Featured Application
After undergoing rigorous validation and optimization, this research can be applied in clinical settings. For physicians, it can offer decision-making support and serve as an auxiliary tool. For patients, it can provide information about their physical conditions. Furthermore, by integrating with wearable devices in the future, it can enable real-time visualization of physical conditions at any time and anywhere and contribute to the formation of medical big data, among other potential application prospects. In summary, this research has laid a solid foundation.
Abstract
This study explored the feasibility of applying XGBoost and random forest algorithms to predict the risk of sudden death from coronary heart disease. From the perspective of symmetry, the human body′s physiological and pathological states can be considered to have a certain dynamic balance, akin to a form of biological symmetry. Sudden death from coronary heart disease disrupts this inherent balance, representing extreme asymmetry in the body′s state. Our study aims to restore a degree of symmetry in the decision-making process for medical professionals by providing accurate prediction models. By adding the fuzzy comprehensive evaluation method for data preprocessing, the prediction models for sudden death from coronary heart disease based on XGBoost and random forests were optimized and constructed. The results indicated that XGBoost and random forest algorithms could be effectively applied to predict the risk of sudden death from coronary heart disease. The promotion and application of these models could serve as an auxiliary tool to provide additional insights that may assist physicians in their decision-making, especially for those with relatively less clinical experience in grassroots units, enable early intervention for high-risk patients, and thereby reduce the occurrence and mortality risk of sudden death from coronary heart disease.
1. Introduction
In medical clinical practice, sudden coronary death (SCD) is a sudden death caused by coronary heart disease, which seriously threatens human life and health. According to the latest survey results, the total number of SCD cases in China is as high as 544,000 per year [1]. SCD is characterized by suddenness, rapidity, unpredictability, and high mortality. There are numerous related risk factors, and the patient′s manifestations and the doctor′s diagnostic behaviors are fuzzy, making it extremely difficult for clinicians to predict the risk of sudden death in patients early [2]. Therefore, establishing a scientific and effective risk prediction model for SCD and screening and early intervention for high-risk populations have become core issues in cardiovascular disease management and have received extensive attention from many scholars in recent years [3].
Early studies mostly used non-machine learning methods such as statistical modeling, empirical scoring, or traditional regression models for SCD risk prediction, such as the Framingham score, GRACE score, and SARIMAX model, but these methods have limited processing capabilities for complex nonlinear data and have poor application effects in actual clinical practice [4]. In recent years, the rapid development of artificial intelligence technology, especially the wide application of machine learning in medical diagnosis and risk prediction, has provided new ideas for SCD prediction. XGBoost is an extensible tree machine learning system proposed by Chen et al. [5]. As a machine learning algorithm based on the gradient boosting framework, XGBoost can flexibly handle data features, and it not only focuses on the prediction error of the model but also considers the relative importance of each sample, enabling XGBoost to maintain excellent performance when dealing with large-scale datasets [6]. Random forests and XGBoost are different types of ensemble methods (Bagging and Boosting). A single decision tree is prone to overfitting, but random forests can reduce this risk by averaging multiple decision trees [7]. However, a single machine learning model often has limited generalization ability and unstable classification for complex samples. Ensemble learning models, such as XGBoost and random forests, have gradually become the mainstream methods in medical risk prediction research due to their strong nonlinear modeling ability and robustness advantages [8]. In the prediction of SCD risk, the situation may be quite complex and variable. Combining random forests and XGBoost to utilize their complementary advantages can reduce classification errors in different ways and may have different responses to different types of data and anomalies, which may improve overall detection accuracy and efficiency [9]. Moreover, different models often have different weaknesses. XGBoost handles linear and nonlinear relationships well, but may overfit on some noisy datasets, while random forests may handle this situation better. The combination of the two can make up for the shortcomings of a single model [10]. Therefore, this paper combines XGBoost and random forest algorithms and proposes an SCD risk prediction. Literature search reveals that there are currently no research reports on the application of the combination of XGBoost and random forests in SCD risk prediction.
Furthermore, the clinical data used in SCD risk prediction often have characteristics such as fuzzy information and large differences between samples, which leads to a decrease in the accuracy of traditional machine learning models when dealing with such data. The fuzzy comprehensive evaluation method, which originates from fuzzy mathematics, has good uncertainty modeling capabilities and can effectively handle problems with fuzzy boundaries between variables and strong subjectivity in evaluation [11]. Previous studies have demonstrated that the combination of fuzzy comprehensive evaluation and machine learning algorithms, such as the integration with convolutional neural networks (CNN), has excellent performance in medical risk assessment [12]. Applying the fuzzy comprehensive evaluation method to the SCD prediction scenario can perform fuzzification processing and normalized weight integration on the original data before model training, enhancing the data′s expression completeness and the model′s tolerance for boundary samples, thereby improving the stability and robustness of the prediction model.
In the vast and intricate realm of medical research, the concept of symmetry, though often not immediately associated with the study of diseases, holds profound significance and offers a unique lens through which we can better understand and address health-related challenges. The human body, in its optimal state, exists in a delicate and dynamic equilibrium, a state that can be metaphorically likened to perfect symmetry. This biological symmetry encompasses not only the physical structure, where paired organs and symmetrical body parts work in harmony, but also extends to physiological processes. The rhythmic beating of the heart, the balanced regulation of hormones, and the coordinated functioning of various systems all contribute to this overall symmetry in the body′s internal environment.
Coronary heart disease, particularly when it results in the tragic event of sudden death, represents a severe disruption of this inherent symmetry. It is as if a sudden, violent force shatters the harmonious balance, throwing the body into a state of chaos. The normal flow of blood through the coronary arteries is obstructed, leading to ischemia and necrosis of the heart muscle. This disruption not only affects the heart itself but also has far-reaching consequences for the entire body, as the heart is the central pump that maintains the circulation of blood and the delivery of oxygen and nutrients to all tissues and organs. In the face of such a formidable challenge, our research endeavors to restore a semblance of symmetry to the medical decision-making process. Traditional methods of predicting the risk of sudden death from coronary heart disease often rely on a limited set of factors and may lack the necessary precision and comprehensiveness. By introducing XGBoost, fuzzy synthetic evaluation, and random forest algorithms, along with the fuzzy comprehensive evaluation method for data preprocessing, we are essentially creating a more balanced and symmetric framework for analysis. These advanced algorithms have the ability to handle a vast amount of complex data, considering multiple variables simultaneously and capturing the intricate relationships between them. Just as a well-designed symmetrical structure can withstand external forces more effectively, our optimized prediction models can better resist the uncertainties and complexities inherent in medical data. They can provide physicians with more accurate and reliable predictions, enabling them to make more informed decisions. For instance, in the context of grassroots medical units where clinical experience may be relatively limited, these models can serve as a valuable auxiliary tool. They can help level the playing field, ensuring that patients, regardless of their location, receive a more standardized and evidence-based assessment of their risk. This, in turn, allows for early intervention in high-risk cases, potentially preventing the occurrence of sudden death and restoring a greater degree of symmetry to patients′ lives and the overall healthcare system. In essence, our study is an attempt to use the power of technology and the concept of symmetry to bring order and balance back to the chaotic landscape of coronary heart disease and its associated risks.
In summary, this paper addresses the issues of insufficient model prediction ability and data fuzziness in current SCD risk prediction by proposing a novel prediction method that integrates fuzzy comprehensive evaluation with the XGBoost–random forest ensemble model. This model first uses fuzzy comprehensive evaluation to extract features and preprocess the original clinical data, reducing the impact of data uncertainty on model performance. Then, it builds an ensemble model based on the combination of XGBoost and random forests to achieve precise prediction and identification of high-risk SCD patients. The research in this paper has the following innovations and contributions:
- It is the first to apply the XGBoost–random forest ensemble model to SCD risk prediction, verifying the feasibility and superiority of the ensemble model in SCD prediction tasks and providing a method reference for the intelligent prediction of related diseases in the future.
- It innovatively introduces the fuzzy comprehensive evaluation method into the SCD prediction process for the first time. In view of the common characteristics of clinical data such as information fuzziness and incompleteness, the fuzzy comprehensive evaluation method, with its advantages in uncertainty modeling, can perform fuzzification processing and normalized weight integration on the original data in the early stage of the prediction process.
- It combines the fuzzy comprehensive evaluation method with XGBoost and random forest algorithms to construct an ensemble model. By organically integrating the strengths of the fuzzy comprehensive evaluation method in handling fuzziness and the advantages of XGBoost and random forest algorithms in mining nonlinear relationships in data, this ensemble model demonstrates outstanding capabilities in handling the fuzziness and nonlinear relationships of clinical data in the overall process covering feature weighting, model training, and integrated prediction, significantly improving the accuracy and stability of SCD prediction.
2. Materials and Methods
2.1. Related Work
2.1.1. XGBoost Model
XGBoost (eXtreme Gradient Boosting) is based on decision trees as its fundamental learners and integrates the superior performance of tree models and gradient boosting algorithms [13]. The core idea is to train multiple weak learners in a serial manner and combine them into a powerful model [14]. In each training round, XGBoost optimizes the loss function through gradient boosting, introduces regularization terms to prevent overfitting, and employs an advanced weighted iterative strategy, focusing each round of learning on correcting the residuals of the previous model. During the learning process, XGBoost not only pays attention to the prediction error of the model but also considers the relative importance of each sample [15]. By using the information obtained from calculating the gradient and Hessian matrix, the model pays more attention to the samples that are difficult to fit. XGBoost is also very flexible in handling features, can handle missing values, and can perform automatic feature selection based on the importance of features. In addition, the parallel performance of XGBoost is another significant feature, supporting parallel processing of data in a multi-threaded environment, enabling XGBoost to maintain excellent performance when processing large-scale datasets. Its basic principle is shown in Figure 1.
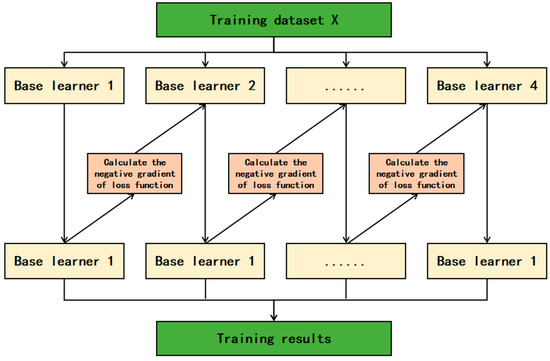
Figure 1.
XGBoost model.
In terms of mathematical models, XGBoost adopts regularization strategies in the establishment of the model, including control of tree complexity, adjustment of sample weights, and reduction in learning rate in each step of iteration. These mechanisms effectively improve the generalization ability of the model, enabling XGBoost to perform well when dealing with large-scale and high-dimensional data [16]. For an XGBoost model with m trees and training data set samples as (xi, yi), the model definition is as shown in Equation (1).
Among them, fk(x) represents the prediction value of the k-th decision tree for the sample.
The derivation of the XGBoost model is based on the second-order Taylor expansion of the loss function. The optimization objective includes not only the first-order derivative (gradient), but also the second-order derivative (Hessian). During the training process, the prediction output of the model is calculated by the following formula:
- The objective function
The objective function of XGBoost consists of two parts, namely the LossFunction and the RegularizationTerm. The objective of the objective function is to minimize the loss function and control the complexity of the model [17].
Here, N represents the number of training data, the true label of the i-th observation is the predicted value of the model for the i-th observation, is the loss function, which measures the difference between the predicted value and the true value, K is the number of trees in the model, is the prediction function of the k-th tree, and is the complexity of the k-th tree (used for regularization to prevent overfitting).
The loss function is an indicator used to measure the difference between the predicted value and the actual value of the model. XGBoost allows the use of multiple loss functions. Common loss functions include squared loss (used for regression problems) [18], log loss (used for binary classification problems), exponential loss, etc.
The regularization term penalizes the complexity of the model to avoid overfitting. The regularization term consists of two parts:
Here, T represents the number of leaf nodes of the tree, wj denotes the weight of the j-th leaf node of the tree, and are regularization parameters that control the complexity of the tree and the smoothness of the leaf weights, respectively.
- Tree-Building
In each iteration, XGBoost improves the optimization model by adding a new tree. The construction of the new tree is based on the first and second derivatives of the loss function (i.e., the gradient and the Hessian), derived from the given loss function l and each sample i.
First Order Derivative:
Second Order Derivative:
The derivative information is utilized for calculating the gain of splitting points. XGBoost optimizes the objective function, selects the optimal splitting points at each step to construct multiple weak learners (decision trees), and integrates them to enhance the model′s performance.
The objective of the new tree is to minimize the following objective function:
Among them, it is the prediction value of the new tree for the i-th sample.
- Diversity Gain
XGBoost employs a greedy algorithm to gradually generate the tree. At each step, a splitting point is selected to minimize the objective function. The selection of the splitting point is carried out by calculating the Gain, which refers to the reduction in the loss function before and after the split one [19].
Among them, GL and GR represent the gains of the left and right subtrees, respectively, while HL and HR denote the sum of the second-order derivatives of the left and right subtrees, respectively.
Through the above steps, XGBoost builds new trees in each round of iteration to gradually reduce the value of the objective function, thereby improving the prediction accuracy of the model. When the gain is less than γ, the model will stop further splitting nodes.
2.1.2. XGBoost with Fuzzy Synthetic Evaluation Features
This study takes into account the characteristics of clinical data used in SCD risk prediction, such as information ambiguity and significant differences among samples. It introduces the concept of fuzzy mathematics to fuzzify the features, thereby enhancing the model′s ability to handle uncertainty and fuzziness. This improvement enables the XGBoost model to better capture the nonlinear relationships and complex patterns in the data, thereby improving the accuracy and robustness of the prediction. The FSE format also makes significant contributions to XGBoost′s handling of sparsity, nonlinearity, and missing values. Specifics are detailed in Table 1.

Table 1.
Contributions of FSE format to XGBoost′s handling of sparsity, nonlinearity, and missing values.
Additionally, this study conducted comparative experiments to demonstrate its advantages over random forests, with results presented in Table 2. These findings precisely explain why XGBoost, rather than random forests, was selected for this step.
Table 2.
Comparative advantages.
Fuzzy mathematics is a new branch of mathematics that uses mathematical methods to study and handle fuzzy phenomena. It is based on the theory of “fuzzy sets” and provides a new approach to dealing with uncertainty problems. It is a powerful tool for describing how the human brain processes fuzzy information [20]. Its basic idea is to construct a fuzzy transformation through membership functions and weight vectors, converting fuzzy judgment information into operational numerical evaluation results [21]. The specific process is as follows:
First, based on existing research and clinical expert experience [22], an index set composed of three first-level indicators is constructed. Each primary indicator is further subdivided into several secondary indicators, totaling 15 key variables, and corresponding local weights are assigned to them. Based on clinical practice, the risk of sudden death is classified into four levels, , namely “extremely high risk, high risk, medium risk, and low risk”, and four types of assessment standard grade vectors are defined. For instance, the vector corresponding to “extremely high risk” is (0.5, 0.3, 0.2, 0.1), which is used for error determination in subsequent risk level identification.
In the fuzzification stage, this study designs corresponding membership functions based on the variable attributes of each indicator and calculates the membership degree of each sample under different risk levels. For enumeration type variables, the corresponding membership degree vectors are directly set. For example, “whether there is a family history of sudden death” is set to (0.6, 0.4, 0.2, 0.1) and (0.1, 0.2, 0.3, 0.5), respectively. For ordered discrete variables, such as myocardial infarction history (none, acute, old, unknown), the corresponding fuzzy grade membership degrees are established following clinical risk classification. For continuous variables like heart rate, left ventricular ejection fraction, and age, membership functions based on Gaussian or piecewise linear functions are designed for modeling. For instance, for heart rate, with 60 beats per minute as the boundary, the extremely high risk membership degree function is set as:
All of the above calculated membership degrees will serve as the basis for the fuzzy matrix. Let the fuzzy evaluation matrix corresponding to each level of indicator be Ri, where each row represents the membership degree of a secondary indicator to the four grades, that is:
Through the local weight vector , perform a fuzzy comprehensive operation to obtain the fuzzy output vector of each first-level indicator . Subsequently, based on the global weights of the first-level indicators . Then, perform comprehensive operations again to obtain the final fuzzy evaluation result:
Finally, calculate the Euclidean distance between the fuzzy result vector B and the preset four risk level vectors, respectively:
where represents the i-th component of the ideal vector of the j-th level. Select the level corresponding to the minimum error as the final evaluation result of this sample. Through the above process, the multi-dimensional clinical information of each case is converted into a fuzzy feature vector, and the final clear risk level is output. On this basis, the fuzzy feature matrix composed of all samples can be used as input features for the training and testing of the XGBoost model, thereby achieving the effective integration of fuzzy information and machine learning models.
The key steps in the fuzzy evaluation process are shown in Table 3.
Table 3.
Summary table of key steps in the fuzzy evaluation process.
2.1.3. Random Forest Model
Random forest is a powerful and flexible machine learning algorithm that integrates multiple decision trees to address classification and regression problems [23]. The core of it is to integrate multiple decision trees, with each decision tree being trained on an independent subset [24].
Its basic principle is illustrated in Figure 2.
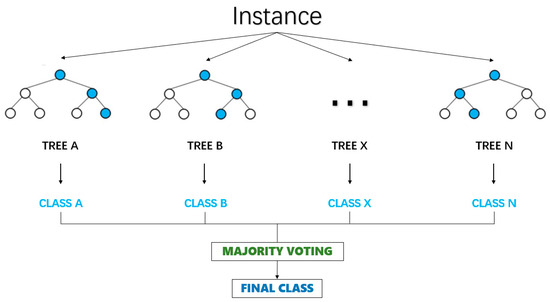
Figure 2.
Random forest model.
The training objective of the decision tree is to minimize the loss function L of the node by selecting the best splitting feature k and splitting threshold t.
Here, the training set of the decision tree and the representation of the left and right subsets after node splitting are given.
The final prediction result of the random forest is determined by the voting of all decision trees [25]. In the classification problem, the voting process selects the category with the highest number of votes as the final prediction result by counting the votes of each category. The voting process is shown in Equation (13).
Among them, is the final prediction result, which is the prediction of the i-th decision tree. Ⅱ() is an indicator function. The underlying principle of the random forest integrates the node splitting process of decision trees, impurity measurement, and the idea of ensemble learning. Among them, the Gini coefficient and entropy of impurity measurement are common measurement methods [26]. During the training of each decision tree, the splitting of nodes is achieved by selecting the best feature and splitting threshold to minimize the loss function.
2.2. Methodology
2.2.1. Model Introduction
In this study, the relationship between XGBoost and random forest is complementary. XGBoost and random forest have different characteristics and advantages [27]. XGBoost is an ensemble learning algorithm based on gradient boosting trees. It iteratively trains weak learners and combines them into a strong learner, which can automatically handle complex nonlinear relationships and has strong fitting ability for data. Random forest, on the other hand, predicts by constructing multiple decision trees and voting among them, and has good anti-overfitting ability and generalization ability, being relatively insensitive to noise and outliers in data. Therefore, the two can complement each other and leverage their respective advantages to enhance the overall performance of the prediction model. The method flowchart of the coronary heart disease sudden death risk prediction model based on improved XGBoost and random forest proposed in this paper is shown in Figure 3.
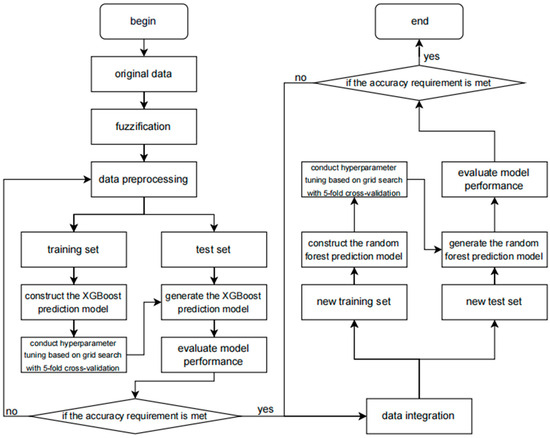
Figure 3.
The flowchart of the methodology.
The flowchart of this prediction model clearly depicts the entire processing flow of data from input to output. Firstly, the raw data undergo a preprocessing stage, including data cleaning, handling of missing values, detection of outliers, and feature selection, to ensure the quality and accuracy of the data. Subsequently, these data are input into the XGBoost model that has been improved with fuzzy mathematics.
During the data preprocessing stage, the original data is subjected to fuzzy processing using the method of fuzzy membership functions. The purpose of fuzzy processing is to smooth out the uncertainty, fuzziness, or noise in the original data so as to better adapt to the training of the XGBoost model. Each feature is subjected to fuzzy processing to generate fuzzy features. These fuzzy features may be represented in the form of membership values, reflecting the degree of membership of the original data to different fuzzy sets.
In the model training stage, the fuzzified data undergoes steps such as normalization, standardization, or encoding as input, and is used to train the XGBoost algorithm. During the training process, XGBoost learns the distribution of the data and the relationships between features to construct a model that can accurately predict the target variable.
In the fuzzy comprehensive evaluation step, the data is further processed using the fuzzy comprehensive evaluation algorithm. Fuzzy comprehensive evaluation is a method based on fuzzy mathematics, which allows for the quantitative assessment of data with fuzziness, uncertainty, or subjectivity. By setting fuzzy sets, membership functions, and weight allocation, the original data can be transformed into a series of fuzzy comprehensive evaluation features. These features typically can more comprehensively reflect the intrinsic attributes and interrelationships of the data.
The input of features into XGBoost uses the fuzzy comprehensive evaluation features as input and passes them to the XGBoost algorithm. XGBoost is an efficient gradient boosting decision tree algorithm that can maintain high performance and accuracy when processing large amounts of data. By training the XGBoost model, the fuzzy comprehensive evaluation features can be utilized to predict the target variable (such as the risk of sudden death from coronary heart disease).
Subsequently, the XGBoost model is evaluated and optimized. This includes using techniques such as cross-validation and grid search to find the best model parameters to improve the prediction performance of the model and using various performance indicators (such as accuracy, recall rate, F1 score, etc.) to evaluate the performance of the model.
After the initial prediction by the XGBoost model, its output is combined with the prediction results of the random forest model. The specific operation involves data integration, which is detailed below. The process is shown in Figure 4.
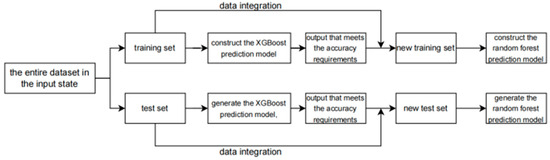
Figure 4.
The flowchart of the data integration.
As shown in the figure, the output of the XGBoost training set is merged with the original training data to serve as the input for the random forest training set, and the output of the XGBoost test set is combined with the original test data to act as the input for the random forest test set. This is the operation process of data integration.
Random forest, as an ensemble learning method, improves prediction performance by constructing multiple decision trees and integrating their prediction results. At this stage, we fully leverage the diversity and stability advantages of random forests to further enhance the accuracy and reliability of the prediction model. In the model evaluation and validation stage, after the model training is completed, an independent test data set should be used to evaluate and validate the model. By comparing the model′s prediction results with the actual results, the model′s performance can be assessed, and it can be determined whether further optimization is needed.
Ultimately, by combining the prediction results of XGBoost and random forest, we obtain the final predicted value of the risk of sudden death from coronary heart disease. This model not only has high prediction accuracy but also can handle large-scale data sets, providing an effective tool for clinicians and researchers to assist them in assessing and predicting the risk of sudden death from coronary heart disease.
2.2.2. Fuzzification
Based on the investigation and analysis of the relevant risk factors of SCD [28,29], a two-level index system was established and the initial weights of the indicators were given. Li Gang et al. proposed that the first step was to obtain the first-level index factors U = {U1 [patient′s previous personal and family medical history (0.34)], U2 [patient′s examination items (0.33)], U3 [comorbidities (0.33)]}. Secondly, each factor Ui was further subdivided to obtain the second-level index factors: U1 = [out-of-hospital cardiac arrest, history of cardiopulmonary resuscitation (0.4), history of myocardial infarction (0.3), family history of sudden death (0.3)], U2 = [paroxysmal ventricular tachycardia (0.1), ventricular tachycardia (0.25), coronary angiography results (0.1), left ventricular ejection fraction (0.2), cardiac enlargement (0.2), heart rate (0.1), age (0.05)], U3 = [encephalopathy (0.1), nephropathy (0.3), diabetes (0.3), hypertension (0.15), COPD (0.15)]. According to clinical experience, the risk assessment levels were defined as four levels with good discrimination, namely: V = {extremely high risk (V1), high risk (V2), moderate risk (V3), low risk (V4)}, and the expected output was defined, that is, the evaluation criteria with grade differences [30,31]. The Evaluation criteria for level differences are shown in Table 4.
Table 4.
Evaluation criteria for level differences.
Based on the clinical practice experience of experts and the principle of membership function establishment, membership functions were established for the above 15 related factors and the corresponding membership degree values were given.
First, the functions were established in terms of the membership degree of personal medical history and family history, personal medical history and family history include extracardiac cardiac arrest, history of cardiopulmonary resuscitation, history of myocardial infarction, and family history of sudden death. The membership degree values corresponding to (extremely high risk, high risk, medium risk, and low risk) for the two situations of “yes” and “no” of extracardiac cardiac arrest and cardiopulmonary resuscitation are (0.5 0.4 0.2 0.1), (0.1 0.2 0.3 0.5); the membership degree values corresponding to the four situations of “no”, “acute”, “chronic”, and “unknown” of myocardial infarction history are (0.1 0.1 0.1 0.5), (0.5 0.3 0.15 0.1), (0.3 0.2 0.3 0.3), (0.25 0.25 0.25 0.25); the membership degree values corresponding to the three situations of “yes”, “no”, and “unknown” of family history of sudden death are (0.6 0.4 0.2 0.1), (0.1 0.2 0.3 0.5), (0.25 0.25 0.25 0.25).
In terms of the membership degree of ventricular premature beats and ventricular tachycardia, the membership degree values for the three situations of “no”, “frequent”, and “occasional” of ventricular premature beats are (0.1 0.1 0.3 0.5), (0.5 0.3 0.2 0.1), (0.3 0.25 0.2 0.35); the membership degree values for the three situations of “no”, “non-persistent”, and “persistent” of ventricular tachycardia are (0.1 0.1 0.2 0.5), (0.4 0.3 0.25 0.1), (0.5 0.4 0.3 0.1).
In terms of the degree of membership of coronary angiography results, the degree of coronary artery lesion and the risk of sudden death are related and the relationship is complex. The membership function is difficult to define. The greater the degree of stenosis of the four main coronary arteries (LM, LAD, LCX, RCA), the higher the risk of sudden death (normal is 0%, complete occlusion is 100%). The lesion of LM is more severe than that of other vessels; the larger the number of vascular lesions, the greater the risk. The coronary angiography results are classified into four situations: any one branch lesion ≥ 85%, LM single lesion > 50% or any two branches lesion MIN > 50%, any two branches lesion MAX ≤ 50% and at least one lesion > 30%, any one lesion < 30%, and the corresponding membership degree values are (0.5 0.3 0.2 0.1), (0.4 0.25 0.15 0.2), (0.3 0.15 0.2 0.4), (0.1 0.1 0.3 0.5).
In terms of the degree of membership of the left ventricular ejection fraction, the lower the left ventricular ejection fraction, the greater the risk of sudden death. There are three situations of left ventricular ejection fraction: ≥40%, <40% and ‘not done’. The membership degree values are (0.3 0.35 0.4 0.5), (0.8 0.5 0.3 0.1), (0.25 0.25 0.25 0.25).
In terms of the degree of membership of cardiac dilation (left ventricular end-diastolic diameter), the normal range of left ventricular end-diastolic diameter is different for men and women (3.5–4.5 cm for women and 4.5–5.5 cm for men). The larger the value exceeding the normal range, the higher the risk. The membership degree values of the normal range and the non-normal range are (0.1 0.2 0.3 0.5), (0.5 0.3 0.1 0.05). The membership function of heart rate is as follows. The heart rate is at the critical point of 60 times. The decrease and increase in heart rate will increase the risk of sudden death. The membership function is as follows.
The age is divided into two categories: those under 45 years old and those over 45 years old. The risk is lower for those younger than 45 years old. The minimum age is set at 15 years old. For those younger than 15 years old, there are basically no data on the risk. The risk increases with age, showing a basically linear relationship. The membership function is as follows.
The degree of association between cerebral disease and renal disease is classified into two types: “present” and “absent”. The corresponding membership values are (0.5 0.3 0.1 0.05) and (0.1 0.1 0.3 0.5), respectively. For renal disease, there are two types: “normal” and “abnormal”. The measurement index is creatinine, and the normal range of creatinine is 53–132 μmol·L−1. Values exceeding this range are considered abnormal. The higher the abnormal creatinine value, the higher the risk. Values below the normal range have no impact on the risk, remaining within the normal range. The corresponding membership values are (0.1 0.2 0.3 0.5) and (0.5 0.4 0.1 0.05), respectively. For diabetes, hypertension, and COPD, there are three types of association: “present”, “absent”, and “unknown”. The corresponding membership values are (0.5 0.3 0.25 0.1), (0.1 0.1 0.2 0.5), and (0.25 0.25 0.25 0.25), respectively [32]. For hypertension, there are three types of association: “present”, “absent”, and “unknown”. The corresponding membership values are (0.5 0.3 0.1 0.1), (0.1 0.1 0.3 0.5), and (0.25 0.25 0.25 0.25), respectively. For COPD, there are two types of association: “present” and “absent”. The corresponding membership values are (0.5 0.3 0.1 0.05), (0.1 0.1 0.3 0.5), respectively.
The membership degree values are obtained through the membership functions of each index factor, thereby forming the fuzzy evaluation matrix Ri. Since the weight values of each factor are different, the weight distribution of each factor is represented by the fuzzy set Ai = (a1, a2, …, ani), and it is subjected to matrix synthesis operation with the evaluation matrix Ri, which results in the comprehensive evaluation of these factors. By doing this layer by layer, the final fuzzy synthetic evaluation result vector B (b1, b2, b3, b4) [33,34,35] can be obtained. This result vector is then compared with the four grade vectors in Table 1 ({(0.5, 0.3, 0.2, 0.1), (0.4, 0.3, 0.3, 0.2), (0.2, 0.3, 0.4, 0.3), (0.1, 0.2, 0.3, 0.5)}) for error calculation. . The smaller the error, the closer it is. The grade corresponding to the minimum error is taken as the final evaluation result [36,37,38].
2.2.3. Construct Feature Matrix
When determining the membership functions according to the requirements of fuzzy comprehensive evaluation, appropriate membership functions are determined for each feature. The membership functions map the original data to the [0, 1] interval, representing the degree to which the data belongs to a certain fuzzy set. Next, the membership degree is calculated. In this study, the determined membership functions are used to calculate for each feature of each sample, obtaining the corresponding membership degrees. The membership degree is a numerical value representing the degree of membership of the feature in the fuzzy set. Then, the feature matrix can be constructed. The calculated membership degrees are used as feature values to construct a two-dimensional feature matrix. In this matrix, each row represents a sample, and each column represents a feature obtained from fuzzy synthetic evaluation; that is, the membership degree. Subsequently, a numerical feature matrix that can be input into the XGBoost model is obtained. This matrix contains the features obtained from the fuzzy synthetic evaluation, that is, the membership degrees, and can be used to train the XGBoost model to predict the risk of sudden death from coronary heart disease or other related tasks.
2.2.4. Model Training and Data Processing
This study completed the training process of the coronary heart disease sudden death risk prediction model based on XGBoost and random forest through several steps, including data division, training and cross-validation of the XGBoost model, incorporating the original data into the training of the random forest model, and model evaluation.
First, data partitioning was carried out. The preprocessed data set was divided into a training set and a test set in a certain proportion. In this study, a 2400:600 ratio was adopted for the division. That is, 80% of the data was used as the training set for model training, and 20% of the data was used as the test set for model performance evaluation. Such a partitioning method can ensure that the model has sufficient data for learning while also having a certain scale of data for an objective evaluation of the model. The data partitioning was implemented using the ‘train_test_split’ function in the ‘sklearn’ library of Python 1.7.1.
Next, XGBoost model training and cross-validation were carried out. XGBoost is an efficient gradient boosting algorithm with strong predictive ability and good generalization performance. When training the XGBoost model, the cross-validation method was adopted to select the optimal model parameters. Cross-validation is a statistical method for evaluating model performance. It divides the training set into multiple subsets, alternately uses one subset as the validation set and the rest as the training set for training and validation, and finally obtains the average performance of the model. This study adopted 5-fold cross-validation; the training set was divided into five subsets, and training and validation were carried out five times in sequence. Model training and parameter tuning are implemented using the ‘xgboost’ library of Python and the ‘GridSearchCV’ function in the ‘sklearn’ library. During the cross-validation process, ‘GridSearchCV’ will traverse all parameter combinations in the parameter grid and select the parameter group that performs the best on the validation set as the final model parameters. Through cross-validation, it is possible to effectively avoid model overfitting and improve the generalization ability of the model.
Subsequently, the original data was combined with it to enter the random forest model training. After the XGBoost model training was completed and evaluated through cross-validation, the prediction results of the XGBoost model were merged with the original data features and input into the random forest model for training. Random forest is an ensemble learning method that builds multiple decision trees and combines their results to effectively improve the accuracy and stability of the model. The random forest model was trained using the ‘RandomForestClassifier’ class in the ‘sklearn’ library.
Finally, the model evaluation was conducted. After the training of the XGBoost model and the random forest model was completed, the performance of the models was evaluated using the test set. Various indicators such as accuracy, precision, recall, F1 value, and the area under the ROC curve (AUC) were adopted to comprehensively assess the performance of the models, as shown in the formula. Through the performance evaluation of the model on the test set, the actual predictive ability of the model can be understood, providing a basis for subsequent model optimization and application.
3. Results
3.1. Experimental Results and Analysis
In this study, in order to evaluate the stability and generalization ability of the coronary heart disease sudden death risk prediction model constructed based on XGBoost and random forests, we conducted a rigorous cross-validation experiment. Cross-validation, as an important model evaluation technique, can effectively avoid the problem of overfitting in the model and provide more reliable performance estimation.
First, we collected clinical data about patients with coronary heart disease from multiple medical institutions. After strict data cleaning and feature engineering processing, a data set with rich feature information was obtained. These features covered basic physiological indicators of the patients (such as age, gender, blood pressure, heart rate, etc.), medical history information (such as the course of coronary heart disease, combined disease conditions, etc.), and related examination results (such as electrocardiogram indicators, blood biochemical indicators, etc.). For cross-validation, the data set was randomly divided into k mutually exclusive subsets. In this experiment, k was set to 5, that is, the 5-fold cross-validation method was adopted.
In the cross-validation of the XGBoost model, we successively took one subset as the validation set and the remaining k-1 subsets as the training sets. In each round of cross-validation, we used the training sets to train the XGBoost model and adjust the model′s hyperparameters to optimize the model′s performance. During the hyperparameter adjustment process, we adopted a combination of grid search and random search to find the optimal hyperparameter combination. After multiple rounds of iterative training, we obtained the prediction results on each validation set.
Through the summary analysis of the results of five cross-validation rounds, combined with Python and subsequent calculations, this experiment shows that the XGBoost model performs well in predicting the risk of sudden death from coronary heart disease. The average accuracy rate reached 88%, the sensitivity was 76%, and the specificity was 84%. This indicates that the XGBoost model can accurately identify patients with a high risk of sudden death from coronary heart disease and also has good discrimination ability for low-risk patients. In addition, by observing the validation results of different folds, we find that the performance of the model fluctuates slightly, indicating that the XGBoost model has good stability.
For the random forest model, the experiment was conducted following the 5-fold cross-validation process. In each round of cross-validation, the random forest model built multiple decision trees by randomly selecting features and samples and made the final prediction through the voting mechanism. During the model training process, we optimized and adjusted the key hyperparameters such as the number of decision trees and the depth of the trees.
The cross-validation results of the random forest model show that its average accuracy rate was 81%, the sensitivity was 83%, and the specificity was 85%. Compared with the XGBoost model, the random forest model had a slight difference in accuracy, but showed certain advantages in sensitivity, and more effectively captured patients with true risks of sudden death. Similarly, the random forest model also showed good stability in the validation results of different folds.
To further compare the performance differences between the XGBoost and random forest models, we conducted a statistical analysis of the cross-validation results of the two models. Through paired t-tests and other methods, we found that the differences in indicators such as accuracy, sensitivity, and specificity between the two models are statistically significant. Considering the performance indicators of the models and practical application requirements, we believe that the XGBoost model is slightly superior to the random forest model in overall performance, but the difference is not significant. In practical applications, the appropriate model can be selected based on specific circumstances.
In conclusion, through cross-validation experiments, we verified the effectiveness and stability of the coronary heart disease sudden death risk prediction model constructed based on XGBoost and random forests. Both of these models can provide valuable references for the assessment of sudden death risk in patients with coronary heart disease and support clinical decision-making and the formulation of intervention measures. In future research, we will further optimize the performance of the model and conduct verification on a larger-scale dataset to improve the generalization ability and clinical application value of the model. Additionally, for clinical patients from a certain hospital, the 15 related indicators are as follows: out-of-hospital cardiac arrest, history of cardiopulmonary resuscitation, myocardial infarction, family history of sudden death, ventricular premature beats, ventricular tachycardia, coronary angiography results, left ventricular ejection fraction < 40%, cardiac dilation (left ventricular end-diastolic internal diameter), heart rate, age, encephalopathy, nephropathy, diabetes, hypertension, COPD. The values of each indicator of the patients and the follow-up results are (0, 1, 0, 0, 0, (0.85, 0, 0), 0, 4.72, 78, 74, 0, 107, 0, 1, 0, 1). The final evaluation result vector B is calculated based on the two-level fuzzy synthetic evaluation method as (0.301, 0.229, 0.313, 0.378). The result obtained by inputting this result vector B into the prediction model based on XGBoost and random forest is “moderate risk”. This prediction result is consistent with the result of consultation by multiple experts, which is “moderate risk”, and the follow-up result of the patient is also “survival”.
3.2. Predictive Value Assessment
In the evaluation of the predictive value for sudden death risk of coronary heart disease, in order to comprehensively and objectively assess the performance of different algorithm models, this study selected four models for comparative analysis: using XGBoost alone, using random forests alone, the traditional combined model of XGBoost and random forests without modification of the fuzzy synthetic evaluation algorithm, and the improved version of XGBoost combined with random forests. The evaluation indicators cover Accuracy, Precision, Recall, F1-Score, the AUC, etc. These indicators can reflect the predictive ability of the models for the sudden death risk of coronary heart disease from different dimensions. The comparison results of relevant indicators are shown in Table 5.
Table 5.
Performance evaluation table for coronary heart disease sudden death risk prediction based on different algorithm models.
From the prediction results, although the XGBoost model alone performs reasonably well in some indicators, due to its failure to fully consider the fuzziness and uncertainty in the data, it has certain limitations when dealing with complex clinical data, resulting in unsatisfactory overall prediction performance. The random forest model alone, relying on its strong feature selection and anti-overfitting capabilities, performs well in some scenarios, but still has room for improvement in capturing the potential associations and complex patterns in the data.
Although the traditional combined model integrates the advantages of XGBoost and random forest algorithms, it has deficiencies in handling fuzzy features and integrating information due to not being improved by the fuzzy synthetic evaluation algorithm, and thus its prediction performance fails to reach the optimal level. In contrast, the improved XGBoost combined with random forest model demonstrates significant advantages. In terms of accuracy, this model achieves 89%, higher than the other three models, indicating that it can predict the risk of sudden death from coronary heart disease more accurately. In terms of precision, the model reaches 87%, meaning that in the samples predicted as positive, the proportion of actual positives is higher, reducing false alarm situations. The recall rate reaches 91%, indicating that the model can effectively identify most patients with a high risk of sudden death from coronary heart disease, reducing the risk of missed detection. As to the F1 value, which is the harmonic mean of precision and recall, the model achieves an excellent result of 89%, comprehensively reflecting its good balance between accuracy and recall. Additionally, in the AUC index, the AUC value of the improved model is 94, further demonstrating its excellent discrimination ability and prediction performance.
To more intuitively show the differences in prediction performance among the four models, we plotted the receiver operating characteristic curve (ROC curve), as shown in Figure 5. Furthermore, the confusion matrices are shown in Figure 6.
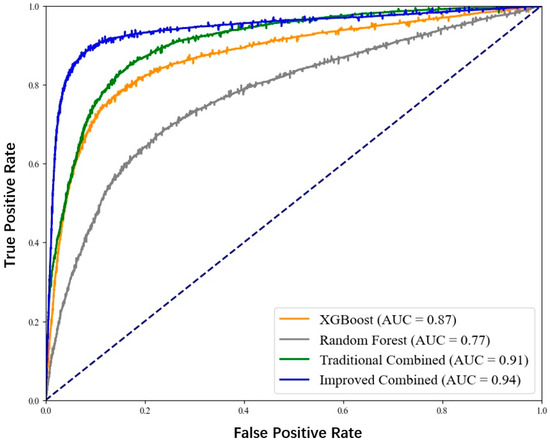
Figure 5.
ROC curve for coronary heart disease sudden death risk prediction.
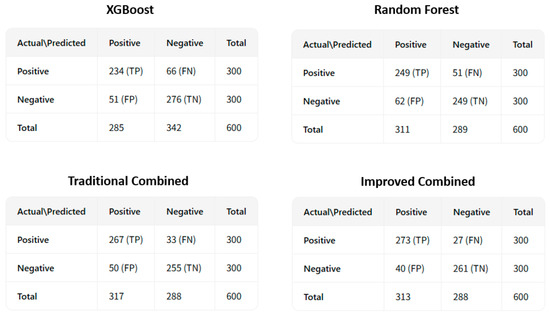
Figure 6.
The confusion matrices for coronary heart disease sudden death risk prediction.
From the figure, it can be clearly seen that the ROC curve of the improved XGBoost combined with the random forest model is closer to the upper left corner, and its AUC value is the largest, indicating that this model has the best performance in distinguishing patients with sudden death from coronary heart disease and non-patients.
In conclusion, through the comparative analysis of the four models on multiple evaluation indicators, it can be clearly concluded that the improved XGBoost combined with the random forest algorithm performs best in predicting the risk of sudden death from coronary heart disease and can provide more accurate and reliable prediction results for clinicians, which is helpful for the early identification of patients with a high risk of sudden death from coronary heart disease, and provides strong support for formulating personalized prevention and treatment plans.
This study focuses on the coronary heart disease sudden death risk prediction model based on the combination of XGBoost and random forests. This model integrates the advantages of two powerful machine learning algorithms and shows high predictive value. By integrating the gradient boosting ability of XGBoost and the decision tree integration strategy of random forest, the model can accurately capture the risk characteristics of sudden death in patients with coronary heart disease, providing a scientific basis for clinical decision-making. This research not only deepens our understanding of the mechanism of sudden death from coronary heart disease, but more importantly, it has significant practical significance in medical practice. With early identification of high-risk patients, doctors can take timely intervention measures, such as drug treatment, lifestyle adjustment, or cardiac rehabilitation programs, thereby effectively reducing the incidence of sudden death from coronary heart disease, improving the quality of life of patients, and reducing the burden on the medical system. Therefore, the coronary heart disease sudden death risk prediction model based on the combination of XGBoost and random forests provides strong technical support for coronary heart disease prevention and treatment work and has far-reaching medical and social impacts.
4. Discussion
In summary, this research elaborates a prediction process that integrates an improved XGBoost model with a random forest model through fuzzy mathematics. This process begins in the data preprocessing stage and proceeds through multiple steps such as fuzzy processing, feature selection, model training, and fuzzy synthetic evaluation, ultimately achieving the prediction of the risk of sudden death due to coronary heart disease. Through this series of steps, not only are the quality and accuracy of the data ensured, but also the advantages of both models are fully utilized, thereby improving the accuracy and reliability of the prediction.
The experimental results show that this model has significant predictive capabilities and can effectively identify individuals at high risk of sudden death due to coronary heart disease. This discovery is of great significance for clinicians and researchers, as it provides them with an effective tool to assist in evaluating and predicting the risk of sudden death due to coronary heart disease, thereby helping to formulate more personalized treatment plans and preventive measures.
However, although our model has achieved initial success, there are still some shortcomings. From a clinical perspective, our model holds substantial promise. By accurately predicting the risk of sudden death due to coronary heart disease, it enables clinicians to prioritize patients for more intensive monitoring and early intervention. For instance, high-risk patients can be recommended for more frequent cardiac examinations, lifestyle modifications, and timely medical treatments, which could potentially save lives. However, there are also notable limitations. Regarding model interpretability, while the combined XGBoost and random forest model through fuzzy mathematics shows good predictive performance, it is often considered a “black-box” model to some extent. Clinicians and patients may find it difficult to understand the underlying reasons for the predicted risk, which could limit their trust and acceptance of the model′s results. Moreover, integrating such a prediction system into real-world clinical workflows presents significant challenges. Clinical settings are complex and dynamic, with various existing systems and procedures in place. Introducing a new prediction model requires seamless integration with electronic health records (EHRs), efficient data transfer, and user-friendly interfaces for healthcare professionals. Additionally, ensuring the model′s continuous performance and adaptability to changing patient populations and clinical practices over time is also a crucial issue.
When considering the broader literature, it is essential to compare our model with recent deep-learning-based approaches for similar prediction tasks. Deep-learning models, such as convolutional neural networks (CNNs) and recurrent neural networks (RNNs), have shown remarkable success in handling large-scale and complex data in various medical fields. In the context of predicting the risk of sudden death due to coronary heart disease, deep-learning models can automatically learn hierarchical features from raw data, potentially capturing more subtle patterns that traditional machine-learning models like ours might miss. However, deep-learning models also have their drawbacks. They typically require a large amount of labeled data for training, and the training process can be computationally expensive and time-consuming. In contrast, our model may be more efficient in terms of data requirements and computational resources, especially when dealing with limited clinical data. Furthermore, deep-learning models often suffer from even worse interpretability issues compared to our model, which could be a significant barrier to their clinical adoption.
Additionally, the parameter tuning of the model is a continuous process, and we need to continue to explore more tuning strategies and tools to improve the performance of the model. At the same time, we also recognize that the interpretability of the model is an important consideration. In the future, we will strive to improve the transparency of the model, making it more understandable to clinicians and patients.
Looking forward to the future, we will continue to strive to improve this prediction model and explore its potential applications in clinical practice. We believe that through continuous research and improvement, our model will provide a more accurate and reliable basis for the assessment and prediction of the risk of sudden death due to coronary heart disease, bringing substantive improvements to the health and quality of life of patients.
Author Contributions
Y.L. was responsible for reviewing manuscripts, communicating and exchanging with professional medical staff, and providing professional support throughout the research process. D.L. was responsible for the development and design of research methods, the establishment of predictive models, and the drafting of papers, and also responsible for code design and provided technical support for the implementation of the XGBoost and random forest algorithms in the sudden death risk prediction model of coronary heart disease. Y.X. is mainly responsible for the collection and organization of data. All authors have read and agreed to the published version of the manuscript.
Funding
This research received no external funding.
Informed Consent Statement
Informed consent was obtained from all subjects involved in the study. Written informed consent has been obtained from the patients to publish this paper.
Data Availability Statement
Due to privacy or ethical constraints, the provision of the requested data is not feasible. Accordingly, this statement is hereby issued.
Conflicts of Interest
The authors declare no conflicts of interest. No institutions had any role in the design of the study; in the collection, analyses, or interpretation of data; in the writing of the manuscript; or in the decision to publish the results.
References
- National Center for Cardiovascular Diseases. Report on Cardiovascular Health and Diseases in China 2023 (Section on Coronary Heart Disease). J. Cardiovasc. Pulm. Dis. 2024, 43, 1015–1024. [Google Scholar]
- Liu, M.B.; He, X.Y.; Yang, X.H.; Wang, Z.W. Interpretation of Key Points in “Report on Cardiovascular Health and Diseases in China 2023”. Chin. Gen. Pract. 2025, 28, 20–38. [Google Scholar]
- Kaur, B.; Kaur, G. Heart Disease Prediction Using Modified Machine Learning Algorithm. In International Conference on Innovative Computing and Communications. Lecture Notes in Networks and Systems; Gupta, D., Khanna, A., Bhattacharyya, S., Hassanien, A.E., Anand, S., Jaiswal, A., Eds.; Springer: Singapore, 2023; Volume 473. [Google Scholar] [CrossRef]
- Dai, J.; Xiao, Y.; Sheng, Q.; Zhou, J.; Zhang, Z.; Zhu, F. Epidemiology and SARIMA model of deaths in a tertiary comprehensive hospital in Hangzhou from 2015 to 2022. BMC Public Health 2024, 24, 2549. [Google Scholar] [CrossRef] [PubMed]
- Chen, T.; Guestrin, C. XGBoost: A Scalable Tree Boosting System. In Proceedings of the 22nd ACM SIGKDD International Conference on Knowledge Discovery and Data Mining (KDD′16), New York, NY, USA, 13 August 2016; pp. 785–794. [Google Scholar]
- Li, J.; An, X.; Li, Q.; Wang, C.; Yu, H.; Zhou, X.; Geng, Y.-A. Application of XGBoost algorithm in the optimization of pollutant concentration. Atmos. Res. 2022, 276, 106238. [Google Scholar] [CrossRef]
- Thomas, N.S.; Kaliraj, S. An Improved and Optimized Random Forest Based Approach to Predict the Software Faults. SN Comput. Sci. 2024, 5, 530. [Google Scholar] [CrossRef]
- Liao, K.-M.; Cheng, K.-C.; Sung, M.-I.; Shen, Y.-T.; Chiu, C.-C.; Liu, C.-F.; Ko, S.-C. Machine learning approaches for practical predicting outpatient near-future AECOPD based on nationwide electronic medical records. iScience 2024, 27, 109542. [Google Scholar] [CrossRef]
- Ma, Y.; Kong, D.L.; Ye, X.Y.; Ding, Y.L. Application and Comparison of Classification and Prediction Models for Type 2 Diabetes Mellitus Complicated with Hypertension Based on Random Forest and XGBoost Algorithms. J. Guangdong Med. Univ. 2024, 42, 523–534. [Google Scholar]
- Li, T.Y.; Xu, X.C.; Yang, X.; Cui, B.; Chen, H.A.; Zhao, X.Y.; Yuan, N.; Meng, F.Q. Prediction of Nitrogen Leaching in Winter Wheat Production in North China Using Random Forest and XGBoost. China Environ. Sci. 2025, 1, 343–354. [Google Scholar]
- Pritika; Shanmugam, B.; Azam, S. Risk Evaluation and Attack Detection in Heterogeneous IoMT Devices Using Hybrid Fuzzy Logic Analytical Approach. Sensors 2024, 24, 3223. [Google Scholar] [CrossRef]
- Yalcinkaya, F.; Erbas, A. Convolutional neural network and fuzzy logic-based hybrid melanoma diagnosis system. Elektron. Ir Elektrotechnika 2021, 27, 69–77. [Google Scholar] [CrossRef]
- Huang, L.; Alhulwah, K.H.; Hanif, M.F.; Siddiqui, M.K.; Ikram, A.S. On QSPR analysis of glaucoma drugs using machine learning with XGBoost and regression models. Comput. Biol. Med. 2025, 187, 109731. [Google Scholar] [CrossRef]
- Mitchell, R.; Frank, E. Accelerating the XGBoost algorithm using GPU computing. PeerJ Comput. Sci. 2017, 3, e127. [Google Scholar] [CrossRef]
- Sagi, O.; Rokach, L. Approximating XGBoost with an interpretable decision tree. Inf. Sci. 2021, 572, 522–542. [Google Scholar] [CrossRef]
- Ye, L.Z.; Zheng, D.H.; Liu, Y.H.; Niu, S. Unbalanced Data Classification Based on Whale Swarm Optimized Random Forest Algorithm. J. Nanjing Univ. Posts Telecommun. 2022, 42, 99–105. [Google Scholar]
- Zhang, Z.W.; Zhang, Y.Y.; Wen, Y.T.; Ren, Y.X. Prediction Method of Performance Parameters of Multi-Defect Lattice Structures Based on XGBoost Model. Acta Metrol. Sin. 2024, 45, 559–564. [Google Scholar]
- Sun, L.K.; Lou, K. Fault Diagnosis of Hydraulic System Test Bench for Controllable Pitch Propeller Based on XGBoost Method. Ship Eng. 2024, 46, 190–196. [Google Scholar]
- Zheng, H.; Jia, Z.F.; Zhou, L.T.; Wang, Z. Defect Classification Algorithm for Wind Turbine Blades Based on PSO-XGBoost. Acta Energiae Solaris Sin. 2024, 45, 127–133. [Google Scholar]
- Han, Z.Z.; Zhou, S.R.; Fang, C. Fuzzy statistic and comprehensive evaluating study for activity characterization of the active region. Sci. China Ser. A-Math. 2001, 44, 662–668. [Google Scholar] [CrossRef]
- Yang, L.; Wang, P.C. A Useful Mathematical Evaluation Method in Medicine. J. Math. Med. 2010, 23, 509–510. [Google Scholar]
- Li, G.; Tong, J.Y.; Zhu, J.; Li, D.; Hao, S.B. Application of Fuzzy Comprehensive Evaluation Method in Risk Prediction of Sudden Coronary Death. J. Southeast Univ. 2014, 33, 300–303. [Google Scholar]
- Wang, L.C.; Liu, S.S. Research on Improved Random Forest Algorithm Based on Hybrid Sampling and Feature Selection. J. Nanjing Univ. Posts Telecommun. 2022, 42, 81–89. [Google Scholar]
- Yang, M.J.; Wang, C.F.; Wu, C.H. Research on Multi-Factor Stock Selection Model Based on Random Forest Algorithm (English). Pure Appl. Math. 2023, 39, 506–519. [Google Scholar]
- Lu, R.; Li, L.Y.; Sun, Y.Y. A Suspicious Transaction Detection Method Based on Random Forest. J. Liaoning Tech. Univ. 2021, 40, 82–89. [Google Scholar]
- Lü, H.Y.; Feng, Q. A Review of Research on Random Forest Algorithm. J. Hebei Acad. Sci. 2019, 36, 37–41. [Google Scholar]
- Imani, M.; Beikmohammadi, A.; Arabnia, H.R. Comprehensive Analysis of Random Forest and XGBoost Performance with SMOTE, ADASYN, and GNUS Under Varying Imbalance Levels. Technologies 2025, 13, 88. [Google Scholar] [CrossRef]
- Lu, Y.; Song, J.X.; Zhu, J.; Bian, Y.P.; Tong, J.Y.; Feng, Y. Analysis of Related Risk Factors for 104 Cases of Sudden Cardiac Death. J. Southeast Univ. 2012, 31, 397–399. [Google Scholar]
- Han, X.J.; Mao, J.Y. Investigation and Analysis of Knowledge, Attitude and Practice about Related Risk Factors in Coronary Heart Disease Patients. Health Med. Res. Pract. 2008, 3, 51–53. [Google Scholar]
- Zhang, F.J.; Liu, S.M. Fuzzy Comprehensive Evaluation of Disease Risk among Rural Residents in China. Shandong Soc. Sci. 2012, 7, 31–35. [Google Scholar] [CrossRef]
- Xu, H.; Wu, Q.Y. Discussion on the Application of Fuzzy Mathematics in Medicine. J. Math. Med. 2000, 6, 564–565. [Google Scholar]
- Yu, J.; Yi, F.; Ma, G.S. Clinical Observation of Coronary Intervention in Elderly Patients with Coronary Heart Disease Complicated with Diabetes Mellitus. Mod. Med. 2012, 40, 671–674. [Google Scholar]
- Tian, F. Application of Fuzzy Comprehensive Evaluation Method in Risk Analysis. Syst. Eng. Electron. 2003, 2, 174–176. [Google Scholar]
- Panjaitan, F.; Nurmaini, S.; Partan, R.U. Accurate Prediction of Sudden Cardiac Death Based on Heart Rate Variability Analysis Using Convolutional Neural Network. Medicina 2023, 59, 1394. [Google Scholar] [CrossRef]
- Sherpa, M.D.; Sonkawade, S.D.; Jonnala, V.; Pokharel, S.; Khazaeli, M.; Yatsynovich, Y.; Kalot, M.A.; Weil, B.R.; Canty, J.M., Jr.; Sharma, U.C. Galectin-3 Is Associated with Cardiac Fibrosis and an Increased Risk of Sudden Death. Cells 2023, 12, 1218. [Google Scholar] [CrossRef]
- Franczyk, B.; Rysz, J.; Olszewski, R.; Gluba-Sagr, A. Do Implantable Cardioverter-Defibrillators Prevent Sudden Cardiac Death in End-Stage Renal Disease Patients on Dialysis? J. Clin. Med. 2024, 13, 1176. [Google Scholar] [CrossRef] [PubMed]
- Gao, W.; Liao, J. Sudden Cardiac Death Risk Prediction Based on Noise Interfered Single-Lead ECG Signals. Electronics 2024, 13, 4274. [Google Scholar] [CrossRef]
- Salzillo, C.; La Verde, M.; Imparato, A.; Molitierno, R.; Lucà, S.; Pagliuca, F.; Marzullo, A. Cardiovascular Diseases in Public Health: Chromosomal Abnormalities in Congenital Heart Disease Causing Sudden Cardiac Death in Children. Medicina 2024, 60, 1976. [Google Scholar] [CrossRef] [PubMed]


Disclaimer/Publisher’s Note: The statements, opinions and data contained in all publications are solely those of the individual author(s) and contributor(s) and not of MDPI and/or the editor(s). MDPI and/or the editor(s) disclaim responsibility for any injury to people or property resulting from any ideas, methods, instructions or products referred to in the content. |
© 2025 by the authors. Licensee MDPI, Basel, Switzerland. This article is an open access article distributed under the terms and conditions of the Creative Commons Attribution (CC BY) license (https://creativecommons.org/licenses/by/4.0/).