Abstract
To address the inadequate balance between exploration and exploitation of existing algorithms in complex solution spaces, this paper proposes a novel mathematical metaheuristic optimization algorithm—the Perpendicular Bisector Optimization Algorithm (PBOA). Inspired by the geometric symmetry of perpendicular bisectors (the endpoints of a line segment are symmetric about them), the algorithm designs differentiated convergence strategies. In the exploration phase, a slow convergence strategy is adopted (deliberately steering particles away from the optimal region defined by the perpendicular bisector) to expand the search space; in the exploitation phase, fast convergence refines the search process and improves accuracy. It selects 4 particles to construct line segments and perpendicular bisectors with the current particle, enhancing global exploration capability. The experimental results on 27 benchmark functions, compared with 15 state-of-the-art algorithms, show that the PBOA outperforms others in accuracy, stability, and efficiency. When applied to 5 engineering design problems, its fitness values are significantly lower. For H-type motion platforms, the PBOA-optimized platform not only achieves high unidirectional motion accuracy, but also the average synchronization error of the two Y-direction motion mechanisms reaches ±2.6 × 10⁻⁵ mm, with stable anti-interference performance.
1. Introduction
Metaheuristic algorithms are algorithmic frameworks designed to address complex optimization problems that often surpass the capabilities of traditional methods. In large-scale, highly complex, and strongly nonlinear search spaces, these algorithms offer distinct advantages—conventional optimization techniques frequently struggle due to prohibitive computational complexity [1]. As high-level strategies, metaheuristics guide heuristic searches to efficiently explore and exploit solution landscapes, aiming to identify global optimal or near-optimal solutions within feasible timeframes. Most draw inspiration from natural processes, providing robust mechanisms for navigating vast and intricate solution spaces [2].
Metaheuristic techniques span a wide range of approaches, from those inspired by natural phenomena and psychological processes to human-engineered systems [3]. Prominent categories include evolutionary algorithms (EAs) [4]—such as differential evolution (DE) [5]—swarm intelligence (SI) [6] (e.g., particle swarm optimization (PSO) [7] and ant colony optimization (ACO) [8]), and physics-based methods like the gravitational search algorithm (GSA) [9]. All operate on iterative refinement: a set of candidate solutions converges toward optimality through processes such as selection, crossover, mutation, movement, and position updates [10].
These techniques find applications across diverse domains, including engineering design optimization [3], image segmentation, path planning, task scheduling, machine learning, and network design [11,12,13,14,15].
However, metaheuristics face inherent challenges: risks of early convergence, the need to balance exploration and exploitation, and demands for parameter tuning. Additionally, the “No Free Lunch” theorem [16] establishes that no single algorithm universally outperforms others across all problems. Thus, selecting an appropriate method depends on the problem’s specific nature and requirements, emphasizing the need for new algorithms to tackle diverse optimization challenges in engineering and related fields [17].
This paper aims to propose a novel mathematics-inspired optimization algorithm—the Perpendicular Bisector Optimization Algorithm (PBOA). A perpendicular bisector is defined as a line perpendicular to a line segment and passing through its midpoint. Its core property—that any point on the bisector is equidistant from the two endpoints of the segment—is a fundamental conclusion in Euclidean geometry, provable via the theory of congruent triangles. This property has been validated over time: Euclid established its foundational role in Elements [18], and it remains a key theoretical reference in modern geometric research [19]. In the framework of swarm intelligence optimization, algorithms update individual positions through correlations between population members. The perpendicular bisector, by partitioning the search space and defining distance relationships between individual positions and potential optimal solutions, provides geometric constraints and directional guidance for particle position updates, forming the algorithm’s theoretical basis. Built on this principle, the PBOA is designed to tackle increasingly complex optimization challenges.
The main contributions of this paper are summarized as follows:
- Propose a novel metaheuristic optimization algorithm—the Perpendicular Bisector Optimization Algorithm (PBOA), which fully leverages the properties of perpendicular bisectors in geometric principles, offering a new perspective for metaheuristic optimization.
- Evaluate the optimization performance of the PBOA using 27 benchmark functions and validate the reliability of the results via detailed visual analytics.
- Verify the application potential of the PBOA through 3 engineering design problems, demonstrating its effectiveness in practical engineering scenarios.
- Apply the PBOA to the parameter optimization of the time-varying non-singular fast terminal sliding mode controller for H-type motion platforms, with the experimental results showing that it exhibits significant advantages in multi-parameter controller optimization.
After the Introduction, Section 2 will review related work on metaheuristic algorithms; Section 3 will introduce the proposed PBOA and its mathematical modeling; Section 4 will describe the experimental setup; Section 5 will conduct a comprehensive simulation and performance analysis of the PBOA on 27 benchmark functions; Section 6 will examine the PBOA’s effectiveness in 5 practical engineering design problems and the optimization of the time-varying non-singular fast terminal sliding mode controller for H-type motion platforms; Section 7 will summarize the key findings and suggest future research directions.
2. Related Work
Optimization algorithms are pivotal in computational science, serving as efficient tools to solve complex problems across diverse fields. A large number of these algorithms take inspiration from natural and social phenomena, converting biological, physical, chemical, and behavioral principles into practical computational strategies [3,10,20]. Their diversity stems from a wide array of sources, such as animal behaviors, plant interactions, and physical processes [3]. This extensive foundation facilitates the development of algorithms that are not only effective but also robust, adapting well to complex high-dimensional optimization tasks. Each algorithm is designed to simulate specific natural mechanisms, providing unique strategies to find efficient solutions in multi-dimensional and dynamic optimization scenarios [10]. By modeling natural phenomena, these algorithms optimize functions through exploration, exploitation, and evolution, embodying the core mechanisms observed in natural systems [3]. Correspondingly, Table 1 [20] offers a detailed classification of state-of-the-art optimization algorithms, categorizing them by their primary inspiration and core methodologies.
Optimization via swarm intelligence algorithms is achieved through the collective intelligence and decentralized decision-making of social animals. Consider Particle Swarm Optimization (PSO) [21], for instance: drawing on the foraging habits of bird flocks and fish schools, it maintains a population of particles (candidate solutions) that navigate the search space. These particles adjust their velocities and positions under the guidance of both individual and collective top-performing solutions, with the swarm moving toward high-quality regions of the search space over iterations. In a similar manner, Ant Colony Optimization (ACO) [22] strengthens promising paths through pheromone deposition and evaporation, balancing the exploitation of known routes with the exploration of new options. The variety of swarming behaviors applicable to optimization tasks is further highlighted by other swarm-based methods like Artificial Bee Colony (ABC) [23], Ant Lion Optimizer (ALO) [24], and Jellyfish Search (JS) [25].
Drawing on mammalian behavior, certain metaheuristic algorithms integrate foraging tactics, social hierarchies, or alertness mechanisms. For example, the Gray Wolf Optimizer (GWO) [16] imitates the hierarchical behavior (alpha, beta, delta, omega) of wolf packs; the Cheetah Optimizer (CO) [26] reproduces how cheetahs pursue prey rapidly and shift direction abruptly; the Meerkat Optimization Algorithm (MOA) [27] is based on meerkats’ coordinated vigilance; and the Harris Hawks Optimizer (HHO) [28] models hawks’ sudden assault strategies. By incorporating these natural behaviors, search diversity is boosted, and solutions are steered toward high-quality regions.
Inspired by physical and chemical phenomena, another major class of optimization algorithms functions differently. Take Simulated Annealing (SA) [29]—rooted in metallurgical annealing—as an example: it uses a gradually declining temperature parameter to temporarily accept inferior solutions, helping escape local optima. In a similar way, the Gravitational Search Algorithm (GSA) [30] treats candidate solutions as masses under gravitational pull; fitter (heavier) solutions exert stronger attraction, steering the population toward optimal solutions. The Multi-Verse Optimizer (MVO) [31] simulates inflation rates across parallel universes, and the Black Hole (BH) Algorithm [32] depicts how solutions converge into a dominant gravitational well.
Within the chemical and biochemical domain, Atom Search Optimization (ASO) [33], Chemical Reaction Optimization (CRO) [34], and Nuclear Reaction Optimization (NRO) [35] make use of molecular interactions, reaction dynamics, and fission or fusion processes to navigate the search space toward configurations with more favorable energy levels.
Biological evolution serves as the source of operational mechanisms for evolutionary algorithms (EAs). Genetic Algorithms (GAs) [36] employ selection, crossover, and mutation operators to iteratively refine a solution population. GAs maintain diversity and reduce the risk of premature convergence by favoring fitter solutions and introducing controlled randomness. As generations progress, the population slowly approaches global or near-global optima. Differential Evolution (DE) [5] improves solutions by applying scaled differences between existing candidates, and Genetic Programming (GP) [37] extends these principles to the evolution of entire programs, thereby demonstrating the adaptability and versatility of evolution-based optimizers.
Another category of optimization algorithms, mathematical and numerical methods, relies on pure mathematical principles instead of biological or social analogies. Take the Arithmetic Optimization Algorithm (AOA) [38] as an example: it uses arithmetic operators—addition, subtraction, multiplication, and division—in a controlled way. Starting with extensive exploration, it gradually narrows its focus to promising regions, with an adjustable parameter regulating how intense arithmetic operations are over time. In a similar vein, Chaos Game Optimization (CGO) [39] and the Sine Cosine Algorithm (SCA) [40] each use fractal geometry and trigonometric models to systematically balance exploration and exploitation within the search space.
Drawing inspiration from natural cycles and environmental dynamics, environmental and ecologically inspired approaches enhance the search process. The Snow Ablation Optimizer (SAO) [41] simulates how snow melts, while the Water Cycle Algorithm (WCA) [42] models the natural water cycle, which includes evaporation, precipitation, and flow. These algorithms achieve a dynamic balance between exploration and exploitation by replicating ecological cycles.
Optimization algorithms have also found inspiration in human social behavior. The Chef-Based Optimization Algorithm (CBOA) [43] imitates the decision-making strategies chefs use when creating and refining recipes; Cultural Algorithms (CA) [44] combine individual adaptation with a shared belief space to facilitate collective learning.
Within non-biological inspiration domains, optimizers inspired by games—such as the Dart Game Optimizer (DGO) [45], Puzzle Optimization Algorithm (POA) [46], and Squid Game Optimizer (SGO) [47]—derive their strategic decision-making from entertainment and popular culture. Meanwhile, algorithms rooted in economics, including Supply-Demand Optimization (SDO) [48] and Search and Rescue Optimizer (SARO) [49], leverage market equilibrium dynamics and systematic rescue strategies to guide convergence toward optimal solutions.
Table 1 illustrates that optimization algorithms exhibit diversity across multiple domains, from swarm intelligence and mammalian hunting strategies to physical-chemical analogies. This diversity showcases the flexibility and adaptability of metaheuristic algorithms when addressing complex optimization challenges.
That said, existing metaheuristic and evolutionary algorithms come with notable limitations: premature convergence, slow adaptation to dynamic environments, and strict parameter tuning requirements [3,50]. For traditional evolutionary methods, computational costs rise exponentially as problem scale increases, making them inefficient in large-scale search spaces. Additionally, gradient-dependent algorithms face difficulties with highly nonlinear or discontinuous problems, which emphasizes the need for flexible gradient-free techniques [3].
The performance of metaheuristic algorithms in high-dimensional, complex optimization tasks is significantly restricted by these challenges. A core issue among them is premature convergence: in multimodal landscapes, algorithms find it hard to maintain solution diversity [51], which often results in convergence to local optima and limits their capacity to identify global solutions [52]. Slow adaptation to dynamic environments is another major challenge; many algorithms depend on fixed exploration-exploitation mechanisms [53], and such rigidity lowers their efficiency in responding to time-varying objectives and constraints, thus weakening their effectiveness in practical applications [54].

Table 1.
Detailed Classification of Mainstream Optimization Algorithms.
Table 1.
Detailed Classification of Mainstream Optimization Algorithms.
| Category | Algorithm | Year | Authors | Brief Description | Ref. |
|---|---|---|---|---|---|
| Swarm intelligence | Particle swarm optimization (PSO) | 1995 | Kennedy, Eberhart | Models swarm behavior of birds; particles adjust velocity and position based on solutions; global best solution is updated | [21] |
| Ant colony optimization (ACO) | 2006 | Dorigo, Stützle | Simulation foraging behavior of ants; uses pheromone trails for promoting paths | [22] | |
| Artificial bee colony (ABC) | 2005 | Karaboga, Basturk | Mimics bee foraging patterns in a graph; employed, onlooker, and scout bees for exploitation of nectar sources | [23] | |
| Whale optimization algorithm (WOA) | 2016 | Mirjalili, Lewis | Simulates “bubble-net attack” hunting strategy of humpback whales; updating surround prey: spiral updating mechanism and encircling prey | [55] | |
| Bacteria phototaxis optimizer (BPO) | 2023 | Pan, Teng, Li, Zhan | Inspired by bacterial phototaxis; uses phototaxis, aerotaxis, and chemotaxis mechanisms for exploration and exploitation | [56] | |
| Mammalian behavior | Gray wolf optimizer (GWO) | 2014 | Mirjalili, et al. | Mimics gray wolves’ strategy in nature (grey wolf hierarchy: alpha, beta, omega); three main steps: tracking, encircling, and attacking prey | [16] |
| Harris hawks optimizer (HHO) | 2019 | Heidari, et al. | Utilizes covert attack strategies of Harris’ hawks to enhance exploration and exploitation | [28] | |
| Cheetah optimizer (CO) | 2022 | Akbar, Deb | Inspired by cheetahs’ chasing speed; it features rapid global search ability and efficient exploitation near optimal solutions | [26] | |
| Mammalian behavior | Meerkat optimization algorithm (MOA) | 2023 | Xian et al. | Mimics meerkats’ alertness; sentry meerkat for exploration; forager meerkats for solution search | [27] |
| Physical phenomena | Simulated annealing (SA) | 1983 | Kirkpatrick et al. | Based on the thermal annealing process in metallurgy; its cooling schedule enables escape from local optima to find better solutions | [29] |
| Gravitational search algorithm (GSA) | 2009 | Rashedi et al. | Considers candidate solutions as masses; gravitational force draws solutions toward fitter agents | [30] | |
| Multi-verse optimizer (MVO) | 2016 | Mirjalili, et al. | Inspired by multi-verse theory; explores universe with varied inflation rates | [31] | |
| Black hole algorithm (BHA) | 2013 | Hammoudeh, et al. | Simulates stars in a black hole attracting stars; solutions converge by “falling” into the black hole | [32] | |
| Elastic deformation optimization algorithm (EDOA) | 2022 | Pan, Tang, et al. | Based on Hooke’s law and Newton’s theory; uses elastic deformation for exploration and exploitation | [57] | |
| Chemical biochemical | Atom search optimization (ASO) | 2019 | Zhao et al. | Simulates integrative interaction forces; solutions find information exchange interactions and reactive relations | [33] |
| Chemical reaction optimization (CRO) | 2009 | Lam, Li | Mimics molecular reactions; uses collision, decomposition, synthesis, and interchange to seek stable, lower-energy solutions | [34] | |
| Nuclear reaction optimization (NRO) | 2019 | Wei et al. | Based on nuclear fission/fusion; explores solution space via collision and entropy search | [35] | |
| Evolutionary algorithms | Differential evolution (DE) | 1997 | Storn, Price | Creates new candidates by adding scaled differences to existing ones | [5] |
| Genetic algorithm (GA) | 1975 | Holland | Employs survival-of-the-fittest principles; along with crossover and mutation operators, to evolve a population toward optimal solutions | [36] | |
| Genetic programming (GP) | 1998 | Banzhaf et al. | Evolves computer programs; represented as trees; genetic operators evolve a population | [37] | |
| Mathematical models | Arithmetic optimization algorithm (AOA) | 2021 | Abualigah et al. | Employs arithmetic operations; transitions from broad exploration to exploitation | [38] |
| Chaos game optimization (CGO) | 2021 | Talatnahr, et al. | Uses chaos fractals; random walks and greedy strategies support both exploration and exploitation | [39] | |
| Sine cosine algorithm (SCA) | 2016 | Mirjalili | Updates solutions via sine/cosine functions; balances global and local search | [40] | |
| Expectation-based weighted hypergraph in optimization (EBHO) | 2024 | Pan, Wang et al. | Incorporates the adaptive hypergraph model in information dissemination; balances global exploration and local exploitation | [58] | |
| Environmental ecological | Snow ablation optimization (SAO) | 2023 | Deng et al. | Simulates snow melting process; iterative ablation reveals promising regions | [41] |
| Water cycle algorithm (WCA) | 2012 | Eskandar et al. | Mimics the water cycle processes; streams merge into rivers and lakes at varying rates | [42] | |
| Human behavior/Social dynamics | Chaotic-based optimization algorithm (CBOA) | 2022 | Tranojevska et al. | Refines solutions via iterative chaotic maps; balances exploration and exploitation | [43] |
| Cultural algorithm (CA) | 1994 | Reynolds | Inspired by cultural evolution; integrates continuous adaptation with a shared belief space for collective learning | [44] | |
| Game—based algorithms | Darts game optimizer (DGO) | 2020 | Dehghani et al. | Inspired by dart throwing; solutions adapt by aiming closer at target optima iteratively | [45] |
| Puzzle optimization algorithm (POA) | 2022 | Ahmadi et al. | Analogous to solving a puzzle; piecewise adjustments gradually assemble coherent optimal structures. | [46] | |
| Economic theory | Supply-demand—based optimization (SDO) | 2019 | Zhao et al. | Mimic market equilibria; supply-demand interactions converge on best solutions over time. | [48] |
| Economic theory | Search and rescue optimization (SAR) | 2020 | Shabani et al. | Models rescue missions; systematic hunting processes locate high-fitness solutions (survivors) | [49] |
Furthermore, the wide applicability of algorithms is hindered by stringent parameter tuning. Parameters like mutation rate, crossover probability, and weight scaling usually require manual tuning [54], a time-consuming process that impairs the algorithm’s generalizability and practical usability. Meanwhile, as the problem dimension grows, the “curse of dimensionality” causes computational costs to rise exponentially: traditional evolutionary methods demand more iterations and evaluations, which reduces their scalability for large-scale problems [51]. Metaheuristic algorithms fare poorly with highly nonlinear, discontinuous, or noisy objective functions, and gradient-based methods also struggle to produce reliable solutions in these scenarios. This further underscores the need for robust gradient-free techniques when dealing with complex real-world problems [53].
Moreover, these algorithms show weak robustness in multimodal optimization: when multiple local optima are present [53], most fail to explore and exploit multiple search regions simultaneously, resulting in suboptimal solutions when the fitness landscape has significant irregularities. Scalability remains a persistent issue: many algorithms are designed for small-scale problems, yet their performance drops sharply as problem complexity increases [52]. Finally, heavy reliance on specific problems limits the universality of metaheuristic algorithms [51]; extensive customization for different problem domains is required for most algorithms, which reduces their versatility in addressing a wide range of optimization challenges.
To tackle the challenges mentioned above, the Perpendicular Bisector Optimization Algorithm (PBOA) introduces a search space expansion mechanism, which effectively lowers the risk of premature convergence. By selecting 4 different particles and constructing line segments with the current particle to generate perpendicular bisectors, the algorithm simulates a geometry-driven search expansion process—this significantly enhances its exploration and exploitation capabilities. Core features, such as the equidistant property of perpendicular bisectors and differentiated convergence strategies (slow convergence in the exploration phase to expand the search range, and fast convergence in the exploitation phase for refined search), adapt to the search needs of complex solution spaces, boosting adaptability in diverse optimization scenarios. Integrating deterministic line segment construction and dynamic convergence control mechanisms, the PBOA extends the performance boundaries of mathematical heuristic algorithms. These mechanisms maintain solution diversity while ensuring convergence efficiency, making the PBOA particularly effective in multimodal and perturbed problem spaces.
A key strength of the PBOA is its deterministic theoretical foundation, a characteristic that equips the algorithm with robust exploitation capability and allows it to focus most computational resources on the search process. Thanks to this resource allocation mechanism, the PBOA exhibits superior performance and robustness in the majority of optimization problems.
By leveraging the geometric properties of perpendicular bisectors to their full extent, the PBOA successfully addresses the core limitations of existing metaheuristic methods, providing a reliable solution approach for complex optimization problems. Subsequent sections will elaborate on the PBOA’s mathematical model and its specific applications in engineering design problems.
3. Perpendicular Bisector Optimization Algorithm
This section will elaborate on the definition and properties of perpendicular bisectors, as well as the PBOA’s implementation details, algorithm pseudocode, and flowchart.
3.1. Definition and Properties of Perpendicular Bisectors
The perpendicular bisector is one of the core concepts in elementary geometry. In a two-dimensional coordinate system (as shown in Figure 1), connecting point A and point B forms line segment AB with A and B as endpoints. By definition, a perpendicular bisector is a straight line that passes through the midpoint of a line segment and is perpendicular to that segment; thus, the perpendicular bisector of segment AB can be denoted as line L. The perpendicular bisector has two basic properties:
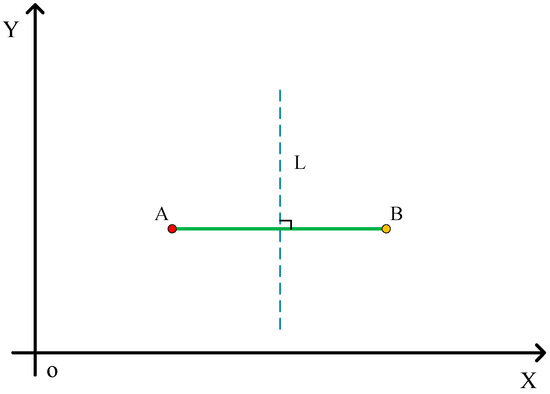
Figure 1.
In a two-dimensional space, this figure shows the perpendicular bisector L of segment AB.
- It is perpendicular to the line segment and bisects it, with the two parts of the segment on either side of the perpendicular bisector being completely symmetric;
- Any point on the line is equidistant from the two endpoints of the segment.
3.2. Inspiration
Intelligent optimization algorithms update individual attributes (such as the position of “particles” in Particle Swarm Optimization (PSO), “genes” in Genetic Algorithms (GA), etc.) by leveraging the interaction between individuals in the population.
In Figure 2, based on Figure 1, individual attribute constraints are added, and all points can only exist within the yellow box (Constrained Region) in Figure 2. Let P be the optimal solution of this two-dimensional constrained optimization problem within the limited region. At this point, the perpendicular bisector L divides the constrained region into two parts; since the distance from point P to point A is less than that to point B, P must be located in the green and pink regions on the left side of the perpendicular bisector L. Take any point B′ in the grid region; in the case of Figure 2, the distance from point B′ to P is less than that from point A to P. By constructing the perpendicular bisector L′ of segment AB′, P must lie within the pink region in Figure 2.
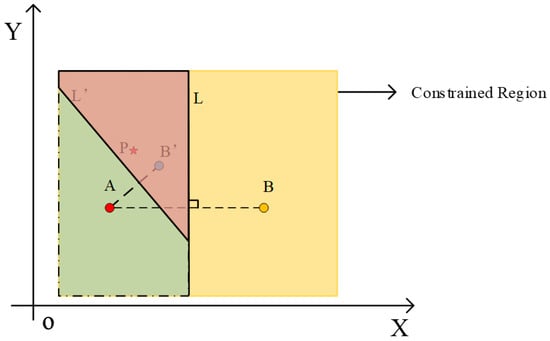
Figure 2.
Schematic Diagram of Optimization Algorithm Based on Perpendicular Bisector Construction in 2D Space.
In three-dimensional space, it can be decomposed into three two-dimensional subspaces, namely the Y-Z plane, X-Y plane, and X-Z plane. For points P, A, and B in three-dimensional space, they can be projected onto these three two-dimensional subspaces, respectively, to obtain projection points: P′, A′, B′ on the Y-Z plane; P″, A″, B″ on the X-Y plane; and P‴, A‴, B‴ on the X-Z plane. Taking the Y-Z plane as an example, we construct line segment A′B′ and its perpendicular bisector. As shown in Figure 3, since point P′ is closer to point A′, it can be known that P′ lies in the region containing A′ as divided by the perpendicular bisector.
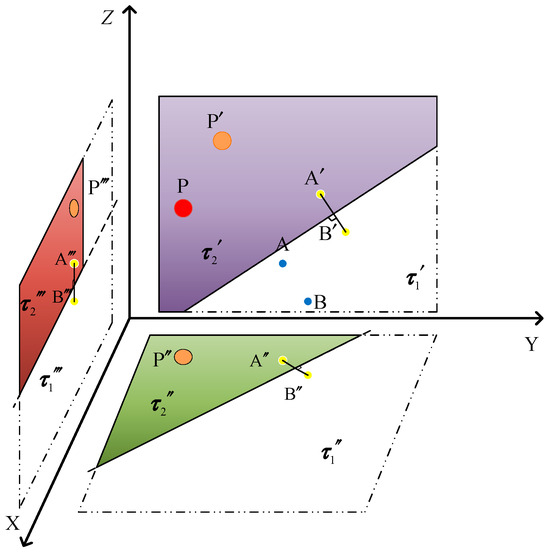
Figure 3.
Schematic Diagram of Optimization Algorithm Based on Perpendicular Bisector Construction in 3D Space.
By performing the same operation on the X-Y plane and X-Z plane, it can be determined that P″ exists in the specific region divided by the perpendicular bisector of the corresponding plane, and P‴ also exists in the corresponding region divided by the perpendicular bisector of the X-Z plane. Finally, the position region of point P in three-dimensional space is the intersection of the corresponding regions in the three two-dimensional subspaces:
Based on the above analysis, complex multi-dimensional solutions can be decomposed into multiple two-dimensional solutions through projection. The properties of perpendicular bisectors in two-dimensional space can also be extended to solve multi-dimensional problems.
3.3. Mathematical Correlation Analysis and Convergence Proof
3.3.1. Correlation Between Geometric Characteristics and Optimization Performance
The core of the PBOA lies in mapping the fitness difference between individuals to the geometric distance relationship in the solution space and using the properties of the perpendicular bisector to narrow the search range. To establish the mathematical correlation between geometric characteristics and optimization performance, we first define the following variables:
Let the solution space be a bounded convex set , and let the objective function be continuous and differentiable. For any two points , their fitness values satisfy (indicating that A is closer to the optimal solution P* than B). According to the geometric properties described in Section 3.2, the perpendicular bisector L of segment AB divides the space into two half-spaces HA and HB, where HA is the region containing A. The key mathematical correlation is: In an ideal scenario, due to the strict consistency between the geometric division by the perpendicular bisector and the direction of the fitness gradient, the probability that holds is 1; in actual engineering, affected by disturbance factors, this probability is not less than 0.5 and approaches 1 as the iteration accuracy improves.
This correlation can be quantified by the fitness gradient. Let be the gradient of the objective function at point X, which reflects the direction of the fastest increase in fitness. For the optimal solution P*, there exists a neighborhood such that for any , (that is, in the minimization problem, the gradient points away from the optimal solution). When constructing the perpendicular bisector L, the angle θ between the normal vector of L and the gradient direction satisfies:
When , holds, so , which means that the normal direction of the perpendicular bisector is consistent with the gradient direction in the local region. This ensures that the HA region divided by the perpendicular bisector contains the search direction of the optimal solution, thereby improving the optimization efficiency.
3.3.2. Convergence Proof Between Geometric Characteristics and Optimization Performance
To prove the convergence of the PBOA, it is necessary to show that as the number of iterations increases, the algorithm can approach the global optimal solution with a probability of 1.
Assumption 1.
The objective function f has a lower bound in the solution space Ω, that is, there exists a constant m such that for all
Assumption 2.
The solution space Ω is a compact set (closed and bounded), so any sequence in Ω has a convergent subsequence.
Assumption 3.
The objective function has monotonicity with respect to the distance to the optimal solution in the local neighborhood of the optimal solution.
Definition 1.
Let be the sequence of solutions generated by the PBOA, where Xk is the optimal solution found in the k-th iteration. The algorithm is said to converge if holds with a probability of 1 (where P* is the global optimal solution).
Proof.
- Feasibility of region shrinkage: In each iteration, the PBOA constructs a new perpendicular bisector based on the current optimal individual Xk and a randomly selected individual Yk, and updates the search region to , where is the half-space containing Xk divided by the perpendicular bisector of XkYk. Since , combined with the monotonicity of the objective function and the geometric properties of the perpendicular bisector, must hold in an ideal scenario, and a high probability of holding is ensured in practice. Therefore, ; that is, the search region is always a nested sequence containing the optimal solution.
- Convergence of the region sequence: Due to the compactness of Ω, according to the finite intersection property of compact sets, the intersection of the nested sequence is a non-empty compact set , and . If the diameter of (the maximum distance between any two points in the set) satisfies , then .
- Probability of approaching the optimal solution: In each iteration, based on the monotonicity of the objective function, the probability that the new search region contains the neighborhood of P* is high. According to the Borel-Cantelli lemma, the probability that the algorithm eventually enters and stays in any neighborhood of P* is 1, that is, holds with a probability of 1.
- Convergence of fitness values: Since f is continuous , holds, and the convergence proof is completed. □
3.3.3. Limitations and Supplementary Strategies
The above convergence proof is based on the unimodal assumption and monotonicity assumption of the objective function. For multimodal problems, although the properties of the perpendicular bisector cannot directly ensure convergence to the global optimal solution, the introduction of mutation operators (such as Gaussian mutation) can help the algorithm jump out of local optima. Let the mutation probability be , and the mutation step size decreases with the number of iterations. Then, the probability that the algorithm explores the neighborhood of the global optimal solution within a limited number of iterations is still 1, thus extending the convergence to multimodal problems. At the same time, in practical applications, to address the impact of disturbance factors, by increasing the number of samples and optimizing the individual selection strategy, the probability that can be made to continuously approach 1 as the iteration accuracy improves, ensuring the optimization performance of the algorithm.
3.4. Convergence Proof of PBOA
The PBOA starts from a set of random solutions, as shown in Equation (3).
where xi represents the corresponding position information of individuals in the ith subgroup. Dim denotes the dimension of the problem, and N denotes the number of individuals in the subpopulation. Each xi,j in matrix X can be calculated using Equation (4).
where r is a random number in the interval [0, 1], and UBj and LBj are the upper and lower bounds of the jth dimension of the given problem, respectively.
3.5. Types of Objects for Constructing Perpendicular Bisectors
Based on the principle of perpendicular bisectors, two particles are required to form a line segment for generating a perpendicular bisector. The PBOA provides 4 types of particles for each particle to be updated to construct line segments:
- Type 1: Particle with the best global fitness (α);
- Type 2: Particle with the second-best global fitness (β);
- Type 3: Particle with the third-best global fitness (γ);
- Type 4: Randomly selected particle.
In each iteration, the probabilities of selecting these 4 types of particles are P1, P2, P3, and P4, respectively. Compared with single-type endpoints, perpendicular bisectors constructed with 4 types of endpoints can form a broader search area (as shown in Figure 4), enhancing the algorithm’s exploration capability in multi-modal spaces.
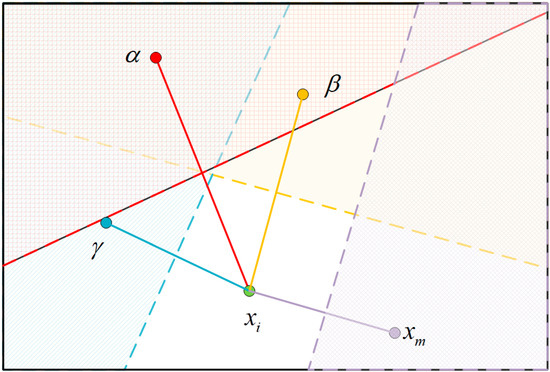
Figure 4.
Search space of PBOA after constructing perpendicular bisectors between particle xi and 4 types of different particles. The colored area in the figure represents the searchable range formed by the perpendicular bisectors constructed between particles and four types of endpoints. Compared with a single-colored area, this range covers a larger area.
3.6. Exploitation Phase
This subsection presents the equation of the perpendicular bisector and designs the exploitation phase for particle update in the PBOA based on this equation.
3.6.1. Equation of the Perpendicular Bisector in Two-Dimensional Space
In a two-dimensional space, let the coordinates of point A be (a1, a2) and the coordinates of point B be (b1, b2); then the equation of the perpendicular bisector L of segment AB can be expressed as:
The region close to point A can be expressed as Equation (6), which provides geometric constraints for particle position update.
3.6.2. Particle Update Method in the Exploitation Phase
Based on the properties of perpendicular bisectors, the particle position update of the PBOA is divided into 3 steps:
- Step 1: Update of the first-dimensional variable using Equation (7),
- Step 2: Update variables in other dimensions (j ≥ 2) using Equation (8),
- Step 3: Re-update of the first-dimensional variable: After the particle updates the last dimension variable, a line segment is constructed between the last-dimensional variable and the first-dimensional variable, and then the first-dimensional variable is updated via Equation (8).
3.7. Exploration Phase
The exploration phase is used to prevent particles from rapidly approaching the selected object according to the convergence strategy of the perpendicular bisector, which would result in insufficient search in most of the space. In this phase, the update steps of particles are the same as the 3 steps in the exploitation phase, but the update method of variables in other dimensions (j ≥ 2) is different: in the exploration phase, variables must be updated based on Equation (11) to make particles approach the midpoint of the line segment, thereby slowing down the aggregation speed and preserving search diversity.
Consistent with the exploitation phase, after updating all variables of xi, it is necessary to re-update xi1, but this time Equation (11) is used instead of Equation (8).
3.8. Selection Method for Exploration Phase and Exploitation Phase
The probability P in Equation (12) is used to regulate mode selection and convergence mode. In the early stage of iteration (t is small), the P value is small, the exploration phase has a higher probability of being selected, and global exploration is prioritized. In the later stage of iteration (t is large), the P value is large, and the exploitation phase has a higher probability of being selected to enhance local search.
In the early stages of algorithm iteration, even as the iteration count t increases, the parameter λ effectively restrains the excessive growth of probability P. This ensures that the algorithm conducts sufficient global exploration and avoids premature transition to the exploitation phase. In the later stages of iteration, with the cumulative increase in t and the synergistic effect of λ, the weight of the exploitation phase gradually increases. Meanwhile, the regulatory mechanism of λ ensures that this transition process is smooth and orderly rather than abrupt. Consequently, λ not only effectively prevents the over-prolongation of the exploration phase (which would delay convergence efficiency) but also avoids the premature initiation of the exploitation phase (which may cause the algorithm to fall into suboptimal local solutions), ultimately achieving a dynamic balance between exploration and exploitation throughout the entire iterative cycle.
3.9. Pseudocode and Algorithm Flow Chart of PBOA
The pseudocode of the PBOA is shown in Algorithm 1, and the algorithm flow chart is shown in Figure 5.
| Algorithm 1: Perpendicular Bisector Optimization Algorithm (PBOA) | |
| 1: | Initialize parameters: population size N, particle dimension d, maximum number of iterations Max_iter, probability parameters P, P1, P2, P3, P4 and adjustment factor λ. |
| 2: | Randomly initialize the population and calculate the fitness values of all particles. |
| 3: | Sort by fitness to determine the globally optimal particle (first in fitness), the second optimal particle (second in fitness), and the third optimal particle (third in fitness). |
| 4: | Set the current number of iterations as t = 1. |
| 5: | while t ≤ Max_iter do |
| 6: | Set the particle index as i = 1. |
| 7: | While i ≤ N do |
| 8: | Generate two random numbers r3 and r4 in the range of [0, 1]. |
| 9: | Calculate the probability P according to Equation (12). |
| 10: | Update the first-dimensional variable xi1 of the ith particle according to Equation (7). |
| 11: | Select another endpoint particle of the line segment according to r3. |
| 12: | if r3 < P1 then |
| 13: | Select the global optimal particle (α) and the current particle to form a line segment. |
| 14: | else if r3 < P2 |
| 15: | Select the second optimal particle (β) and the current particle to form a line segment. |
| 16: | else if r3 < P3 |
| 17: | Select the third optimal particle (γ) and the current particle to form a line segment. |
| 18: | else |
| 19: | Randomly select a particle from the population to form a line segment with the current particle. |
| 20: | end if |
| 21: | Select the update mode according to r4; |
| 22: | if r4 < P then |
| 23: | Update the j ≥ 1 dimensional variables of the particle according to Equation (8). |
| 24: | Re-update xi1 using xiDim. |
| 25: | else |
| 26: | Update the j ≥ 1 dimensional variables of the particle according to Equation (11). |
| 27: | Re-update xi1 using xiDim. |
| 28: | end if |
| 29: | i = i + 1. |
| 30: | Calculate the fitness value of the ith particle after update. |
| 31: | If the new fitness is better, update the records of the globally optimal, second optimal, and third optimal particles. |
| 32: | end while |
| 33: | t = t + 1. |
| 34: | end while |
| 35: | Output the position of the global optimal particle and its corresponding best fitness. |
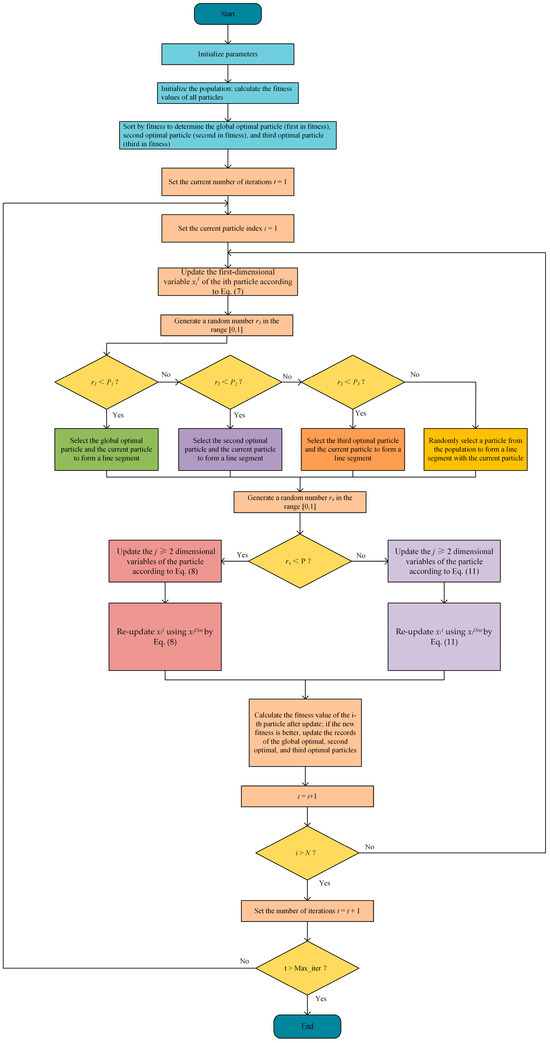
Figure 5.
Algorithm flow chart of PBOA.
3.10. Computational Complexity of PBOA
The computational complexity of an optimization algorithm can be characterized by a function that relates the running time of the algorithm to the input size of the problem. In complexity analysis, the O-notation (big O notation) is a widely recognized representation method. Based on this, the time complexity of the PBOA can be described as follows:
In addition to the factors involved in Equation (13), the time complexity of the PBOA is also affected by the following parameters: maximum number of iterations (Max_iter), population size (N), problem dimension (Dim), and computational cost of the objective function (f). Among them, the time complexity of the particle update process can be expressed as:
Therefore, considering the above influencing factors, the overall time complexity of the Perpendicular Bisector Optimization Algorithm (PBOA) can be derived as:
In O-notation, the time complexity of an algorithm is dominated by the term with the fastest growth rate (the remaining lower-order terms can be ignored). Based on this, the time complexity of the Perpendicular Bisector Optimization Algorithm (PBOA) can be simplified as:
4. Experimental Setup
This section provides an overview of the experimental setup, including the selection of benchmark test functions, the choice of comparison algorithms, the setting of evaluation metrics, and parameter configuration.
4.1. Benchmark Test Functions
In this paper, 27 optimization functions from reference [59] are selected as the test set (Table 2) to evaluate the efficiency and stability of the PBOA. Among them, the first 23 functions (F1~F23) are derived from the CEC2005 test suite, aiming to analyze the global search ability and local search ability of the algorithm; the remaining 4 functions (F24~F27) are translation variants of F1, F3, F9, and F11, which are used to verify the adaptability of the algorithm when perturbations are introduced into the independent variables.

Table 2.
Test function information table.
The 23 benchmark functions in the CEC2005 test suite mentioned above can be divided into three categories:
- Unimodal functions (F1~F7): Containing only a single global optimal value, they are mainly used to test the convergence performance of the algorithm.
- Multimodal functions (F8~F13): Including multiple local optimal solutions with complex structures, they focus on evaluating the algorithm’s ability to balance exploration and exploitation to avoid premature convergence.
- Fixed-dimensional multimodal functions (F14~F23): With low dimensions but a large number of local optimal solutions, they are mainly used to test the robustness of the algorithm in low-dimensional spaces.
4.2. Comparison Algorithms
To evaluate the performance of the PBOA, 15 optimization algorithms summarized in Table 3 are selected as comparison objects. These algorithms are all representative methods published in recent years, including two classical meta-heuristic algorithms that update based on geometric principles, with high citation counts.

Table 3.
List of 13 compared optimization algorithms.
4.3. Evaluation Metrics
To evaluate the performance of the algorithms, the Average Optimal Fitness (AOF) is adopted as the core evaluation metric. AOF is defined as the average of the optimal fitness values obtained from each independent run of the algorithm in multiple independent tests.
In terms of the meaning of the metric, a smaller AOF value indicates a lower average optimal fitness of the algorithm, meaning that the algorithm is more likely to find better solutions in multiple tests. In the algorithm performance ranking, the higher the ranking (closer to 1), the smaller the corresponding AOF value; the lower the ranking, the larger the AOF value.
4.4. Parameter Settings
The specific parameter configurations of each algorithm are detailed in Table 4. To ensure the fairness and impartiality of the comparative experiments, the parameter values listed in Table 4 are determined based on the following criteria: (1) For most algorithms, the parameters are set to the default values recommended in their original studies, which have been validated to achieve optimal performance in general optimization scenarios. (2) For a few algorithms where the original studies suggest a range of parameter values, we conducted preliminary experiments to select the values that yield stable and representative performance within that range, avoiding extreme values that might artificially degrade their optimization capabilities. (3) All parameters are kept consistent across different benchmark functions and engineering design problems to eliminate the influence of parameter variability on the comparison results. This is to ensure the transparency of the experimental process and the reproducibility of the results.

Table 4.
Parameter settings for compared algorithms.
5. Experimental Results and Analysis
5.1. Parameter Sensitivity Analysis
The core parameters involved in this paper include: the number of optimal points among the types of particles to be selected as endpoints of line segments, the key factor λ for selecting particle movement modes, and the probability parameters P1, P2, P3, and P4 that control the probability of particles following different targets. To evaluate the impact of these parameters on the algorithm performance, a parameter sensitivity analysis is conducted.
The experiment adopts a unified setup: the population size N = 50, and the maximum number of iterations Max_iter = 1000. For each parameter combination, the PBOA runs independently 50 times on each test function. The results of the sensitivity analysis are shown in Figure 6, Figure 7 and Figure 8. Based on these results, this paper determines the optimal setting method for each parameter, which is as follows:
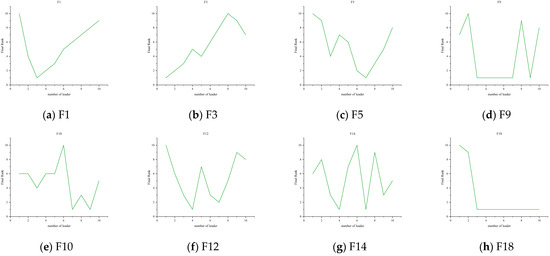
Figure 6.
Trend chart of leader quantity ranking changes.
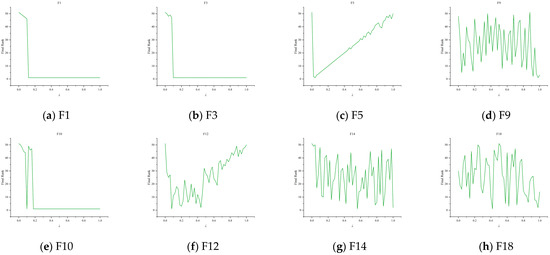
Figure 7.
Trend chart of λ ranking changes.
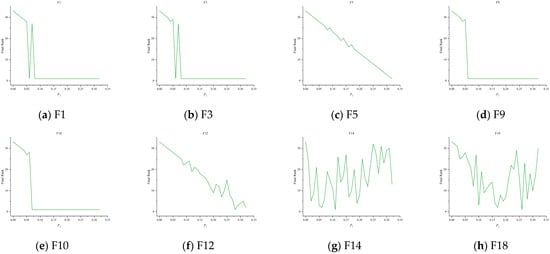
Figure 8.
Trend chart of P1, P2, P3, P4 ranking changes.
5.1.1. Selection of Test Functions
To further evaluate the impact of parameters on the algorithm performance, this study selects 8 representative benchmark functions (F1, F3, F5, F9, F10, F12, F14, F18) for analysis. The specific parameters of each test function are detailed in Table 1, covering different characteristics (such as unimodal/multimodal, high-dimensional/low-dimensional, etc.), which can support a comprehensive evaluation of parameter impacts.
5.1.2. Sensitivity Analysis of the Number of Optimal Points
To quantify the impact of the number of optimal points among particle types selected as endpoints of line segments (hereinafter referred to as “endpoint candidate optimal points”) on the optimization performance of the PBOA, this experiment systematically adjusts this number from 1 to 10, resulting in 10 distinct parameter combinations. The remaining parameters of the PBOA are fixed as follows: each endpoint candidate optimal point has an equal probability of being selected; the control parameter λ is set to 0.4. For each combination of the number of endpoint candidate optimal points and test functions, 50 independent runs are conducted to ensure statistical robustness. The comprehensive ranking of algorithm performance is adopted as the core evaluation metric, where a smaller ranking indicates superior overall performance under that parameter configuration.
Based on the optimization results of the PBOA on benchmark functions with different numbers of endpoint candidate optimal points, Figure 6 presents the final rankings of each function under the 10 quantity configurations. The key findings are summarized as follows:
Unimodal functions (F1, F3, F5): For F1, the ranking is optimal with 3 endpoint candidate optimal points, followed by 2 and 4, while the performance is the poorest with 10. This indicates that a moderate number of endpoint candidate optimal points (3–4) facilitates efficient local exploitation for this unimodal problem. In F3, the performance is optimal with 1 endpoint candidate optimal point, followed by 2 and 3, with the worst performance observed with 7, suggesting that fewer endpoint candidate optimal points can improve the convergence efficiency of this function. For F5, the ranking is optimal with 7 endpoint candidate optimal points, with 2 and 8 also performing well, and the lowest ranking with 10. Overall, these results demonstrate that for unimodal function optimization, the number of endpoint candidate optimal points in the range (3–7) yields superior comprehensive rankings, reflecting strong adaptability to local exploitation scenarios.
Multimodal functions (F9, F10, F12): In F9, the algorithm achieves optimal rankings when the number of endpoint candidate optimal points is 3, 4, 5, 6, 7, or 9, indicating high robustness to variations in this number for this multimodal function; however, performance is the poorest with 8. For F10, the best rankings are observed with 7 and 9 endpoint candidate optimal points, followed by 8, with the lowest ranking with 10, suggesting that a moderate-to-large number of endpoint candidate optimal points (7–9) effectively balances exploration across multiple peaks. In F12, the optimal ranking is attained with 4 endpoint candidate optimal points, followed by 7 and 3/6, with the worst performance with 10. Overall, for multimodal function optimization, the number of endpoint candidate optimal points in the range (3–7) results in balanced rankings across most functions, effectively synergizing global exploration and local exploitation.
Fixed-dimensional multimodal functions (F14, F18): For F14, optimal rankings are achieved with 4, 6, or 7 endpoint candidate optimal points, followed by 3/9, with the poorest performance with 10. In F18, the algorithm exhibits exceptional stability: the number of endpoint candidate optimal points ranging from 3 to 9 all achieve optimal rankings, while 1 and 2 perform significantly worse. These results indicate that fixed-dimensional multimodal functions benefit from a moderate-to-large number of endpoint candidate optimal points (3–9), with low sensitivity to specific values within this range.
In summary, integrating the ranking results across unimodal, multimodal, and fixed-dimensional multimodal functions, when the number of endpoint candidate optimal points is in the range (3–7), the PBOA achieves superior comprehensive rankings on most test functions with strong performance stability. This range demonstrates robust performance across diverse optimization scenarios, thus recommending (3–7) as the optimal range for the number of endpoint candidate optimal points in the PBOA. Considering the algorithm’s outstanding performance with 3 optimal points in unimodal functions and its good adaptability in multimodal and fixed-dimensional multimodal functions, this paper ultimately selects 3 as the number of endpoint candidate optimal points.
5.1.3. Sensitivity Analysis of Parameter λ
To quantify the impact of parameter λ on the search ability of the PBOA, the experiment sets λ to increase with a fixed step size of 0.02 in the interval [0, 1], forming 51 groups of parameter experiments. Other parameters of the PBOA are set as follows: P1, P2, P3 are all 0.1, and P4 is 0.7. For each combination of parameters and test functions, 51 independent optimization experiments are conducted, and the comprehensive ranking of algorithm performance is recorded as the core basis for parameter evaluation.
Based on the performance of the PBOA on benchmark functions under different λ values, Figure 7 illustrates the final rankings of the PBOA for optimizing each function with 51 λ values (a smaller ranking indicates better comprehensive performance of the algorithm under that parameter combination). The experimental results show that:
Unimodal functions (F1, F3, F5): In F1, when λ ∈ [0.02, 1], the algorithm’s ranking is overall in a better range; in F3, the ranking is stable and high when λ ∈ [0.02, 1], with the optimal ranking when λ ∈ [0.10, 1]. This indicates that in unimodal function optimization, λ can maintain good performance of the PBOA within a large range, especially when λ is in the above range, the comprehensive ranking is better, reflecting that the algorithm has strong adaptability to λ in local exploitation scenarios. In F5, the final ranking of the algorithm is the smallest (optimal) when λ ∈ [0.02, 0.2], indicating that a low λ value is more conducive to improving the convergence accuracy of unimodal functions. Based on the performance of unimodal functions, it is recommended that λ be preferentially selected from [0.02, 0.5].
Multimodal functions (F9, F10, F12): In F9, the algorithm rankings corresponding to 51 λ values show disordered fluctuations, indicating that this function has low sensitivity to λ; in F10, the ranking is significantly better and more stable when λ ∈ [0.18, 1]; in F12, lower λ values in [0.02, 0.3] correspond to better rankings. Overall, in multimodal function optimization, when λ ∈ [0.18, 0.5], the algorithm’s ranking performance is more balanced across most functions, which can well balance the synergy between global exploration and local exploitation.
Fixed-dimensional multimodal functions (F14, F18): Under all λ values, the final rankings of the algorithm show random distribution characteristics, and the overall ranking is low. This indicates that when the PBOA handles fixed-dimensional multimodal functions, its performance has low dependence on λ and has certain limitations.
In summary, combining the ranking results of unimodal and multimodal functions, when λ ∈ [0.18, 0.5], the PBOA achieves better comprehensive rankings on most test functions with strong performance stability. Therefore, this paper recommends this interval as the optimal value range for parameter λ.
5.1.4. Sensitivity Analysis of Parameter P1, P2, P3, and P4
In the PBOA, parameters P1, P2, P3, and P4 are key factors affecting the construction of perpendicular bisectors between particles and other objects. Among them, P1, P2, and P3 represent the probabilities of particles associating with the globally optimal (rank 1), second optimal (rank 2), and third optimal (rank 3) particles, respectively, while P4 is the probability of particles associating with randomly selected remaining particles. This section explores the impact of these parameters on PBOA performance through experiments, with the specific design as follows: P1 = P2 = P3 is set to increase from 0 to 0.33 with a step size of 0.01 (34 parameter combinations in total), and P4 is calculated as P4 = 1 − P1 − P2 − P3; to ensure experimental validity, other parameters are fixed as λ = 0.4; for each combination of parameters and test functions, 50 independent optimization experiments are conducted, with the comprehensive ranking as the core performance evaluation index (a smaller ranking indicates better comprehensive performance).
Figure 8 shows the ranking trends of the 34 parameter combinations. Based on the above results, the analysis is as follows:
Unimodal functions (F1, F3, F5): In F1 and F3, when the values of P1, P2, and P3 are greater than 0.08, the algorithm rankings are overall high and stable, indicating that the algorithm performs excellently in unimodal function optimization; in F5, higher values of P1, P2, and P3 correspond to better rankings, suggesting that increasing these parameters helps improve the search accuracy of the algorithm on this function. Overall, larger values of P1, P2, and P3 are more conducive to the algorithm’s performance in unimodal function optimization.
Multimodal functions (F9, F10, F12): F9 achieves better rankings when P1, P2, P3 ∈ [0.06, 0.33]; in F10, rankings improve significantly when P1, P2, and P3 are greater than 0.07; in F12, rankings show an optimizing trend as parameter values increase. Overall, in multimodal function optimization, larger values of P1, P2, and P3 lead to better rankings, with the combination P1 = P2 = P3 = 0.28 achieving the optimal ranking and the strongest performance stability.
Fixed-dimensional multimodal functions (F14, F18): Rankings of all parameter combinations show disordered distribution, with overall low rankings, indicating that adjusting P1, P2, P3, and P4 cannot effectively improve the algorithm’s performance on this type of function.
In summary, considering the ranking performance across all function types, when P1 = P2 = P3 = 0.28 and P4 = 0.16, the PBOA achieves the optimal comprehensive ranking on most test functions with strong performance stability, which is beneficial for enhancing the overall robustness of the algorithm. Therefore, this parameter combination is recommended as the optimal setting for P1, P2, P3, and P4.
5.2. Qualitative Analysis
This section systematically presents the execution process of the PBOA on selected test functions. Figure 9 shows the qualitative analysis results of the PBOA on 8 test functions. The analysis uses four recognized indicators to intuitively evaluate the algorithm performance: search history, average fitness of the population, first-dimensional trajectory, and convergence curve. The specific meanings of each indicator are as follows:
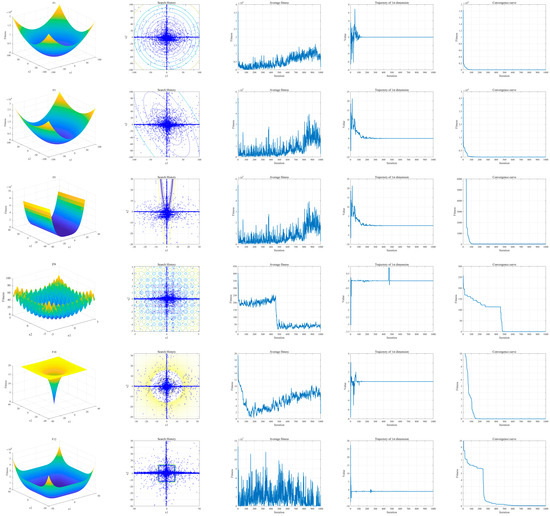

Figure 9.
Qualitative performance of PBOA on 8 test functions.
- Search history: Used to display the spatial distribution of the population during the search process;
- First-dimensional trajectory: Reflects the position change law of solutions along the first dimension during algorithm iteration;
- Average fitness: Characterizes the evolution trend of the overall fitness of the population as iterations progress;
- Convergence curve: Describes the dynamic process of the algorithm approaching the optimal solution.
For detailed observation, the number of iterations of the PBOA is set to 1000, and the population size is set to 50.
From the search history, it can be seen that the PBOA exhibits strong search ability in both global and local search spaces and can quickly converge to the optimal solution region. The first-dimensional trajectory clearly shows that in the initial iteration stage, the position change range of the algorithm is wide to quickly locate potential optimal regions; in subsequent iterations, the frequency and amplitude of position changes gradually decrease, reflecting the strategic transition from global exploration to local exploitation. The average fitness curve shows a continuous downward trend, indicating that the population gradually converges to the optimal solution with iterations. These characteristics collectively indicate that the proposed PBOA has high efficiency in solution space search and can effectively balance the synergy between exploitation and exploration.
Figure 10 shows the iterative variation law of PBOA population diversity on 8 test functions. The results indicate that the population does not exhibit homogenization during iteration; especially on F14 and F18, the population diversity shows an upward trend with the increase in the number of iterations, demonstrating that the PBOA has strong global search capability and can effectively escape local optimal traps.


Figure 10.
The population diversity of PBOA.
In the PBOA, particles are reset to random positions within the search space bounded by the lower bound (LB) and upper bound (UB) when either or . This “escape mechanism” serves as a core strategy to prevent the algorithm from stagnating in local optima. Experimental results indicate that particle resets triggered by or account for an average of 12–18% of the total iterations across all test scenarios. For multimodal functions such as F16 and F18, this proportion increases significantly to 25–30%. From a performance perspective, variations in reset frequency exhibit dual effects: excessive resets prolong convergence time, whereas a moderate increase in reset frequency enhances the algorithm’s ability to escape local optima, thereby improving global optimization efficiency. Overall, this mechanism effectively strengthens the performance of the PBOA in solving multi-extremal problems.
5.3. Comparative Experiments and Analysis
This section systematically evaluates the performance advantages and limitations of the PBOA through a comprehensive comparison with current mainstream optimization algorithms in terms of solution accuracy, convergence speed, and stability. In this section, all algorithms are set with 500 iterations and a population size of 50. The test results are shown in Table 5, Table 6, Table 7 and Table 8, with detailed analysis as follows:

Table 5.
The performance of different optimization algorithms on unimodal functions.

Table 6.
The performance of different optimization algorithms on multimodal functions.

Table 7.
The performance of different optimization algorithms on fixed-dimensional multimodal functions.

Table 8.
The performance of different optimization algorithms on perturbed unimodal functions.
Unimodal functions (F1~F7): The PBOA ranks first in F1~F4 and F7; it performs slightly worse than the WOA in F5 and slightly worse than GTO and DE in F6. Overall, the PBOA shows strong performance in the unimodal function test suite, with its comprehensive ranking significantly outperforming most algorithms (1/2 of WOA, which ranks second, and 1/10.63 of MFO, which ranks the worst). Among algorithms based on mathematical geometry principles, the PBOA exhibits particular competitiveness.
Multimodal functions (F8~F13): The PBOA ranks first in all test functions except F12, where it ranks second (slightly behind DRA). Overall, the PBOA performs outstandingly in multimodal function tests, maintaining significant competitiveness among all comparative algorithms including VOR and NEL.
Fixed-dimensional multimodal functions (F14~F23): The PBOA ranks first in all test functions, demonstrating significant superiority in optimizing this type of function. Its performance outperforms other geometry-based algorithms such as VOR and NEL, as well as mainstream optimization algorithms.
Perturbed unimodal functions (F24~F27): The PBOA ranks first in F25; it is outperformed by GTO and DE in F24, by the DRA and WOA in F26, and by the DRA in F27. Overall, the PBOA ranks second in this type of function test (only behind DRA), still maintaining certain performance advantages in competition with comparative algorithms including VOR and NEL.
Table 9 presents the results of the non-parametric Wilcoxon rank-sum test at a significance level of 0.05, showing that the PBOA has significant differences from most comparative algorithms, with only small differences from DE and MFO in specific scenarios. This result further confirms the robustness and uniqueness of the PBOA.

Table 9.
p-Values of the Wilcoxon rank-sum test among 27 test functions.
Figure 11 presents the convergence curves of the top 7 algorithms (PBOA, DRA, WOA, DE, GTO, GWO, WAO) among the 16 comparative algorithms. The results show that the PBOA maintains a stable convergence trend across all test functions. The PBOA expands the exploration range by introducing a strategy of constructing perpendicular bisectors with four types of reference points and controlling the update distance, which is reflected in Figure 10 as a consistently steady downward trend in its convergence curve. Although the PBOA has a relatively slower convergence speed compared to other comparative algorithms, it still maintains a significant downward trend even when the number of evaluations is close to the optimal value. This characteristic implies that the PBOA may further find better solutions with additional computational resources, demonstrating its ability to dynamically balance exploration and exploitation, thereby enhancing the potential to avoid local optima.

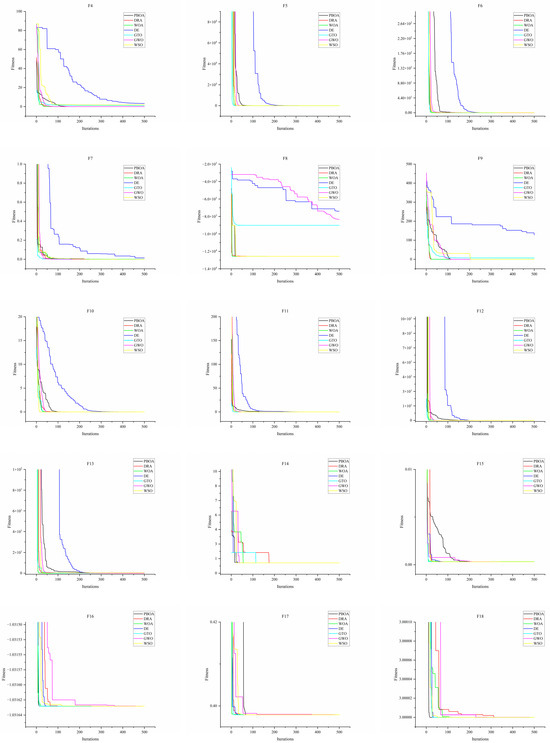
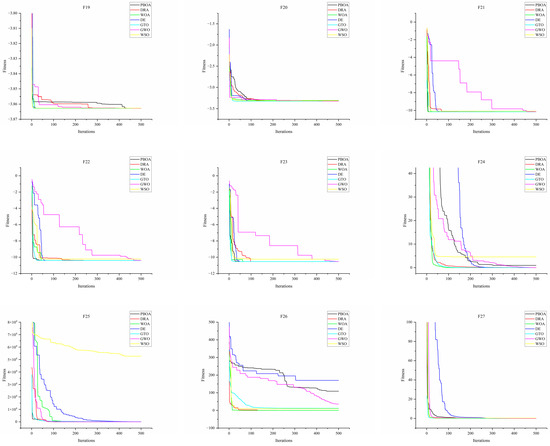
Figure 11.
Convergence curves of PBOA and compared algorithms.
Further analysis of the boxplots in Figure 12 reveals that the result distribution of the PBOA is more concentrated with fewer outliers, which confirms its strong robustness and adaptability.

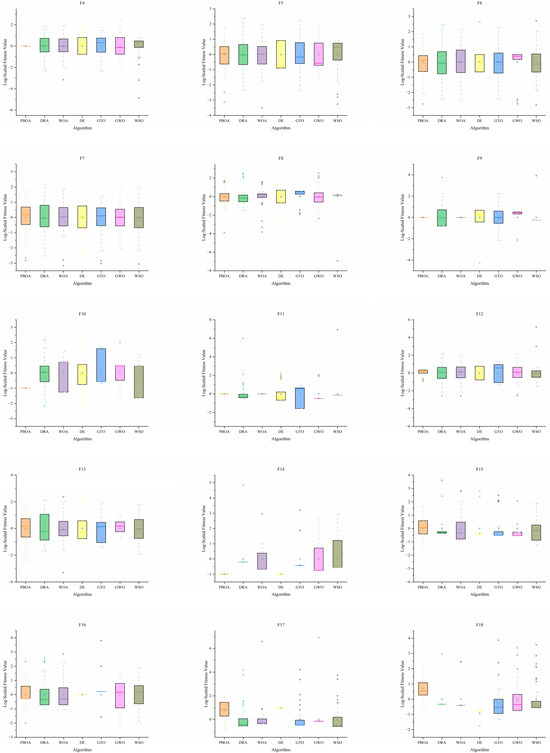
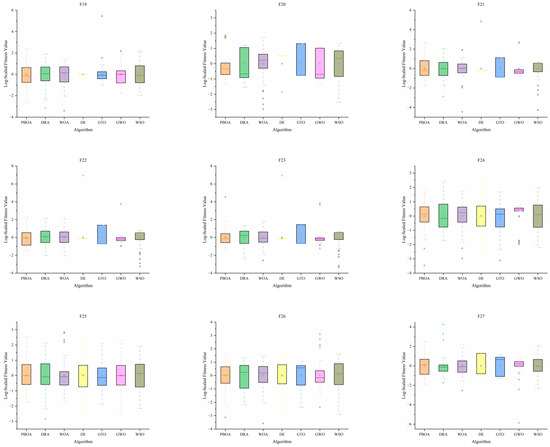
Figure 12.
Boxplot of PBOA and compared algorithm.
To compare operational efficiency, Figure 13 records the time consumption of 14 algorithms to complete the experiment. The results show that PSO performs the best in operational efficiency, while the PBOA ranks fifth with relatively longer running time, which constitutes its potential performance bottleneck. Generally, newer algorithms tend to have higher computational loads due to more sophisticated exploration and exploitation mechanisms. Compared with the DRA and PRGO proposed in 2025, the PBOA has a shorter running time than PRGO and slightly longer than the DRA; the three algorithms have similar time consumption, all within 1.4 times that of PSO.
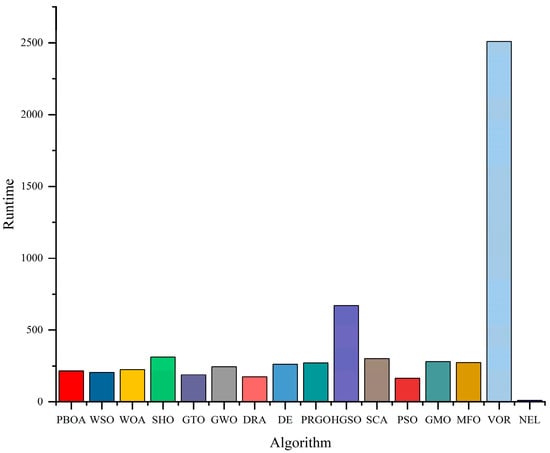
Figure 13.
Total running time consumed by 16 optimization algorithms.
5.4. Comparison and Analysis with the Original Literature Data of Some Algorithms
To more objectively evaluate the performance of the PBOA, this study extracted experimental data from the original studies of the DRA, WOA, GTO, GWO, SHO, and GMO algorithms for comparative analysis; other algorithms were not included in the comparison as the original studies did not conduct relevant experiments.
Table 10 presents the p-values of the Wilcoxon rank-sum test results between the PBOA and the aforementioned 6 algorithms on 23 benchmark functions (F1–F23) at a significance level of 0.05. Statistical analysis shows that the PBOA exhibits significant statistical differences from most comparative algorithms in the majority of test functions, as detailed below:

Table 10.
p-Values of the Wilcoxon rank-sum test based on the original data of several comparison algorithms.
Compared with the DRA, 19 out of 23 functions show significant differences (p < 0.05), among which the differences in F3 (p = 6.94 × 10⁻⁵) and F1 (p = 1.09 × 10⁻³) are particularly significant, indicating that there are essential differences in their performance patterns when handling high-dimensional problems and extreme value problems.
Compared with the WOA, 17 functions present significant differences, typically in F3 (p = 2.08 × 10⁻³) and F1 (p = 3.89 × 10⁻²), suggesting that the PBOA has better stability in unimodal optimization scenarios.
Compared with GTO, 16 functions demonstrate significant differences, with prominent differences in F6 (p = 1.79 × 10⁻²) and F4 (p = 4.55 × 10⁻³), reflecting that the PBOA has stronger adaptability in multi-modal problems.
Compared with GWO, 15 functions have significant differences, including F3 (p = 3.47 × 10⁻⁴) and F2 (p = 6.67 × 10⁻³), which embodies the advantage of the PBOA in balancing exploration and exploitation capabilities.
Compared with SHO, 14 functions show significant differences, with obvious differences in F6 (p = 7.14 × 10⁻³) and F3 (p = 8.33 × 10⁻⁴), highlighting the efficiency advantage of the PBOA in the fine search process.
Compared with GMO, 15 functions present significant differences, such as F3 (p = 1.23 × 10⁻⁴) and F2 (p = 3.51 × 10⁻³), verifying that the PBOA has a unique optimization trajectory.
It is worth noting that non-significant differences (p ≥ 0.05) only exist in a few functions (e.g., F16, F18), where all algorithms converge to similar solutions, which may be related to the simplicity or specific attributes of the functions themselves. In summary, the statistical test results confirm that the performance of the PBOA has significant statistical differences from most comparative algorithms, confirming its robustness and uniqueness in handling diverse optimization problems.
6. Engineering Design Problems
In this section, the performance of the PBOA in practical optimization scenarios is evaluated through six engineering design problems to verify its optimization potential in real-world engineering environments. All experimental results are detailed in tabular form, with values recorded after rounding; algorithm rankings are strictly determined based on unrounded raw results to ensure the accuracy of the sorting. For practical problems 1 to 5 covered in this section, all algorithms are set with a maximum number of iterations of 10,000 and a population size of 50, while the maximum number of iterations for practical problem 6 is 200. The presented results are the optimal outcomes obtained from 50 independent runs of each algorithm on each problem.
6.1. Tension/Compression Spring Design
As shown in Figure 13, the core objective of the tension/compression spring design problem is to minimize the spring weight, with three design parameters as optimization variables: wire diameter (d), mean coil diameter (D), and number of active coils (N). The mathematical model of this problem can be expressed as:
Consider:
Minimize:
Subject to:
With
Table 11 lists the optimal solutions and corresponding fitness values of the PBOA and other comparative algorithms for this problem. The results show that the fitness value of the solution obtained by the PBOA is significantly better than that of other algorithms, demonstrating superior optimization performance. The convergence process of the PBOA for this problem is shown in Figure 14.

Table 11.
Performance of optimization algorithms on the tension/compression spring design.
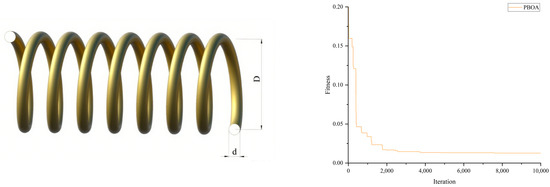
Figure 14.
Schematic and performance convergence curve on the tension/compression spring design.
6.2. Pressure Vessel Design
As shown in Figure 15, the core objective of the pressure vessel design problem is: to minimize the manufacturing cost under the premise of ensuring that the vessel performance meets the standards. This problem involves four optimization variables, namely: shell thickness Ts, head thickness Th, inner radius R, and length of the cylindrical part without heads L. Its mathematical expression is as follows:

Figure 15.
Schematic and performance convergence curve on the pressure vessel design problem.
Consider:
Minimize:
Subject to:
With
Table 12 presents the optimal solutions and corresponding fitness values of the PBOA and other comparative algorithms for the pressure vessel design problem. The results show that the fitness value of the solution obtained by the PBOA is the best among all comparative algorithms. The convergence process of the PBOA for this problem is shown in Figure 15.

Table 12.
Performance of optimization algorithms on the pressure vessel design.
6.3. Welded Beam Design
The schematic diagram of the welded beam design problem is shown in Figure 16. The core objective of this problem is to minimize the economic cost, which is achieved by adjusting 4 key parameters: beam thickness (h), length (l), height (t), and width (b).
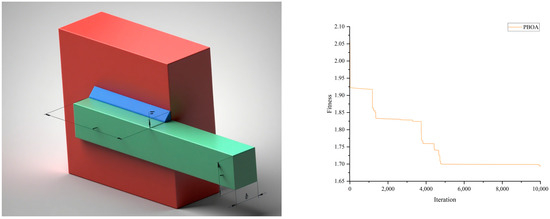
Figure 16.
Schematic and performance convergence curve on the welded beam design problem.
Consider:
Minimize:
Subject to:
where
With
Table 13 presents the optimization schemes and corresponding fitness values of various algorithms for the welded beam design problem. The results show that the fitness value of the solution obtained by the PBOA is the best among all comparative algorithms. The convergence process of the PBOA for this problem is shown in Figure 16.

Table 13.
Performance of optimization algorithms on the welded beam design.
6.4. Wireless Sensor Network Coverage Optimization
Wireless Sensor Networks (WSNs) play a crucial role in fields such as environmental monitoring and smart agriculture, where the rationality of node deployment directly affects monitoring efficiency. The core objective of the wireless sensor network coverage optimization problem is to minimize the fitness value. The optimization variables are the coordinates of 20 sensor nodes: the x and y coordinates of each node (, for ). The mathematical model of this problem can be expressed as:
Consider:
Minimize:
where
Subject to:
With:
- : Coverage rate. is an indicator function (1 if grid point g is covered, 0 otherwise), and G is the set of grid points.
- : Standard deviation of normalized remaining energy.
- : Connectivity. is the number of neighbors of node i (nodes within communication radius).
Table 14 presents the optimization schemes of various algorithms for the wireless sensor network coverage optimization problem (due to space constraints, only the first 4 variables of each algorithm’s result are shown) along with their corresponding fitness values. Among them, the complete solution of the PBOA is (10.51, 40.34, 65.21, 84.98, 86.92, 50.81, 86.25, 13.19, 31.70, 24.82, 9.66, 86.05, 22.33, 60.90, 87.17, 69.22, 66.53, 55.50, 67.53, 10.33, 44.29, 48.97, 87.39, 87.41, 51.60, 85.82, 31.69, 88.48, 85.54, 32.69, 11.87, 63.17, 34.37, 9.21, 10.52, 12.92, 45.95, 78.65, 55.84, 25.89).

Table 14.
Performance of optimization algorithms on the wireless sensor network coverage optimization.
The results show that among all the comparative algorithms, the fitness value of the solution obtained by the PBOA is the optimal. The convergence process of the PBOA for this problem is illustrated in Figure 17.
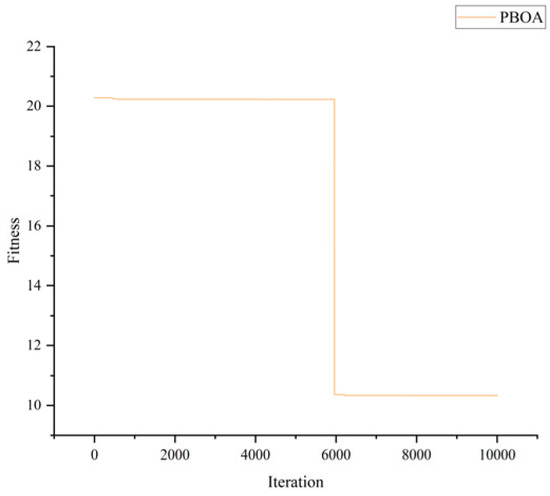
Figure 17.
Schematic and performance convergence curve on the wireless sensor network coverage optimization.
6.5. Unmanned Aerial Vehicle (UAV) Path Planning Problem
In scenarios like environmental monitoring and logistics distribution, the rationality of Unmanned Aerial Vehicle (UAV) path planning directly affects task execution efficiency and energy consumption. The core objective of the UAV path planning problem is to minimize the fitness value, which comprehensively considers flight distance, energy consumption, and penalties for violating constraints. The optimization variables consist of values related to the visit order (first 5 variables) and coordinates of waypoints (next 20 variables, with each pair representing an coordinate). The mathematical model of this problem, with known parameters specified, is as follows:
Known Parameters:
- Start point coordinates: ;
- Target points coordinates (5 in total):
- Flight height: Fixed at 100 (unit: meters, does not affect 2D path calculation);
- Maximum flight distance: (unit: meters, including redundancy);
- Maximum load: (unit: kg);
- Load reduction per target point: (unit: kg, load decreases by this value after reaching each target point);
- Energy consumption coefficient: ;
- No-fly zones (each defined by center coordinates and radius r):
- Safe distance from no-fly zones: (unit: meters, the minimum allowed distance between flight path and no-fly zones).
Consider:
: Values used to determine the visit order of the 5 target points (converted into a permutation of {1, 2, 3, 4, 5} via sorting). : x and y coordinates of 10 waypoints (inserted between consecutive points in the path).
Minimize:
where
- Total flight distance (D):
The sum of Euclidean distances between consecutive points in the full path. The full path is constructed as:
where is the visit order of target points (a permutation of {1, 2, 3, 4, 5}). Mathematically , where are consecutive points in the full path.
- Total energy consumption (E):
Calculated using the model , where is the distance of the i-th segment, and is the load during the i-th segment. The load changes as: after visiting each target point t.
- Penalty term (P):
If any flight segment is within the range of a no-fly zone (), P increases by 1000 per violation. If total distance , P increases by .
Subject to:
- No-fly zone avoidance: For each no-fly zone and each flight segment between points and , the minimum distance from to the segment must be :
- Maximum distance limit: .
- Unique visit order: The visit order must be a permutation of {1, 2, 3, 4, 5} (all target points are visited exactly once).
Table 15 presents the optimization schemes of various algorithms for the UAV path planning problem (due to space constraints, only the first 4 variables of each algorithm’s result are shown) along with their corresponding fitness values. Among them, the complete solution of the PBOA is (1.00, 5.00, 1.03, 2.09, 3.03, 0.03, 0.04, 311.73, 486.28, 300.28, 599.86, 640.89, 281.84, 562.35, 162.36, 258.95, 51.83, 400.99, 252.66, 405.41, 782.37, 586.97, 489.63, 0.00, 54.58).

Table 15.
Performance of optimization algorithms on the UAV path planning problem.
The results show that among all the comparative algorithms, the fitness value of the solution obtained by the PBOA is the optimal. The convergence process of the PBOA for this problem is illustrated in Figure 18.
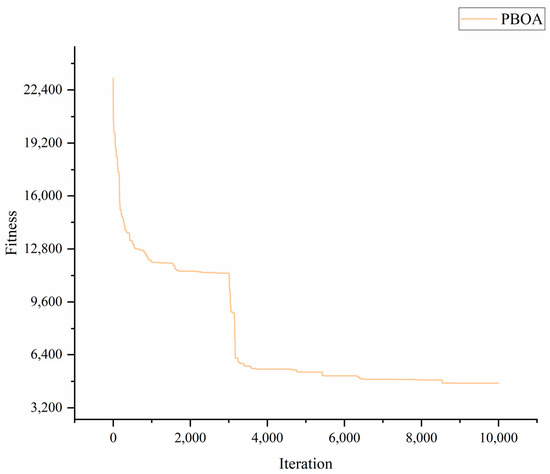
Figure 18.
Schematic and performance convergence curve on the UAV path planning problem.
6.6. Design of Time-Varying Nonsingular Fast Terminal Sliding Mode Controller for H-Type Motion Platform
Figure 19 shows the schematic diagram and structural sketch of the H-type motion platform. The motion mechanism of the platform is as follows: two parallel Y-direction ball screws drive the worktable collaboratively to realize Y-direction motion; the X-direction ball screw is connected across the two Y-axis ball screws, responsible for driving the worktable to move in the X-direction; the entire motion system is powered by a servo motor. Benefiting from its stable structural design, the H-type motion platform has a wide range of application scenarios.
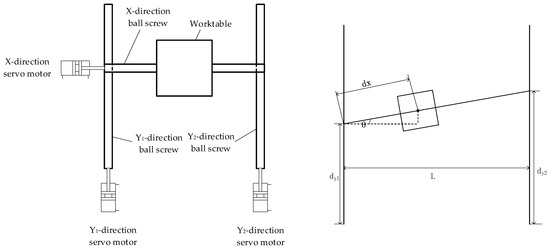
Figure 19.
Schematic diagram and structural sketch of H-type motion platform.
In terms of control accuracy, the synchronization error of the two Y-direction ball screws must be strictly controlled within a very small range, which is the key to ensuring the Y-direction displacement accuracy of the platform. As proposed in Reference [71], the actual displacement in the X-direction dx′ and Y-direction dy′ of the worktable can be expressed as:
where dy1 is the displacement of the Y1 motion mechanism, dy2 is the displacement of the Y2 motion mechanism, dx is the displacement of the X motion mechanism, θ is the angle between the X motion mechanism and the line perpendicular to the Y1 and Y2 motion mechanisms, and L is the distance between Y1 and Y2.
A time-varying nonsingular fast terminal sliding mode controller is designed in Reference [71]:
The control rate wx for the X-direction displacement is:
where
where di, do, vi, and vo represent the desired displacement, output displacement, desired velocity, and output velocity in the i-direction (where i can denote X, Y1, and Y2), respectively; δ, k1, k2, k3, k4, k5, and k6 are constants greater than 0; τ takes values in the range of 1–300; K is a constant affected by the screw lead and gearbox reduction ratio; and tanh is the hyperbolic tangent function.
The control rate wY1 for the Y1-direction is:
The control rate wY2 for the Y2-direction is:
where
For the Y1-direction:
For the Y2-direction:
Among the three controllers for the X, Y1, and Y2 directions, although the symbols δ, β, k1, k2, k3, k4, k5, and k6 are consistent, parameter settings of different controllers need to be differentiated to achieve optimal control effects. Based on this, the problem can be formulated as the “parameter optimization problem of time-varying nonsingular fast terminal sliding mode controller for H-type motion platform”. Its core objectives are: to improve the X-direction control accuracy by optimizing the parameters δ, k1, k2, k3, k4, k5, and k6 of the X-direction controller; and to enhance the Y-direction control accuracy while reducing the synchronization error between the Y1 and Y2 motion mechanisms by optimizing the parameters δ, β, k1, k2, k3, k4, k5, and k6 of the two Y-direction controllers. The mathematical formulation of this problem is as follows:
Consider for X-direction controller:
Consider for Y1-direction controller or Y2-direction controller:
Minimize for X-direction controller:
Minimize for Y1-direction controller or Y2-direction controller:
All variables range from [0.0001, 10,000]. Considering factors such as transmission efficiency and disturbances, the X-direction motion mechanism is set with K = 0.99, the Y1-direction motion mechanism with K = 0.99, and the Y2-direction motion mechanism with K = 0.98. Additionally, random numbers following a normal distribution (mean = 0, variance = 0.001) are added to the system output to simulate external disturbances.
Table 16, Table 17 and Table 18 present the optimization schemes and corresponding fitness values of the PBOA and other comparative algorithms for the H-type motion platform optimization problem. The results indicate that among all comparative algorithms, the fitness value of the solution obtained by the PBOA is optimal. Figure 20 illustrates the convergence process of the PBOA for this problem.

Table 16.
Performance of the Optimization Algorithm in X-direction Controller Design.

Table 17.
Performance of the Optimization Algorithm in Y1-direction Controller Design.

Table 18.
Performance of the Optimization Algorithm in Y2-direction Controller Design.
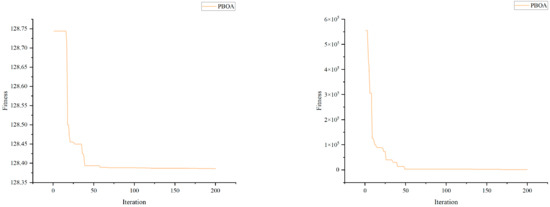
Figure 20.
Convergence Curve of PBOA in the Controller Optimization Problem.
After parameter optimization using the PBOA, the input-output curves (actual displacements of the X-axis, Y1-axis, and Y2-axis) of the H-type motion platform, as well as the synchronization error between the two Y-direction motion mechanisms, are shown in Figure 21. Experimental data reveal that, with a standard displacement of 1 mm as the reference, the control errors between the actual displacements of the X-axis, Y1-axis, Y2-axis and the standard value are all stabilized within the range of ±2 × 10⁻⁵ mm. Meanwhile, the synchronization error of the two Y-direction mechanisms is controlled within ±2.6 × 10⁻⁵ mm without significant fluctuations.
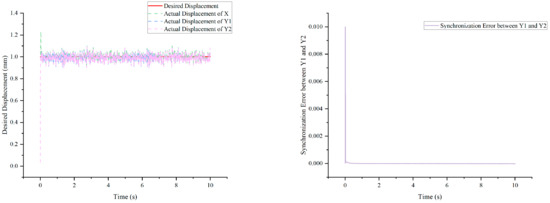
Figure 21.
Motion accuracy of the H-type motion platform and synchronization error between the two Y-direction motion mechanisms after optimizing controller parameters by PBOA.
These results fully demonstrate that in engineering scenarios with disturbances, the PBOA can effectively ensure the motion accuracy and synchronization stability of the H-type motion platform, which fully meets the requirements of high-precision motion control in engineering applications.
6.7. Summary of PBOA’s Performance in Practical Problems
Table 19 presents the results of the non-parametric Wilcoxon rank-sum test at a significance level of 0.05, analyzing the performance differences between the PBOA and other comparative algorithms across 5 problems (P1 to P5). The p-values in the table indicate the statistical significance of these differences, with a p-value < 0.05 suggesting a significant performance gap between the PBOA and the corresponding algorithm.

Table 19.
Wilcoxon rank-sum test p-values (PBOA vs. other algorithms).
The results show that the PBOA exhibits significant differences from most comparative algorithms across all 5 problems. Specifically, algorithms such as WSO, WOA, SHO, GTO, GWO, DRA, PRGO, HGSO, SCA, PSO, GMO, VOR, and NEL all yield p-values far below 0.05 when compared with PBOA. For instance, in P3, the extremely small p-values of the WOA (1.15 × 10⁻⁹) and SHO (2.98 × 10⁻⁶) indicate that the performance advantage of the PBOA over these algorithms is statistically highly significant. Similarly, NEL demonstrates remarkably low p-values across multiple problems, such as 4.17 × 10⁻⁶ (P2) and 9.74 × 10⁻¹⁰ (P3), reflecting a distinct performance gap with the PBOA.
Notably, the PBOA shows relatively smaller differences from DE and MFO in specific scenarios. For example, in P1, although the p-values of DE (3.02 × 10⁻³) and MFO (2.81 × 10⁻³) are still below 0.05, they are higher than those of algorithms like the WOA (2.56 × 10⁻³) and SHO (1.67 × 10⁻³). In P4, the p-values of DE (3.35 × 10⁻³) and MFO (3.05 × 10⁻³) are also larger than those of GWO (1.78 × 10⁻³) and DRA (2.67 × 10⁻³), indicating a relatively less pronounced performance gap. These results suggest that while the PBOA still outperforms DE and MFO, the statistical significance of this advantage is relatively weaker in certain problems.
Overall, the results of the Wilcoxon rank-sum test further confirm the robustness and uniqueness of the PBOA: it maintains a significant performance advantage over most comparative algorithms across different problems, and even in cases where the differences with individual algorithms (DE and MFO) are relatively smaller, it still demonstrates stable superiority. This consistency underscores the effectiveness of the PBOA in solving the target optimization problems.
7. Summary and Outlook
This paper proposes a novel mathematical heuristic optimization algorithm—the Perpendicular Bisector Optimization Algorithm (PBOA). The design inspiration of the PBOA originates from the geometric property of the perpendicular bisector, i.e., any point on the perpendicular bisector is equidistant from the two endpoints of the line segment. Based on this property, the PBOA designs two differentiated convergence strategies: the exploration phase mainly adopts a slow convergence strategy to explore potential high-quality solutions by expanding the search range; the exploitation phase focuses on a fast convergence strategy to improve solution accuracy through refined search. Meanwhile, relying on the deterministic principle, the algorithm selects 4 different particles to form line segments with the current particle and constructs perpendicular bisectors, thereby expanding the search space and enhancing global exploration capability. To comprehensively evaluate the performance of the PBOA, experiments are conducted using 27 benchmark test functions. The results show that the PBOA exhibits outstanding performance in solution accuracy and stability, outperforming most existing optimization algorithms.
Despite its excellent overall performance, the PBOA has potential limitations of slow convergence speed and long running time: the slow convergence speed stems from the design mechanism that the algorithm actively reduces particle displacement distance in the early stage to ensure global search; the long running time is due to the increased computational load caused by refined steps in the optimization process. Future research needs to further optimize the PBOA’s spatial exploration planning and computational efficiency to balance convergence speed with search range, as well as solution quality with running time. In addition, this study applies the PBOA to five engineering design problems with varying complexity and diversity, constructing a strong verification platform to validate the algorithm’s applicability. Experiments demonstrate that the PBOA can effectively explore unknown search spaces and find better solutions, thus validating its effectiveness and robustness in practical engineering scenarios. Finally, in the parameter optimization of the time-varying nonsingular fast terminal sliding mode controller for the H-type motion platform, the controller optimized by the PBOA outperforms comparative algorithms in both control accuracy and robustness, fully demonstrating its application potential in the field of controller parameter optimization.
In summary, as a new optimization method, the PBOA not only provides reliable solutions for traditional optimization problems but also exhibits strong performance in practical engineering applications. Despite limitations in operation, its advantages in solution quality and stability make it highly valuable for multiple scenarios. Future work can further explore binary and multi-objective versions of the PBOA, focusing on optimizing its convergence speed and computational efficiency to enhance applicability and effectiveness in complex optimization problems. We believe that the proposal of the PBOA will provide new directions and insights for research and applications in related fields.
Author Contributions
Conceptualization and methodology: D.W.; Experiments, data curation and writing—original draft: Y.Z.; Writing—review and editing, supervision: W.C.; Validation and formal analysis: D.W. All authors have read and agreed to the published version of the manuscript.
Funding
This work is supported by the Science Research Fund Project of Yunnan Provincial Department of Education (2023J1598).
Data Availability Statement
The code is at https://github.com/wushushuynl/code-of-PBOA, accessed on 28 July 2025.
Conflicts of Interest
The authors declare no conflicts of interest.
References
- Sharma, M.; Kaur, P. A Comprehensive Analysis of Nature-Inspired Meta-Heuristic Techniques for Feature Selection Problem. Arch. Comput. Methods Eng. 2021, 28, 1103–1127. [Google Scholar] [CrossRef]
- Wang, Z.; Schafer, B.C. Machine learning to set meta-heuristic specific parameters for high-level synthesis design space exploration. In Proceedings of the 57th ACM/IEEE Design Automation Conference (DAC), San Francisco, CA, USA, 20–24 July 2020; IEEE: New York, NY, USA, 2020; pp. 1–6. [Google Scholar]
- Dokeroglu, T.; Sevinc, E.; Kucukyilmaz, T.; Cosar, A. A survey on new generation metaheuristic algorithms. Comput. Ind. Eng. 2019, 137, 106040. [Google Scholar] [CrossRef]
- Vikhar, P.A. Evolutionary algorithms: A critical review and its future prospects. In Proceedings of the International Conference on Global Trends in Signal Processing, Information Computing and Communication (ICGTSPICC), Jalgaon, India, 22–24 December 2016; IEEE: New York, NY, USA, 2016; pp. 261–265. [Google Scholar]
- Storn, R.; Price, K. Differential evolution—A simple and efficient heuristic for global optimization over continuous spaces. J. Glob. Optim. 1997, 11, 341–359. [Google Scholar] [CrossRef]
- Beni, G. Swarm intelligence. In Complex Social and Behavioral Systems: Game Theory and Agent-Based Models; Sotomayor, M., Pérez-Castrillo, D., Castiglione, F., Eds.; Springer: New York, NY, USA, 2020; Volume 3, pp. 791–818. [Google Scholar]
- Wang, D.; Tan, D.; Liu, L. Particle swarm optimization algorithm: An overview. Soft Comput. 2018, 22, 387–408. [Google Scholar] [CrossRef]
- Dorigo, M.; Stützle, T. Ant colony optimization: Overview and recent advances. In Handbook of Metaheuristics; Gendreau, M., Potvin, J.-Y., Eds.; Springer: Boston, MA, USA, 2010; pp. 227–263. [Google Scholar]
- Rashedi, E.; Rashedi, E.; Nezamabadi-Pour, H. A comprehensive survey on gravitational search algorithm. Swarm Evol. Comput. 2018, 41, 141–158. [Google Scholar] [CrossRef]
- Mirjalili, S.; Jangir, P.; Saremi, S. Multi-objective ant lion optimizer: A multi-objective optimization algorithm for solving engineering problems. Appl. Intell. 2017, 46, 79–95. [Google Scholar] [CrossRef]
- Günay Yılmaz, A.; Alsamoua, S. Improved Weighted Chimp Optimization Algorithm Based on Fitness–Distance Balance for Multilevel Thresholding Image Segmentation. Symmetry 2025, 17, 1066. [Google Scholar] [CrossRef]
- Tang, R.; Qi, L.; Ye, S.; Li, C.; Ni, T.; Guo, J.; Liu, H.; Li, Y.; Zuo, D.; Shi, J.; et al. Three-Dimensional Path Planning for AUVs Based on Interval Multi-Objective Secretary Bird Optimization Algorithm. Symmetry 2025, 17, 993. [Google Scholar] [CrossRef]
- Lu, H.; Cheng, S.; Zhang, X. An Improved Whale Migration Algorithm for Global Optimization of Collaborative Symmetric Balanced Learning and Cloud Task Scheduling. Symmetry 2025, 17, 841. [Google Scholar] [CrossRef]
- Wilson, A.J.; Kiran, W.; Radhamani, A.; Bharathi, A.P. Optimizing energy-efficient cluster head selection in Wireless Sensor Networks using a binarized spiking neural network and honey badger algorithm. Knowl.-Based Syst 2024, 299, 112039. [Google Scholar] [CrossRef]
- Damiani, C.; Rodina, Y.; Decherchi, S. A hybrid federated kernel regularized least squares algorithm. Knowl.-Based Syst 2024, 305, 112600. [Google Scholar] [CrossRef]
- Mirjalili, S.; Mirjalili, S.M.; Lewis, A. Grey wolf optimizer. Adv. Eng. Softw. 2014, 69, 46–61. [Google Scholar] [CrossRef]
- Brest, J.; Maučec, M.S.; Bošković, B. Single objective real-parameter optimization: Algorithm jso. In Proceedings of the IEEE Congress on Evolutionary Computation (CEC), Donostia, Spain, 5–8 June 2017; pp. 1311–1318. [Google Scholar]
- Euclid. Euclid’s Elements; Heath, T.L., Translator; Dover Publications: New York, NY, USA, 1956. [Google Scholar]
- Hartshorne, R. Geometry: Euclid and Beyond; Springer: Boston, MA, USA, 2000. [Google Scholar]
- Rodan, A.; Al-Tamimi, A.K.; Al-Alnemer, L.; Mirjalili, S.; Tiňo, P. Enzyme action optimizer: A novel bio-inspired optimization algorithm. J. Supercomput. 2025, 81, 686. [Google Scholar] [CrossRef]
- Kennedy, J.; Eberhart, R. Particle swarm optimization. In Proceedings of the ICNN’95—International Conference on Neural Networks, Perth, WA, Australia, 27 November–1 December 1995; IEEE: New York, NY, USA, 1995; Volume 4, pp. 1942–1948. [Google Scholar]
- Dorigo, M.; Birattari, M.; Stutzle, T. Ant colony optimization. IEEE Comput. Intell. Mag. 2006, 1, 28–39. [Google Scholar] [CrossRef]
- Karaboga, D.; Basturk, B. A powerful and efficient algorithm for numerical function optimization: Artificial bee colony (abc) algorithm. J. Glob. Optim. 2005, 39, 459–471. [Google Scholar] [CrossRef]
- Mirjalili, S. The ant lion optimizer. Adv. Eng. Softw. 2015, 83, 80–98. [Google Scholar] [CrossRef]
- Chou, J.-S.; Truong, D.-N. A novel metaheuristic optimizer inspired by behavior of jellyfish in ocean. Appl. Math. Comput. 2021, 389, 125535. [Google Scholar] [CrossRef]
- Akbari, M.A.; Zare, M.; Azizipanah-Abarghooee, R.; Mirjalili, S.; Deriche, M. The cheetah optimizer: A nature-inspired metaheuristic algorithm for large-scale optimization problems. Sci. Rep. 2022, 12, 10953. [Google Scholar] [CrossRef]
- Xian, S.; Feng, X. Meerkat optimization algorithm: A new meta-heuristic optimization algorithm for solving constrained engineering problems. Expert Syst. Appl. 2023, 231, 120482. [Google Scholar] [CrossRef]
- Heidari, A.A.; Mirjalili, S.; Faris, H.; Aljarah, I.; Mafarja, M.; Chen, H. Harris hawks optimization: Algorithm and applications. Futur. Gener. Comput. Syst. 2019, 97, 849–872. [Google Scholar] [CrossRef]
- Kirkpatrick, S.; Gelatt, C.D.; Vecchi, M.P. Optimization by simulated annealing. Science. 1983, 220, 671–680. [Google Scholar] [CrossRef]
- Rashedi, E.; Nezamabadi-Pour, H.; Saryazdi, S. GSA: A gravitational search algorithm. Inf. Sci. 2009, 179, 2232–2248. [Google Scholar] [CrossRef]
- Mirjalili, S.; Mirjalili, S.M.; Hatamlou, A. Multi-verse optimizer: A nature-inspired algorithm for global optimization. Neural Comput. Appl. 2016, 27, 495–513. [Google Scholar] [CrossRef]
- Hatamlou, A. Black hole: A new heuristic optimization approach for data clustering. Inf. Sci. 2013, 222, 175–184. [Google Scholar] [CrossRef]
- Zhao, W.; Wang, L.; Zhang, Z. Atom search optimization and its application to solve a hydrogeologic parameter estimation problem. Knowl.-Based Syst. 2019, 163, 283–304. [Google Scholar] [CrossRef]
- Lam, A.Y.S.; Li, V.O.K. Chemical-reaction-inspired metaheuristic for optimization. IEEE Trans. Evol. Comput. 2009, 14, 381–399. [Google Scholar] [CrossRef]
- Wei, Z.; Huang, C.; Wang, X.; Han, T.; Li, Y. Nuclear reaction optimization: A novel and powerful physics-based algorithm for global optimization. IEEE Access 2019, 7, 66084–66109. [Google Scholar] [CrossRef]
- Holland, J.H. Adaptation in Natural and Artificial Systems: An Introductory Analysis with Applications to Biology, Control, and Artificial Intelligence; University of Michigan Press: Ann Arbor, MI, USA, 1975. [Google Scholar]
- Banzhaf, W.; Francone, F.D.; Keller, R.E.; Nordin, P. Genetic Programming—An Introduction: On the Automatic Evolution of Computer Programs and Its Applications; Morgan Kaufmann Publishers Inc.: Burlington, MA, USA, 1998. [Google Scholar]
- Abualigah, L.; Diabat, A.; Mirjalili, S.; Abd Elaziz, M.; Gandomi, A.H. The arithmetic optimization algorithm. Comput. Methods Appl. Mech. Eng. 2021, 376, 113609. [Google Scholar] [CrossRef]
- Talatahari, S.; Azizi, M. Chaos game optimization: A novel metaheuristic algorithm. Artif. Intell. Rev. 2021, 54, 917–1004. [Google Scholar] [CrossRef]
- Mirjalili, S. SCA: A sine cosine algorithm for solving optimization problems. Knowl.-Based Syst. 2016, 96, 120–133. [Google Scholar] [CrossRef]
- Deng, L.; Liu, S. Snow ablation optimizer: A novel metaheuristic technique for numerical optimization and engineering design. Expert Syst. Appl. 2023, 225, 120069. [Google Scholar] [CrossRef]
- Eskandar, H.; Sadollah, A.; Bahreininejad, A.; Hamdi, M. Water cycle algorithm—A novel metaheuristic optimization method for solving constrained engineering optimization problems. Comput. Struct. 2012, 110–111, 151–166. [Google Scholar] [CrossRef]
- Trojovská, E.; Dehghani, M. A new human-based metaheuristic optimization method based on mimicking cooking training. Sci. Rep. 2022, 12, 14861. [Google Scholar] [CrossRef]
- Reynolds, R. An Introduction to Cultural Algorithms; World Scientific Press: Singapore, 1994. [Google Scholar]
- Dehghani, M.; Montazeri, Z.; Givi, H.; Guerrero, J.; Dhiman, G. Darts game optimizer: A new optimization technique based on darts game. Int. J. Intell. Eng. Syst. 2020, 13, 286–294. [Google Scholar] [CrossRef]
- Zeidabadi, F.A.; Dehghani, M. POA: Puzzle Optimization Algorithm. Int. J. Intell. Eng. Syst. 2022, 15, 273–281. [Google Scholar] [CrossRef]
- Azizi, M.; Baghalzadeh Shishehgarkhaneh, M.; Basiri, M.; Moehler, R.C. Squid game optimizer (SGO): A novel metaheuristic algorithm. Sci. Rep. 2023, 13, 5373. [Google Scholar] [CrossRef]
- Zhao, W.; Wang, L.; Zhang, Z. Supply-demand-based optimization: A novel economics-inspired algorithm for global optimization. IEEE Access 2019, 7, 73182–73206. [Google Scholar] [CrossRef]
- Shabani, A.; Asgarian, B.; Salido, M.; Asil Gharebaghi, S. Search and rescue optimization algorithm: A new optimization method for solving constrained engineering optimization problems. Expert Syst. Appl. 2020, 161, 113698. [Google Scholar] [CrossRef]
- Slowik, A.; Kwasnicka, H. Evolutionary algorithms and their applications to engineering problems. Neural Comput. Appl. 2020, 32, 12363–12379. [Google Scholar] [CrossRef]
- Li, G.; Zhang, T.; Tsai, C.-Y.; Yao, L.; Lu, Y.; Tang, J. Review of the metaheuristic algorithms in applications: Visual analysis based on bibliometrics. Expert Syst. Appl. 2024, 255, 124857. [Google Scholar] [CrossRef]
- Mishra, A.; Goel, L. Metaheuristic algorithms in smart farming: An analytical survey. IEEE Tech. Rev. 2024, 41, 46–65. [Google Scholar] [CrossRef]
- Sharma, P.; Raju, S. Metaheuristic optimization algorithms: A comprehensive overview and classification of benchmark test functions. Soft Comput. 2024, 28, 3123–3186. [Google Scholar] [CrossRef]
- Tomar, V.; Bansal, M.; Singh, P. Metaheuristic algorithms for optimization: A brief review. Eng. Proc. 2024, 59, 238. [Google Scholar]
- Mirjalili, S.; Lewis, A. The whale optimization algorithm. Adv. Eng. Softw. 2016, 95, 51–67. [Google Scholar] [CrossRef]
- Pan, Q.; Tang, J.; Zhan, J.; Li, H. Bacteria phototaxis optimizer. Neural Comput. Appl. 2023, 35, 13433–13464. [Google Scholar] [CrossRef]
- Pan, Q.; Tang, J.; Lao, S. Edoa: An elastic deformation optimization algorithm. Appl. Intell. 2022, 52, 17580–17599. [Google Scholar] [CrossRef]
- Pan, Q.; Wang, H.; Tang, J.; Lv, Z.; Wang, Z.; Wu, X.; Ruan, Y.; Yv, T.; Lao, M. Eioa: A computing expectation-based influence evaluation method in weighted hypergraphs. Inf. Process. Manag. 2024, 61, 103856. [Google Scholar] [CrossRef]
- Yu, Y.-F.; Wang, Z.; Chen, X.; Feng, Q. Particle swarm optimization algorithm based on teaming behavior. Knowl.-Based Syst. 2025, 318, 113555. [Google Scholar] [CrossRef]
- Mozhdehi, A.T.; Khodadadi, N.; Aboutalebi, M.; El-kenawy, E.S.M.; Hussien, A.G.; Zhao, W.; Nadimi-Shahraki, M.H.; Mirjalili, S. Divine Religions Algorithm: A novel social-inspired metaheuristic algorithm for engineering and continuous optimization problems. Clust. Comput. 2025, 28, 253. [Google Scholar] [CrossRef]
- Zhang, J.; Yan, F.; Yang, J. Binary plant rhizome growth-based optimization algorithm: An efficient high-dimensional feature selection approach. J. Big Data 2025, 12, 13. [Google Scholar] [CrossRef]
- Zhao, S.; Zhang, T.; Ma, S.; Wang, M. Sea-horse optimizer: A novel nature-inspired meta-heuristic for global optimization problems. Appl. Intell. 2023, 53, 11833–11860. [Google Scholar] [CrossRef]
- Rezaei, F.; Safavi, H.R.; Abd Elaziz, M.; Mirjalili, S. GMO: Geometric mean optimizer for solving engineering problems. Soft Comput. 2023, 27, 10571–10606. [Google Scholar] [CrossRef]
- Braik, M.; Hammouri, A.; Atwan, J.; Al-Betar, M.A.; Awadallah, M.A. White shark optimizer: A novel bio-inspired meta-heuristic algorithm for global optimization problems. Knowl.-Based Syst. 2022, 243, 108457. [Google Scholar] [CrossRef]
- Abdollahzadeh, B.; Soleimanian Gharehchopogh, F.; Mirjalili, S. Artificial gorilla troops optimizer: A new nature-inspired metaheuristic algorithm for global optimization problems. Int. J. Intell. Syst. 2021, 36, 5887–5958. [Google Scholar] [CrossRef]
- Hashim, F.A.; Houssein, E.H.; Mabrouk, M.S.; Al-Atabany, W.; Mirjalili, S. Henry gas solubility optimization: A novel physics-based algorithm. Future Gener. Comput. Syst. 2019, 101, 646–667. [Google Scholar] [CrossRef]
- Mirjalili, S. Moth-flame optimization algorithm: A novel nature-inspired heuristic paradigm. Knowl.-Based Syst. 2015, 89, 228–249. [Google Scholar] [CrossRef]
- Nelder, J.A.; Mead, R. A Simplex Method for Function Minimization. Comput. J. 1965, 7, 308–313. [Google Scholar] [CrossRef]
- Fujita, K.; Honda, K.; Hirokawa, S. Voronoi diagram-based multi-objective optimization using cell-wise Pareto dominance. Eur. J. Oper. Res. 2005, 167, 731–748. [Google Scholar]
- Hirokawa, S.; Fujita, K. A Voronoi diagram-based approach to multi-modal function optimization. J. Glob. Optim. 2006, 36, 589–608. [Google Scholar]
- Yang, G.; Wu, D.; Wang, L.; Xu, T. Time-varying non-singular fast terminal sliding mode control for H-type motion platform. Modul. Mach. Tool Autom. Manuf. Tech. 2023, 5, 81–84. [Google Scholar]
Disclaimer/Publisher’s Note: The statements, opinions and data contained in all publications are solely those of the individual author(s) and contributor(s) and not of MDPI and/or the editor(s). MDPI and/or the editor(s) disclaim responsibility for any injury to people or property resulting from any ideas, methods, instructions or products referred to in the content. |
© 2025 by the authors. Licensee MDPI, Basel, Switzerland. This article is an open access article distributed under the terms and conditions of the Creative Commons Attribution (CC BY) license (https://creativecommons.org/licenses/by/4.0/).