1. Introduction
In today’s highly competitive market environment, most product companies place great emphasis on satisfying consumer needs [
1], including both functional and emotional demands. When consumers perceive that their needs are reflected in new products, their satisfaction levels tend to increase [
2]. With the widespread adoption of modern mechanized and intelligent manufacturing technologies [
3], the differences in quality, structure, and functionality among furniture products have gradually diminished. As a result, traditional approaches such as structural design [
4], functional improvement [
5], and ergonomic studies [
6] are no longer sufficient to ensure a competitive advantage in the consumer market. Increasingly, scholars are turning their attention to optimizing furniture form [
7] to meet users’ higher-level affective requirements. On the other hand, in the era of the experience economy, consumers, having met their basic material needs, now demand enhanced emotional experiences from products [
8]. The sensory characteristics of a product play a critical role in consumer acceptance and decision-making [
9]. Human beings predominantly acquire information from the external world through visual perception [
10]. The explicit form of a product creates a first impression by stimulating visual senses, which in turn shapes users’ perceptual experiences and influences their purchasing behavior. Therefore, product manufacturers must consider leveraging form innovation to meet emotional demands, launch emotionally resonant products, enhance user satisfaction, and ultimately gain substantial market returns [
11]. However, there are significant challenges. On one hand, current product form development is overly reliant on the experience and personal judgment of designers. Design departments often spend excessive time on repeated modifications, leading to inefficiency. On the other hand, cognitive asymmetries between designers and users often hinder products from meeting consumer expectations. These asymmetries arise from differences in knowledge, education, and product understanding. As a result, enterprises struggle to identify key affective requirements and translate them into design elements. The subjective nature of design intensifies this problem. It causes repeated trial-and-error cycles, which extend development time and increase costs. Therefore, design decision-making is critical to business strategy and performance [
12,
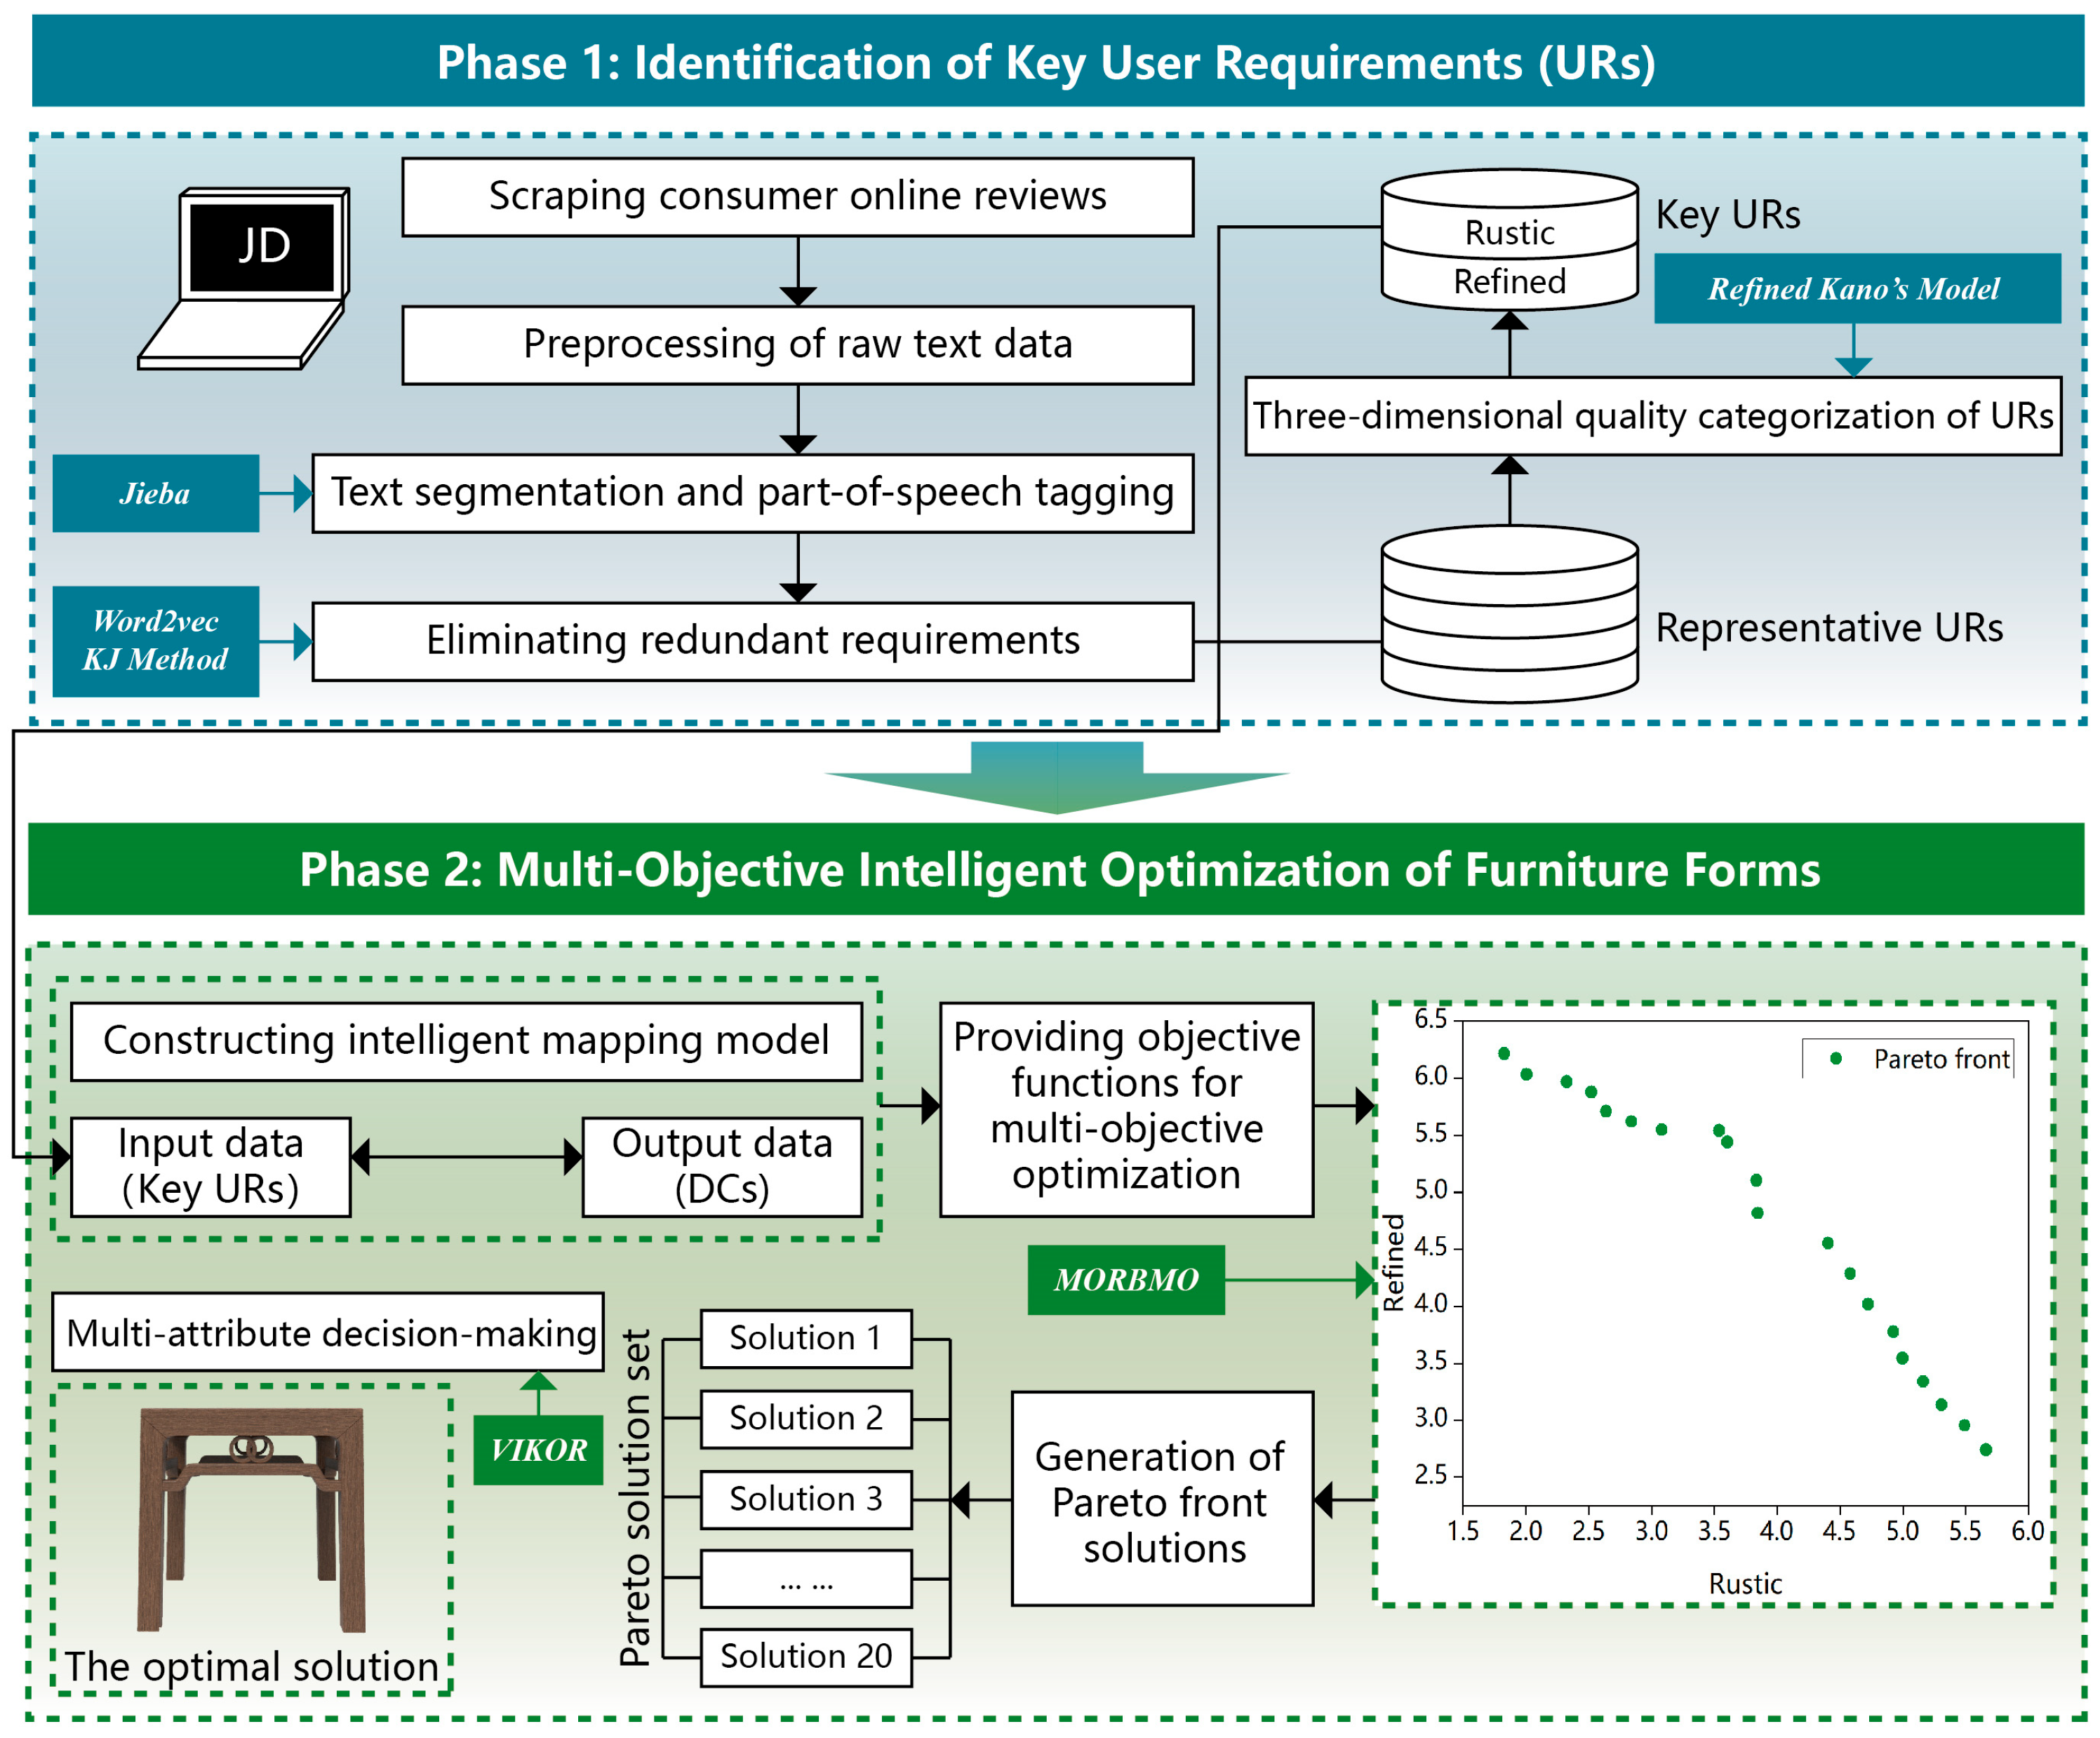
13]. To address these issues, this study proposes a consumer-centered approach. The method integrates Kansei engineering (KE), big data analytics, and artificial intelligence. KE provides a framework to link user perceptions with design elements. Big data extracts authentic consumer insights and reduces the cognitive gap between designers and users. Intelligent optimization techniques satisfy multi-dimensional emotional needs and improve the efficiency of product development.
KE is defined as a methodology that translates consumers’ feelings and impressions of a product into design elements [
14]. This approach aligns with the current trend of consumer-centered product development and aims to provide product functions and design features that embody and respond to users’ affective perceptions [
2]. However, traditional KE approaches still exhibit certain limitations.
First, the identification of key URs and the determination of their corresponding weights are foundational to bridging the gap between the user and design domains. They also play a critical role in setting priorities for product development. Currently, traditional KE methods collect Kansei-related terms through two main channels to identify URs: (1) prior research findings documented in the academic literature or professional publications [
15], and (2) direct user interviews. These methods often fall short in terms of timeliness, objectivity, and efficiency. Online review data, by contrast, have become one of the most influential sources of information affecting consumer decisions. They provide a direct link between products and real user experiences [
16]. While online reviews are commonly used in sentiment analysis and feature extraction research [
17], they have been infrequently applied within KE frameworks. On the other hand, user requirements often exhibit qualitative characteristics. After gathering user needs, Kano’s model [
18] is commonly used to analyze the implicit relationship between product attributes and consumer satisfaction. It enables the classification of quality attributes into four types: “attractive quality”, “one-dimensional quality”, “must-be quality”, and “indifferent quality”. However, Kano’s model only supports coarse-grained classification of URs and lacks the capacity to determine their relative importance or weights in a detailed manner. To date, there is limited research that leverages online review data to perform both fine-grained classification and weighting of user requirements within a KE framework.
Second, once the key URs have been identified, constructing a mapping model between URs and DCs to determine the optimal design solution is a core component of KE. In addition to traditional linear models—such as Multiple Linear Regression and Quantification Theory Type I—many advanced algorithms have been introduced in recent years to build nonlinear models, thanks to the rapid advancement of artificial intelligence technologies. These include BackPropagation Neural Networks (BPNNs), Support Vector Regression (SVR), and Long Short-Term Memory (LSTM) networks. By learning from user evaluation data, such models can predict the effectiveness of furniture features and help generate optimized design solutions that meet specific URs. While these studies have advanced the automation of furniture development and improved the precision of design decision-making, they predominantly focus on single-objective optimization, i.e., optimizing product forms for a single user requirement. The need to simultaneously address multiple dimensions of emotional user needs has not been adequately emphasized. In reality, engineering design problems are typically multi-objective in nature [
19]. Human emotional responses to products are likewise multifaceted [
20]. Specifically, users often present complex and diverse requirements, and in real-world scenarios—such as product usage or purchasing decisions—they expect products to satisfy multiple needs concurrently, rather than just a single aspect.
In summary, the asymmetry commonly observed in user research and optimization design processes often results in final products that fail to meet the genuine requirements of users. This, in turn, hinders furniture enterprises—despite significant resource investment—from gaining a competitive edge in the consumer market. In the design framework proposed by this study, user elements and furniture elements together form an integrated design system. User elements encompass actual URs from various sources and levels of granularity, while furniture elements include deconstructed DCs and form components. In this study, “symmetry” is defined as the internal equilibrium of a design system that integrates both elements, which is achieved through furniture forms that effectively fulfill users’ affective requirements. Specifically, at the user research level, large volumes of authentic online user reviews from diverse sources are employed to address cognitive and preference asymmetries between designers and users. At the optimization design level, multi-objective optimization is used to overcome the limitations of single-objective approaches, which often fail to balance and fulfill users’ multi-dimensional affective requirements. Thus, this study aims to explore the phenomena of symmetry and asymmetry in the field of morphological design and proposes an intelligent optimization design method for furniture forms that considers users’ multi-dimensional affective requirements.
Accordingly, this study identifies two key research questions (RQs) that require urgent attention. RQ1: how can authentic URs be extracted from widely sourced online consumer reviews, and how can the key requirements that contribute most to enhancing user satisfaction be identified? RQ2: once the key URs are determined, how can a multi-objective optimization approach be constructed to ensure that new product forms simultaneously accommodate these multi-dimensional affective requirements?
To address these RQs, this study proposes two main solutions:
(1) For RQ1, this study integrates online review data and the refined Kano’s model to develop a big-data-driven approach to user research. In the field of product form design, few researchers have applied this enhanced Kano’s model. The method begins by crawling massive amounts of online user reviews as data sources, which are then automatically processed using NLP techniques. Online review data are voluntarily generated by real consumers [
21,
22], and compared to traditional surveys or interviews, such publicly available data reduce the subjectivity and cost of user research. The improved Kano model overcomes the limitations of the traditional model by enabling fine-grained quality classification and importance weighting of URs. This provides valuable insights into the nuanced and dynamic needs of consumers and effectively bridges the cognitive gap between designers and users.
(2) For RQ2, an integrated design method combining MORBMO and VIKOR is introduced. Specifically, MORBMO is employed to solve the multi-objective optimization problem of furniture form design, thereby enabling product solutions to balance multiple affective requirements of users. The MORBMO algorithm [
23] simulates the magpie’s food storage behavior to retain superior solutions and balances exploration and exploitation through food searching and attacking strategies, effectively avoiding local optima. In addition, the multi-criteria decision-making method VIKOR [
24] is employed to assist the design team in selecting the optimal solution from the Pareto front. Compared to traditional design methods that generate only a single optimized solution for a single user requirement, the integrated approach of multi-objective optimization and multi-attribute decision-making offers greater flexibility and realism. It supports the development of multiple candidate solutions, each balancing different user demands, thereby ensuring the final product aligns with various consumer expectations. This not only reduces the trial-and-error cost for design teams but also helps companies gain a competitive edge in the market at a lower cost.
The structure of this paper is organized as follows:
Section 2 presents a comprehensive review of the relevant theories and methods.
Section 3 introduces the methodologies employed in this study.
Section 4 validates the proposed model using a real-world case study.
Section 5 discusses the results and implications of the case.
Section 6 concludes this paper by summarizing its contributions and limitations.
4. Empirical Study
4.1. Determination of Key User Requirements
4.1.1. Data Acquisition and Preprocessing
The identification of key URs is essential for guiding subsequent product development strategies, as Kansei words directly reflects users’ affective requirements. JD.com, one of the largest e-commerce platforms in China, offers a vast variety of products and a large consumer base, while actively encouraging customers to share their opinions. The massive volume of user reviews available on this platform provides researchers with authentic, objective, and representative data for conducting user studies—offering a clear advantage over traditional sources such as literature reviews, user reports, or expert interviews.
Accordingly, this study takes Ming-style furniture as a research case. Fourteen representative products from different brands—selected based on high sales and review counts—were chosen as the data source. Using the BAZHUAYU web scraping tool, a total of 143,524 characters of raw user reviews were collected and saved in UTF-8 encoded.txt files. Subsequently, the raw text data underwent preprocessing using Python 3.7.0. First, special characters and punctuation marks were removed from the review texts. Then, invalid reviews were filtered out by removing entries that were too short (fewer than five characters) or duplicated.
After text cleaning, the Jieba package was used for Chinese word segmentation, stop word removal, and part-of-speech tagging. A stop word list developed by Harbin Institute of Technology was used to eliminate non-informative words, and adjectives within the reviews were finally tagged for further analysis.
4.1.2. Screening of Representative URs Utilizing Word2vec and KJ Method
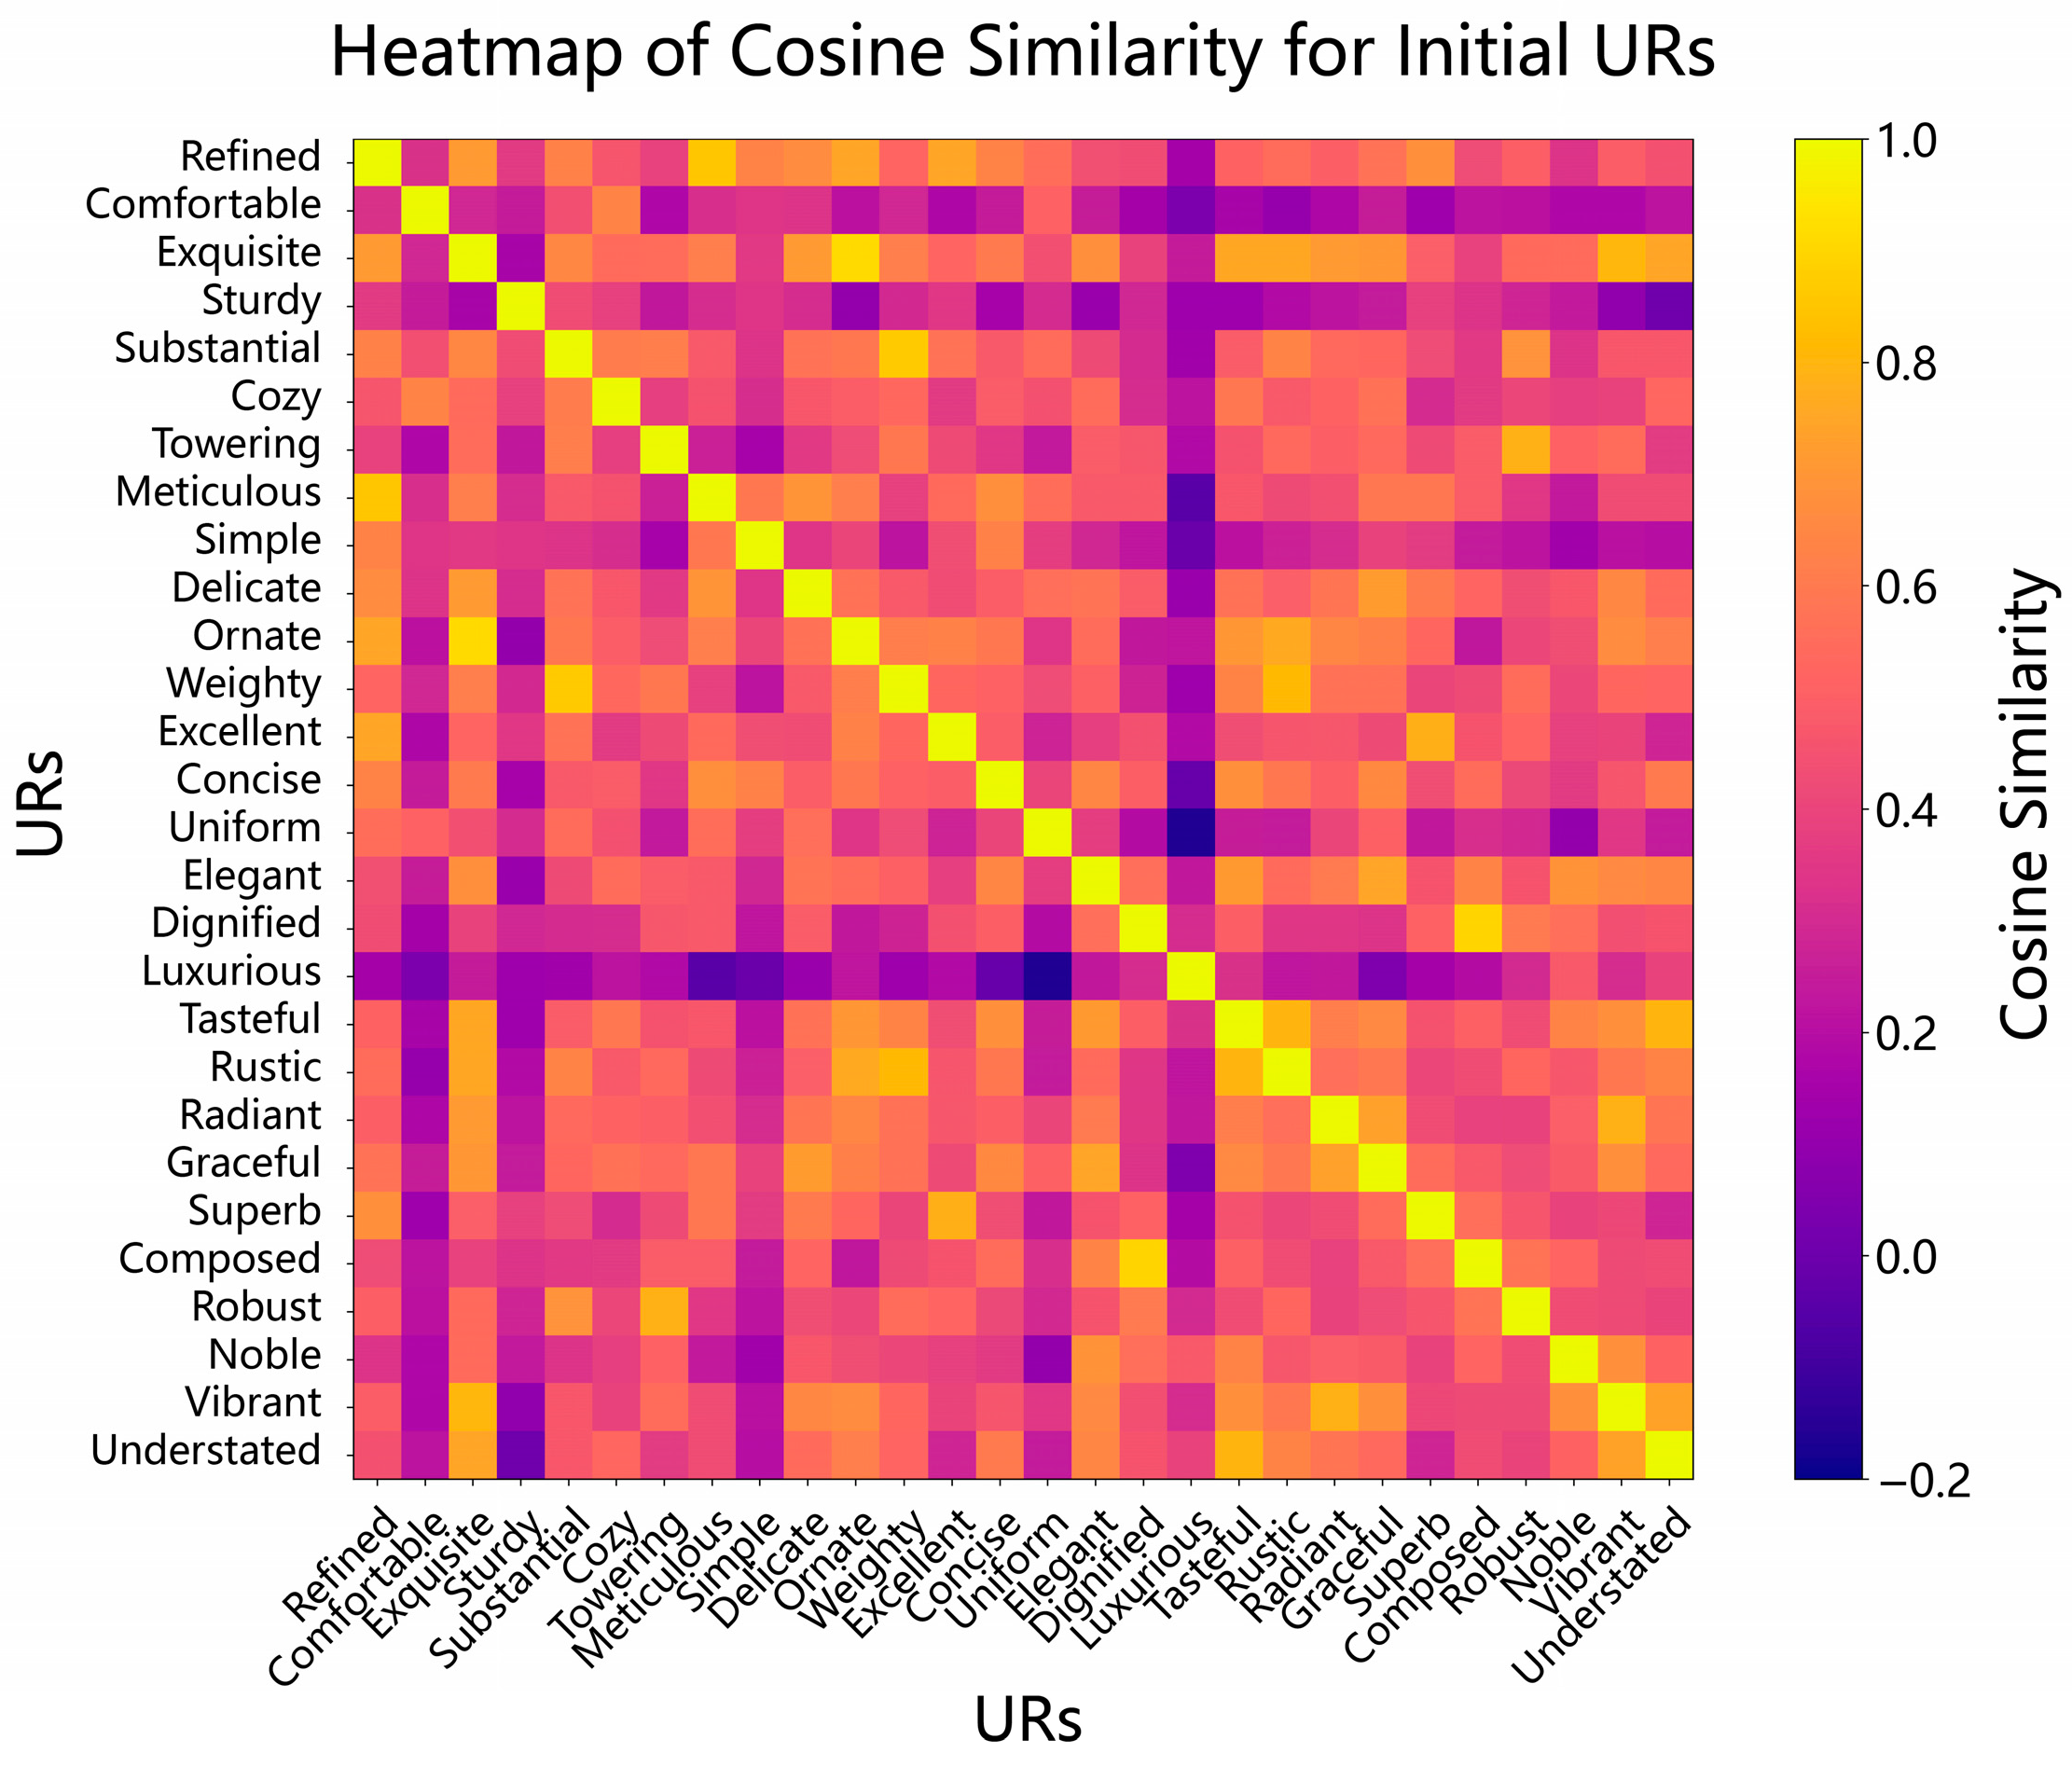
A combined approach of semantic similarity computation and focus group discussion was employed to filter out representative URs and avoid redundant entries with similar meanings. First, to enhance model performance, the study utilized the gensim package to load a pre-trained Word2Vec model based on a Chinese Wikipedia corpus. This model was used to obtain vector representations of 18 initial URs and to compute the cosine similarity between them. Next, a cosine similarity heatmap of these URs was generated using the matplotlib package, as shown in
Figure 4. A similarity threshold of 0.7 was set, and pairwise comparisons were conducted to identify semantically redundant terms. Specifically, it was found that the similarity between “refined” and terms such as “exquisite”, “meticulous”, and “ornate” exceeded the threshold of 0.7, indicating that these requirements convey highly overlapping meanings. In addition, the similarity between “exquisite” and “delicate”, “ornate”, and “tasteful” was also above the threshold; between “substantial” and “weighty” above the threshold; between “towering” and “robust” above the threshold; between “meticulous” and “delicate” above the threshold; between “delicate” and “graceful” above the threshold; between “ornate” and “tasteful” and “rustic” above the threshold; between “weighty” and “rustic” above the threshold; between “excellent” and “superb” above the threshold; between “elegant” and “tasteful” and “graceful” above the threshold; between “dignified” and “composed” above the threshold; between “tasteful” and “rustic” and “understated” above the threshold; between “radiant” and “graceful” and “vibrant” above the threshold; and between “vibrant” and “understated” above the threshold. Subsequently, redundant requirements with high similarity were removed. Finally, a focus group applied the KJ method to manually classify and analyze the filtered URs, verifying and eliminating entries with overlapping meanings. Through this two-step screening process, a final set of 11 representative URs was retained: “refined”, “comfortable”, “sturdy”, “substantial”, “towering”, “simple”, “uniform”, “elegant”, “luxurious”, “rustic”, and “vibrant”. These representative URs collectively formed the Kansei dictionary.
4.1.3. Classification and Wights Calculation for Representative URs Utilizing the Refined Kano’s Model
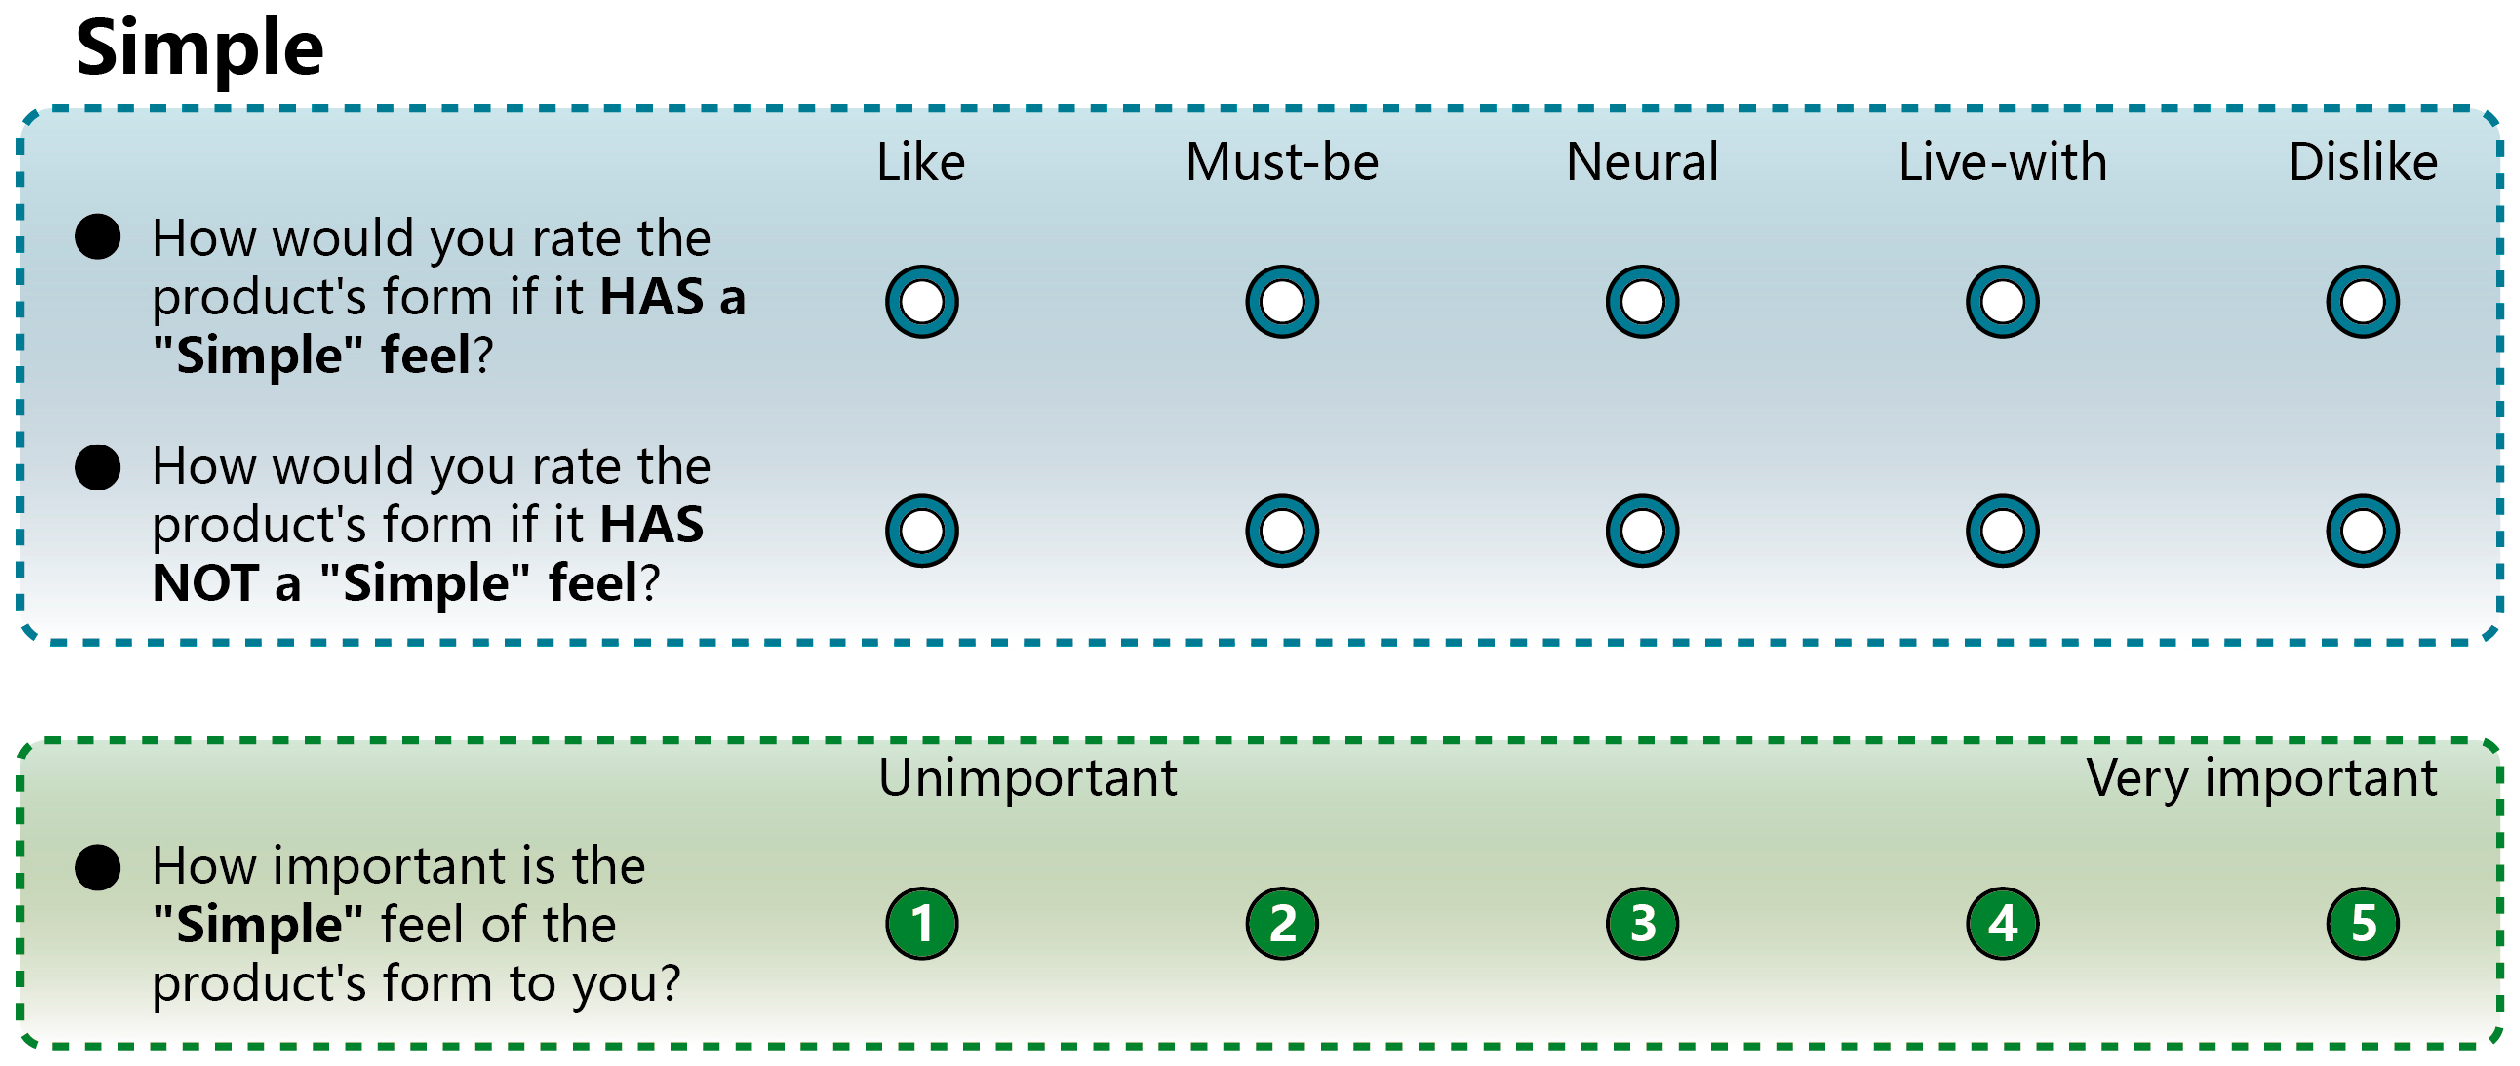
After obtaining the representative URs, the refined Kano’s model proposed in this study was applied to perform three-dimensional quality classification and weight calculation of the representative URs, in order to further identify the key URs. First, the refined Kano’s model questionnaire, as described in
Section 3.1.3, was distributed to 88 participants with prior experience using Ming-style furniture. After collecting the responses, the data were verified for validity, and responses with excessively short completion times or illogical answers were removed. A total of 73 valid questionnaires were retained.
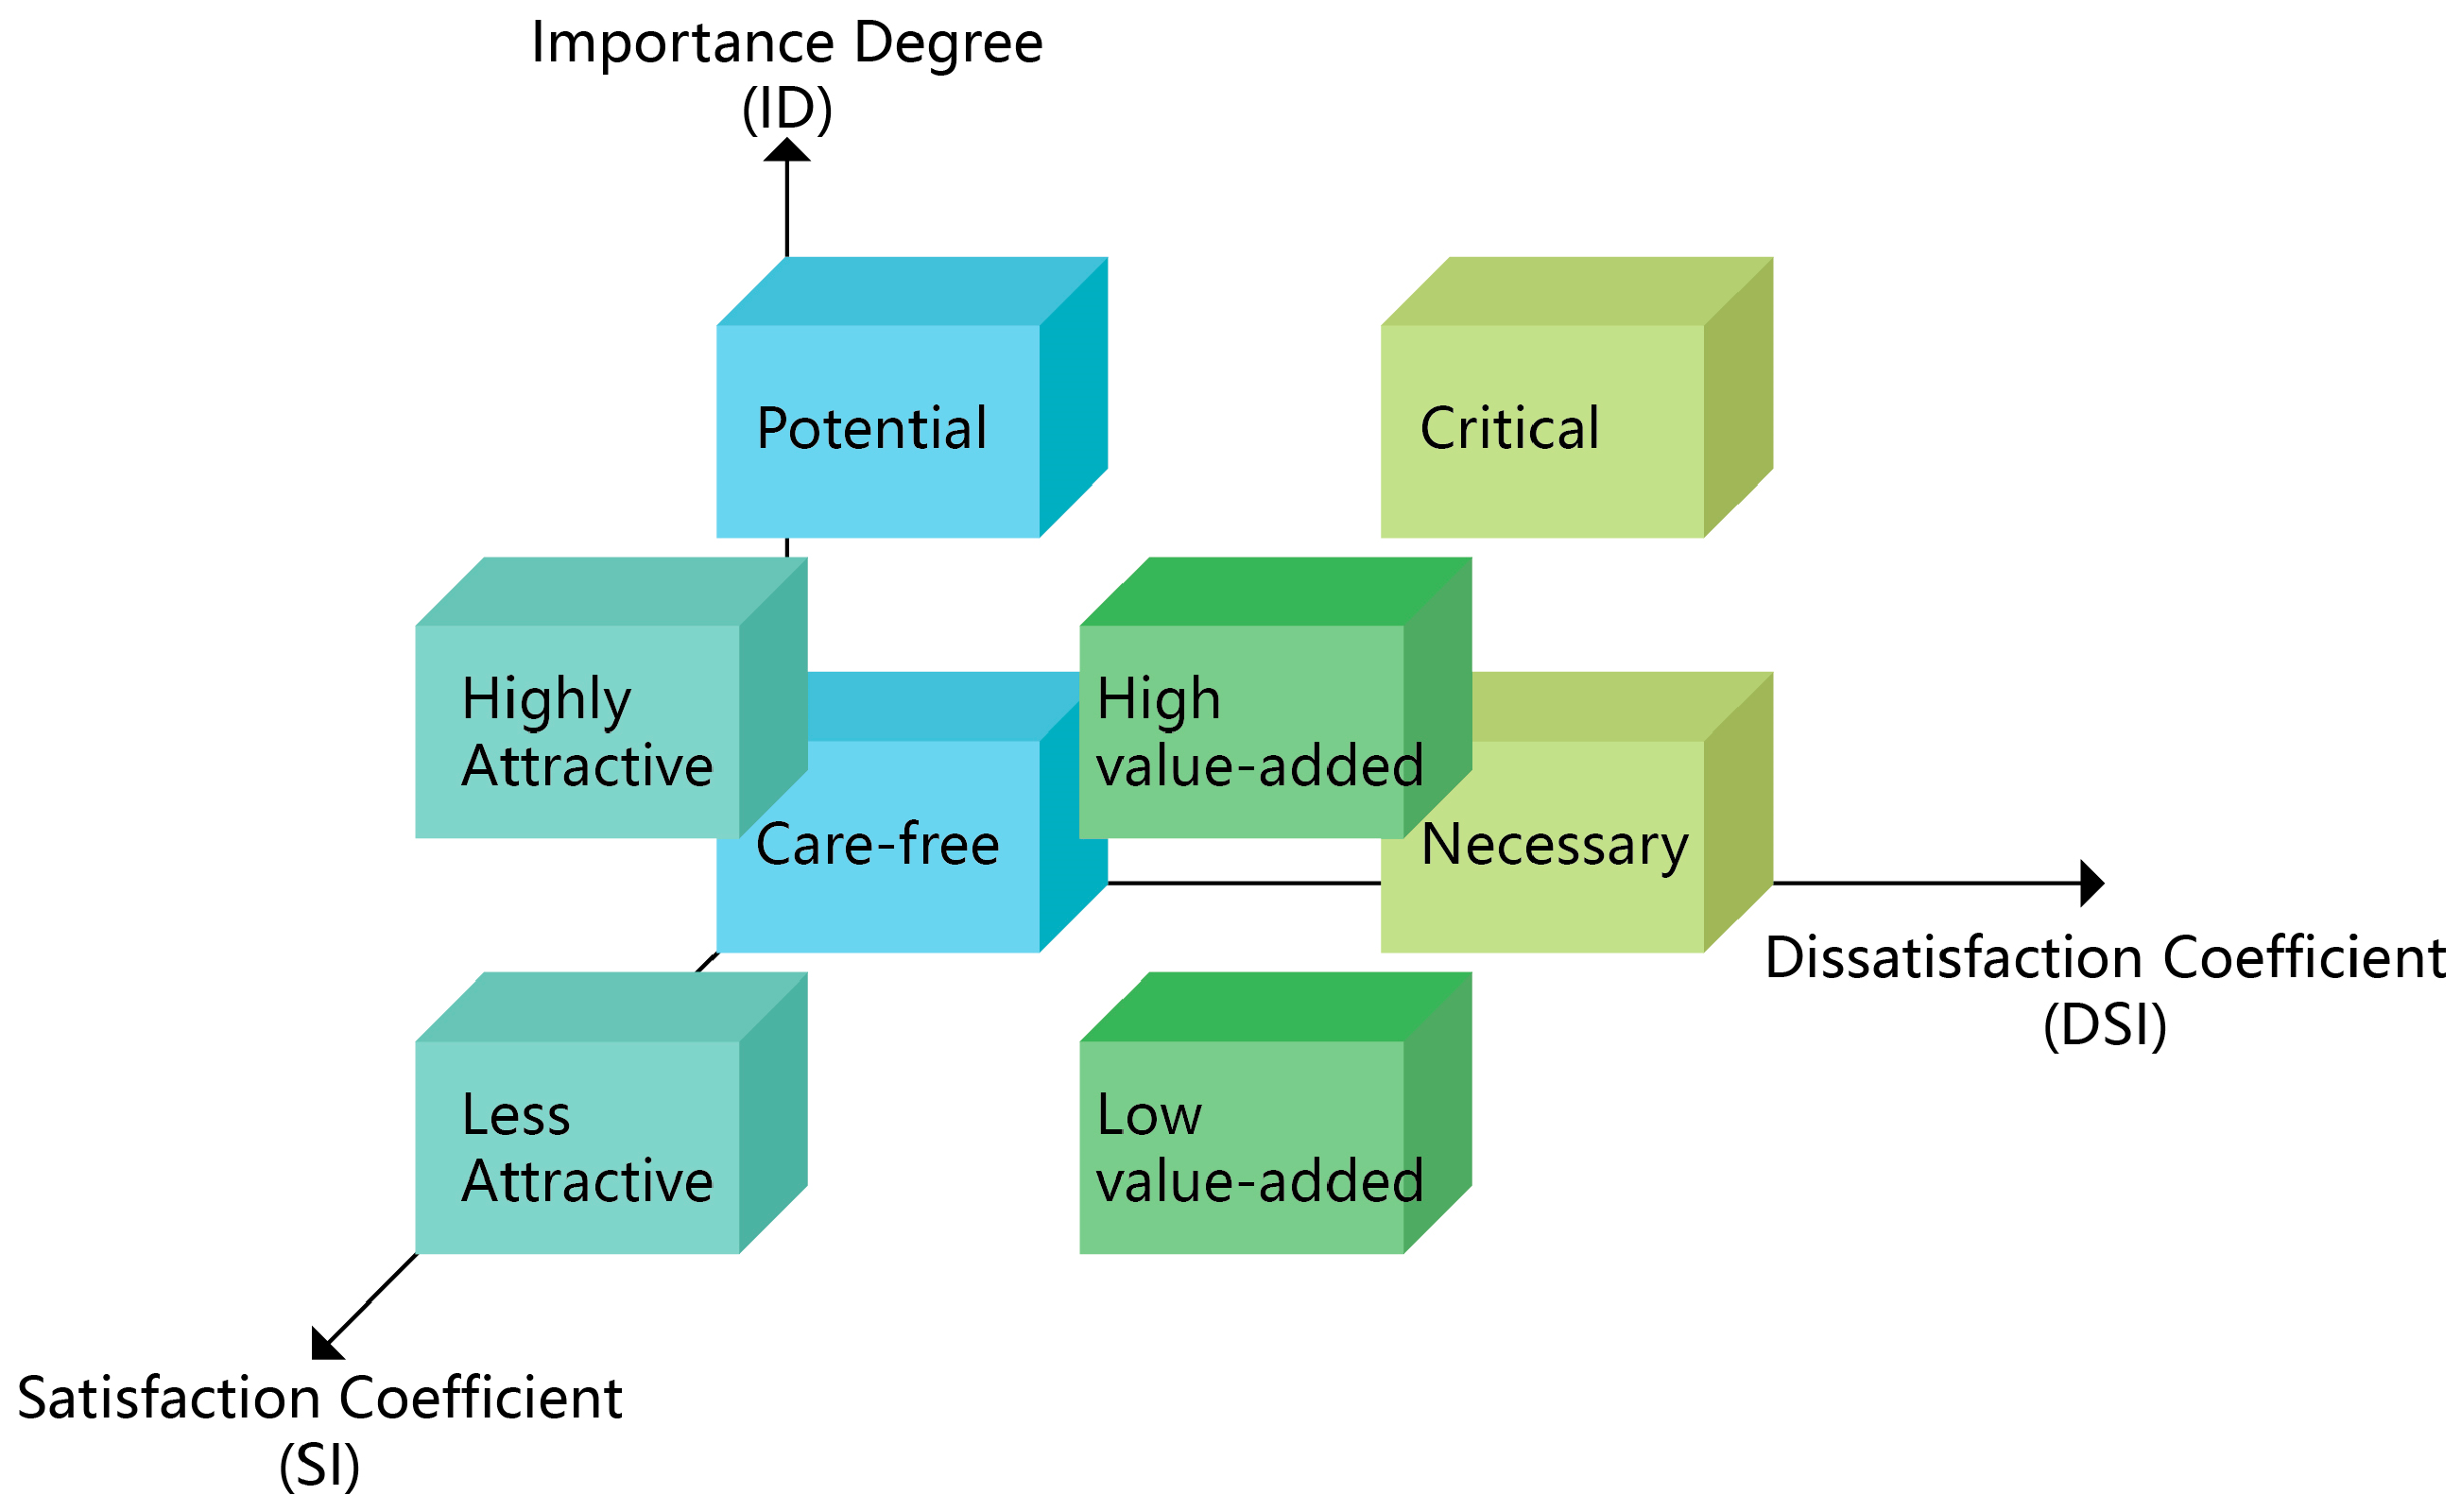
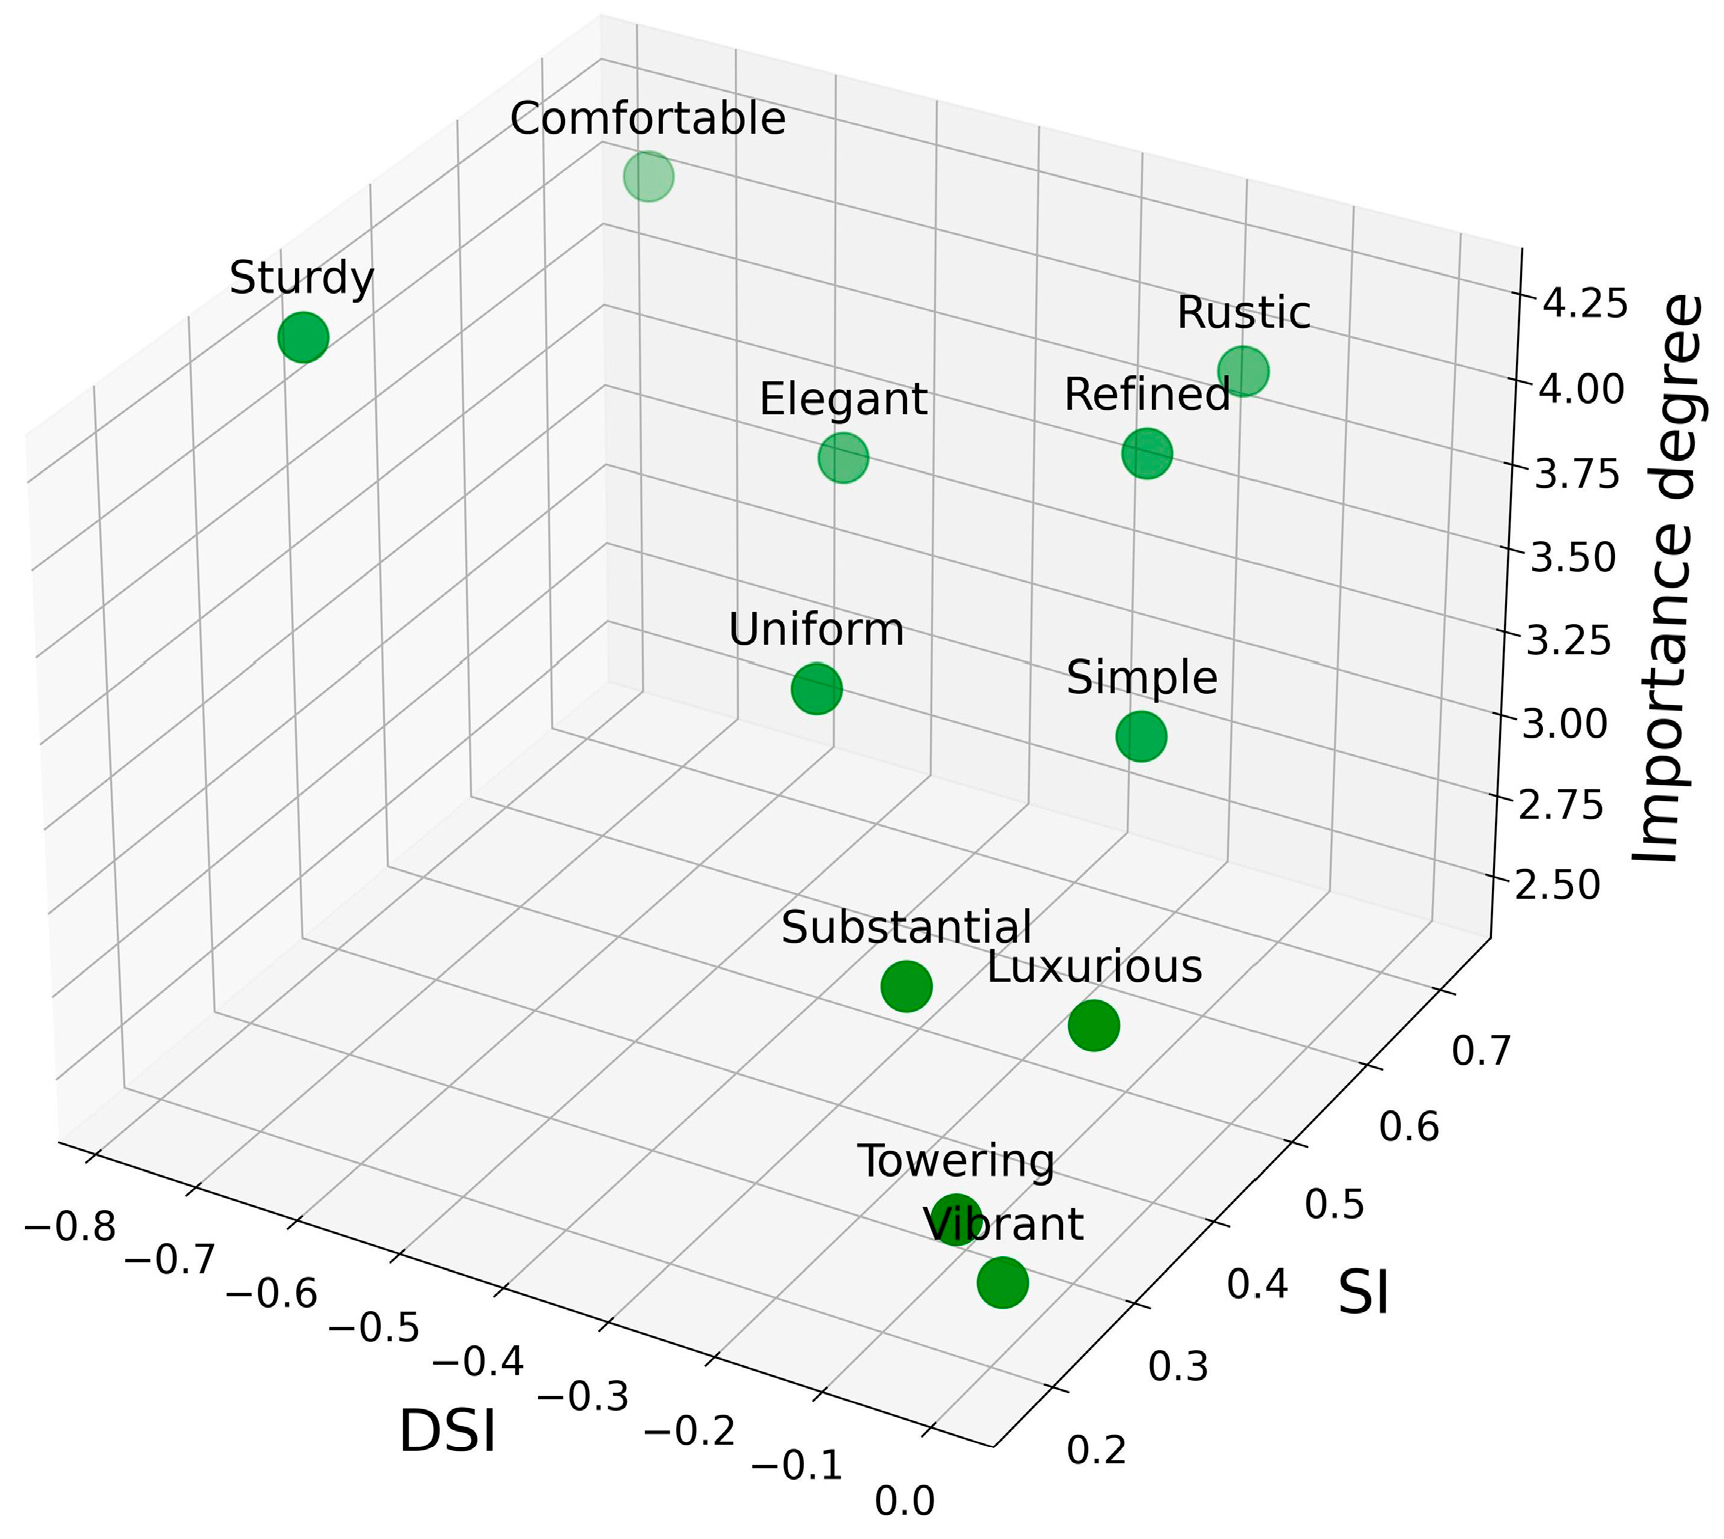
Using Equations (2) and (3), the Satisfaction Index (SI) and Dissatisfaction Index (DSI) for the 11 representative URs were calculated. Subsequently, Equation (4) was used to compute the perceived importance of each requirement. Reliability analysis showed a Cronbach’s Alpha coefficient of 0.743, indicating a good level of internal consistency for the Likert scale data. A three-dimensional scatter plot was then generated to visualize the representative URs based on their SI, DSI, and importance scores (see
Figure 5).
A closer analysis of
Figure 5 showed that “rustic” and “refined” not only had higher SI values and lower DSI values but also carried relatively high weights, 3.92 and 3.89, both significantly above the mean (3.465). This indicated that these two requirements were not only conducive to enhancing customer satisfaction but were also of critical importance. Accordingly, they were classified as highly attractive (HA) attributes within the attractive category. In other words, providing these two qualities in a product could effectively assist firms in attracting potential customers and improving user satisfaction, making them strategic quality attributes that products should possess. By contrast, although “simple” also had a higher SI and lower DSI value, its perceived importance (3.36) was below the mean, thus classifying it as a less attractive (LA) attribute, which could be discarded under cost constraints. “Comfortable” and “elegant” were high value-added (HV) quality attributes, which contributed considerably to customer satisfaction but showed relatively high DSI values. “Sturdy” was identified as a critical (C) attribute within must-be attributes. “Uniform” was categorized as a potential (P) attribute within indifferent attributes, suggesting potential to become attractive to consumers. Finally, “substantial”, “luxurious”, “towering”, and “vibrant” all had importance scores significantly below the mean and exerted little influence on customer satisfaction, thus falling under care-free (CF) attributes in the ondifferent category, which firms did not need to consider when resources were limited. As argued by Tan et al. [
42], designers should prioritize attractive attributes first, followed by one-dimensional and must-be attributes, while indifferent attributes may be disregarded due to their negligible contribution to customer satisfaction.
Therefore, in order to guide firms in concentrating limited resources on critical issues and maximizing overall benefits, this study first identified HA attributes—namely “rustic” and “refined”—as the key user requirements (URs). These were regarded as strategic quality attributes for enhancing customer satisfaction and were subsequently applied in the product case development. The quality classifications of the representative URs are summarized in
Table 3.
4.2. Morphological Decomposition of Furniture Forms
This section selects the square stool from Ming-style furniture as the analysis subject for design characteristics (DCs), as it not only represents a fundamental functional category of furniture but is also widely used in both commercial and residential spaces. With its strong connection to users and diverse range of styles, it serves as a highly representative example.
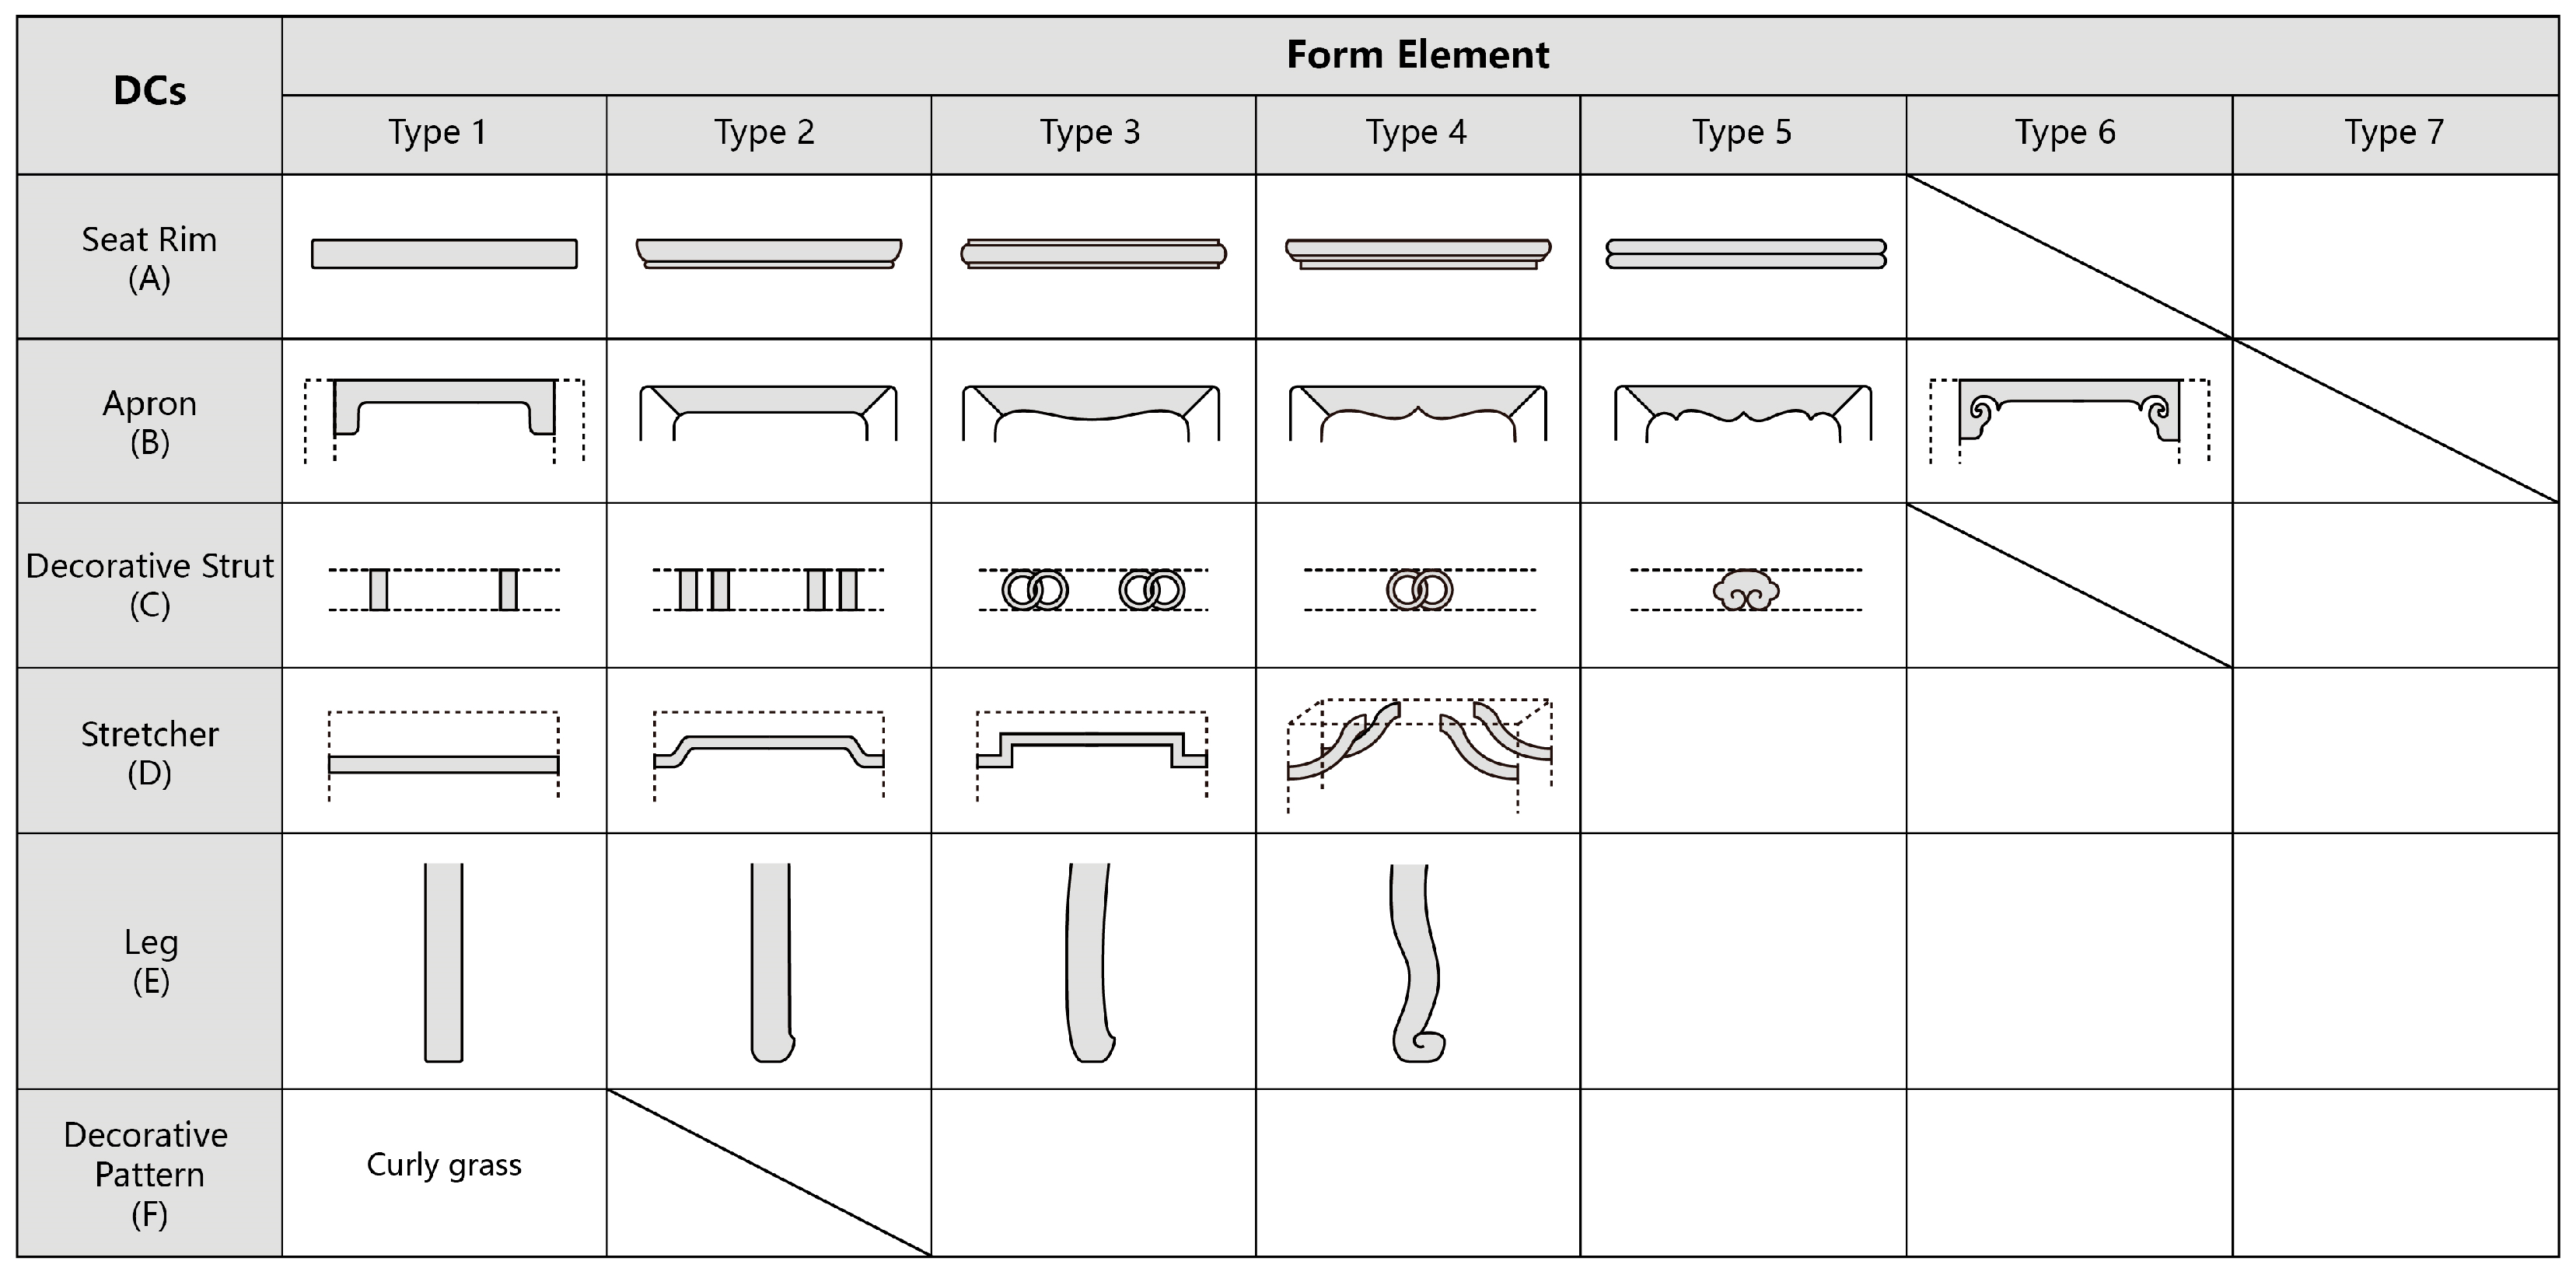
Through morphological analysis, the furniture was classified into six distinct DCs, each of which was systematically coded, as illustrated in
Figure 6. These characteristics were identified as the seat rim (A), apron (B), decorative strut (C), stretcher (D), leg (E), and decorative pattern (F).
The seat rim, positioned along the perimeter of the square stool’s seat, secures the surface structurally and contributes to its aesthetic appeal through variations in linear form; in this study, it was further subdivided into six categories. The apron, situated directly beneath the seat rim and joined to the legs on all four sides, transfers structural loads from the rim to the legs. Functionally analogous to beams in architectural structures, it was categorized into seven types. The decorative strut, serving primarily ornamental purposes, extends downward to connect with the stretcher and consists of six types. The stretcher, a horizontal member linking the legs at their midsection, reinforces overall stability and appears in four common configurations. The leg, as a fundamental load-bearing element comparable to architectural columns, was classified into four categories. Finally, the decorative pattern, which has no structural function, is mainly applied to the apron’s surface, where it enriches the visual hierarchy and enhances artistic expression.
A total of 150 sample images were collected from books and websites, from which 80 high-resolution images with clear morphological differences and strong representativeness were selected as experimental samples. After selecting the samples, standardized image processing was conducted. First, irrelevant elements such as backgrounds and shadows were removed. Next, the color saturation of all images was reduced to −100 to achieve grayscale processing. Finally, the images were uniformly output as JPG files with dimensions of 100 × 100 mm, a resolution of 150 ppi, and a white background. These preprocessing steps eliminated confounding variables unrelated to the independent variables—such as color, size, background, and lighting—ensuring the validity of the experimental conditions. Following preprocessing, a 7-point Likert scale questionnaire was designed to collect users’ emotional evaluations of the 80 stool samples. After excluding responses with extremely short completion times or illogical patterns, a total of 70 valid questionnaires were retained. The morphological elements of the DCs were used as input characteristics, while the users’ affective evaluations served as output characteristics. In this way, a Kansei evaluation matrix under two requirement objectives was constructed, providing a foundational dataset for subsequent multi-objective optimization.
4.3. Multi-Objective Intelligent Optimization of Furniture Forms
4.3.1. Generation of Pareto Solutions
Based on
Figure 6, the independent variables of the 80 samples were encoded using a discrete feature representation, ensuring that the data could be correctly recognized within the MATLAB R2017b environment. The resulting Kansei evaluation matrix is shown in
Table A1 of
Appendix A.
Both surrogate model training and multi-objective optimization were conducted in the MATLAB R2017b environment. First, the dataset was partitioned. The first six columns, corresponding to the DCs (categorical variables), were treated as input features, while the final two columns, representing user Kansei evaluation values (continuous variables), were used as output features. The sampling size was configured as follows: the first 90% of the dataset (seventy-two samples) was allocated to the training set, and the remaining 10% (eight samples) was used as the test set. Next, in order to optimize the hyperparameters of the Support Vector Regression (SVR) surrogate model, Particle Swarm Optimization (PSO) was applied to globally search for the optimal combination of two hyperparameters: the penalty factor and the kernel function parameter. The optimal hyperparameter combination for Objective 1 (“rustic”) was determined as (30.6259, 0.73224), and for Objective 2 (“refined”) as (16.7981, 0.68201).
After the optimal parameters were identified, the SVR model was trained and used to construct the objective functions for subsequent multi-objective optimization. With the objective functions established, the MORBMO algorithm was implemented for multi-objective optimization. The repository size was set to 20, meaning the algorithm outputs 20 solutions per run. The population size was set to 100, and the maximum number of iterations was 200.
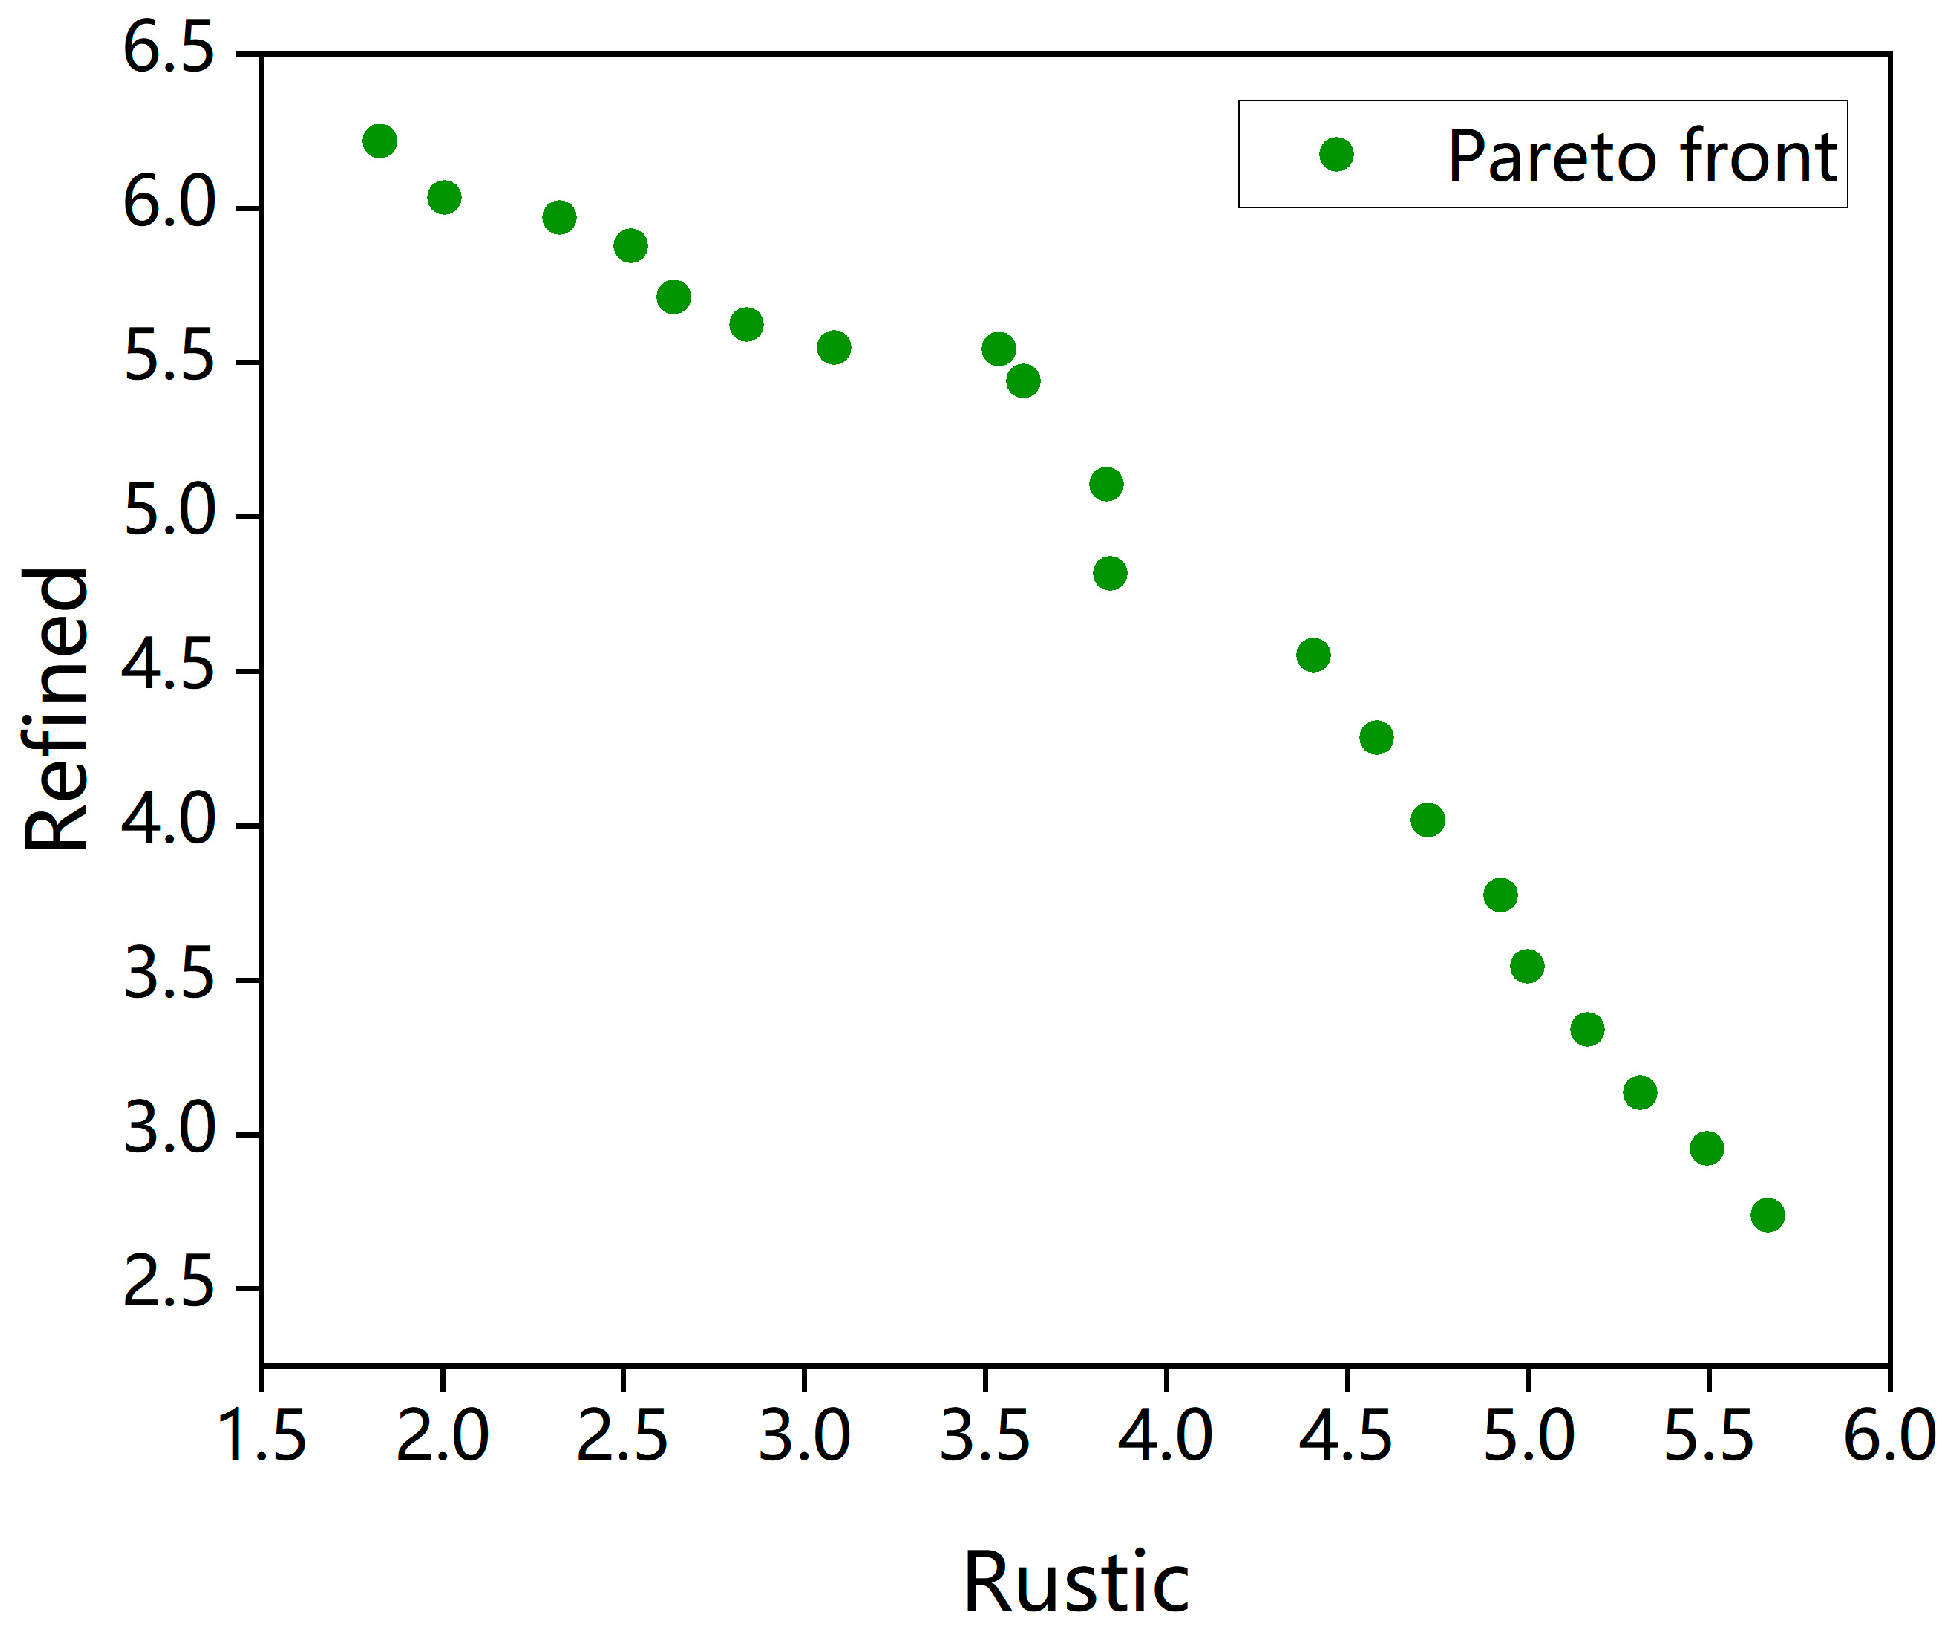
Table 4 provides the details of the hyperparameter settings and experimental environment configuration. The Pareto front solutions generated by the MORBMO algorithm are illustrated in
Figure 7. The 20 solutions are evenly distributed across the two-dimensional space. All points on the Pareto front are optimal solutions, offering the design team a diverse set of alternatives rather than a single solution. By examining the overall trend of the Pareto front solutions, it was observed that an increase in the “rustic” value was accompanied by a decrease in the “refined” value, and vice versa. This finding indicates that the optimization of one requirement is typically associated with the deterioration of another, as different objectives are inherently in conflict and coupled through shared resources. In this study, both objectives shared the same set of input variable resources—namely, the six DCs illustrated in
Figure 6. As a result, the optimization of one objective occupied resources that could otherwise have been allocated to the other. Traditional morphology-based optimization methods that focused solely on a single objective often led to products incapable of simultaneously satisfying multi-dimensional user affective requirements. By contrast, the Pareto front represents the essence of balance, as it enables simultaneous improvements across multiple objectives through holistic optimization, thereby maximizing overall benefits in engineering tasks.
4.3.2. Comparative Experiment on Algorithm Performance
In addition to the MORBMO algorithm, two other classical optimization algorithms—Multi-Objective Sparrow Search Algorithm (MOSSA) [
43] and Multi-Objective Particle Swarm Optimization (MOPSO) [
44]—were employed for performance comparison. In the comparative experiments, all three algorithms were configured with identical parameter settings. Each algorithm was independently executed 20 times, and all the resulting solutions were subjected to non-dominated sorting to construct a reference Pareto front (RPF) [
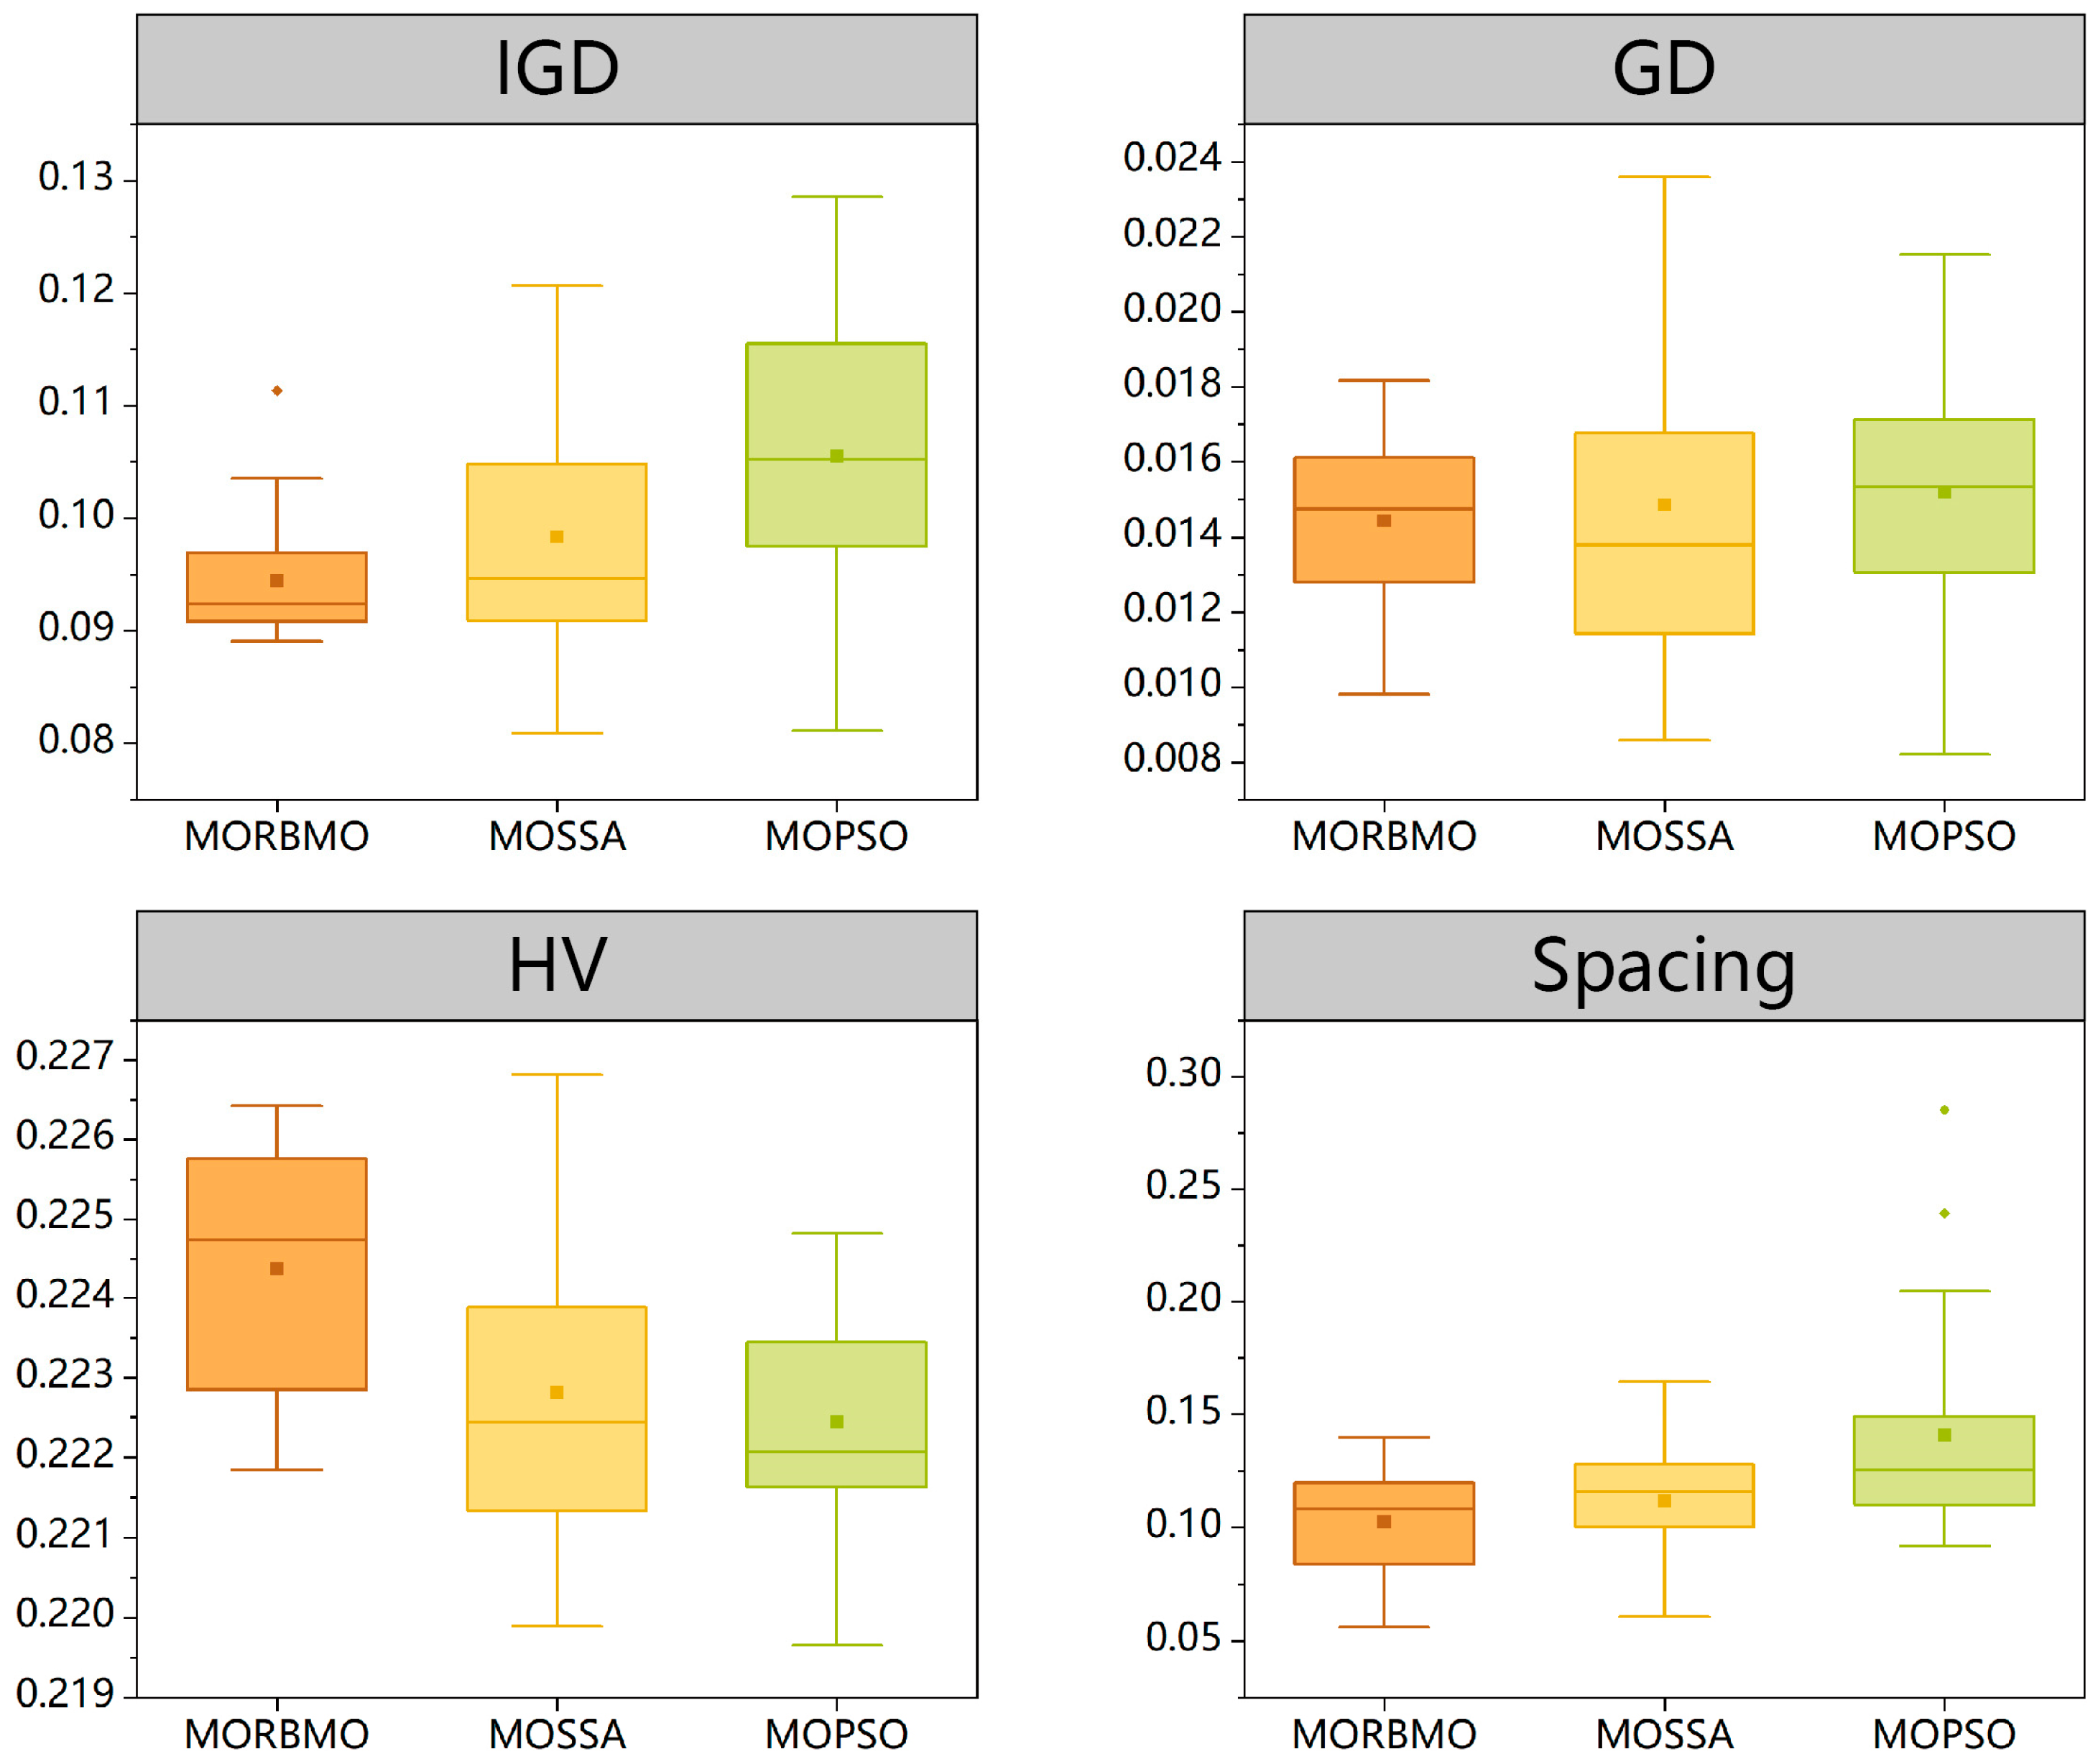
19]. To systematically and comprehensively evaluate the performance of the three algorithms, four indicators—IGD, GD, HV, and spacing—were introduced. The evaluation results are summarized in
Table 5. Pairwise comparisons of the algorithms were conducted using the Wilcoxon rank sum test to assess performance differences [
45]. For the IGD metric, MORBMO significantly outperformed MOPSO (
p < 0.05), whereas no statistically significant difference was observed between MORBMO and MOSSA. For the GD metric, none of the algorithm pairs exhibited statistically significant differences. Regarding the HV metric, MORBMO performed significantly better than both MOSSA and MOPSO (
p < 0.05), while the difference between MOSSA and MOPSO was not statistically significant. For the spacing metric, both MORBMO and MOSSA significantly outperformed MOPSO (
p < 0.05), but no statistically significant difference was found between MORBMO and MOSSA. Furthermore,
Figure 8 presents boxplots for a more intuitive comparison of the algorithms’ performance across the different metrics. Overall, the MORBMO algorithm demonstrated superior performance, with smaller standard deviations. Specifically, it achieved the lowest IGD and GD values, indicating that the solution set generated by MORBMO is closer to the theoretical optimal front. In addition, its significantly lower spacing value suggests better distribution uniformity and greater solution diversity. Finally, the MORBMO algorithm attained a comparatively higher HV value, which demonstrates that its solution set encompassed a larger and more extensive coverage of the objective space, thereby yielding a Pareto front with superior diversity.
4.3.3. Multi-Criteria Decision-Making for Pareto Solutions
The VIKOR method was applied to identify the optimal solution among the 20 Pareto front solutions presented in
Figure 7. After normalizing the 20 solutions, the group utility values and individual regret values for each solution were calculated using Equations (19) and (20), respectively. The compromise values were then determined using Equation (21).
Table 6 presents the overall decision results for all 20 solutions. For Solution 4, the group utility value (0.3739) and the individual regret value (0.2769) were both markedly lower than those of the other solutions, indicating that this solution not only performed well in terms of overall performance across the two objectives but also maintained satisfactory performance on individual criteria. When these two measures were combined, the resulting compromise value (0.0761) was the smallest among the 20 solutions. This demonstrates that Solution 4 simultaneously maximized the overall benefit and avoided severe underperformance on any single criterion and was therefore identified as the final optimal solution. The characteristic combination for Solution 4 is (A6, B2, C4, D2, E1, F2), and its output values for the two objectives are (3.5383, 5.5420).
4.4. Design Practice
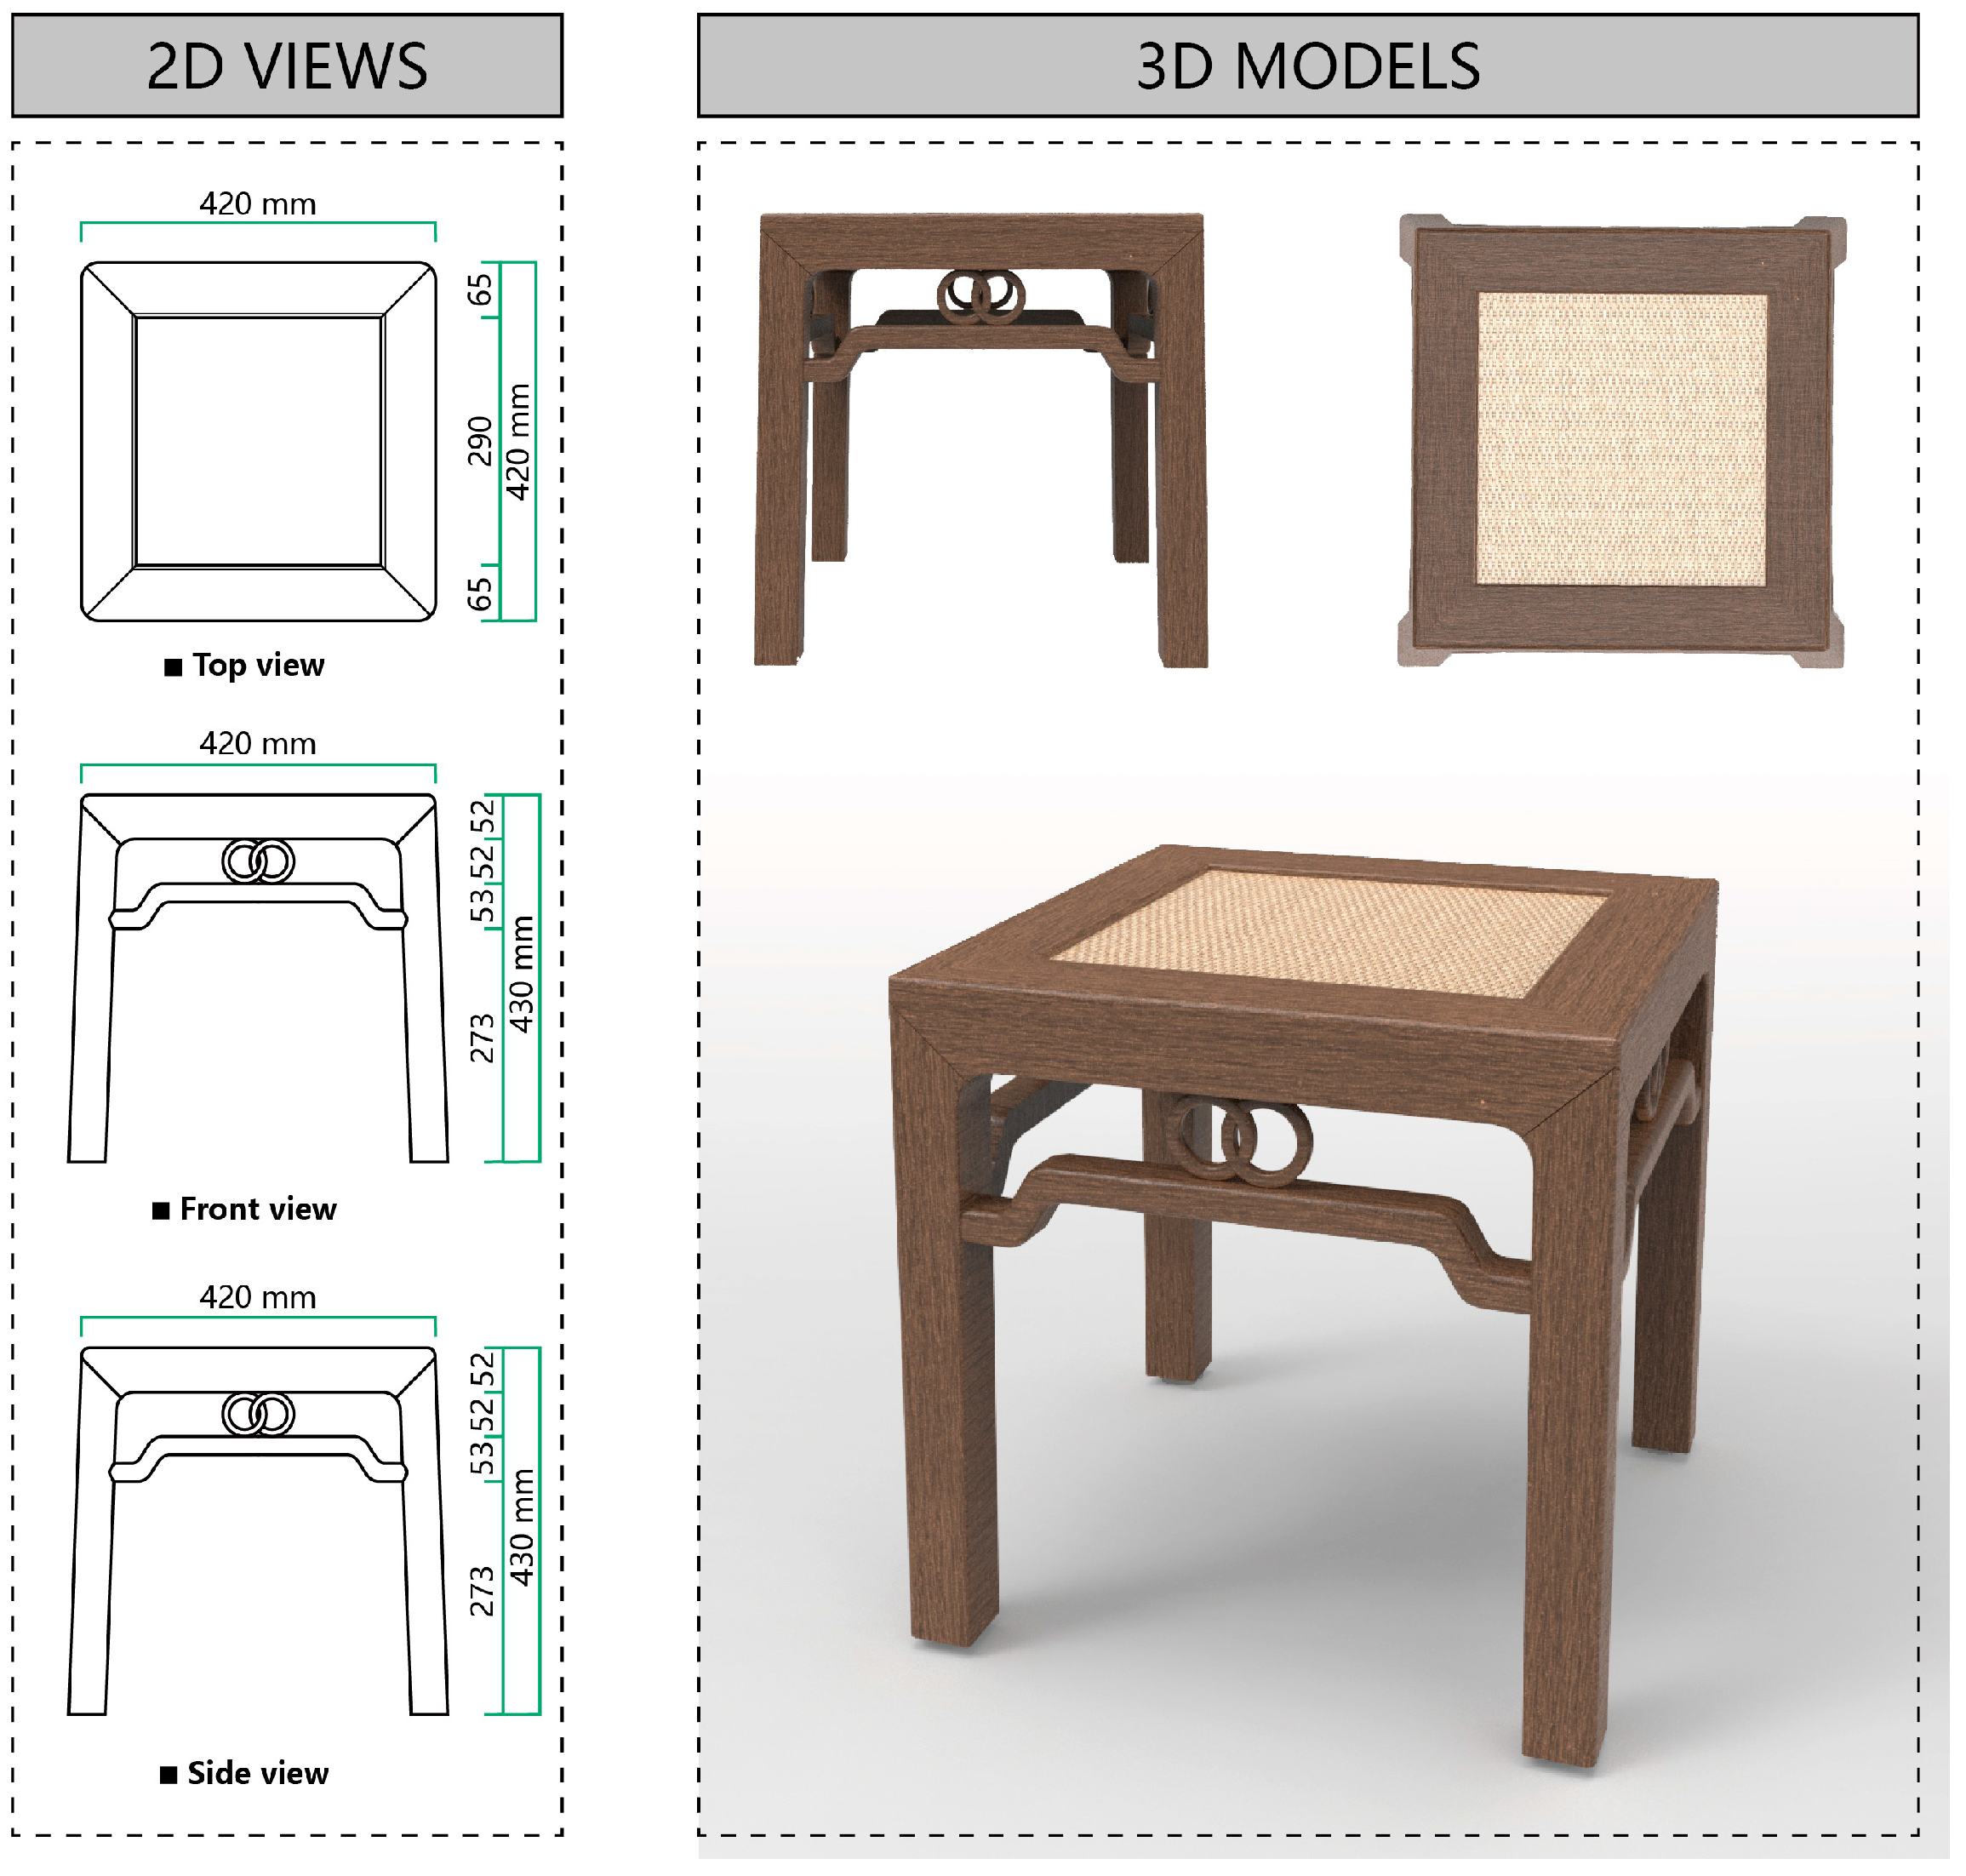
This section focuses on product line planning and development based on the final solution. After completing the conceptual design through hand-drawn sketches, the selected scheme underwent detailed design, modeling, and rendering. Modeling was carried out using AutoCAD 2019 in conjunction with Rhino 6. To ensure ergonomic suitability, the stool was designed with a seat height of 430 mm and a length and width of 420 mm. In addition, an experienced professional furniture designer oversaw the proportion of the contours and the curvature of the lines to enhance the overall harmony and elegance of the product form. The 3D model was then imported into KeyShot 2023 for rendering. The final product was successfully developed, as shown in
Figure 9.
In terms of styling, the stool inherits the understated elegance and refined simplicity typical of Ming-style furniture. The form is clean and fluid, with the stool legs angled outward by 2 degrees. As a result, both the side and front views reveal a trapezoidal rather than rectangular silhouette, conveying a sense of stability. In terms of decoration, a decorative strut with a patterned element is added between the apron and the stretcher. This feature not only enhances the piece’s visual refinement but also serves a structural role in reinforcing the frame. Apart from this, no excessive ornamental carvings are used, allowing the piece to stand out through its proportion and linework alone. The main structure is crafted from black walnut heartwood, featuring a natural chocolate hue and a fine, elegant grain. A transparent water-based lacquer is applied to the wood surface, serving as a protective layer to minimize damage from wear and environmental factors while also adding a soft sheen that accentuates the wood’s natural texture. The seat surface is woven using a traditional cane technique, providing elasticity and enhanced seating comfort.
5. Discussion
On the one hand, in today’s user-centered consumer market, the extraction of key URs directly shapes the direction of new product development. In KE research, Kansei words serve as an important medium for expressing users’ affective requirements. Previous studies have often relied on sources such as magazines and journals, supplemented by the KJ method to mine Kansei words, and then employed multi-criteria decision analysis to determine the priority of URs. While such methods are classical and easy to implement, they are constrained by limited sample sizes, which restrict their ability to represent the overall characteristics of user groups and to capture the dynamic and quality-oriented nature of consumer preferences. To address this issue, this study proposed a big-data-driven refined Kano’s model for the three-dimensional classification of URs. Online user reviews were collected to capture authentic needs in a more objective and comprehensive way. Eleven representative requirements were then extracted using natural language processing techniques. These requirements were classified through the refined Kano’s model with greater granularity, and categories such as HA, LA, and HV attributes were identified. Two HA requirements—“rustic” and “refined”—emerged as the key URs. Under resource constraints, this approach enabled furniture enterprises to prioritize product development more effectively. The results showed that the refined Kano’s model reduced cognitive asymmetry between designers and users. It also revealed multi-layered requirements with higher depth and granularity, reflecting the model’s inherent symmetry and resolution.
On the other hand, earlier KE studies predominantly employed statistical models to establish associations; however, these approaches are inherently linear, with limited scalability and weak robustness to noise. Consequently, in recent years, machine learning algorithms have increasingly been introduced into the domain of furniture form design, achieving a series of promising outcomes. Such algorithms offer greater scalability, higher predictive accuracy, and the ability to model more complex nonlinear relationships. Nevertheless, their limitation lies in their narrow focus: they typically optimize only a single requirement, thereby neglecting or even worsening other objectives, and they generally yield only a single optimal solution. In contrast, real-world furniture design invariably involves multiple objectives that must be simultaneously considered and optimized. Compared with prior studies, this research innovatively employed the multi-objective optimization algorithm MORBMO to automatically generate a set of non-dominated solutions, thereby revealing the balance among conflicting objectives and covering diverse requirements. The results indicated that MORBMO achieved strong overall performance, producing a solution set with greater diversity and closer approximation to the RPF. Subsequently, the multi-criteria decision-making method VIKOR was applied to identify the final solution from the Pareto set. Among the alternatives, Solution 4 was distinguished by its relatively low group utility value (0.3739) and individual regret value (0.2769), as well as the smallest compromise value (0.0761), and was therefore determined to be the final optimal solution. This outcome highlights the methodological innovation of this study: rather than providing enterprises or researchers with a single prescriptive solution, the proposed approach offers a diverse set of alternatives. In summary, the integrated methodology proposed in this research—combining MORBMO and VIKOR—achieved both global balance and diversified choices in the optimization design process, thereby addressing the multi-dimensional expectations of the market and users. Such multi-dimensional trade-offs not only prevent “one-sided optimization” but also offer new insights for related studies in furniture form design.
6. Conclusions
In the era of emotional experience, product forms that align with users’ affective requirements can effectively stimulate purchasing and usage behaviors. However, key challenges remain in this field—namely, how to more comprehensively and objectively extract key URs to bridge the cognitive gap between designers and users, and how to develop innovative furniture that balances users’ multi-dimensional affective requirements. In response to the asymmetries observed in the field of form design, this study, grounded in KE, proposes an intelligent optimization method for furniture form design that takes into account users’ multi-dimensional affective requirements. This approach effectively restores symmetry between user-related factors and product-related factors within the design system. First, natural language processing techniques were employed to extract online user reviews. After identifying representative URs using Word2Vec and the KJ method, the refined Kano’s model was applied to perform three-dimensional quality classification and weight calculation, ultimately identifying “rustic” and “refined” as the two key URs. Next, morphological analysis was used to deconstruct the product into six DCs: seat rim (A), apron (B), decorative strut (C), stretcher (D), leg (E), and decorative pattern (F). A surrogate model was then built using SVR, and a set of Pareto-optimal solutions was generated using the proposed MORBMO algorithm. A comparative experiment on algorithm performance showed that the MORBMO algorithm outperformed other algorithms. Solution 4 was identified as the final optimal solution using the VIKOR method. Finally, the selected design was refined and evaluated. Compared with previous studies, this research makes the following three key contributions:
(1) This study proposes an intelligent optimization design method for furniture form that integrates big data and artificial intelligence technologies into the design domain. This approach enhances the universality and objectivity of user requirement data sources while improving design efficiency.
(2) A big-data-driven refined Kano’s model is introduced to enable both fine-grained classification of URs and the identification of key URs. This assists design teams in prioritizing product line planning based on URs.
(3) An automated solution generation model is constructed using the MORBMO algorithm, which outputs a set of solutions that satisfy users’ multi-dimensional affective requirements rather than a single optimal solution. The final solution is then selected using the VIKOR method. This combination of multi-objective optimization and multi-criteria decision-making provides design departments with more diverse and flexible pathways for new product development.
Admittedly, this study has the following three limitations that warrant further improvement in future work:
(1) This study applies morphological analysis to deconstruct product characteristics, which limits the granularity of the morphological breakdown. As a result, some design details may not have been fully considered. Future research will explore more nuanced and multi-layered morphological deconstruction, potentially using CAD tools to quantitatively describe product forms.
(2) This study focuses on a single visual design attribute—furniture form. Due to experimental constraints, it does not account for other multi-dimensional design features such as color, material, and surface finishing. However, in real-world purchasing and usage contexts, consumers perceive products through multiple senses, such as vision and touch. Future research will expand on this work by examining how multi-dimensional design attributes influence consumer preferences.
(3) This study employs the square stool from Ming-style furniture as a specific case to validate the feasibility of the proposed method. In fact, the method demonstrates both extensibility and generalizability. When applied to other product categories, it requires case-specific analysis to identify emerging market trends and accurately capture product characteristics. Future work may further extend this method and apply it to diverse product types, thereby broadening its practical significance.
