Abstract
Cosmic ray astronomy, the search for sources of cosmic rays of the highest energies, requires knowledge of the change in their trajectory as they pass through the magnetic fields of the Galaxy. The knowledge of magnetic fields in the Galaxy is rather modest and we are forced to resort in our calculations to models. In this paper, we compare the results obtained with several commonly used regular Galactic field models assuming the same Kolmogorov-turbulent irregular field. Calculations were carried out for specific potential UHECR sources of both known objects in the sky and potential ones located in the directions of the observed UHECR.
1. Introduction
Charged ultra-high-energy cosmic rays (UHECRs) are subject to Lorentz forces created by ubiquitous magnetic fields during propagation. The intensity of these fields depends on the scale of the distances considered, ranging from the size of the Solar System and the Earth’s field to Galactic and intergalactic fields. The degree of deflection also depends on the energy and charge of the particle. In this work, we will consider particles with extremely high energies (1020 eV), for which only Galactic-scale fields are relevant. It is often assumed that, at these ultra-high energies, the paths of particles from their sources to Earth are almost straight, deviating very little from a straight line. This assumption is based on the assumption that we are dealing with protons. In the rapporteur talk at the International Cosmic Ray Conference in July 2025, professor Olkonomou outlined the current experimental and interpretative landscape in the field of UHECR [1]. The two large experimental groups, the Pierre Auger Observatory and the Telescope Array, appear to be close to reaching a consensus on the mass composition at 1020 eV. It looks like the pure proton and pure iron primaries seem incompatible with the measured values of the depth of the Extensive Air Shower (EAS) maxima , not to mention the dispersion of this quantity and other issues. Figures presented by Prof. Olkonomou suggest that the mass of primary particles in this energy range is ’in the middle’ (A∼14).
If we add to this the difficulty of constructing a mechanism to accelerate UHECR particles to energies at the limit of possibility illustrated vividly in the Hillas diagram [2] and the problems of finding the small-scale anisotropy expected for propagating protons, the question of the mass (charge) composition of the primary cosmic rays remains ope.
Trajectories of particles with energies in excess of eV, if they are charged 26 times more than a proton, can be significantly bent when they pass through the magnetic fields of the Galaxy.
2. Magnetic Fields in the Galaxy
The magnetic field of the Galaxy can conveniently be divided into two components: a regular field and a turbulent, or random, field. We will start with the former in Section 2.1. Section 2.2 discusses the irregular field model used in this work.
2.1. Regular Magnetic Field
In our galaxy, the magnetic field can take the form of a bisymmetric spiral (BSS), in which the field directions in consecutive arms are opposite, or an axisymmetric spiral (ASS), in which the field directions in adjacent arms are the same. While the ASS model can today be treated more as a mathematical curiosity, it cannot be rejected a priori. Both are illustrated in Figure 1.
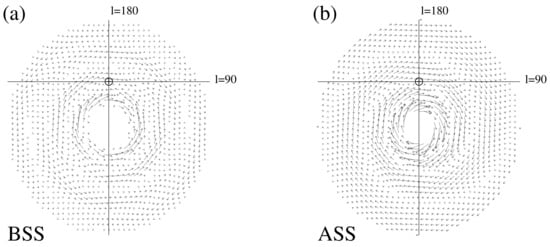
Figure 1.
Magnetic field in the galactic plane for the BSS (a) and ASS (b) models from [3]. The length of the arrows corresponds to the strength of the magnetic field. The horizontal and vertical lines represent the galactic coordinate system, with l denoting galactic longitude. The circle indicates the position of the Solar System in the Galaxy.
Another issue is the behaviour of the magnetic field above and below the galactic plane. The simplest solutions are either a dipole-type field of odd parity (A) or a quadrupole-type field of even parity (S) [3].
The magnetic fields shown in Figure 1 illustrate the dependencies proposed by Stanev in [3].
with the and r field components are
where the pitch angle . The parameters and variables appearing in Equations (1) and (2) are r—the galactic radius, kpc (for BSS-A) and kpc (for ASS-S). with a value of 6.4 μG at 4 kpc, and R is the galactocentric distance of the Solar System, 8.5 kpc.
The regular magnetic field component perpendicular to the Galactic plane is set to zero. The magnetic field strength decreases exponentially with the distance from the Galactic disc (z), with a scale of 1 kpc for z less than 0.5 kpc and 4 kpc for greater distances, as proposed in Ref. [3].
The model presented above, which was modified by the introduction of a toroidal field in the galactic halo, was analysed in the work of [4]. A similar modification was made in [5] by adding a poloidal magnetic field to the halo.
An extension of this concept is the significantly improved model [6,7]. This model was created to accurately describe the WMAP7 22 GHz total synchrotron intensity measurements, rather than for UHECR propagation. While it is objectively better than the rough models analysed in this work, uncertainties related to the shape of the Galaxy’s magnetic fields remain to be definitively resolved (see [1]).
Another modification that alters the radial and vertical dependence of the mean field on spatial coordinates was applied in the work [8]. This modification involved replacing Equation (1) with
and with kpc, kpc, kpc.
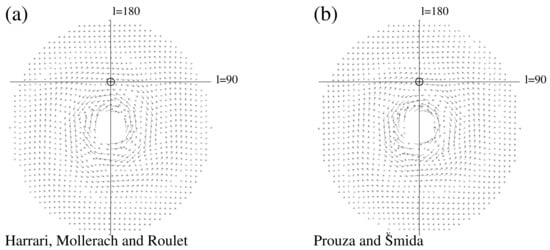
Figure 2.
Magnetic field in the galactic plane for the [8] (a) and [5] (b) models shown as in Figure 1.
2.2. Turbulent (Random) Magnetic Field
The irregular magnetic fields are often studied by dividing the space into very small cells (50 pc), each of which has a randomly generated magnetic field value and direction. To take into account the fact that larger field values are expected in spiral arms, irregular fields are also introduced by strengthening the field in the arms and weakening it in the spaces between them [5].
A more realistic picture of the intergalactic magnetic field is achieved by using the Fourier modes and their power spectrum.
where are random phases, and the length of the turbulent wave vector k is limitted with the model parameters and . We used pc and pc. Concerning the UHECR transport problem, the lower limit of turbulence size is not important. The upper limit (within the reasonable range) has only a minor influence [9,10].
In the present paper, a particular turbulent random field is realised by replacing the integration in Equation (4) with the sum of 1000 independent Fourier components, each with a randomly chosen value of k (limited by and ) and a random phase of . The sum was then normalised to produce the assumed . In our calculations, we assumed that the average value of this field was 4 μG. We investigated the effect of the mean value of the turbulent field on the deviations of UHECR particle tracks. The results are presented in Section 7.
The power spectrum is proportional to the energy density contained in the k mode. For the power-law Kolmogorov turbulence spectrum, we used
Some examples of the random magnetic field are given in Figure 3.
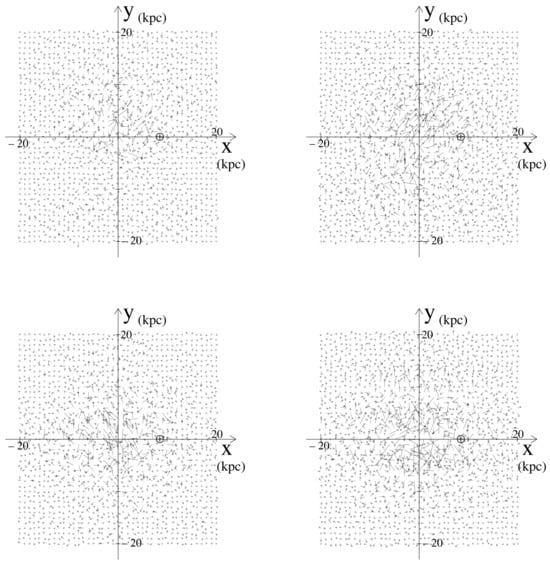
Figure 3.
Four different random realisations of an irregular magnetic field.
3. UHECR Propagation
Two approaches are available for the study of anisotropy, and these are as follows: The first is known as ’back propagation’ [3]. It is started from a set of observed (or potentially observed, uniformly distributed) events on Earth and consists in each particle being followed from where it was observed according to the direction of that observation. In doing so, the particle’s charge is assumed to be the opposite of its true charge (i.e., negative). Eventually, the location from which the particle was emitted is estimated. This is a commonly used method; see, for example, [8,11,12].
The opposite method investigates the deflection of particles emitted from sources located far beyond the Solar System, which follow curved paths into its vicinity. This method is used, for example, by Ref. [13]. Clearly, it is not intended for practical use at low energies, where particles move through space by diffusion. However, simulations can be performed for particles at extremely high energies, where the deviations are not as significant. Particles are emitted in a cone pointing towards the galaxy, and only events that have approached the solar system at an assumed small distance are recorded.
This is the technique that we used in our work.
4. Suspected and Potential Sources of UHECR
In the context of cosmic ray astronomy, certain astrophysical objects have long been associated with showers of extremely high energy. Firstly, they appear to fulfil the Hillas energy criteria required to produce a stream of particles with such high energies. Secondly, analysis of the arrival directions of the showers suggests that at least some originate from, and may be correlated with, these objects. There are a number of different candidates for UHECR sources, including Active Galactic Nuclei (AGN). Of all the known AGNs, Centaurus A (Cen A) is the closest to Earth. Located at a distance of about 3.8 Mpc, Cen A has very large radio lobes, making it a fascinating object for many astrophysical studies, including those concerning UHECRs.
Another interesting object is the M82 starburst galaxy, located between 3.5 and 3.8 Mpc away, which was identified as the hotspot detected by the Telescope Array [14,15,16]. M82 is renowned for harbouring an intermediate-size black hole [17].
These two potential sources were also considered at lower energies (>8 EeV) in [12,18].
As for the identification of astrophysical objects that could be sources of UHECRs, the Large Magellanic Cloud, a dwarf satellite galaxy of the Milky Way, has recently been proposed. It is very close to us at only 50 kpc. Several of the most energetic showers observed by the Pierre Auger Observatory are in close proximity to the LMC, as noted in [19].
Furthermore, more or less statistically significant clusters of showers, small-scale anisotropy, were also observed. However, it has not been possible to link these clusters unambiguously to any object that could potentially be a source of UHECRs. To be mentioned here are two AGASA triplets (one with a case from Haverah Park added on) [20] and the recent very energetic (2.4 × 10²⁰ eV) Amaterasu event [1]. Whereas an attempt could be made to attribute the AGASA triplets to astronomical objects (C1—Mrk 359, C2 to the galaxy NGC 3642 (quite close, 8.4 Mpc)) or the distant Mrk 40 or Mrk 171, no visible relatively close object can be attributed to Amaterasu.
In the latter case, it would be useful to know the potential deviation of this particle’s trajectory, as this would help direct our search for the source.
5. UHECR Particle Propagation
In order to determine the extent of the observed changes in the directions of incoming particles from extragalactic sources, we conducted calculations involving the emission of particles with energy of eV from the sources under study towards the Solar System. As these particles entered the magnetic fields of the Galaxy, they changed direction, making it extremely unlikely that they would hit the Solar System. They could leave the Galaxy without ever approaching the observer’s position. We checked the closest distance at which a particle would pass the Solar System in each case, recording the angle of arrival if the distance was less than 500 pc. In each such case, we determined the position of the point on the celestial sphere indicated by the particle velocity vector at the moment it passed the Solar System at its closest point. We considered this direction to be a good approximation of the direction of arrival of the ultra-high-energy cosmic ray. The value of 500 pc was chosen arbitrarily. Using a smaller value would not affect the deviation results, but it certainly affects the number of cases in which particles pass very close to the observation point. The fraction of particles hitting such ‘blurred area’ of the Solar System is shown in the tables below in the last columns and is marked as ‘hits’.
Example trajectories for protons, the CNO group of nuclei (Z = 7) and iron, in the case of emission from Cen A, LMC and M82 and the regular magnetic field of Ref. [5] are shown in Figure 4. Each figure shows 10 cases, each of which is a realisation of a trajectory in a different turbulent field system. The scatter of these trajectories illustrates the uncertainty in our estimates of directional deviations in the Galactic fields. Detailed distributions of deviations in the equatorial coordinates (r.a.—right ascension and —declination) are shown in Figure 5. The histograms are normalised, with the values on the ordinate axis showing the probability of realising the value in a given bin. Figure 4 and Figure 5 present the results obtained for the one regular magnetic field model of the Galaxy of [5]. Another series of figures for three other models and additional three ‘suspicious’ sources would result in 108 small figures. Figure 4 and Figure 5 demonstrate the qualitative differences in the propagation of protons and heavier nuclei and show that this effect is present for different source directions.
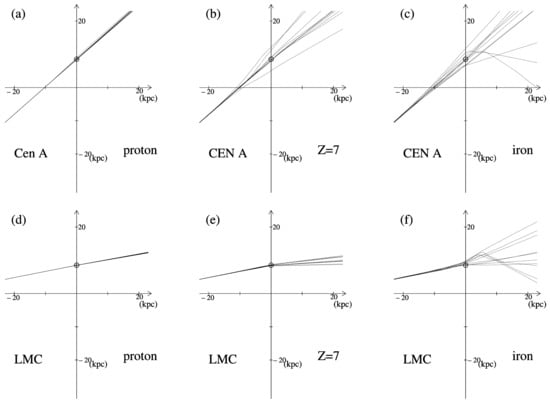
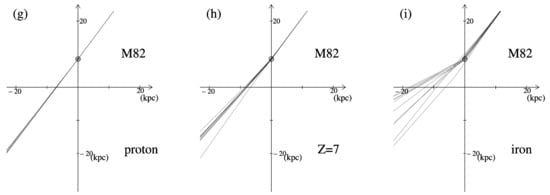
Figure 4.
Examples of trajectories (in X × Y plane) of protons (a,d), nitrogen (b,e) and iron (c,f) emitted from Cen A (top row, ), LMC (middle row ) and M82 (bottom row, ) propagated in the Galactic magnetic field model of [5] source. The axes have markers at 10 kpc intervals, with values given at 20 kpc intervals on each axis. The value of 20 kpc was chosen to avoid obscuring the trajectories; the position of the Solar System is indicated by a small circle at y = 8.5 kpc.
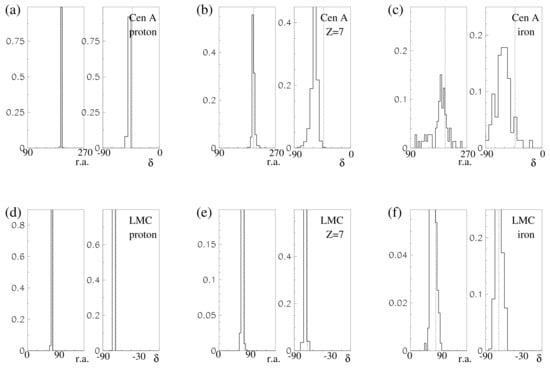

Figure 5.
Histograms showing possible deviations with respect to straight path in right ascension (r.a.) and declination of protons (a,d), nitrogen (b,e) and iron (c,f) trajectories emitted from Cen A (top row, ; ) and LMC (middle row, ; ) and M82 (bottom row, ; ) source. Vertical dashed lines are the equatorial coordinates of the sources. Galactic field is as in Figure 4.

Table 1.
Details of particle propagation in different regular field models from three UHECR sources: r.a.—is the right ascension and —declination of the source. The triangular brackets denote averaging observed particle direction over recorded events; and represent the dispersion of the corresponding observed values. The final column, labelled ‘hits’, shows the fraction of events that approached the Solar System at a distance of less than 500 pc.

Table 2.
Details of particle propagation in different regular field models from the directions of three UHECR events: two AGASA triplets and the recent, intriguing Amaterasu event [21]. Description as in the Table 1.
6. Results
Firstly, Figure 4 and Figure 5 clearly show that eV protons are deflected only slightly by the magnetic fields of the galaxy, regardless of their initial trajectory. This may not be surprising.
As can be seen in Figure 5, the deviations are clearly larger for particles with a higher charge (Z = 7). In the case of iron nuclei, propagation effects sometimes lead to the source being almost obscured at this energy, depending on the turbulent field configuration.
For each analysed combination of the direction to the source and the specific model of the regular magnetic field, the average deviation value was determined in both equatorial coordinates: right ascension and declination. The dispersion of both deviations was determined in a similar manner. It should be noted that these average values have no real physical meaning. The averaging is performed based on various possible configurations of the turbulent field; in reality, however, this configuration is unique. The dispersion shows the expected limits of deviation, but is not related to the actual particle directions of registered showers.
The final column shows the proportion of particles that leave the source and reach Earth’s vicinity by flying closer than 500 parsecs. Some galactic field models, particularly when the source is dominated by the highest-energy heavy nuclei (such as iron), suggest that it is impossible to observe any significant small-scale anisotropy in practice. It is seen in Table 1 for the model of Ref. [8] and iron nucleus propagation from M82 of LMC sources.
7. Moderate Importance of Turbulent Magnetic Field Values
Turbulent fields undoubtedly impact the deviations of cosmic ray particle trajectories, which are affected by these fields. The effect of the average value of these fields on the results of our propagation calculations is shown in Table 3.

Table 3.
Details of particle propagation in regular field model of [5] from two UHECR sources and different average turbulent magnetic filed strength.
For comparison, the deviation of the lack of turbulent magnetic fields ( μG) with only the regular component is shown. The table shows the mean values of the deviations and their dispersions for field values ranging from 0 to 8 μG. The results are given for two potential UHECR sources. The notes on the interpretation of the averages and deviations are identical to those in Table 1 and Table 2.
As expected, the mean value of the turbulent fields has the influence on the scatter of the UHECR particle trajectory deviations. As the table shows, this influence is minimal, even for iron nuclei. As shown in the last column, the proportion of UHECR particle trajectories approaching the Solar System at a distance of less than 500 pc differs significantly from 100% for large magnetic field values, particularly with regard to the propagation of iron nuclei.
8. Summary
We have performed calculations on the propagation of cosmic ray particles with extremely high energies (1020 eV), based on various Galactic magnetic field models described in the literature. Our aim was to investigate how the trajectories of UHECR deviate depending on their electric charge. Our calculations confirmed the common belief that protons with these energies move in practically straight lines. This is the foundation for the idea of ‘cosmic ray astronomy’.
However, if the charge of the cosmic ray particle is larger, it is expected to deviate more from its original direction, which would make simple interpretations of UHECR astronomy more complicated. Iron nuclei are often accepted as an alternative to primary protons. The significant deflection of iron nuclei in the magnetic fields of the Galaxy affects the results of small-scale cosmic ray anisotropy at the highest energies.
We decided to have a look at how much and in what direction UHECR particles, the ones that are emitted from a few selected potential and suspected sources, are deflected.
The main results of this study are summarised in the Figure 6.
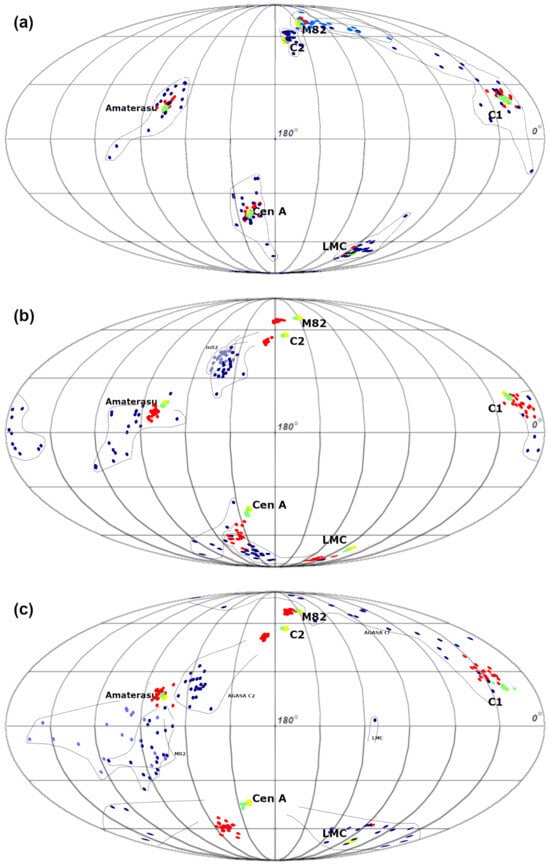
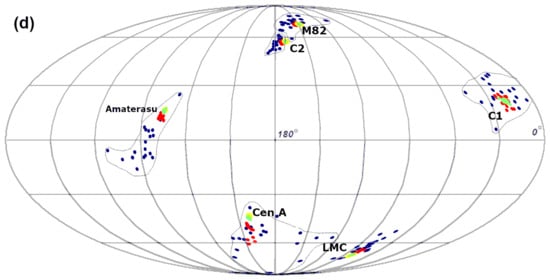
Figure 6.
Directions that would be observed if UHECRs with energies of 1020 eV (for Amaterasu 2.4 eV) were to originate from different sources, which are marked with yellow spots next to their names. These spots are hardly visible because they are mostly obscured by the green dots indicate protons. Red dots indicate CNO (Z = 7) and blue dots indicate iron nuclei. The magnetic field models are SSB (a) and ASS (b) from [3], BSS from [8] (c) and the field model from [5] (d). Some of the iron particles (shown in blue) have been highlighted in light blue to distinguish them from those originating from other nearby sources. The purpose of the contours drawn with dotted lines is to guide the eye in grouping together events that originate from the same source. They have no physical meaning.
This figure shows the directions from which the UHECR particles emitted by the exemplary postulated sources (depicted on the map as yellow spots with a radius of 2°) would reach us, assuming different models of galactic magnetic field. The directions of the protons are marked with green dots, and, as can be seen, they are contained within cones of yellow spots. For the CNO group of nuclei (Z = 7), the directions are marked with red dots. As can be seen on the map, the deviation of these directions from the sources’ positions varies considerably, reaching up to 10 ÷ 20° for, e.g., Cen A. The dark blue colour marks the directions of the recorded iron nuclei, emitted from the sources. Here, the deviations are significant.
As shown in Table 1 and Table 2, for certain field models and in specific directions, the deviations in the trajectory of heavy nuclei are so large that it is highly unlikely that such a nucleus would reach Earth’s vicinity and be registered as a giant EAS. These cases impose constraints on the mass composition of cosmic rays, as well as on models of galactic fields that allow for a heavy composition.
The Amaterasu source is of particular interest here. The particle energy here is 2.4 times higher than the particle energies we have test-emitted from other sources and shown in Figure 6. Despite this, however, the deviations of the particle trajectories, if they were iron nuclei, are very large in all field models considered.
As you can see, the directional deviation depends on the source latitude. This is due to the geometric position of the particle tracks in relation to the galactic disk. Outside of this, the field is much smaller, which is why there are small deviations for the M82 sources and for the direction to the AGASA C2 triplet.
There is also an interesting bias concerning the Cen A source. The observed directions of incoming heavy particles are deflected towards the south pole. In contrast, for the source in the Large Magellanic Cloud, the heavy nuclei are deflected northward. In some cases, they are deflected by up to 20°.
The tables show the precise results of the numerical calculations performed on the four analysed models of a regular galactic magnetic field. These results can be used to verify theories about the origin of cosmic rays and their mass composition, as well as the models themselves. Certain combinations of three variables, the mass composition of cosmic rays, specific sources and the modelled regular field, are sometimes irreconcilable. For example, the field model from Ref. [8] predicts that iron nuclei from the M82 source would not reach the Solar System, and that even if they did, they would not point to M82.
The maps in Figure 6 were prepared for all the four field models discussed in the article.
Funding
This research received no external funding.
Data Availability Statement
The original data presented in the study are available on request from the corresponding author.
Acknowledgments
Roger Clay is gratefully thanked for the inspiration and fruitful discussion.
Conflicts of Interest
The author declares no conflicts of interest.
References
- Oikonomou, F. Cosmic Ray Indirect. Rapporteur Talk of the ICRC2025 Geneva, 24 July 2025, to Appear in PoS (ICRC 2025). 2025. Available online: https://indico.cern.ch/event/1258933/contributions/6562474/ (accessed on 6 August 2025).
- Hillas, A.M. The Origin of Ultra-High-Energy Cosmic Rays. Annu. Rev. Astron. Astrophys. 1984, 22, 425–444. [Google Scholar] [CrossRef]
- Stanev, T. Ultra-high-energy Cosmic Rays and the Large-scale Structure of the Galactic Magnetic Field. Astrophys. J. 1997, 479, 290. [Google Scholar] [CrossRef]
- Alvarez-Muñiz, J.; Engel, R.; Stanev, T. Ultrahigh-Energy Cosmic-Ray Propagation in the Galaxy: Clustering versus Isotropy. Astrophys. J. 2002, 572, 185. [Google Scholar] [CrossRef]
- Prouza, M.; Šmída, R. The Galactic magnetic field and propagation of ultra-high energy cosmic rays. Astron. Astrophys. 2003, 410, 1–10. [Google Scholar] [CrossRef]
- Jansson, R.; Farrar, G.R. A New Model of the Galactic Magnetic Field. Astrophys. J. 2012, 757, 14. [Google Scholar] [CrossRef]
- Jansson, R.; Farrar, G.R. The Galactic Magnetic Field. Astrophys. J. Lett. 2012, 761, L11. [Google Scholar] [CrossRef]
- Harari, D.; Mollerach, S.; Roulet, E. The toes of the ultra high energy cosmic ray spectrum. J. High Energy Phys. 1999, 1999, 022. [Google Scholar] [CrossRef]
- Wibig, T.; Wolfendale, A.W. Heavy Cosmic Ray Nuclei from Extragalactic Sources above ‘The Ankle’. Open Astron. J. 2009, 2, 95–101. [Google Scholar] [CrossRef]
- Wibig, T. Propagation of Ultra-High Energy Cosmic Rays in Extragalactic Magnetic Fields. Open Phys. 2004, 2, 277–299. [Google Scholar] [CrossRef]
- Keivani, A. Magnetic Deflections of Ultra-high Energy Cosmic Rays from Centaurus A. Ph.D. Thesis, Louisiana State University and Agricultural and Mechanical College, Baton Rouge, LA, USA, 2013. Available online: https://repository.lsu.edu/gradschool_dissertations/2426 (accessed on 6 August 2025).
- Mollerach, S. Magnetic field effects on UHECR propagation. PoS 2025, UHECR2024, 002. [Google Scholar] [CrossRef]
- Dolgikh, K.; Korochkin, A.; Rubtsov, G.; Semikoz, D.; Tkachev, I. Images of the ultra-high energy cosmic rays from point sources. Adv. Space Res. 2024, 74, 5295–5301. [Google Scholar] [CrossRef]
- Abbasi, R.U.; Abe, M.; Abu-Zayyad, T.; Allen, M.; Anderson, R.; Azuma, R.; Barcikowski, E.; Belz, J.W.; Bergman, D.R.; Blake, S.A.; et al. Indications of intermediate-scale anisotropy of cosmic rays with energy greater than 57 Eev in the northern sky measured with the surface detector of the Telescope array experiment. Astrophys. J. 2014, 790, L21. [Google Scholar] [CrossRef]
- He, H.N.; Kusenko, A.; Nagataki, S.; Zhang, B.B.; Yang, R.Z.; Fan, Y.Z. Monte Carlo Bayesian search for the plausible source of the Telescope Array hotspot. Phys. Rev. D 2016, 93, 043011. [Google Scholar] [CrossRef]
- Pfeffer, D.N.; Kovetz, E.D.; Kamionkowski, M. Ultrahigh-energy cosmic ray hotspots from tidal disruption events. Mon. Not. R. Astron. Soc. 2016, 466, 2922–2926. [Google Scholar] [CrossRef]
- Ebisuzaki, T.; Makino, J.; Tsuru, T.G.; Funato, Y.; Portegies Zwart, S.; Hut, P.; McMillan, S.; Matsushita, S.; Matsumoto, H.; Kawabe, R. Missing Link Found? The “Runaway” Path to Supermassive Black Holes. Astrophys. J. 2001, 562, L19. [Google Scholar] [CrossRef]
- Mollerach, S.; Roulet, E. Anisotropies of ultrahigh-energy cosmic rays in a scenario with nearby sources. Phys. Rev. D 2022, 105, 063001. [Google Scholar] [CrossRef]
- Clay, R.; Wibig, T. The Large Magellanic Cloud as a source of the highest energy cosmic rays. arXiv 2025, arXiv:2507.16378. [Google Scholar] [CrossRef]
- Takeda, M.; Hayashida, N.; Honda, K.; Inoue, N.; Kadota, K.; Kakimoto, F.; Kamata, K.; Kawaguchi, S.; Kawasaki, Y.; Kawasumi, N.; et al. Small-Scale Anisotropy of Cosmic Rays above 1019 eV Observed with the Akeno Giant Air Shower Array. Astrophys. J. 1999, 522, 225. [Google Scholar] [CrossRef]
- Collaboration, T.A.; Abbasi, R.U.; Allen, M.G.; Arimura, R.; Belz, J.W.; Bergman, D.R.; Blake, S.A.; Shin, B.K.; Buckland, I.J.; Cheon, B.G.; et al. An extremely energetic cosmic ray observed by a surface detector array. Science 2023, 382, 903–907. [Google Scholar] [CrossRef] [PubMed]
Disclaimer/Publisher’s Note: The statements, opinions and data contained in all publications are solely those of the individual author(s) and contributor(s) and not of MDPI and/or the editor(s). MDPI and/or the editor(s) disclaim responsibility for any injury to people or property resulting from any ideas, methods, instructions or products referred to in the content. |
© 2025 by the author. Licensee MDPI, Basel, Switzerland. This article is an open access article distributed under the terms and conditions of the Creative Commons Attribution (CC BY) license (https://creativecommons.org/licenses/by/4.0/).