Abstract
Accurate prediction of geological hazard susceptibility forms the foundation of effective risk management, yet small-sample constraints often limit model generalization. In order to address this issue, this study applied an ensemble method based on predictive symmetry quantification, using Mount Tai, China, as a test case. Thirteen influencing factors were integrated using six machine learning algorithms—Logistic Regression (LR), Multilayer Perceptron (MLP), Random Forest (RF), Gradient Boosting Decision Tree (GBDT), eXtreme Gradient Boosting (XGB), and Support Vector Machine (SVM)—trained on 34 hazard sites. Symmetry breaking in model outputs was quantified, and XGB and MLP, which showed the lowest correlation (0.59), were selected for dynamic weighted integration. Symmetry-adjusted weighting counteracts bias from individual models. For hyperparameter tuning, grid search was employed, while SHapley Additive exPlanations (SHAP) was used to quantify factor contributions. The performance of each model was evaluated using AUC and AP metrics. The key results show that all base models performed robustly (AUC > 0.8), with XGB showing high consistency (AUC = 0.927), and the performance of the symmetry-optimized ensemble (MLP + XGB) exceeded that of all the individual models (AUC = 0.964). The dominant drivers of Geohazards included elevation, slope, the topographic wetness index, and road adjacency, with high-susceptibility zones clustered in southeastern high-altitude terrain, central mountains, and road-intensive north-central sectors. The approach presented here provides an ensemble method based on predictive symmetry quantification that is effective under the constraints of small sample sizes.
1. Introduction
Geological hazards recur globally due to the systemic asymmetries that are inherent in factors such as slope gradient, tectonic activity, and rainfall [1,2,3]. These hazards pose direct threats to socioeconomic stability by disrupting states of equilibrium [2]. However, extreme weather events cause geological hazards to be random and destructive, with complex triggers. For instance, extreme rainfall increases the risk of mudflows and landslides, while prolonged drought can loosen soil structure, affecting hazard susceptibility [4]. These hazards have diverse impacts; they damage infrastructure, degrade ecosystems, and threaten human well-being. Consequently, predicting occurrences and mapping susceptibility levels is crucial for understanding trends, implementing mitigation strategies, and reducing casualties and economic losses [5].
Traditional prediction methods rely on analyzing historical hazard data and geological factors (such as tectonics, lithology, precipitation, slope, and aspect), typically using qualitative pattern analysis [6,7,8] or statistical quantification of factor relationships [9]. While they assign weights for susceptibility evaluation, their inherent subjectivity has been criticized [10,11]. Advances in machine learning (ML) have established ML-based prediction as the mainstream approach [12,13,14]. ML models process diverse data to objectively weight factors and enhance prediction accuracy [15], employing algorithms such as Logistic Regression, Support Vector Machine, Multilayer Perceptron, and Gaussian Naive Bayes [16,17,18,19,20].
The concept of “symmetry” originates from systems science, referring to a system’s invariance under specific transformations. In the context of machine learning (ML) for geological hazard prediction, we extend this principle to characterize model robustness against feature perturbations. Ideally, different models operating on identical data distributions should yield consistent predictions. However, intrinsic algorithmic biases and feature space complexities often introduce predictive discrepancies—a disruption of ideal symmetry that is known as symmetry breaking [21,22]. This phenomenon represents a fundamental source of predictive uncertainty and inaccuracy in geospatial modeling. Our proposed symmetry optimization framework actively counteracts such breaks through strategically weighted ensemble techniques, enhancing both prediction fidelity and stability.
While individual ML models provide valuable insights, inherent architectural differences induce asymmetric responses across several dimensions: feature space interpretation, error distribution patterns, and generalization capabilities. For instance, decision tree-based Random Forest (RF) excels at capturing local feature interactions, but exhibits heightened sensitivity to noise—particularly near feature space boundaries—leading to spatially heterogeneous prediction biases. Conversely, Multilayer Perceptron (MLP) networks offer a superior global nonlinear mapping capacity, yet demonstrate vulnerability to input perturbations and local overfitting, compromising their adaptability to new samples. These asymmetries intensify under the constraints of small sample sizes, where limited feature learning restricts generalization [23].
To mitigate the asymmetry-induced limitations of single models, we employ a weighted ensemble approach based on two mechanisms: first, compensating for individual algorithm biases (e.g., overfitting-induced volatility vs. underfitting conservatism) that skew predictions; second, pairing the least-correlated models with calibrated weights to achieve complementary synergy, enhancing symmetry through balanced contributions. The resulting collective prediction outperforms all individual models in terms of reliability and performance.
Geological hazards occur frequently in the Mount Tai region due to complex natural and anthropogenic disturbances, posing severe challenges to local tourism operations and ecological conservation. These hazards not only threaten the safety of residents and tourists, but also cause potential economic losses by damaging infrastructure and disrupting ecological balance [24]. Such recurrent and impactful phenomena underscore the urgency of developing reliable susceptibility assessment models to support proactive risk management, which forms the core motivation of this study.
2. Study Area and Data
2.1. Study Area Overview
Mount Tai is located in the Tai’an Municipality, central Shandong Province, China (Figure 1). The mountain range spans approximately 200 km from east to west and 50 km from north to south, covering a total area of 25,000 hectares, with its highest peak reaching an elevation of 1545 m. The region experiences a temperate monsoon climate with distinct vertical climatic variations. Mount Tai has an annual mean temperature of 6 °C, reflecting its temperate monsoon regime with pronounced altitudinal gradients. At the mountain base, the average January temperature is −3 °C, while the average July temperature is 26 °C. At the summit, temperatures average −18 °C in January and 26 °C in July, with an annual precipitation of approximately 1132 mm. The study area lies at the southwestern edge of the Jiyang Depression, within the Luxi Uplift zone, and has been structurally dominated by persistent tilting tectonics since the Neogene, as evidenced by its three-tiered fault terraces. The region is traversed by three major faults—the Tai qian Fault, the Zhong tian men Fault, and the Yun bu qiao Fault—forming a three-tiered platform structure [25]. Due to intense neotectonic activity, geological hazards such as landslides and debris flows occur frequently, posing challenges to both tourism operations and ecological conservation in the area (Figure 1).
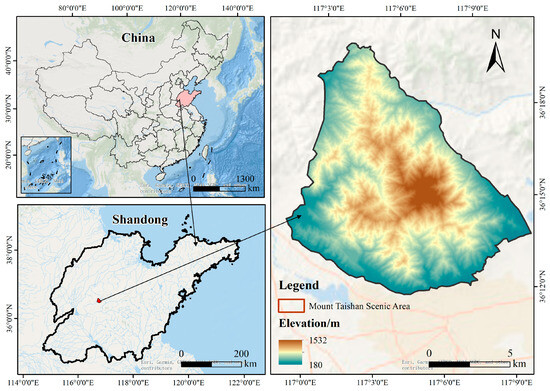
Figure 1.
The location of the study area.
2.2. Data Sources
DEM data were sourced from the GDEMV3 dataset on the Geospatial Data Cloud platform (https://www.gscloud.cn/, accessed on 20 April 2025), which enabled the derivation of various terrain parameters, including the slope gradient, aspect azimuth, relief amplitude, profile curvature, plan curvature, surface roughness, hydrographic buffers, dissection depth, and topographic wetness index. Land use data [26] were obtained from Zenodo (https://zenodo.org/, accessed on 20 April 2025). In order to derive NDVI values, Landsat 9 imagery captured in April 2024 (with 2.9% cloud cover) was acquired from the Geospatial Data Cloud and processed using near-infrared and red bands. Road network data were retrieved from OpenStreetMap (https://www.openstreetmap.org/, accessed on 25 April 2025) and subsequently clipped to the study area boundary (Supplementary Materials).
2.3. Geohazard Inventory Data
A total of 2325 geological hazard points in Shandong Province were obtained from the Resource and Environmental Science and Data Center platform (https://www.resdc.cn/Default.aspx/, accessed on 23 April 2025) (Supplementary Materials). Using ArcGIS 10.8, these provincial hazard data were clipped with the Mount Tai boundary layer, resulting in 34 hazard points within the study area. The inventory consists of 29 rockfall points and 5 landslide points.
2.4. Causative Factors
This study selected 13 influencing factors: elevation, slope, aspect, topographic relief, surface roughness, waterbody buffer, road buffer, profile curvature, plan curvature, vegetation coverage (NDVI), topographic wetness index (TWI), Land Use and Land Cover Change (LUCC), and surface dissection depth.
2.4.1. Topographic Factors
Topographic attributes critically influence the occurrence and distribution of geological hazards by governing stress states, weathering processes, hydrology, and geomorphic stability. Elevation controls the overall morphology and stress regimes within rock and soil masses, subsequently affecting weathering intensity, precipitation patterns, vegetation distribution, and flow velocity [27]. The slope gradient dictates the spatial extent of unconstrained slope faces; expanded faces amplify stress concentrations, directly promoting detachment mechanisms for landslides and rockfalls. Notably, while steep slopes are inherently unstable, moderate slopes often exhibit higher hazard susceptibility due to the combined effects of precipitation infiltration and gravity-driven forces [28]. Aspect modulates solar radiation and wind-driven moisture distribution, influencing vegetation coverage, soil moisture retention, and ultimately slope stability [29]. Topographic relief, which quantifies the variation in elevation within an area, strongly correlates with hazard proneness and scale: high-relief areas are susceptible to large-scale events, whereas low-relief areas typically experience smaller-scale hazards [30]. Surface roughness, defined as the ratio of surface area to planar area, governs ground irregularity and exerts dominant control over flow velocity relative to the discharge rate and slope angle, significantly impacting erosion intensity [31]. Curvature parameters further refine topographic influence: profile curvature (perpendicular to contours) modulates landslide dynamics by altering driving forces and shear resistance, while plan curvature (parallel to contours) delineates terrain concavity—convergent zones enhance moisture retention via runoff convergence, catalyzing pore-pressure buildup, which eventually triggers failure [32]. Finally, a greater surface dissection depth reduces soil stability and enhances erosion potential [33]. The interplay of these factors creates complex spatial patterns of hazard susceptibility.
2.4.2. Hydrological Factors
River buffer zones represent transitional areas between terrestrial and aquatic ecosystems, with their width varying according to river size. Fluvial processes such as lateral erosion and scouring weaken the mechanical properties of bank materials, increasing slope steepness and reducing stability. For three major geological hazards—landslides, debris flows, and rockfalls—the frequency of their occurrence and their spatial density within river buffers exhibit a clear negative correlation with their distance from the river channel. Both the number of hazard points and their distribution density decrease progressively as the distance from the watercourse increases [34].
2.4.3. Anthropogenic Factors
Road buffer zones refer to designated areas that are situated adjacent to roadways. Similarly to in river buffer zones, the frequency of geological hazards in these zones exhibits an inverse relationship with their distance from roads: the hazard occurrence probability decreases with increasing buffer distance. Empirical data demonstrate that landslide density reaches its minimum when the road buffer extends beyond 120 m [35].
2.4.4. Vegetation Factors
The Normalized Difference Vegetation Index (NDVI) is derived by calculating the reflectance of vegetation in the red and near-infrared spectral bands, serving as an indicator of vegetation coverage. Geological hazards are predominantly concentrated in areas with lower vegetation coverage, with the highest frequency of hazard occurrences observed in regions exhibiting 20% to 60% vegetation coverage [36].
Anthropogenically modified land cover fundamentally alters geohazard predisposition patterns. In urban areas, impervious surfaces accelerate surface runoff concentration, thereby increasing flood risks. Vegetation degradation compromises soil cohesive strength through root network reduction, thereby amplifying slope instability and mass wasting frequency [37] (Figure 2).
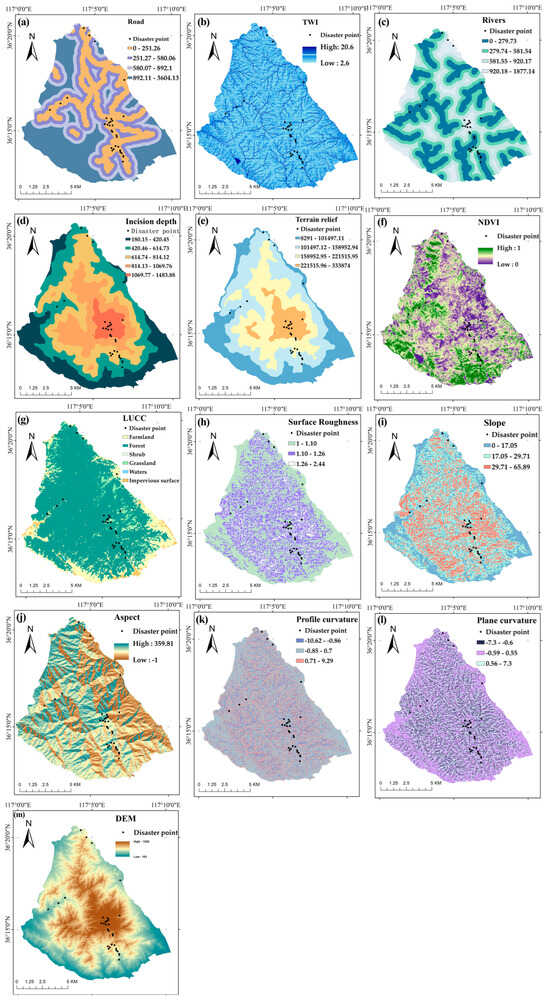
Figure 2.
The DCFs selected in this study: (a) roads, (b) TWI, (c) rivers, (d) incision depth, (e) terrain relief, (f) NDVI, (g) LUCC, (h) surface roughness, (i) slope, (j) aspect, (k) profile curvature, (l) plane curvature, and (m) DEM.
3. Methodology
3.1. Spearman’s Rank Correlation Analysis
Collinearity among different hazard-inducing factors may adversely affect the stability and accuracy of machine learning models in geological hazard prediction. To mitigate this issue, Spearman’s rank correlation analysis was employed to identify and eliminate highly correlated factors, thereby reducing multicollinearity problems.
The Spearman correlation coefficient (Rs) is calculated as follows:
where the variables correspond to those defined in Equation (1):
Rs: Spearman’s rank correlation coefficient.
di = R(Xi) − R(Yi): The rank difference between the i-th data point for variables X and Y.
n: The total number of data points.
R(Xi) and R(Yi): The ranks of X and Y for the i-th data point.
Spearman’s rank correlation coefficient method was employed to assess the interrelationships among the 13 geographical factors; the resulting Rs values were in the range of [−1, 1]. An Rs value of −1 indicates a perfect negative correlation between two variables, and Rs = 1 signifies a perfect positive correlation, while Rs = 0 denotes the complete absence of any statistical association between the examined factors. As a distribution-free method, Spearman’s Rs quantifies monotonic dependencies through rank concordance analysis, delivering distributionally invariant correlation estimates even when applied to skewed geospatial data, as is common in hazard studies. The coefficient’s magnitude reflects correlational strength (with absolute values approaching 1 indicating stronger associations), while its sign determines the directionality of the observed relationship.
3.2. Modeling Framework
3.2.1. Base Models
Support Vector Machine (SVM)
Support Vector Machine (SVM) is a binary classification model whose fundamental principle involves positioning an optimal hyperplane within the feature space to segregate positive and negative samples. The model achieves maximal discriminative power by maximizing the margin between the hyperplane and the closest data points from both classes (support vectors), thereby enhancing generalization capability.
Random Forest (RF)
The Random Forest (RF) algorithm, as an ensemble learning method, is widely applied in geological hazard prediction and related fields. The algorithm employs Bootstrap resampling, iteratively drawing n samples with replacement from the source dataset to construct distinct training subsets for each decision tree. Each decision tree in the forest is independently trained on these diverse subsets using randomly selected feature sets. The final prediction is determined through majority voting among all the constituent decision trees [38].
Logistic Regression (LR)
The Logistic Regression model shares fundamental similarities with multiple linear regression, while differing primarily in its dependent variable. Specifically designed for binary classification problems, this model has gained increasing recognition among researchers, leading to its widespread application in the field of geological hazard prediction [39].
Gradient Boosting Decision Tree (GBDT)
The Gradient Boosting Decision Tree (GBDT) model is an ensemble learning algorithm based on decision trees. This predictive model consists of a series of weak learners, typically decision trees, which are sequentially trained to fit residual errors. In the GBDT framework, each new decision tree model is trained using the steepest gradient descent method to approximate the residuals from the previous step. All the tree outputs undergo additive integration via sequential residual fitting, culminating in the ensemble prediction [40].
Multilayer Perceptron (MLP)
Multilayer Perceptron (MLP) is a foundational feedforward neural network architecture that is extensively used for predictive analytics in classification and regression tasks across various scientific fields [41]. The model is structured hierarchically with three key components: (1) an input layer that processes feature data, (2) hidden layers that apply nonlinear transformations using activation functions, and (3) an output layer that produces the final predictions. The learning process of MLP involves advanced optimization techniques to adjust the weights between neurons, including backpropagation for error gradient calculation and gradient descent for loss minimization [42]. These mechanisms enhance the model’s predictive accuracy and reliability.
eXtreme Gradient Boosting (XGBoost)
Chen’s XGBoost model (2016) [43] represents a state-of-the-art solution, achieving 5.8× faster computation than standard GBDT in geohazard scenarios. This advanced ensemble algorithm operates by iteratively generating new decision trees that specifically target and minimize the residual errors from previous predictions. Through this sophisticated gradient boosting framework combined with regularization techniques, XGBoost systematically reduces both bias and variance in the model, thereby achieving superior predictive accuracy compared to conventional boosting methods.
3.2.2. Adaptive Weighted Ensemble Model
Ensemble learning methods refer to the strategic combination of multiple individual base models to compensate for the limitations of any single model, which thereby improves overall predictive performance and robustness [44]. Heterogeneous base model predictions directly counteract feature underrepresentation in small-sample geospatial studies [45].
We introduce an adaptively weighted fusion architecture where integration weights evolve with model performance metrics. The framework primarily conducts correlation analysis based on the prediction results of different base models, selecting the group of base models with the lowest correlation for weighted integration. The weight values of the two models are dynamically adjusted, with the sum of weights constrained to 1 and each weight limited to the range of 0.05–0.95. This constraint prevents absolute dominance by any single model, while ensuring that all the selected models contribute meaningfully to the ensemble—a strategy that has been empirically validated by Kuncheva and Whitaker (2003), who demonstrated that maintaining minimum classifier contributions (5–10%) preserves ensemble diversity and improves robustness [45]. Furthermore, Zhou (2025) showed that this strategy of bounded weight allocation helps to balance the bias–variance tradeoff in heterogeneous ensembles, particularly under small-sample conditions [44]. The optimal weight combination is ultimately determined by selecting the set that yields the highest AUC value through systematic validation. The specific procedural steps are as follows.
Prediction Correlation Analysis
Model pairs with minimal prediction–output correlation (not feature correlation) are selected for integration. This strategy involves measuring functional redundancy through output divergence [46], bypassing input feature dependencies. The correlation of prediction results is calculated using the following formula (Equation (2)):
Here, represent the prediction probability vectors of the two models under comparison. The selection criterion focuses on identifying the model pair with the smallest absolute correlation value , thereby minimizing inter-model dependency and maximizing ensemble diversity. This strategy ensures that the combined models exhibit complementary predictive behaviors, reducing redundancy and enhancing generalization performance in geological hazard prediction tasks.
Weighted Ensemble Definition
Given the prediction probabilities from two distinct models, denoted as and , the final ensemble prediction is computed as their dynamically weighted average. This approach allows for adaptive adjustment of model contributions based on their relative performance and complementarity. The weighting mechanism ensures that neither model dominates entirely (avoiding over-reliance on a single predictor), while maintaining an optimal balance to enhance predictive accuracy. Specifically, the ensemble output is derived through Equation (3), with the weights constrained by Equation (4):
The weights satisfy
Weight Optimization
To systematically identify the optimal weighting configuration, we generated 20 candidate weight combinations within a symmetry-preserving constraint space (0.05 to 0.95 per model). This design ensured a minimum 5% contribution threshold for each model, preventing dominance by any single predictor and actively preserving ensemble symmetry. This symmetry safeguard is critical for maintaining model diversity and enhancing prediction stability in geohazard susceptibility assessment.
For each candidate weight pair (), where , the predictive performance was rigorously evaluated by computing the Area Under the Curve (AUC) metric based on validation data. The weight combination yielding the maximum AUC value was selected as the final optimized solution. The mathematical formulation of this selection criterion is given in Equation (5):
The mathematically derived optimal weights, denoted as , represent the specific weight combination that maximized the Area Under the Curve (AUC) metric during validation.
Argmax represents the parameter value that maximized the objective function.
The adaptive weighted ensemble technique integrates multiple base models via dynamic weighting, enhancing predictive performance and stability. It counterbalances variance from individual predictors and mitigates the impacts of noise and outliers through targeted weight allocation. This method preserves interpretability by quantifying the competence of each base model, enabling the traceability of predictions, identification of systemic weaknesses, and refinement of modeling strategies. This retention of interpretability is vital for geohazard prediction in geology and geography.
3.3. Hyperparameter Tuning Methods
Grid search was applied across six machine learning models to fine-tune hyperparameters, with Random Forest used as an illustrative example. We established a grid with five key hyperparameters: n_estimators, max_depth, min_samples_split, min_samples_leaf, and max_features. The GridSearchCV tool with 5-fold cross-validation was used to assess each configuration and optimize the hyperparameters in order to produce the highest AUC score. This approach ensured that an exhaustive search was conducted for the best hyperparameter set, which was crucial for enhancing our model’s predictive accuracy in geological hazard assessments.
3.4. Validation Approaches
3.4.1. SHAP (SHapley Additive exPlanations)
The SHAP (SHapley Additive exPlanations) model, which was originally proposed by Lundberg, is based on game theory [47]. For our small-sample study (n = 34), we implemented three safeguards to ensure reliable interpretations: (1) Tree SHAP’s exact calculations for the XGB/RF/GBDT models provided deterministic results that were unaffected by sample size; (2) global feature importance aggregation reduced single-prediction volatility; and (3) cross-validation of factor rankings confirmed >90% consistency for the top contributors (road buffers/TWI). These measures collectively addressed small-sample limitations, while preserving SHAP’s explanatory power. The specific formula is as follows:
In the formula, s represents one of the feature subsets that does not include feature k; |s| indicates the number of features in subset s; is the value function of feature subset s, representing the prediction value of the machine learning model on feature subset s; denotes the value function after adding feature k to subset s; and ! represents the Shapley weight value.
3.4.2. AUC-ROC Curve Analysis
The Receiver Operating Characteristic (ROC) curve, with its associated Area Under the Curve (AUC) value, is a widely used measure for assessing the performance of binary classifiers. This graphical representation plots the true positive rate (sensitivity) on the y-axis against the false positive rate (1 − specificity) on the x-axis. The AUC value represents the Area Under the ROC Curve. When the AUC value is greater than 0.5 and closer to 1, it indicates better predictive accuracy of the model. An AUC value equal to 0.5 suggests that the model has no classification capability, while an AUC value below 0.5 indicates that the model’s predictive performance is worse than random guessing. Equation (7) computes the true positive rate (TPR), while Equation (8) determines the false positive rate (FPR).
The Area Under the Curve (AUC) of the Receiver Operating Characteristic (ROC) curve serves as a key performance measure for binary classifiers. Here, P is the total number of actual positive samples, N the total number of actual negatives, TP is the count of correctly identified positives, and FP is the number of negatives misclassified as positives. Equation (9) provides the formal definition of the AUC:
where m represents the number of distinct thresholds; and denote the true positive rate and the false positive rate at the i-th threshold, respectively; and and represent the true positive rate and the false positive rate at the (i + 1)-th threshold. This trapezoidal integration method computes the AUC by summing the areas of consecutive trapezoids defined by adjacent threshold points, offering a reliable numerical approximation of the Area Under the ROC Curve.
3.5. Experimental Design
The methodological framework used in this study is shown in Figure 3. Positive samples in the model dataset consisted of geohazard occurrence points acquired from the Resources and Environmental Science and Data Platform. Thirteen influencing factors were extracted as model training data through processing DEM elevation data using ArcGIS 10.8 and ENVI 5.6. Following data preprocessing, Spearman’s correlation analysis was employed to examine the interrelationships among the 13 factors, and highly correlated factors were subsequently eliminated.
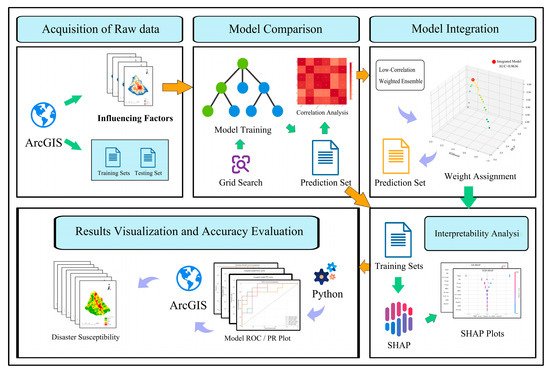
Figure 3.
The methodological framework used in this study.
The remaining factors were then used as input for training six distinct machine learning models. For parameter optimization, a grid search method was systematically applied to each model to identify optimal hyperparameters. Post-training, the prediction results underwent correlation analysis, and the two models exhibiting the lowest correlation coefficients were selected for ensemble modeling.
The study employed ArcGIS for spatial visualization of the outputs from all six individual models and the ensemble model. ROC curves were generated and AUC values were compared to evaluate the performance of each model. The contribution of individual influencing factors to predictions was quantified by applying SHAP (SHapley Additive exPlanations) analysis to the optimal model (selected based on the highest AUC). The influencing factors were subsequently ranked based on their SHAP values, providing insights into their relative importance to the model’s predictive capability.
4. Results
4.1. Correlation Analysis Results
The correlation analysis results of the 13 influencing factors are presented in Figure 4. According to correlation theory, factors are generally considered to exhibit no strong inter-correlation when the coefficient values are below 0.7 [48]. The analysis revealed extremely high correlations between specific factor pairs: DEM data showed correlation coefficients of 1 and 0.99 with topographic relief and dissection depth, respectively, while dissection depth demonstrated a perfect correlation (r = 1) with topographic relief. Similarly, slope exhibited complete collinearity (r = 1) with surface roughness. Based on these findings, we eliminated three topographic factors—surface roughness, topographic relief, and dissection depth—and retained ten relatively independent causative factors for subsequent model training.
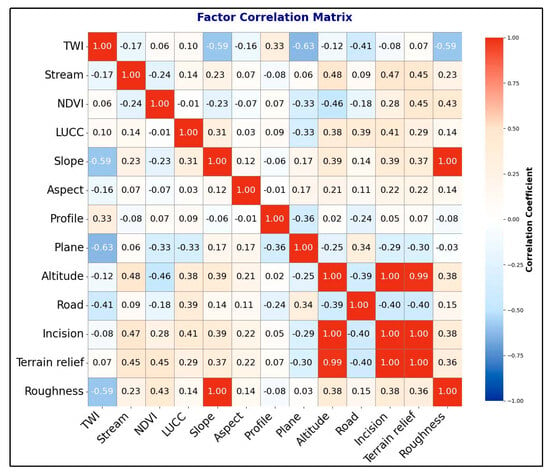
Figure 4.
Correlation analysis of impact factors.
4.2. SHAP Interpretation Results
The modeling dataset comprised 68 samples, with 34 actual hazard sites labeled as “1” and an equivalent number of artificially generated negative samples (34) from low-hazard-susceptibility zones labeled as “0”. The data were divided into training (70%) and evaluation (30%) sets to facilitate model construction and assessment.
As can be seen in Figure 5, SHAP (SHapley Additive exPlanations) analysis provides distinct advantages in quantifying the contributions of individual features to machine learning outputs. SHAP analysis of the Logistic Regression model revealed the following importance ranking for terrain factors: road buffer zones were the most influential predictor, followed by surface weakness, elevation, slope gradient, plan curvature, vegetation coverage, river buffer zones, and profile curvature. Land use type and aspect orientation contributed the least. This hierarchical pattern of factor importance aligns well with previous findings for SHAP-based contribution rankings [49], confirming the methodological robustness of our approach.
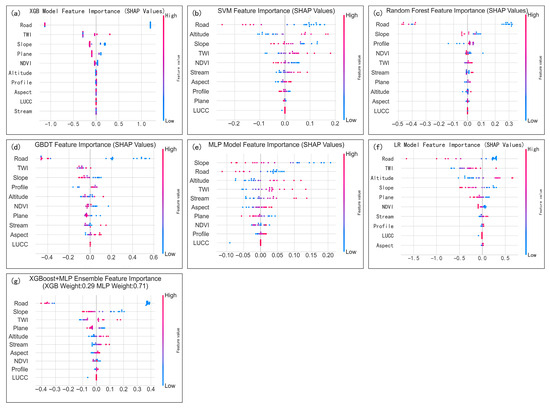
Figure 5.
A summary of the SHAP values of the six individual models and the MLP + XGB integrated model. (a) XGB, (b) SVM, (c) RF, (d) GBDT, (e) MLP, (f) LR, and (g) XGB + MLP.
4.3. Individual vs. Ensemble Model Performance
In the accuracy assessment phase of our study, both ROC curves and PR curves, as shown in Figure 6, were employed as evaluation metrics. The results demonstrate that the XGB and LR models achieved the highest AUC values of 0.927 and 0.918, respectively, indicating their superior predictive performance. The SVM model followed closely, with an AUC of 0.891, while the RF, GBDT, and MLP models yielded progressively lower AUC values of 0.855, 0.845, and 0.827, respectively.
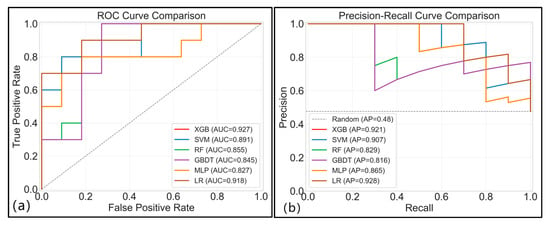
Figure 6.
Model performance comparison: (a) a comparison of the ROC curves of the six machine learning models; (b) a comparison of the PR curves of the six machine learning models.
Similarly, analysis of the precision–recall (PR) curves, as shown in Figure 6, reveals consistent patterns, with the XGB and LR models maintaining outstanding performance in both their precision and recall metrics. Their average precision (AP) scores reached 0.921 and 0.928, respectively. The SVM model achieved the highest AP of 0.907, followed by the MLP (0.865), RF (0.829), and GBDT (0.816) models, showing a performance hierarchy that corroborates the ROC curve findings.
Building upon the individual models, we pursued a weighted ensemble approach focused on minimizing correlation. Correlation analysis of all six model outputs (Figure 7) revealed that XGB and MLP exhibited the lowest inter-model correlation (r = 0.59), making them prime candidates for ensemble integration. Consequently, these two models were selected for ensemble construction.
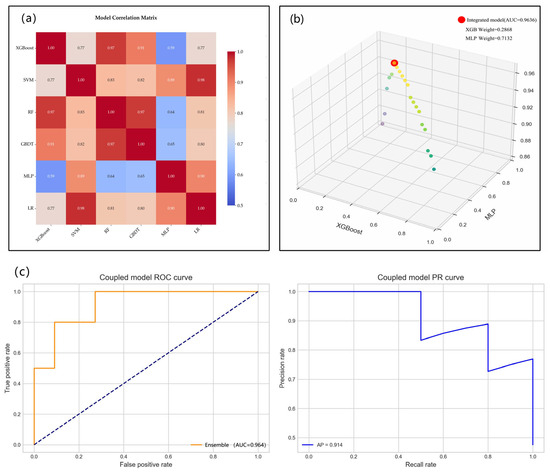
Figure 7.
Integrated model optimization process: (a) correlation analysis of the six models’ prediction results; (b) the weight distribution of the integrated model; (c) the ROC curve and PR curve for the integrated model.
Optimized weights (XGB = 0.2868, MLP = 0.7132), determined through systematic accuracy maximization, were applied to combine model predictions in order to maximize predictive accuracy. As illustrated in Figure 7, through iterative optimization, the optimal weight configuration was determined to be 0.2868 for the XGB model and 0.7132 for the MLP model. The ensemble’s superior AUC (0.96) reflects this model’s decisive advancement in performance compared to that of the stand-alone models.
Integrating both evaluation metrics, as shown in Figure 7, reveals that the dynamically weighted ensemble model demonstrates superior performance, with both the highest AUC value and PR metrics that are comparably excellent among all the tested approaches. Comparative analysis of the ensemble versus individual models, also illustrated in Figure 7, yields the following comprehensive performance ranking (in descending order): XGB + MLP ensemble > XGB > LR > SVM > MLP > RF > GBDT. This performance hierarchy validates our optimized weighting strategy, which successfully combines the predictive strengths of individual models while offsetting their limitations.
4.4. Geospatial Visualization of Model Outputs
The Natural Breaks method was employed using ArcGIS (Figure 8). The susceptibility levels were categorized into five distinct classes: very low, low, moderate, high, and very high susceptibility; this enabled systematic visualization and comparison across all seven modeling approaches. The quantitative distribution of susceptibility classes for each model is presented in Table 1. The synthesized results from all models, as illustrated in Figure 8, consistently identify concentrated zones of high and very high susceptibility, predominantly located in three key areas: (1) the southeastern region, with the highest elevation; (2) the central mountainous area; and (3) the north-central sector, adjacent to major transportation corridors. This spatial clustering demonstrates the joint effects of extreme topography and anthropogenic infrastructure on susceptibility.
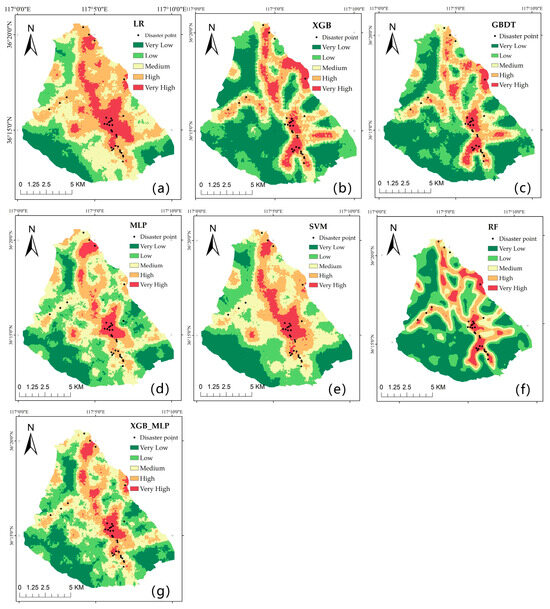
Figure 8.
The geological disaster prediction results of the different models: (a) LR, (b) XGB, (c) GBDT, (d) MLP, (e) SVM, (f) RF, and (g) XGB_MLP.

Table 1.
The prediction results of the seven models.
4.5. Model Adaptability Verification
The predictive adaptability of three models (LR, XGB, and XGB + MLP ensemble) was assessed by quantifying the proportion of known hazard points within high-to-very-high-susceptibility zones. The results show capture rates of 97%, 88%, and 85% for these three models, respectively (Figure 9), indicating that they all performed well.
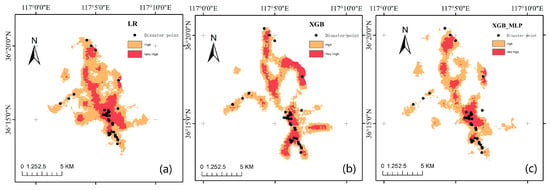
Figure 9.
The distribution of disaster points in high-risk areas: (a) the LR model, (b) the XGB model, and (c) the integrated model.
Notably, while the symmetry-optimized ensemble exhibited superior overall discriminative power, as evidenced by its higher AUC (0.964) and AP (0.914), LR had a higher rate of capturing known hazard points. This discrepancy can be attributed to inherent differences in model behavior.
LR, which has linear decision boundaries, adopts a conservative approach, classifying larger areas as having high-to-very-high susceptibility. This boosts recall, but reduces precision. In contrast, the ensemble integrates the strengths of XGB and MLP, optimizing nonlinear patterns and symmetry in order to focus on truly high-risk zones; thus, this model prioritizes precision (with the compromise of slightly lower recall), and its higher AUC confirms its superior risk-ranking ability. This reflects a tradeoff: LR prioritizes broad coverage, while the ensemble emphasizes accurate risk stratification.
5. Discussion
5.1. Predictive Accuracy Across Models
Sample size is a critical factor governing model fitting quality in geological hazard prediction. Empirical evidence confirms that larger datasets enhance predictive stability by (1) improving feature space coverage, (2) reducing parameter estimation variance, and (3) mitigating dimensionality-induced instability [50]. Conversely, sparse data amplify overfitting risks when model complexity exceeds sample support, while constraining generalization through incomplete feature representation [51].
Our susceptibility analysis implemented six machine learning architectures: LR, RF, GBDT, MLP, and SVM. All models underwent grid search optimization with 5-fold cross-validation. Spearman correlation analysis revealed striking algorithmic symmetry among the tree-based ensembles (XGB, GBDT, RF; ρ = 0.97–0.98), attributable to the following shared characteristics: (1) decision tree foundations, (2) greedy feature-splitting behaviors converging on dominant predictors, and (3) similar adaptation to low sample-dimension ratios (n/p < 1), where strong features dictate decision boundary convergence [52].
The MLP architecture fundamentally disrupted this predictive symmetry through hidden-layer nonlinear activations (ReLU), enabling global pattern mapping, which is absent from tree-based methods. L2 regularization further balanced overfitting resistance and feature sensitivity. Contrastingly, XGB’s gradient boosting constructed piecewise-constant prediction regions via additive trees with explicit structural constraints. These architectural asymmetries yielded substantially decorrelated predictions between MLP and XGB (r = 0.59) [53], establishing ideal conditions for complementary ensemble integration.
The observed decorrelation symmetry enabled strategic ensemble construction through (1) complementary strength allocation (XGB’s local feature proficiency vs. MLP’s distributed signal sensitivity), (2) differential noise–feature response, and (3) divergent regularization philosophies (XGB’s structural vs. MLP’s parametric). The equilibrium-optimized weights (MLP: 0.7132, XGB: 0.2868) reflect MLP’s superior weak-feature performance. The resultant ensemble achieved balanced performance superiority (AUC = 0.964, AP = 0.914), surpassing all the individual models (best single model: XGB, with AUC = 0.927), confirming that integrating decorrelated learners enhance prediction through variance reduction and compensatory learning.
5.2. Factor Importance Evaluation
Geohazard mechanisms exhibit inherent complexity, precluding universal standards for causative factor selection or importance ranking across diverse study areas and models [50]. For our causative factor selection, we initially considered 13 factors: elevation, slope, aspect, profile curvature, plan curvature, surface roughness, NDVI, TWI, dissection depth, road buffer zones, river buffer zones, LUCC, and topographic relief. The unique geological characteristics of the Mount Tai study area—a predominantly homogeneous granite lithology, with minimal fault lines—led us to exclude commonly used factors, like lithology and fault buffers, that showed limited relevance here. We conducted correlation analysis on these 13 factors and identified strong collinearity among topographic relief, dissection depth, surface roughness, and elevation; subsequently, we removed surface roughness, dissection depth, and topographic relief, and retained 10 independent factors for modeling. SHAP analysis of our top-performing models (LR, XGB, and XGB + MLP) revealed road buffers, TWI, slope, and elevation to be the most influential factors for susceptibility prediction, demonstrating how combined anthropogenic and topographic factors critically impact slope stability. This provides valuable evidence for targeted hazard prevention strategies.
Importantly, factor importance varied substantially by model: XGB showed dispersed SHAP values for road buffers and TWI, with minimal clustering of other factors, reflecting its tree-based sensitivity to complex feature interactions; LR’s linear assumptions produced more balanced SHAP distributions; MLP demonstrated weights of uniform importance, thanks to its ability to capture complex feature combinations without demonstrating extreme nonlinear responses like those produced by XGB; and the XGB + MLP ensemble exhibited intermediate SHAP values thanks to its combination of XGB’s feature segmentation with MLP’s nonlinear representation capacity.
These model-dependent variations in factor importance stem from fundamental algorithmic differences: XGB’s decision trees excel at identifying local strong features through recursive partitioning, but may overlook subtle global patterns; LR’s linear framework captures dominant trends, while smoothing extreme effects; MLP’s neural network architecture detects distributed weak predictors through hidden-layer transformations; and the ensemble balances these strengths. In the case of Mount Tai, conventional factors (e.g., lithology) showed limited relevance, whereas anthropogenic elements (road buffers) proved to be critical predictors. SHAP-derived rankings deliver actionable hazard management insights, necessitating model-specific interpretation of geospatial predictors. The SHAP-based importance rankings provide actionable insights for regional hazard management, while highlighting the need for model-specific interpretation of geospatial predictors in susceptibility mapping. These results advance methodological best practices by demonstrating how to reconcile model-agnostic geological knowledge with algorithm-specific factor importance patterns in hazard assessment.
6. Conclusions
Geological hazards in the Mount Tai region exhibit an uneven distribution pattern. They are predominantly concentrated near the main peak, “Yuhuangding”, and the northern rear mountain areas. Furthermore, the western ascending mountain roads have also been identified as high-risk zones. Analysis of SHAP values across various models indicates that road buffer zones, elevation, the topographic wetness index (TWI), and slope gradient serve as the primary triggering factors for these hazards. Among these, road buffer zones have the most pronounced influence. Unreasonable practices during mountain road construction, involving extensive excavation and backfilling of rock and soil, have altered the original landforms and geological structures. These changes have modified the stress fields within the rock and soil masses, significantly elevating the risk of geological hazards. Additionally, slopes adjacent to roads, which have been destabilized by excavation activities, have experienced a reduction in shear strength, further increasing their susceptibility. The impact of elevation is most evident near the main peak. The Jade Emperor Summit area features greater topographic relief and steeper slopes, making it inherently more vulnerable. Areas with higher TWI values typically exhibit greater potential for concentrated surface runoff and elevated soil moisture. This saturation reduces soil shear strength, thereby destabilizing rock and soil masses and increasing hazard susceptibility.
This study employed six individual models, alongside one symmetrically optimized weighted ensemble model, to assess their effectiveness in predicting geological hazard susceptibility within the Mount Tai area. Among the individual models, the XGB and LR models demonstrated strong performance. Furthermore, a correlation analysis was used to select the two individual models with the lowest correlation for integration into the ensemble model. This ensemble approach yielded superior results, outperforming all six individual models. The ensemble model’s enhanced performance makes it notably more reliable for practical application. Critically, this weighted integration strategy also improves model robustness when working with limited sample sizes, offering a viable method for geological hazard prediction in data-scarce scenarios.
Combining machine learning with remote sensing data leverages the real-time monitoring capabilities of remote sensing alongside the efficient analytical power of computational models. This integration has the potential to significantly enhance the accuracy and timeliness of geological hazard assessments, providing a stronger foundation for disaster mitigation efforts. Moreover, the cross-disciplinary convergence of machine learning and geological hazard prediction fosters innovative research, enabling more rational allocation of mitigation resources and improved disaster management efficiency. Ultimately, this approach can help to reduce the destructive impact of natural disasters on human settlements, infrastructure, and property, safeguarding socioeconomic stability and the continuity of daily life.
Supplementary Materials
The following datasets used in this study are publicly available: Digital Elevation Model (DEM) data from the Geospatial Data Cloud (https://www.gscloud.cn/), land use data from Zenodo (https://zenodo.org/), NDVI data derived from Landsat 9 imagery (Geospatial Data Cloud), and road networks from OpenStreetMap (https://www.openstreetmap.org/). Geological hazard inventory data were obtained from the Resource and Environmental Science and Data Center Platform (https://www.resdc.cn/Default.aspx).
Author Contributions
Conceptualization, Z.Z. and B.C.; methodology, Z.Z. and P.L.; software, Z.Z. and P.L.; validation, Z.Z., P.L., X.D. and Z.J.; formal analysis, Z.Z. and P.L.; investigation, Z.Z., P.L., C.F., X.T. and Y.Z.; resources, B.C., X.D. and Z.J.; data curation, Z.Z., C.F., F.C. and X.T.; writing—original draft preparation, Z.Z.; writing—review and editing, B.C., X.D., Z.J. and C.F.; visualization, Z.Z. and C.F.; supervision, B.C., X.D. and Z.J.; project administration, B.C.; funding acquisition, B.C. All authors have read and agreed to the published version of the manuscript.
Funding
This research was funded by the National Natural Science Foundation of China, under grant number 42201006; by the Open Fund (DGERA 20221105) of the Key Laboratory of Deep-time Geography and Environment Reconstruction and Applications of the Ministry of Natural Resources, Chengdu University of Technology; and by the Liaocheng University College Students innovation and Entrepreneurship Project (CXCY2024055).
Data Availability Statement
All data used in this study are publicly accessible. The Digital Elevation Model (DEM) data were obtained from the Geospatial Data Cloud, land use data were taken from Zenodo, NDVI data were derived from Landsat 9 imagery via the Geospatial Data Cloud, and road network data were taken from OpenStreetMap. The geological hazard inventory data were sourced from the Resource and Environmental Science and Data Center Platform. No private or sensitive information is disclosed in this study. The code used in this study is available from the corresponding author upon reasonable request.
Acknowledgments
We sincerely thank all the researchers and institutions that contributed to this study. We give special thanks to our colleagues for their valuable discussions and technical support. We also appreciate the constructive comments from the reviewers and editors, which significantly improved the quality of this manuscript.
Conflicts of Interest
The author Fuhai Cui was employed by the company Heze Municipal Water Conservancy Survey and Design Institute. The remaining authors declare that the research was conducted in the absence of any commercial or financial relationships that could be construed as a potential conflict of interest.
References
- Mokhtari, M.; Faridi, P.; Masoodi, M.; Ahmadi, S.M. Perspective chapter: A global view of natural hazards related disasters. In Natural Hazards-New Insights; IntechOpen: London, UK, 2023. [Google Scholar]
- Xiao, W.; Zhou, Z.; Ren, B.; Deng, X. Integrating spatial clustering and multi-source geospatial data for comprehensive geological hazard modeling in Hunan Province. Sci. Rep. 2025, 15, 1982. [Google Scholar] [CrossRef] [PubMed]
- Comegna, L.; Rianna, G.; Sequino, G.; Reder, A.; Picarelli, L.; Urciuoli, G. Climate change and landslide hazard in stiff clays and clay shales. Landslides 2025. [Google Scholar] [CrossRef]
- Chae, B.-G.; Park, H.-J.; Catani, F.; Simoni, A.; Berti, M. Landslide prediction, monitoring and early warning: A concise review of state-of-the-art. Geosci. J. 2017, 21, 1033–1070. [Google Scholar] [CrossRef]
- Handy, R.L. The arch in soil arching. J. Geotech. Eng. 1985, 111, 302–318. [Google Scholar] [CrossRef]
- Shao, C.; Liu, Y.; Lan, H.; Li, L.; Liu, S.; Yan, Z.; Li, Y. Spatiotemporal distribution characteristics, causes, and prevention advice of fatal geohazards in Jiangxi Province, China. Sci. Total Environ. 2022, 834, 155337. [Google Scholar] [CrossRef]
- Jiang, Y.; Wang, J.; Yuan, X.; Wang, R. Analysis of the geomorphology and environmental geological problems of Huzhou on the Yangtze River delta. Acta Geol. Sin.-Engl. Ed. 2004, 78, 808–812. [Google Scholar] [CrossRef]
- Pandey, A.C.; Singh, S.K.; Nathawat, M.S. Waterlogging and flood hazards vulnerability and risk assessment in Indo Gangetic plain. Nat. Hazards 2010, 55, 273–289. [Google Scholar] [CrossRef]
- Huang, P.; Peng, L.; Pan, H. Linking the random forests model and GIS to assess geo-hazards risk: A case study in Shifang County, China. IEEE Access 2020, 8, 28033–28042. [Google Scholar] [CrossRef]
- Chen, B.; Wei, N.; Qu, T.; Zhang, L.; Li, Y.; Long, X.; Lin, Y. Research on weighting method of geological hazard susceptibility evaluation index based on apriori Algorithm. Front. Earth Sci. 2023, 11, 1127889. [Google Scholar] [CrossRef]
- Thapa, I.; Ghani, S.; Kumari, S.; Choudhary, A.; Sivenas, T.; Asteris, P.G. Geotechnical Characterization and Stability Prediction of Nano-Silica-Stabilized Slopes: A Machine Learning Approach to Mitigating Geological Hazards. Transp. Infrastruct. Geotechnol. 2025, 12, 89. [Google Scholar] [CrossRef]
- Ahmad, H.; Ningsheng, C.; Rahman, M.; Islam, M.M.; Pourghasemi, H.R.; Hussain, S.F.; Habumugisha, J.M.; Liu, E.; Zheng, H.; Ni, H. Geohazards susceptibility assessment along the upper indus basin using four machine learning and statistical models. ISPRS Int. J. Geo-Inf. 2021, 10, 315. [Google Scholar] [CrossRef]
- Yu, B.; Xing, H.; Yan, J.; Li, Y. Small-scale, large impact: Utilizing machine learning to assess susceptibility to urban geological disasters—A case study of urban road collapses in Hangzhou. Bull. Eng. Geol. Environ. 2024, 83, 454. [Google Scholar] [CrossRef]
- Merghadi, A.; Yunus, A.P.; Dou, J.; Whiteley, J.; ThaiPham, B.; Bui, D.T.; Avtar, R.; Abderrahmane, B. Machine learning methods for landslide susceptibility studies: A comparative overview of algorithm performance. Earth-Sci. Rev. 2020, 207, 103225. [Google Scholar] [CrossRef]
- Yuan, X.; Liu, J.; Huang, L.; Li, X. Assessment of landslide susceptibility in xinyuan county based on machine learning models. Sci. Technol. Eng. 2025, 25, 1815–1826. [Google Scholar] [CrossRef]
- Sarkar, P.; Mondal, M.; Sarkar, A.; Gayen, S.K. Landslide susceptibility assessment for the Darjeeling Toy Train route: A GIS and machine learning approach. Stoch. Environ. Res. Risk Assess. 2024, 39, 613–637. [Google Scholar] [CrossRef]
- Hailu, S.; Deribew, K.T.; Teferi, E.; Moisa, M.B.; Roba, Z.R.; Dagne, S.S.; Woldetsadik, M. Spatial assessment employing fusion logistic regression and frequency ratio models to monitor landslide susceptibility in the upper Blue Nile basin of Ethiopia: Muger watershed. Environ. Syst. Res. 2024, 13, 54. [Google Scholar] [CrossRef]
- Jin, R.; Wang, S.; Liu, J. Multi-Index Fusion Debris Flow Early Warning Model Based on Spatial Interpolation and Support Vector Machine. Water 2024, 16, 724. [Google Scholar] [CrossRef]
- Zhao, H.; Wei, A.; Ma, F.; Dai, F.; Jiang, Y.; Li, H. Comparison of debris flow susceptibility assessment methods: Support vector machine, particle swarm optimization, and feature selection techniques. J. Mt. Sci. 2024, 21, 397–412. [Google Scholar] [CrossRef]
- Chen, H.; Zhang, H.; Boning, D.; Hsieh, C.-J. Robust decision trees against adversarial examples. In Proceedings of the International Conference on Machine Learning, Long Beach, CA, USA, 9–15 June 2019; pp. 1122–1131. [Google Scholar]
- Yamagata, T. Reducing model biases is essential to projecting future climate variability. Natl. Sci. Rev. 2021, 8, nwab080. [Google Scholar] [CrossRef]
- Strocchi, F. Symmetry Breaking; Springer: Berlin/Heidelberg, Germany, 2005; Volume 643. [Google Scholar]
- Lee, H.; Chen, S. Systematic bias of machine learning regression models and correction. IEEE Trans. Pattern Anal. Mach. Intell. 2025, 47, 4974–4983. [Google Scholar] [CrossRef] [PubMed]
- Xian, L.; Ji, M.; Liu, F.; Li, Q. Assessing Geological Disaster Susceptibility in Taishan Area by Coupling Certainty Factor Model with Optimized Random Forest Model. Bull. Soil Water Conserv. 2024, 44, 134–143. [Google Scholar] [CrossRef]
- Wang, S.J.; Wan, Y.S. Precambrian geology and geoparks in Shandong province, China. North China Geol. 2022, 45, 18–36. [Google Scholar] [CrossRef]
- Huang, X.; Yang, J. The 30 m annual land cover datasets and its dynamics in China from 1985 to 2022. Earth Syst. Sci. Data 2023, 13, 3907–3925. [Google Scholar] [CrossRef]
- Tak, G.-M.; Park, J.-H.; Lee, C.-K.; Kim, H. Influence of altitude, slope, and waterway characteristics on the occurrence of slow-moving landslides in South Korea. Front. Earth Sci. 2023, 11, 1276768. [Google Scholar] [CrossRef]
- Xie, C.; Huang, Y.; Li, L.; Li, T.; Xu, C. Detailed inventory and spatial distribution analysis of rainfall-induced landslides in Jiexi County, Guangdong Province, China in August 2018. Sustainability 2023, 15, 13930. [Google Scholar] [CrossRef]
- Farzam, M.; Ejtehadi, H. Effects of drought and slope aspect on canopy facilitation in a mountainous rangeland. J. Plant Ecol. 2017, 10, 626–633. [Google Scholar] [CrossRef]
- Yang, W.; Niu, R.; Si, R.; Li, J. Geological hazard susceptibility analysis and developmental characteristics based on slope unit, using the xinxian county, henan province as an example. Sensors 2024, 24, 2457. [Google Scholar] [CrossRef] [PubMed]
- Wang, J.; Zhang, K.; Yang, M.; Meng, H.; Li, P. The effect of roughness and rainfall on hydrodynamic properties of overland flow. Hydrol. Res. 2019, 50, 1324–1343. [Google Scholar] [CrossRef]
- Ferrer-Boix, C.; Chartrand, S.M.; Hassan, M.A.; Martín-Vide, J.P.; Parker, G. On how spatial variations of channel width influence river profile curvature. Geophys. Res. Lett. 2016, 43, 6313–6323. [Google Scholar] [CrossRef]
- Xue, X.W.; Chen, X.; Zhang, Z.C.; Qin, N.X. Categorization of karst landform on the basis of landform factor eigenvalue. Carsologica Sin. 2009, 28, 175–180. [Google Scholar] [CrossRef]
- Wang, Z.; Chen, J.; Lian, Z.; Li, F.; Pang, L.; Xin, Y. Influence of buffer distance on environmental geological hazard susceptibility assessment. Environ. Sci. Pollut. Res. 2024, 31, 9582–9595. [Google Scholar] [CrossRef] [PubMed]
- Fang, L.; Wang, Q.; Yue, J.; Xing, Y. Analysis of optimal Buffer distance for linear hazard factors in landslide susceptibility prediction. Sustainability 2023, 15, 10180. [Google Scholar] [CrossRef]
- Feng, B.; Cheng, X.; Fan, F.; Lu, H.; Li, R.; Wei, B. Geological hazard risk assessment based on Information Model: A case study of Lufeng City in Yunnan Province. World Nucl. Geosci. 2024, 41, 1260–1274. [Google Scholar] [CrossRef]
- Pacheco Quevedo, R.; Velastegui-Montoya, A.; Montalván-Burbano, N.; Morante-Carballo, F.; Korup, O.; Daleles Rennó, C. Land use and land cover as a conditioning factor in landslide susceptibility: A literature review. Landslides 2023, 20, 967–982. [Google Scholar] [CrossRef]
- Zhang, S.; Tan, S.; Zhou, J.; Sun, Y.; Ding, D.; Li, J. Geological disaster susceptibility evaluation of a random-forest-weighted deterministic coefficient model. Sustainability 2023, 15, 12691. [Google Scholar] [CrossRef]
- Huangfu, W.; Wu, W.; Zhou, X.; Lin, Z.; Zhang, G.; Chen, R.; Song, Y.; Lang, T.; Qin, Y.; Ou, P. Landslide geo-hazard risk mapping using logistic regression modeling in Guixi, Jiangxi, China. Sustainability 2021, 13, 4830. [Google Scholar] [CrossRef]
- Cui, S.; Sudjianto, A.; Zhang, A.; Li, R. Enhancing robustness of gradient-boosted decision trees through one-hot encoding and regularization. arXiv 2023, arXiv:2304.13761. [Google Scholar] [CrossRef]
- Li, H.; Gao, W.; Xie, J.; Yen, G.G. Multiobjective bilevel programming model for multilayer perceptron neural networks. Inf. Sci. 2023, 642, 119031. [Google Scholar] [CrossRef]
- Castro, W.; Oblitas, J.; Santa-Cruz, R.; Avila-George, H. Multilayer perceptron architecture optimization using parallel computing techniques. PLoS ONE 2017, 12, e0189369. [Google Scholar] [CrossRef] [PubMed]
- Chen, T.; Guestrin, C. Xgboost: A scalable tree boosting system. In Proceedings of the 22nd ACM Sigkdd International Conference on Knowledge Discovery and Data Mining, San Francisco, CA, USA, 13–17 August 2016; pp. 785–794. [Google Scholar]
- Zhou, Z.-H. Ensemble Methods: Foundations and Algorithms; CRC Press: Boca Raton, FL, USA, 2025. [Google Scholar]
- Kuncheva, L.I.; Whitaker, C.J. Measures of diversity in classifier ensembles and their relationship with the ensemble accuracy. Mach. Learn. 2003, 51, 181–207. [Google Scholar] [CrossRef]
- Zhang, S.; Ma, K.; Wang, L.; Zhang, Z.; Ye, X.; Zhang, J.; Li, H. Prediction of thermal protection performance and empirical study of flame-retardant cotton based on a combined model. Front. Mater. 2024, 11, 1454935. [Google Scholar] [CrossRef]
- Wang, Y.; Lang, J.; Zuo, J.Z.; Dong, Y.; Hu, Z.; Xu, X.; Zhang, Y.; Wang, Q.; Yang, L.; Wong, S.T. The radiomic-clinical model 788 using the SHAP method for assessing the treatment response of whole-brain radiotherapy: A multicentric study. Eur. Radiol. 2022, 32, 8737–8747. [Google Scholar] [CrossRef]
- Zeng, T.R.; Wang, L.F.; Zhang, Y.; Cheng, P.; Wu, F. Landslide susceptibility modeling and interpretability based on CatBoost-SHAP model. Chin. J. Geol. Hazard Control 2024, 35, 37–50. [Google Scholar] [CrossRef]
- Cao, J.; Zhang, Z.; Du, J.; Zhang, L.; Song, Y.; Sun, G. Multi-geohazards susceptibility mapping based on machine learning—A case study in Jiuzhaigou, China. Nat. Hazards 2020, 102, 851–871. [Google Scholar] [CrossRef]
- Reichenbach, P.; Rossi, M.; Malamud, B.D.; Mihir, M.; Guzzetti, F. A review of statistically-based landslide susceptibility models. Earth-Sci. Rev. 2018, 180, 60–91. [Google Scholar] [CrossRef]
- Chen, S.; Zhou, X.; Zhou, G.; Fan, C.; Ding, P.; Chen, Q. An online physical-based multiple linear regression model for building’s hourly cooling load prediction. Energy Build. 2022, 254, 111574. [Google Scholar] [CrossRef]
- Bentéjac, C.; Csörgő, A.; Martínez-Muñoz, G. A comparative analysis of gradient boosting algorithms. Artif. Intell. Rev. 2021, 54, 1937–1967. [Google Scholar] [CrossRef]
- Grinsztajn, L.; Oyallon, E.; Varoquaux, G. Why do tree-based models still outperform deep learning on typical tabular data? Adv. Neural Inf. Process. Syst. 2022, 35, 507–520. [Google Scholar] [CrossRef]
Disclaimer/Publisher’s Note: The statements, opinions and data contained in all publications are solely those of the individual author(s) and contributor(s) and not of MDPI and/or the editor(s). MDPI and/or the editor(s) disclaim responsibility for any injury to people or property resulting from any ideas, methods, instructions or products referred to in the content. |
© 2025 by the authors. Licensee MDPI, Basel, Switzerland. This article is an open access article distributed under the terms and conditions of the Creative Commons Attribution (CC BY) license (https://creativecommons.org/licenses/by/4.0/).