Article

LISA-YOLO: A Symmetry-Guided Lightweight Small Object Detection Framework for Thyroid Ultrasound Images

1
School of Information Science and Engineering, Yanshan University, Qinhuangdao 066004, China
2
School of Information Engineering, Xinjiang Institute of Engineering, Urumqi 830023, China
3
School of Electromechanical Engineering, Xinjiang Institute of Engineering, Urumqi 830023, China
*
Author to whom correspondence should be addressed.
Symmetry 2025, 17(8), 1249; https://doi.org/10.3390/sym17081249
Submission received: 13 June 2025 / Revised: 13 July 2025 / Accepted: 22 July 2025 / Published: 6 August 2025
(This article belongs to the Section Computer)

Abstract

Non-invasive ultrasound diagnosis, combined with deep learning, is frequently used for detecting thyroid diseases. However, real-time detection on portable devices faces limitations due to constrained computational resources, and existing models often lack sufficient capability for small object detection of thyroid nodules. To address this, this paper proposes an improved lightweight small object detection network framework called LISA-YOLO, which enhances the lightweight multi-scale collaborative fusion algorithm. The proposed framework exploits the inherent symmetrical characteristics of ultrasound images and the symmetrical architecture of the detection network to better capture and represent features of thyroid nodules. Specifically, an improved depthwise separable convolution algorithm replaces traditional convolution to construct a lightweight network (DG-FNet). Through symmetrical cross-scale fusion operations via FPN, detection accuracy is maintained while reducing computational overhead. Additionally, an improved bidirectional feature network (IMS F-NET) fully integrates the semantic and detailed information of high- and low-level features symmetrically, enhancing the representation capability for multi-scale features and improving the accuracy of small object detection. Finally, a collaborative attention mechanism (SAF-NET) uses a dual-channel and spatial attention mechanism to adaptively calibrate channel and spatial weights in a symmetric manner, effectively suppressing background noise and enabling the model to focus on small target areas in thyroid ultrasound images. Extensive experiments on two image datasets demonstrate that the proposed method achieves improvements of 2.3% in F1 score, 4.5% in mAP, and 9.0% in FPS, while maintaining only 2.6 M parameters and reducing GFLOPs from 6.1 to 5.8. The proposed framework provides significant advancements in lightweight real-time detection and demonstrates the important role of symmetry in enhancing the performance of ultrasound-based thyroid diagnosis.

1. Introduction

Thyroid cancer is one of the malignant tumors with a continuously rising incidence worldwide. According to GLOBOCAN 2022 data, the annual number of new thyroid cancer cases worldwide has exceeded 800,000, with the onset age trending younger [1]. Early detection and diagnosis of thyroid nodules are critical for improving patient survival and quality of life. As a non-invasive, real-time, and cost-effective diagnostic tool, ultrasound imaging has become the preferred modality for thyroid disease diagnosis [2]. However, ultrasound images inherently suffer from high noise, low contrast, and blurred boundaries. Clinicians often rely on experience for diagnosis, introducing significant subjective bias and misdiagnosis risks [3]. To bridge this gap, automated, precise, and efficient computer-aided diagnostic systems are employed to alleviate physicians’ workload and enhance diagnostic accuracy, thus becoming essential for modern clinical practice [4].
In recent years, deep learning has demonstrated powerful feature extraction and classification capabilities in medical image analysis, achieving significant advancements in thyroid nodule detection and benign/malignant classification [5,6]. Multi-view deep learning models enable effective integration of information across different ultrasound views, thereby improving detection accuracy [5]. Additionally, transfer learning has emerged as an effective solution to challenges such as insufficient training data and weak model generalization capabilities, enhancing model robustness and flexibility in practical applications [6]. Notably, YOLO models (e.g., YOLOv3/v5), with their end-to-end training and fast inference, have made substantial progress in real-time object detection [7,8] and are widely applied to lesion detection tasks in medical imaging [9].
Despite this, most existing deep learning models for thyroid ultrasound image analysis still face numerous challenges. On the one hand, to pursue detection accuracy, these models often adopt complex network architectures, resulting in a large number of parameters and high computational costs. This makes them difficult to deploy on portable devices or in resource-constrained environments, and unable to meet the rapid diagnosis needs of primary healthcare facilities for thyroid tumors. On the other hand, small-target thyroid tumors constitute a significant proportion of ultrasound images. Existing traditional (non-deep learning) models suffer from issues such as suboptimal feature extraction and inaccurate localization in small-target detection, which undermine diagnostic accuracy and reliability, as illustrated in Figure 1.
To address the above issues, this paper focuses on model lightweight and improvement in small object detection capabilities. In terms of lightweight, by optimizing the network structure and introducing efficient feature extraction module methods, the model parameters and computational complexity are reduced, enabling the model to run quickly on resource-constrained platforms such as portable ultrasound devices, providing the possibility for on-site screening and real-time diagnosis of thyroid tumors. In terms of small object detection, by improving feature fusion strategies and designing detection mechanisms more suitable for small objects, the model’s ability to capture and locate features of small target tumors in thyroid ultrasound images is enhanced, improving the detection rate and diagnostic accuracy of small tumors and reducing missed diagnoses and misdiagnoses. The specific contributions of this paper are threefold.
(1)
This paper presents a lightweight dual-path feature extraction mechanism based on the Ghost module (DG-FNet), which enhances feature reuse while maintaining a lightweight architecture. The design incorporates structural symmetry in its dual-branch processing to effectively extract low-level and high-level semantic information in a balanced manner. A progressive feature optimization mechanism iteratively refines tumor features such as texture, shape, and boundaries. Additionally, deformable convolutions are utilized to generate flexible, symmetry-preserving “ghost features,” which protect fine-grained shallow features while reducing redundant deep semantics. This allows for dynamic adjustments of sampling locations to remain consistent with tumor deformations, while also reducing computational complexity and improving processing speed;
(2)
This paper proposes the IMSF-Net module, an improvement based on the BiFPN architecture, which incorporates a symmetry-aware design in its bidirectional fusion path. Through dynamically weighted multi-scale feature aggregation, this module enhances cross-scale detection sensitivity while maintaining architectural balance. A hierarchical optimization strategy effectively integrates nodule localization and classification tasks. Furthermore, by symmetrically coordinating with YOLOv11’s original C3k2 module, IMSF-Net enhances small object detection performance with only a slight increase in computational cost;
(3)
This paper proposes a collaborative attention mechanism (SAF-Net) that combines channel-wise and spatial feature refinement within a symmetrical dual-branch architecture. Initially, features are filtered through a coarse channel attention process, followed by fine-grained selection of key diagnostic channels. This is subsequently complemented by spatial attention refinement. The collaborative attention structure ensures symmetric calibration of spatial and channel weights, enhancing the model’s focus on the boundaries and echogenic features of thyroid nodules. The guided attention constraint enforces structural coherence, allowing the model to dynamically highlight diagnostically relevant regions and significantly improve small object sensitivity and feature representation quality.

2. Related Work

2.1. Traditional Methods for Diagnosing Thyroid Tumors

Fine-needle aspiration (FNA) is currently one of the gold standards for the diagnosis of thyroid nodules, determining the nature of the nodules through cytological analysis. Although FNA has played an important role in reducing unnecessary surgeries, its results are limited by sample quality and the experience of pathologists, with the risk of false negatives and false positives [10]. Ultrasound examination is also an important means of preliminary screening for thyroid nodules, providing information on the size, shape, boundaries, and blood flow of the nodules, which helps to determine the benign or malignant tendencies of the nodules. However, ultrasound diagnosis depends on the operator’s experience, and its specificity and sensitivity are limited, making it difficult to completely distinguish between benign and malignant nodules [11]. Pathological assessment is also an important basis for diagnosing thyroid tumors, but the process is complex and time-consuming. In addition, in certain subtypes of thyroid cancer, pathological features may overlap, leading to misdiagnosis or missed diagnosis [10]. Traditional pathology is difficult to reflect the molecular heterogeneity of tumors, which limits the accurate prediction of tumor biological behavior [12]. Although traditional diagnostic methods for thyroid tumors are mature and widely used, there are still problems such as strong operation dependence, insufficient diagnostic consistency, and limited understanding of tumor biology. With the development of artificial intelligence technology, emerging methods such as deep learning-assisted diagnosis are gradually being explored and applied in the hope of making up for the shortcomings of traditional methods [12,13].

2.2. CNN-Based Detection Methods

Given the limitations of traditional methods, many scholars have begun to investigate the use of deep learning for thyroid tumor detection, aiming to improve diagnostic accuracy and efficiency. Li et al. successfully diagnosed suspected thyroid nodules using a deep convolutional neural network, demonstrating high sensitivity and specificity [14]. Similarly, Zhao et al. proposed a deep learning-based method for detecting and classifying suspicious thyroid nodule ultrasound images, further optimizing the diagnostic process [15]. The trend is to combine multi-modal ultrasound image information with deep learning to enhance diagnostic accuracy. Tao et al. built a model using multi-modal ultrasound images, effectively assisting in determining nodule properties and improving the identification rate of malignant nodules [16]. A retrospective multicenter study by Qi et al. showed that a deep learning model based on ultrasound images effectively predicted gross extrathyroidal extension of thyroid cancer, providing references for treatment plans [17]. Furthermore, Bai et al. utilized deep learning for thyroid nodule risk stratification, which helps clinicians develop individualized management strategies [18]. Wang et al. proposed a fully convolutional anchor-free 3D object detection method [19], providing a new direction for precise detection. Gummalla et al. proposed a hybrid deep learning model combining a sequential CNN and K-means clustering for early thyroid abnormality detection [20]. Ma et al. effectively diagnosed thyroid cancer by combining SPECT images with CNN [21]. Etehadtavakol et al. achieved more refined nodule segmentation by fusing U-Net and VGG16 with feature engineering [22]. Kim et al. introduced the RED-Net structure with residual and dilated convolutions for measuring thyroid volume, achieving high mAP values [23]. Liu et al.’s multi-scale weighted fusion attention mechanism for parathyroid detection also provides a reference for improving object detection and segmentation accuracy [24]. However, practical applications still face challenges such as insufficient sample size, difficulty in annotation, limited model generalization ability, complex structures, and small object detection.

2.3. YOLO-Based Tumor Detection Methods

YOLO-series object detection algorithms are widely used for automatic tumor detection due to their efficient real-time detection capabilities. Multiple studies have utilized different YOLO versions for brain tumor detection and hardness assessment, achieving high accuracy and real-time performance [25]. Additionally, combining MRI images with YOLO for brain tumor segmentation and classification effectively assists physicians in diagnosis [26]. Integrating YOLO with a Transformer mechanism has improved the detection accuracy for breast mass detection and segmentation [27]. For thyroid tumor detection, Wu et al. proposed a multi-scale YOLO-based detection model for real-time detection and tracking of thyroid nodules and surrounding tissues. This model leverages a multi-scale fusion strategy to effectively improve its performance in detecting nodules of varying sizes [28]. YOLOv8 has demonstrated superior performance over previous YOLOv5 models in automatic thyroid nodule segmentation and classification tasks, not only enhancing detection accuracy but also improving the ability to differentiate between benign and malignant nodules, which is crucial for clinical decision-making [29]. Furthermore, to address issues such as high noise, low contrast, and blurred boundaries in ultrasound images, an improved YOLOv8 model (referred to as YOLO-Thyroid) has been proposed to enhance thyroid nodule detection [7]. Vahdati et al. proposed a multi-view deep learning model for thyroid nodule detection [5]. Ghabri et al. proposed an AI-enhanced thyroid detection method based on YOLO [30]. Despite the excellent performance of YOLO-series models in object detection, ultrasound images inherently suffer from characteristics like high noise, low contrast, and blurred boundaries. These traits limit the model’s ability to extract effective features, thus affecting the final diagnostic accuracy [4]. Moreover, complex networks often struggle to meet real-time application demands, necessitating a balance between accuracy and real-time performance [4,31].

3. Methods

3.1. Overall Architecture

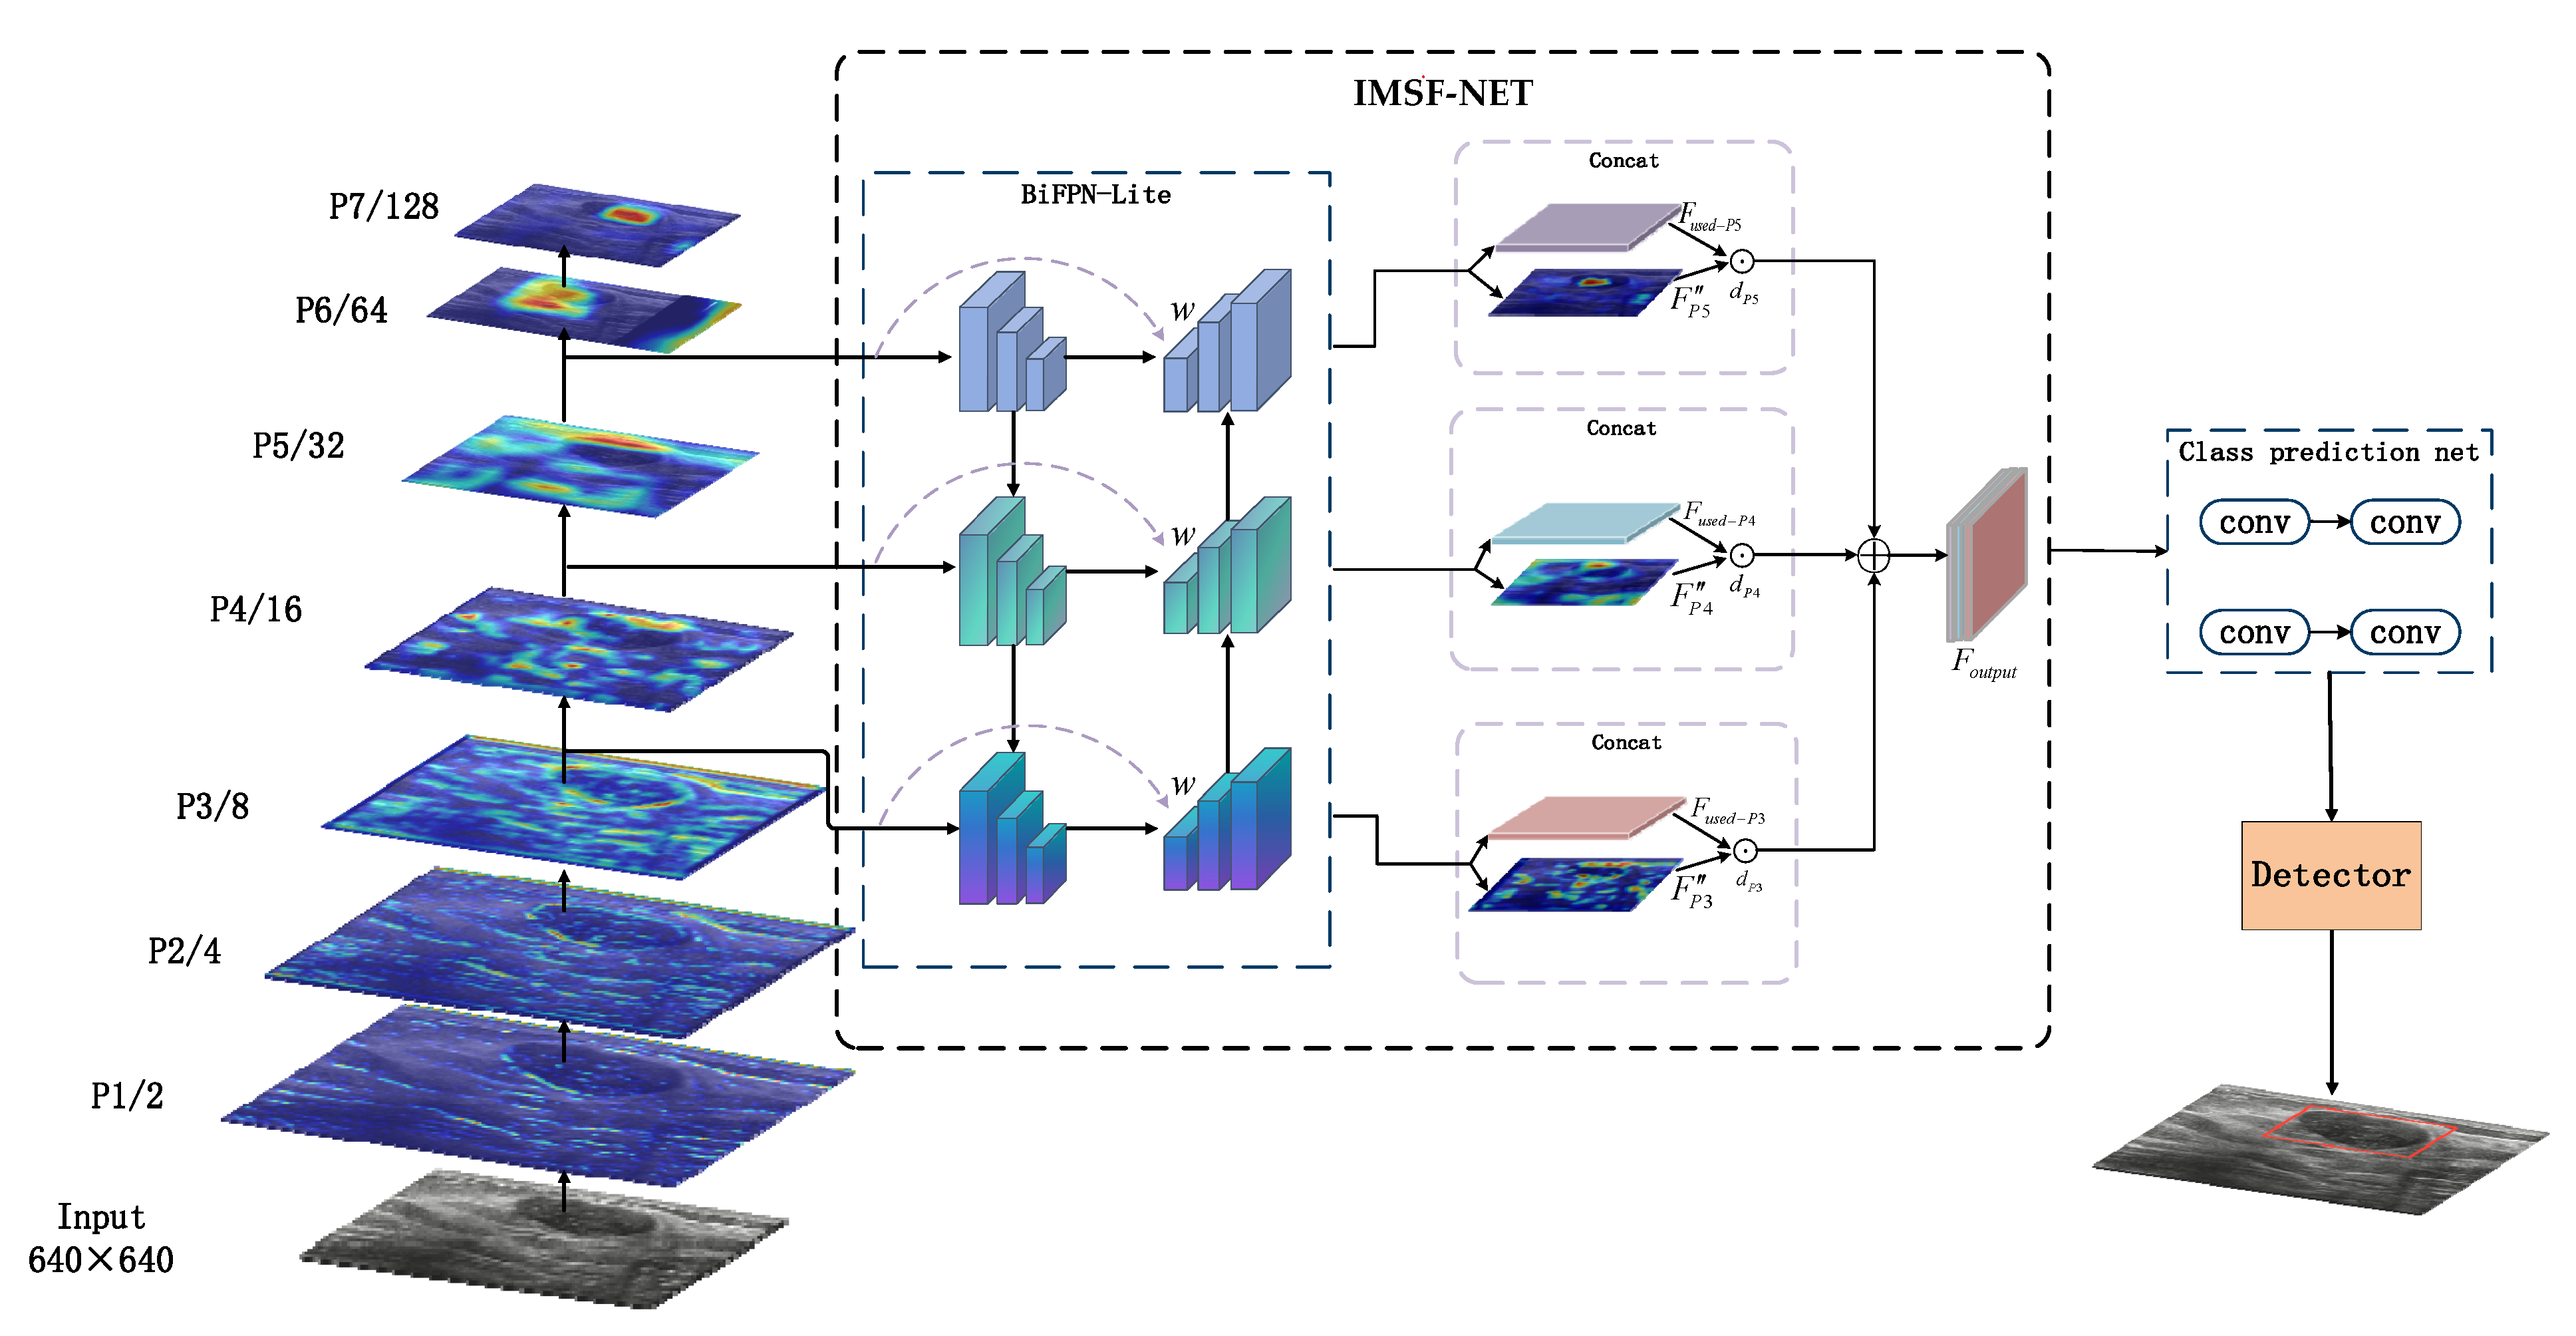
Figure 2 illustrates the overall design of the LISA-YOLO network, whose framework comprises four core components: the Input Layer, Feature Extraction Backbone, Feature Optimization Neck, and Multi-Scale Detection Head. This design builds upon YOLOv11 and incorporates several improvements. The DG-FNET module is integrated to significantly enhance the efficiency of extracting feature representation information, such as thyroid tumor boundary textures and grayscale distributions, while also filtering and reconstructing redundant features. This effectively reduces computational overhead without compromising crucial semantic information. Furthermore, the proposed IMSF-NET module adaptively learns the importance weights of tumor features at different scales. This selectively strengthens edge details of tiny tumors and overall contour features of large tumors, thereby effectively improving the detection sensitivity for tumors of various sizes. Finally, the SAF-NET module introduces a dual-channel and spatial collaborative attention mechanism to achieve refined optimization of multi-dimensional features, which notably enhances the detection performance for small targets.
Initially, the model employs the SGD optimizer (momentum = 0.9, weight decay = 5 × 10⁻⁴) with an initial learning rate of 0.01, using cosine annealing to schedule down to 1 × 10⁻⁴. Image pixels are normalized to the range [0, 1]. The data input layer acquires thyroid tumor ultrasound images and performs preliminary feature encoding using basic convolutional operations. Subsequently, the feature information undergoes hierarchical alternating processing through the C3K2 module and the DG-FNET module. By designing a streamlined convolutional architecture with a cascaded structure of main operations and depthwise separable convolutions, and integrating a main path information fusion strategy, key information features such as tumor edges and heterogeneous internal echoes are prioritized and preserved. This achieves optimized extraction of features at different levels, effectively reducing computation without losing critical semantic information.
Subsequently, at the end of the network’s backbone extraction part, the SPPF (Spatial Pyramid Pooling) module is used to achieve multi-scale context fusion, which significantly expands the receptive field and, thus, enhances the ability to recognize large targets. In the Neck stage, the C2PSA module is first utilized to integrate cross-layer features. The IMSF-Net module then obtains multi-scale feature maps by establishing three sub-branches (corresponding to P3, P4, and P5 layers, respectively), achieving complementary fusion of cross-level information, thereby enhancing the feature processing effect for small thyroid tumors. Furthermore, the SAF-Net module performs joint weighted processing on feature maps in both channel and spatial dimensions. First, a channel attention mechanism globally filters the feature maps, primarily retaining channels related to critical information about tumor echo intensity. Subsequently, a secondary channel weighting is applied to the filtered core channels to strengthen tumor-specific feature responses, thus effectively enhancing the salient features of the target region. The introduction of a spatial attention constraint mechanism forces the model to prioritize learning key features of thyroid tumors and focus on the tumor ROI (Region of Interest) information in the image, significantly improving the ability to capture features of tiny tumors (diameter < 5 mm). This network architecture achieves a good balance between efficiency and accuracy, demonstrating excellent performance in model lightweight and small lesion recognition tasks in thyroid ultrasound images, fully validating the rationality of each submodule’s design.

3.2. DG-FNET Module

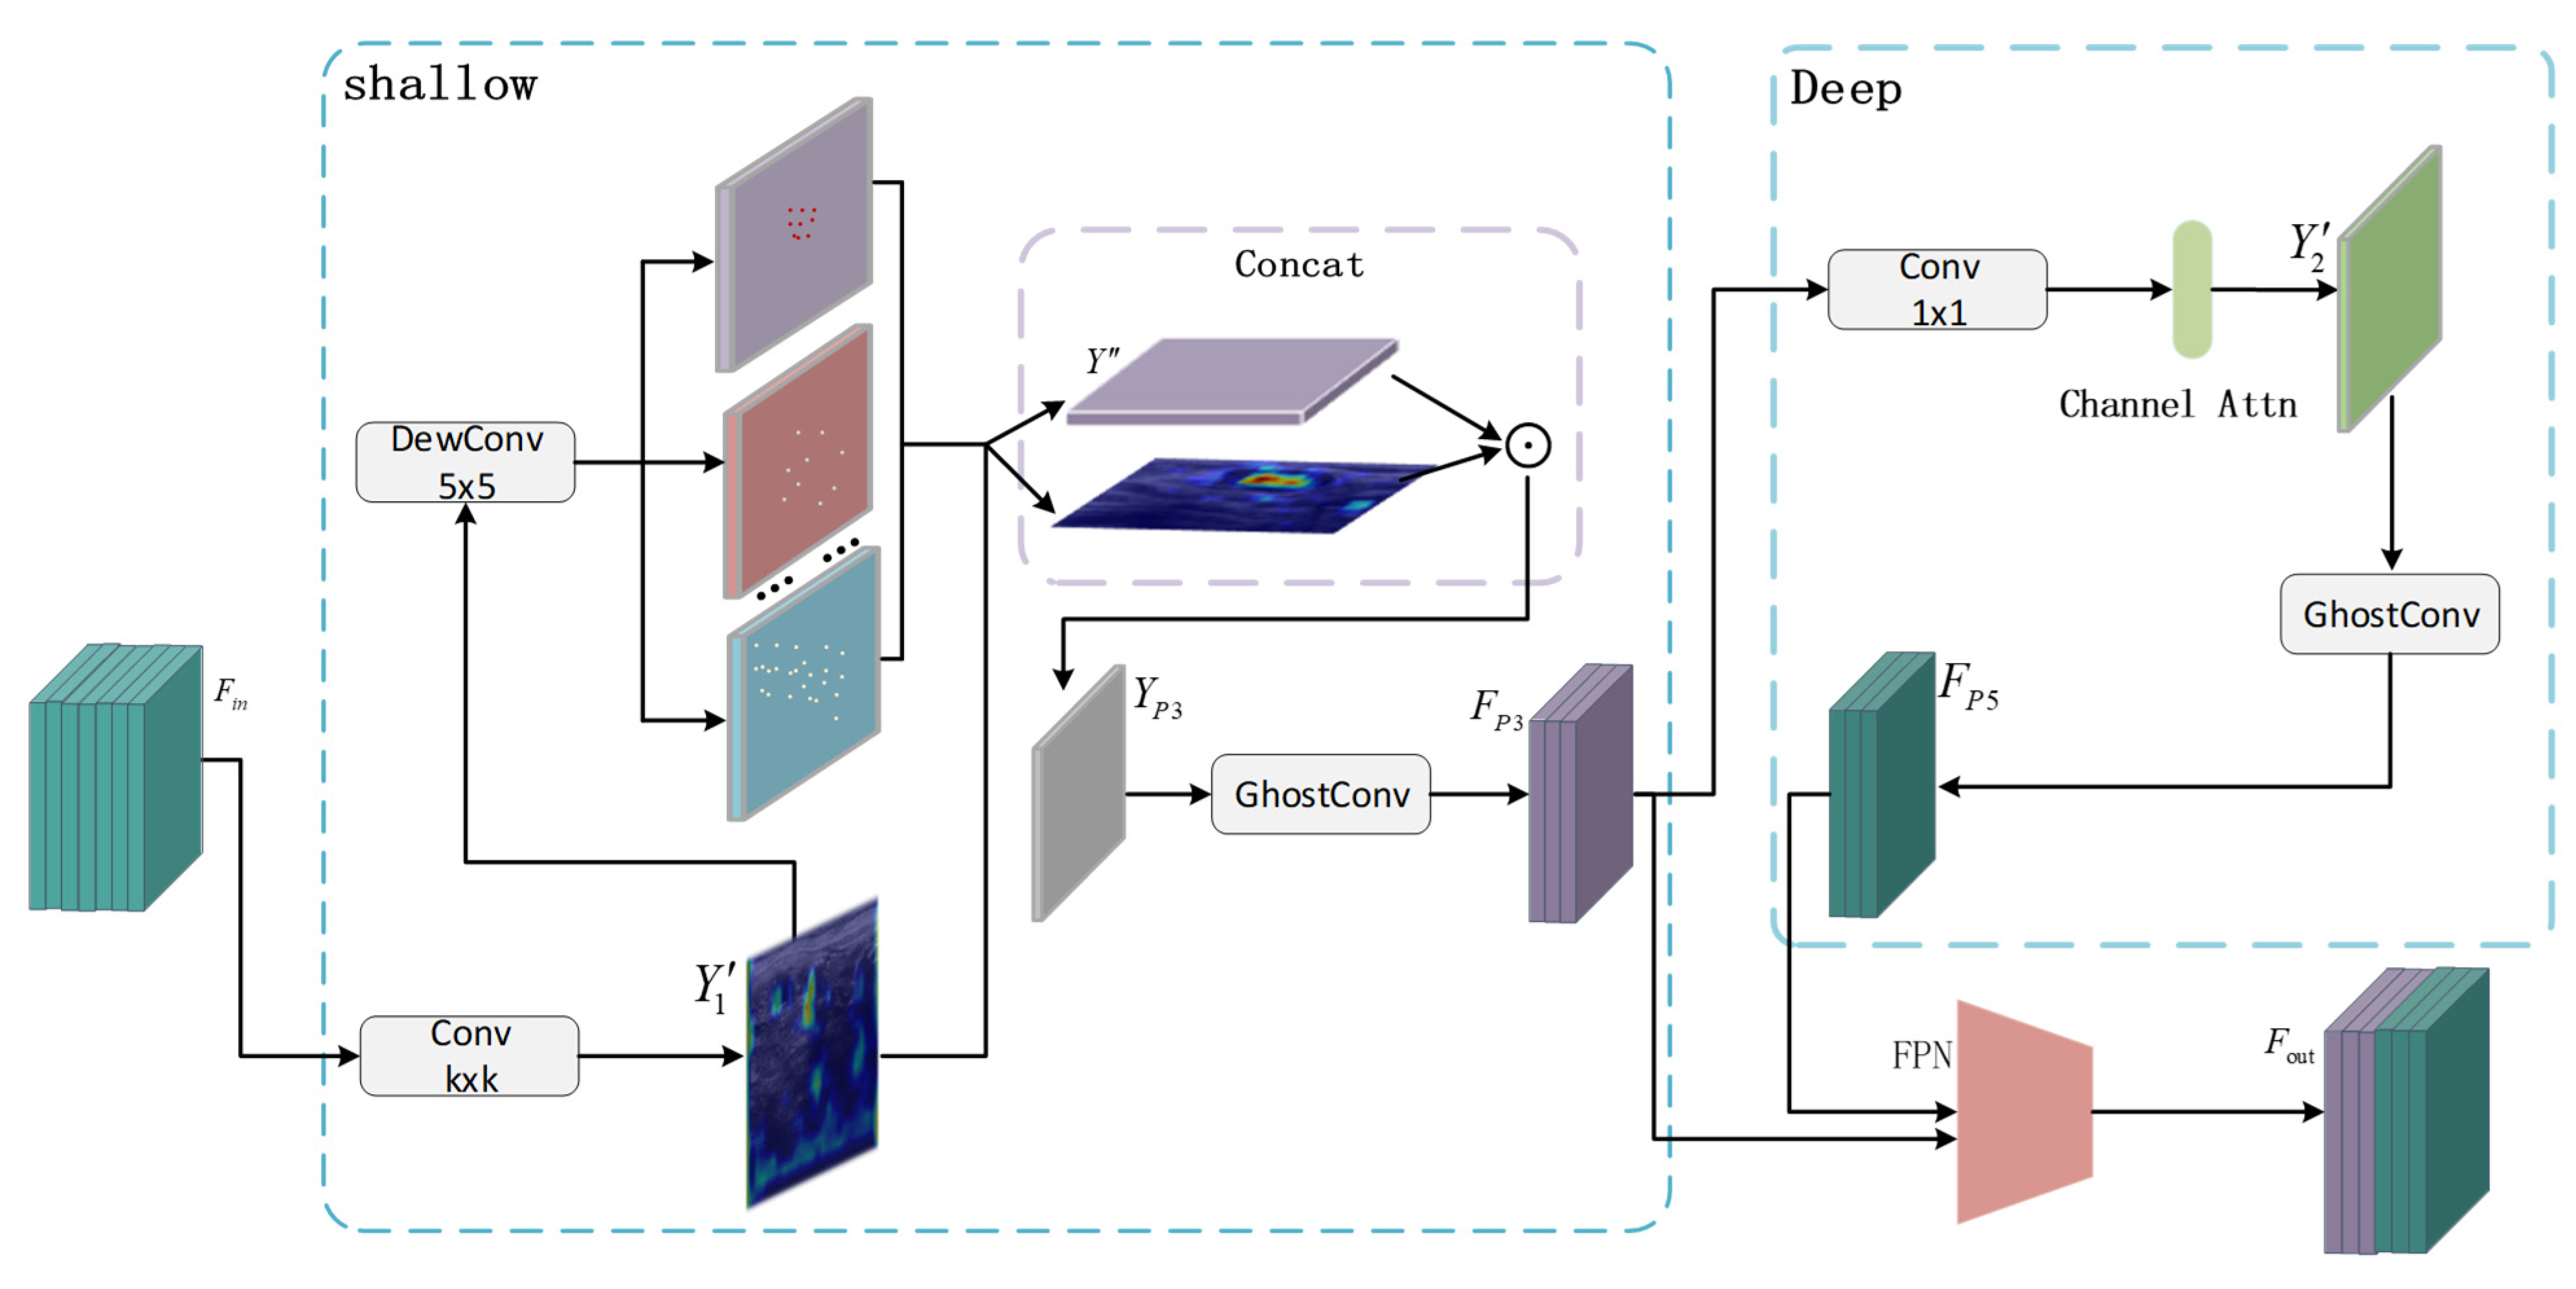
This paper, building upon the YOLOv11 model, introduces an enhanced Ghost module within the backbone network. By leveraging a collaborative mechanism between primary convolution and computationally efficient, cheap operations, this design effectively preserves key semantic information associated with thyroid nodule boundaries and echo intensities. This process is guided by the grayscale distribution and textural characteristics intrinsic to thyroid ultrasound images, thereby enhancing feature extraction efficiency. As illustrated in Figure 3, this network adopts a cross-layer feature fusion structure that symmetrically integrates high-resolution texture features from shallow layers with abstract semantic features from deeper layers. This symmetrical feature interaction ensures structural balance across scales, reduces computational complexity, and maintains the integrity of the feature representation for thyroid tumor detection.
This paper first employs an optimized primary operation strategy on the input feature maps. For the input feature map F R H × W × C 1 , a small number of convolutional kernels are used to extract grayscale texture and edge information from thyroid ultrasound images, generating base features Y 1 and Y 1 R H × W × C 2 / 2 as the output of the primary operation. Here, C 2 represents the number of output channels; k = 1 is the kernel size, and s is the stride. The primary operation extracts base features using small convolutional kernels, aiming to reduce the loss of small target information due to downsampling, as shown in Equation (1).
Y 1 = Conv k × k , s ( X 1 )
In the shallow layer (P3 level), local textures are enhanced. For blurred thyroid nodule edges, the Ghost module’s cheap operation ( 5 × 5 depthwise convolution) is employed to improve edge detail perception, where Y is the output of the cheap operation. Feature dimensions are expanded through depthwise separable convolution, and feature fusion is achieved via channel concatenation (Concat). This approach preserves the global information from the primary operation and the local details from the cheap operation, yielding Y P 3 R H × W × C 2 , as shown in Equations (2) and (3).
Y = DepthwiseConv 5 × 5 , 1 ( Y 1 )
Y P 3 = Concat ( Y 1 , Y )
Finally, the optimized Ghost convolution yields the shallow feature map F P 3 , where C i n 3 denotes the number of input channels, and C o u t 3 represents the number of output channels. The shallow Ghost module aims to capture fine-grained local features and reduce redundant computations, thereby preserving a larger computational budget for deep feature extraction, as shown in Equation (4).
F P 3 = G h o s t C o n v C i n 3 , C o u t 3
For the abundant redundant background information, such as thyroid tissue textures and ultrasound artifacts, present in high-resolution feature maps, the deep layer (P5 level) employs convolution to compress the number of feature channels, thereby reducing the redundancy in these high-resolution feature maps. Finally, the optimized Ghost convolution yields a feature map F P 5 , with the goal of enhancing thyroid semantic features while simultaneously reducing model complexity, as shown in Equations (5) and (6).
Y 2 = Conv 1 × 1 , s ( X 2 )
F P 5 = G h o s t C o n v C i n 5 , C o u t 5
To accommodate the feature distribution of different-sized lesions in thyroid tumor ultrasound images, a cross-scale fusion mechanism is introduced. In the deep network, the high-dimensional features output by the Ghost module and the shallow features are fused across scales via FPN (Feature Pyramid Network). Here, weights w 1 and w 2 are learnable weight parameters that dynamically adjust the fusion ratio of high-level and low-level features, and ε is a small constant to prevent division by zero, as shown in Equation (7).
F out = w 1 F P 5 + w 2 F P 3 w 1 + w 2 + ε
Thyroid ultrasound images are characterized by low contrast and weak boundaries. By introducing the DG-FNET module, redundant computations are reduced, focusing on extracting key texture features and more efficiently extracting marginalized features of thyroid nodules.

3.3. Multi-Scale Feature Fusion IMSF-NET Module

In thyroid tumor ultrasound images, the diversity in lesion size and morphology, coupled with the inherent difficulty in detecting small targets, presents significant challenges for accurate recognition. To address these issues, this paper introduces an enhanced Bidirectional Feature Pyramid Network (BiFPN). As shown in Figure 4, a lightweight module (BiFPN-Lite) is designed, which strengthens the multi-scale feature fusion process by enabling symmetrical top–down and bottom–up pathways, thereby promoting a balanced integration of semantic and spatial features across scales. By leveraging this symmetry-aware fusion structure, this network achieves improved precision in detecting heterogeneous lesion features in thyroid ultrasound images.
This paper selects several key positions to insert the IMSF-NET module with the aim of enhancing feature interaction at specific levels. At the position connecting Backbone P4 and P3 layers after upsampling, it fully integrates detailed information such as lesion edges and textures contained in low-level features of thyroid tumor images, along with semantic information including tumor properties from high-level features, thereby accurately capturing subtle differences in thyroid tumors in ultrasound images. To effectively promote efficient cross-layer information flow, this module is introduced at the position connecting Head P4 after downsampling, enabling the network to more comprehensively analyze complex features in thyroid tumor ultrasound images. This module receives two input feature maps F R H × W × C 1 and F R H × W × C 1 , where C 1 and C 2 denote the number of channels, and H and W denote spatial dimensions. A set of learnable weight vectors w is defined to achieve effective feature fusion, as shown in Equation (8), followed by normalization to ensure that features from each level participate in the fusion with optimal weights, further improving the network’s analytical accuracy for thyroid tumor ultrasound images, as shown in Equation (9).
w = w 0 , w 1
w ^ i = w i j = 0 1 w j + ε , i 0 , 1
ε = 1 e 4 is a small constant used to prevent the denominator from becoming zero. The normalized weights w 0 and w 1 are used to compute the weighted feature map F u s e d , as shown in Equation (10).
F u s e d = w 0 F + w 1 F
Then, the fused feature map F u s e d is concatenated with the original feature map F 2 along the specified dimension d P 3 , where denotes the concatenation operation, yielding the output feature map F o u t u s e d as shown in Equation (11).
F o u t u s e d = C o n c a t F f u s e d F
The improved BiFPN module significantly enhances the recognition capability for different types of thyroid lesions through a three-stage feature fusion strategy. In thyroid ultrasound images, small lesions with blurred boundaries and low contrast are often difficult to identify due to weak features. The first fusion focuses on strengthening the model’s perception of fine-grained structures. By enhancing the expression of shallow features, it effectively captures the subtle boundaries and internal structural information of such lesions, providing a basis for subsequent precise localization. Thyroid cancer nodules often present with irregular edges; thus, the second fusion deeply integrates high-level semantic information with low-level detailed features, performing multi-scale information fusion of crucial discriminatory information such as lesion malignancy tendency characterization, edge morphology, and internal texture. This improves the recognition accuracy for smaller lesion areas. The third fusion further optimizes cross-layer information interaction, enabling the model to adaptively weigh the contributions of different-level features, forming a more comprehensive feature representation, and improving the overall network’s expressiveness, where represents the feature fusion operation, as shown in Equation (12).
F o u t p u t = F o u t 1 F o u t 2 F o u t 3
Through this progressive fusion strategy, the improved IMSF-NET module effectively addresses challenges such as large variations in lesion size, blurred boundaries, and weak features in thyroid ultrasound images, providing strong support for the precise clinical diagnosis of thyroid tumors.

3.4. Collaborative Attention Mechanism SAF-NET Module

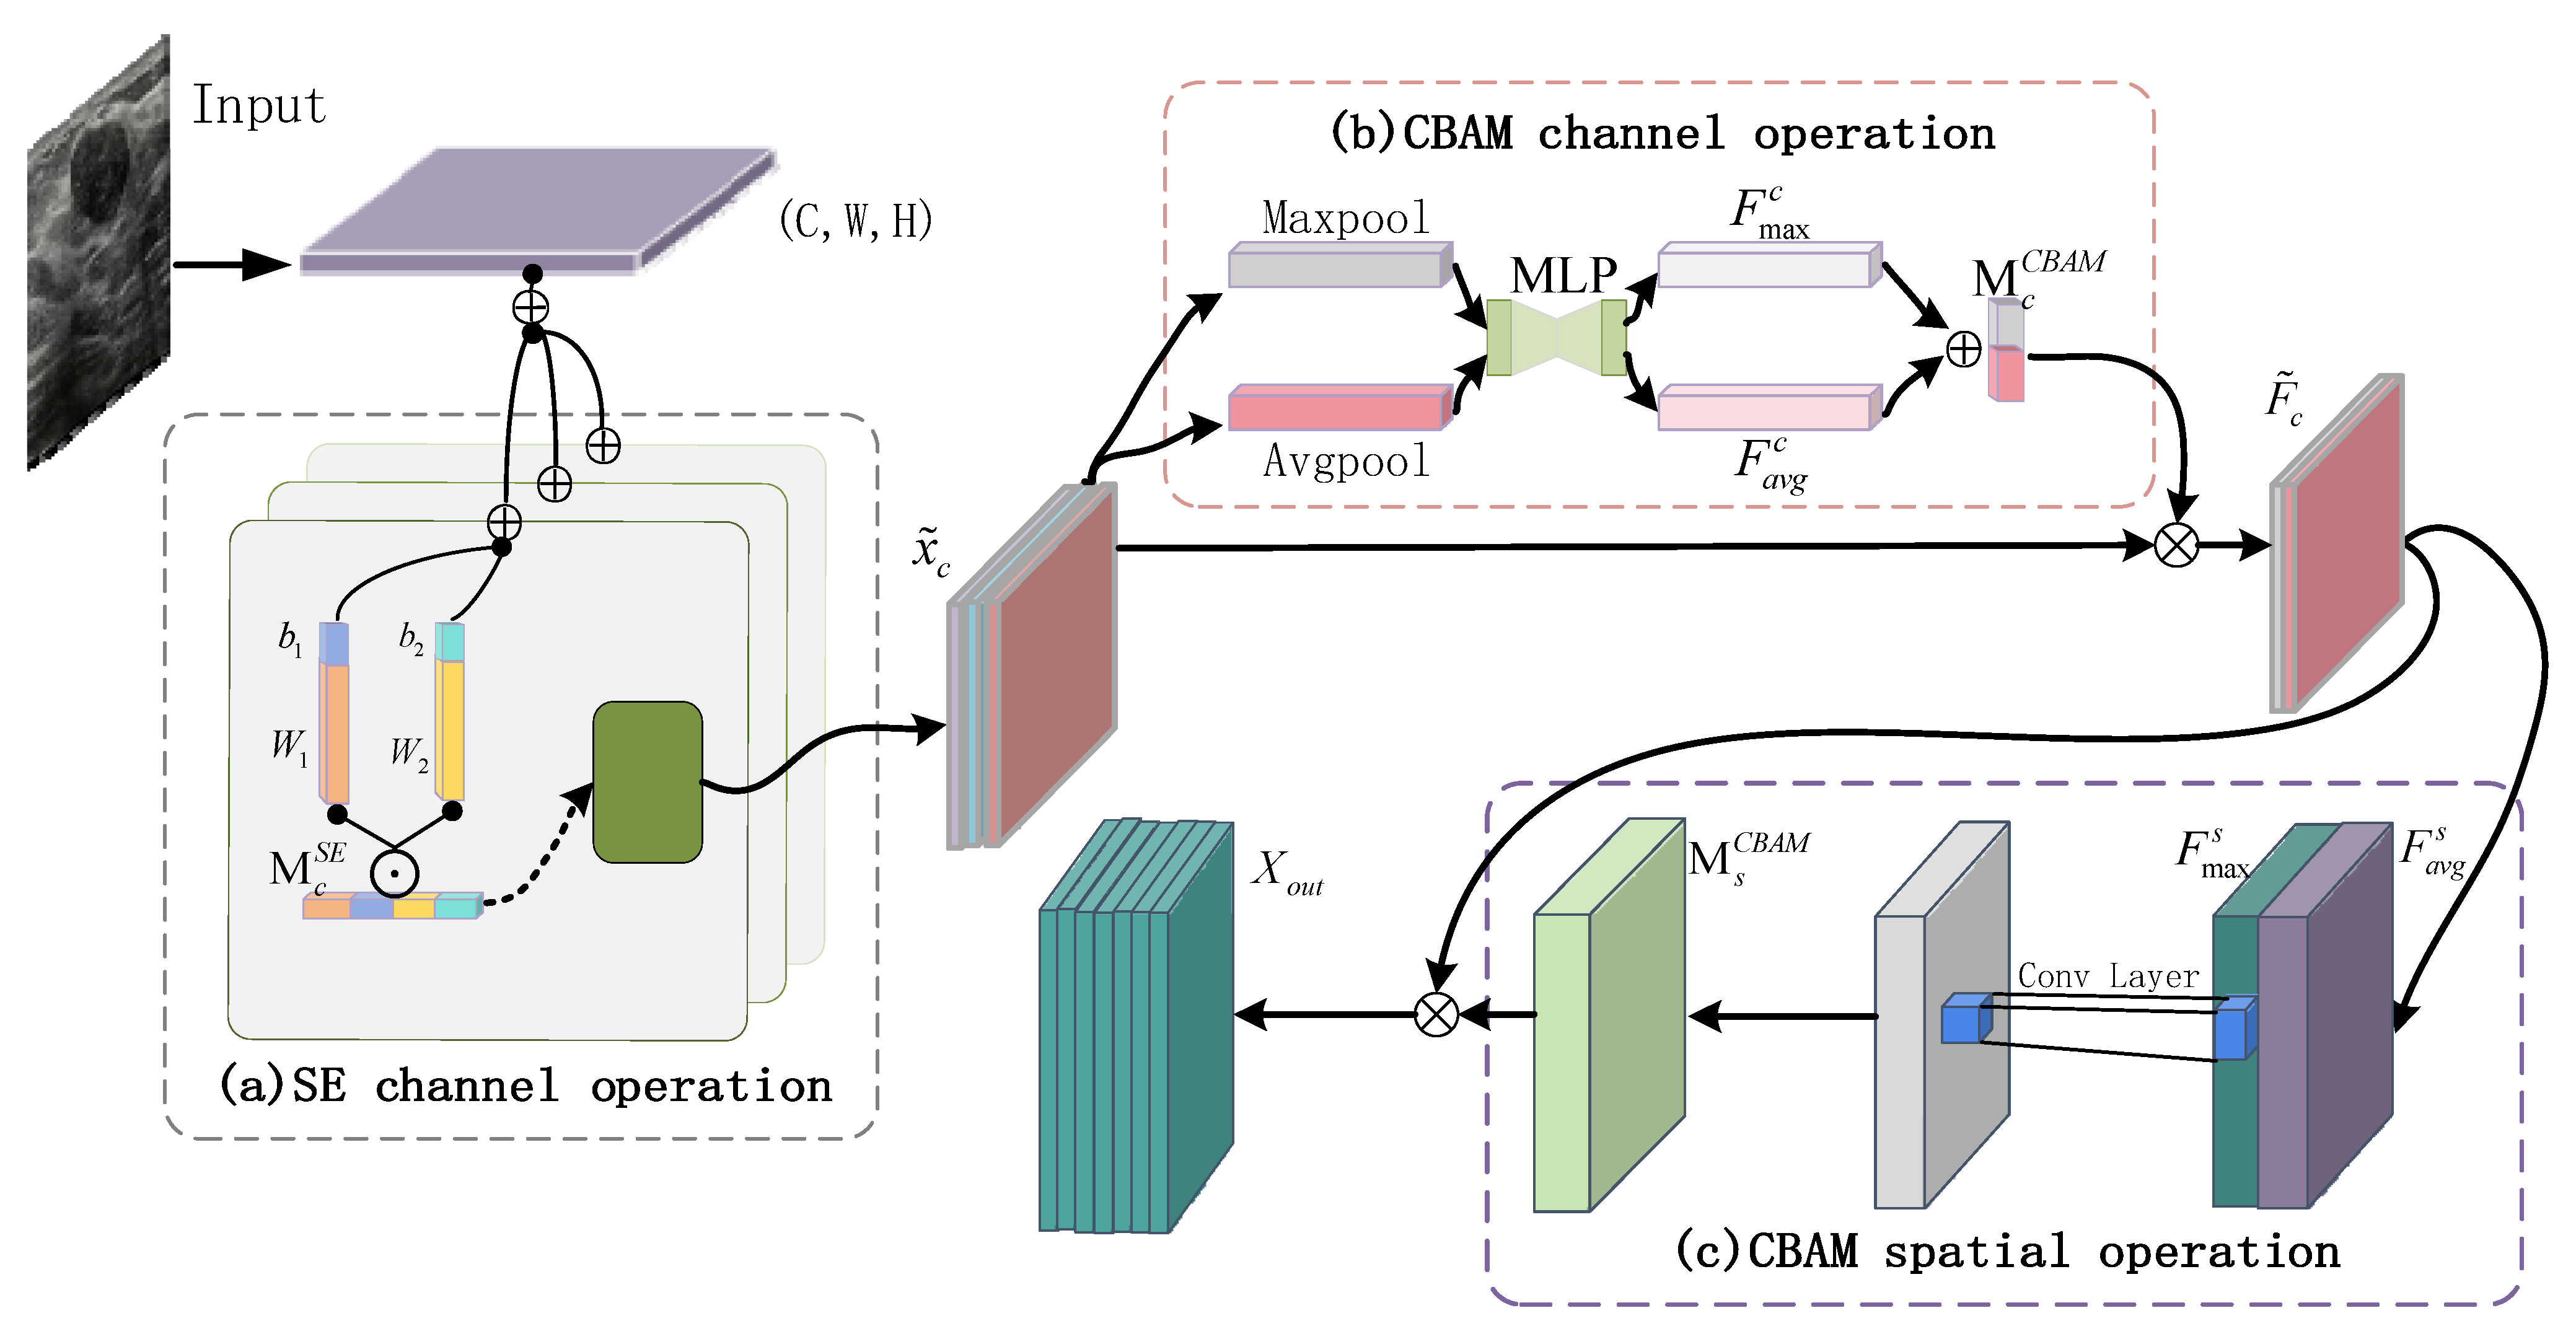
In thyroid tumor ultrasound imaging, the grayscale intensity, texture, and other feature differences between lesion regions and surrounding normal tissues are often subtle and poorly defined, making accurate segmentation of target regions challenging. To address this limitation, this paper proposes a novel hybrid attention module, SE-CBAM, which integrates SE and CBAM mechanisms. The core innovation lies in the design of a hierarchical, symmetry-inspired dual-stage attention mechanism that collaboratively refines both channel and spatial features. This structured attention strategy enables this model to precisely localize thyroid tumor regions, heighten sensitivity to key diagnostic cues, and significantly improve contrast discrimination between lesions and background in ultrasound images.
In the analysis of thyroid tumor ultrasound images, to accurately distinguish tumor targets from the background, the first stage introduces the SE module to perform global channel selection. In thyroid ultrasound images, tumor-related grayscale, texture, and other information are distributed across different channels, while some channels may contain only redundant background information. Global average pooling is used to quantify the importance of each channel in expressing thyroid tumor features, as shown in Equation (13).
z c = 1 H × W i = 1 H j = 1 W x c ( i , j )
After completing global channel selection on thyroid tumor ultrasound images, to further explore the potential nonlinear relationships between channels, this model introduces two fully connected layers for feature processing, as shown in Figure 5a. Let the weights and biases of the first fully connected layer be W 1 and b 1 , respectively, and those of the second fully connected layer be W 2 and b 2 , respectively. This model can adaptively learn and enhance channels closely related to thyroid tumor features, generating channel attention weights M c S E . After weighting by the channel attention, the channel feature map x ~ c is obtained. Here, W 1 R C / r × C and W 2 R C / r × C are learnable parameters that are continuously optimized during training, combined with the activation function δ (ReLU), further improving the model’s ability to represent features in thyroid tumor ultrasound images, as shown in Equations (14) and (15).
M c S E = σ ( W 2 δ W 1 z + b 1 + b 2 )
x ˜ c = M c S E × x c
Due to the complex and variable characteristics of tumors in thyroid ultrasound images, such as morphology, boundaries, and internal echoes, the CBAM module is introduced in the second stage to comprehensively capture tumor-related features. Specifically, as shown in Figure 5b, the MLP parameters from the SE module are reused. The input thyroid ultrasound feature maps undergo global average pooling F a v g c and global max pooling F m a x c operations separately to extract feature information from different dimensions. Then, the two pooling results are concatenated and passed through a shared multilayer perceptron (MLP) for feature fusion and processing. Using the channel attention weights M c C B A M for weighting, the optimized channel feature map F ~ c is ultimately generated, as shown in Equations (16) and (17). Compared with traditional designs with independent parameters, this approach reduces C 2 r parameters while ensuring the model’s capability to analyze thyroid tumor ultrasound images, thereby improving computational efficiency and making it suitable for rapid processing and analysis of clinical ultrasound images.
F pool = F avg ; F max , M c C B A M = σ MLP F pool
F ˜ c = M c C B A M × F c
Thyroid tumors in ultrasound images may exhibit diverse shapes, sizes, and spatial distributions. This model performs deep processing on the feature maps after channel-wise processing to enhance the capture of spatial positional information. As shown in Figure 5c, global average pooling and global max pooling are applied to the feature maps to extract spatial information from different perspectives. The two pooling results are then concatenated to obtain feature maps F a v g s , F m a x s , and F a g g , which are subsequently processed via convolution. Through this convolution operation, associations among spatial features are mined to generate the spatial attention weight map M s C B A M . Finally, based on this spatial attention weight map, the original feature map is weighted to produce the optimized feature map X o u t , as shown in Equation (18).
X o u t = M s C B A M M c C B A M M c S E x
This module, through an efficient cascaded optimization and parameter sharing strategy, significantly enhances the network’s ability to analyze thyroid tumor ultrasound images without markedly increasing computational overhead, offering a scalable attention optimization solution for the precise detection of thyroid tumors.

4. Experiments and Results

4.1. Dataset

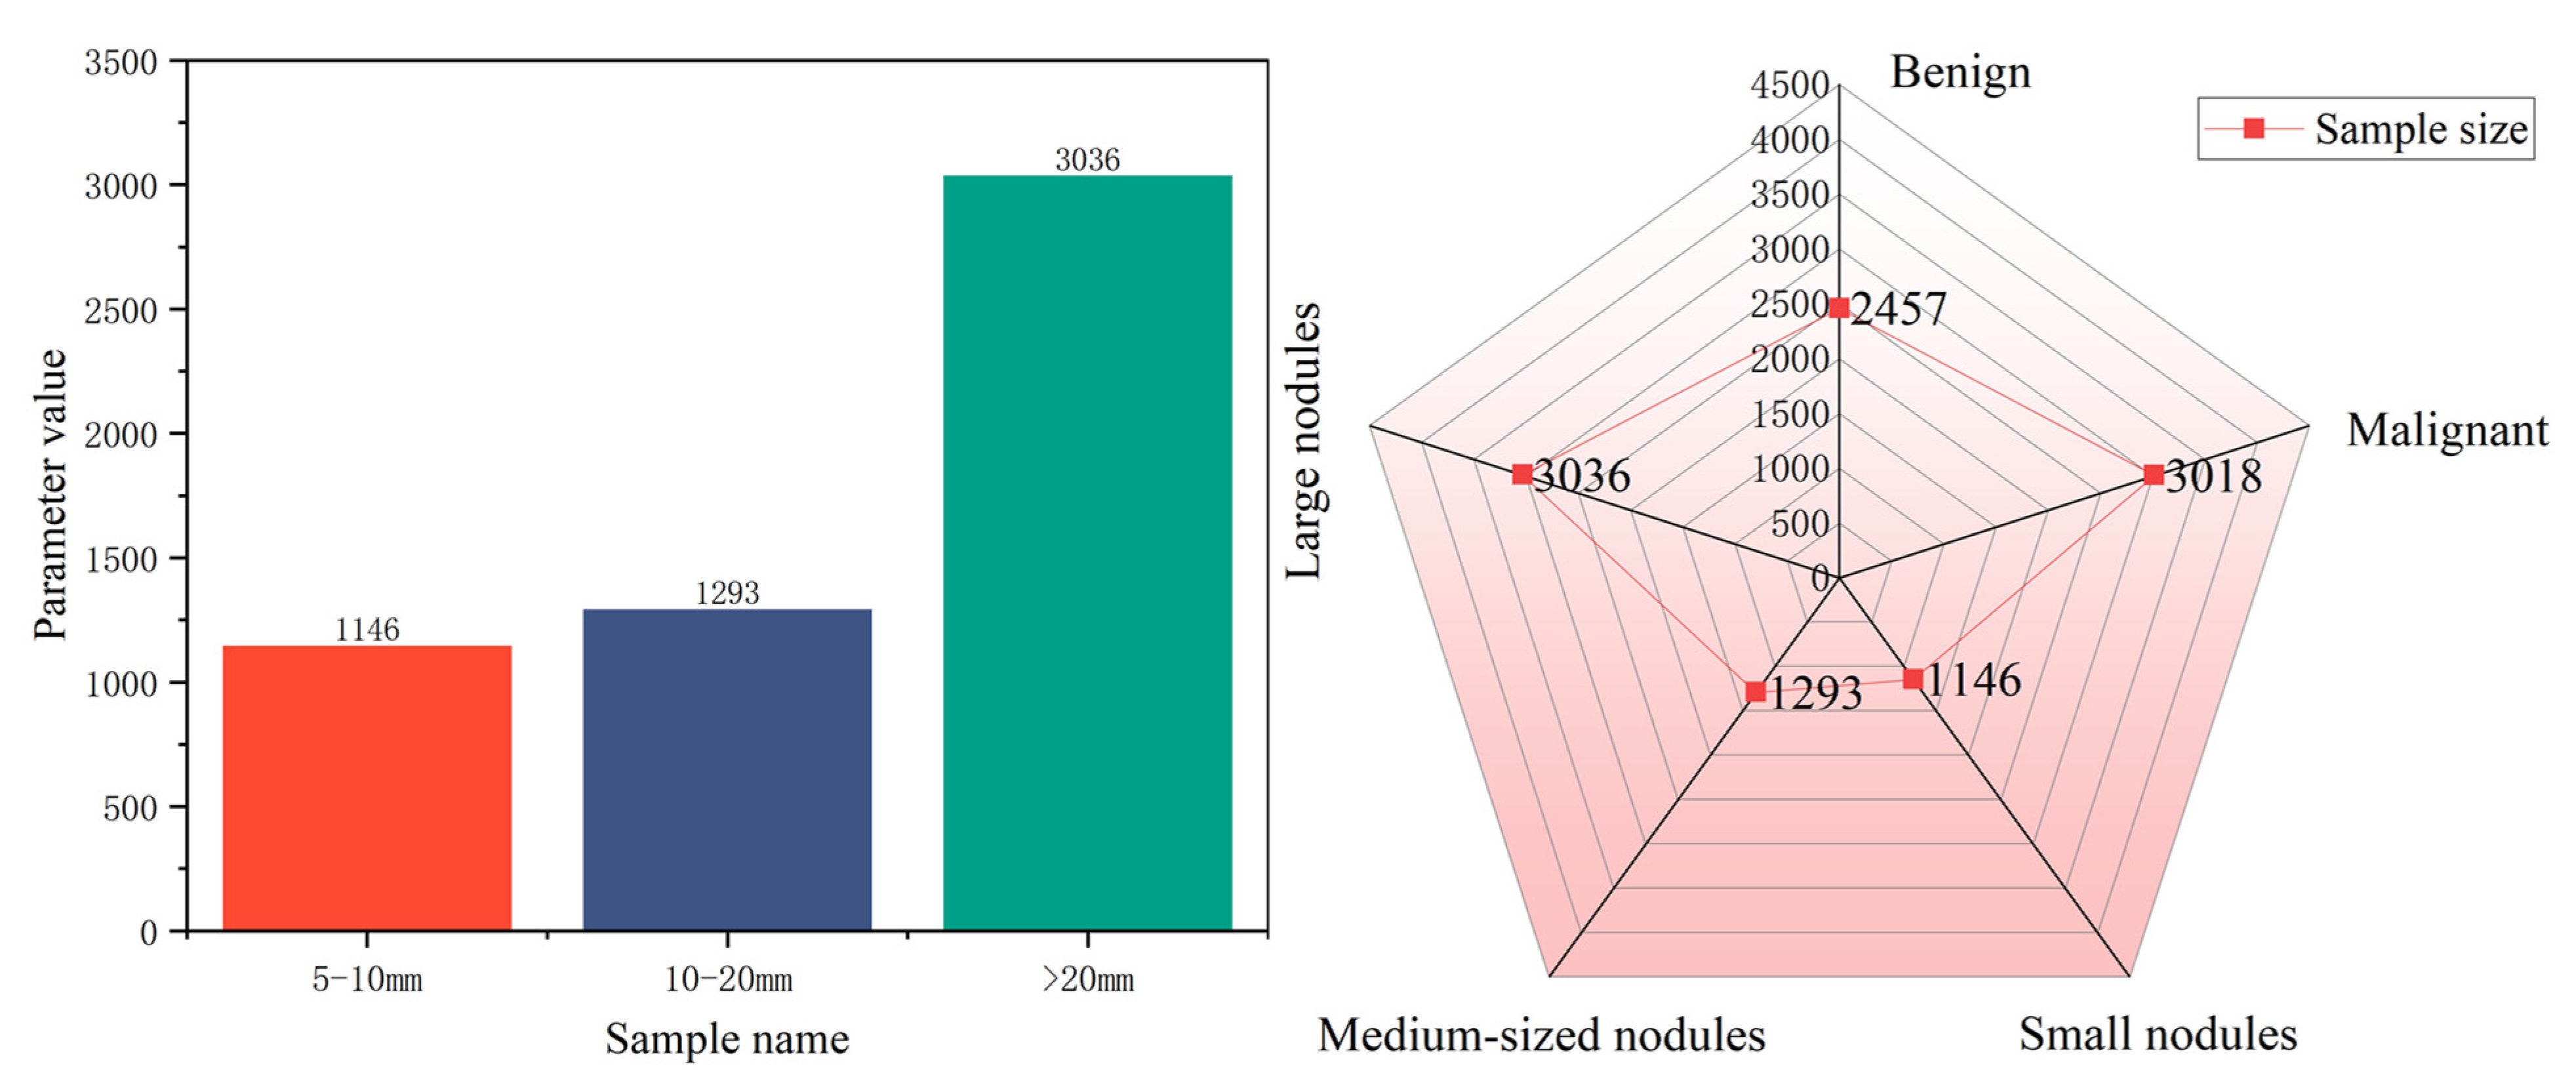
In this study, two datasets were prepared: a self-built thyroid nodule ultrasound image dataset and the publicly available AIS-Seg dataset. The self-built dataset initially included 816 benign samples and 1015 malignant samples. Four data augmentation techniques were applied to expand the dataset: random horizontal flipping, random rotation, random blurring, and random noise addition. The final dataset contains a total of 5475 ultrasound images, including 2457 benign samples and 3018 malignant samples. As shown in Figure 6, regarding nodule size distribution, the dataset contains 1146 small nodules (5–10 mm, 20.9%), 1293 medium nodules (10–20 mm, 23.6%), and 3036 large nodules (>20 mm, 55.5%).
The self-built dataset was independently annotated by two experienced ultrasound radiologists, each with over six years of clinical experience. Annotation followed the TI-RADS criteria and used the LabelImg tool to define bounding boxes. Consistency was measured using the Kappa coefficient (0.83) and mean IoU (0.91). Any discrepancies between the two radiologists were subsequently reviewed and resolved by a senior chief physician.
Both datasets were divided into training, validation, and testing sets in a 7:2:1 ratio. To further reduce splitting bias, five-fold cross-validation was performed, resulting in an average mAP of 80.8% ( ± 0.5 ), which is essentially consistent with the single split result. The datasets are suitable for tasks such as classification, segmentation, and object detection, and can support comprehensive model evaluation. The laboratory data in this paper have undergone rigorous ethical processing to ensure compliance with research integrity and ethical standards. Based on the premise of protecting patient privacy, all experimental data involved in this paper have not been made public.

4.2. Experimental Setup

The experiment was carried out on an NVIDIA GeForce RTX 4090 GPU (24 GB VRAM) hardware platform, with software dependencies, including the PyTorch 2.0.1 framework, Python 3.7 programming environment, and CUDA 11.7 acceleration library. Due to the differences in thyroid object detection scenarios, all baseline models were retrained from scratch using the same data augmentation, epochs, and hyperparameters, without reusing pre-existing weights. The model initialization did not employ pre-trained weights from the COCO dataset. Input images were uniformly resized to 640 × 640 pixels, the training batch size was set to 16, and the complete training process spanned 150 epochs.

4.3. Evaluation Metrics

Considering the significant differences in the thyroid datasets used, annotation specifications, and preprocessing procedures, direct quantitative comparisons across papers can easily introduce uncontrollable biases. Therefore, this paper verifies the independent contribution of each module to detection accuracy and inference efficiency through unified datasets and ablation experiments. To quantify and compare the performance of the proposed model and the contrast models in breast ultrasound image detection, four classic quantitative evaluation metrics were selected: Precision, Recall, Frames Per Second (FPS), F1-score, and mean Average Precision (mAP@50). Higher values for these four metrics indicate better model performance. In addition, computational complexity (GFLOPs) and resource requirements (Param) were also chosen.

4.4. Method Comparison and Results Analysis

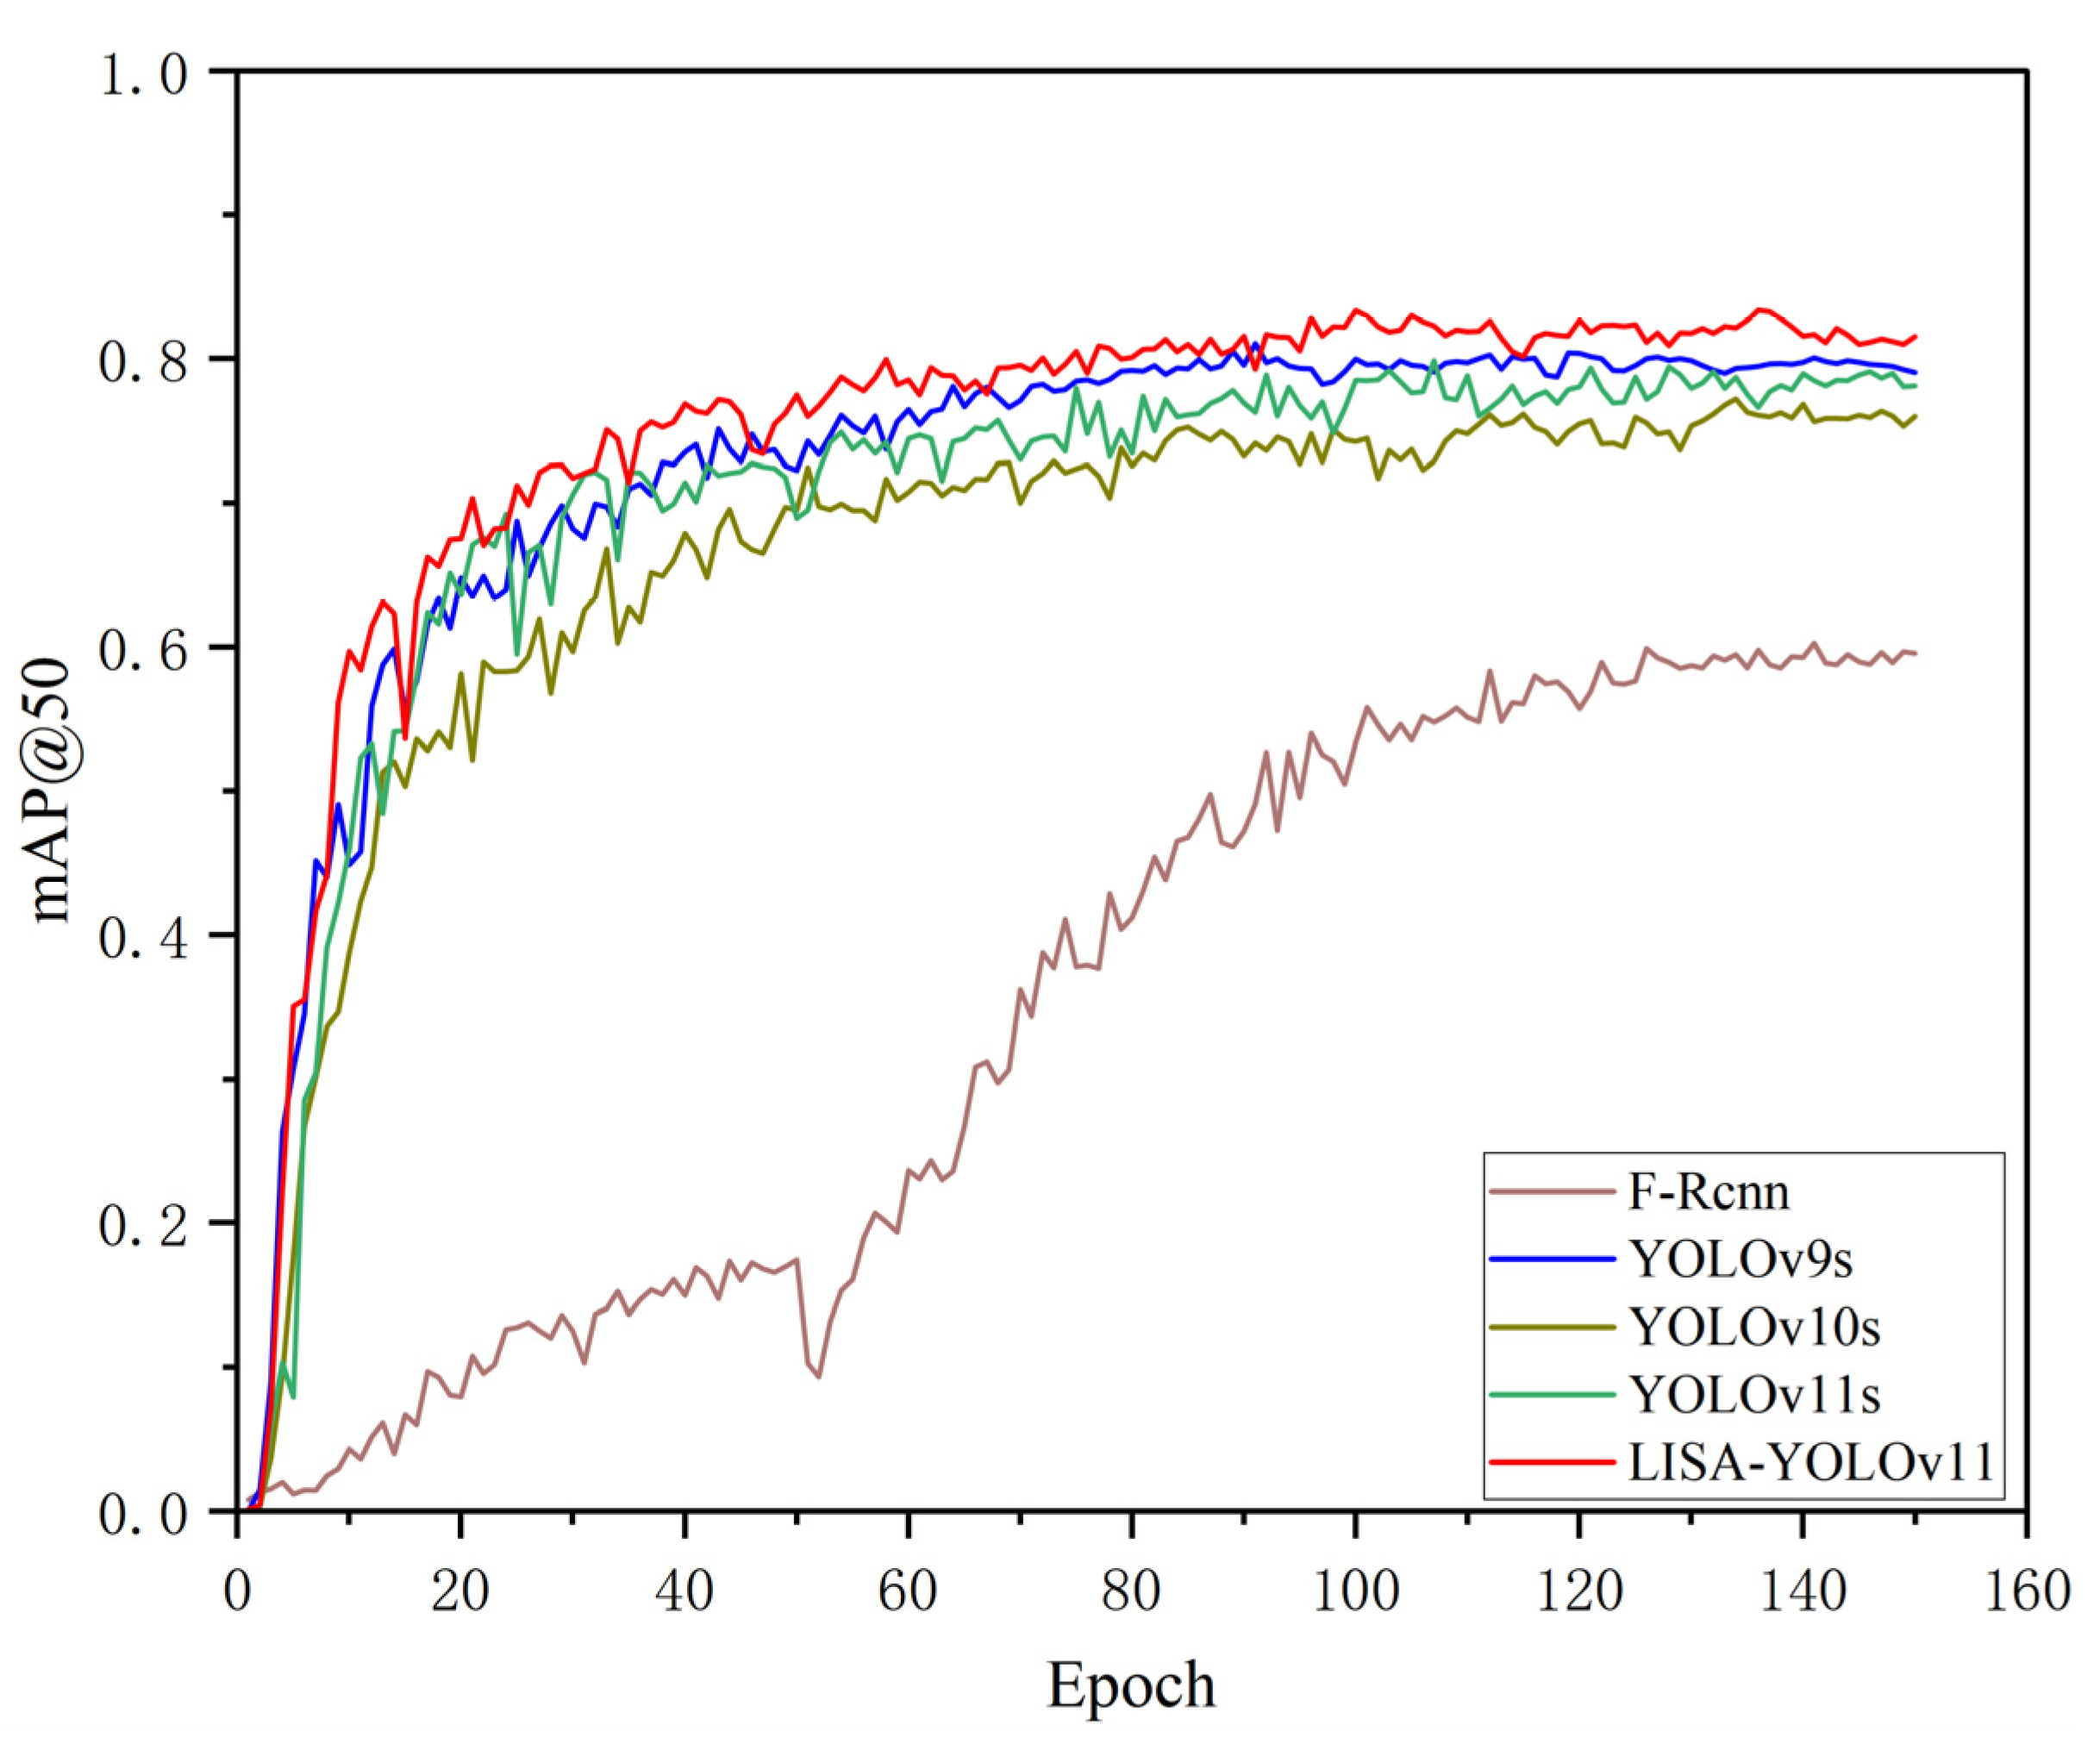
For the thyroid tumor ultrasound image detection task, this study systematically compares the improved model with several mainstream open-source models. This research selects Faster R-CNN, along with YOLO series models v9, v10, and v11, and the enhanced LISA-YOLOv11 model as reference benchmarks. As shown in Figure 7, training and testing were conducted on a self-constructed thyroid tumor ultrasound image dataset, providing a clear visualization of each model’s performance differences in the key metric mean Average Precision (mAP) for thyroid tumor detection.

4.4.1. Module Performance Comparison

To comprehensively verify the effectiveness and superiority of each key module in the proposed method, this paper will add more targeted lightweight design, small object detection, and feature extraction comparison experiments based on the original experimental design. By comparing each module with the current baseline model, the impact of this design on the overall model performance will be comprehensively evaluated.
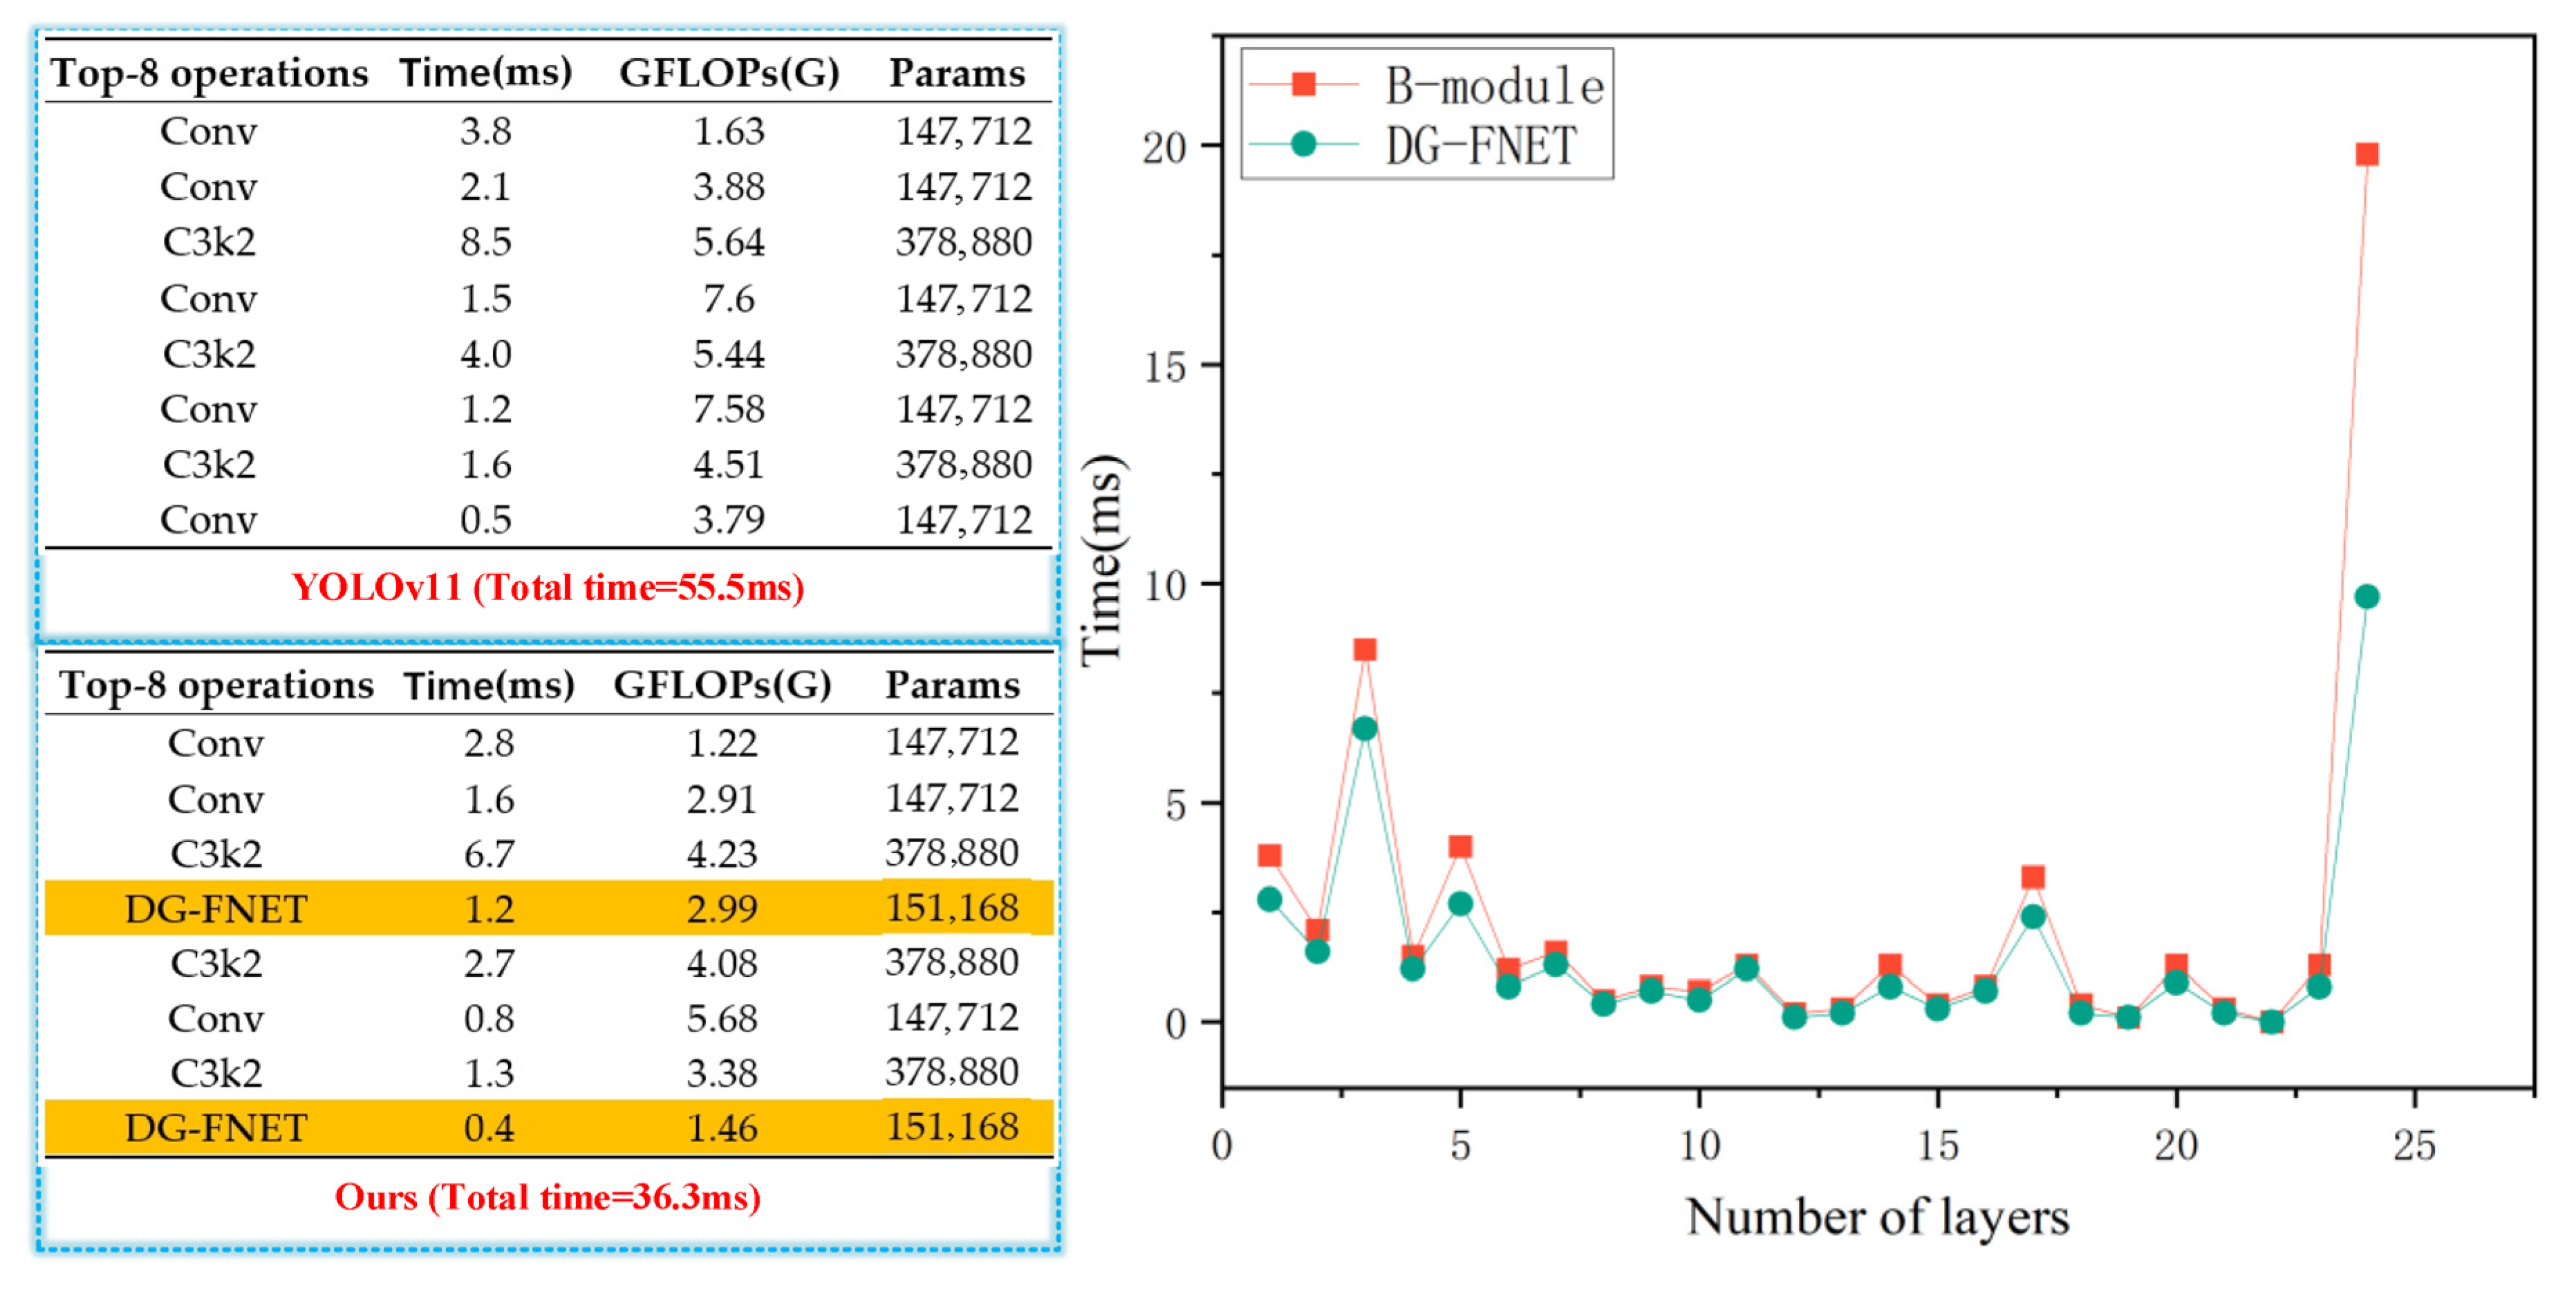
In terms of lightweight design, this study selects YOLOv11s (B-module) as the basic architecture and constructs a comparison model by introducing DG-FNET (referred to as the lightweight module). Mobile terminal testing experiments were also conducted in Section 4.4.3 to demonstrate the effectiveness of the lightweight design. This experiment focuses on extracting the computation time, floating-point operations (GFLOPs), and parameter size (Params) of each layer in the backbone network to evaluate the optimization effect of model lightweight. Considering the large total number of parameters, only the key data of the first eight layers are shown.
Based on the test results analysis, the processing time for the B-module is 55.5 milliseconds, while DG-FNET only requires 36.3 milliseconds. As shown in Figure 8, the comparison of layer-wise time consumption clearly demonstrates that the lightweight architecture designed in this study has a significant advantage in processing efficiency at each layer. Furthermore, the GFLOPs data per layer shown in Figure 9 indicates that the computational complexity of the new model is significantly reduced, resulting in better overall performance. The experimental data fully validates the effectiveness of the lightweight scheme proposed in this paper.
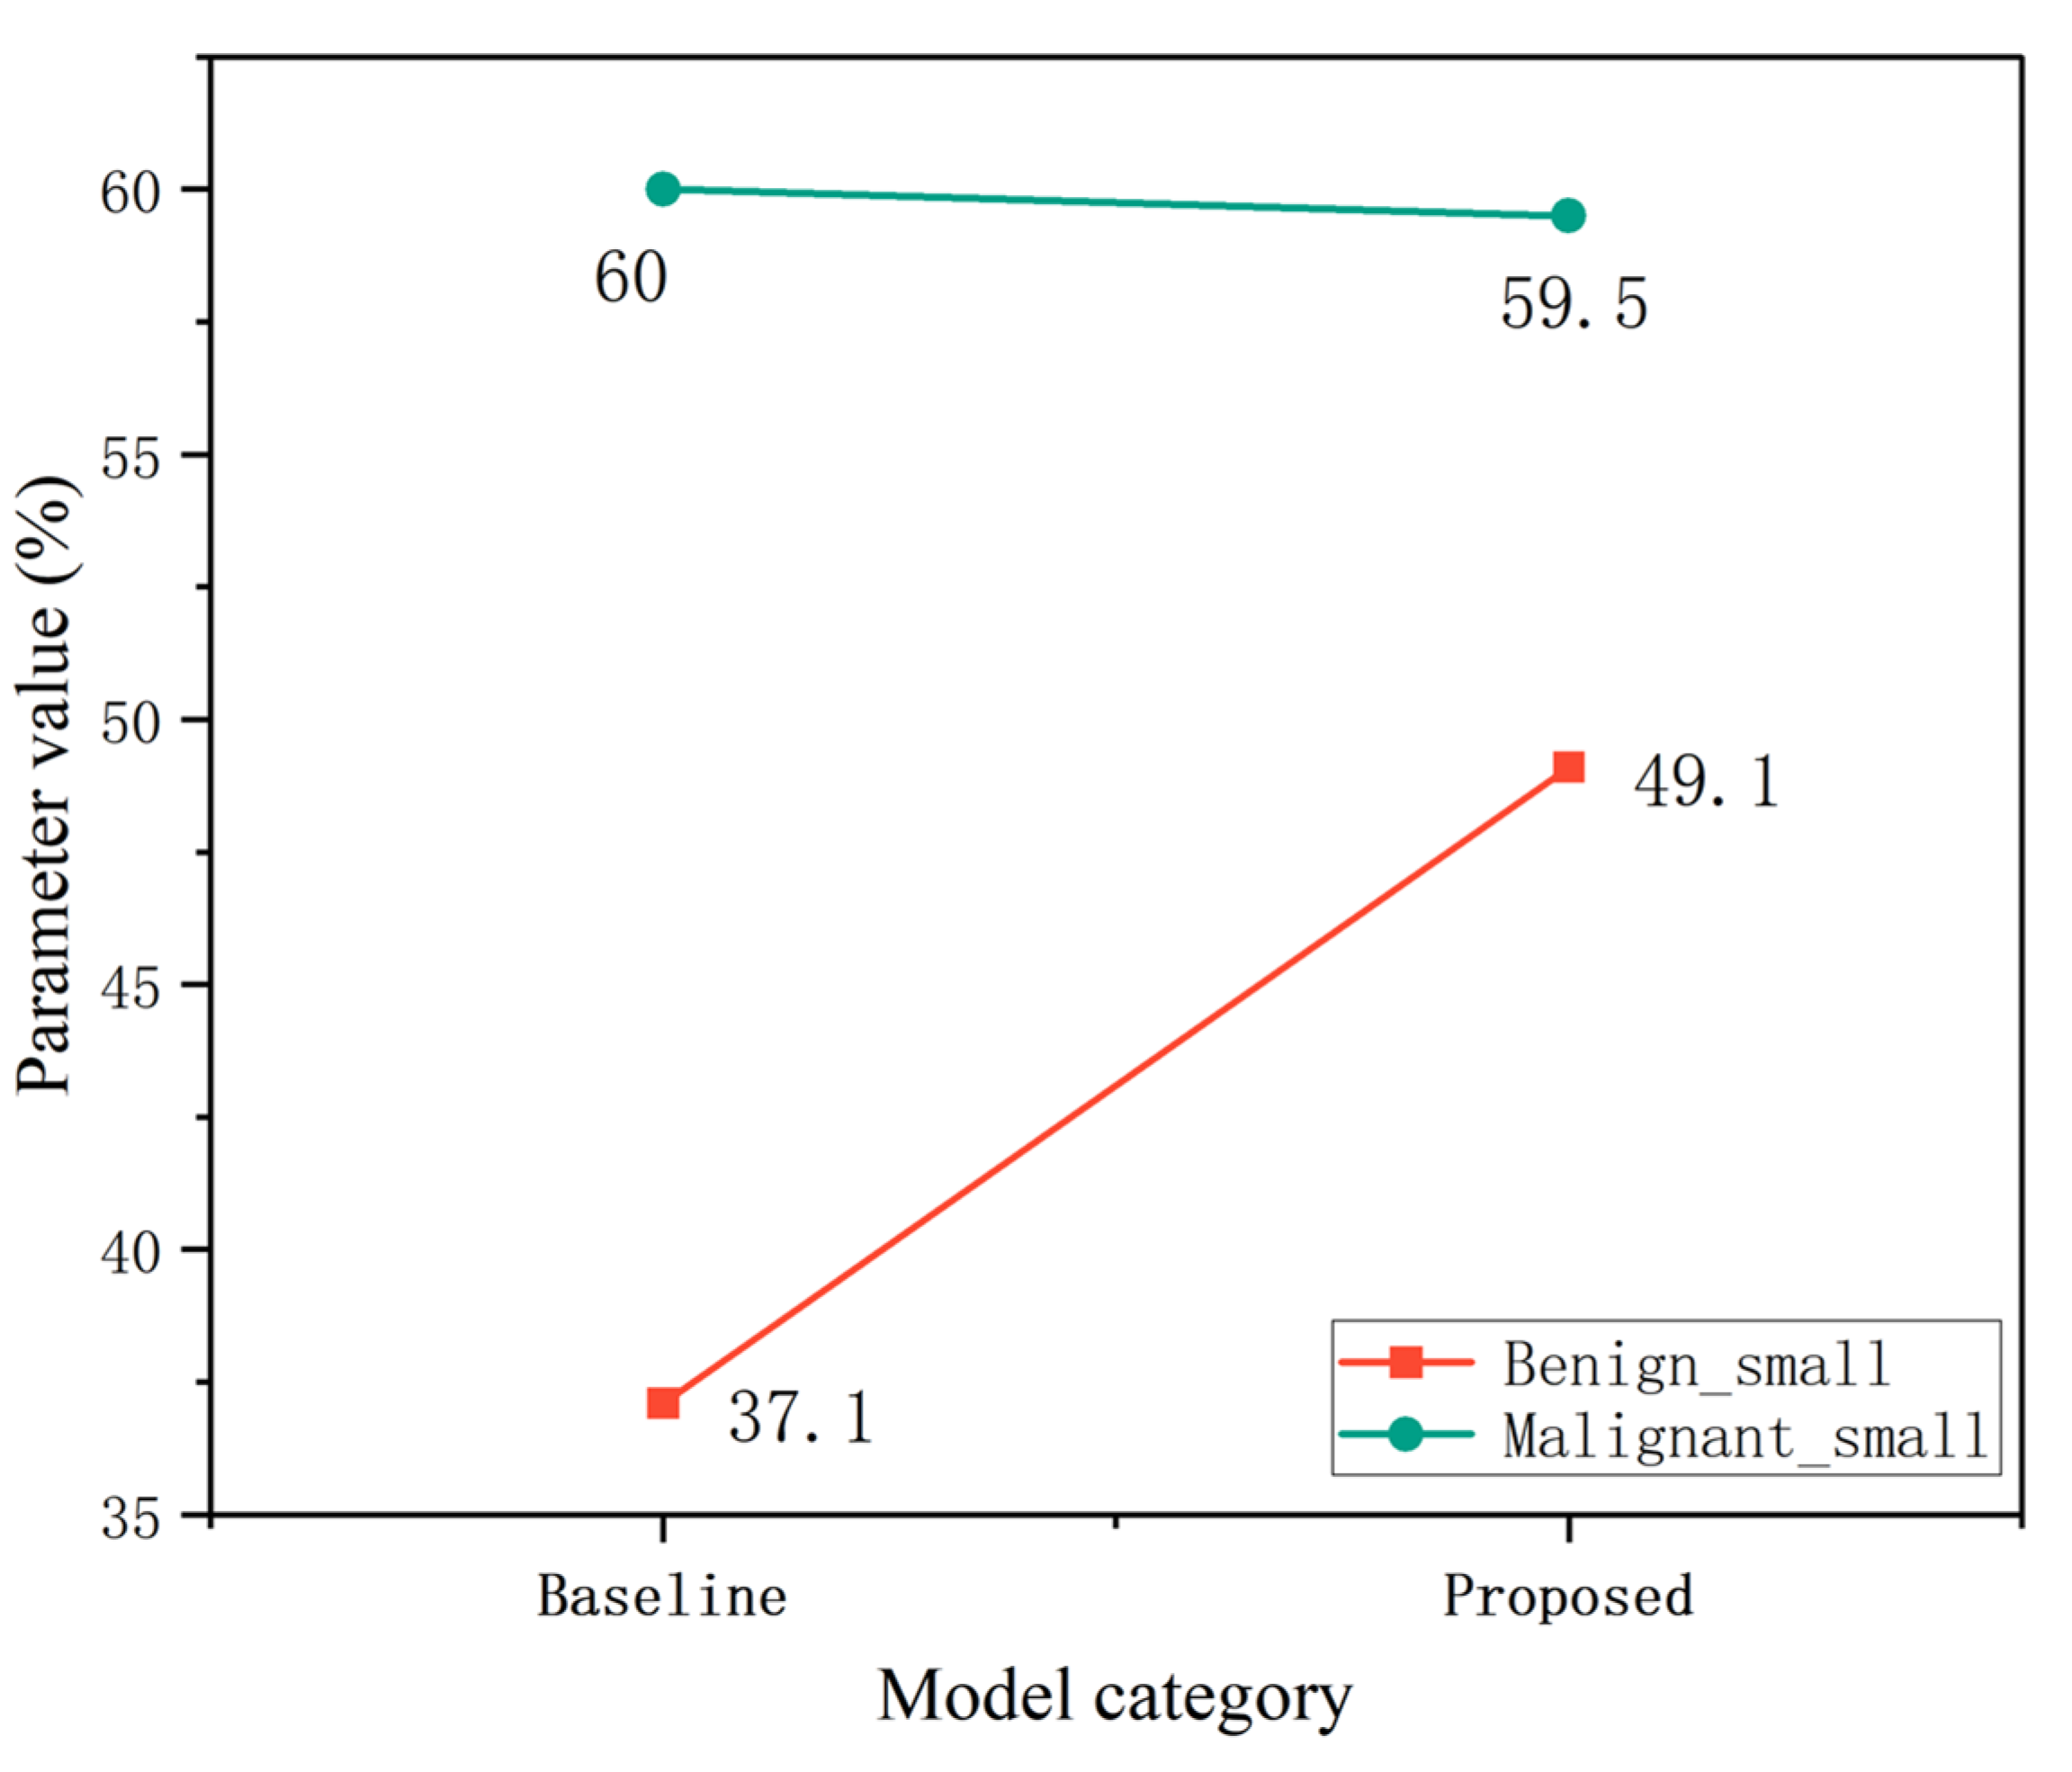
As shown in Table 1, the proposed model outperformed the baseline (YOLOv11) model in detecting both benign and malignant small lesions. Specifically, for benign small nodules, the average precision (AP) increased from 69.1% to 69.3%, an improvement of 0.2%. For malignant small nodules, the AP improved more significantly, from 76.8% to 80.4%, an increase of 3.6%. These results indicate that the proposed method enhances the detection capability of small-sized lesions, especially in malignant cases, which are more clinically significant.
To evaluate the effectiveness of the proposed method in detecting small thyroid tumor targets, we conducted a dedicated experiment focusing on small objects. A total of 1146 images containing benign and malignant small nodules (defined as a size of 640 × 640 ) were extracted from the original dataset. In addition, 853 small object images were collected from public datasets to ensure broader generalization.
As shown in Figure 10, the detection performance of the baseline model and the improved model in two categories, Benign_small and Malignant_small, is visualized. This clearly illustrates the performance gap between the baseline model and the proposed model, especially in the malignant category. The improvement in small object detection accuracy can be attributed to the improved feature representation and discriminative power of the model, which enables it to better locate and classify nodules with limited spatial information. This improvement further demonstrates the effectiveness of the network structure improvements proposed in this paper in improving the accuracy of small object detection in the thyroid.
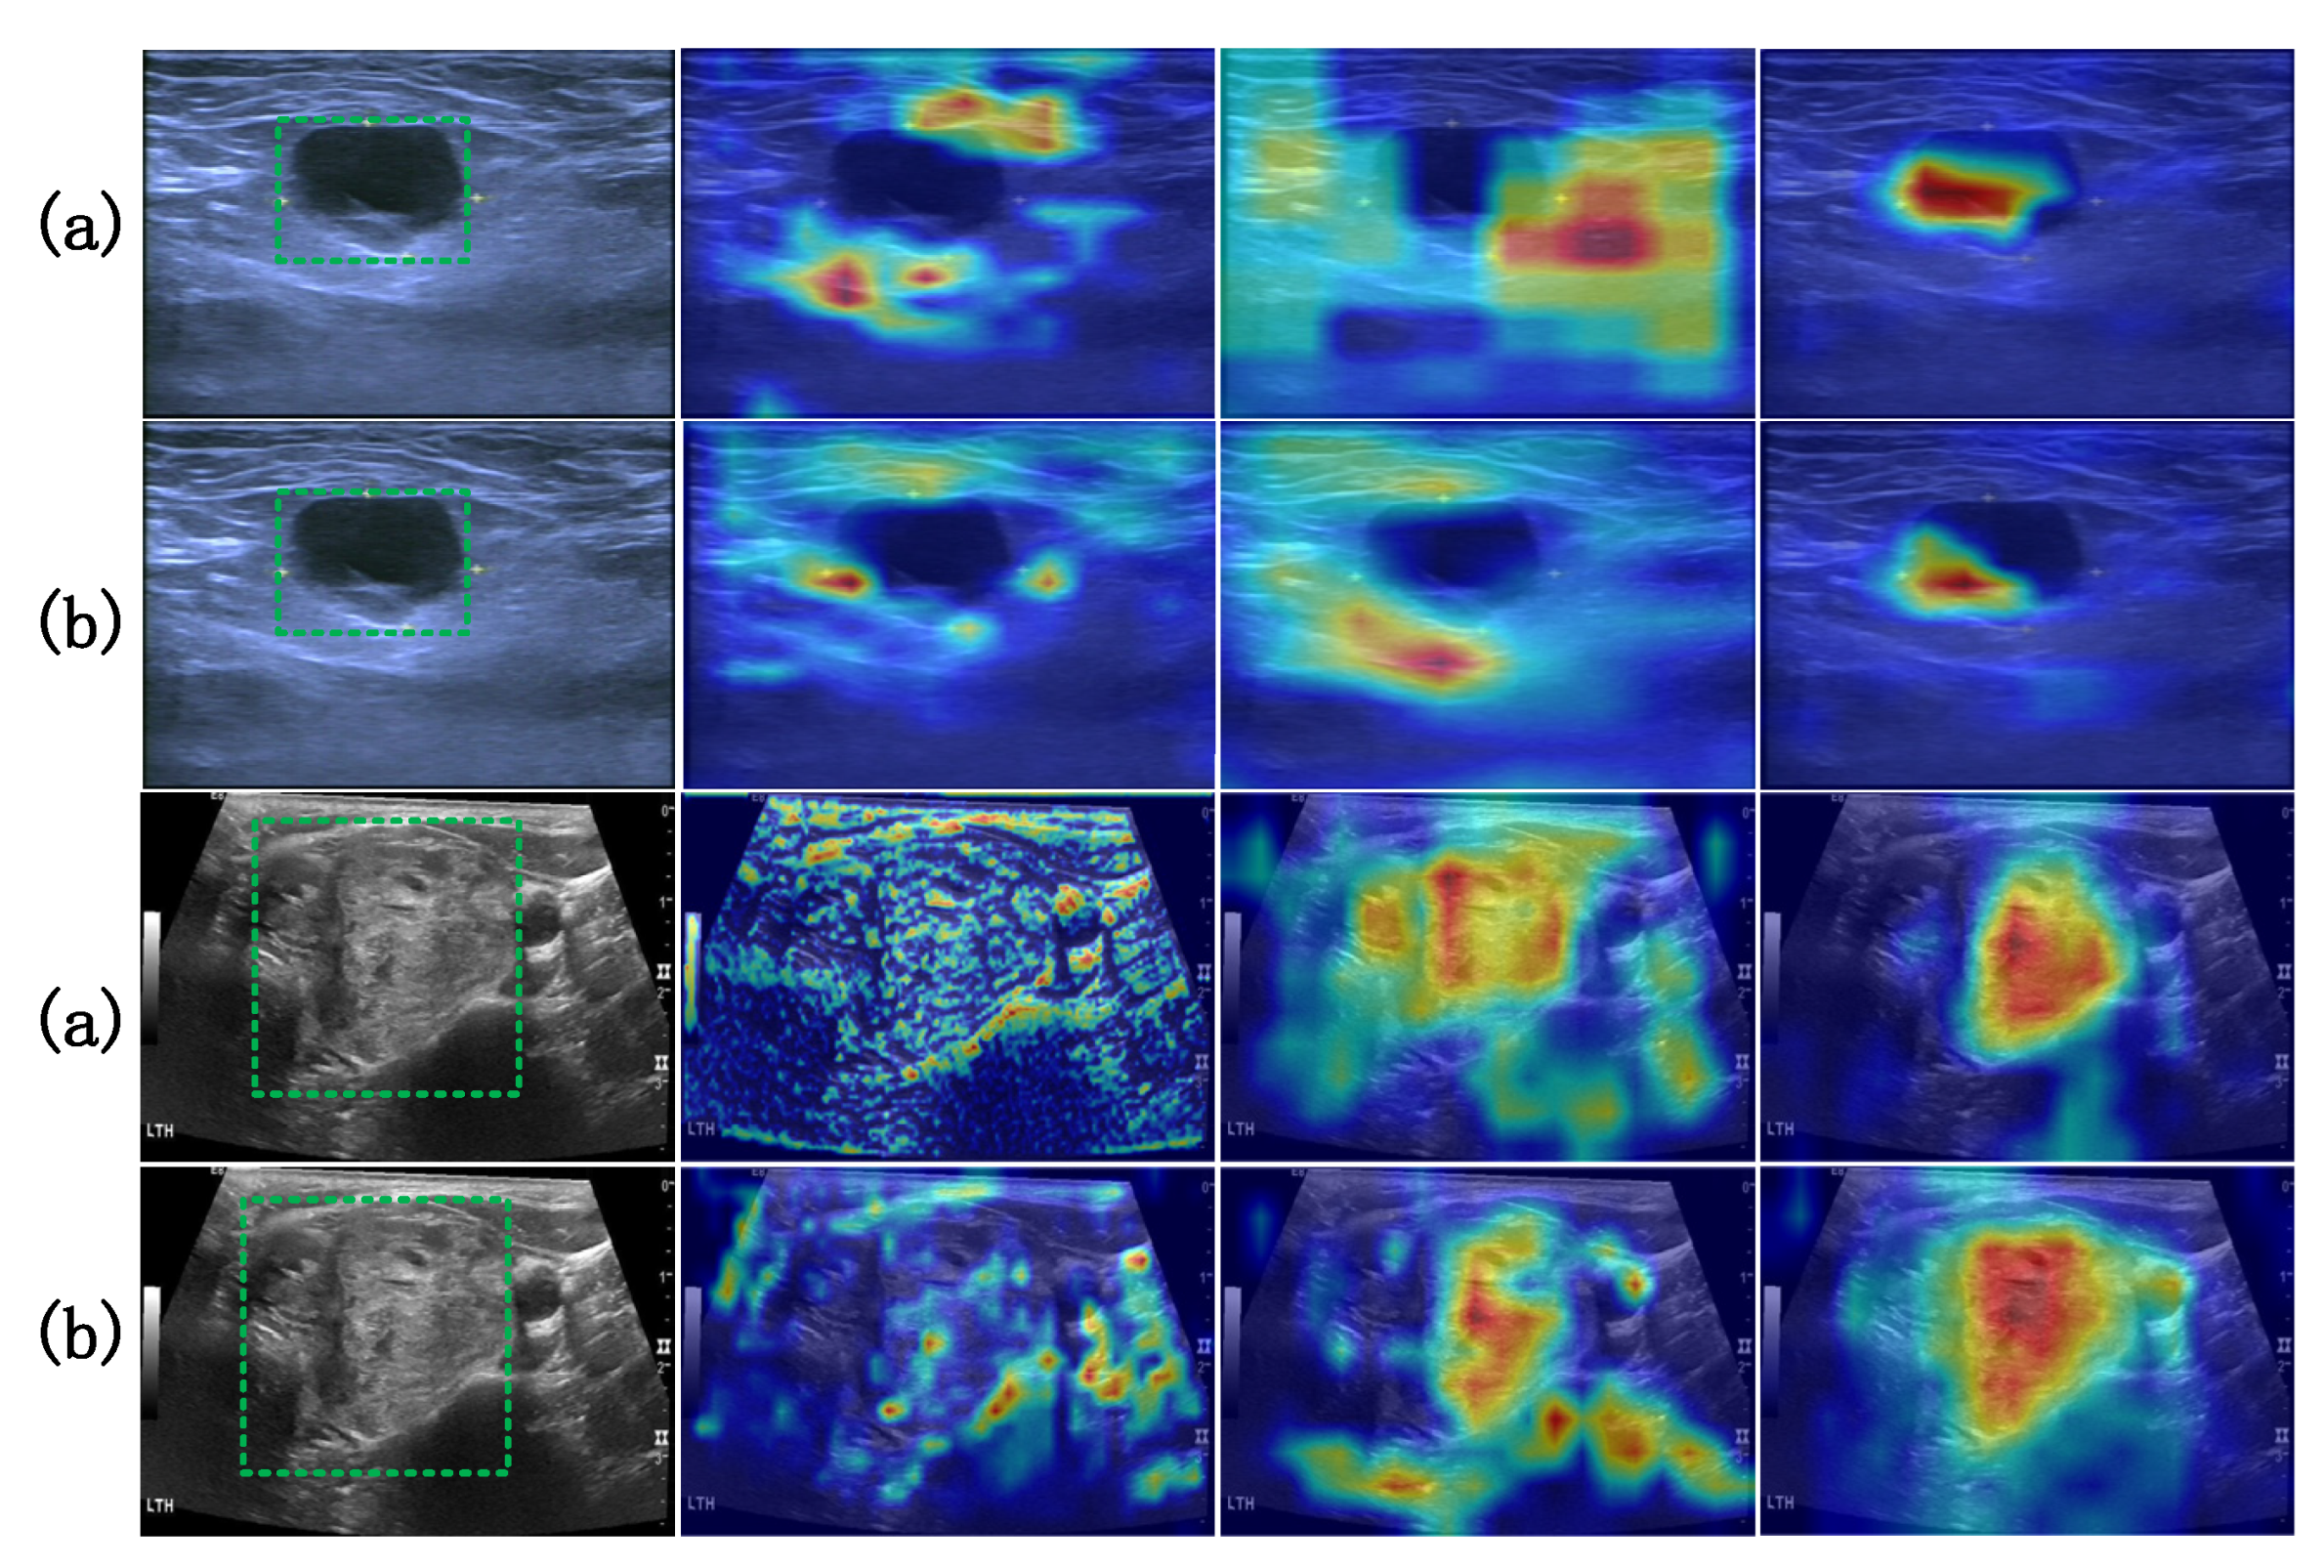
This paper employs the Grad-CAM method to verify the effectiveness of the improved model in feature extraction from lesion areas. Activation maps of the baseline model and the improved model at different convolutional layers (layer 6, layer 11, layer 16) were visualized and analyzed. The heatmap results, as shown in Figure 11, intuitively reflect the distribution of regions that the model focuses on during the decision-making process.
As shown in Figure 11, the lesion areas in the original images are identified with added green dashed boxes. From the visualization results, it can be seen that the improved model exhibits more concentrated activation regions at all levels. Especially in the deep feature maps of the 11th and 16th layers, its focus area is clearly concentrated on the actual lesion area, with clear boundaries and strong localization ability. In contrast, the baseline model shows dispersed activation regions, blurred boundaries, and even deviations from the lesion area at the same levels, reflecting its shortcomings in extracting key semantic features. This comparative result indicates that the improved model has stronger discrimination and sensitivity in deep semantic feature expression, and can more effectively focus on lesion-related regional information, thereby improving the overall diagnostic accuracy and interpretability. It also further verifies the effectiveness and rationality of the network structure improvement proposed in this paper in terms of feature extraction capabilities.

4.4.2. Method Comparison

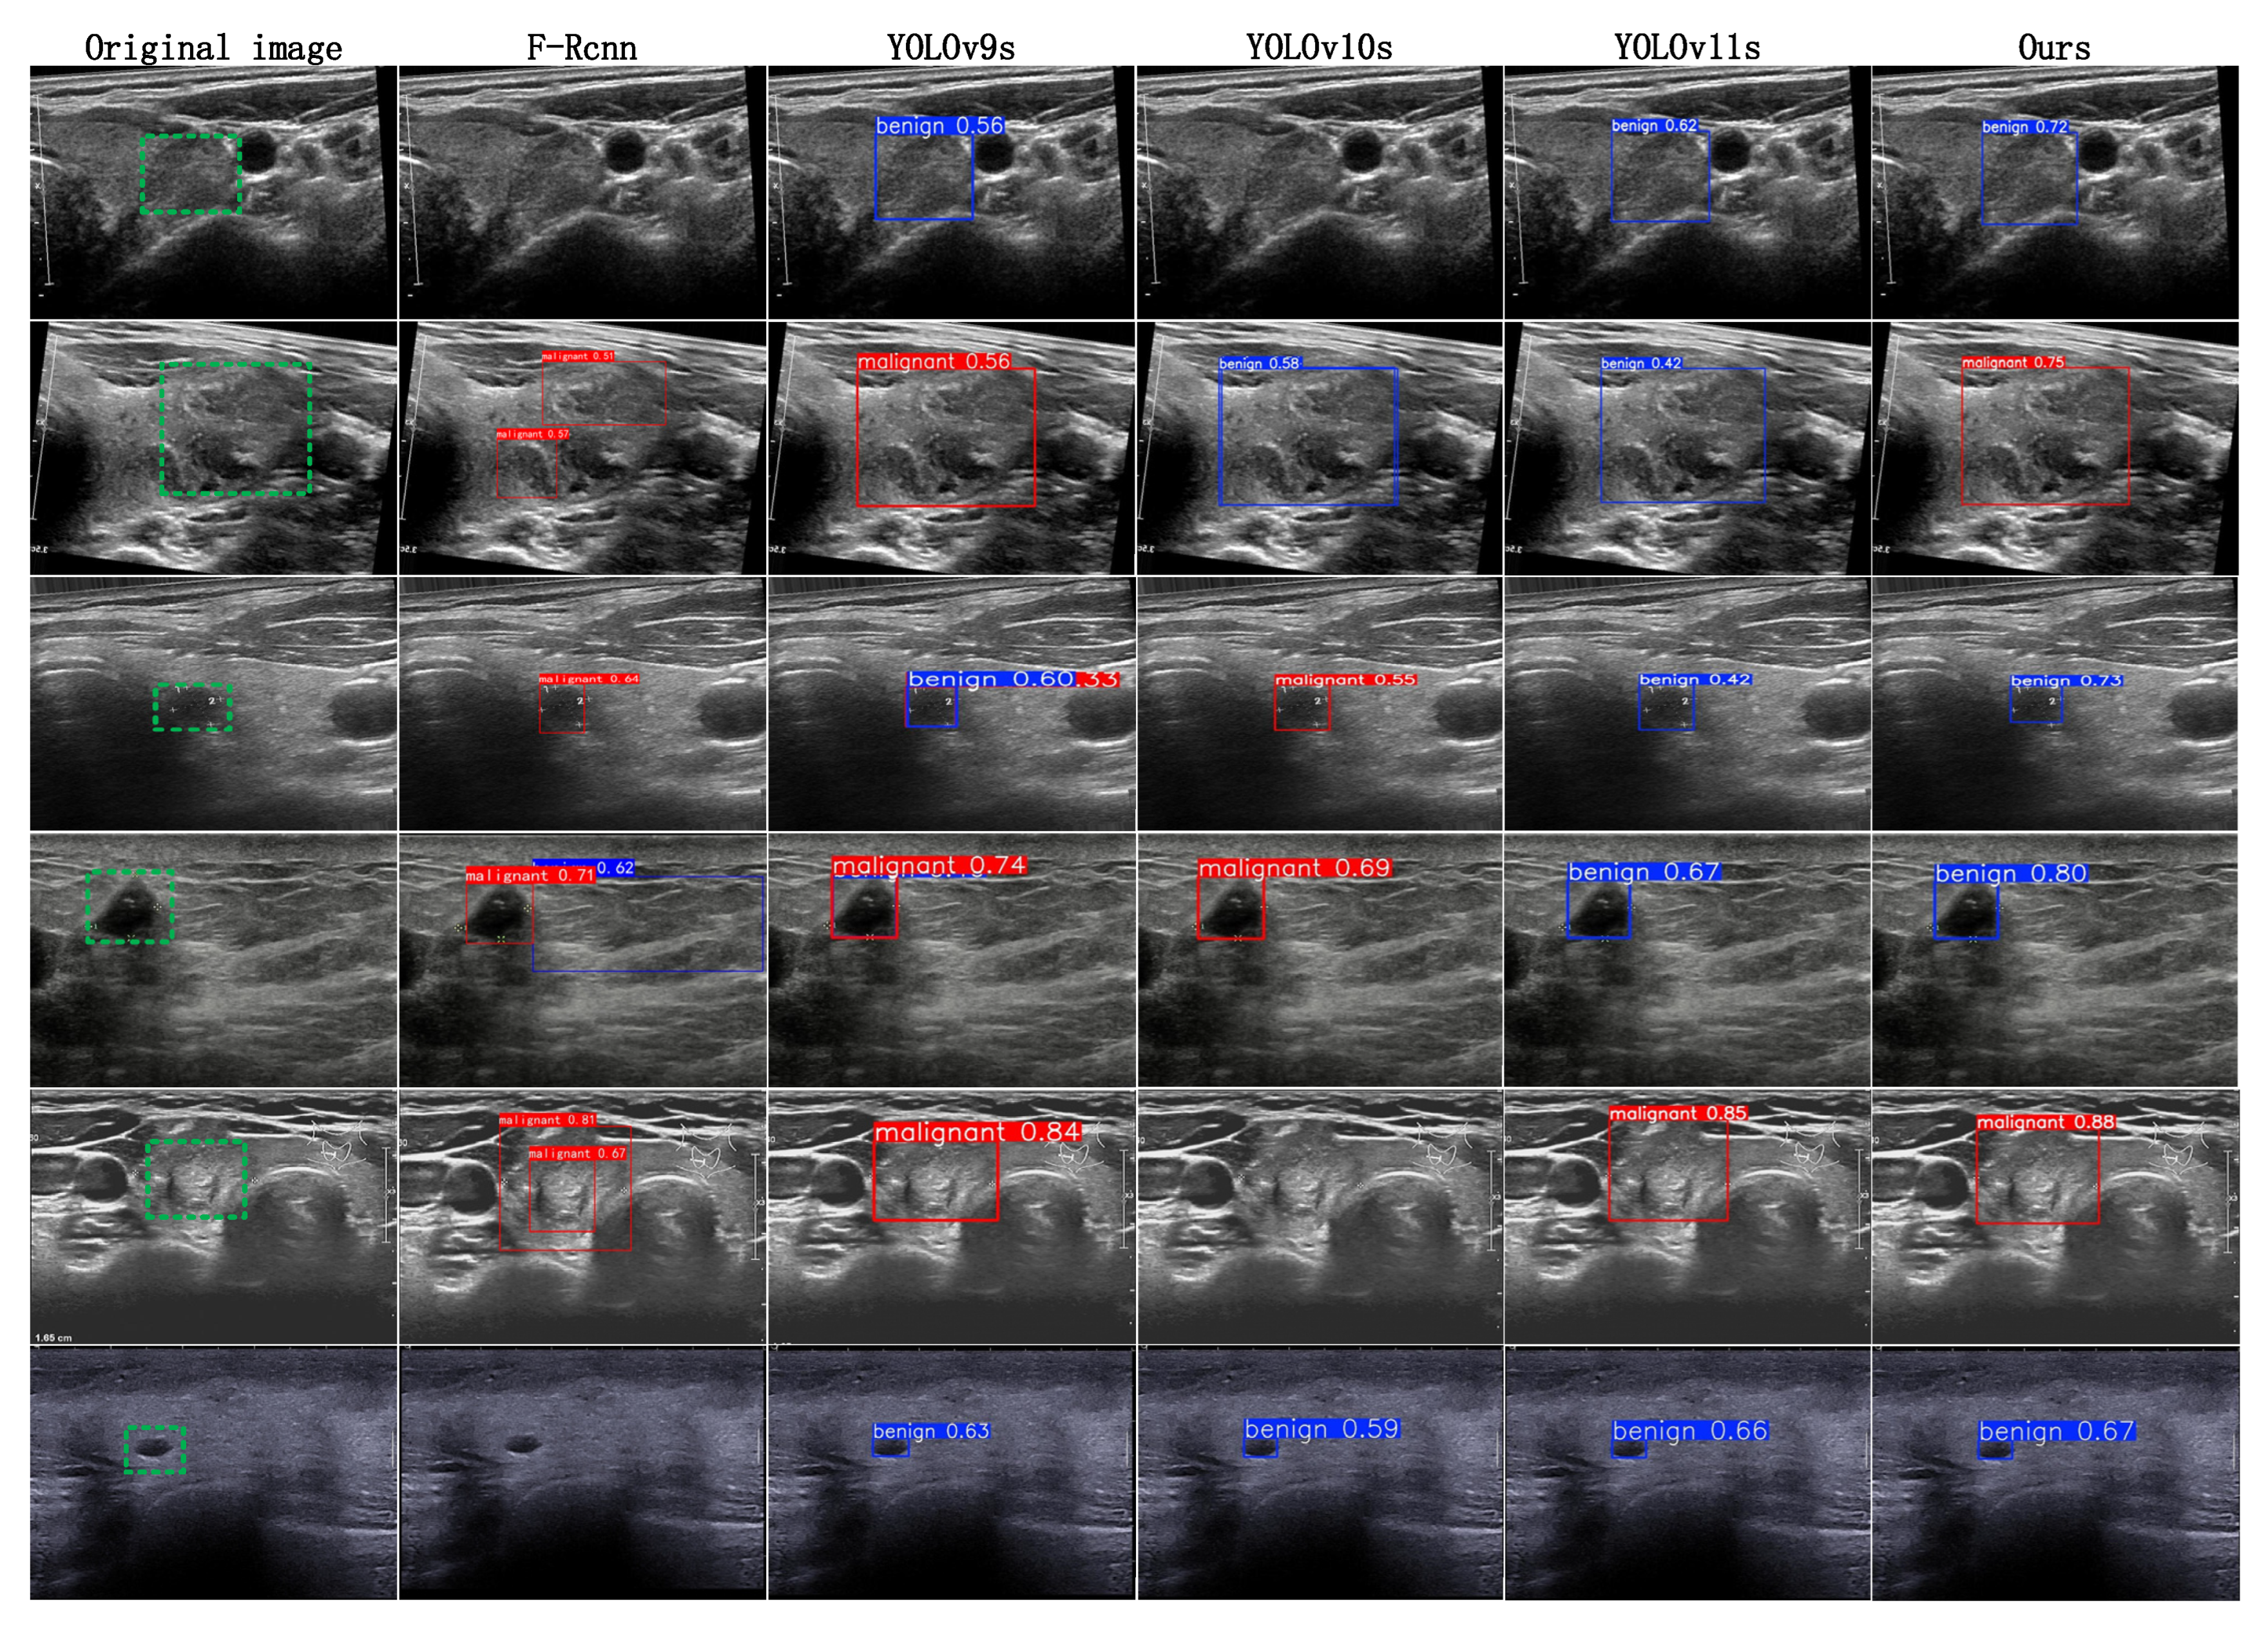
To validate the detection performance of the LISA-YOLOv11 model, this paper conducted a comparative analysis using both public and self-built ultrasound image datasets. The lesion areas in the original images are identified with green dashed boxes. In the experimental data, the first three rows of samples are from a public database, while the latter three rows are self-collected data. The analysis of the detection results in Figure 12 indicates that in the first row of tests, the model demonstrates optimal lesion recognition accuracy and effectively avoids missed detections in the tracheal region; in the second and fifth test groups, the algorithm’s localization and recognition accuracy for malignant lesions also surpass other comparative methods. From the prediction results in the third and fourth rows, it is evident that the model can accurately identify minute benign lesions, effectively preventing misjudgments, and its detection precision remains at a leading level. Furthermore, in the sixth row’s prediction results, this model similarly exhibits precise recognition capabilities for tiny benign lesions, successfully eliminating missed diagnoses, and its accuracy remains optimal.
This paper compares four deep learning image detection methods with the newly proposed method. The specific performance data evaluated on the self-built data training set is detailed in Table 2, Table 3 and Table 4. Among them, Table 3 focuses on presenting the detection performance of benign thyroid tumors, while Table 4 focuses on showcasing the detection performance of malignant tumors. The experimental data shows that the LISA-YOLOv11 model developed in this paper, based on the YOLOv11 framework, has achieved significant improvements in several key indicators compared to the baseline detection network.
As can be seen from the overall data in Table 2, the method in this paper achieves significant performance improvements: mAP increased by 4.5%; F1 increased by 2.3%, Recall increased by 3.9%, and Precision increased by 0.5%. Significant progress has also been made in the real-time processing capability of this model. Compared with the baseline model, the FPS index increased by 9.0, and the model complexity GFLOPs decreased from 6.1 to 5.8, which is in line with the lightweight design goal.
As can be seen from the data in Table 3 for the performance of benign thyroid tumors, although Precision and F1 did not improve due to insufficient benign samples, mAP still increased by 3.8%, and Recall increased by 1.9%. From the data in Table 4 for the performance of malignant tumors, it can be seen that all indicators have been significantly improved: mAP increased by 5.1%; F1 increased by 5.0%; Recall increased by 5.9%, and Precision increased by 4.1%.
The specific performance data evaluated on the public AIS-Seg dataset is detailed in Table 5, Table 6 and Table 7. Among them, Table 6 focuses on presenting the detection performance of benign thyroid tumors, while Table 7 focuses on showcasing the detection performance of malignant tumors. The experimental data shows that the LISA-YOLOv11 model developed in this paper, based on the YOLOv11 framework, has achieved significant improvements in several key indicators compared to the baseline detection network.
An analysis of the data in Table 5 reveals that the algorithm proposed in this study achieved significant optimization across all performance metrics: Precision showed the most prominent increase, improving by 4.3% from its original level; F1 followed with a 3.8% increase; Recall grew by 3.3%, and mAP also advanced by 1.8%. Breakthrough progress was also made in model processing efficiency, with the FPS metric increasing by 6.0 points compared to the baseline model.
Based on the thyroid benign tumor detection results in Table 6, all evaluation metrics showed significant improvement, with Precision demonstrating the most prominent increase at 6.2%. Recall rose by 2.5%; the F1 grew by 4.3%, and mAP increased by 1.6%. Similarly, the malignant tumor detection data in Table 7 revealed clear enhancements across all performance indicators. Here, Recall exhibited the most significant growth, increasing by 4.1%, while Precision went up by 2.2%; the F1 grew by 3.2%, and mAP improved by 1.9%.

4.4.3. Benchmarking Strategy Across Devices

In this paper, to evaluate the actual performance and deployment efficiency of the proposed model on mobile terminals, comprehensive experiments were conducted on mobile terminals with typical hardware differences. These devices are classified according to computing power: high-end model (Model A), mid-range model (Model B), and low-end model (Model C). The trained model weight files were installed on each terminal to evaluate the model’s performance under different hardware conditions. Table 8 lists the detailed hardware configurations, including CPU type, GPU model, and RAM size.
In this paper, 300 samples were randomly selected for experimental evaluation. Table 9 summarizes the inference performance of the proposed model on each device, including CPU and GPU memory consumption, frames per second (FPS), and total inference time. The results show that the proposed model exhibits good performance on all three hardware platforms. Specifically, Model A achieved the fastest inference speed, with an average frame rate of 21.6 FPS and the lowest GPU memory consumption (392.81 MB), while maintaining low latency (10.04 s per inference session). Even on the resource-constrained Model C, the model maintained acceptable performance, with a frame rate of 17.5 FPS and a total GPU memory usage of 1270.17 MB.
Figure 13 visually compares the differences in memory footprint between the baseline model and the new model. The first row of data presents the memory performance of the baseline model, while the second row shows the memory status of the proposed model. The test data on the three terminals shows that the proposed model has achieved a significant reduction in memory usage on both the CPU and GPU. Of particular note is that on the Model C device, the baseline model experienced an abnormal increase in graphics processor memory during operation. In contrast, the proposed model maintained a flatter memory usage curve, indicating improved deployment stability and efficiency. These results collectively verify that the proposed model not only maintains competitive detection performance but also achieves lower memory overhead and inference latency.

4.4.4. Ablation Study

This paper validates the effectiveness of the LISA-YOLOv11 model, with a particular focus on an in-depth analysis of its three key modules: the lightweight network structure DG-FNET, the dynamic multi-scale feature integration unit IMSF-NET, and the synergistic attention mechanism SAF-NET. Based on a controlled experimental design, this paper uses YOLOv11 as a reference model and conducts a comprehensive performance comparison by systematically removing or replacing each module. The experiments utilize a self-built professional dataset, with F1, mAP@50, and FPS as performance evaluation metrics. Detailed evaluation metric data can be found in Table 10, and the experimental data strongly verifies the superiority of the proposed scheme.
As shown in Table 10, system performance significantly improved when using the three modules: DG-FNET (A), IMSF-NET (B), and SAF-NET (C). Specifically, when using module A, the F1 score increased by 0.9%, mAP improved by 2.7%, and FPS increased by 1.0. After using module B, the F1 score grew by 1.2%, mAP rose by 2.8%, and FPS increased by 0.8. Upon introducing module C, although F1 only slightly increased by 0.1%, mAP improved by 2.4%, and FPS significantly increased by 2.6. Under the dual-module benchmark framework, the combination of A and C showed significant advantages, with an F1 increase of 1.6%, mAP improvement of 3.9%, and FPS increase of 4.6. By integrating and optimizing the three major modules A, B, and C, the model proposed in this paper achieved optimal performance, with its F1 score increasing by 2.3%, mAP improving by 4.5%, and FPS increasing by 9.0, reaching the anticipated targets for all performance indicators.

5. Conclusions

This paper introduces an innovative network model, LISA-YOLO, for the efficient detection of thyroid nodules in ultrasound images. This model primarily addresses critical challenges such as small object detection under limited computational resources. Our approach integrates three core modules: DG-FNet, IMSF-Net, and SAF-Net, each designed to optimize computational efficiency, enhance detection accuracy, and improve small object sensitivity, respectively. Through extensive experimental evaluation, we demonstrate that the LISA-YOLO model significantly outperforms existing YOLO-based models and traditional deep learning frameworks in terms of F1 score, mAP, and FPS, while simultaneously reducing computational complexity.
This paper adopts a unique feature fusion strategy, coupled with spatial and channel-level attention mechanisms. This design symmetrically integrates both high-level and low-level features, effectively focusing on critical regions in ultrasound images and enhancing this model’s ability to identify subtle lesions. Its lightweight network architecture ensures this model’s feasibility for deployment on mobile devices, enabling thyroid cancer screening in resource-constrained areas. Furthermore, this model’s optimized computational efficiency provides timely diagnostic support, assisting healthcare professionals in making informed decisions.
Despite the significant progress made, there is still room for improvement in small object detection and accuracy. Future plans include introducing richer datasets and novel augmentation techniques to enhance model performance. Secondly, combining a joint multi-task training mechanism for detection and segmentation with multi-modal learning is also a research direction to improve the overall performance of this model.

Author Contributions

Conceptualization, G.F.; methodology, G.F. and G.G.; software, H.F.; validation, W.L.; formal analysis, G.F. and H.F.; investigation, G.F.; resources, G.G. and W.L.; data curation, W.L.; writing—original draft preparation, G.F.; writing—review and editing, G.G. and G.F.; supervision, G.G.; project administration, G.G.; funding acquisition, G.G. and W.L. All authors have read and agreed to the published version of the manuscript.

Funding

This research was funded by the Xinjiang Urumqi Hongshan Science and Technology Innovation Young Talents Program and the Natural Science Foundation of Hebei Province, grant number B241013006 and F2024203049, The APC was funded by B241013006.

Data Availability Statement

AIS-Seg (AI Studio) Thyroid Nodule Ultrasound Image Dataset Access URL: https://aistudio.baidu.com/datasetdetail/289158 (accessed on 15 July 2023). The self-built dataset used in this study cannot be made publicly available. Interested researchers may request a representative subset from the authors, subject to approval from the hospital’s administrative department.

Acknowledgments

The authors have reviewed and edited the output and take full responsibility for the content of this publication.

Conflicts of Interest

The authors declare no conflicts of interest.

References

  1. Sung, H.; Ferlay, J.; Siegel, R.L.; Laversanne, M.; Soerjomataram, I.; Jemal, A.; Bray, F. Global cancer statistics 2020: Globocan estimates of incidence and mortality worldwide for 36 cancers in 185 countries. CA Cancer J. Clin. 2021, 71, 209–249. [Google Scholar] [CrossRef] [PubMed]
  2. Wu, X.; Tan, G.; Luo, H.; Chen, Z.; Pu, B.; Li, S.; Li, K. A knowledge-interpretable multi-task learning framework for automated thyroid nodule diagnosis in ultrasound videos. Med. Image Anal. 2024, 91, 103039. [Google Scholar] [CrossRef] [PubMed]
  3. Sharifi, Y.; Bakhshali, M.A.; Dehghani, T.; DanaiAshgzari, M.; Sargolzaei, M.; Eslami, S. Deep learning on ultrasound images of thyroid nodules. Biocybern. Biomed. Eng. 2021, 41, 636–655. [Google Scholar] [CrossRef]
  4. Yang, D.; Xia, J.; Li, R.; Li, W.; Liu, J.; Wang, R.; Qu, D.; You, J. Automatic thyroid nodule detection in ultrasound imaging with improved yolov5 neural network. IEEE Access 2024, 12, 22662–22670. [Google Scholar] [CrossRef]
  5. Vahdati, S.; Khosravi, B.; Robinson, K.A.; Rouzrokh, P.; Moassefi, M.; Akkus, Z.; Erickson, B.J. A multi-view deep learning model for thyroid nodules detection and characterization in ultrasound imaging. Bioengineering 2024, 11, 648. [Google Scholar] [CrossRef] [PubMed]
  6. Ajilisa, O.A.; Jagathy Raj, V.P.; Sabu, M.K. A deep learning framework for the characterization of thyroid nodules from ultrasound images using improved inception network and multi-level transfer learning. Diagnostics 2023, 13, 2463. [Google Scholar] [CrossRef] [PubMed]
  7. Wang, S.; Zhao, Z.-A.; Chen, Y.; Mao, Y.-J.; Cheung, J.C. Enhancing thyroid nodule detection in ultrasound images: A novel yolov8 architecture with a c2fa module and optimized loss functions. Echnologies 2025, 13, 28. [Google Scholar] [CrossRef]
  8. Yang, X.; Geng, H.; Wang, X.; Li, L.; An, X.; Cong, Z. Identification of lesion location and discrimination between benign and malignant findings in thyroid ultrasound imaging. Sci. Rep. 2024, 14, 32118. [Google Scholar] [CrossRef] [PubMed]
  9. Ekong, F.; Yu, Y.; Patamia, R.A.; Feng, X.; Tang, Q.; Mazumder, P.; Cai, J. Bayesian depth-wise convolutional neural network design for brain tumor mri classification. Diagnostics 2022, 12, 1657. [Google Scholar] [CrossRef] [PubMed]
  10. Cibas, E.S.; Baloch, Z.W.; Fellegara, G.; LiVolsi, V.A.; Raab, S.S.; Rosai, J.; Diggans, J.; Friedman, L.; Kennedy, G.C.; Kloos, R.T.; et al. A prospective assessment defining the limitations of thyroid nodule pathologic evaluation. Ann. Intern. Med. 2013, 159, 325–332. [Google Scholar] [CrossRef] [PubMed]
  11. Cao, Y.; Zhong, X.; Diao, W.; Mu, J.; Cheng, Y.; Jia, Z. Radiomics in differentiated thyroid cancer and nodules: Explorations, application, and limitations. Cancers 2021, 13, 2436. [Google Scholar] [CrossRef] [PubMed]
  12. Tomás, G.; Tarabichi, M.; Gacquer, D.; Hébrant, A.; Dom, G.; Dumont, J.E.; Keutgen, X.; Fahey, T.J.; Maenhaut, C.; Detours, V. A general method to derive robust organ-specific gene expression-based differentiation indices: Application to thyroid cancer diagnostic. Oncogene 2012, 31, 4490–4498. [Google Scholar] [CrossRef] [PubMed]
  13. Anari, S.; Tataei Sarshar, N.; Mahjoori, N.; Dorosti, S.; Rezaie, A.; Darba, A. Review of deep learning approaches for thyroid cancer diagnosis. Math. Probl. Eng. 2022, 2022, 1–8. [Google Scholar] [CrossRef]
  14. Li, X.; Zhang, S.; Zhang, Q.; Wei, X.; Pan, Y.; Zhao, J.; Xin, X.; Qin, C.; Wang, X.; Li, J.; et al. Diagnosis of thyroid cancer using deep convolutional neural network models applied to sonographic images: A retrospective, multicohort, diagnostic study. Lancet. Oncol. 2019, 20, 193–201. [Google Scholar] [CrossRef] [PubMed]
  15. Zhao, Z.; Yang, C.; Wang, Q.; Zhang, H.; Shi, L.; Zhang, Z. A deep learning-based method for detecting and classifying the ultrasound images of suspicious thyroid nodules. Med. Phys. 2021, 48, 7959–7970. [Google Scholar] [CrossRef] [PubMed]
  16. Tao, Y.; Yu, Y.; Wu, T.; Xu, X.; Dai, Q.; Kong, H.; Zhang, L.; Yu, W.; Leng, X.; Qiu, W.; et al. Deep learning for the diagnosis of suspicious thyroid nodules based on multimodal ultrasound images. Front. Oncol. 2022, 12, 1012724. [Google Scholar] [CrossRef] [PubMed]
  17. Qi, Q.; Huang, X.; Zhang, Y.; Cai, S.; Liu, Z.; Qiu, T.; Cui, Z.; Zhou, A.; Yuan, X.; Zhu, W.; et al. Ultrasound image-based deep learning to assist in diagnosing gross extrathyroidal extension thyroid cancer: A retrospective multicenter study. EClinicalMedicine 2023, 58, 101905. [Google Scholar] [CrossRef] [PubMed]
  18. Bai, Z.; Chang, L.; Yu, R.; Li, X.; Wei, X.; Yu, M.; Liu, Z.; Gao, J.; Zhu, J.; Zhang, Y. Thyroid nodules risk stratification through deep learning based on ultrasound images. Med. Phys. 2020, 47, 6355–6365. [Google Scholar] [CrossRef] [PubMed]
  19. Wang, H.; Zhang, G.; Cao, H.; Hu, K.; Wang, Q.; Deng, Y.; Gao, J.; Tang, Y. Geometry-aware 3d point cloud learning for precise cutting-point detection in unstructured field environments. J. Field Robot. 2025. [Google Scholar] [CrossRef]
  20. Gummalla, D.K.; Ganesan, S.; Pokhrel, S.; Somasiri, N. Enhanced early detection of thyroid abnormalities using a hybrid deep learning model: A sequential cnn and k-means clustering approach. J. Innov. Image Process. 2024, 6, 244–261. [Google Scholar] [CrossRef]
  21. Ma, L.; Ma, C.; Liu, Y.; Wang, X. Thyroid diagnosis from spect images using convolutional neural network with optimization. Comput. Intell. Neurosci. 2019, 2019, 6212759. [Google Scholar] [CrossRef] [PubMed]
  22. Etehadtavakol, M.; Etehadtavakol, M.; Ng, E.Y.K. Enhanced thyroid nodule segmentation through u-net and vgg16 fusion with feature engineering: A comprehensive study. Comput. Methods Programs Biomed. 2024, 251, 108209. [Google Scholar] [CrossRef] [PubMed]
  23. Kim, M.-J.; Kim, J.-A.; Kim, N.; Hwangbo, Y.; Jeon, H.J.; Lee, D.-H.; Oh, J.E. Red-net: A neural network for 3d thyroid segmentation in chest ct using residual and dilated convolutions for measuring thyroid volume. IEEE Access 2025, 13, 3026–3037. [Google Scholar] [CrossRef]
  24. Liu, W.; Lu, W.; Li, Y.; Chen, F.; Jiang, F.; Wei, J.; Wang, B.; Zhao, W. Parathyroid gland detection based on multi-scale weighted fusion attention mechanism. Electronics 2025, 14, 1092. [Google Scholar] [CrossRef]
  25. Alhussainan, N.F.; Ben Youssef, B.; Ben Ismail, M.M. A deep learning approach for brain tumor firmness detection based on five different yolo versions: YOLOv3–YOLOv7. Computation 2024, 12, 44. [Google Scholar] [CrossRef]
  26. Almufareh, M.F.; Imran, M.; Khan, A.; Humayun, M.; Asim, M. Automated brain tumor segmentation and classification in mri using yolo-based deep learning. IEEE Access 2024, 12, 16189–16207. [Google Scholar] [CrossRef]
  27. Prinzi, F.; Insalaco, M.; Orlando, A.; Gaglio, S.; Vitabile, S. A yolo-based model for breast cancer detection in mammograms. Cogn. Comput. 2024, 16, 107–120. [Google Scholar] [CrossRef]
  28. Zhou, Y.-T.; Yang, T.-Y.; Han, X.-H.; Piao, J.-C. Thyroid-detr: Thyroid nodule detection model with transformer in ultrasound images. Biomed. Signal Process. Control 2024, 98, 106762. [Google Scholar] [CrossRef]
  29. Gondi, S.; Nagaral, M.U. YOLOv8 based an automated segmentation and classification of thyroid nodules using usg images. In Proceedings of the 2024 International Conference on Innovation and Novelty in Engineering and Technology (INNOVA), Vijayapura, India, 20–21 December 2024; pp. 1–6. [Google Scholar] [CrossRef]
  30. Ghabri, H.; Fathallah, W.; Hamroun, M.; Othman, S.B.; Bellali, H.; Sakli, H.; Abdelkrim, M.N. Ai-enhanced thyroid detection using yolo to empower healthcare professionals. In Proceedings of the 2023 IEEE International Workshop on Mechatronic Systems Supervision (IW_MSS), Hammamet, Tunisia, 2–5 November 2023; pp. 1–6. [Google Scholar] [CrossRef]
  31. Zhou, S.; Qiu, Y.; Han, L.; Liao, G.; Zhuang, Y.; Ma, B.; Luo, Y.; Lin, J.; Chen, K. A lightweight network for automatic thyroid nodules location and recognition with high speed and accuracy in ultrasound images. J. X-Ray Sci. Technol. 2022, 30, 967–981. [Google Scholar] [CrossRef] [PubMed]
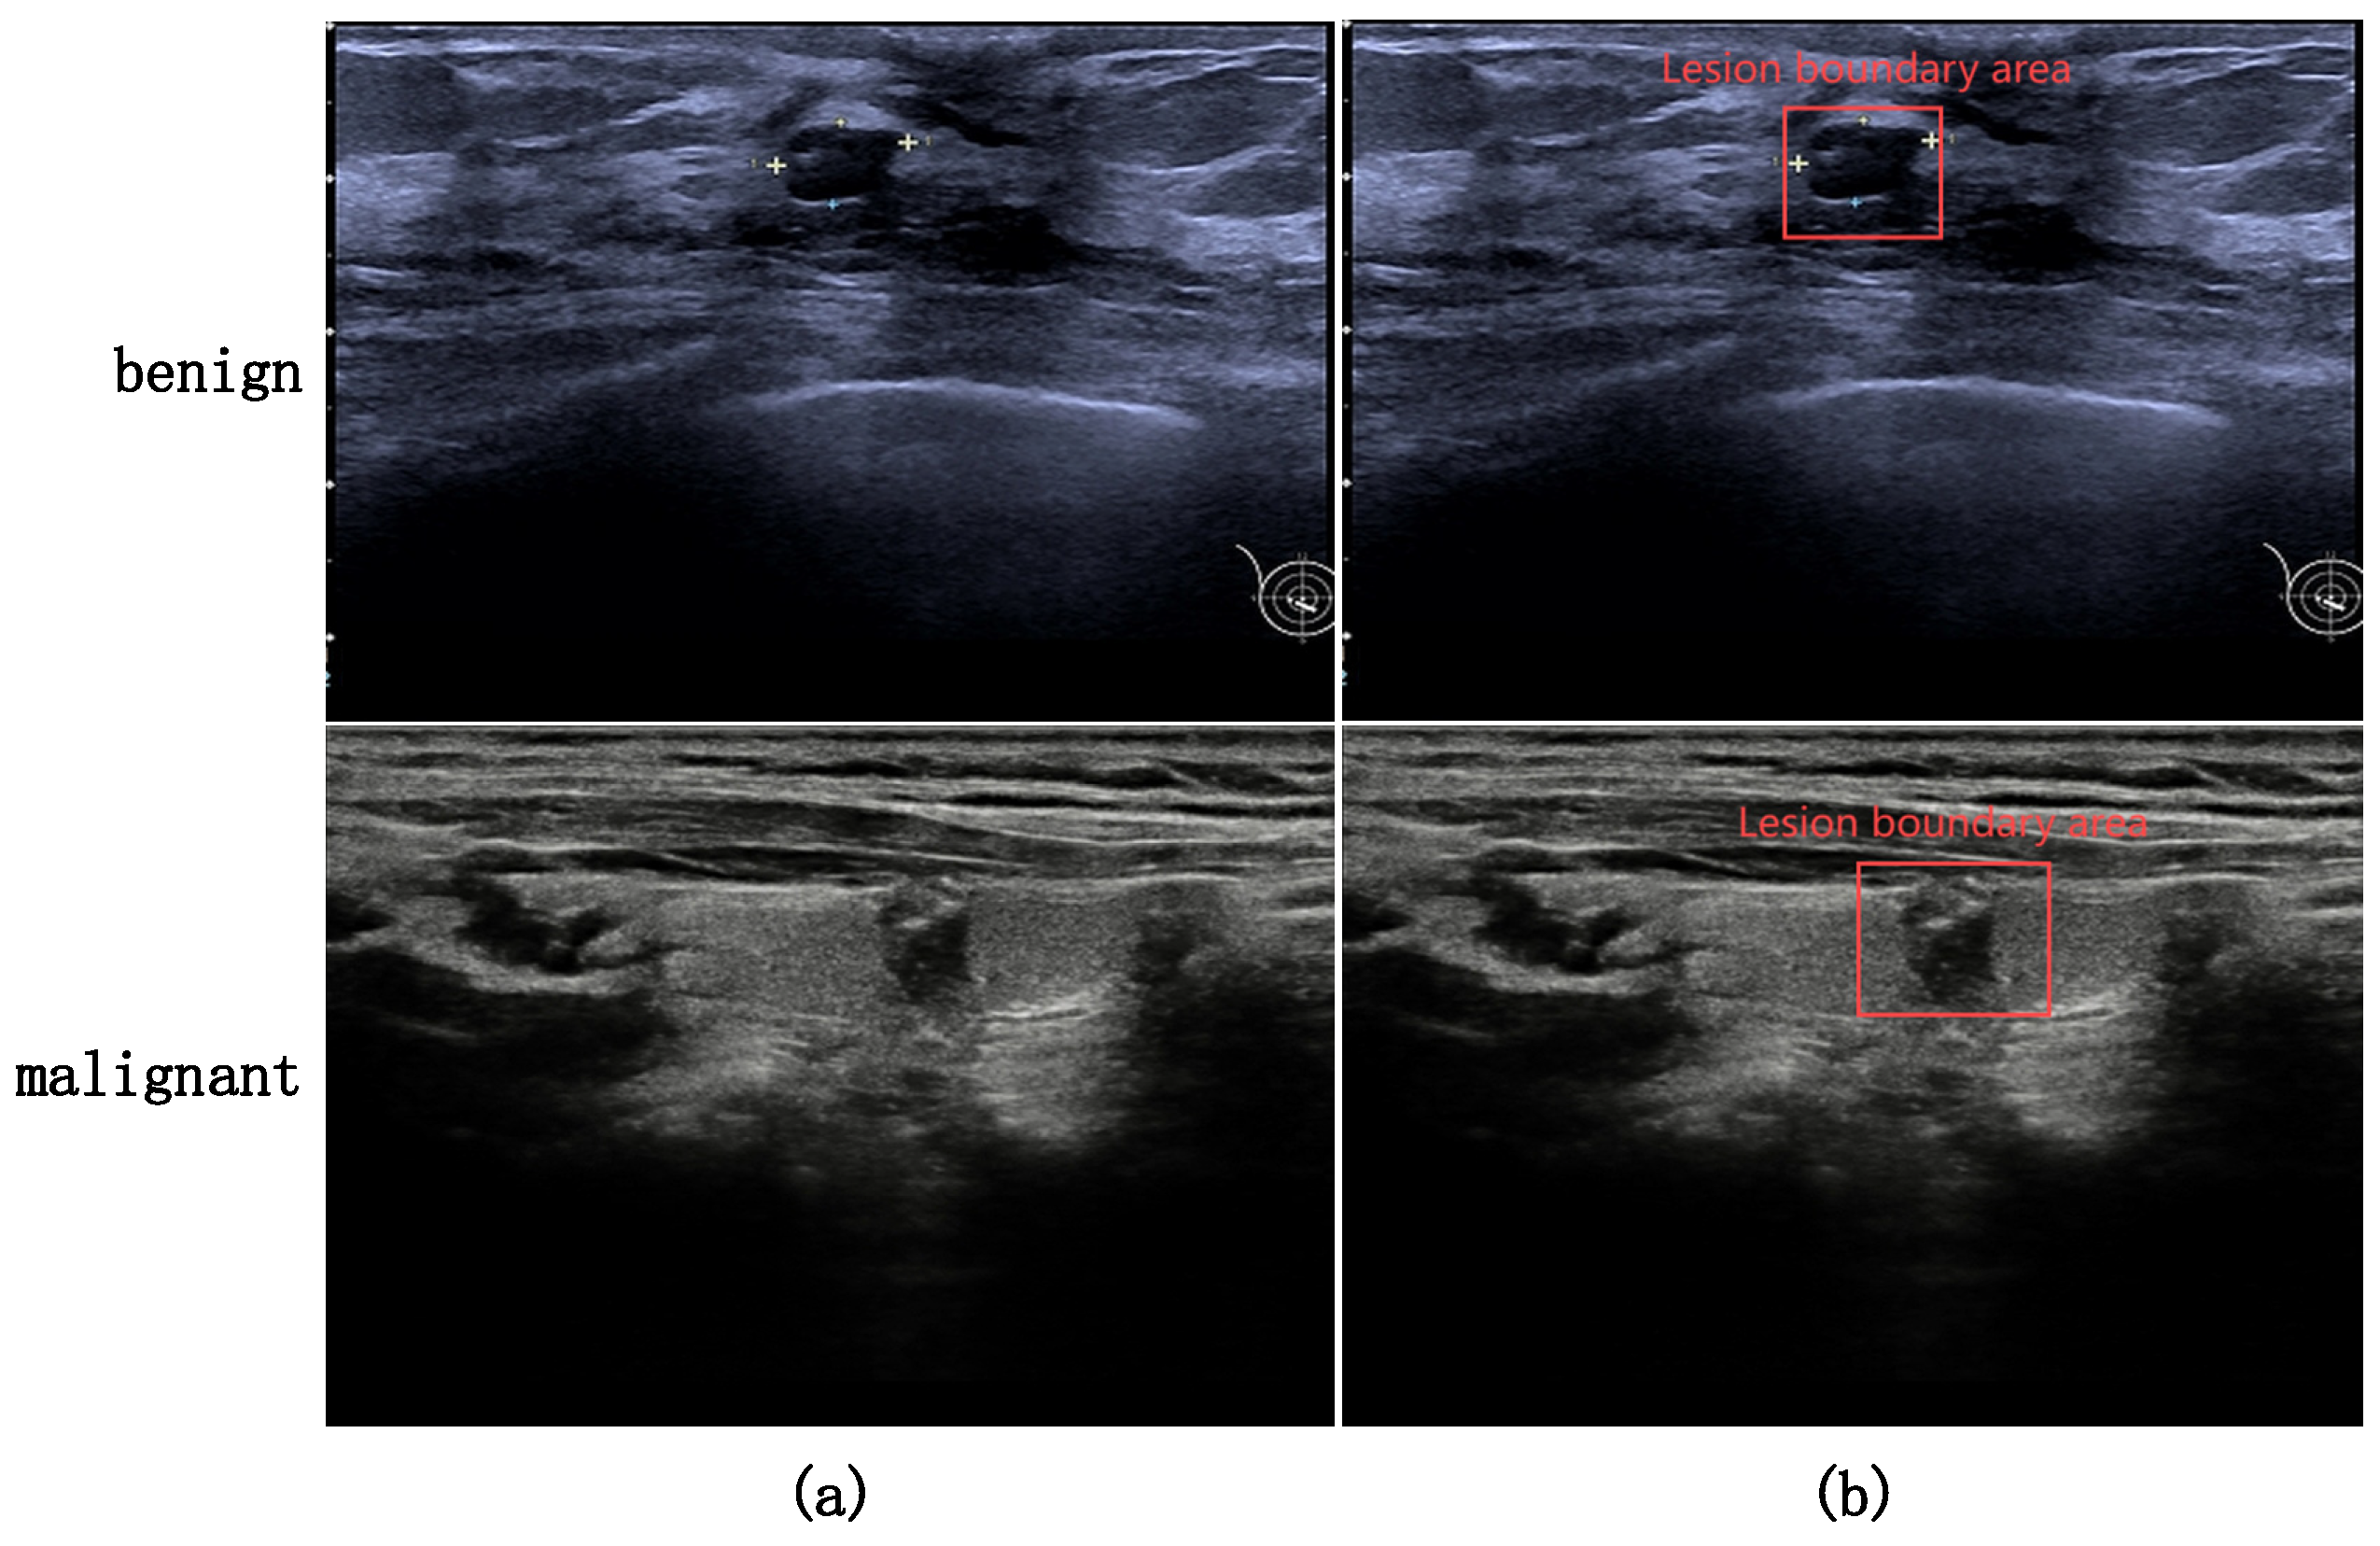
Figure 1. Examples of thyroid ultrasound images: (a) Original images of benign and malignant lesions; (b) Images with lesion area boundaries.
Symmetry 17 01249 g001
Figure 2. The LISA-YOLO model is introduced, primarily consisting of the DG-FNET module, the IMSF-NET module, and the SAF-NET module, ellipsis represents the omission of repeated structures.
Symmetry 17 01249 g002
Figure 3. DG-FNET Module Structure Diagram.
Symmetry 17 01249 g003
Figure 4. Multi-scale Feature Fusion IMSF-NET Module Framework Diagram. In the heatmap, warm colors indicate lesion-sensitive areas, while cool colors indicate non-lesion-sensitive areas.
Symmetry 17 01249 g004
Figure 5. The Collaborative Attention Mechanism SAF-NET module primarily introduces the channel attention mechanism and the spatial attention mechanism.
Symmetry 17 01249 g005
Figure 6. Sample distribution of the self-built dataset: 2457 benign samples, 3018 malignant samples. Includes 1146 small nodules, 1293 medium nodules, and 3018 large nodules.
Symmetry 17 01249 g006
Figure 7. Comparison of mAP between F-Rcnn, YOLOv9, YOLOv10, YOLOv11, and LISA-YOLOv11 models.
Symmetry 17 01249 g007
Figure 8. Comparison of Time Consumption Between Layers in Lightweight Model Performance Testing, the DG-FNET module layer is highlighted with a yellow background.
Symmetry 17 01249 g008
Figure 9. Comparison of GFLOPs for Each Layer in Lightweight Model Performance Testing, the DG-FNET module layer is highlighted with a yellow background.
Symmetry 17 01249 g009
Figure 10. Model small object performance demonstration chart.
Symmetry 17 01249 g010
Figure 11. Comparison of Grad-CAM heatmaps for the improved model (row (a)) and the baseline model (row (b)) in the 6th, 11th, and 16th convolutional layers. In the heatmap, warm colors indicate lesion-sensitive areas, while cool colors indicate non-lesion-sensitive areas.
Symmetry 17 01249 g011
Figure 12. Performance comparison of different dataset methods. The first column displays the original images; the second to fourth columns display the prediction results of the Faster-RCNN, YOLOv9s, YOLOv10s, and YOLOv11s models, respectively; the last column displays the prediction results of the LISA-YOLOv11 model.
Symmetry 17 01249 g012
Figure 13. The memory footprint comparison chart of the three mobile terminals shows the resource usage of the baseline model in the first row and the optimized memory usage efficiency in the second row.
Symmetry 17 01249 g013
Table 1. Comparison of Baseline and Proposed AP Performance for Different Categories.
CategoryBaseline AP (%)Proposed AP (%)Improvement
Benign small69.169.3+0.2
Malignant small76.880.4+3.6
Table 2. Experimental results of different algorithms on laboratory datasets.
MethodPrecision (%)Recall (%)F1 (%)mAP@50 (%)Param
(M)
GFLOPs
(G)
FPS
Faster-Rcnn54.957.256.060.341.817.1
YOLOv9s74.575.474.980.325.3263.925.4
YOLOv10s74.472.273.276.88.121.623.1
YOLOv11s75.174.374.678.92.56.126.6
Ours75.678.276.983.42.65.835.6
Table 3. Experimental results of different algorithms on laboratory dataset for benign cases.
MethodPrecision (%)Recall (%)F1 (%)mAP@50 (%)Param
(M)
GFLOPs
(G)
FPS
Faster-Rcnn52.254.453.258.3441.817.1
YOLOv9s74.771.573.179.725.3263.925.4
YOLOv10s75.868.571.975.78.121.623.1
YOLOv11s77.574.175.777.82.56.126.6
Ours74.376.075.281.62.65.835.6
Table 4. Experimental results of different algorithms on laboratory dataset for malignant cases.
MethodPrecision (%)Recall (%)F1 (%)mAP@50 (%)Param
(M)
GFLOPs
(G)
FPS
Faster-Rcnn56.959.358.161.941.817.1
YOLOv9s74.479.476.880.925.3263.925.4
YOLOv10s72.975.874.377.98.121.623.1
YOLOv11s72.874.573.680.12.56.126.6
Ours76.980.478.685.22.65.835.6
Table 5. Experimental results of different algorithms on the AIS-Seg dataset.
MethodPrecision (%)Recall (%)F1 (%)mAP@50 (%)Param
(M)
GFLOPs
(G)
FPS
Faster-Rcnn62.669.866.075.741.821.9
YOLOv9s82.585.383.889.925.3263.931.6
YOLOv10s88.989.789.294.58.121.632.4
YOLOv11s87.487.287.393.12.56.132.9
Ours91.790.591.194.92.65.838.9
Table 6. Experimental results of different algorithms on the AIS-Seg dataset for benign cases.
MethodPrecision (%)Recall (%)F1 (%)mAP@50 (%)Param
(M)
GFLOPs
(G)
FPS
Faster-Rcnn60.569.864.874.641.821.9
YOLOv9s79.881.580.679.725.3263.931.6
YOLOv10s88.686.687.593.38.121.632.4
YOLOv11s86.284.385.292.42.56.132.9
Ours92.486.889.594.02.65.838.9
Table 7. Experimental results of different algorithms on the AIS-Seg dataset for malignant cases.
MethodPrecision (%)Recall (%)F1 (%)mAP@50 (%)Param
(M)
GFLOPs
(G)
FPS
Faster-Rcnn64.569.566.976.341.821.9
YOLOv9s85.289.187.191.825.3263.931.6
YOLOv10s89.292.991.095.78.121.632.4
YOLOv11s88.790.089.393.92.56.132.9
Ours90.994.192.595.82.65.838.9
Table 8. Hardware specifications of tested portable computing devices.
Device TypeProcessor ModelGPU ModelRAM (GB)
Model AIntel Core i7-14650HX (13th Gen, 16 cores, Raptor Lake-HX)NVIDIA GeForce RTX 3080 Ti Laptop GPU (16 GB, Ampere)32
Model BIntel Core i7-12850HX (12th Gen, 16 cores, Alder Lake-HX)NVIDIA GeForce RTX 4060 Laptop GPU (8 GB, Ada Lovelace)32
Model CIntel Core i7-12700H (12th Gen, 14 cores, Alder Lake-H)NVIDIA GeForce RTX 3060 Laptop GPU (6 GB, Ampere)16
Table 9. Inference performance of the proposed model on different devices.
MethodRAM Cost (CPU)RAM Cost (GPU)FPSTime Cost (s)
Model A5577.31 MB392.8121.610.04
Model B5753.80500.2918.813.07
Model C6290.941270.1717.513.23
Table 10. Ablation experiments on the self-built dataset.
Experimental
Programmes
ABCF1 (%)mAP@50 (%)FPS
YOLOv11 74.678.926.6
1 75.5 (+0.9)81.6 (+2.7)27.6 (+1.0)
2 75.8 (+1.2)81.7 (+2.8)27.4 (+0.8)
3 74.7 (+0.1)81.3 (+2.4)29.2 (+2.6)
4 75.7 (+1.1)81.9 (+3.0)28.3 (+1.7)
5 76.2 (+1.6)82.8 (+3.9)31.2 (+4.6)
6 75.9 (+1.3)81.7 (+2.8)32.8 (+6.2)
Ours76.9 (+2.3)83.4 (+4.5)35.6 (+9.0)
Disclaimer/Publisher’s Note: The statements, opinions and data contained in all publications are solely those of the individual author(s) and contributor(s) and not of MDPI and/or the editor(s). MDPI and/or the editor(s) disclaim responsibility for any injury to people or property resulting from any ideas, methods, instructions or products referred to in the content.