Article

Study on Mechanism and Constitutive Modelling of Secondary Anisotropy of Surrounding Rock of Deep Tunnels

1
College of Mining Engineering, Taiyuan University of Technology, Taiyuan 030024, China
2
CCTEG Coal Mining Research Institute, Beijing 100013, China
3
State Key Laboratory of Intelligent Coal Mining and Strata Control, Beijing 100013, China
*
Author to whom correspondence should be addressed.
Symmetry 2025, 17(8), 1234; https://doi.org/10.3390/sym17081234
Submission received: 20 June 2025 / Revised: 17 July 2025 / Accepted: 1 August 2025 / Published: 4 August 2025
(This article belongs to the Section Engineering and Materials)

Abstract

Crack initiation, propagation, and slippage serve as the key mesoscopic mechanisms contributing to the deterioration of deep tunnel surrounding rocks. In this study, a secondary anisotropy of deep tunnels surrounding rocks was proposed: The axial-displacement constraint of deep tunnels forces cracks in the surrounding rock to initiate, propagate, and slip in planes parallel to the tunnel axial direction. These cracks have no significant effect on the axial strength of the surrounding rock but significantly reduce the tangential strength, resulting in the secondary anisotropy. First, the secondary anisotropy was verified by a hybrid stress–strain controlled true triaxial test of sandstone specimens, a CT 3D (computed tomography three-dimensional) reconstruction of a fractured sandstone specimen, a numerical simulation of heterogeneous rock specimens, and field borehole TV (television) images. Subsequently, a novel SSA (strain-softening and secondary anisotropy) constitutive model was developed to characterise the secondary anisotropy of the surrounding rock and developed using C++ into a numerical form that can be called by FLAC3D (Fast Lagrangian Analysis of Continua in 3 Dimensions). Finally, effects of secondary anisotropy on a deep tunnel surrounding rock were analysed by comparing the results calculated by the SSA model and a uniform strain-softening model. The results show that considering the secondary anisotropy, the extent of strain-softening of the surrounding rock was mitigated, particularly the axial strain-softening. Moreover, it reduced the surface displacement, plastic zone, and dissipated plastic strain energy of the surrounding rock. The proposed SSA model can precisely characterise the objectively existent secondary anisotropy, enhancing the accuracy of numerical simulations for tunnels, particularly for deep tunnels.

1. Introduction

With the shift in resource development to greater depths, the excavation depth of tunnels has also increased [1,2,3]. In a deep environment, high deviatoric stress induced by excavation causes extensive deterioration of the surrounding rock [4,5], leading to a severe deformation [6,7]. Statistically [8], deep tunnels account for approximately 30% of the annual tunnelling, and 70% of these tunnels need to be repaired owing to the severe deformation, which considerably increases costs.
Extensive laboratory experiments and field observations [9,10,11,12,13,14] indicate that a strain-softening model can well characterise the deterioration behaviour of most rock masses; thus, it has been widely adopted in deep tunnel analyses. A tunnel excavated in a strain-softening rock mass is typically simplified as a plane-strain problem, in which the tangential stress σt and radial stress σr are considered to be the maximum principal stress σ1 and minimum principal stress σ3, respectively. Both σt and σr control the failure and deterioration of the surrounding rock, but the axial stress σa is often ignored.
However, Lu et al. [15] pointed out that due to the existence of axial in situ stress, the calculation result of σa is different from that of the plane-strain problem. Guan et al. [16] found that σa would cause axial plastic flow to occur, leading to deterioration of the surrounding rock. Zou et al. [17,18] demonstrated that σa could become σ1 under certain conditions, which leads to the failure of the surrounding rock. Yi et al. [19] indicated that in the scenario where the axial in situ stress approaches or is higher than the tangential in situ stress, the surrounding rock will exhibit 3D plastic flow. Moreover, an increase in the axial in situ stress will intensify the deformation and failure of the surrounding rock. Therefore, both axial and tangential strengths of the surrounding rock are important in deep tunnel analyses. Consequently, similar to σr, σa has the potential to serve as σ1, leading to the failure of the surrounding rock. Hence, accurately estimating the axial and tangential strengths, as well as their evolution, is important. Nevertheless, in the previous studies, the axial and tangential strengths were consistently equal, and the strain-softening was uniform in all directions.
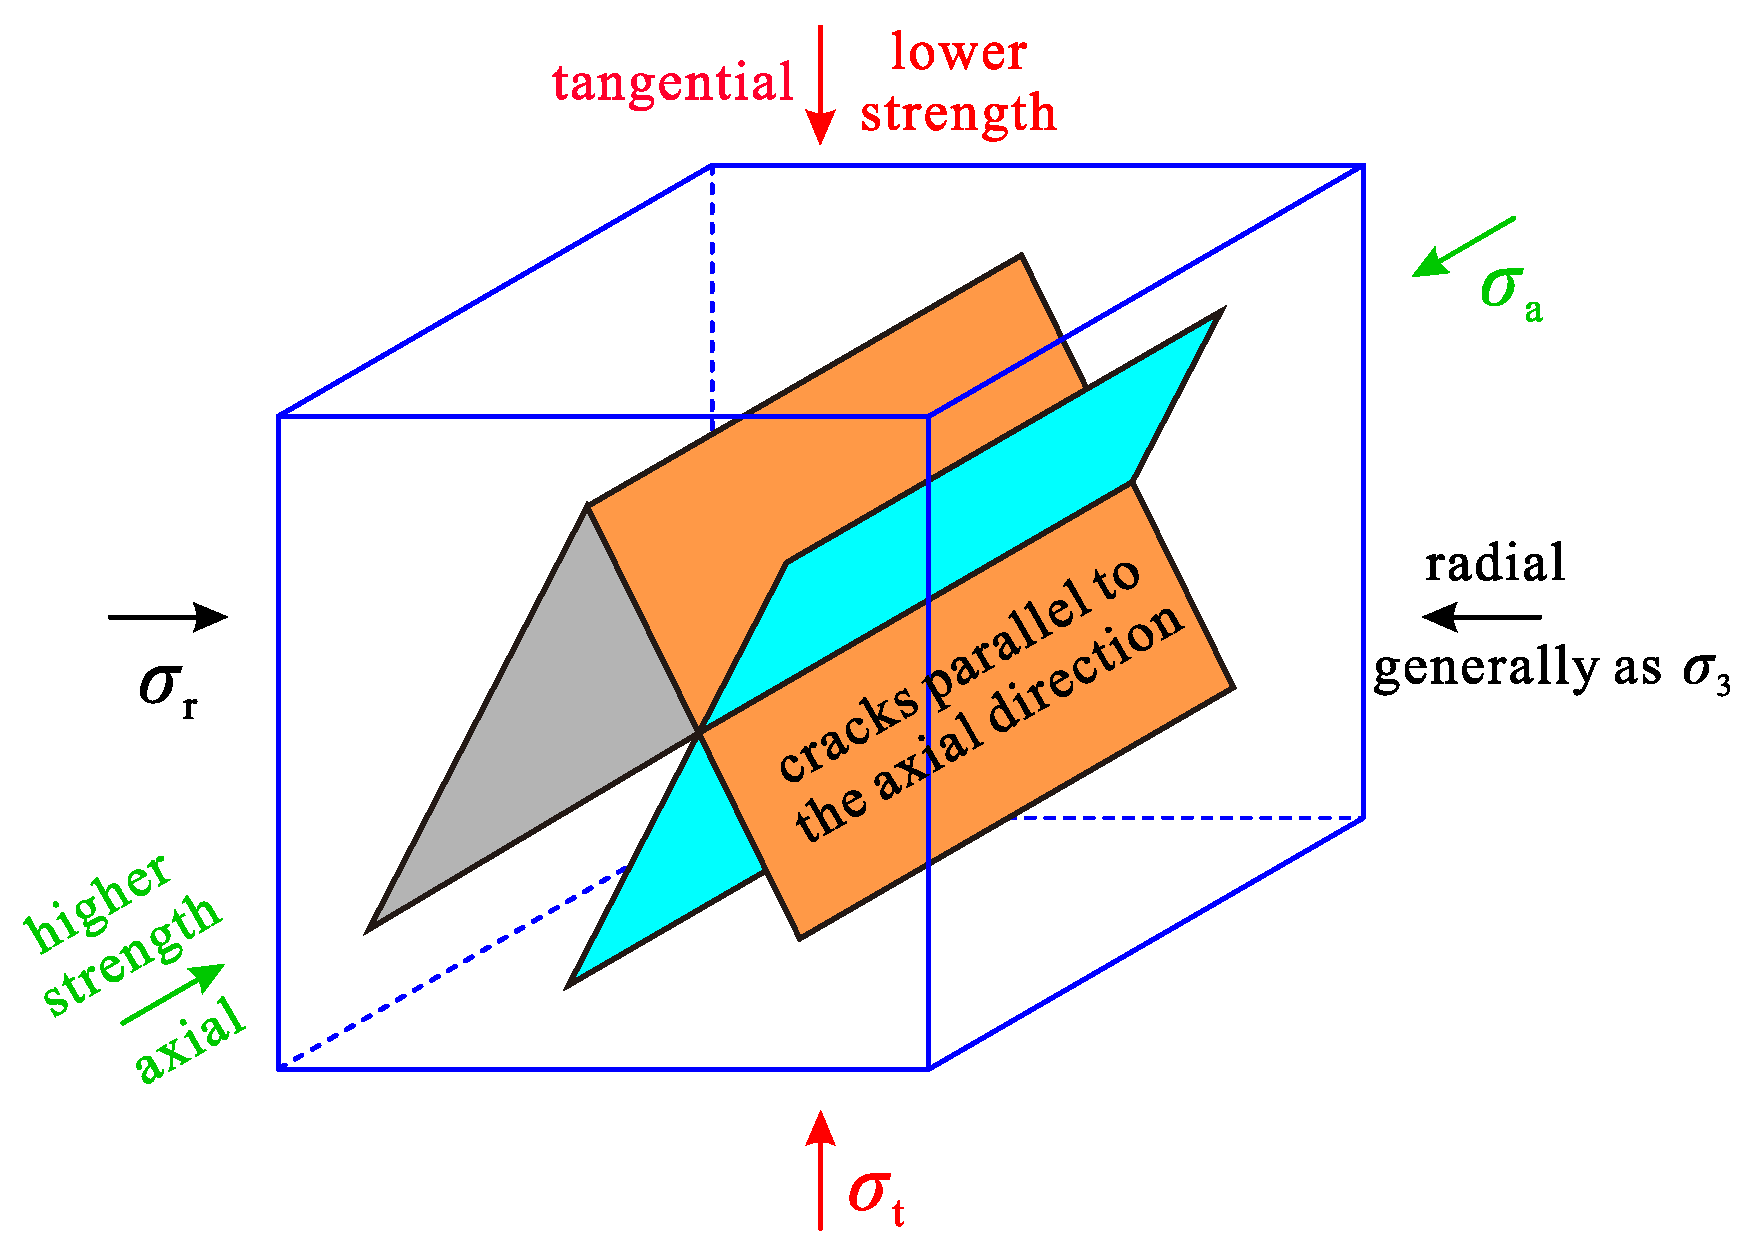
Pourhosseini and Shabanimashcool [20] indicated that the strain-softening of rock mass is induced by the initiation, propagation, and slippage of cracks [21,22]. As shown in Figure 1, under the axial displacement constraint of the surrounding rock, a crack is easy to initiate, propagate, and slip in a plane parallel to the axial direction, but difficult to initiate, propagate, and slip in other directions. Therefore, it can be inferred that in the deformation and failure process of the surrounding rock, most of the secondary cracks are approximately parallel to the axial direction (verified in Section 2). According to the single-jointed rock mass model proposed by Jaeger [23] and the subsequent multi-jointed rock mass models [24,25], these cracks parallel to the axial direction have no significant effect on the axial strength of the surrounding rock, but they can significantly reduce the tangential strength, as shown in Figure 2. As a result, the tangential strain-softening of the surrounding rock is expected to be more pronounced compared to the axial strain-softening, thereby leading to a lower tangential strength relative to the axial strength. In this study, this novel mechanical property is proposed and defined as the secondary anisotropy of the surrounding rock of tunnels (different from the stress-induced secondary anisotropy of rocks [26]).
In this study, the proposed secondary anisotropy of the surrounding rock was captured and verified using a hybrid stress–strain controlled true triaxial test, CT scanning, numerical simulation of heterogeneous rock specimens, and field borehole TV imaging observation. Subsequently, a novel SSA constitutive model was developed to characterise the secondary anisotropy. Finally, by comparing the simulation results obtained using the SSA model and a traditional strain-softening model, we further analyse and discuss the effects of secondary anisotropy on the deformation, failure modes, and strain energy dissipation of deep tunnel surrounding rocks.

2. Capture and Verification of Secondary Anisotropy Induced by Axial-Displacement Constraint

2.1. True Triaxial Test Under Hybrid Stress–Strain Controlled Loading

2.1.1. Testing Machine and Rock Specimen Preparation

A TRW-3000 true triaxial hydraulic servo-controlled testing machine (manufactured by Chaoyang Testing Instrument Co., Ltd., Changchun, China) [27] was used for this test, as shown in Figure 3. The testing machine was compatible with cubic rock specimens with side lengths of 50–300 mm, which could be independently loaded through solid pistons driven by oil pressure in three orthogonal directions.
Five cubic sandstone specimens with a side length of 100 mm were prepared for the tests and were named s-1 to s-5. All sandstone samples were collected perpendicular to the stratification planes, and the tangential and axial loadings were parallel to the stratification planes to avoid the interference of inherent anisotropy [28]. The basic mechanical parameters measured by uniaxial compression, Brazilian splitting, and variable-angle shear tests are listed in Table 1. Before loading the sandstone specimen, lubricant and polythene sheets were applied evenly to each surface to reduce the interfacial friction effect.

2.1.2. Testing Scheme

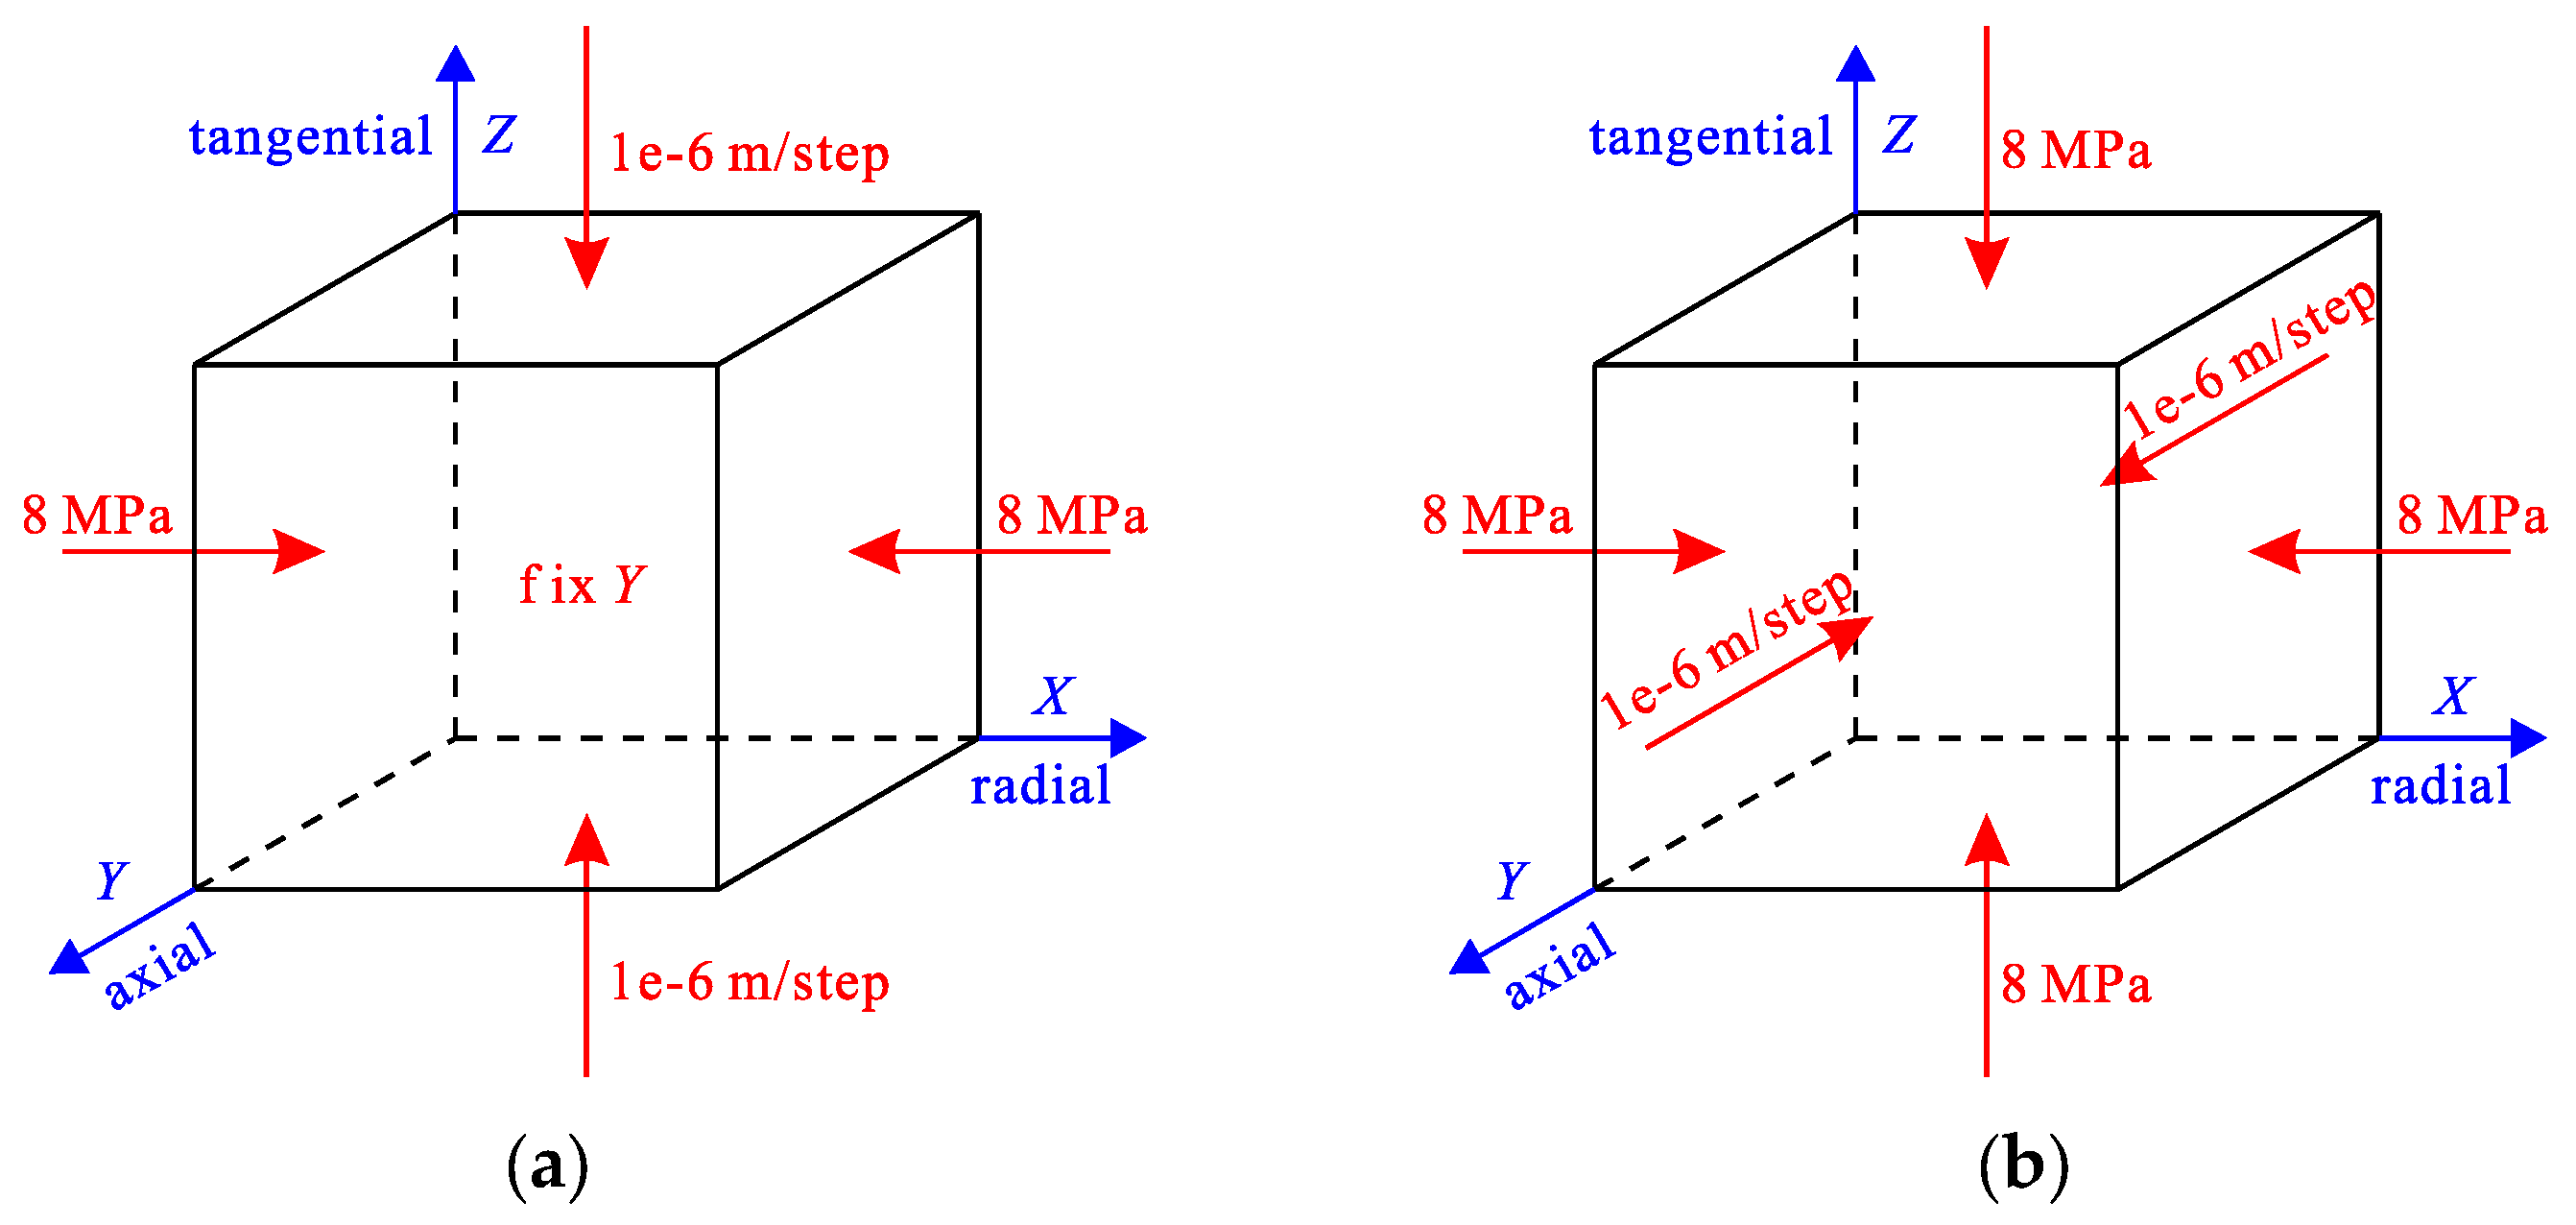
To verify the secondary anisotropy of the surrounding rock, hybrid stress–strain controlled loading tests on sandstone specimens were conducted, stimulating the crack development process (but not the stress path) of the unit of the surrounding rock under the axial-displacement constraint (see Figure 1). The X, Y, and Z directions of the testing machine correspond to the radial, axial, and tangential directions of the tunnel, respectively, as shown in Figure 3.
First, the Z direction (tangential) was loaded to a specific tangential strength σts after the peak (in this process, a constant strain in the Y direction (axial) was maintained to simulate the axial-displacement constraint). Subsequently, the axial strength σas was measured by loading in the Y direction (axial). Finally, by comparing σts and σas, the greater the difference, the more significant the secondary anisotropy. The detailed loading procedure was as follows.
(1) The X, Y, and Z directions were simultaneously loaded to 8 MPa (stress control, 0.05 MPa/s).
(2) The stress of 8 MPa was maintained in the X direction. (In the process of deformation and failure of tunnel surrounding rock, the confining pressure keeps decreasing, but this test focuses on the crack development process under the axial-displacement constraint, rather than the stress path. Therefore, a representative constant value in the process was selected, and the rationality of this approach was verified in Section 2.2) The strain was maintained constant in the Y direction (to simulate the axial-displacement constraint). The Z direction was loaded to the peak stress σp, then loading was stopped when the stress gradually decreased to σts (σts corresponds to the tangential strength when cracks propagate and slippage to a certain extent; σts is difficult to specify accurately in advance, and it is only necessary to ensure that σts/σp of rock specimens s-1 to s-4 decreases successively. The stress in the Y direction at this time was recorded as σYs (σ2); displacement control, 2.5 µm/s; tangential failure occurred).
(3) The stress of 8 MPa was maintained in the X direction, and the strain was kept constant in the Y direction. The Z direction was unloaded to σYs (stress control, 0.2 MPa/s).
(4) The stresses of 8 MPa and σYs were maintained in the X and Z directions, respectively (excluding the effects of σ2 and σ3 when measuring σts and σas). The Y direction was loaded until the peak stress σas appeared (σas corresponded to the axial strength at the time σts was measured; displacement control, 2.5 µm/s; axial failure occurred).
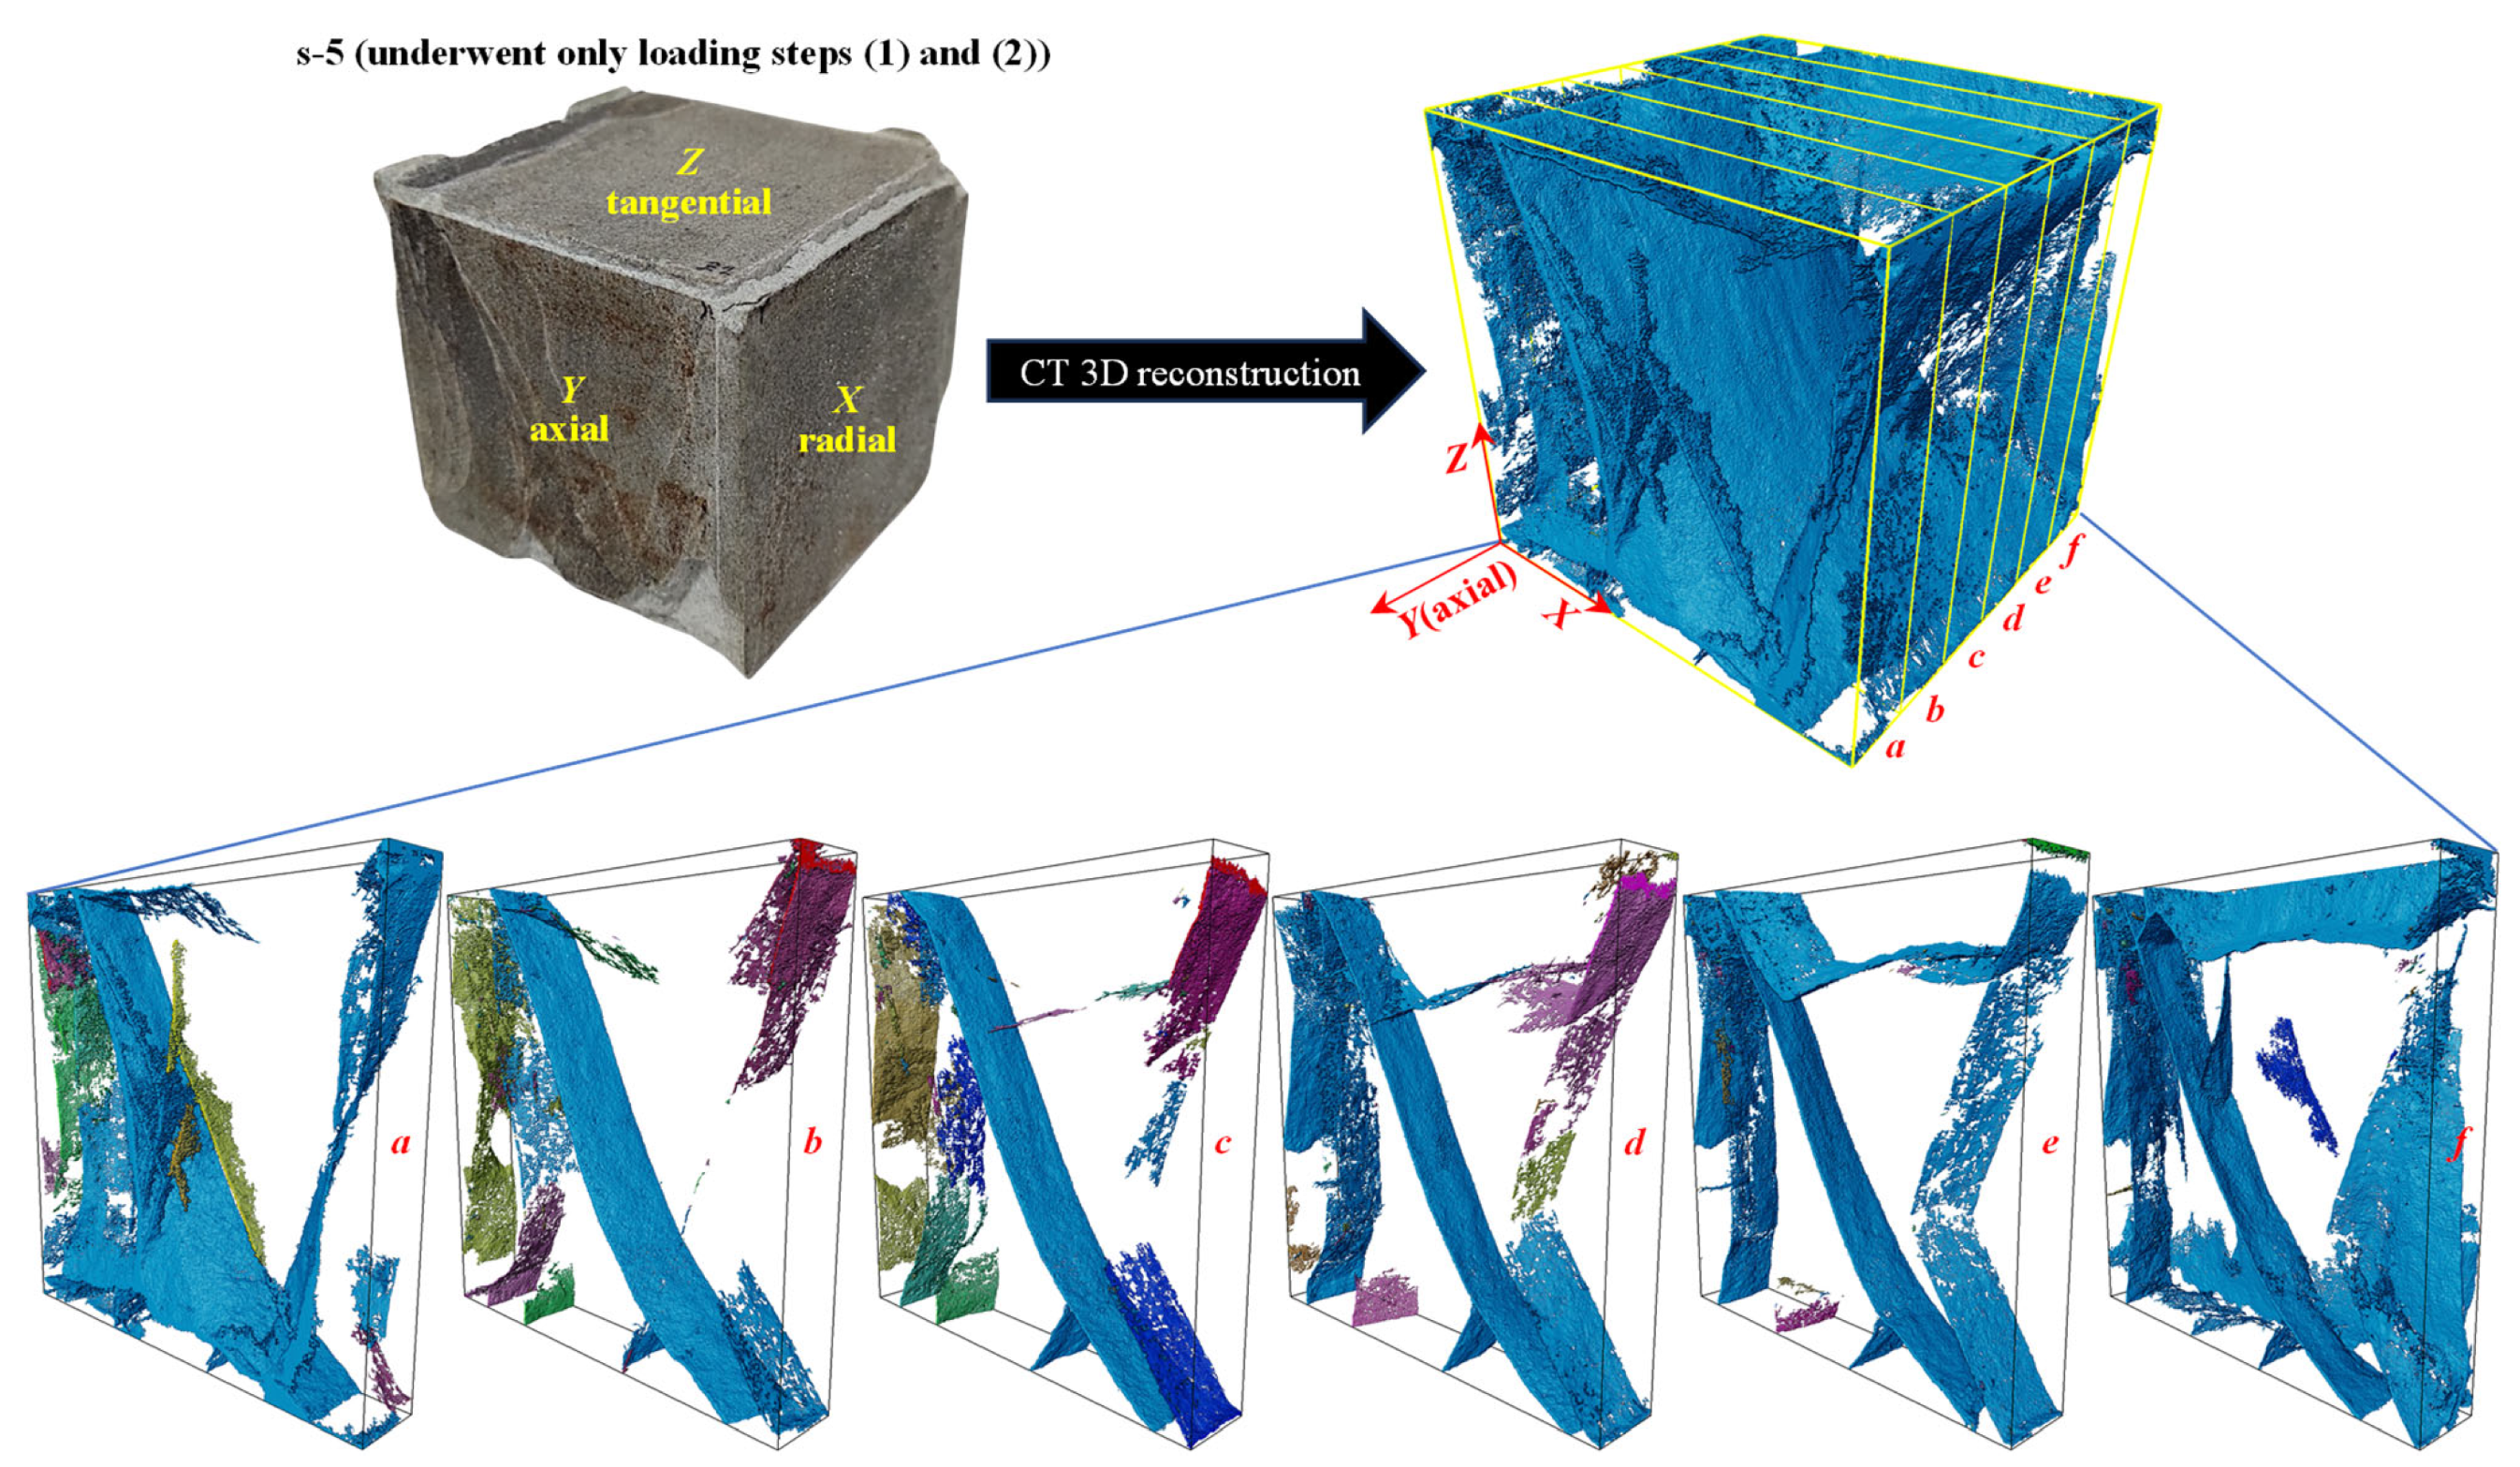
Rock specimens s-1 to s-4 underwent all loading steps to evaluate the secondary anisotropy and to obtain the data required by the constitutive model in Section 3. Rock specimen s-5 underwent only loading steps (1) and (2), and CT scanning was conducted to observe the crack morphology (loading step (2) simulates the crack development process in a unit of the surrounding rock under the axial-displacement constraint, while loading step (3) is a destructive test inconsistent with reality; therefore, loading step (3) was not continued to observe the crack morphology).

2.1.3. Testing Results and Analysis

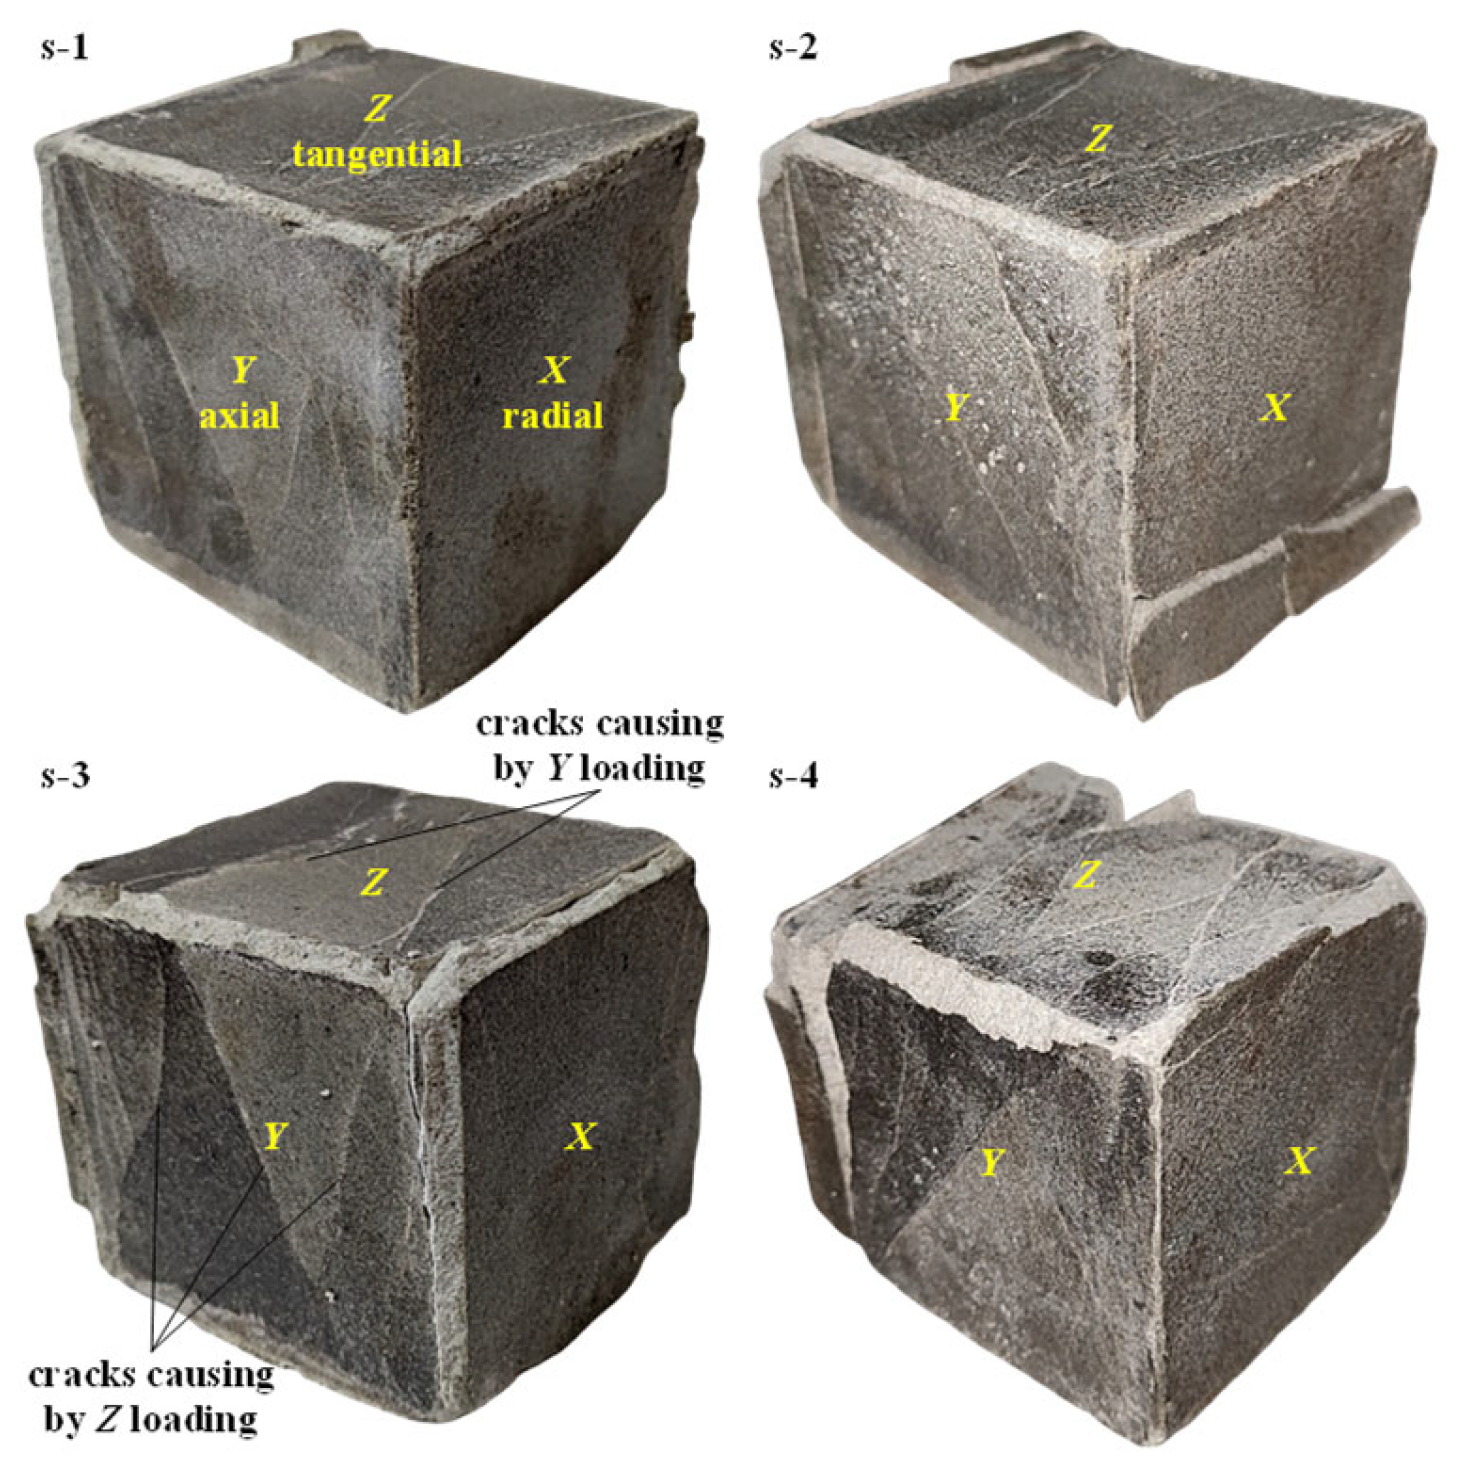
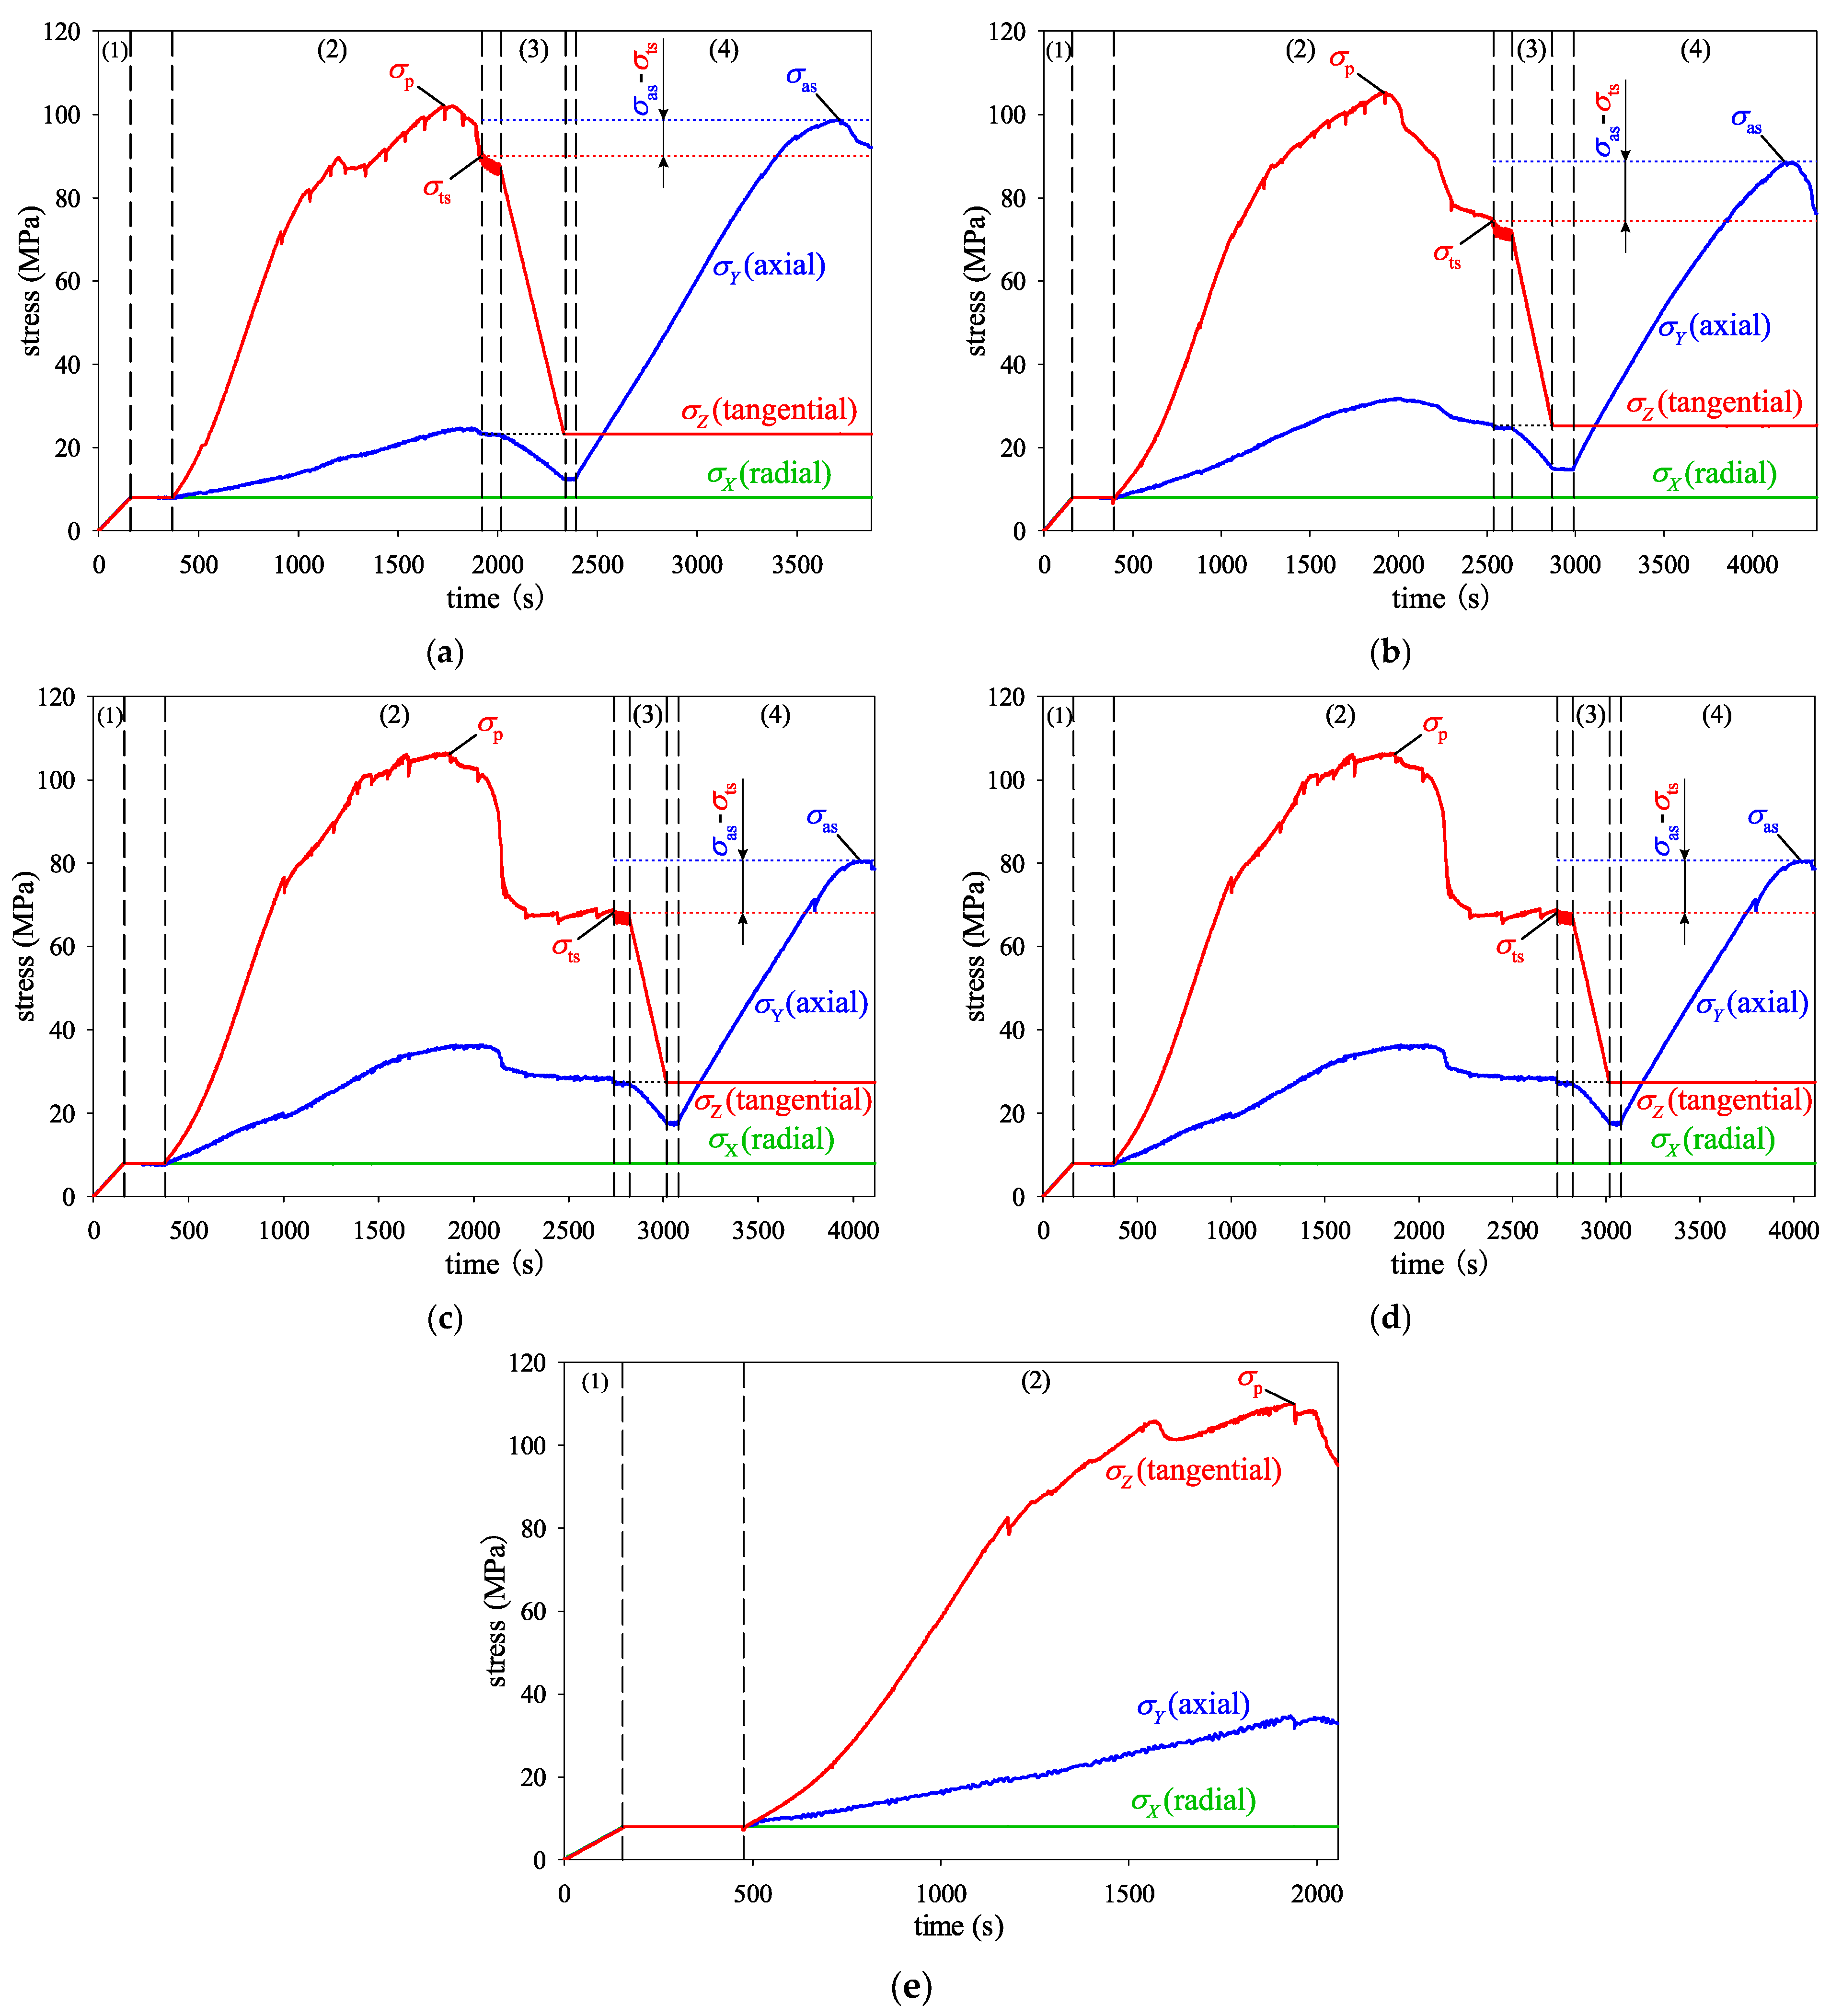
The failure modes and loading data of the sandstone specimens are shown in Figure 4 and Figure 5, respectively, and the CT 3D reconstruction of sandstone specimen s-5 are shown in Figure 6. When the peak stress was reached in the Z direction (tangential), the loading stopped in the Z direction (tangential) and the peak stress was reached in the Y direction (axial), the corresponding stresses in the three orthogonal directions are shown in Table 2.
As shown in Figure 4, shear failure occurred in all sandstone specimens, and sandstone specimen s-4, loaded to the residual strength in the Z direction (tangential), exhibited cracks with the most severe propagation and slippage. This is consistent with the view of Pourhosseini and Shabanimashcool [20] that the strain-softening results from crack initiation, propagation, and slip. Sandstone specimen s-5 did not undergo the strength test in the Y direction (axial) and maintained a constant strain in the Y direction (axial-displacement constraint). Therefore, the crack morphology of this specimen can represent that of the surrounding rock unit (as shown in Figure 2). By comparison, it can be seen that the crack morphologies on the surfaces of sandstone specimen s-5 and the surrounding rock unit are highly similar, especially on the surface perpendicular to the Y direction (axial).
According to Figure 5 and Table 2, a typical strain-softening phenomenon occurred in all sandstone specimens. For sandstone specimens from s-1 to s-4, the measured axial strength σas is much higher than the corresponding post-peak tangential strength σts after the tangential failure, which indicates that the tangential strain-softening is more severe than axial strain-softening, presenting a significant secondary anisotropy.
Moreover, according to Figure 6, the cracks of sandstone specimen s-5 are approximately parallel to the Y direction (axial). This is consistent with the mechanism of the secondary anisotropy described in Section 1: “cracks tend to initiate, propagate, and slip in planes parallel to the axial direction”.

2.2. Numerical Simulation of Heterogeneous Rock Specimen

Extensive studies have shown that rocks are heterogeneous materials, and the mechanical parameters of the meso-structure approximately follow a Weibull distribution [29]:
P u = m u 0 u u 0 m 1 exp u u 0 m
where P(u) is the probability density function for a given mechanical parameter u; u0 is the mean value of u; and m is the homogeneity index (the smaller the m, the more significant the heterogeneity).
A numerical model with the same size as that of the sandstone specimens described in Section 2.1 was established by FLAC3D, and each side was divided into 50 zones, with a total of 125,000 zones. The Young’s modulus, tensile strength, and cohesion in Table 1 were adopted as the mean values u0, and 125,000 datasets were generated according to Equation (1) (following the principle that the higher the Young’s modulus, the higher the strength. Therefore, the ratio of Young’s modulus, tensile strength, and cohesion among each set of data was equal; based on a numerical inversion, the value of m was determined to be 3). All the zones were assigned parameters in turn by the Fish language according to the datasets, and the built-in strain-softening model [30] was adopted. Three numerical schemes were conducted:
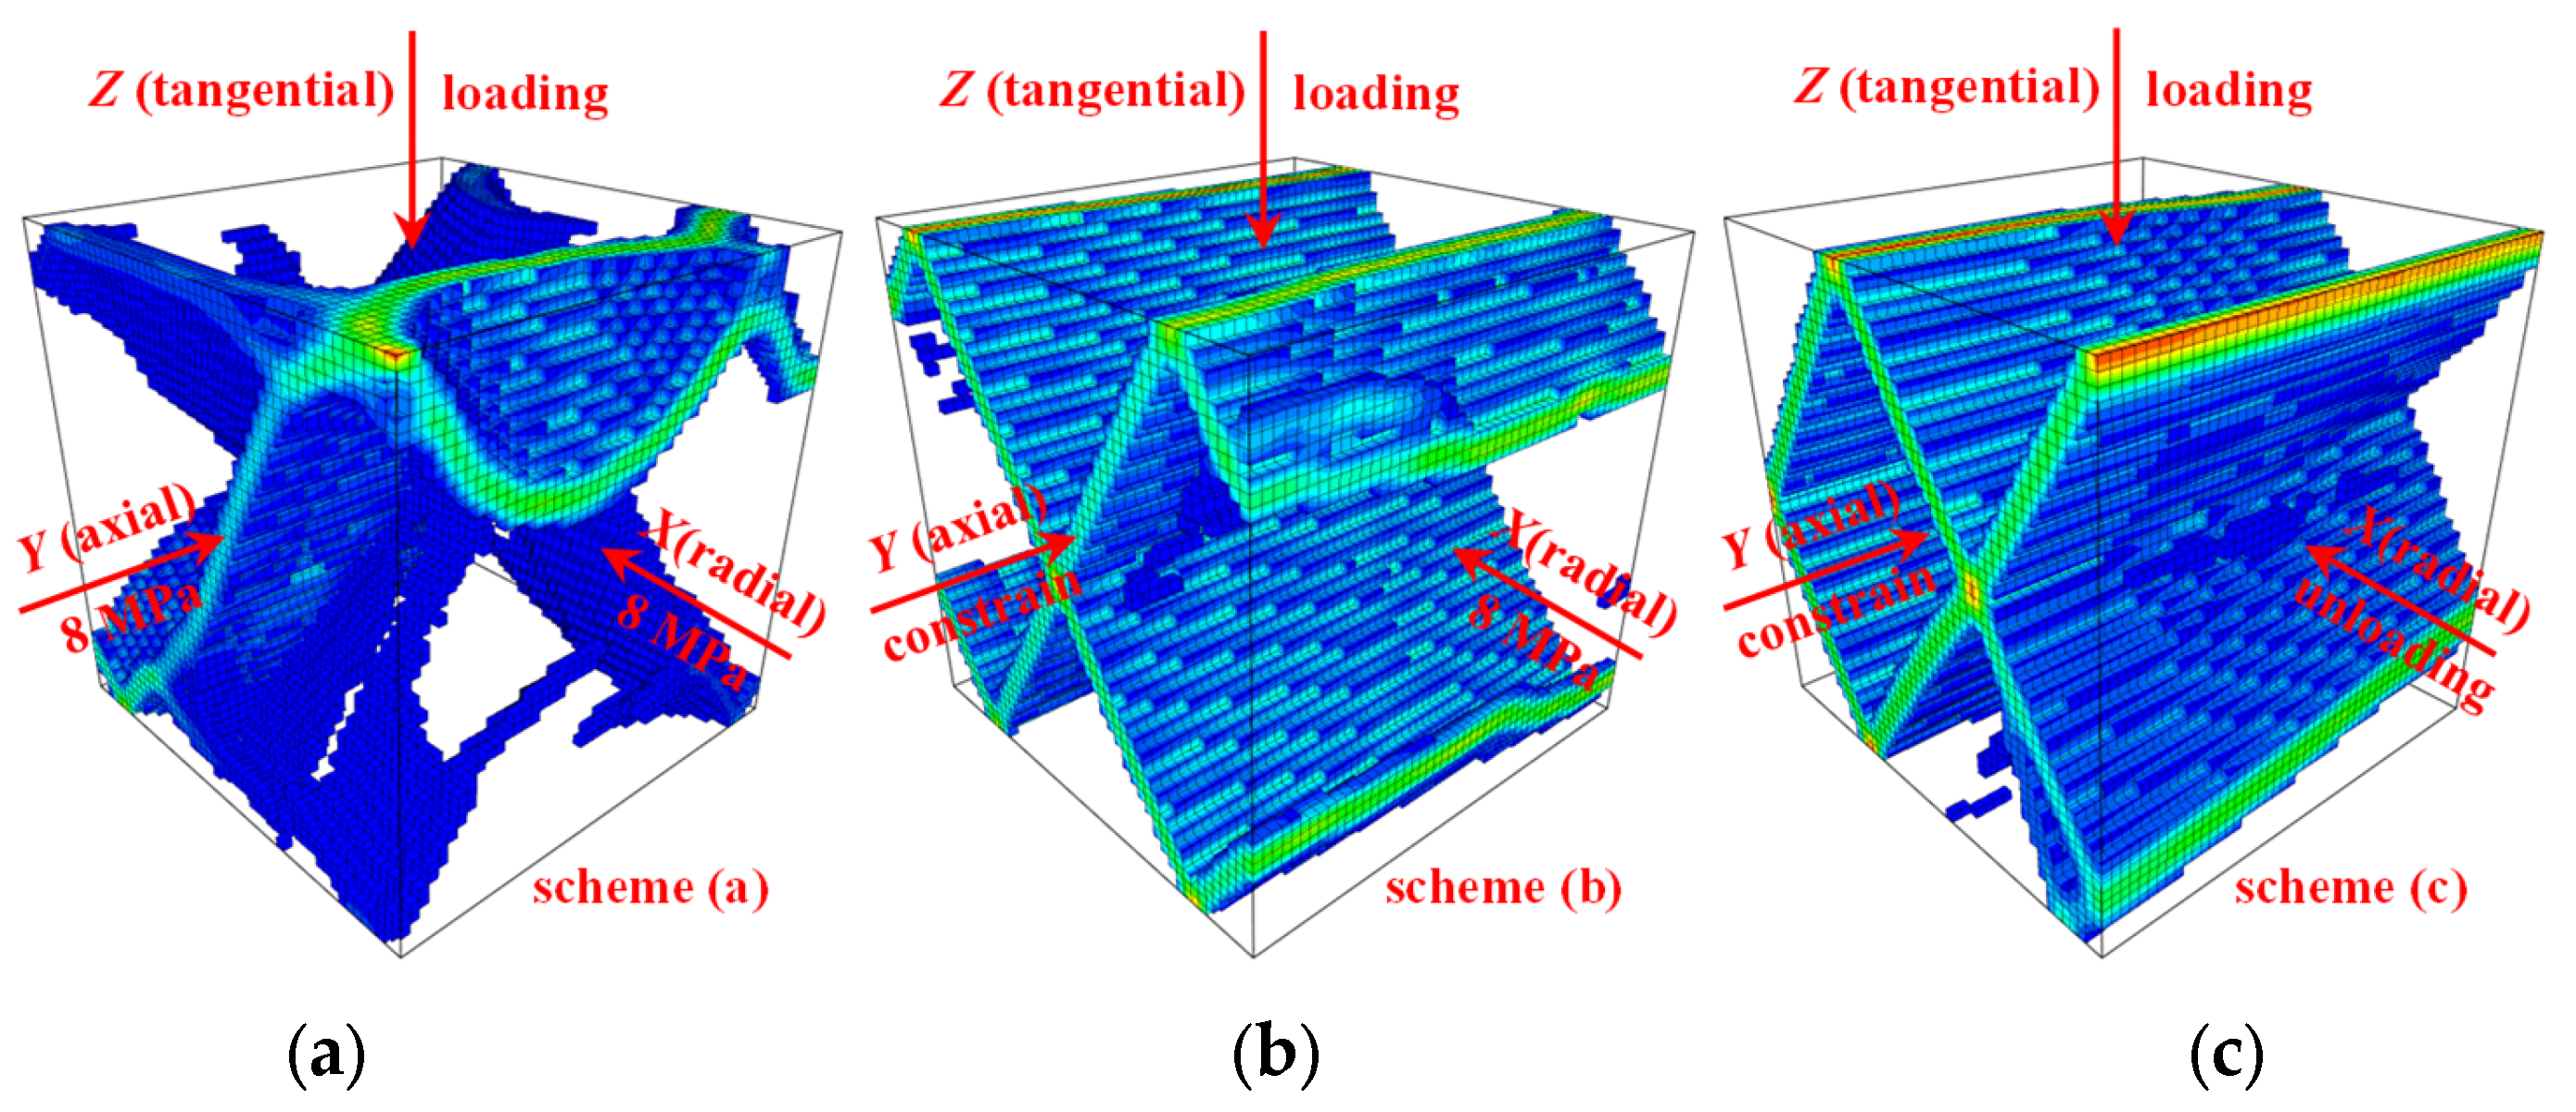
(a) Unconfined loading: tangential loading (displacement control, 1 × 10⁻⁷ m/step) and constant axial and radial stresses of 8 MPa.
(b) Axial constrained loading: tangential loading (displacement control, 1 × 10⁻⁷ m/step), axial-displacement constraint (constant strain), and constant radial stress of 8 MPa.
(c) Axial constrained loading/unloading: tangential loading (displacement control, 1 × 10⁻⁷ m/step), axial-displacement constraint (constant strain), and radial unloading gradually from 37.5 MPa to 0.
The shear bands of the three schemes are shown in Figure 7. By comparing schemes (b) and (c) considering the axial-displacement constraint and scheme (a) without the constraint, it can be seen that the axial-displacement constraint forces the shear bands approximately parallel to the axial direction, which verifies the secondary anisotropy from the perspective of numerical simulation. In addition, schemes (b) and (c) obtained similar results, which verifies the rationality that selecting a representative constant value during the deformation and failure of the surrounding rock as σ3 in Section 2.1.2.

2.3. Field Borehole TV Image

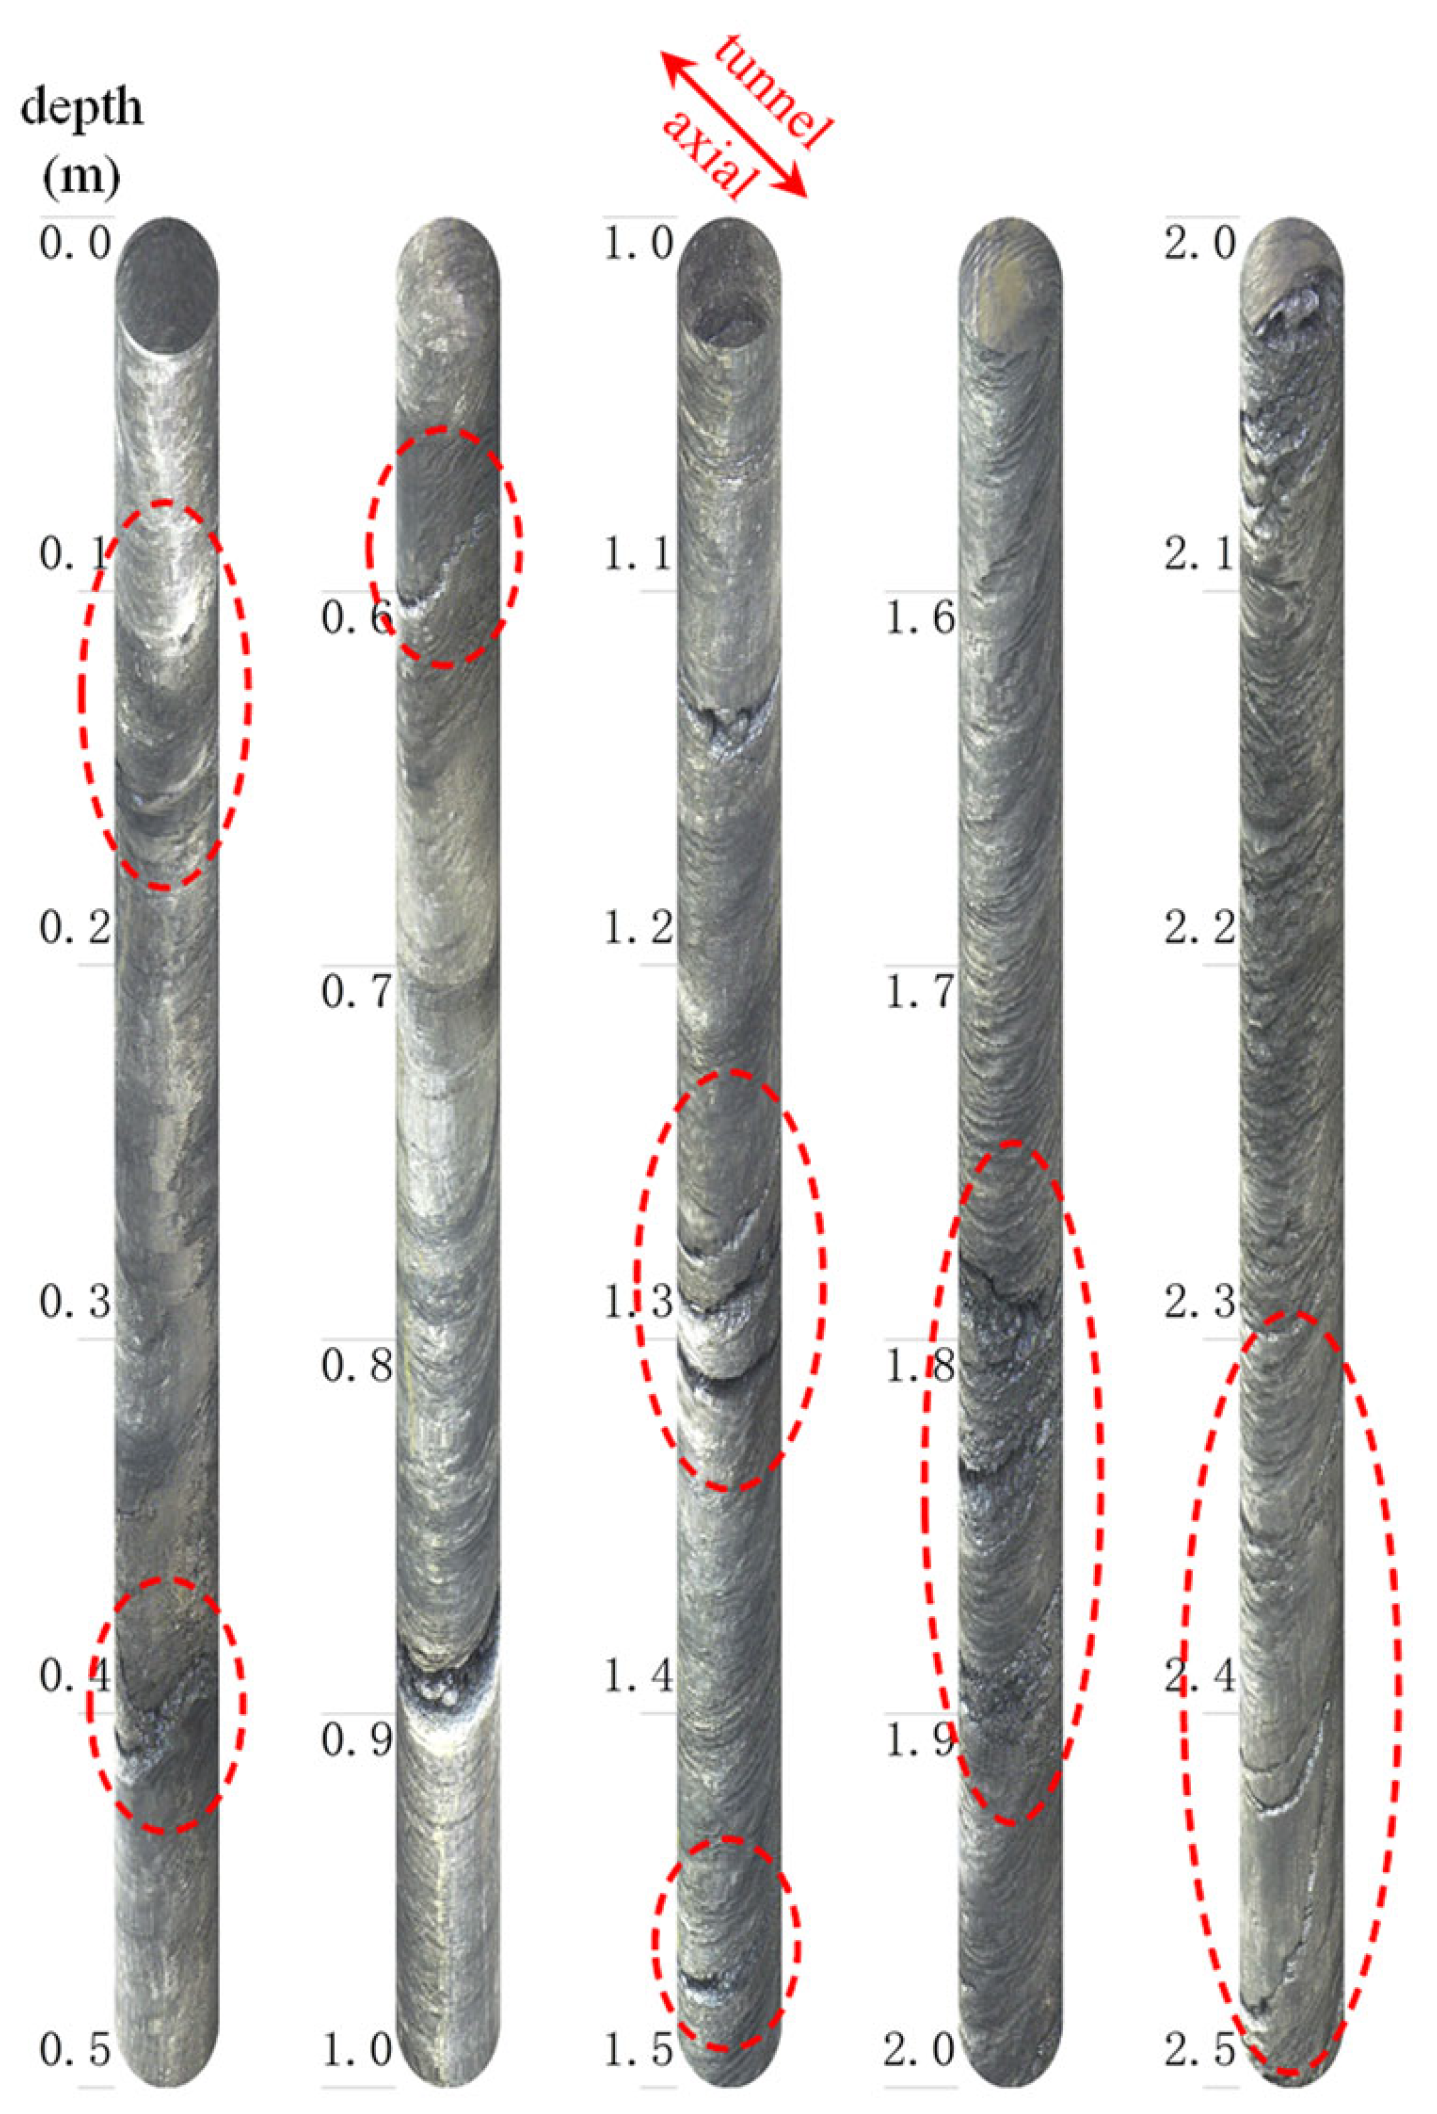
By analysing the borehole TV images of the surrounding rock of several deep tunnels, it was found that most cracks were approximately parallel to the axial direction of tunnels (a typical borehole TV image is shown in Figure 8), these cracks have no significant effect on the axial strength, but they can significantly reduce the tangential strength, which verifies the secondary anisotropy of the surrounding rock from the perspective of field observation.

3. A Novel Secondary Anisotropy Model for the Deep Tunnel Surrounding Rock

3.1. Numerical Implementation of the Secondary Anisotropy

The strain-softening of rock masses involves material instability, stress path dependence, and nonlinearity of the stress–strain response, and its constitutive relationship is essentially incremental. Therefore, there are several difficulties in obtaining an analytical solution, and FLAC3D can address these problems [30]. Based on a uniform strain-softening model developed by Yi et al. [31] that can be called by FLAC3D, a novel constitutive model (SSA model) was developed using C++ to accurately describe the secondary anisotropy of the surrounding rock.
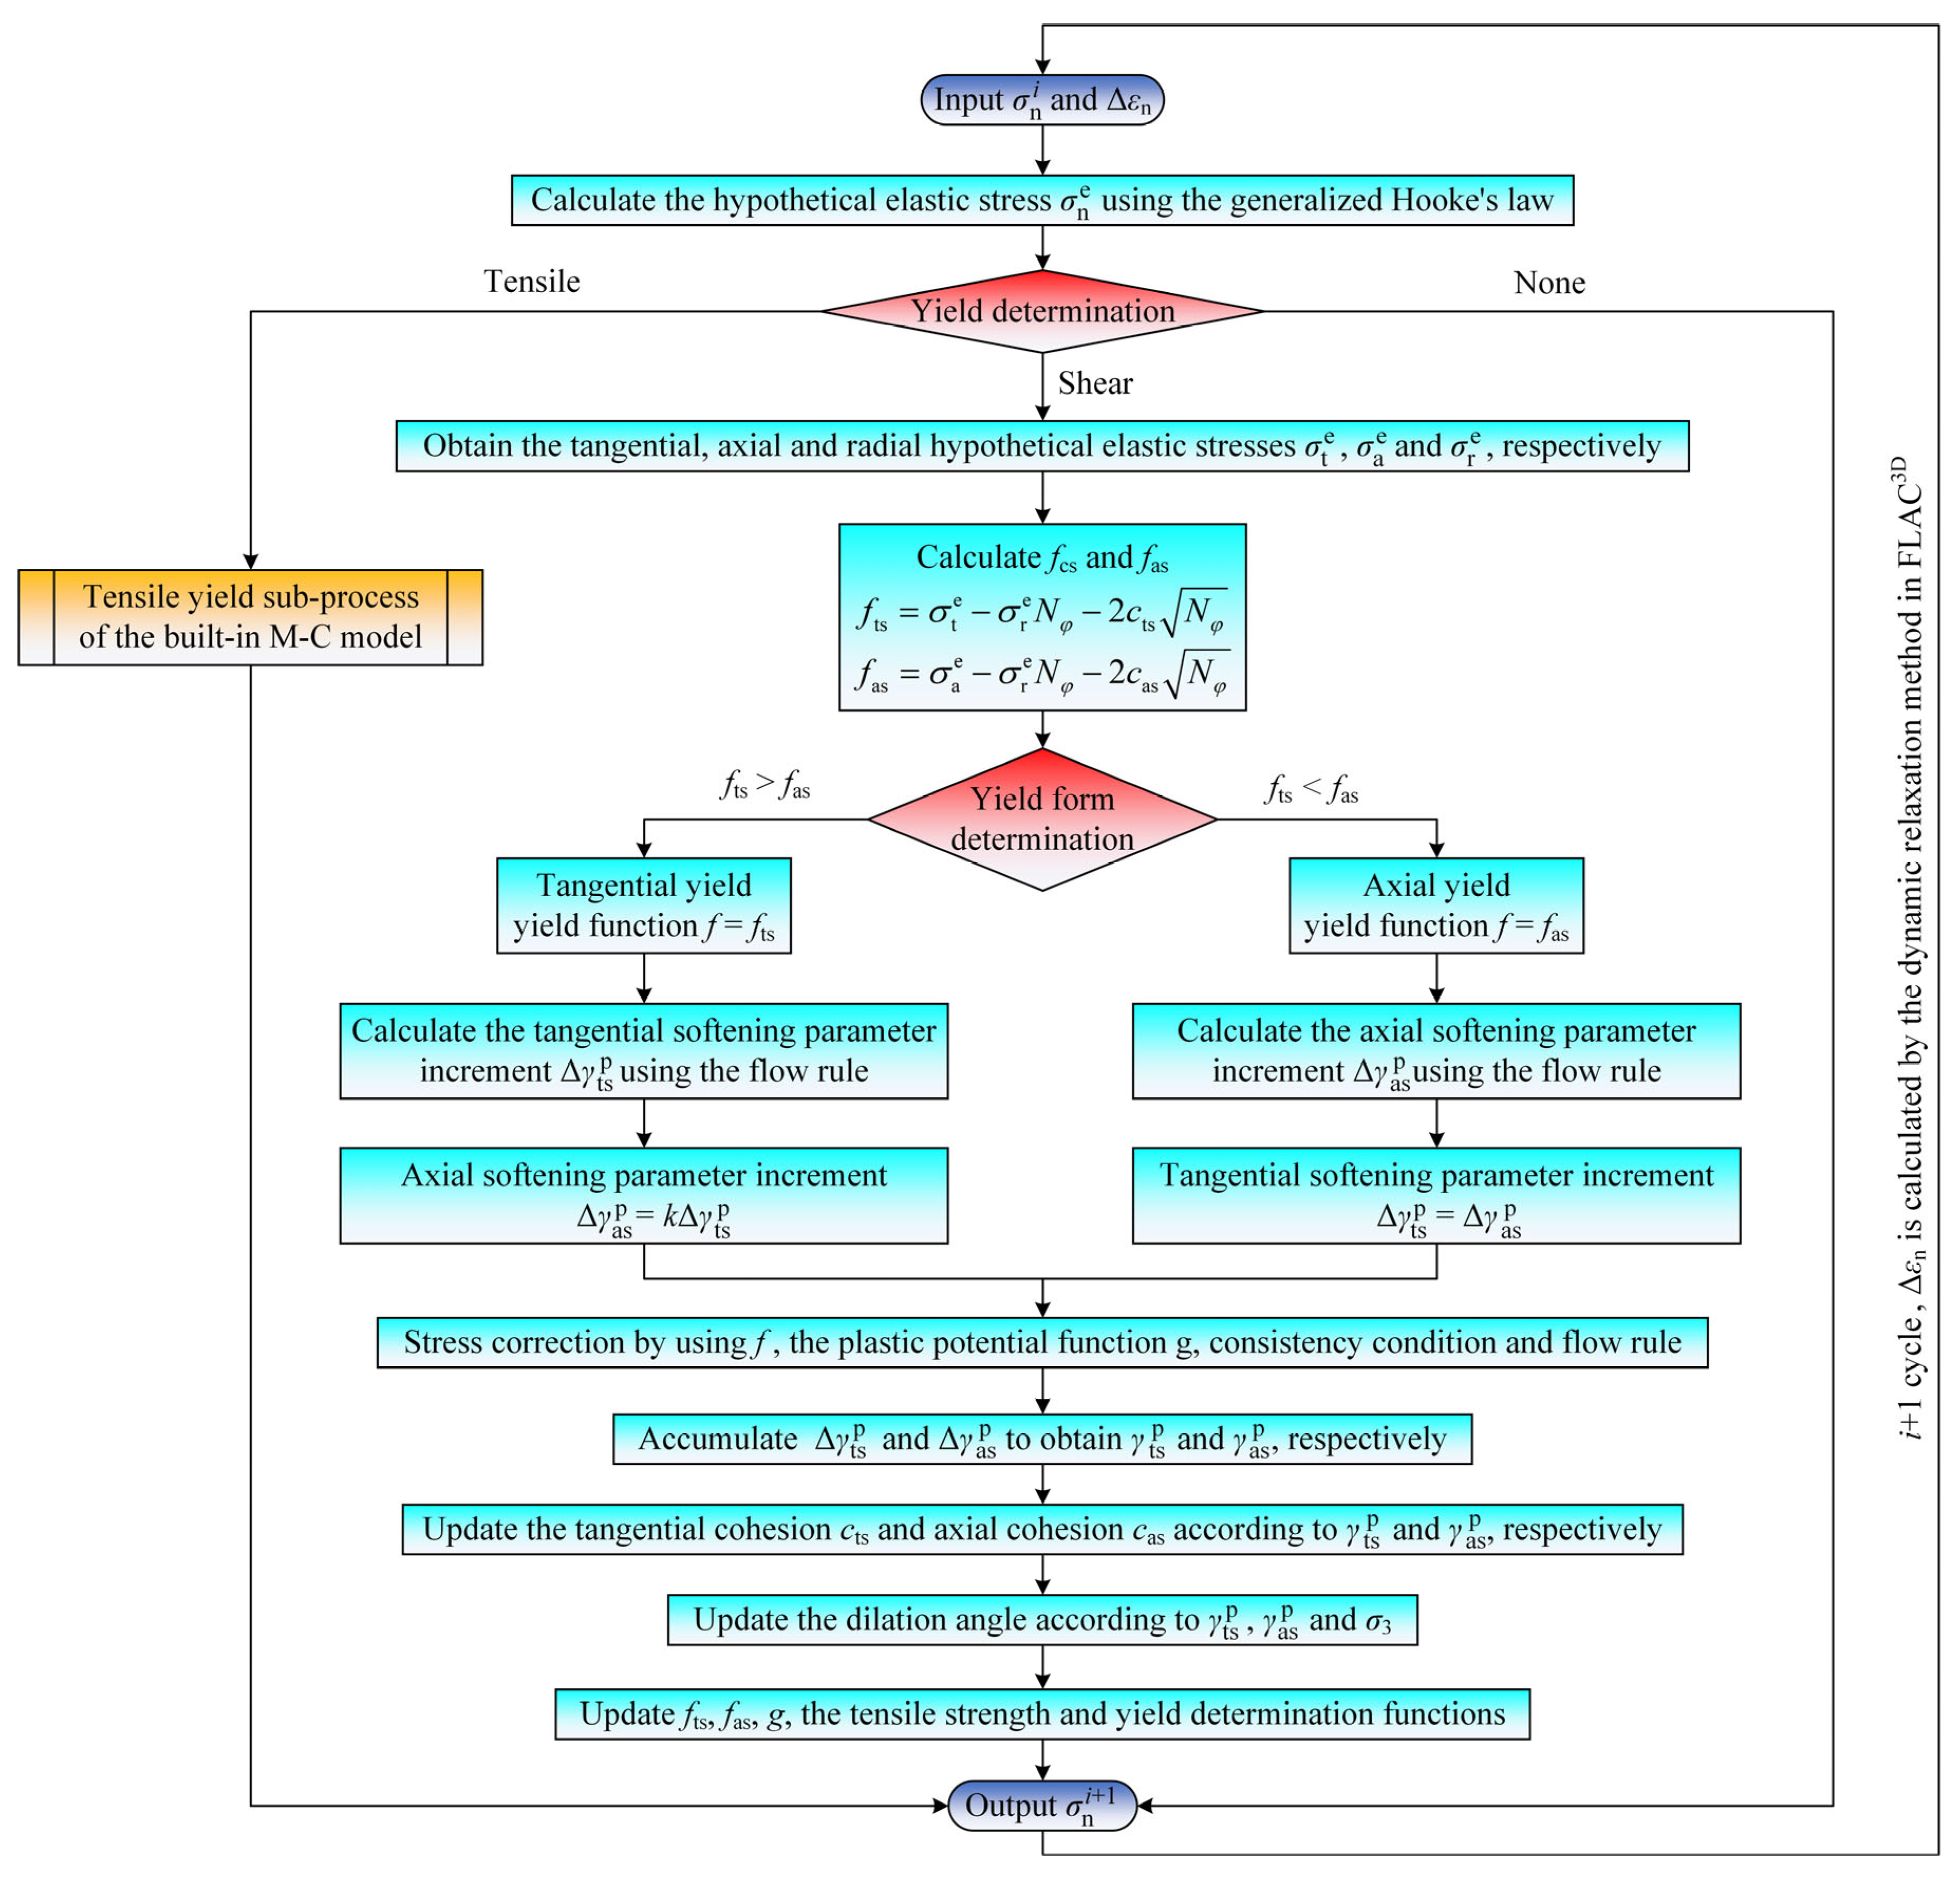
As shown in Figure 9, the function of the SSA model is to output all the stress components σ n i + 1 of the next cycle based on all the stress components σ n i of the current cycle and all the strain increment components Δεn calculated by the dynamic relaxation method [30]. Firstly, Δεn is assumed to be elastic, which is substituted into the generalised Hooke’s law to obtain the hypothetical elastic stress σ n e . Then the yield determination is carried out. When there is no yield, the elasticity assumption of Δεn is valid, and σ n i + 1 = σ n e is output directly. In the case of tensile yield, the stress correction of σ n e is performed according to the tensile yield sub-process of the built-in Mohr–Coulomb model to obtain σ n i + 1 . In the case of shear yield, it is necessary to determine the yield form, that is, whether the tangential stress or the axial stress causes the yield. Considering the secondary anisotropy, the tangential and axial strengths have different softening processes in the post-peak stage, which requires the tangential cohesion cts and axial cohesion cas to be unequal. Therefore, the tangential and axial yield functions have the same form, but different parameters (compression is positive herein).
f ts = σ t e σ r e N φ 2 c ts N φ
f as = σ a e σ r e N φ 2 c as N φ
where fts and fas are the tangential and axial yield functions, respectively; σ t e , σ a e , and σ r e are the tangential, axial, and radial hypothetical elastic stresses, respectively; φ is the friction angle; and Nφ = (1 + sin(φ))/(1 − sin(φ)) is a transformation function.
Generally, in a certain cycle, only one of fts and fas (calculated by Equations (2) and (3), respectively) are positive; that is, tangential and axial yields seldom occur simultaneously. However, in rare cases, both fts and fas are positive. Therefore, it is assumed that if fts > fas, that is, the tangential yield trend is more significant, the shear yield is determined as the tangential yield, and vice versa. The corresponding yield function is selected according to the yield form, and the stress correction of σ n e is performed to obtain σ n i + 1 by combining the plastic potential function g, consistency condition, and flow rule [32,33]. At this point, the purpose of the SSA model is achieved, but the strength parameters and related functions must be updated to realise strain-softening.
Based on extensive experimental data, Pourhosseini and Shabanimashcool [20] proposed a strain-softening model applicable to sedimentary rocks. They showed that in the strain-softening process, with the accumulation of the softening parameter γp, only the cohesion c among the strength parameters of the Mohr–Coulomb criterion decreases, whereas the friction angle φ remains constant. The variation in cohesion c is as follows:
c = c 0 1 tanh 100 γ p tanh 10 + 0.001 q
γ p = ε 1 p ε 3 p
where c0 is the peak cohesion, q is a parameter that depends on the rock type, and ε 1 p and ε 3 p are the maximum and minimum plastic principal strains, respectively.
Considering the secondary anisotropy, the tangential and axial cohesions are unequal in the post-peak stage, and the corresponding softening parameters are consequently unequal. Therefore, Equations (4) and (5) are modified as follows (the softening parameters are written in incremental form):
c ts = c 0 1 tanh 100 γ ts p tanh 10 + 0.001 q
c as = c 0 1 tanh 100 γ as p tanh 10 + 0.001 q
Δ γ ts p = Δ ε t p Δ ε r p
Δ γ as p = Δ ε a p Δ ε r p
where γ ts p and γ as p denote the tangential and axial softening parameters, respectively. Their incremental forms correspond to Δ γ ts p and Δ γ as p , respectively; Δ ε t p , Δ ε a p , and Δ ε r p are the tangential, axial, and radial plastic strain increments, respectively.
Moreover, cts and cas are functions of γ ts p and γ as p , respectively, which are accumulated by Δ γ ts p and Δ γ as p in each cycle, respectively. Therefore, the determination of Δ γ ts p and Δ γ as p (defined by Equations (8) and (9), respectively) can be used to update the strength parameters and related functions. According to the test results in Section 2.1.3, in a tangential failure process, the axial strain-softening is slower than tangential strain-softening. Therefore, if a tangential yield occurs in a certain cycle, the accumulation of γ as p should be slower than that of γ ts p . After Δ γ ts p is calculated using the flow rule, Δ γ as p should be greater than 0 and less than Δ γ ts p , that is, Δ γ as p = k Δ γ ts p , 0 < k < 1. If an axial yield occurs in a certain cycle, uniform strain-softening occurs without an axial-displacement constraint. After Δ γ as p is calculated using the flow rule, Δ γ ts p should be equal to Δ γ as p . At this point, the secondary anisotropy is numerically implemented, but the ratio k of Δ γ as p to Δ γ ts p during tangential yielding remains to be determined.

3.2. Determination of k

First, according to the testing data in Table 2, the peak cohesion c0, tangential cohesion cts when the loading stopped in the Z direction (tangential), and corresponding axial cohesion cas of each sandstone specimen were calculated. Second, the tangential softening parameter γ ts p and axial softening parameter γ as p were calculated according to cts/c0 and cas/c0 of each sandstone specimen, respectively. γ ts p - γ as p data pairs of all the sandstone specimens were then fitted to obtain γ as p ( γ ts p ) as a function of γ ts p . Finally, k was determined by taking the first derivative of γ as p ( γ ts p ).
Although the SSA model adopts the Mohr–Coulomb criterion, which is convenient for engineering applications, and where the parameters have physical interpretations [34,35], the intermediate principal stress σ2 has a significant effect on rock strength under true triaxial stress conditions [36,37,38]. Therefore, the following Mogi–Coulomb criterion [39,40], the 3D extension of the Mohr–Coulomb criterion, was adopted to derive the formula of cohesion c to consider the effect of σ2.
τ oct = a + b σ 1 + σ 3 2
τ oct = 1 3 σ 1 σ 2 2 + σ 2 σ 3 2 + σ 3 σ 1 2
a = 2 2 3 c cos φ
b = 2 2 3 sin φ
where τoct is the octahedral shear stress, and a and b are material parameters.
The formula for c can be derived from Equations (10)–(13), as follows:
c = 1 2 sec φ σ 1 2 + σ 2 2 σ 2 σ 3 + σ 3 2 σ 1 σ 2 + σ 3 σ 1 + σ 3 sin φ
By substituting the test data from Table 2 into Equation (14), c0, cts, and cas of each sandstone specimen were obtained, as listed in Table 3.
According to Equation (4) proposed by Pourhosseini and Shabanimashcool [20], when the softening parameter γp reaches 0.06, the rock strength decreases to residual strength. Sandstone specimen s-4 was loaded to the residual strength in the Z direction (axial); thus, cts was the residual cohesion and q = 0.20162 can be solved by substituting c0 and cts into Equation (4). γ ts p and γ as p of each rock specimen can then be obtained by substituting cts/c0 and cas/c0 from Table 3 into Equations (6) and (7), respectively. In addition, the softening parameter corresponding to the peak strength ( γ 0 p ) is 0.
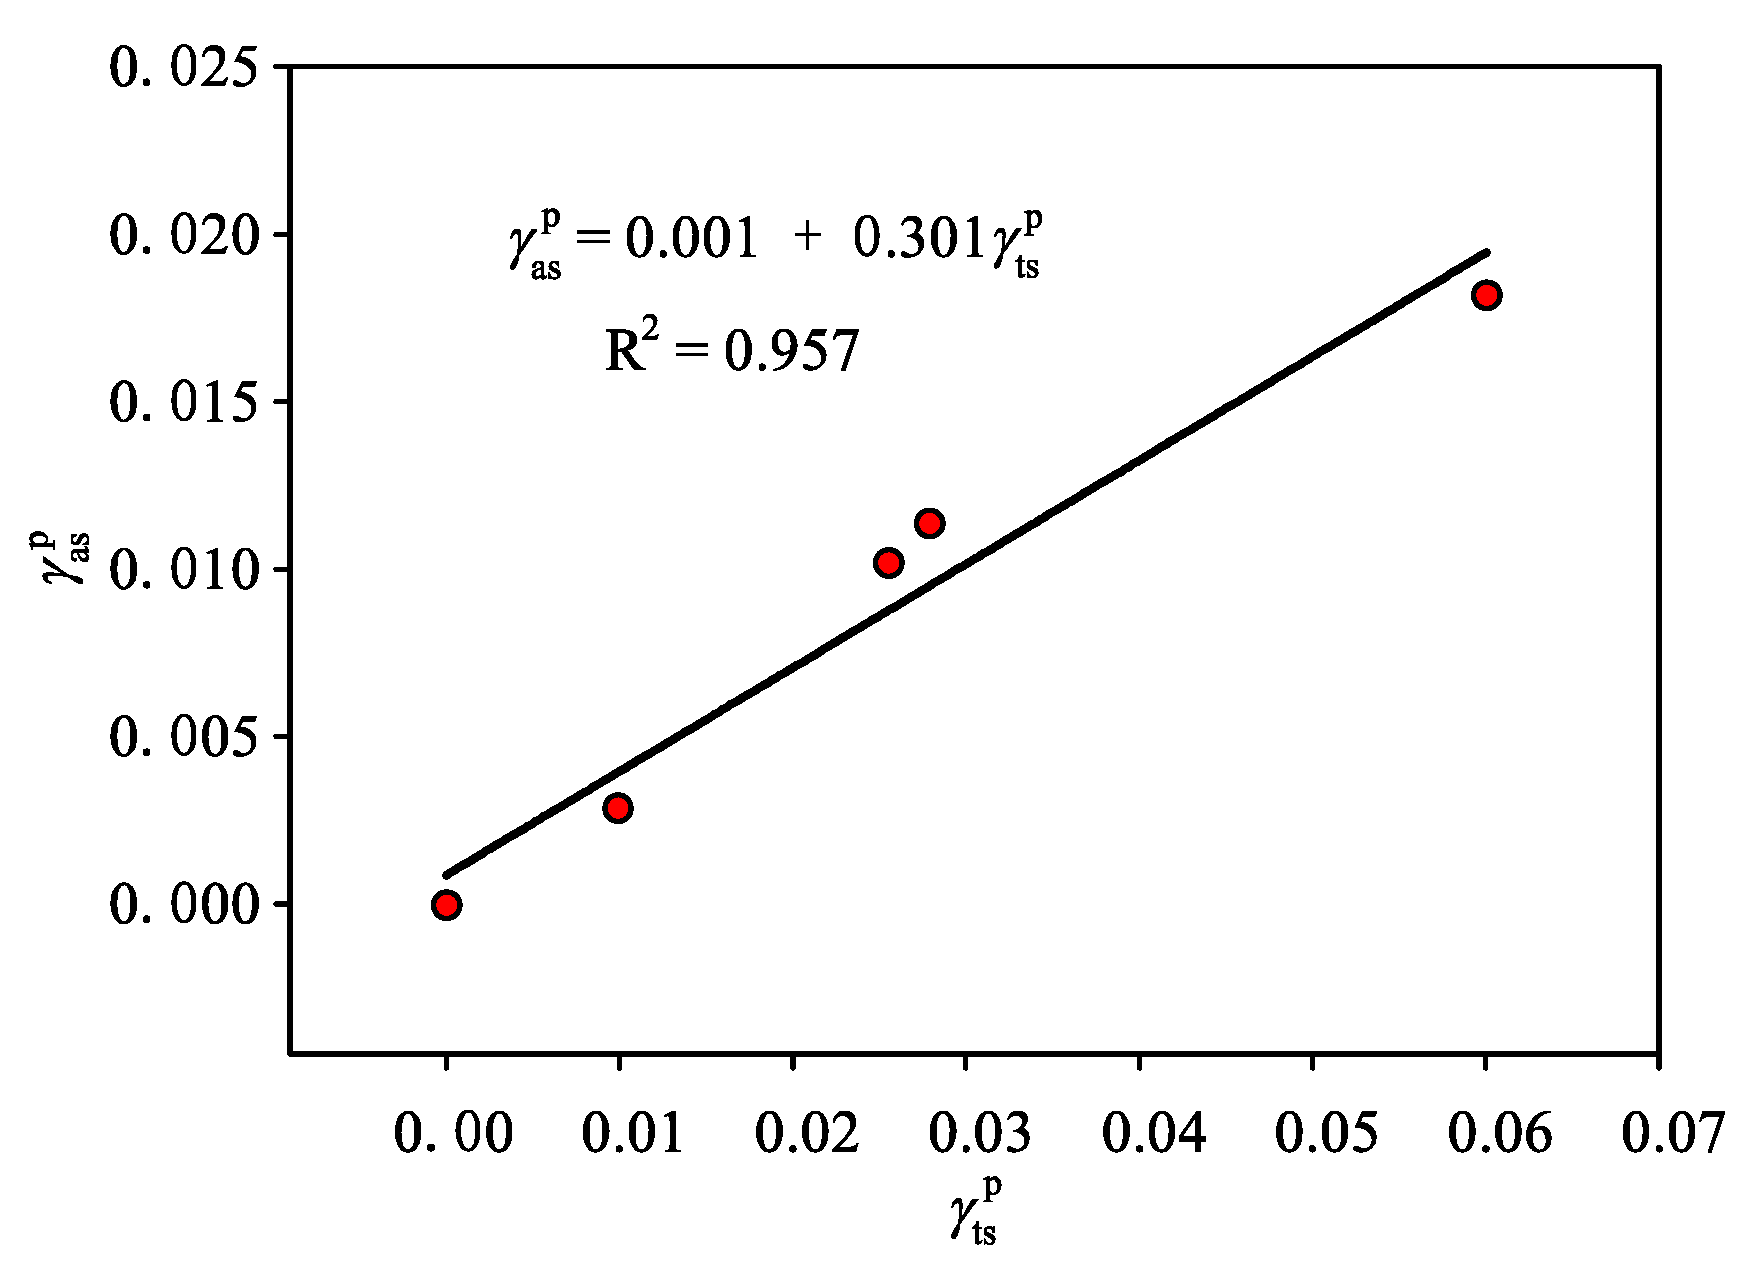
As shown in Figure 10, the γ ts p - γ as p data pairs of rock specimens s-1 to s-4 and the origin (as softening parameters, the initial values of γ ts p and γ as p are both 0) were fitted to obtain γ as p ( γ ts p ):
γ as p ( γ ts p ) = 0.001 + 0.301 γ ts p
By taking the first derivative of Equation (15), the ratio k of Δ γ as p to Δ γ ts p during tangential yielding was determined to be 0.301.
Figure 10. Fitting result of the relationship between the axial softening parameter γ as p and tangential softening parameter γ ts p .
Symmetry 17 01234 g010

3.3. Model Verification

3.3.1. Verification of the Key Parameters

According to the calculation process shown in Figure 9, the SSA model was developed using C++ into a numerical form that can be called by FLAC3D and then verified according to the oedometer test method [30].
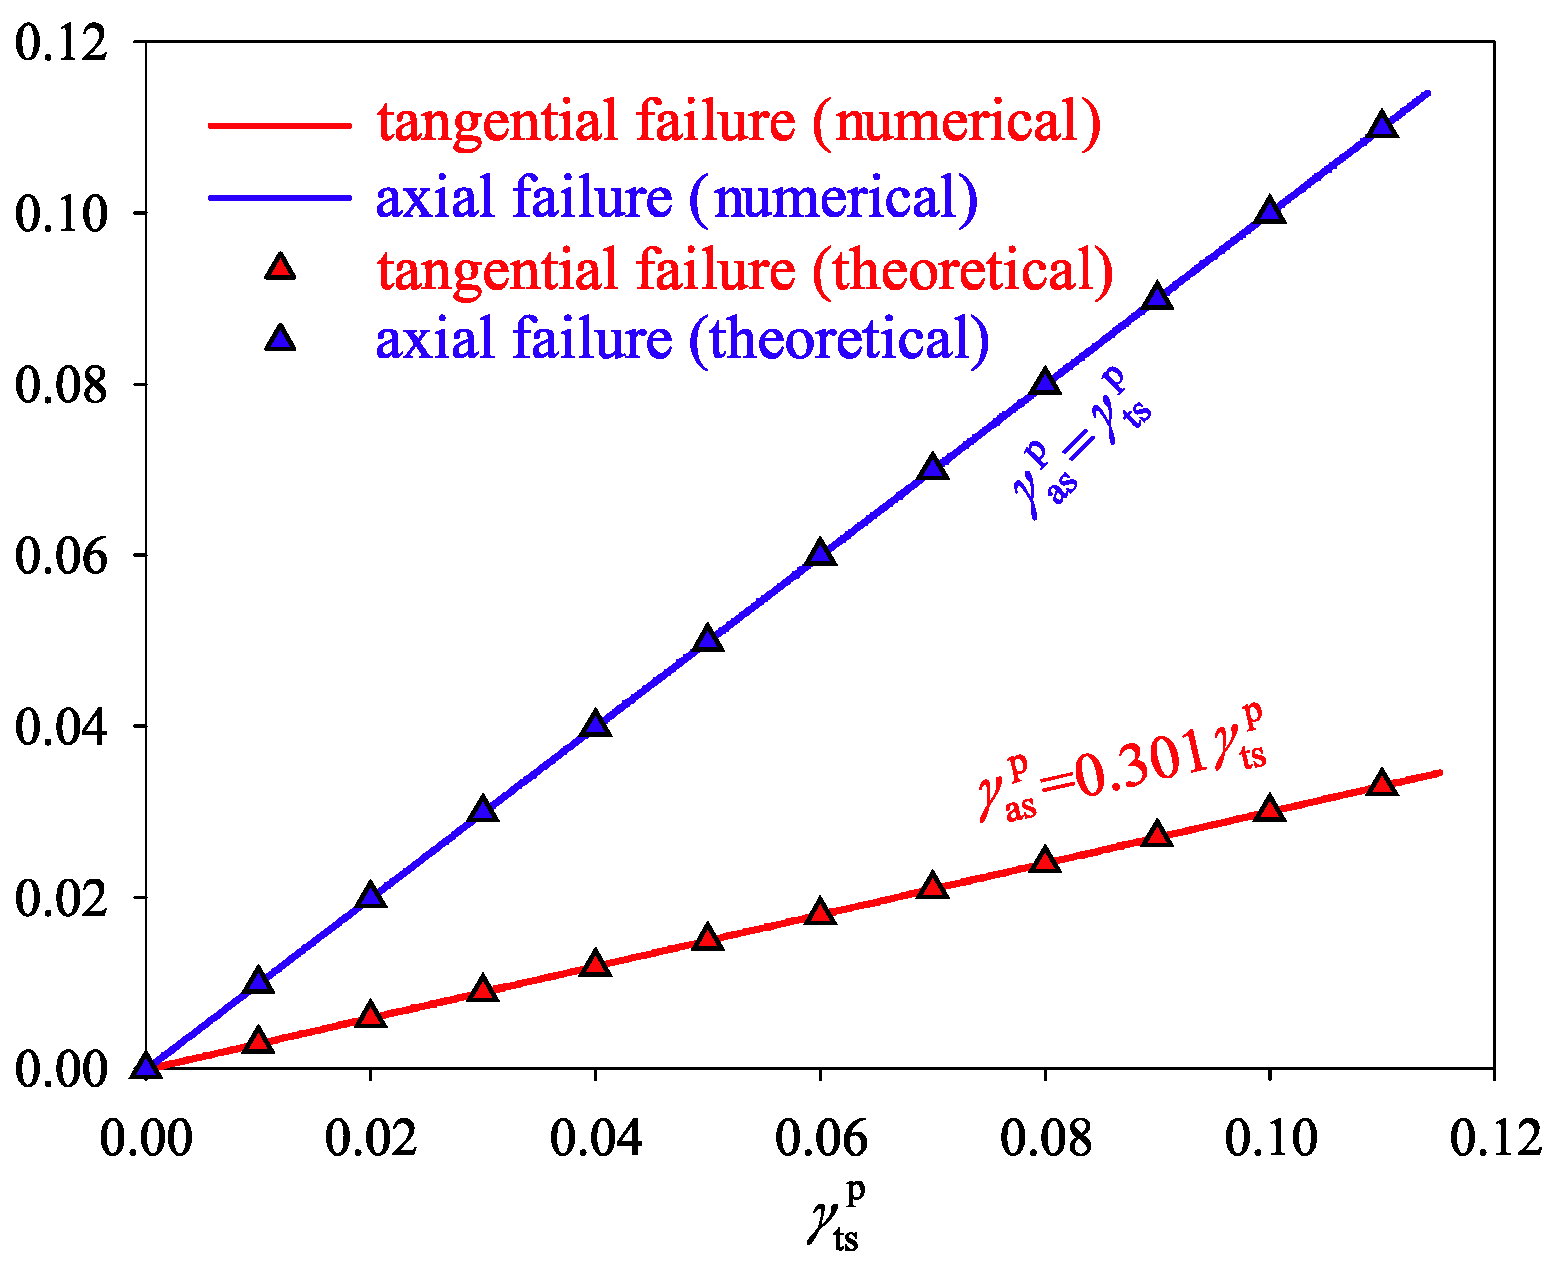
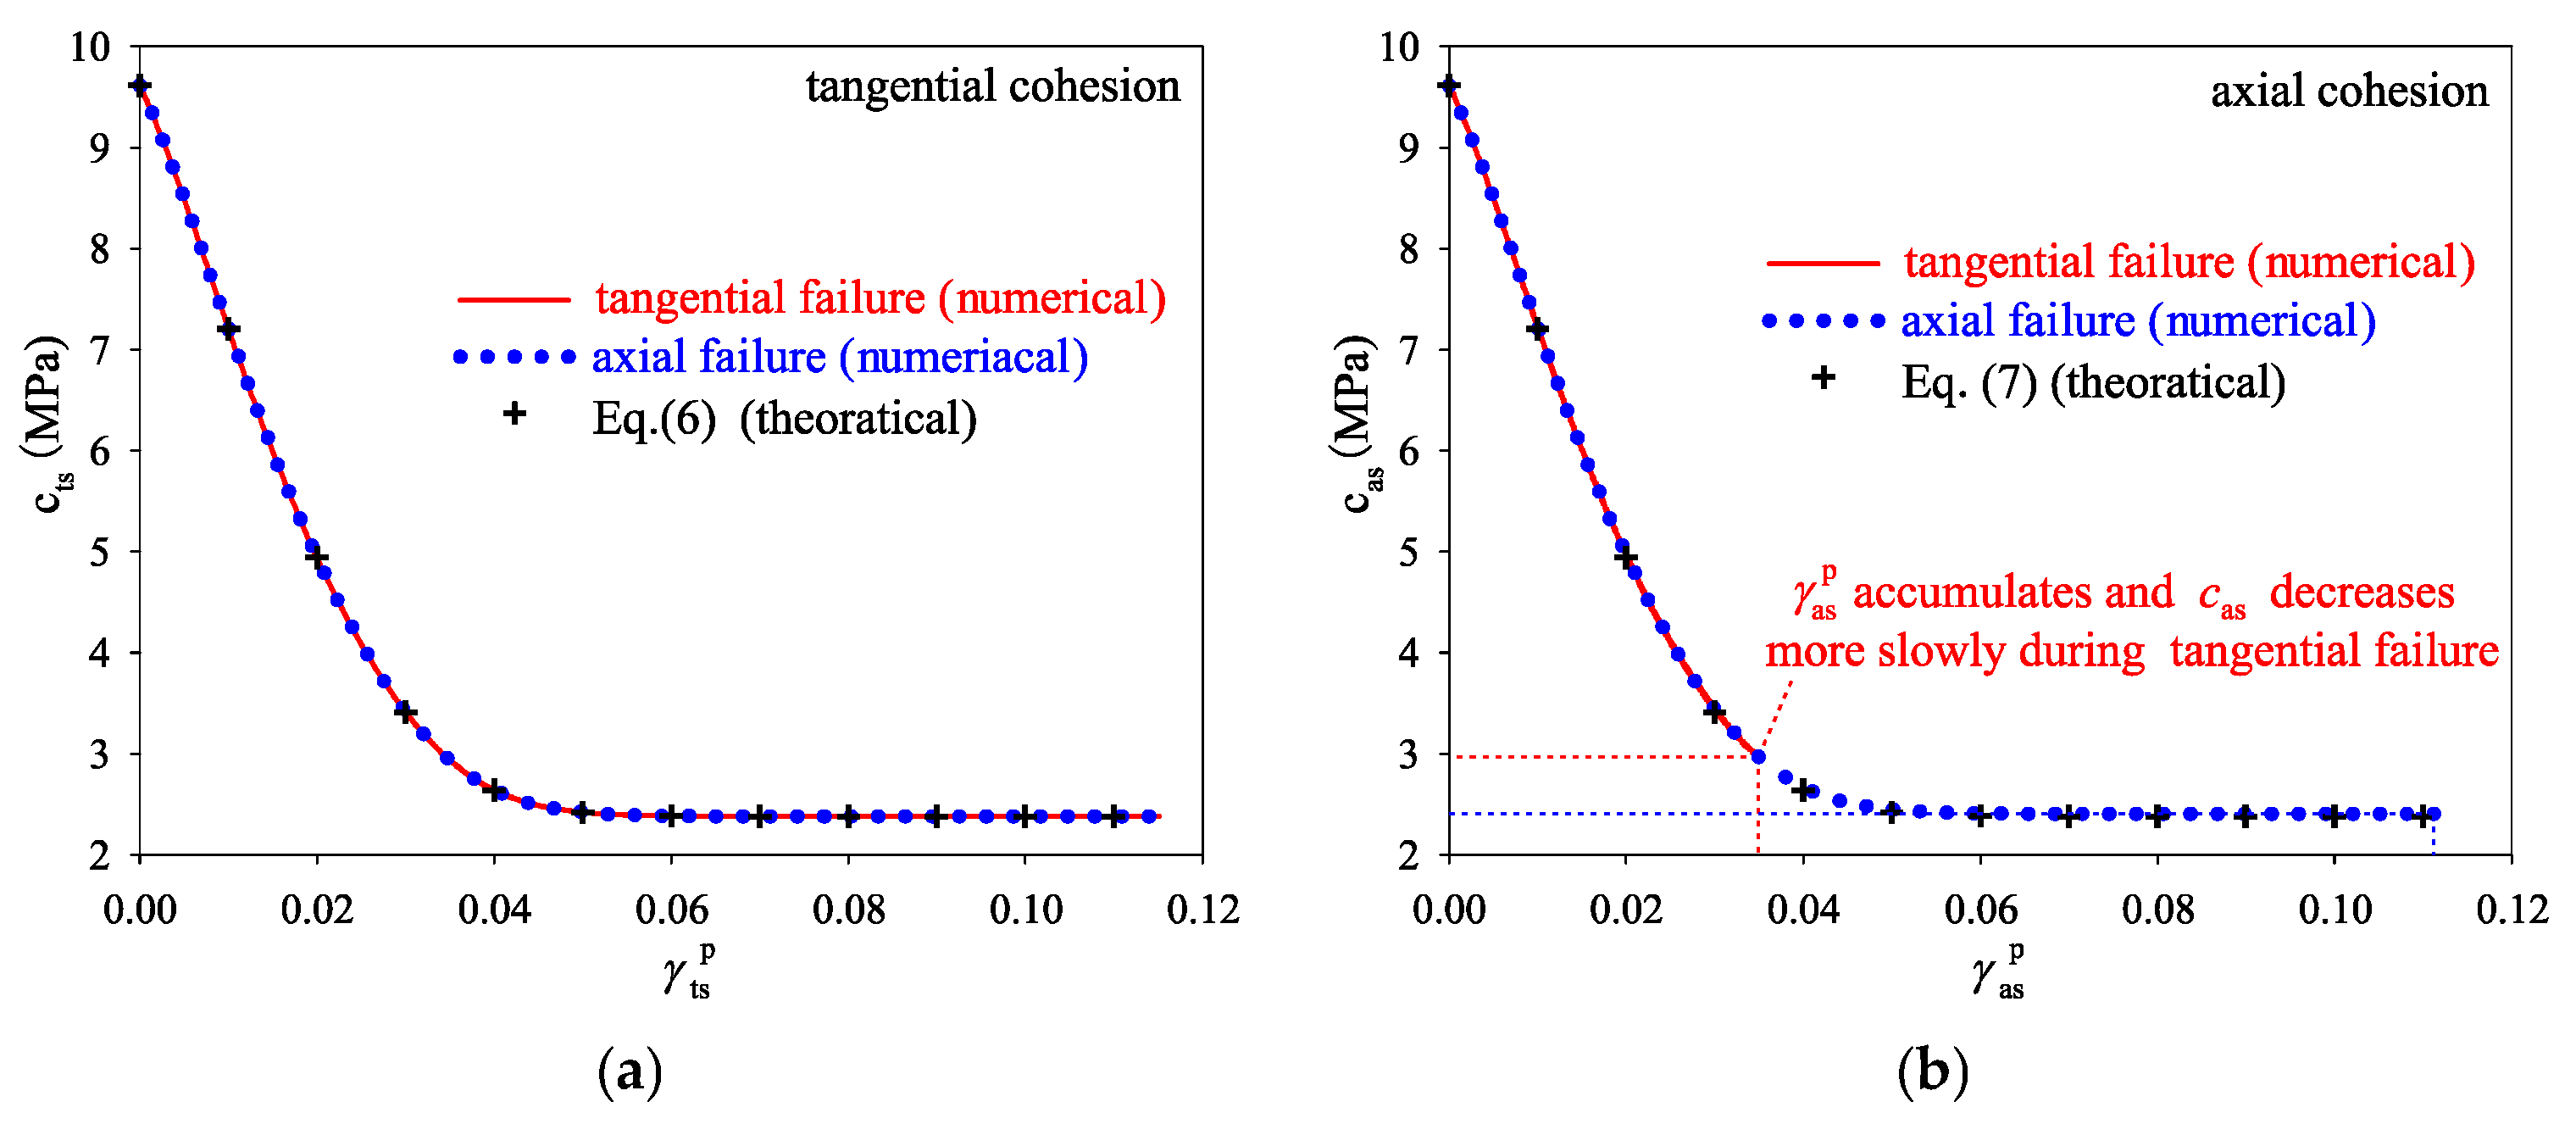
A single-grid numerical model, as shown in Figure 11, was established to simulate the two cases of tangential and axial yields to verify the relationship between γ as p and γ ts p , as well as the variations in cas and cts. The material parameters in Table 1 were adopted. In addition, there is a significant synergistic effect between strain-softening and dilatancy [31,41,42], so the dilation angle should be accurately estimated. The two-parameter mobilised dilation angle model proposed by Pourhosseini and Shabanimashcool [20] is used to estimate the dilation angle in the SSA model. The initial stresses in the X, Y, and Z directions were set as 8 MPa. In the tangential yield simulation, the stress was maintained in the X direction (radial), and strain was constant in the Y direction (axial) and loaded in the Z direction (tangential). In the axial yield simulation, the stresses were maintained in the X and Z directions (without the axial-displacement constraint) and loaded in the Y direction. The calculation was conducted for 30,000 cycles, and γ as p , γ ts p , cas, and cts were monitored. The results are shown in Figure 12 and Figure 13.
According to Figure 12 and Figure 13, the relationship between γ as p and γ ts p is consistent with the results presented in Section 3.1, and the variations in cas and cts are consistent with Equations (6) and (7), respectively.

3.3.2. Verification of the Secondary Anisotropy

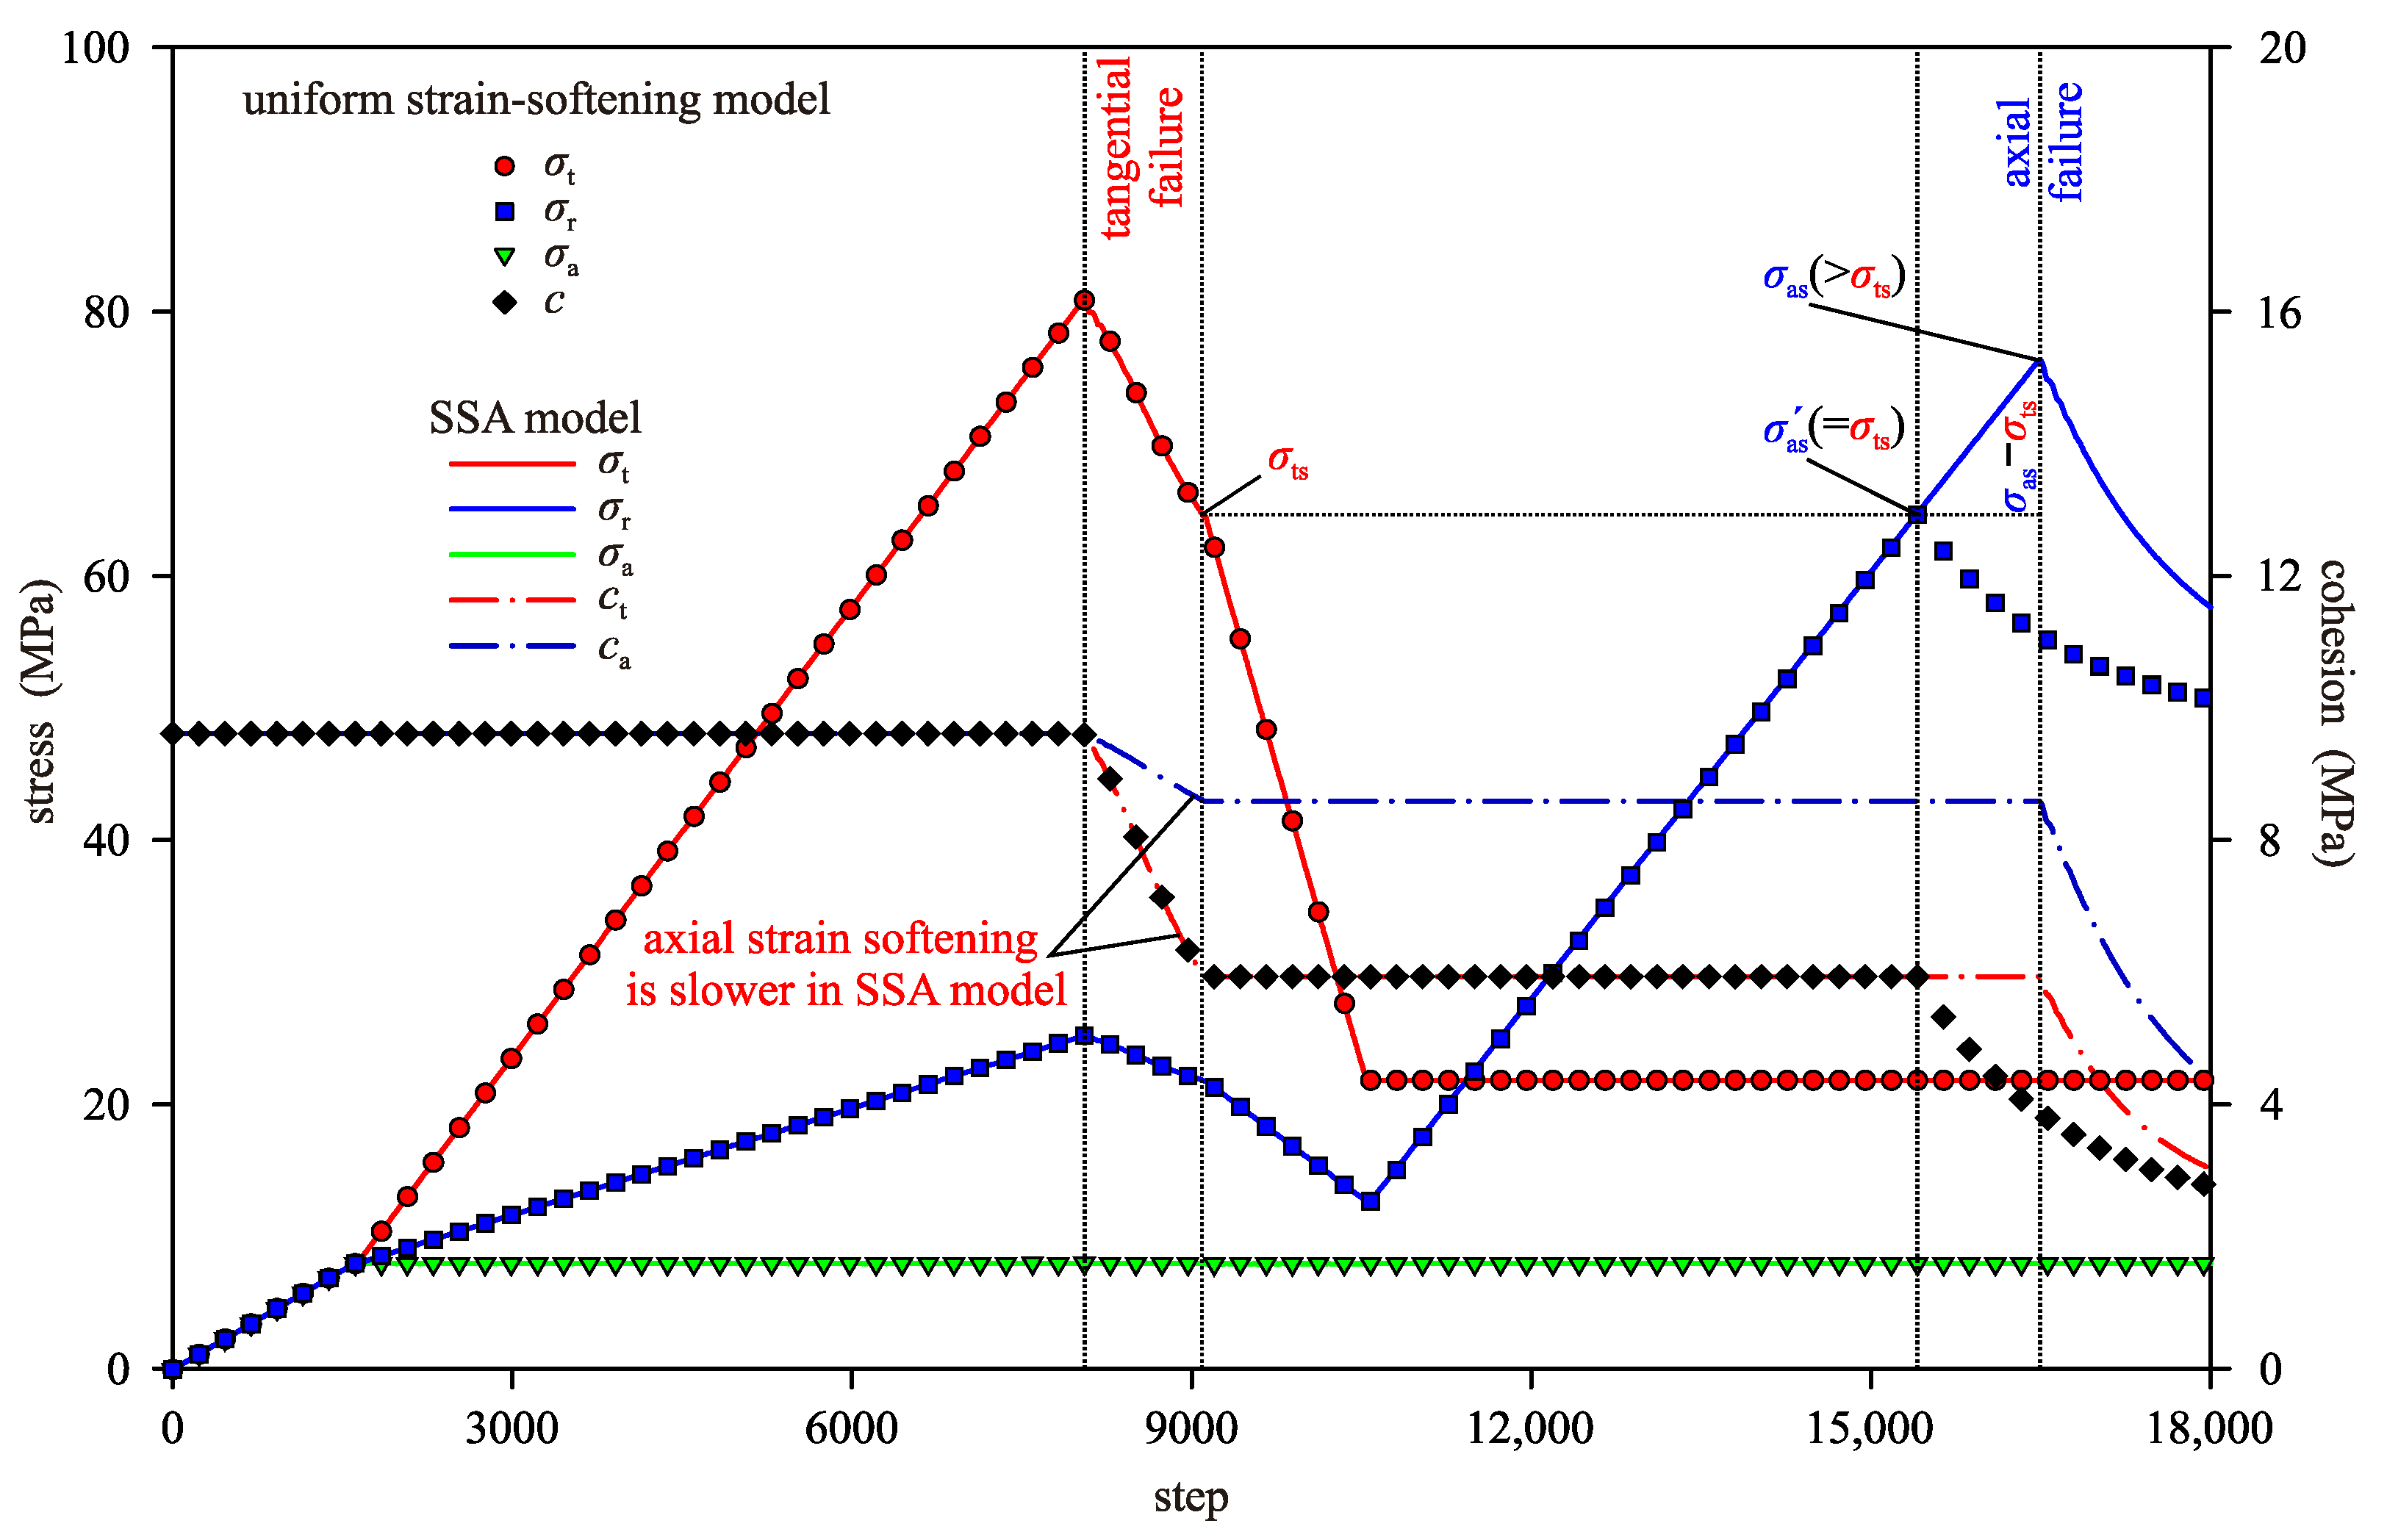
Although the verification in Section 3.3.1 indicates that the SSA model can accurately reflect the variations in key parameters, it is more important to verify whether it can describe the secondary anisotropy. The single-grid numerical model shown in Figure 11 was loaded using the same loading procedure as the laboratory tests (see Section 2.1.2). The SSA model was adopted, with the uniform strain-softening model [31] as the reference, and the material parameters were taken from Table 1. The tangential stress σt, radial stress σr and axial stress σa, the cohesion c of the uniform strain-softening model [31], as well as the tangential cohesion ct and axial cohesion ca of the SSA model, were monitored. The results are shown in Figure 14.
As shown in Figure 14, for the uniform strain-softening model [31], the measured axial strength σas is equal to the corresponding post-peak tangential strength σts after the tangential failure; while for the SSA model, σas is significantly higher than σts. Additionally, during the tangential failure, the axial strain-softening is slower than the tangential strain-softening in the SSA model. Apparently, the results of the SSA model are consistent with the test results (see Section 2.1.3), and this model can describe the secondary anisotropy. Moreover, the stress curves of the two models are completely consistent before the axial failure, indicating that the SSA model has high stability and reliability.

4. Effects of the Secondary Anisotropy on the Deformation and Failure of a Deep Tunnel Surrounding Rock

4.1. Modelling and Schemes

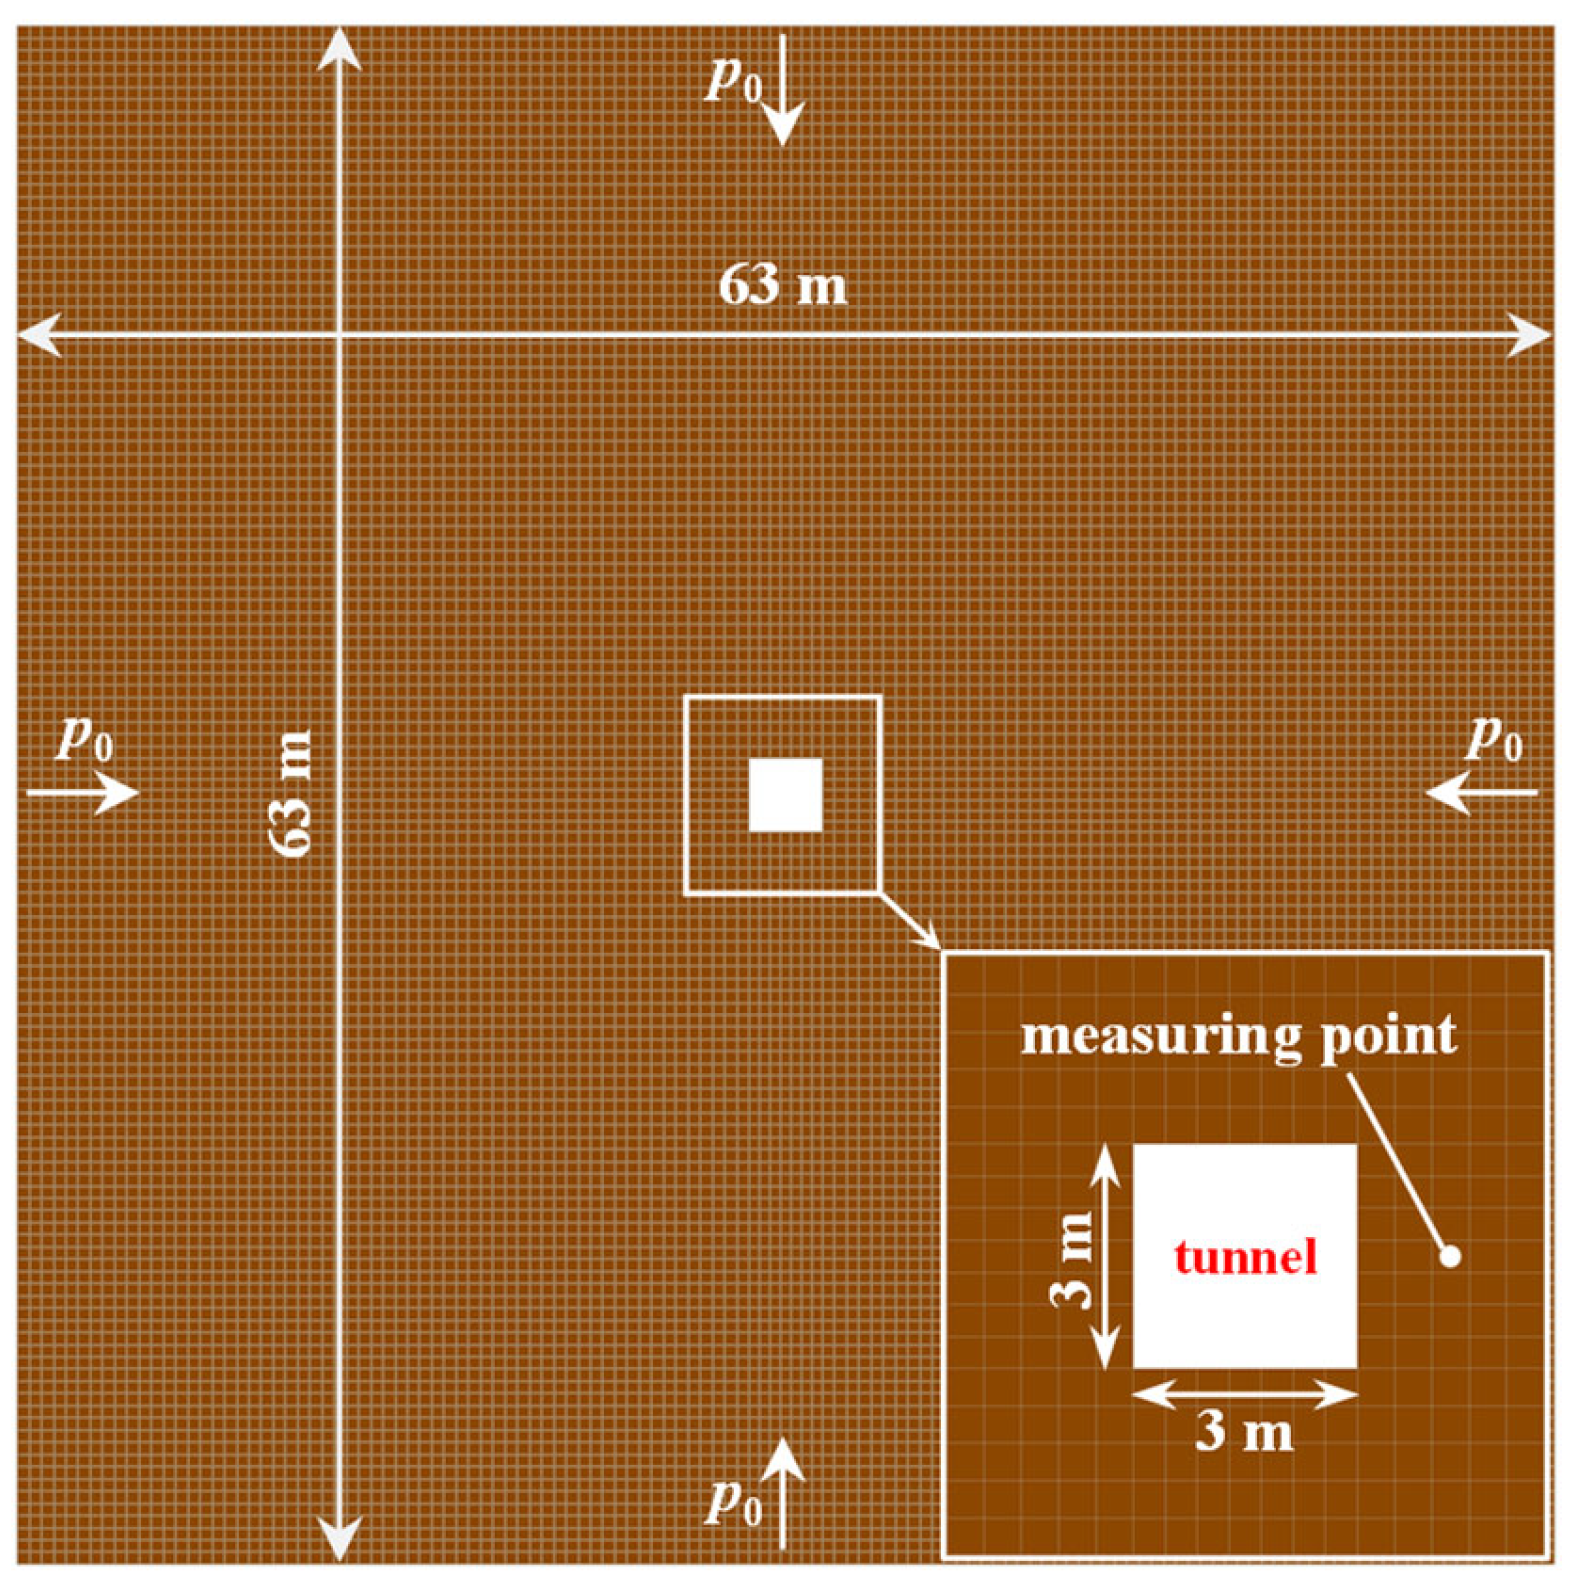
Because deep tunnels can be analysed using a plane model, a numerical model with a unit thickness (1 m) was established using FLAC3D, and a common 3 × 3 m rectangular tunnel was excavated, as shown in Figure 15. The model boundaries were 30 m away from the excavation boundaries, and all the model boundaries were fixed in the normal directions. A model boundary, namely the artificial boundary, can be categorised into stress boundaries and displacement boundaries. Both types of boundaries can introduce errors into the calculation results. Nevertheless, when the artificial boundaries are sufficiently distant from the excavation boundaries, these errors can be nearly eliminated [30]. In this simulation, displacement boundaries, which are more suitable for tunnel analysis, were selected, and the distances between the artificial boundaries and the excavation boundaries were set to be ten times the dimensions of the tunnel to minimise errors. Moreover, considering axial symmetry of the tunnel, the displacement boundaries were also applied in the axial direction). The model comprises 16,129 zones and 32,768 nodes. The excavation depth of the tunnel was set to 1500 m, and the rock mass volumetric weight was set to 25 kN/m3; thus, the hydrostatic in situ stress p0 was 37.5 MPa (in situ stress tends to be hydrostatic at greater depths [43]). Because verifying the secondary anisotropy requires the use of as homogeneous and intact rock as possible with strength significantly higher than that of in situ rock masses, the strength parameters in Table 1 were appropriately reduced for the numerical simulation (c = 6.37 MPa, φ = 25°, UCS = 20 MPa, that is, the strength was reduced by approximately 50%), while the other parameters remained unchanged. The uniform strain-softening model developed by Yi et al. [31] and the SSA model were used to perform the numerical simulations. The effects of secondary anisotropy on the deformation and failure of the surrounding rock were analysed by comparing the results calculated by the two models.

4.2. Numerical Simulation Results

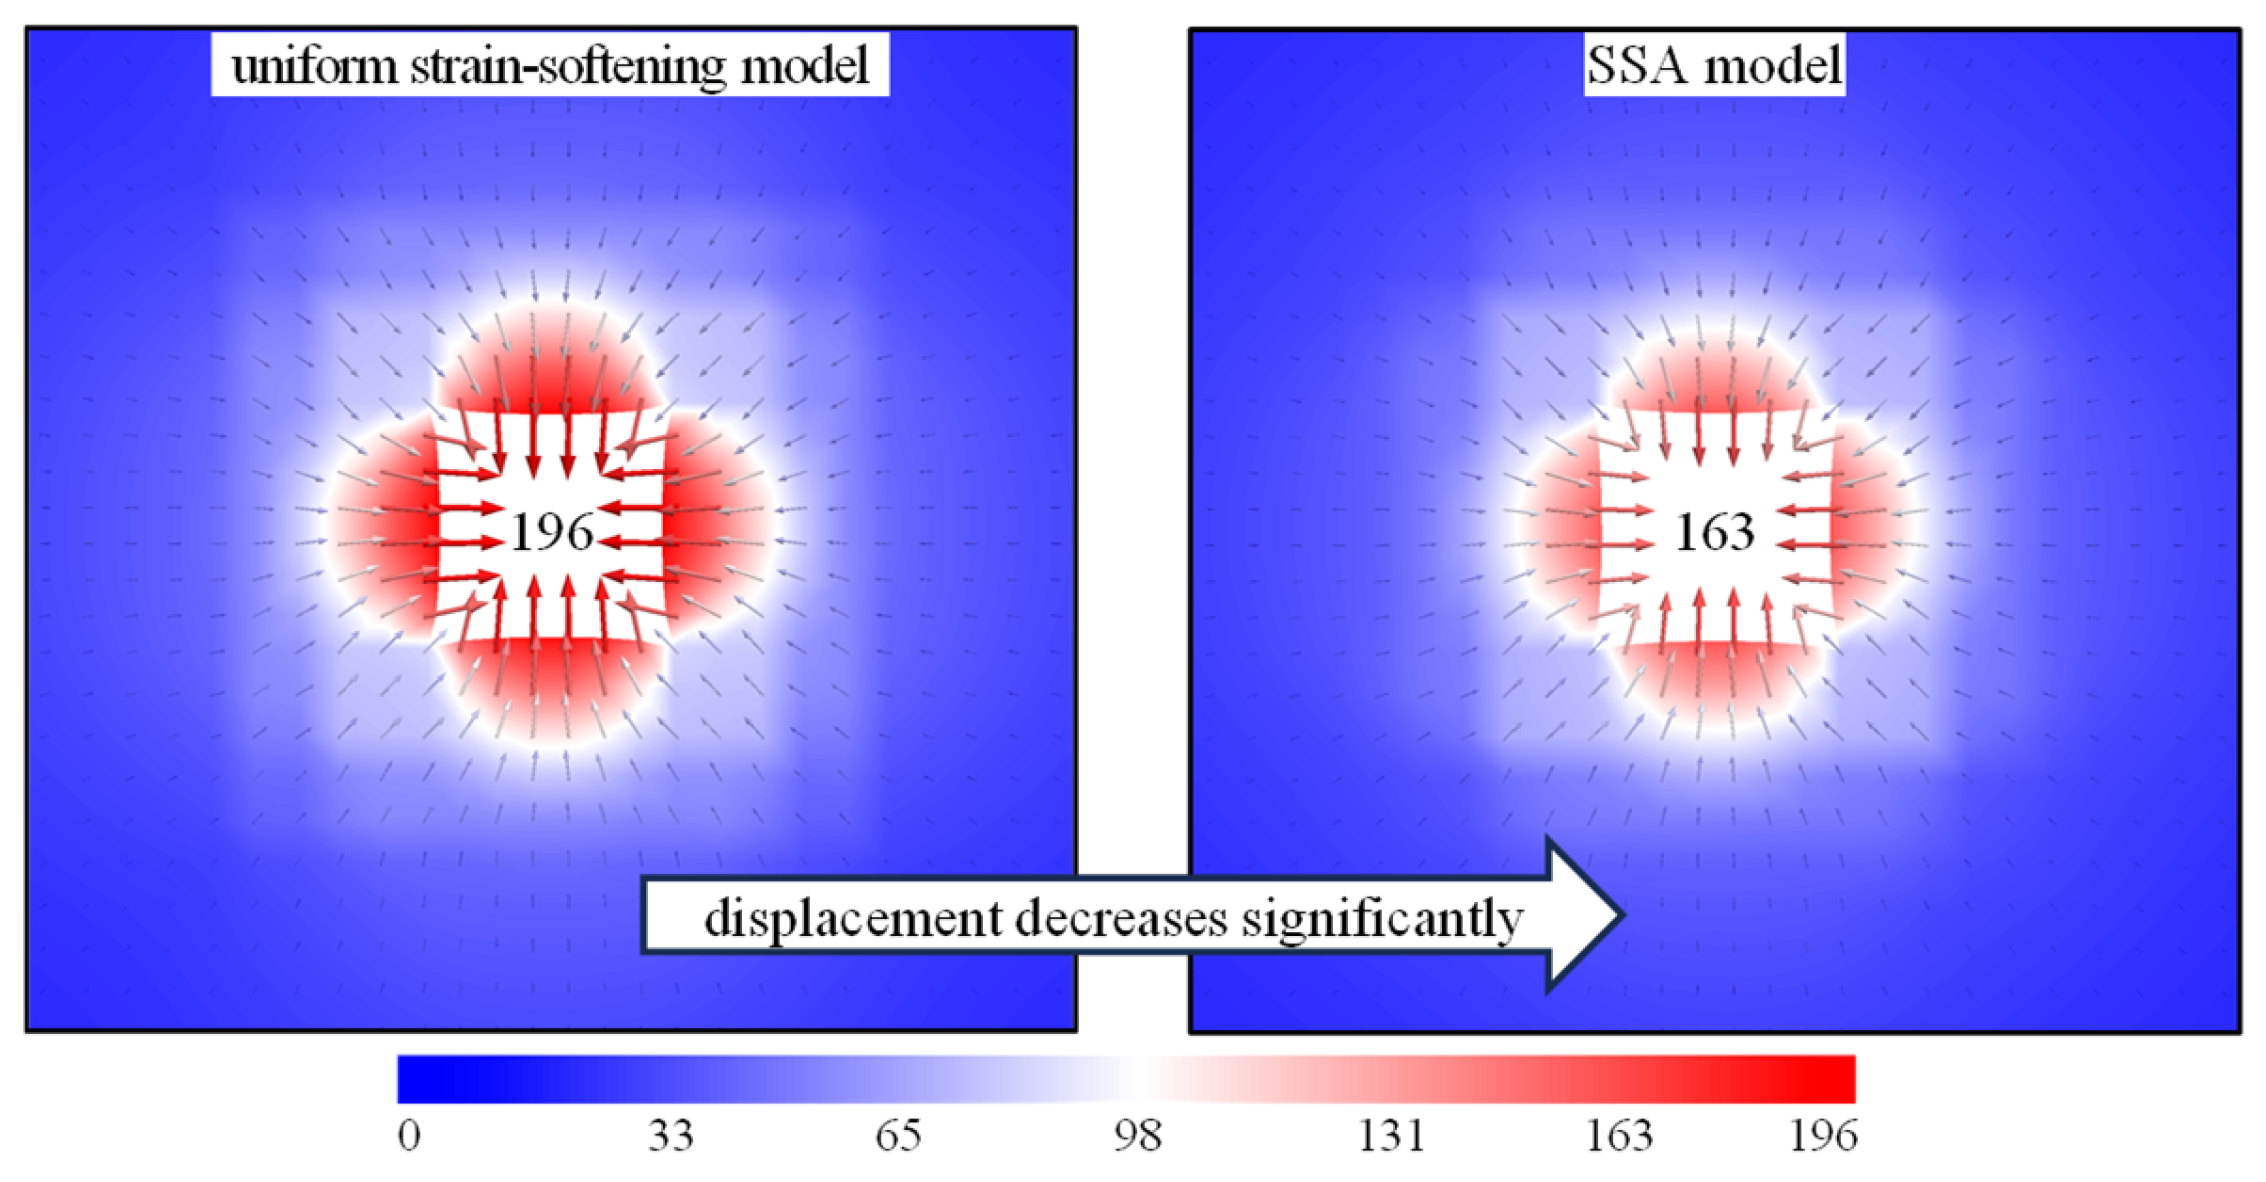
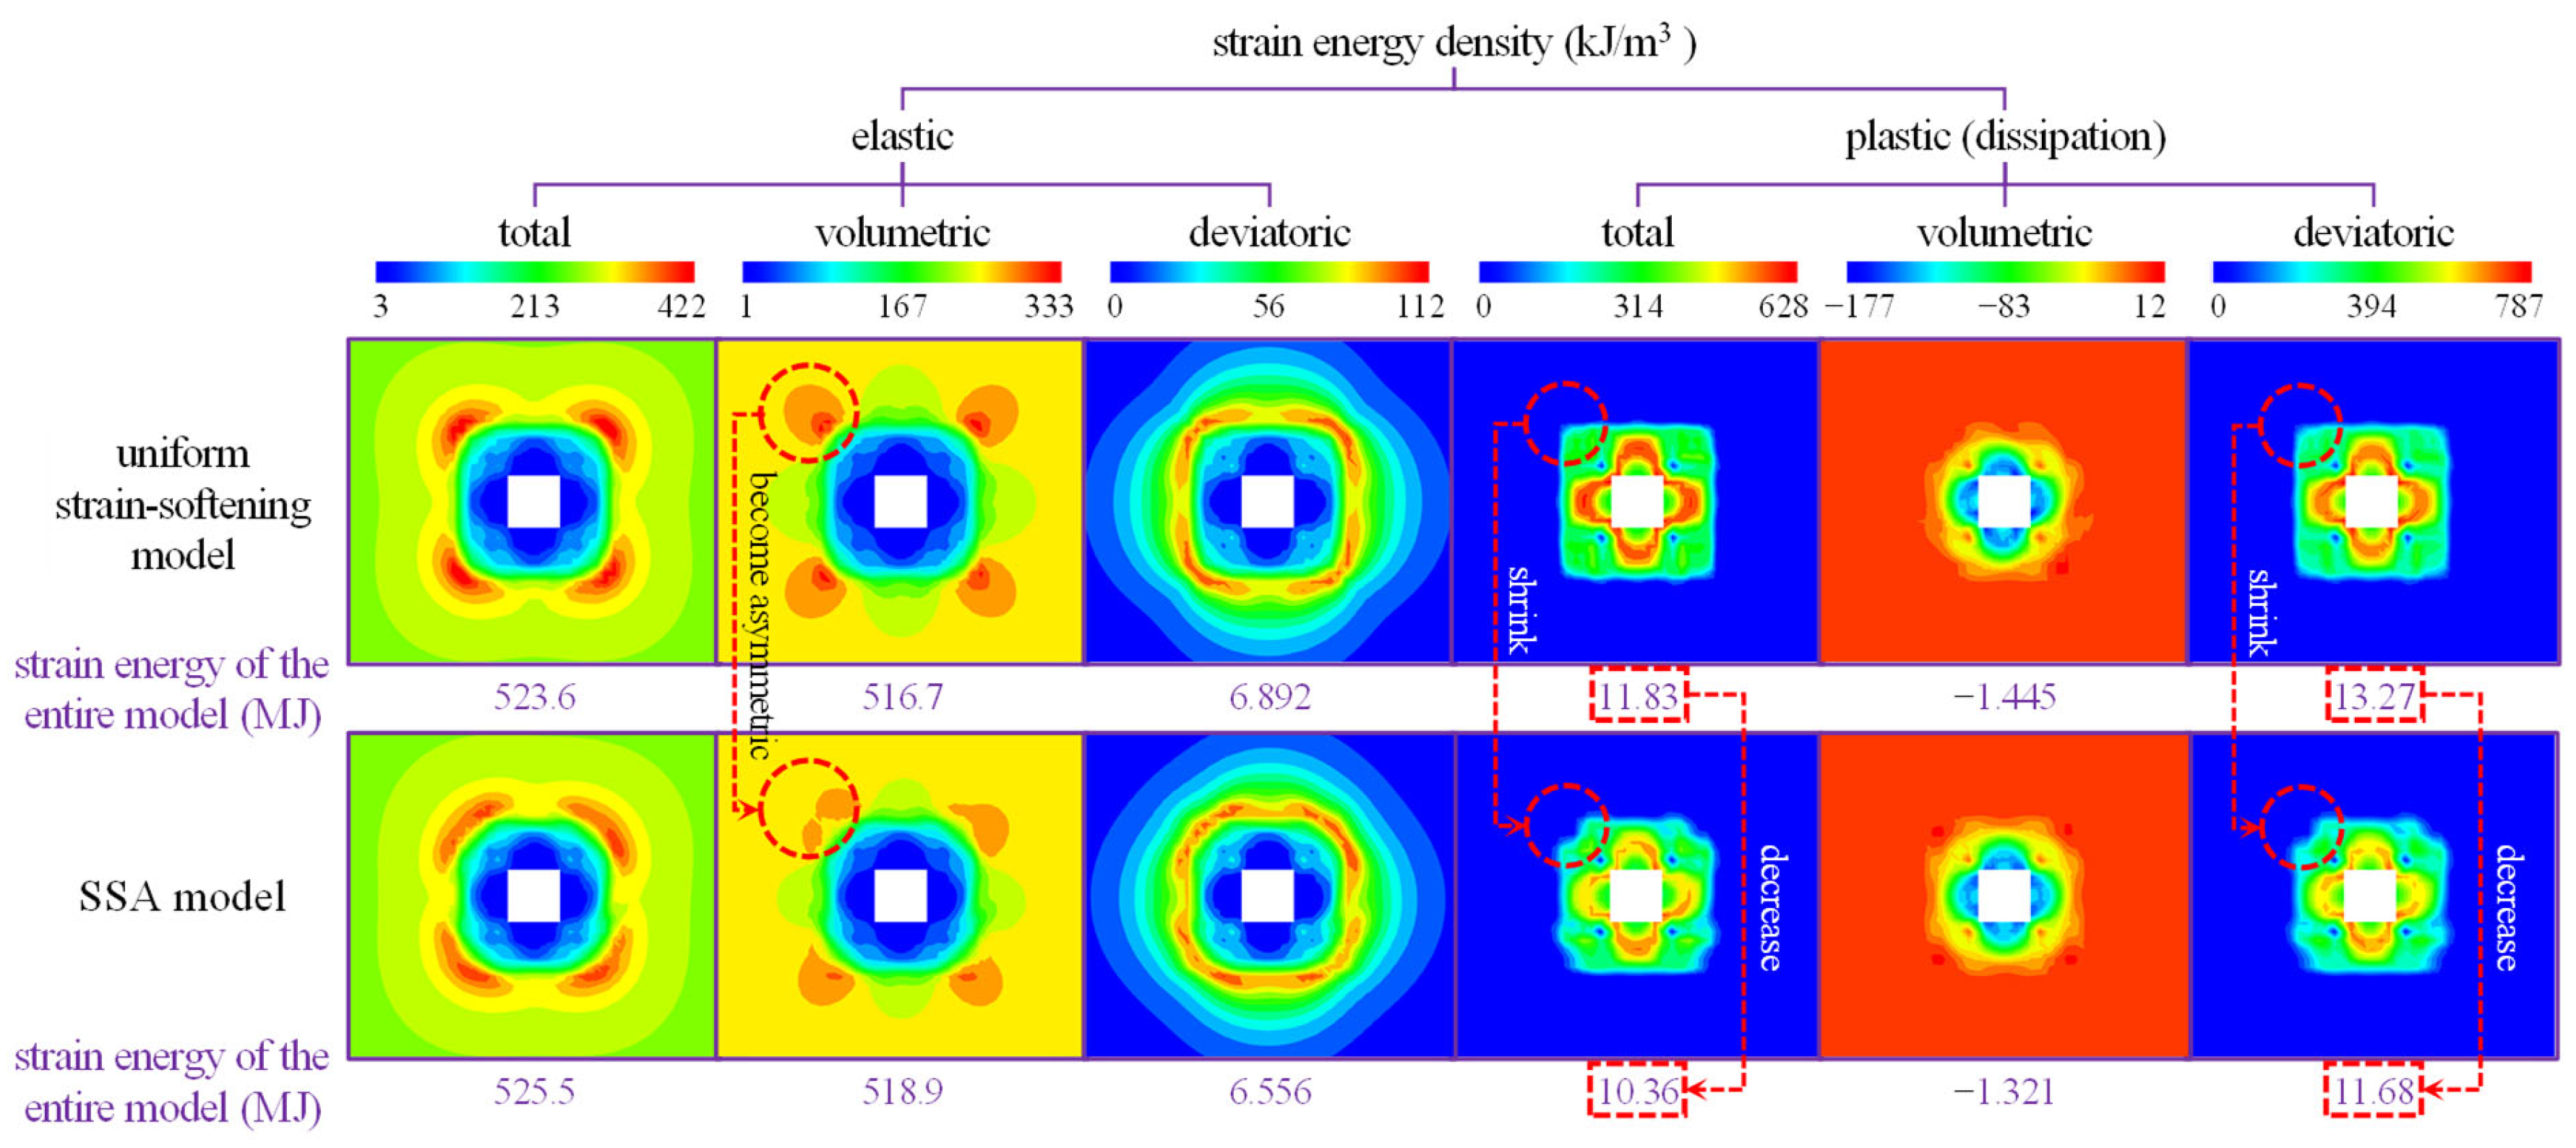
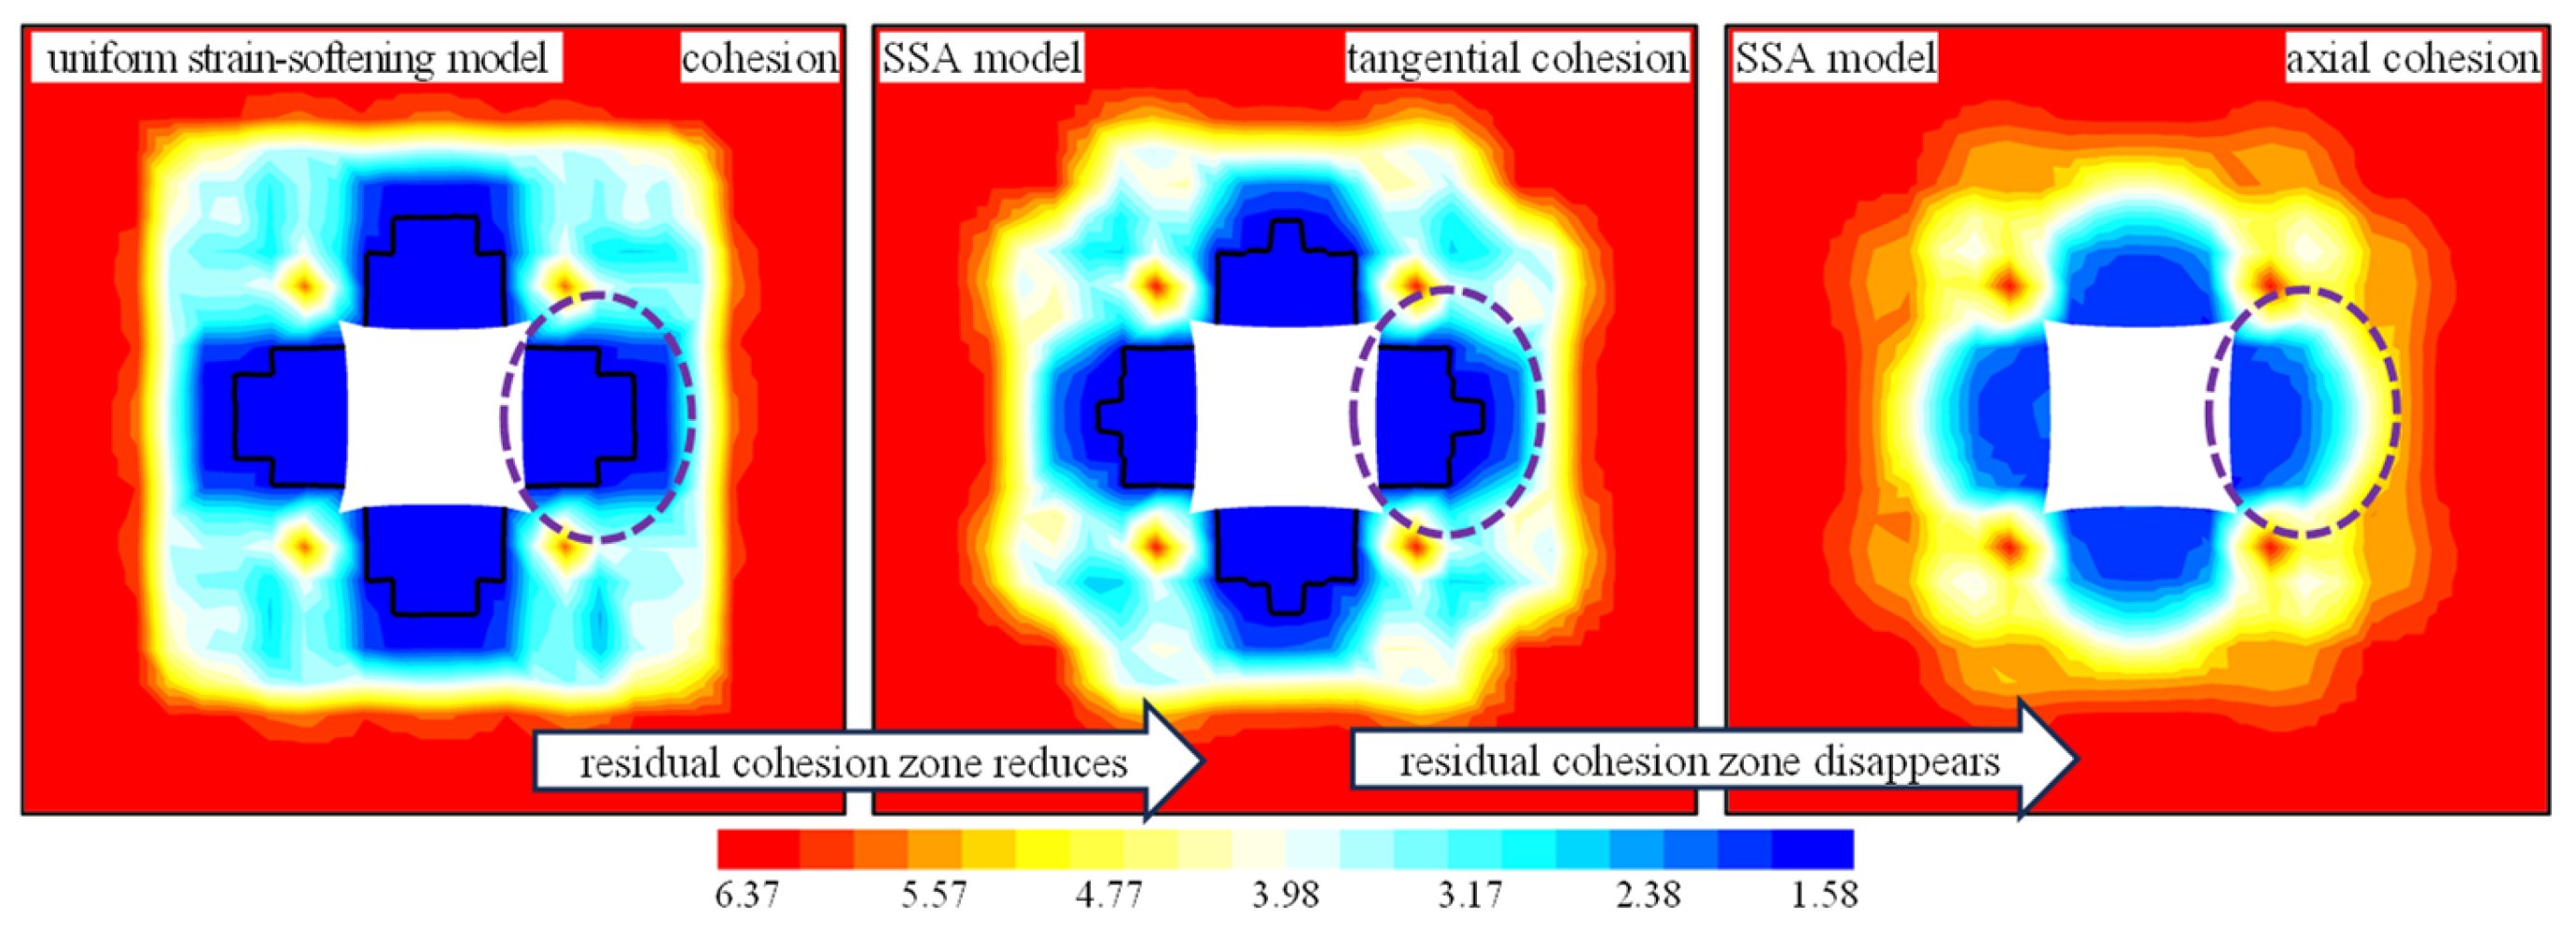
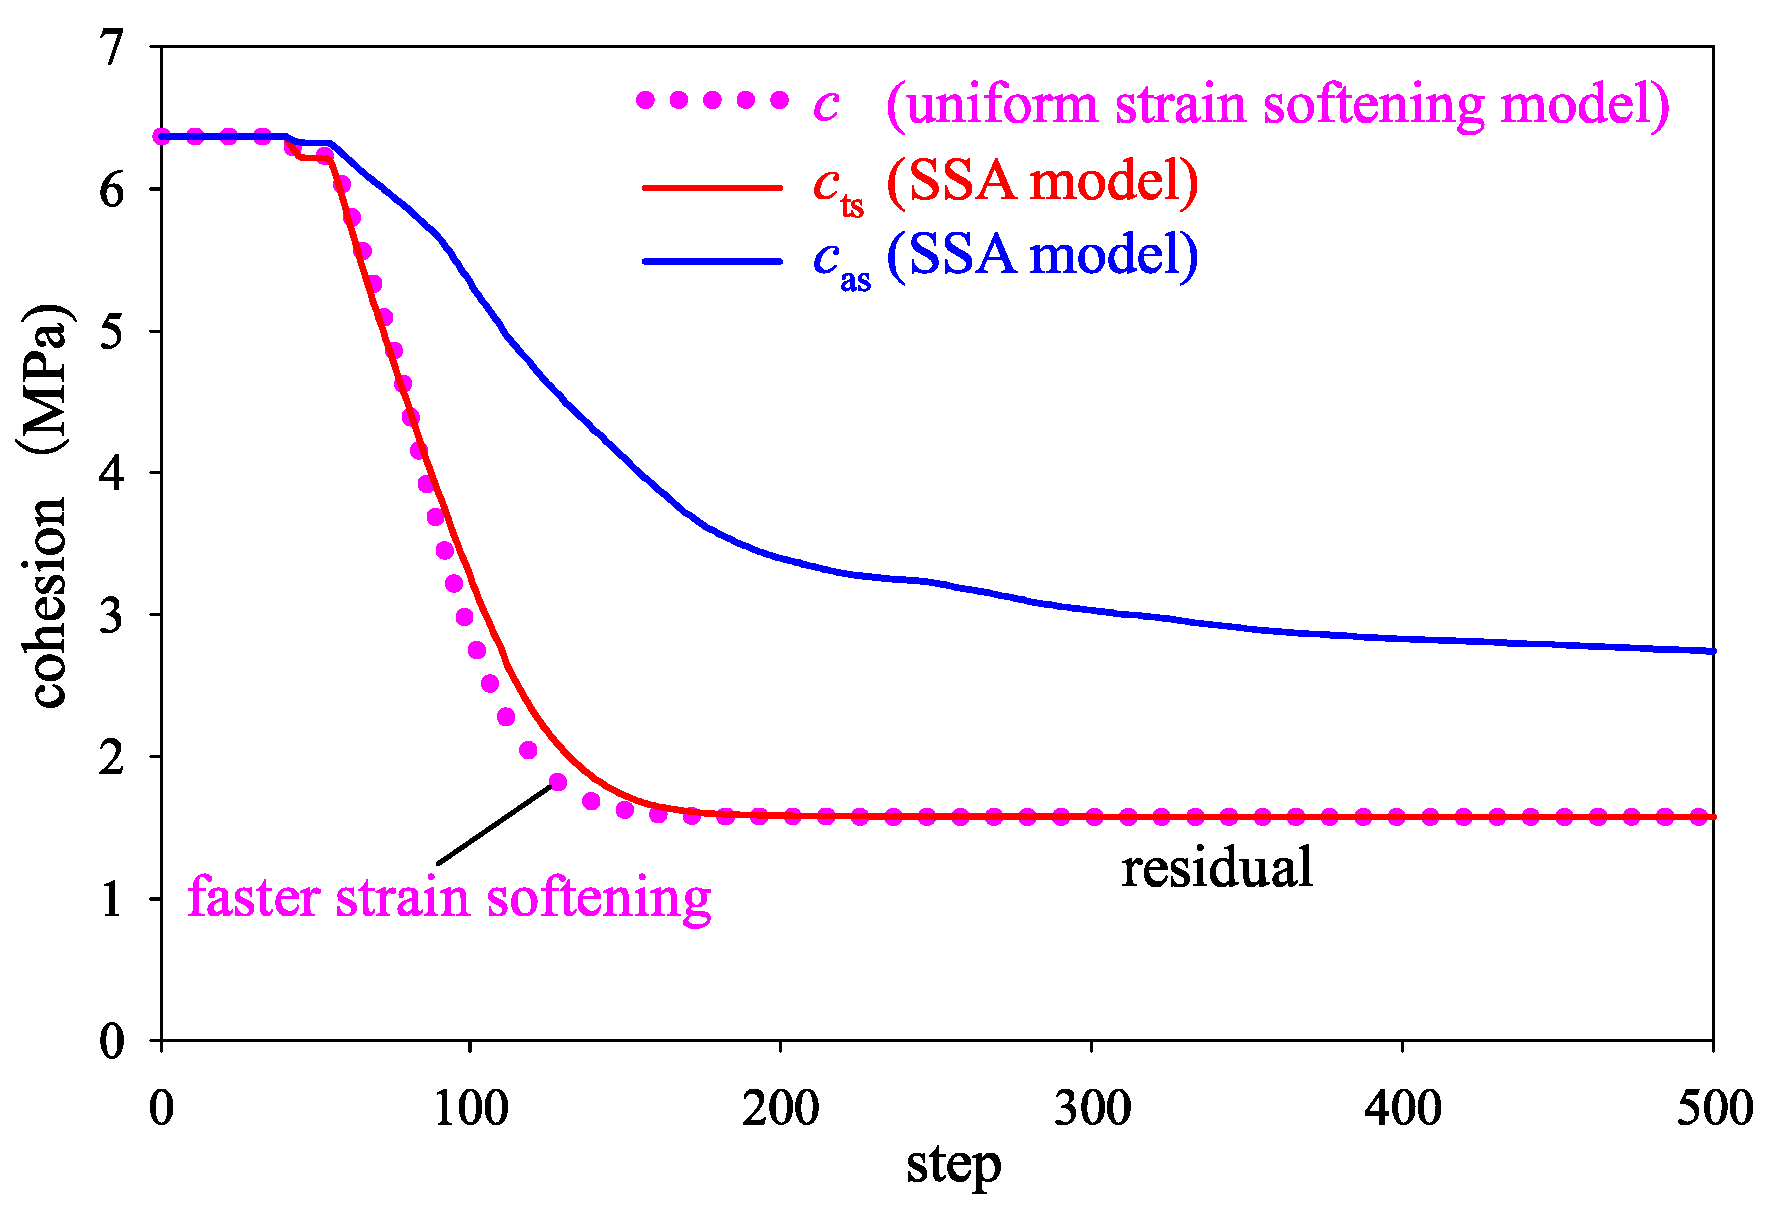
After equilibrium was reached, the displacement, plastic zone, strain energy, and cohesion of the surrounding rock calculated by the two models are shown in Figure 16, Figure 17, Figure 18, and Figure 19, respectively, and the monitoring data (the location of the monitoring point is shown in Figure 15) of the cohesions and stresses at the measuring point are shown in Figure 20 and Figure 21, respectively (only the first 500 steps during which the cohesions and stresses vary significantly are shown).
According to Figure 16, the displacements of the four excavation boundaries of the tunnel were approximately equal; therefore, the surface displacement of the right rib is considered an example for the analysis. The surface displacements of the right rib calculated by the uniform strain-softening and SSA models were 196 and 163 mm, respectively, which indicated that the surface displacement was overestimated by 20.2% when the secondary anisotropy was ignored.
As depicted in Figure 17, taking the secondary anisotropy into account (SSA model) resulted in a reduction in the plastic zone of the surrounding rock. This phenomenon can be attributed to the fact that the surrounding rock exhibits a higher axial strength when the secondary anisotropy is considered.
Energy is the driving force for the failure of rock materials, and the deformation and failure of the surrounding rock of the tunnel are the result of energy accumulation and dissipation [12,44,45]. As presented in Figure 18, the distributions of elastic strain energy density in the surrounding rock of the two models were similar (only the region of concentrated elastic volumetric strain energy became asymmetric), and the total elastic strain energies in the two models were also comparable. However, considering the secondary anisotropy, the dissipation region of plastic strain energy shrank, and the dissipation amount decreased as well. Specifically, the total plastic strain energy dissipated in the entire model decreased from 11.83 to 10.36 MJ, registering a reduction of 12.4%. Among this reduction, the dissipated plastic deviatoric strain energy was the main contributor, decreasing from 13.27 to 11.68 MJ, a reduction of 12.0%. Plastic deviatoric strain energy is generated during the plastic flow process of the surrounding rock. This indicates that the secondary anisotropy suppresses the plastic flow process, reduces the dissipated plastic deviatoric strain energy, and further decreases the deformation and the plastic zone of the surrounding rock [12,44,45].
According to Figure 19 and Figure 20, both the cohesion c calculated by the uniform strain-softening model and the tangential cohesion cts calculated by the SSA model exhibited residual areas in the shallow part of the surrounding rock; however, the uniform strain-softening process was faster, and the corresponding residual areas were larger. There was no residual area of axial cohesion cas calculated by the SSA model, and the areas in which strain-softening occurs (non-red areas) were smaller. This indicates that the failure mode of the surrounding rock is mainly tangential failure, and the strain-softening is slighter when the secondary anisotropy is considered, especially the axial strain-softening.
As shown in Figure 21, when the surrounding rock was tangentially loaded due to tunnel excavation, σt was higher than σa at the initial yield (tangential failure). During the tangential strain-softening of the surrounding rock, the tangential yield surface shrank, causing the curve of σt to rapidly drop and intersect with the curve of σa. At this point, for the uniform strain-softening model, the tangential and axial strengths of the surrounding rock are always equal, which caused the tangential and axial failures to occur alternately in the calculation process, and σt and σa to be approximately equal. For the SSA model, the tangential strain-softening is more severe during tangential failure, and as a result, tangential failure continued, but the axial failure did not begin until the axial strength decreased to a certain value, which caused σt to be lower than σa.

5. Discussion

In this study, a novel secondary anisotropy of the surrounding rock of deep tunnels and its mechanism were proposed and verified. A constitutive model (SSA model) that can accurately describe the secondary anisotropy was established, and the effects of the secondary anisotropy on the deformation and failure of the surrounding rock were analysed based on the SSA model.
Distinct from the secondary anisotropy of rocks induced by stress as previously described by Li and Hu [26], the secondary anisotropy herein pertains to the surrounding rock of tunnels. It is caused by the axial displacement constraint, manifesting as the axial strain-softening process lagging behind that of the tangential direction. This represents a novel mechanical property. In comparison with a traditional uniform strain-softening model [31], the SSA model accounts for the secondary anisotropy, resulting in a smaller displacement, plastic zone, and dissipated plastic strain energy in the surrounding rock. Moreover, the degree of deterioration of the surrounding rock was mitigated.
Due to the complex and variable in situ stress and rock mass strength, there are often significant discrepancies between the input parameters of a numerical simulation and actual conditions. Therefore, it is difficult to directly verify the numerical simulation results through field monitoring data. The secondary anisotropy was only indirectly verified by the cracks in the surrounding rock, as shown in the field borehole TV image (Figure 8). In addition, to highlight the secondary anisotropy, this study adopted a loading method parallel to the stratification planes to exclude the effects of the inherent anisotropy [28]. Nevertheless, the inherent anisotropy will inevitably impact the manifestation of the secondary anisotropy of the surrounding rock.
In future investigations, the in situ testing techniques for the surrounding rock will be refined, aimed at measuring the relationship between the axial and tangential strengths of the surrounding rock in the field, thereby directly validating the secondary anisotropy. Moreover, indices for quantitatively characterising the inherent anisotropy of rock masses will be proposed, and hybrid stress–strain controlled true triaxial tests will be conducted on rock specimens with varying degrees of inherent anisotropy. This will enable an in-depth analysis of the impact of the inherent anisotropy on the manifestation of the secondary anisotropy.

6. Conclusions

(1) Mechanism of the secondary anisotropy: The axial-displacement constraint of the surrounding rock forces cracks to initiate, propagate, and slip in planes parallel to the axial direction of the tunnel. These cracks significantly reduce the tangential strength and slightly reduce the axial strength. As a result, the tangential strain-softening is more severe, which induces the secondary anisotropy.
(2) Effects of the secondary anisotropy: Considering the secondary anisotropy, the axial strength of the surrounding rock of a deep tunnel decreases more slowly than the tangential strength, resulting in delayed axial failure, and causing the axial stress to be higher than the tangential stress. Neglecting the secondary anisotropy will lead to an overestimation of the deformation, plastic zone, and dissipated plastic deviatoric strain energy of the tunnel surrounding rock.
(3) Significance of the secondary anisotropy: Numerical simulation is an essential method for deformation prediction and support design of tunnels, and the secondary anisotropy is an objectively existing mechanical property of the surrounding rock. The proposed SSA model can precisely characterise the secondary anisotropy, improving the accuracy of the numerical simulation, particularly at greater depths.

Author Contributions

Conceptualization, K.Y. and P.G.; Funding acquisition, K.Y. and Z.L.; Investigation, K.Y. and C.S.; Methodology, K.Y. and Z.L.; Software, K.Y. and K.D.; Supervision, P.G.; Validation, Z.L.; Visualisation, C.S. and K.D.; Writing—original draft, K.Y.; Writing—review and editing, P.G. All authors have read and agreed to the published version of the manuscript.

Funding

This research was funded by the National Natural Science Foundation of China (grant no. 52404094, 52404085) and the Fundamental Research Program of Shanxi Province (grant no. 202203021222088).

Data Availability Statement

The original contributions presented in this study are included in the article. Further inquiries can be directed to the corresponding author.

Conflicts of Interest

Author Zhiguo Lu was employed by China Coal Technology and Engineering Group. The remaining authors declare that the research was conducted in the absence of any commercial or financial relationships that could be construed as a potential conflict of interest.

Abbreviations

CT 3DComputed tomography three-dimensional
TVTelevision
SSAStrain-softening and secondary anisotropy
FLAC3DFast Lagrangian Analysis of Continua in 3 Dimensions

References

  1. Kang, H.P.; Gao, F.Q.; Xu, G.; Ren, H.W. Mechanical behaviors of coal measures and ground control technologies for China’s deep coal mines—A review. J. Rock Mech. Geotech. 2023, 15, 37–65. [Google Scholar] [CrossRef]
  2. Xie, S.R.; Li, H.; Chen, D.D.; Feng, S.H.; Yang, J.H.; Ma, X.; Jiang, Z.S.; Xing, S.K. Research on the Control Technology and Key Parameters of External Anchor-Internal Unloading of Surrounding Rock During Gob-Side Entry Driving Under Severe Mining of 1000-m-Deep Mine. Rock Mech. Rock Eng. 2024, 57, 2913–2932. [Google Scholar] [CrossRef]
  3. Zhou, J.L.; Pan, J.F.; Xia, Y.X.; Du, T.T.; Liu, W.A.; Zhang, C.Y. Mechanism and prevention of coal bursts in gob-side roadway floor under thick and hard roof in the deep mining area of Ordos. Int. J. Coal Sci. Technol. 2024, 11, 80. [Google Scholar] [CrossRef]
  4. Jain, H.; Kumar, J. Displacements and stresses around a circular tunnel in an elastic medium with pseudo-static horizontal earthquake body forces. Comput. Geotech. 2023, 162, 105663. [Google Scholar] [CrossRef]
  5. Yin, S.F.; Zheng, X.J.; Wang, E.; Kang, Q.T.; Zhang, X.M. Non-uniform failure and differential pressure relief technology of roadway under irregular goafs in deep close-distance coal seams. Sci. Rep. 2023, 13, 18527. [Google Scholar] [CrossRef]
  6. Meng, N.K.; Bai, J.B.; Yoo, C. Failure mechanism and control technology of deep soft-rock roadways: Numerical simulation and field study. Undergr. Space 2023, 12, 1–17. [Google Scholar] [CrossRef]
  7. Ma, L.; Xing, L.; Liu, C.; Cui, T.; Qiao, X.; Miao, W.; Kong, P. Research on the Instability Mechanism and Control Technology of Gob-Side Entry in Deep Mines with Soft Rock. Buildings 2025, 15, 19. [Google Scholar] [CrossRef]
  8. Yang, S.Q.; Chen, M.; Jing, H.W.; Chen, K.F.; Meng, B. A case study on large deformation failure mechanism of deep soft rock roadway in Xin’An coal mine, China. Eng. Geol. 2017, 217, 89–101. [Google Scholar] [CrossRef]
  9. Hoek, E.; Brown, E.T. Practical estimates of rock mass strength. Int. J. Rock Mech. Min. Sci. 1997, 34, 1165–1186. [Google Scholar] [CrossRef]
  10. Pardoen, B.; Besuelle, P.; Dal Pont, S.; Cosenza, P.; Desrues, J. Accounting for Small-Scale Heterogeneity and Variability of Clay Rock in Homogenised Numerical Micromechanical Response and Microcracking. Rock Mech. Rock Eng. 2020, 53, 2727–2746. [Google Scholar] [CrossRef]
  11. Xie, S.R.; Wu, Y.Y.; Chen, D.D.; Liu, R.P.; Han, X.T.; Ye, Q.C. Failure analysis and control technology of intersections of large-scale variable cross-section roadways in deep soft rock. Int. J. Coal Sci. Technol. 2022, 9, 19. [Google Scholar] [CrossRef]
  12. Xin, X.K.; Meng, Q.B.; Pu, H.; Wu, J.Y. Theoretical analysis and numerical simulation analysis of energy distribution characteristics of surrounding rocks of roadways. Tunn. Undergr. Space Technol. 2024, 147, 105747. [Google Scholar] [CrossRef]
  13. Zheng, K.Y.; Shi, C.H.; Lou, Y.L.; Jia, C.J.; Lei, M.F.; Yang, Y. A computational method for tunnel energy evolution in strain-softening rock mass during excavation unloading based on triaxial stress paths. Comput. Geotech. 2024, 169, 106212. [Google Scholar] [CrossRef]
  14. Cao, D.; Fan, L.; Huang, R.; Guo, C. Investigation of the Mechanical Properties of Reinforced Calcareous Sand Using a Permeable Polyurethane Polymer Adhesive. Materials 2024, 17, 5277. [Google Scholar] [CrossRef]
  15. Lu, A.Z.; Xu, G.S.; Sun, F.; Sun, W.Q. Elasto-plastic analysis of a circular tunnel including the effect of the axial in situ stress. Int. J. Rock Mech. Min. Sci. 2010, 47, 50–59. [Google Scholar] [CrossRef]
  16. Guan, K.; Zhu, W.C.; Wei, J.; Liu, X.G.; Niu, L.L.; Wang, X.R. A finite strain numerical procedure for a circular tunnel in strain-softening rock mass with large deformation. Int. J. Rock Mech. Min. Sci. 2018, 112, 266–280. [Google Scholar] [CrossRef]
  17. Zou, J.F.; Liu, L.; Xia, M.Y. Simple approach for solution of the quasi-plane-strain problem in a circular tunnel in a strain-softening rock mass considering the out-of-plane stress effect. Undergr. Space 2020, 5, 339–353. [Google Scholar] [CrossRef]
  18. Zou, J.F.; Yang, T.; Ling, W.; Guo, W.J.; Huang, F.L. A numerical stepwise approach for cavity expansion problem in strain-softening rock or soil mass. Geomech. Eng. 2019, 18, 225–234. [Google Scholar] [CrossRef]
  19. Yi, K.; Liu, Z.H.; Lu, Z.G.; Zhang, J.W.; Dong, S.Y. Effect of Axial In-Situ Stress in Deep Tunnel Analysis Considering Strain Softening and Dilatancy. Energies 2020, 13, 1502. [Google Scholar] [CrossRef]
  20. Pourhosseini, O.; Shabanimashcool, M. Development of an elasto-plastic constitutive model for intact rocks. Int. J. Rock Mech. Min. Sci. 2014, 66, 1–12. [Google Scholar] [CrossRef]
  21. Wu, J.Y.; Li, J.; Faria, R. An energy release rate-based plastic-damage model for concrete. Int. J. Solids Struct. 2006, 43, 583–612. [Google Scholar] [CrossRef]
  22. Yazdani, S.; Schreyer, H.L. An anisotropic damage model with dilatation for concrete. Mech. Mater. 1988, 7, 231–244. [Google Scholar] [CrossRef]
  23. Jaeger, J.C. Shear Failure of Anistropic Rocks. Geol. Mag. 1960, 97, 65–72. [Google Scholar] [CrossRef]
  24. Renani, H.R.; Martin, C.D.; Cai, M. An analytical model for strength of jointed rock masses. Tunn. Undergr. Space Technol. 2019, 94, 103159. [Google Scholar] [CrossRef]
  25. Shen, J.Y.; Shu, Z.; Cai, M.; Du, S.G. A shear strength model for anisotropic blocky rock masses with persistent joints. Int. J. Rock Mech. Min. Sci. 2020, 134, 104430. [Google Scholar] [CrossRef]
  26. Li, W.Q.; Hu, H.S. Seismic Sources in Stress-Induced Anisotropic Media. J. Geophys. Res-Solid. Earth 2022, 127, e2021JB023915. [Google Scholar] [CrossRef]
  27. Li, X.B.; Du, K.; Li, D.Y. True Triaxial Strength and Failure Modes of Cubic Rock Specimens with Unloading the Minor Principal Stress. Rock Mech. Rock Eng. 2015, 48, 2185–2196. [Google Scholar] [CrossRef]
  28. Wang, L.; Zhu, Z.; Zhu, S.; Wu, J. A Case Study on Tunnel Excavation Stability of Columnar Jointed Rock Masses with Different Dip Angles in the Baihetan Diversion Tunnel. Symmetry 2023, 15, 1232. [Google Scholar] [CrossRef]
  29. Deng, P.H.; Liu, Q.S.; Lu, H.F. FDEM numerical study on the mechanical characteristics and failure behavior of heterogeneous rock based on the Weibull distribution of mechanical parameters. Comput. Geotech. 2023, 154, 105138. [Google Scholar] [CrossRef]
  30. Itasca Inc. FLAC3D: Fast Lagrangian Analysis of Continua in 3 Dimension, Version 5.01; Itasca Inc.: Minneapolis, MN, USA, 2012.
  31. Yi, K.; Kang, H.P.; Ju, W.J.; Liu, Y.D.; Lu, Z.G. Synergistic effect of strain softening and dilatancy in deep tunnel analysis. Tunn. Undergr. Space Technol. 2020, 97, 103280. [Google Scholar] [CrossRef]
  32. Li, P.F.; Wei, Y.J.; Zhang, M.J.; Huang, Q.F.; Wang, F. Influence of non-associated flow rule on passive face instability for shallow shield tunnels. Tunn. Undergr. Space Technol. 2022, 119, 104202. [Google Scholar] [CrossRef]
  33. Zhang, M.J.; Di, Q.G.; Li, P.F.; Wei, Y.J.; Wang, F. Influence of non-associated flow rule on face stability for tunnels in cohesive-frictional soils. Tunn. Undergr. Space Technol. 2022, 121, 104320. [Google Scholar] [CrossRef]
  34. Ban, L.R.; Du, W.S.; Jin, T.W.; Qi, C.Z.; Li, X.Z. A roughness parameter considering joint material properties and peak shear strength model for rock joints. Int. J. Min. Sci. Technol. 2021, 31, 413–420. [Google Scholar] [CrossRef]
  35. Chen, S.-L.; Hsu, K.-J.; Tang, C.-W.; Zhang, X.-L.; Lai, C.-H. Numerical Analysis of the Crown Displacements Caused by Tunnel Excavation with Rock Bolts. Symmetry 2022, 14, 1508. [Google Scholar] [CrossRef]
  36. Maina, D.; Konietzky, H. The effect of the intermediate principal stress on pillar strength. Int. J. Coal Sci. Technol. 2025, 12, 8. [Google Scholar] [CrossRef]
  37. Schwartzkopff, A.K.; Sainoki, A.; Bruning, T.; Karakus, M. A conceptual three-dimensional frictional model to predict the effect of the intermediate principal stress based on the Mohr-Coulomb and Hoek-Brown failure criteria. Int. J. Rock Mech. Min. Sci. 2023, 172, 105605. [Google Scholar] [CrossRef]
  38. Zhao, X.B.; Chen, H.; Lv, J.; He, X.H.; Qin, Y.W.; Sun, K.M. Triaxial Creep Damage Model for Salt Rock Based on Fractional Derivative. Sustainability 2023, 15, 10369. [Google Scholar] [CrossRef]
  39. Mahetaji, M.; Brahma, J.; Vij, R.K. A new extended Mohr-Coulomb criterion in the space of three-dimensional stresses on the in-situ rock. Geomech. Eng. 2023, 32, 49–68. [Google Scholar] [CrossRef]
  40. Zheng, Z.; Li, R.H.; Zhang, Q.; Huang, X.H.; Wang, W.; Huang, S.L. Mechanical parameter evolutions and deterioration constitutive model for ductile-brittle failure of surrounding rock in high-stress underground engineering. Undergr. Space 2024, 15, 131–152. [Google Scholar] [CrossRef]
  41. Yi, K.; Liu, Z.H.; Lu, Z.G.; Zhang, J.W.; Sun, Z.Y. Transfer and dissipation of strain energy in surrounding rock of deep roadway considering strain softening and dilatancy. Energy Sci. Eng. 2021, 9, 27–39. [Google Scholar] [CrossRef]
  42. Kang, H.; Yi, K. Simulation study on dilatant and rheologic properties of soft rocks surrounding deep roadway and its application. J. China Coal Soc. 2023, 48, 15–33. [Google Scholar] [CrossRef]
  43. Kang, H.; Yi, B.; Gao, F.; Lu, H. Database and characteristics of underground in-situ stress distribution in Chinese coal mines. J. China Coal Soc. 2019, 44, 23–33. [Google Scholar] [CrossRef]
  44. Lu, Z.; Ju, W.; Gao, F.; Du, T. Numerical analysis on the factors affecting post-peak characteristics of coal under uniaxial compression. Int. J. Coal Sci. Technol. 2024, 11, 2. [Google Scholar] [CrossRef]
  45. Lv, H.; Yang, X.; Yu, Y.; Liu, W. Research on Rock Energy Constitutive Model Based on Functional Principle. Symmetry 2024, 16, 1250. [Google Scholar] [CrossRef]
Figure 1. Development of a crack in a tunnel surrounding rock under axial-displacement constraint (the crack is forced parallel to the axial direction).
Symmetry 17 01234 g001
Figure 2. Axial-displacement constraint induced secondary anisotropy of the surrounding rock.
Symmetry 17 01234 g002
Figure 3. True triaxial testing machine and sandstone specimen: (a) testing machine, (b) loading cell, (c) sandstone specimen.
Symmetry 17 01234 g003
Figure 4. True triaxial testing machine and sandstone specimen.
Symmetry 17 01234 g004
Figure 5. Loading data of the sandstone specimens ((1)–(4) signify the loading steps described in Section 2.1.2): (a) s-1, (b) s-2, (c) s-3, (d) s-4, and (e) s-5.
Symmetry 17 01234 g005
Figure 6. CT 3D reconstruction of cracks in sandstone specimen s-5 (The letters a–f denote distinct components of the reconstructed entity. The main cracks are approximately parallel to the axial direction).
Symmetry 17 01234 g006
Figure 7. Shear bands of heterogeneous rock model (zones with plastic shear strain > 0.01; the axial-displacement constraint forces the shear bands approximately parallel to the axial direction): (a) scheme (a), (b) scheme (b), (c) scheme (c).
Symmetry 17 01234 g007
Figure 8. Typical roof borehole TV image (390 m from the heading of No. 020202 headgate in Xiangning Shennanwa coal mine, China; the cracks are approximately parallel to the axial direction).
Symmetry 17 01234 g008
Figure 9. Calculation process of the SSA model.
Symmetry 17 01234 g009
Figure 11. A single-grid numerical model and its boundary conditions for the SSA model verification; (a) tangential loading and (b) axial loading.
Symmetry 17 01234 g011
Figure 12. Verification results of the relationship between the axial softening parameter γ as p and tangential softening parameter γ ts p .
Symmetry 17 01234 g012
Figure 13. Verification results of the cohesions: (a) tangential cohesion, (b) axial cohesion.
Symmetry 17 01234 g013
Figure 14. Verification results of the secondary anisotropy (the uniform strain-softening model [31] versus the SSA model).
Symmetry 17 01234 g014
Figure 15. Numerical model.
Symmetry 17 01234 g015
Figure 16. Displacement of the surrounding rock (mm, the uniform strain-softening model [31] versus the SSA model).
Symmetry 17 01234 g016
Figure 17. Plastic zone of the surrounding rock (the uniform strain-softening model [31] versus the SSA model, red represents plastic zone, and the black dashed line demarcates the area with substantial differences).
Symmetry 17 01234 g017
Figure 18. Strain energy of the surrounding rock (the uniform strain-softening model [31] versus the SSA model).
Symmetry 17 01234 g018
Figure 19. Cohesions of the surrounding rock (MPa, the uniform strain-softening model [31] versus the SSA model, black curves are the contours of residual values, and the violet dashed line demarcates the area with substantial differences).
Symmetry 17 01234 g019
Figure 20. Variations in the cohesions at the monitoring point (the uniform strain-softening model [31] versus the SSA model).
Symmetry 17 01234 g020
Figure 21. Variations in the stresses at the monitoring point (the uniform strain-softening model [31] versus the SSA model).
Symmetry 17 01234 g021
Table 1. Basic mechanical parameters of the sandstone specimens.
Young’s
Modulus
/GPa
Poisson’s
Ratio
UCS
/MPa
Tensile
Strength
/MPa
Cohesion
/MPa
Friction
Angle
/(°)
Density
/g·cm−3
4.310.2239.712.329.62412.37
Table 2. Stresses in the three orthogonal directions of the sandstone specimens at different times (MPa).
Specimen
No.
Reach Peak Stress in
Z Direction (Tangential)
Stop Loading in
Z Direction (Tangential)
Reach Peak Stress in
Y Direction (Axial)
σasσts
XYZXYZ (σts)XY (σas)Z
s-18.00124.143102.2458.00223.49590.3027.99998.67123.4978.369
s-28.00031.440105.3118.00025.20574.5838.00188.55825.20513.975
s-37.99930.588110.6047.99825.58275.8018.00091.89725.58016.096
s-48.00136.092106.0128.00027.51367.9727.99880.62127.51112.649
s-57.99834.590110.060did not undergo these loading steps
Table 3. Cohesions and softening parameters of the sandstone specimens at different times.
Specimen
No.
Reach Peak Stress in
Z Direction (Tangential)
Stop Loading in
Z Direction (Tangential)
Reach Peak Stress in
Y Direction (Axial)
c0/MPa γ 0 p cts/MPa γ ts p /10−3cas/MPa γ as p /10−3
s-19.91907.4599.919.2892.88
s-29.02803.76625.526.71310.21
s-310.31703.95327.877.35111.39
s-48.36002.08160.054.61018.21
Disclaimer/Publisher’s Note: The statements, opinions and data contained in all publications are solely those of the individual author(s) and contributor(s) and not of MDPI and/or the editor(s). MDPI and/or the editor(s) disclaim responsibility for any injury to people or property resulting from any ideas, methods, instructions or products referred to in the content.