1. Introduction
In agricultural production, plant diseases have always been one of the significant factors severely affecting crop growth and yield. When crops are attacked by diseases, it not only leads to a decrease in yield but may also result in the loss of entire fields. With the increasing pressures of global climate change, expanding international trade activities, and population growth, the demand for crop yield and quality becomes increasingly urgent. Therefore, timely and accurate identification and management of plant diseases are crucial for maintaining agricultural stability and food security. Traditionally, the detection and identification of plant diseases have mainly relied on manual observation and experiential judgment. This method has numerous limitations, such as requiring a significant amount of time and labor and difficulty in accurately identifying diseases in the early stages [
1].
Recent advances in deep learning have significantly improved plant disease classification. However, accurate identification remains challenging due to visually similar disease symptoms, diverse scales of lesion patterns, and complex background noise. Misclassifications can lead to incorrect treatments, increased agricultural costs, and reduced crop yields. Some classic convolutional neural network (CNN) models have been directly applied to plant leaf classification. Hassan et al. [
2] proposed an energy-efficient convolutional neural network architecture that integrates the Inception and residual structures. This network surpasses other classic convolutional neural networks in terms of classification accuracy and operational efficiency. The idea of ensemble learning can fully utilize the advantages of different feature extractors. By employing multiple feature extractors to extract features from plant leaves and merging the features extracted by different feature extractors in an appropriate manner, the fused features exhibit stronger semantic information representation capabilities. Transformers [
3] are capable of capturing long-range dependencies through self-attention mechanisms and have been widely applied in natural language processing. Several studies [
4,
5,
6] have followed the transformer encoder approach for computer vision tasks, achieving performance comparable to or exceeding that of convolutional neural networks. Zeng et al. [
7] proposed a model called DIC-Transformer, which leverages transformer to generate image captions and then produces feature vectors for classification. While CNNs are more suited for extracting local features from images, transformer models excel at capturing global features. The combination of CNNs and transformer models offers a promising approach to enhance the performance of plant disease classification models. However, most existing CNN-based methods primarily focus on local patterns and often struggle to capture the long-range dependencies or global structure inherent in complex plant disease symptoms. Meanwhile, although transformer-based models offer strong global modeling capabilities, they are limited in accurately recognizing fine-grained local variations that are crucial for distinguishing visually similar disease types. If the unique challenges of plant disease images (such as high inter-species similarity and diverse symptom scales) are not taken into account, simply combining the two may not yield optimal results in some studies.
To address the above limitations, we propose the Plant Transformer (PLTransformer) for plant disease classification. The core of PLTransformer consists of a symmetric multi-scale convolution module. This design is motivated by the observation that plant disease images often contain both minute local cues and broader regional patterns, which must be simultaneously captured to enable robust classification. Unlike natural images, plant disease images exhibit high similarity between them, requiring the model to effectively extract both fine-grained and coarse-grained features. Based on this fundamental observation, the symmetric multi-scale convolution module combines the local feature extraction capabilities of convolutional layers with the long-range modeling power of transformers. Additionally, we design the overlap-attentive channel downsampler, which captures the correlations between local channels during the patch merging process. This module enhances the channel-wise contextual understanding during downsampling, further improving discriminability. Together, these components form an efficient and compact model that explicitly addresses the challenges of multi-scale plant disease classification, outperforming conventional CNNs and ViT variants in accuracy.
We propose the Plant Transformer for plant disease image classification, with its core consisting of a symmetric multi-scale convolution module designed to effectively extract both fine-grained and coarse-grained features.
We introduce the overlap-attentive channel downsampler, which captures interdependencies among local channels of feature maps during downsampling, enhancing the model’s ability to extract semantic information in feature representations.
By comparing our method with other state-of-the-art approaches, we validate the effectiveness of our proposed method.
The remaining sections of this paper are organized as follows.
Section 2 provides a brief overview of the related work.
Section 3 offers a detailed explanation of the proposed method.
Section 4 discusses the experimental results and
Section 5 discusses this work, while
Section 6 concludes this work.
2. Related Work
2.1. Convolutional Neural Networks and Attention-Based Methods
Convolutional neural networks can automatically learn features such as textures in images, making them widely applicable in image classification tasks. Many researchers have successfully applied CNN technology in the field of plant disease classification, achieving satisfactory results. Li et al. [
8] compared the performance of deep CNNs in plant disease classification with combinations of shallow CNNs and classical machine learning classifiers. The results showed that the combination of shallow CNNs and machine learning classifiers exhibited excellent performance. However, such hybrid strategies often require handcrafted feature extraction or additional preprocessing steps, limiting their scalability and end-to-end training capabilities compared to deep learning models. Moreover, these methods might struggle to capture high-level semantic features needed for complex plant disease patterns. Kamal et al. [
9] conducted a study on the feasibility of applying depthwise separable convolution in the field of plant disease classification. While this improves efficiency, the capacity of depthwise convolutions to model global contextual dependencies remains limited, often resulting in decreased accuracy on visually similar disease categories. An attention mechanism allows for neural network models to focus more on important regions within an image. Zhao et al. [
10] improved the convolutional attention module in their proposed RIC-Net, which is an attention mechanism that aggregates spatial and channel attention. This approach achieves higher efficiency in terms of fewer parameters, faster training, and higher recognition accuracy. Nonetheless, their attention design remains tightly coupled with traditional CNN blocks, lacking modularity for extension to more diverse network backbones. Lee et al. [
11] incorporated spatial attention into recurrent neural networks, enhancing the model’s learning capability and improving learning quality, thereby overcoming noise interference issues in images. While effective in denoising, RNN-based models tend to be slower in inference and less parallelizable compared to convolutional or transformer-based counterparts. Wang et al. [
12] proposed a novel attention mechanism that simultaneously utilizes image information and position-plane information. This approach outperformed commonly used generic attention models in plant disease classification models. Although their model achieves strong performance, it introduces additional overhead through complex positional encoding and alignment processes, which may limit its practical efficiency.
2.2. Transformer-Based Methods
The transformer architecture introduced in the field of natural language processing has opened up new horizons for image processing. Yu et al. [
13] proposed a novel transformer architecture, Mix-ViT, which significantly improves classification performance by combining ultra-fine-grained visual classification with a visual transformer. While their approach significantly enhances classification accuracy, it requires intensive computation due to the high-resolution input and dense self-attention operations, making it less suitable. Patil et al. [
14] developed a novel transformer model that employs a cross-attention mechanism for rice disease classification. The model excels at focusing on disease-specific regions by attending across feature maps, but it introduces substantial architectural complexity and lacks a mechanism to exploit local spatial patterns, which are often critical for distinguishing early-stage symptoms. Zheng et al. [
15] proposed a model called SwinMLP, which uses a swin transformer as its backbone architecture and combined it with a multi-layer perceptron (MLP) for strawberry appearance quality recognition. While this combination benefits from hierarchical window-based attention, the use of pure transformer backbones still results in higher memory requirements and training instability compared to CNN-based architectures, especially when training data is limited. Bi et al. [
16] proposed an improved swin transformer model that focuses on multi-scale features to accurately identify different corn seed varieties, which may limit its generalizability to broader plant disease classification scenarios involving more diverse visual patterns and symptom variations. Guo et al. [
17] developed a novel architecture—Convolutional Sliding Window Transformer (CST)—for identifying the severity and type of diseases in different crops. Li et al. [
18] proposed a lightweight hybrid model, SLViT, which combines convolutional layers and a visual transformer for plant disease classification. Li et al. [
19] introduced a novel architecture, ConViT, based on a visual transformer. This network combines a local feature recognition module with convolutional operations, enabling it to capture both local and global features, thereby achieving efficient classification of leaf diseases. Despite these innovations in spatial feature refinement, the models rely heavily on carefully tuned window sizes and positional configurations, which may reduce generalization across different plant species or image resolutions.
Table 1 summarizes the methods used for plant disease classification in related studies. Overall, CNN-based methods excel at capturing low-level features such as local textures and edges in images, making them suitable for scenarios where plant disease images exhibit distinct localized lesions. The introduction of attention mechanisms (e.g., spatial attention and channel attention) enables the model to focus on more critical regions within the image, thereby enhancing its robustness and discriminative capability. However, CNNs inherently prioritize the extraction of local features, making it challenging to capture long-range dependencies or global semantic relationships within images. Transformer-based methods can directly model long-range relationships between regions in images through self-attention mechanisms, but they lack the ability to model local regions effectively. Hybrid models enhance the discriminatory ability and generalization performance of the model by achieving synergistic integration of local and global information. PLTransformer is a hybrid architecture that integrates convolutional neural networks with transformers through a multi-branch fusion design. The multi-scale residual convolutional block is dedicated to capturing local features at different spatial resolutions, while the multi-scale dilated convolutional attention block facilitates the integration of diverse global semantic information. This architectural synergy enhances the model’s capability to capture complex semantic relationships in challenging visual scenes.
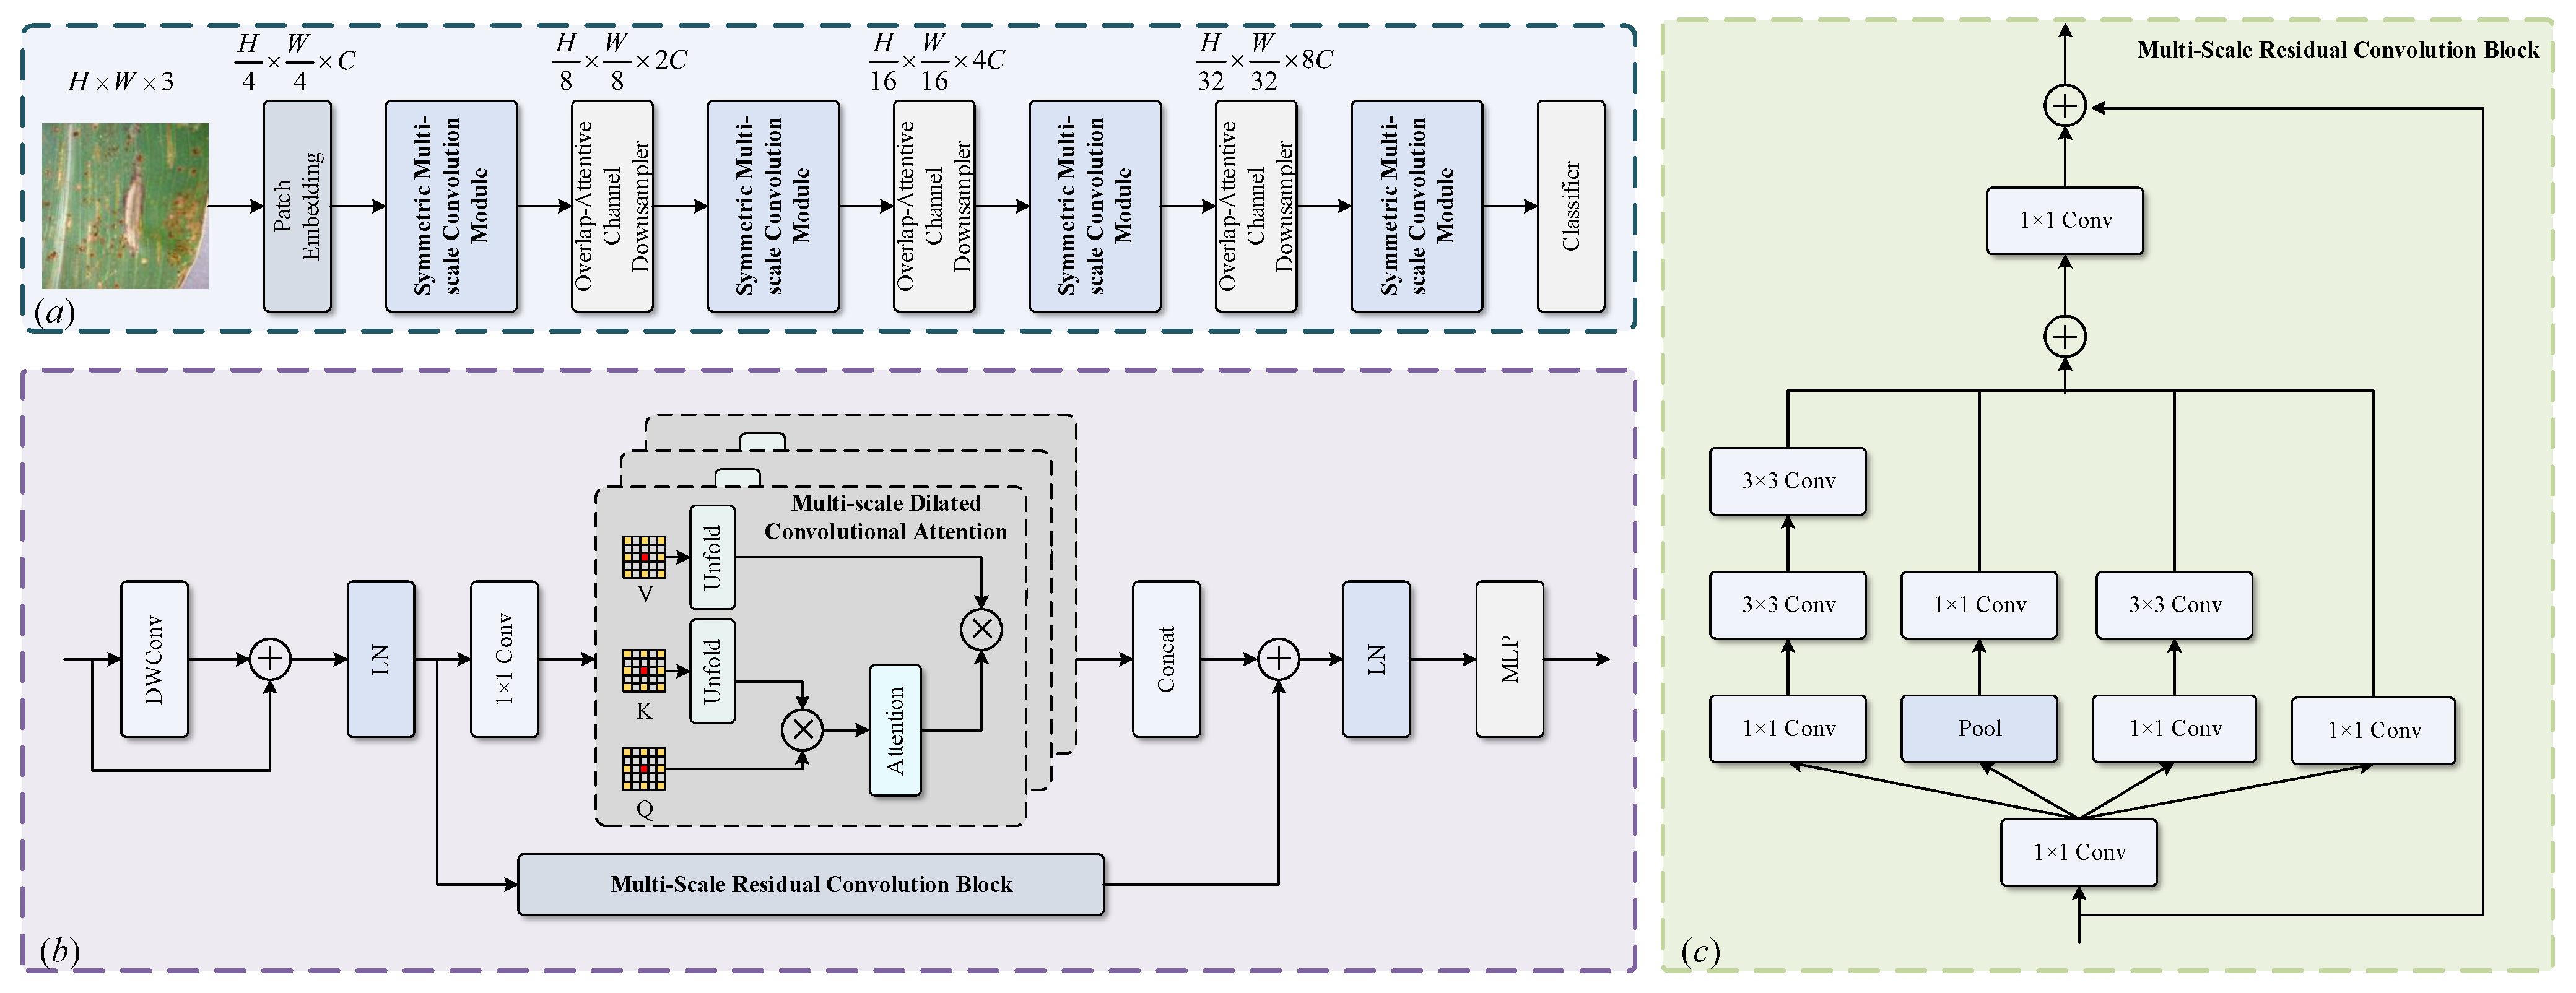
3. Method
In this section, we detail the three components of our approach: the network architecture, the symmetric multi-scale convolution module, and the overlap-attentive channel downsampler. To address the challenge of scale variation in disease spots, we introduce a symmetric multi-scale convolution block. By employing parallel branches with different receptive fields, the symmetric multi-scale convolution module captures disease features across multiple spatial resolutions, ensuring robust representation of both subtle and prominent lesions. Plant leaves often exhibit complex textures and overlapping visual patterns that make downsampling difficult without losing discriminative details. To mitigate this, we design an overlap-attentive channel downsampler to perform channel-wise attentive downsampling while preserving overlapping semantic cues. This enhances the feature quality passed to deeper layers, particularly under conditions of occlusion or background clutter.
3.1. Network Architecture
The overall architecture of our PLTransformer is illustrated in
Figure 1. PLTransformer primarily uses symmetric multi-scale convolution operations to enable the network to extract discriminative features from plant disease images with different spatial resolutions, effectively capturing both coarse and fine lesion patterns. At the same time, PLTransformer employs a four-stage architecture and symmetric stacked structure to ensure balanced feature learning and promote structural consistency across different levels, which is particularly advantageous for modeling the diverse and spatially variable visual features of plant diseases. The input image is divided into
patches, with each block treated as a token. The original pixels of each patch are linearly projected to a dimension
C by the patch embedding module.
The proposed symmetric multi-scale convolutional modules are stacked to form a network consisting of four stages with feature dimensions of C, , , and . Before the last three stages, the feature maps are downsampled using an overlapping attentive channel downsampler, and the number of channels is doubled through linear projection. This pyramidal architecture efficiently utilizes computational resources while preserving crucial information in the image. By downsampling the feature map and progressively increasing the number of channels, the network can learn features at different scales across different stages.
3.2. Symmetric Multi-Scale Convolution Module
The core idea of the symmetric multi-scale convolution module is to enable the model to capture local features at various scales by applying convolutional operations at multiple levels of superposition. By using convolution kernels of different sizes, the model can focus on distinct ranges of local information, making it more flexible in extracting key local patterns. This capability to extract information at different scales allows the model to be more comprehensive in handling a diverse range of local features. The symmetric multi-scale convolution module consists of two key blocks: the multi-scale residual convolution block and the multi-scale dilated convolutional attention block.
Multi-scale residual convolution block: Figure 1c illustrates the structure of the multi-scale residual convolution block (MRC). MRC constructs parallel multi-scale convolutions for multi-scale local feature extraction by integrating convolution operations and residual connections. After the feature map is input into the block, a 1 × 1 convolution is applied to double the number of channels. Next, three different convolution kernel sizes and pooling layers are used to extract the multi-scale semantic information. Following this, the multi-scale fused semantic information is obtained through overlaying. Simultaneously, the input feature map is mapped identically to the output stage of the convolution and combined with the multi-scale fused information to form a residual structure. The convolution kernel sizes include 1 × 1, 3 × 3, and 5 × 5. To reduce the computational complexity, two concatenated 3 × 3 convolution kernels are used in place of the 5 × 5 convolution kernel. A 1 × 1 convolution is then applied to restore the number of channels in the fused multi-scale semantic information to its original state, which is subsequently combined with the input of the block to produce the output. The 1 × 1 convolution to increase the number of channels introduces non-linearity into the process, thereby enhancing the model-fitting capability.
where
is the global average pooling,
is the activation function, and
is the
convolution.
Multi-scale dilated convolutional attention block: The multi-scale dilated convolutional attention block (MDCA) block uses dilated attention to focus on distant locations through sparse sampling, achieving greater context awareness. In the context of plant disease classification, lesion regions often exhibit diverse spatial scales and complex patterns. MDCA primarily consists of dilated convolutions and multi-head attention mechanisms. Dilated convolutions help expand the receptive field to capture large-scale disease areas and long-range dependencies without sacrificing resolution. Meanwhile, multi-head attention enables the model to simultaneously focus on different lesion characteristics, such as the shape, texture, and boundary, across various spatial locations. Together, these mechanisms are well suited for modeling the heterogeneous and context-dependent visual features of plant diseases. The MDCA block models localized and sparse image block interactions within a sliding window. The computation of multi-scale dilated attention is similar to multi-head self-attention, with the key difference being that MDCA applies varying dilation rates to different heads to obtain multi-scale dilated attention. This block enhances the computational complexity without increasing the receptive field of the neural network model. The mathematical expressions for multi-scale dilated convolutional attention are shown in Equations (
4) and (
5).
where
represents the i th head, n indicates the feature map is divided into n heads,
represents the query matrix of the
i th head,
represents the key matrix of the
i th head,
represents the value matrix of the
i th head, and
indicates the dilation rate of the
i th head. Dilated attention calculates attention separately for each head and then aggregates these outputs into a linear layer.
Figure 1b illustrates the computation process of dilated attention.
The channels of the feature map are evenly distributed among different heads, with each head being assigned different dilation rates. Within each head, only the self-attention between the central red patch and the surrounding yellow patches is computed. By employing different dilation rates, redundant computations of self-attention among all patches are cleverly avoided while enriching the model’s receptive field.
To accommodate inputs of different resolutions, the MDCA module incorporates Conditional Position Embedding (CPE). CPE is implemented through a depthwise separable convolution with a size of 3 × 3, which overlays the positional information captured by the convolution kernel onto the input feature map before outputting. The implementation of the CPE is shown in Equation (
6).
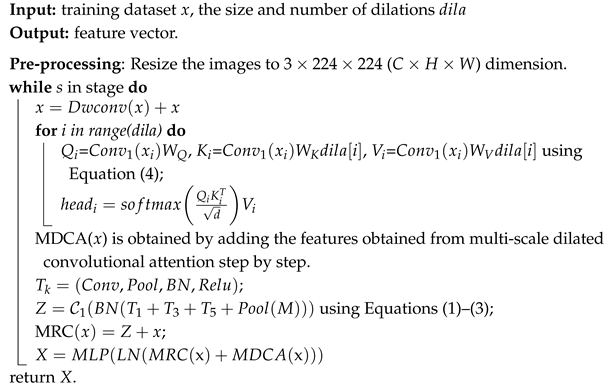
The output of the CPE undergoes standardization processing of the mean and variance through a layer normalization layer before being input into MDCA to learn the attention weights. The output feature map is then processed through a dropout layer and a fully connected layer before being used as the output of the MDCA module. This output is added to the output of the MRC module to serve as the output of the current stage. The process of the symmetric multiscale convolution module is shown in Algorithm 1.
| Algorithm 1: Framework of symmetric multi-scale convolution module. |
![Symmetry 17 01232 i001]() |
3.3. Overlap-Attentive Channel Downsampler
In the patch merging layer, an overlapping downsampler is used to perform patch merging operations on the feature map. The overlap-attentive channel downsampler employs overlapping convolution operations to create overlapping regions between feature blocks, thereby preserving more contextual details. The overlapping downsampler employs a convolution with a stride of 2 and a kernel size of 3 to process the output of the previous stage, which is then subjected to layer normalization to obtain the output of the overlapping downsampler. Patch merging doubles the number of channels in the feature map, resulting in a large number of channels that make it difficult for subsequent structures to capture inter-channel dependencies. In this paper, a channel attention mechanism is embedded in the overlapping downsampler to capture inter-channel dependencies. This is referred to as the overlap-attentive channel downsampler.
Figure 2 shows the schematic diagram of the overlap-attentive channel downsampler. Specifically, an adaptive overlapping downsampler first compresses the feature map of size W × H × C into 1 × 1 × C using global average pooling, where W, H, and C represent the width, height, and channels of the feature map, respectively. Then, a one-dimensional convolution is used to capture the inter-channel dependencies, resulting in a channel weight matrix. The input of the channel attention is multiplied by the channel weight matrix to obtain the output of adaptive overlapping downsampler. The size of the convolution kernel for the one-dimensional convolution is determined adaptively in this paper. A non-linear function is used to fit the mapping relationship between the global channel number and the local channel number. Its mathematical expression is shown in Equation (
7).
where they represent hyperparameters. According to Formula (
8), the local channel number k can be inversely calculated.
Here,
denotes rounding to the nearest odd number. A one-dimensional convolution with a kernel size of k and padding size of
is set up to obtain the weight relationships between different channels. The calculation formula for this step is shown in Equation (
9).
The weight matrix W here represents the weights learned by channel attention. Finally, the feature map weighted by channel attention is obtained by multiplying the input feature map by the weight matrix. Its mathematical expression is shown in Formula (
10).
4. Experimental Results and Discussion
4.1. General Setting
Datasets: PlantVillage [
20]: This is a large and readily available dataset, comprising 54,303 images of healthy and unhealthy leaves categorized into 38 groups based on species and disease. In this paper, experiments were conducted on three plant species, corn, potato, and tomato, with disease categories of 3, 2, and 8, respectively. According to ref. [
20], the dataset was divided into training, validation, and test sets in a ratio of 7:2:1.
Table 2 provides detailed information about the dataset.
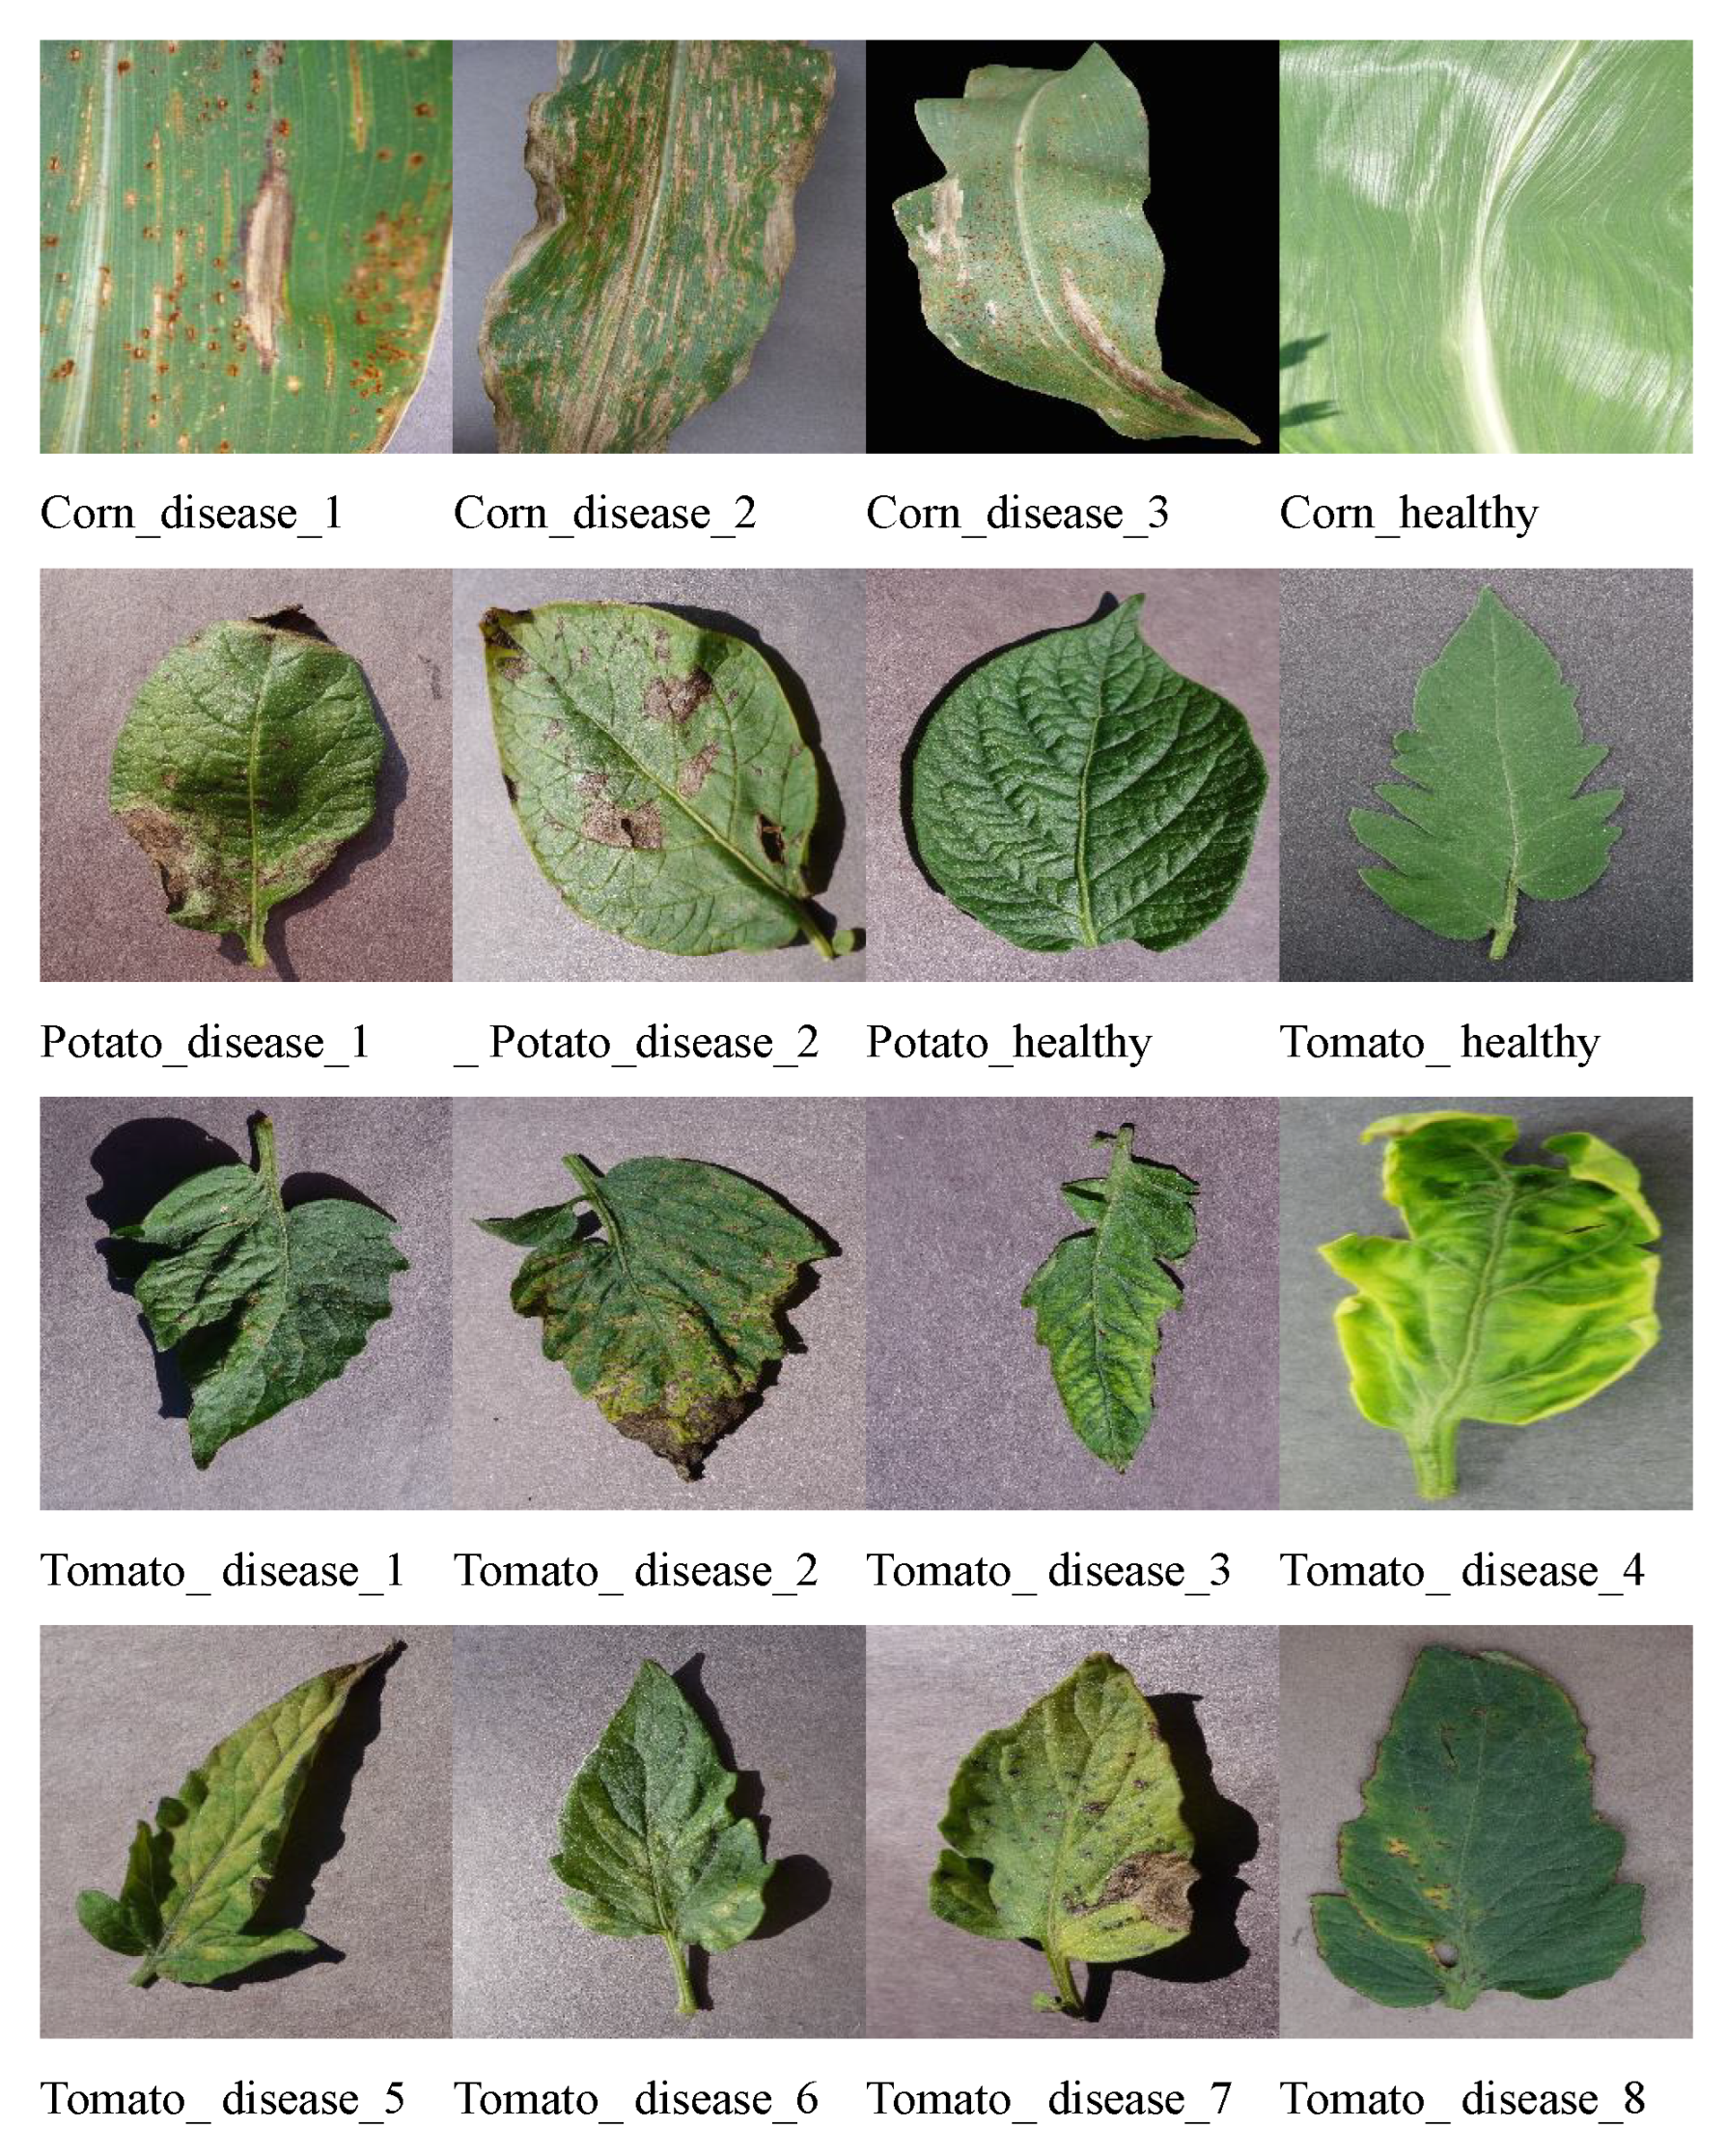
Figure 3 displays schematic diagrams of diseases across different categories.
Table 2.
The category information for PlantVillage.
Table 2.
The category information for PlantVillage.
| Plant | Diseases | Number of Train | Number of Validation | Number of Test |
|---|
| Potato | Early_blight | 1697 | 485 | 242 |
| Late_blight | 1697 | 485 | 242 |
| Healthy | 1596 | 456 | 228 |
| Corn | Cercospora_leaf_spot Gray_leaf_spot | 1437 | 410 | 205 |
| Common_rust | 1668 | 477 | 238 |
| Northern_Leaf_Blight | 1669 | 477 | 238 |
| Healthy | 1626 | 465 | 232 |
| Tomato | Bacterial_spot | 1489 | 425 | 213 |
| Early_blight | 1680 | 480 | 240 |
| Leaf_Mold | 1646 | 470 | 235 |
| Septoria_leaf_spot | 1526 | 436 | 218 |
| Spider_mites Two-spotted_spider_mite | 1523 | 435 | 217 |
| Target_Spot | 1598 | 457 | 228 |
| Tomato_mosaic_virus | 1566 | 448 | 224 |
| Tomato_Yellow_Leaf_Curl_Virus | 1715 | 490 | 245 |
| Healthy | 1684 | 481 | 240 |
Figure 3.
Diagram illustrating disease categories.
Figure 3.
Diagram illustrating disease categories.
4.1.1. The Experimental Environment
We constructed our model using PyTorch 1.7.0 and the PyTorch ImageModeling Library (timm) and then trained and evaluated the model on a GeForce RTX 3090Ti (NVIDIA Corporation, Santa Clara, CA, USA).
To ensure fair comparison, all the methods employed the same training strategy. The input image size was set to 256 × 256 and resized to 224 × 224 after image augmentation before being fed into the network model. The network model used the Adam optimizer with an initial learning rate of 0.0001, trained for 200 epochs, with a batch size of 64 for each training batch, and a dropout rate of 0.5. We expanded the training data by 4 times using image enhancement strategies, such as random rotation, horizontal flipping, and color jitter.
The patch embedding module is responsible for dividing the input image into blocks and projecting the pixels into the feature space. The block embedding module is implemented using a Conv2d layer with a convolution kernel size of and a stride of , which divides the input image into patches.
The symmetric multi-scale convolution module and overlap-attentive channel downsampler are key components of our PLTransformer and will be described in detail. The former is stacked , , , and times in stages 1, 2, 3, and 4, respectively, with , , , and . The modular design of PLTransformer facilitates easy customization to accommodate varying model size requirements.
4.1.2. Evaluation Metrics
The evaluation metrics used in this section of the experiment include accuracy, precision, recall, and F1 score. These metrics can all be calculated based on the counts of the four types of samples mentioned above. Below are the descriptions of these evaluation metrics.
Accuracy represents the proportion of correctly classified samples among all samples in a neural network model. Its calculation formula is shown in Equation (
11). Accuracy is a comprehensive metric for evaluating the performance of a model, but it may not fully reflect the model’s performance.
Precision represents the proportion of true positive samples among all samples predicted as positive by a neural network model. Its calculation formula is shown in Equation (
12). Precision focuses on evaluating how many actual positive samples are predicted correctly as positive, which is crucial for evaluating the misdiagnosis rate in plant disease classification tasks.
Recall, also known as sensitivity, measures the proportion of samples predicted as positive by the neural network model among all actual positive samples. In the context of plant disease classification tasks, recall represents the proportion of successfully classified samples in diseased plant leaves, measuring the model’s ability to avoid missed diagnoses. Its calculation formula is shown in Equation (
13).
The F1 score is the harmonic mean of the precision and recall, used to comprehensively assess the performance of a classification model. Its calculation formula is shown in Equation (
14).
4.2. The Experimental Results and Analysis
4.2.1. Method Effectiveness Validation Experiment
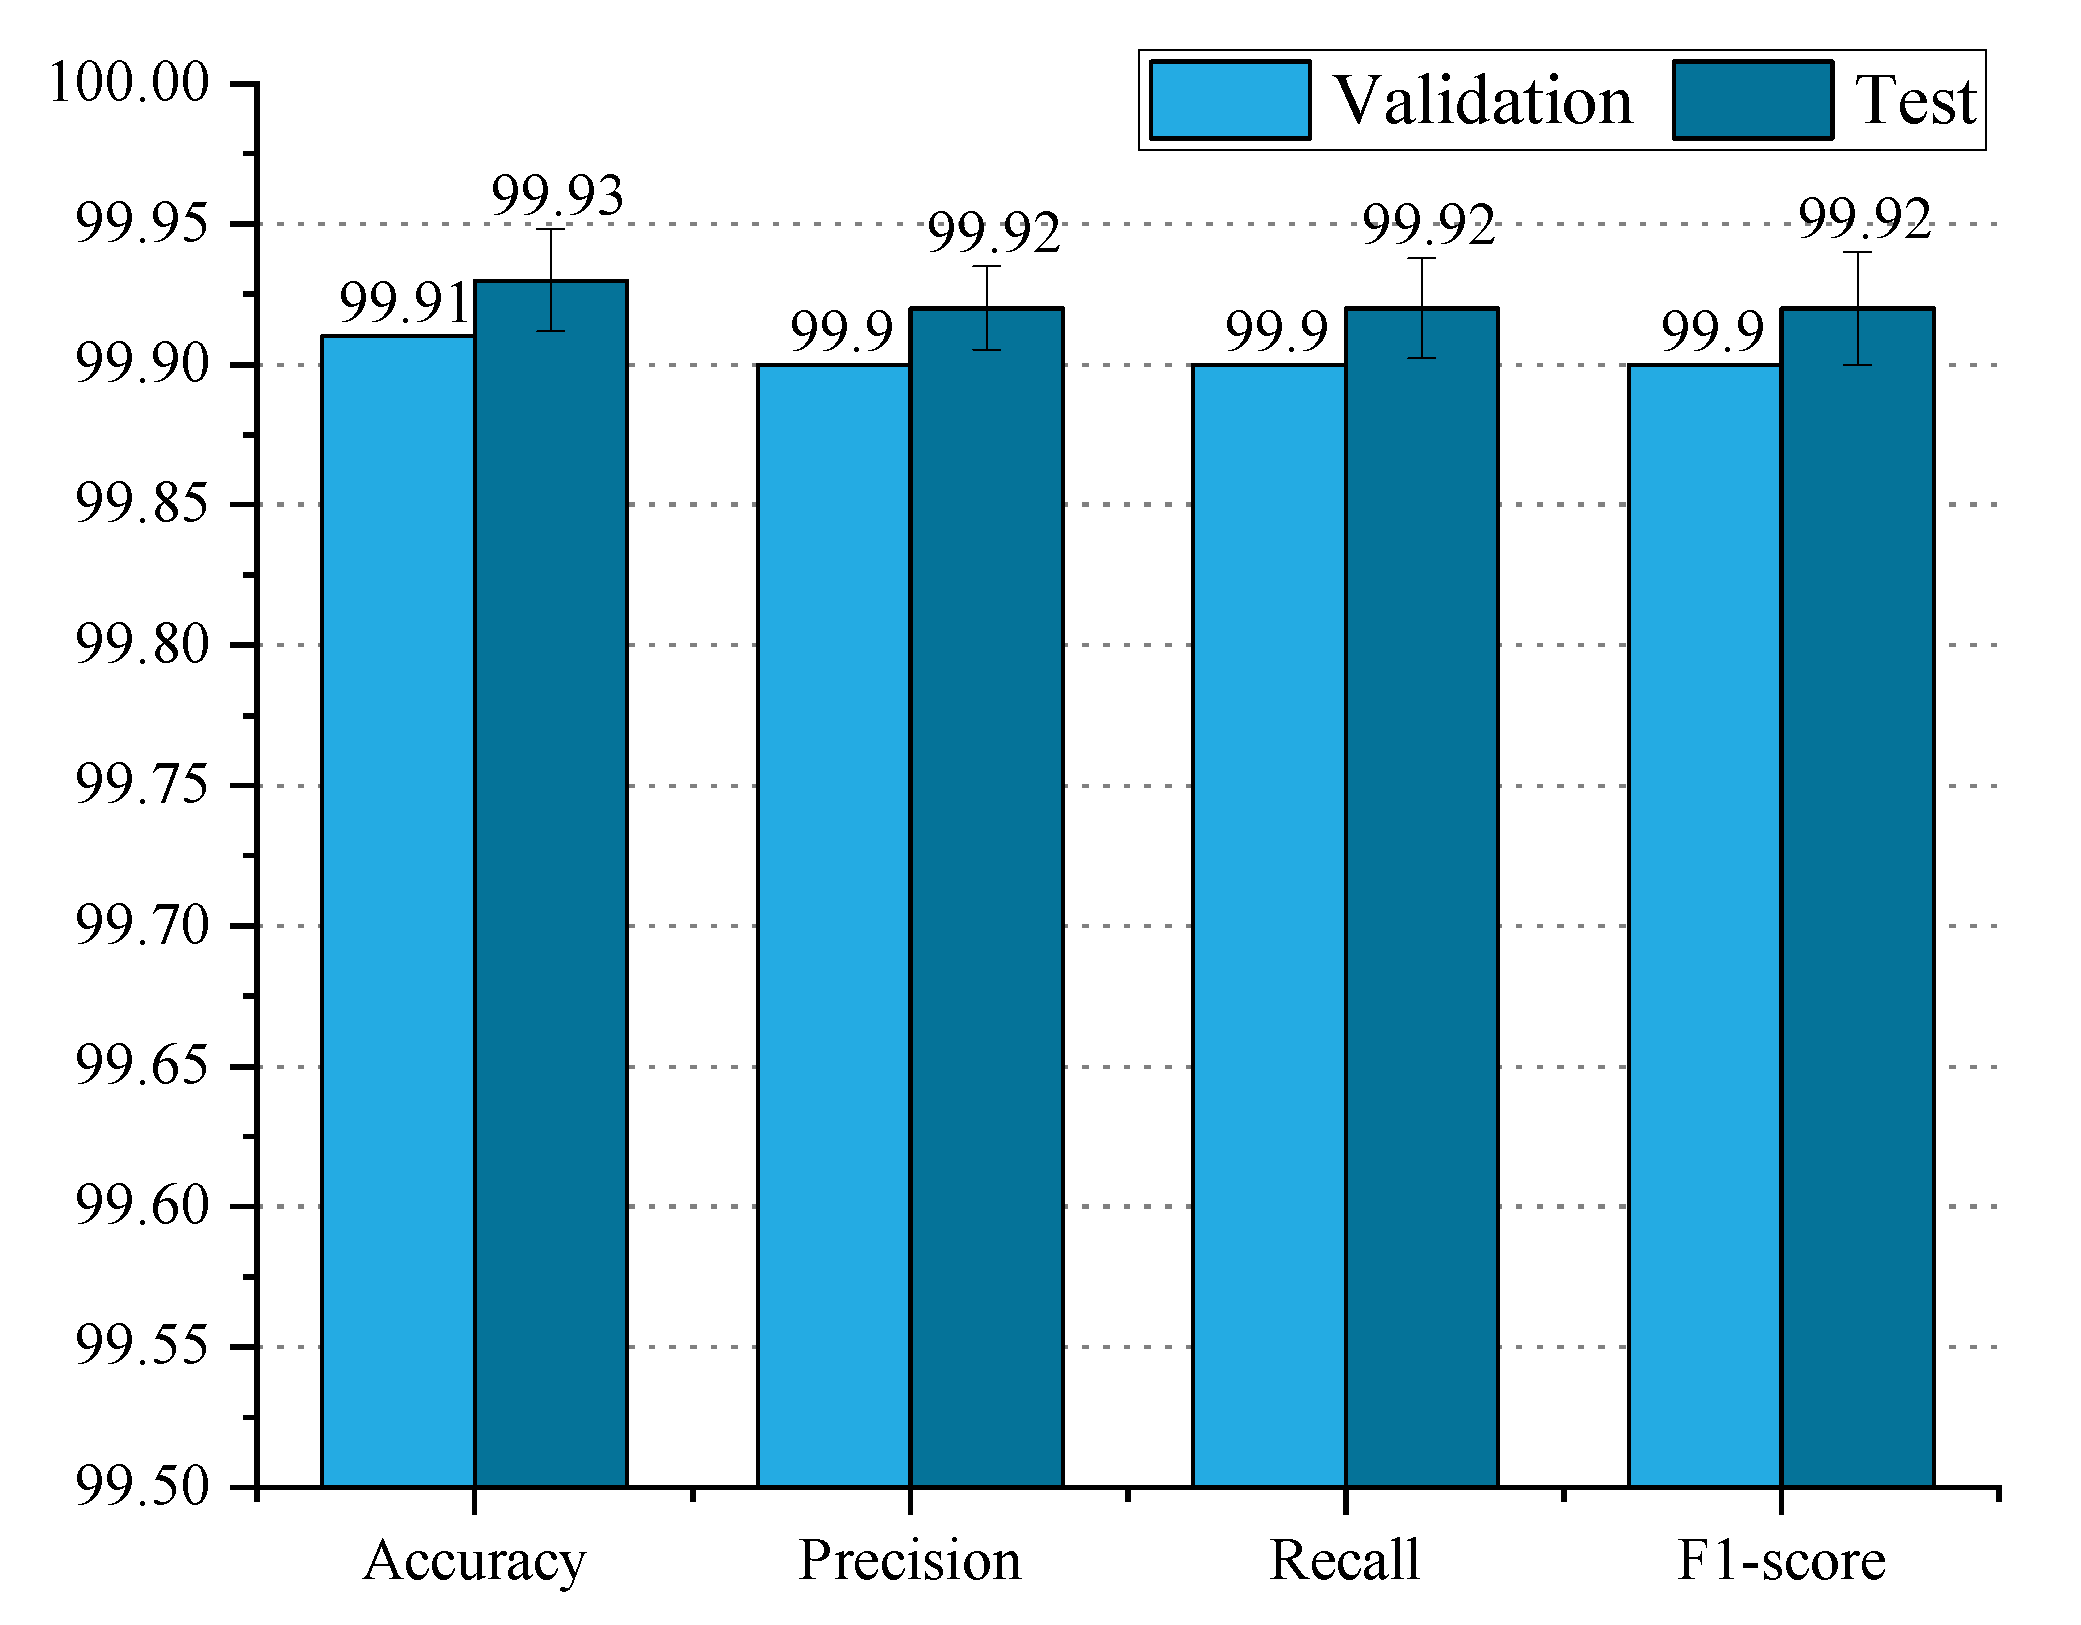
In this section, we evaluate the effectiveness of PLTransformer using the accuracy, precision, recall, and F1 score.
Figure 4 illustrates the performance of PLTransformer on the test and validation datasets.
From the figure, it can be observed that PLTransformer performs similarly in terms of accuracy, precision, recall, and F1 score on both the validation and test datasets. PLTransformer achieves an accuracy of 99.91% on the validation dataset and 99.95% on the test dataset, with a difference of only 0.04%. For precision, PLTransformer achieves 99.90% on the validation dataset and 99.94% on the test dataset, again with a difference of 0.04%. Regarding recall, PLTransformer achieves 99.95% on the test dataset, which is 0.05% higher than its performance on the validation dataset. The F1 score of PLTransformer on the validation and test datasets is 99.90% and 99.95%, respectively, with the validation dataset result being 0.05% higher than the test dataset result. Overall, the performance of PLTransformer on the validation and test datasets differs by at most 0.05%. Therefore, we conclude that PLTransformer exhibits excellent generalization performance.
Figure 5 depicts the confusion matrices of PLTransformer on the validation and test datasets. From the confusion matrix of the test dataset, we observe that one healthy potato leaf is incorrectly predicted as having late blight, and one tomato leaf with Septoria leaf spot is misclassified into the Leaf Mold category. From the confusion matrix of the validation dataset, we can see that two tomato leaves with Bacterial spot are, respectively, predicted as having Two-spotted spider mite and Target Spot. One tomato leaf with Two-spotted spider mite is incorrectly classified as having Tomato mosaic virus. Almost all non-diagonal elements have a value of 0, with only a few positions having non-zero values, indicating that the model has very few misclassified samples and high classification accuracy. In summary, the PLTransformer model has good classification capabilities for most categories.
4.2.2. Quantitative Comparison of Dataset
We compared PLTransformer with four classic convolutional neural networks (AlexNet, VGG11, EfficientNet, and SqueezeNet) and six transformer networks including ViT, SwinT, DeiT, Twins, DilateFormer, and DIC-Transformer on the dataset. We trained all ten models along with PLTransformer on PlantVillage and compared their performance in terms of accuracy, precision, recall, and F1 score. The quantitative comparison results are shown in
Table 3.
From the experimental data in the table, it is evident that transformer models generally outperform convolutional neural network models, with superior performance in accuracy, precision, recall, and F1 score. PLTransformer achieves the best scores in all four metrics, with accuracy, precision, recall, and F1 score reaching 99.95%, 99.94%, 99.95%, and 99.95%, respectively. The improvement in PLTransformer’s performance is attributed to the introduction of local image feature information by the multi-scale residual convolutional module into the transformer model, enriching the semantic information extracted by the model. Additionally, the overlap-attentive channel downsampler helps the model capture the interdependence between local channels in complex channel structures, further enhancing the model’s feature extraction capability.
4.2.3. Visualization Results
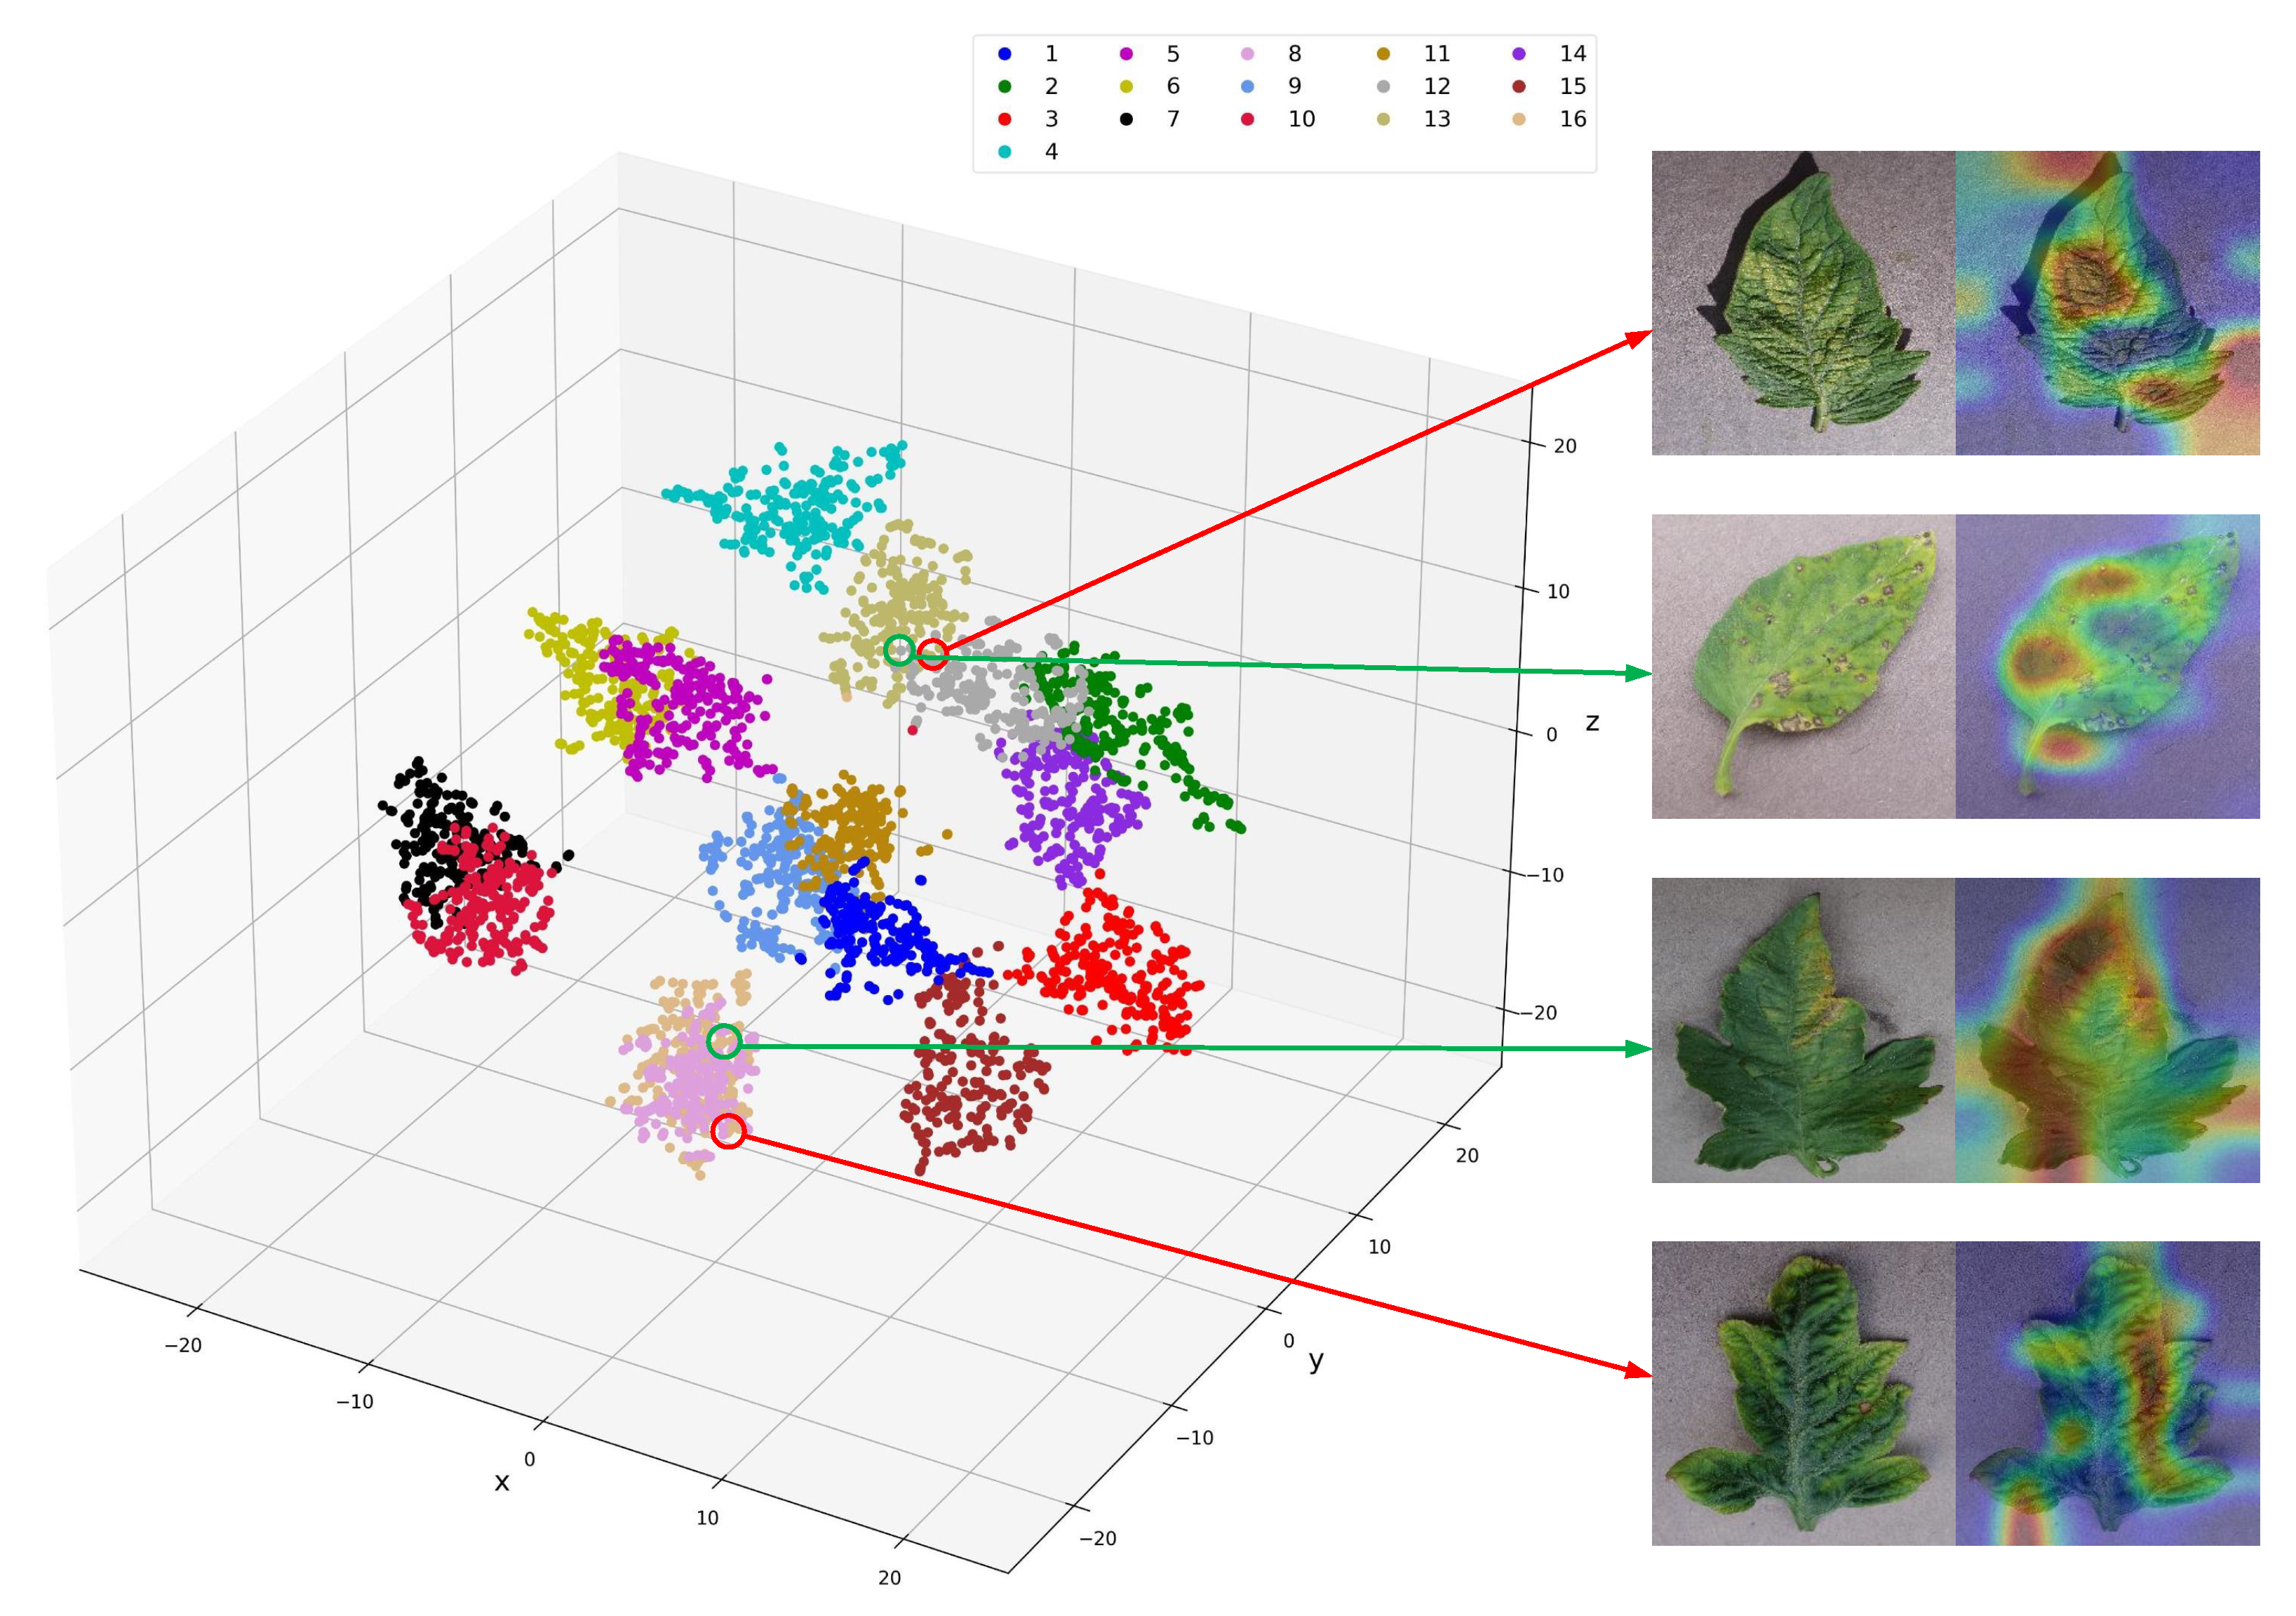
T-SNE (t-distributed stochastic neighbor embedding) is a technique used for data dimensionality reduction and visualization. It maps high-dimensional data into two- or three-dimensional space to facilitate the visualization of similarity relationships between data points. Grad-CAM [
30] (Gradient-weighted Class Activation Mapping) is a technique based on the PyTorch framework used to generate class activation maps. Grad-CAM displays the activation regions of different classes in a neural network, helping to understand how the model makes classification decisions based on input.
We employed the T-SNE and Grad-CAM techniques to visualize the classification results of PLTransformer.
Figure 6 depicts the visualization results, where the left side shows the similarity relationships of the classification features, and the right side illustrates the class activation maps of similar categories. From the figure, it can be observed that different categories of plant leaf images have clear boundaries, demonstrating the superior performance of our method. In the figure, The upper part of
Figure 6 represents tomato leaves with Septoria leaf spot, and the lower part of
Figure 6 represents tomato leaves with Spider mites Two-spotted spider mite. Observing these two types of images, it can be seen that the morphology of the leaves and the symptoms of the disease are quite similar, and the key areas affecting the model’s decision are very similar. This suggests that the model may confuse leaves with similar morphologies, which is the main reason for model errors.
While the T-SNE results show generally well-separated clusters, these failure cases highlight the model’s difficulty in distinguishing diseases with subtle visual differences. The embeddings of such samples often lie near class boundaries, indicating low inter-class separability and high intra-class similarity. These observations suggest that PLTransformer, despite its high overall accuracy, remains sensitive to fine-grained visual ambiguity. To address this, future work will focus on integrating contrastive learning strategies or uncertainty-aware modules to improve class boundary robustness.
4.3. Ablation Experiment
4.3.1. The Impact of Multi-Scale Residual Convolution
Our method employs a multi-scale residual convolutional module to extract local features from images. To validate the effectiveness of the multi-scale residual convolutional module, we compare our approach with a method where the multi-scale residual convolutional module is removed while keeping all the other modules the same. The experimental results are shown in
Table 4.
From the table above, it can be seen that after incorporating the multi-scale residual convolution block, the model’s accuracy, precision, recall, and F1 score increased by 1.18%, 1.38%, 1.22%, and 1.31%, respectively. As shown in the table, after introducing the MRC module, although the computational complexity of PLTransformer increased slightly, the overall computational cost remained within an acceptable range, demonstrating a good balance between efficiency and effectiveness. Specifically, FLOPs increased from 3.2 to 3.4 (an increase of approximately 6.25%), and the number of parameters increased by approximately 1.12 million (about 6.2%). Meanwhile, the model achieved significant improvements in accuracy, precision, recall, and F1 score, with the F1 score jumping from 98.64% to 99.95%. The performance improvement far exceeds the increase in computational overhead. This indicates that the introduction of the MRC module not only significantly enhances the model’s discriminative capability but also maintains high computational efficiency. The data indicates that the multi-scale residual convolution block extracts local features from images, enriching the features extracted by the model and enhancing the model’s performance.
4.3.2. The Impact of Overlap-Attentive Channel Downsampler
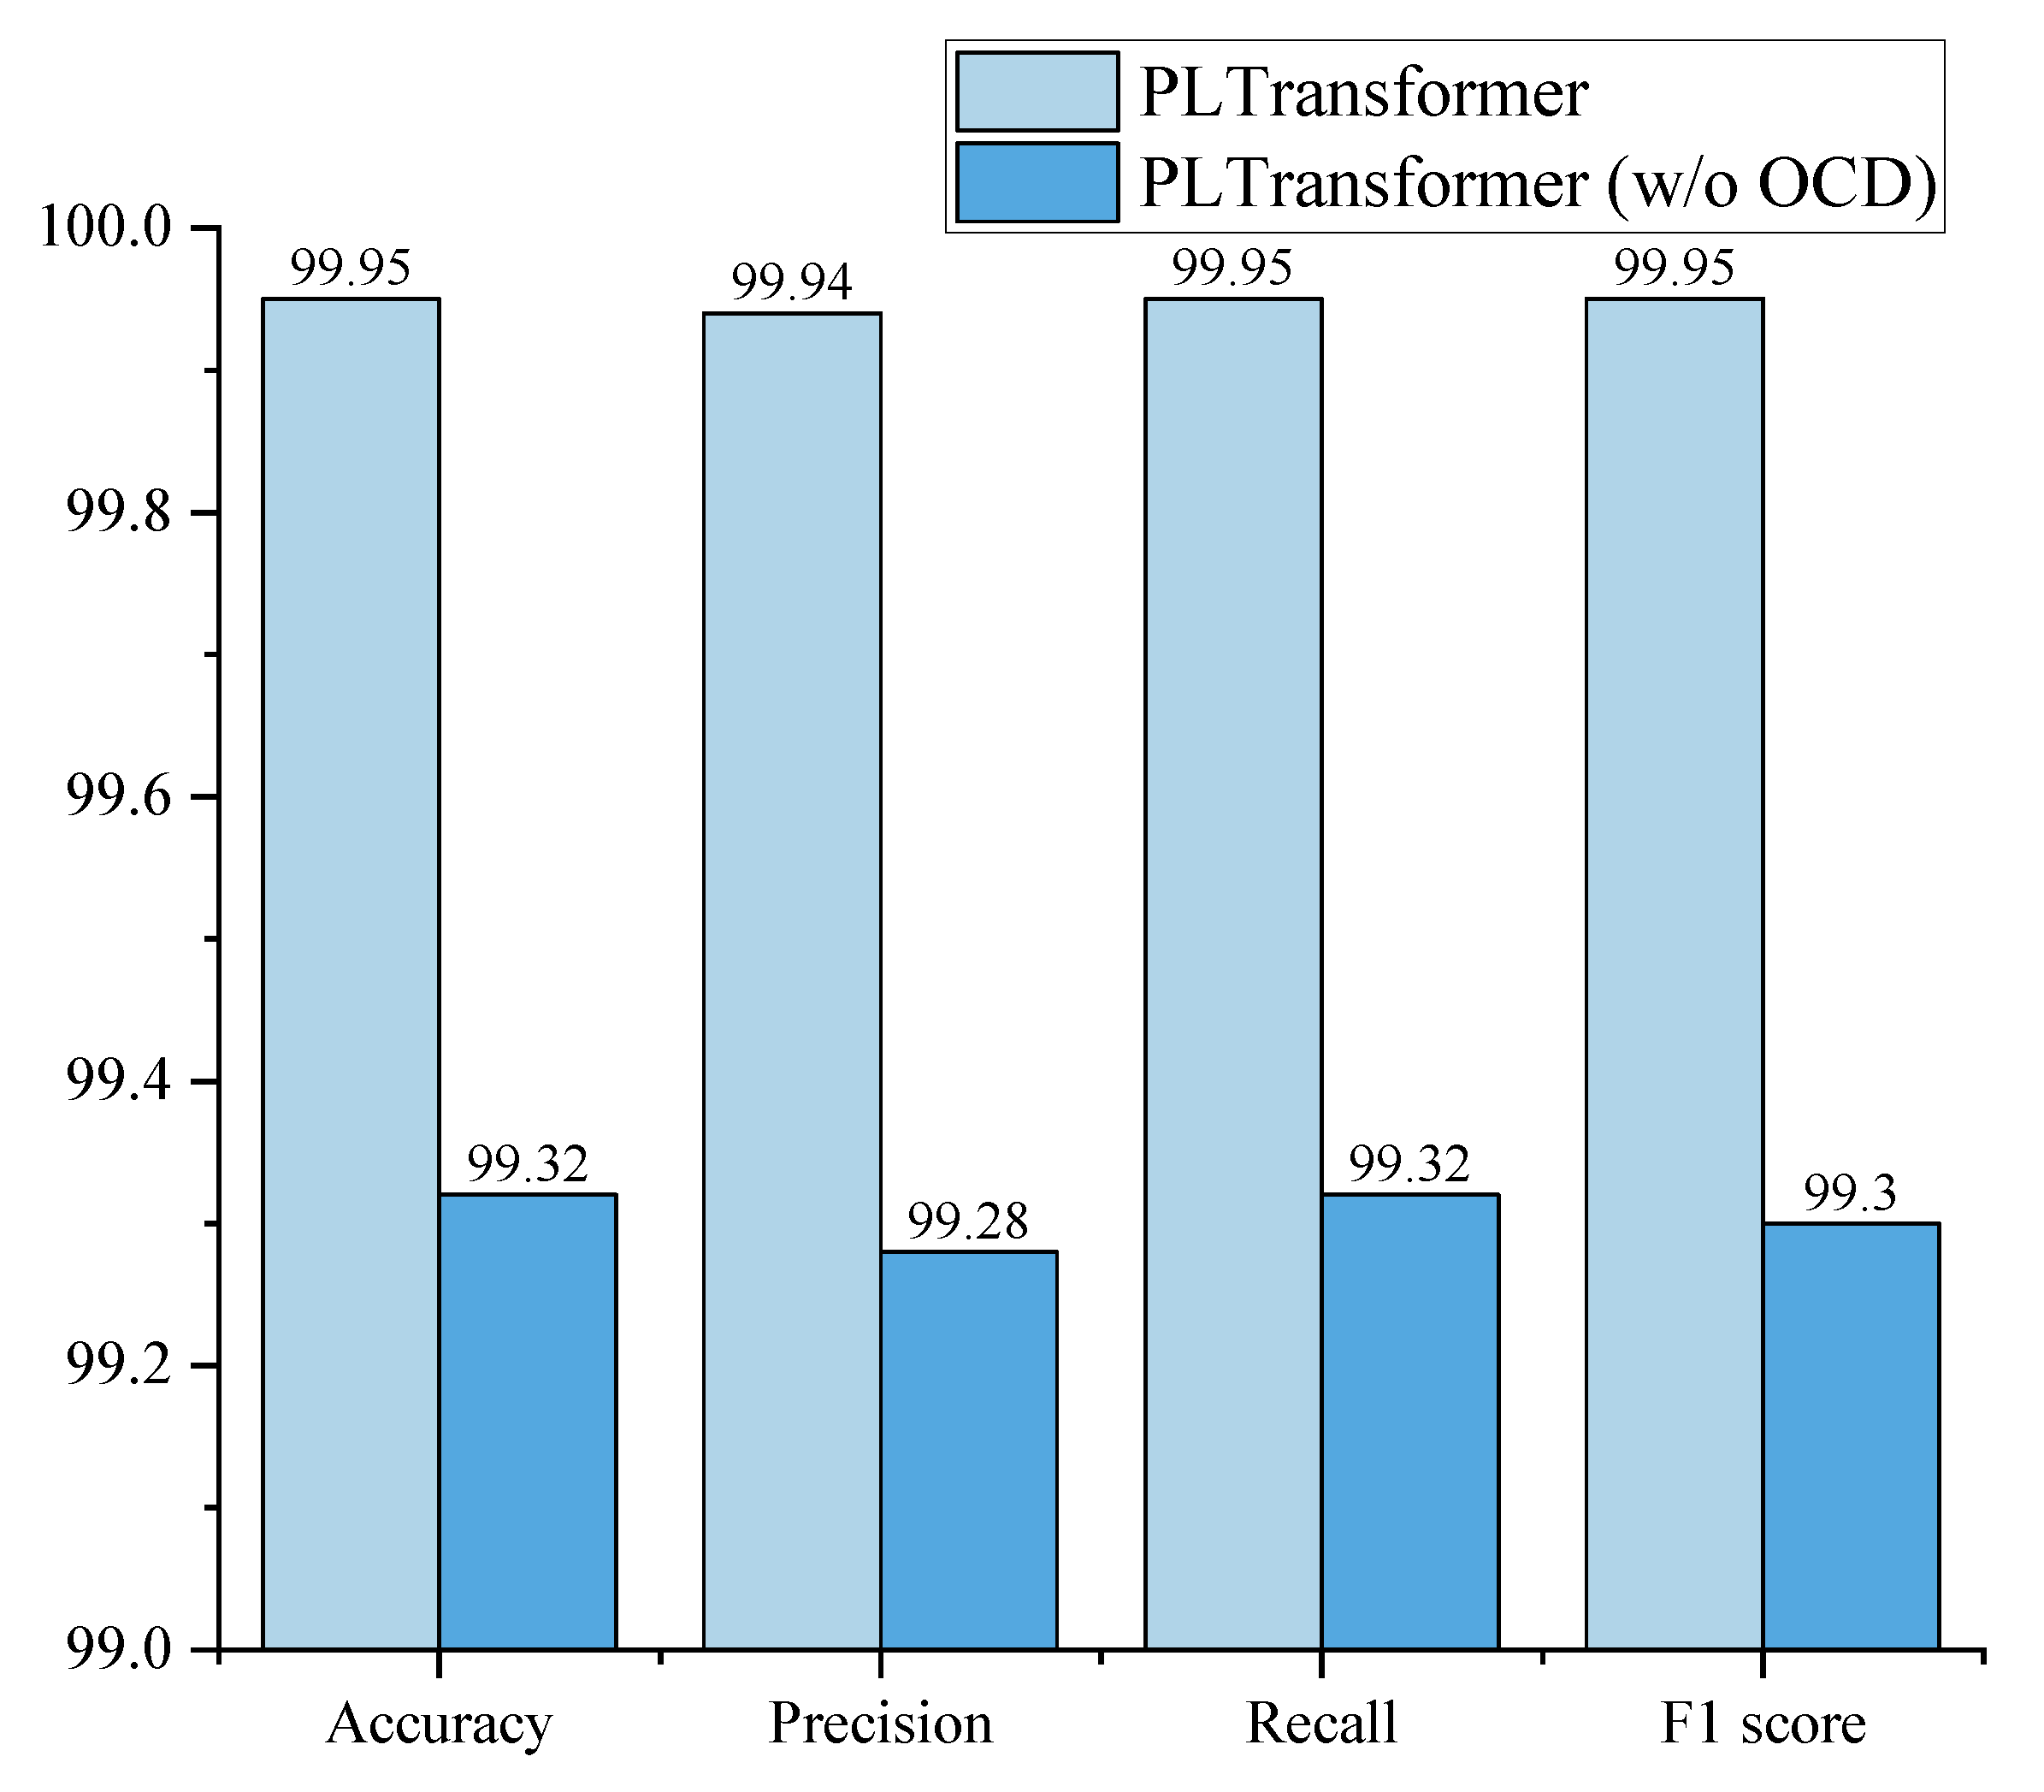
Our approach replaces the overlapping downsampler with the overlap-attentive channel downsampler, incorporating channel attention into the overlapping downsampler to assist the model in learning the complex relationships between channels. We compare the overlap-attentive channel downsampler with the overlapping downsampler, and the experimental results are shown in
Figure 7.
From the graph, it can be observed that when using the overlap-attentive channel downsampler in our approach, all four evaluation metrics including accuracy, precision, recall, and F1 score outperform those of the regular overlapping downsampler. Specifically, accuracy increased from 99.32% to 99.95%, precision increased from 99.28% to 99.94%, recall increased from 99.32% to 99.95%, and the F1 score increased from 99.30% to 99.95%. The improvement in model performance is attributed to the attention of the overlap-attentive channel downsampler on the interdependence between the local channels of the feature map during the downsampling. This enhancement strengthens the model’s feature extraction capability, resulting in improved classification performance.
4.3.3. The Impact of the Dilation Rate in Multi-Scale Dilated Convolutional Attention Blocks
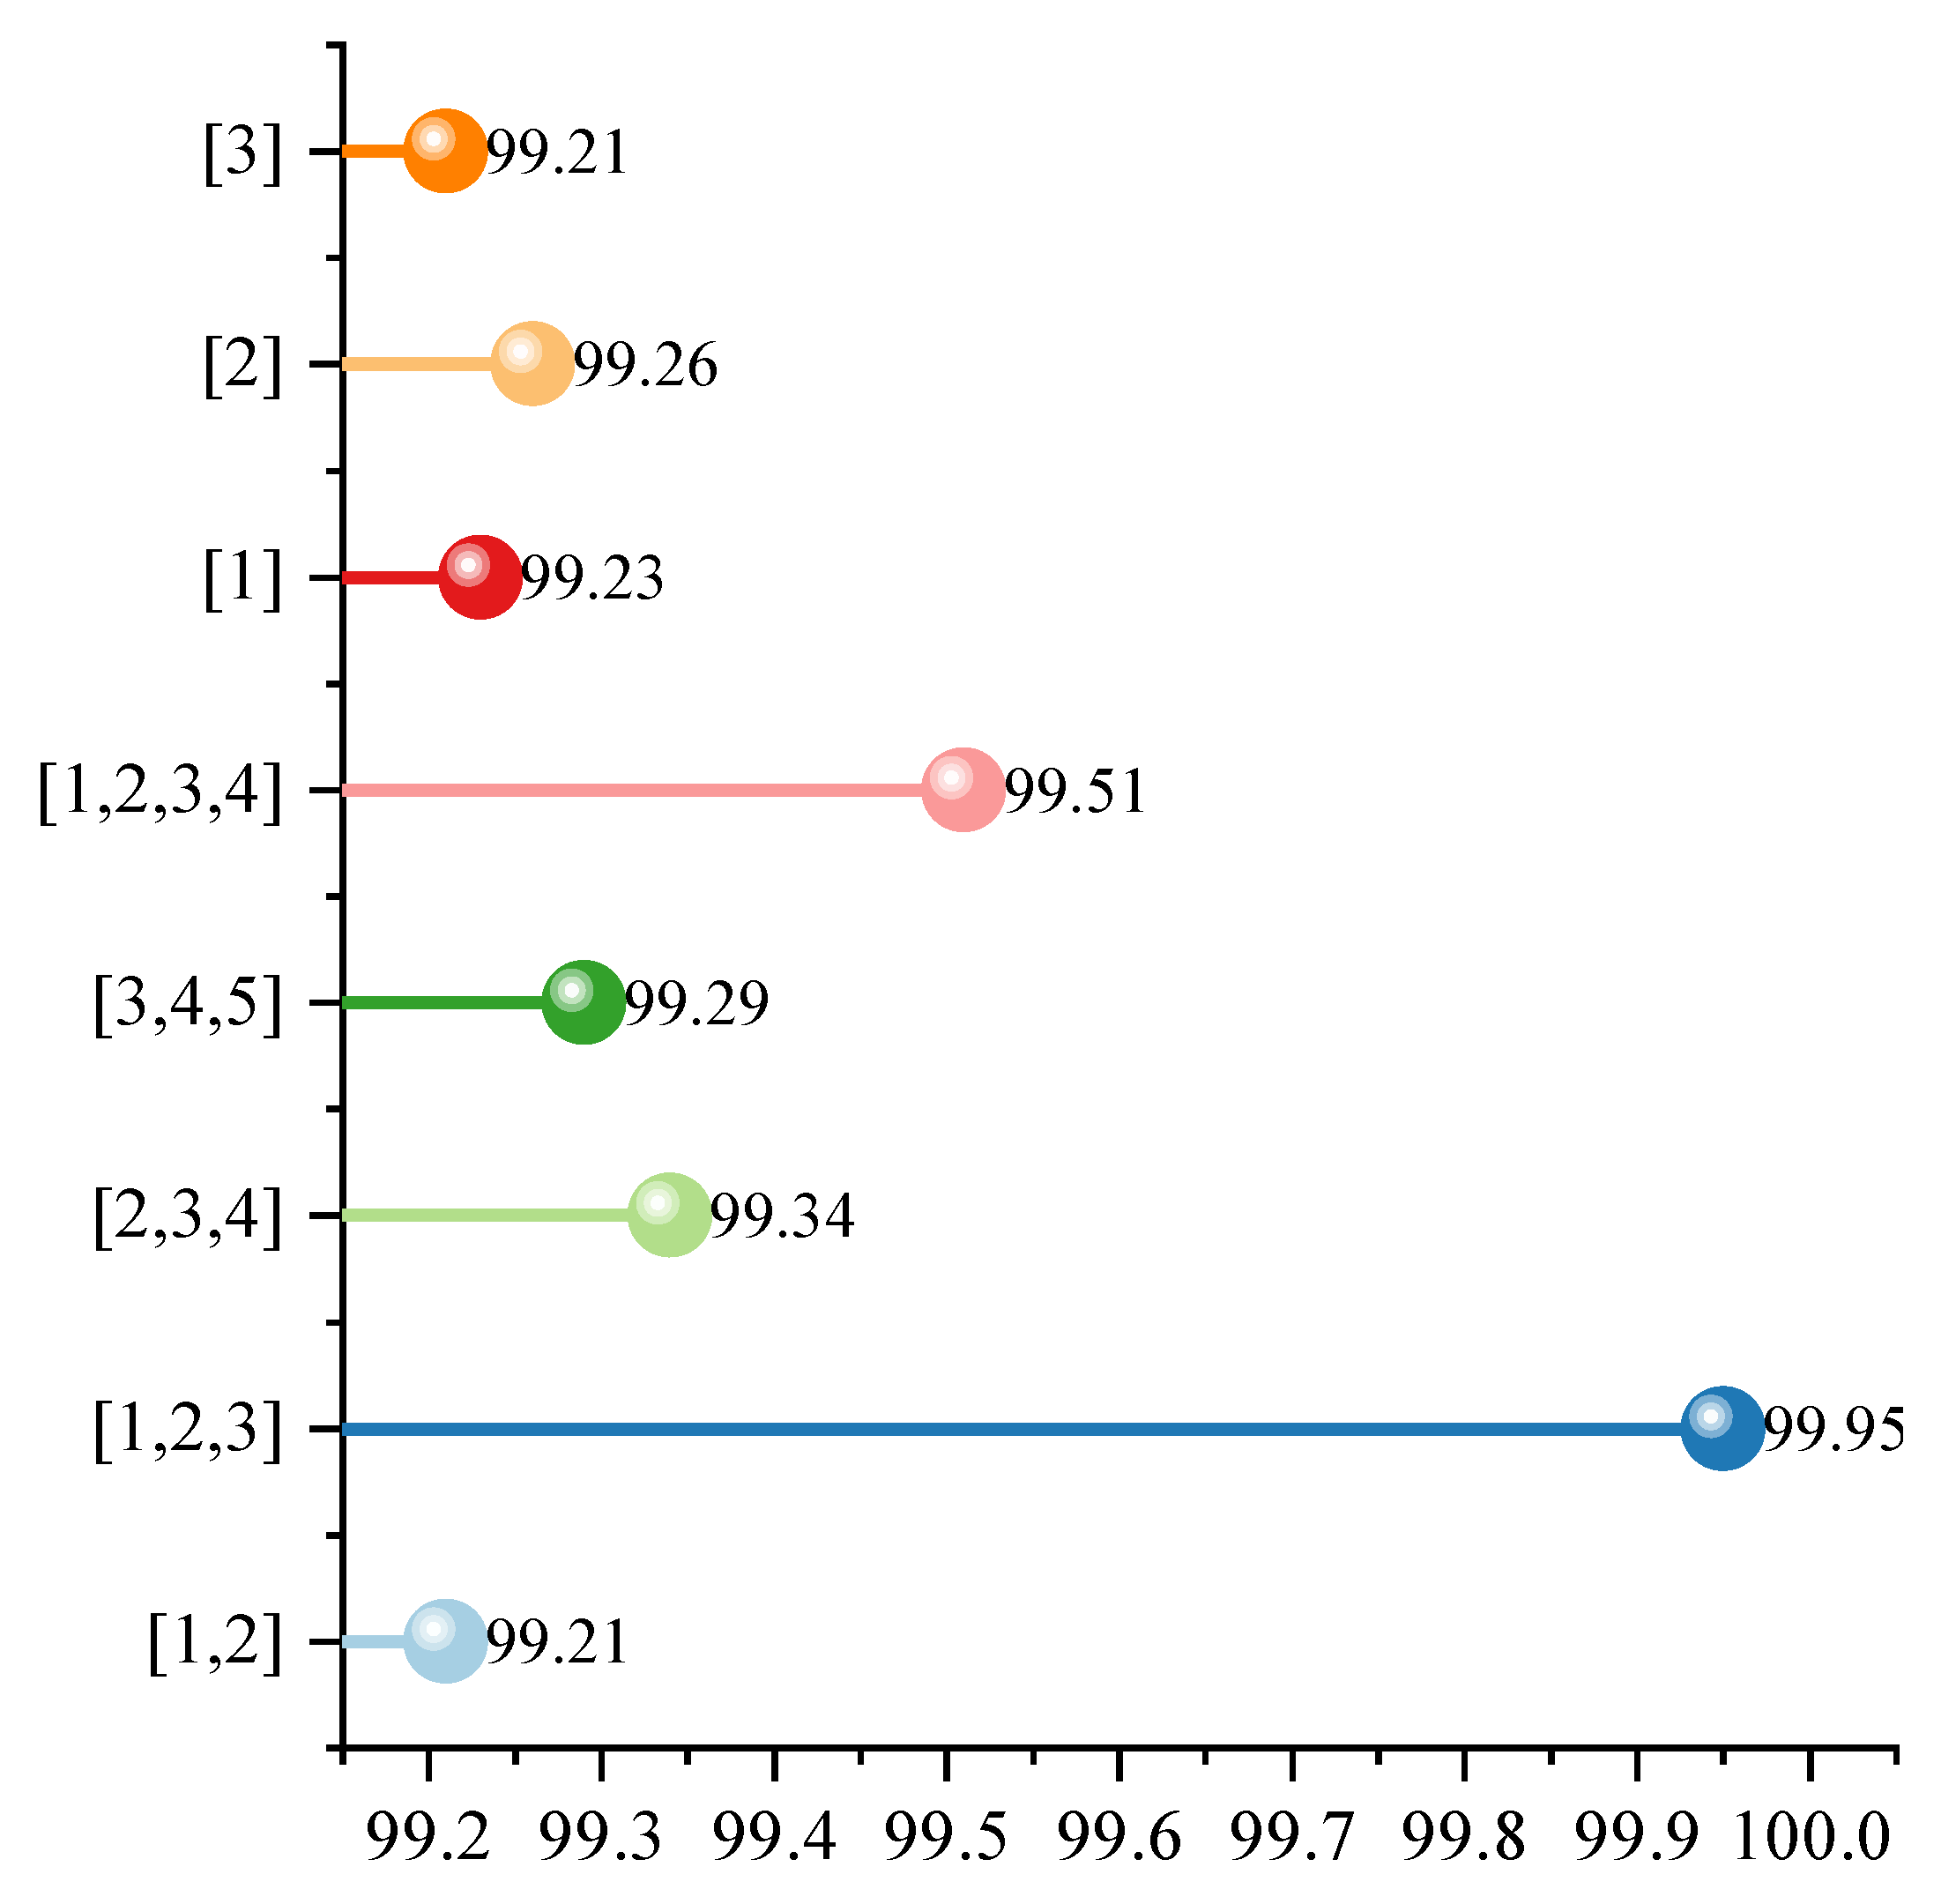
Figure 8 shows how different combinations of expansion rates affect the classification performance of the model in the multi-scale dilated convolutional attention module. The horizontal axis of the figure represents the classification accuracy, while the vertical axis denotes the adopted expansion rate combinations (e.g., [1] indicates using only convolutions with an expansion rate of 1, and [1,2,3] indicates using multi-scale convolutions with expansion rates of 1, 2, and 3). Each point corresponds to the accuracy results under a specific experimental configuration. As shown in the figure, when using a single dilation rate (e.g., [1], [2], or [3]), the model accuracy hovers between 99.21% and 99.26%, indicating relatively average performance. This suggests that the limited receptive field of a single scale restricts the model’s ability to comprehensively model both local and global features of an image. However, when multiple dilation rate combinations are introduced, the accuracy significantly improves. For example, the accuracy rate is 99.29% when using the [3,4,5] combination, 99.34% for [2,3,4], and 99.51% for [1,2,3,4], all of which are higher than when using a single expansion rate.
Among these, the best result comes from the dilation rate combination [1,2,3], achieving an accuracy rate of 99.95%, significantly outperforming all other combinations, even surpassing the [1,2,3,4] combination that includes more dilation rates. In contrast, the accuracy rates for [1,2] and [1,2,3,4] are 99.21% and 99.51%, respectively, indicating that more expansion rates are not necessarily better. A suitable and complementary combination (such as [1,2,3]) can maximize feature extraction capabilities while maintaining structural efficiency. Overall, the experimental results in the figure show that reasonably designing multi-scale dilation rate combinations, especially compact combinations that include neighboring scales (such as [1,2,3]), can more fully capture different scale information in images and improve the model’s ability to express complex semantic features, thus significantly improving classification accuracy. This also verifies that the multi-scale dilated convolutional attention module has important performance advantages in image recognition tasks.
4.4. Statistical Significance Tests
To further validate the performance improvement of PLTransformer, we conducted a statistical significance analysis. SwinT performed worse than PLTransformer on every metric. Specifically, we first established the hypotheses, namely, the null hypothesis (H0) and the alternative hypothesis (H1).
H0. It is hypothesized that there is no significant difference in performance between PLTransformer and SwinT in the plant disease image classification task.
H1. The hypothesis that there is a significant difference in performance between PLTransformer and SwinT in the image classification task.
The accuracy rates of PLTransformer in five experiments were 99.95%, 99.89%, 99.91%, 99.93%, and 99.90%, respectively. SwinT achieved accuracy rates of 99.64%, 99.71%, 99.59%, 99.62%, and 99.60% in ten experiments. The means and standard deviations of the two models are 0.9991 and 0.0158, and 0.9963 and 0.0450, respectively. We used a t-test to compare the average performance of the two models.
where
and
denote means,
and
denote standard deviations, and
and
denote the number of repetitions of the experiment. According to Equation (
15), we get
t = 12.72, and looking up the t-distribution table, we get
p =
, and we set the significance level of
to 0.001. The
p-value is significantly less than the
-value, the null hypothesis is rejected, and it is concluded that there is a significant difference between the performance of PLTransformer and SwinT. Therefore, by analyzing the statistical significance, we get that there is a significant difference between the two models, and the performance gain of PLTransformer is better.
4.5. Extended Experiment on PlantDoc
To validate the generalization ability of PLTransformer on other plant disease datasets, we conducted an extended experiment using the PlantDoc dataset [
31]. The experimental setup was the same as that of the main experiment. The PlantDoc dataset contains 2598 images of 13 plant species. The images are divided into 27 categories: 10 healthy categories and 17 disease categories. Due to the small dataset size, we expanded the training set by a factor of 4. The data setup is shown in
Table 5.
Figure 9 shows the performance of PLTransformer on the PlantDoc dataset. As can be seen, the precision, recall, F1 score, and accuracy on the validation set are 83.91%, 83.57%, 83.73%, and 83.47%, respectively. Due to the limited amount of data and uneven distribution of categories, PLTransformer performs slightly worse on the test set but still performs well. This indicates that PLTransformer has good generalizability on other plant disease datasets.
5. Discussion
Although PLTransformer achieved a high classification accuracy of 99.95% on the PlantVillage dataset, we acknowledge that this performance may be partially attributed to the clean and well-labeled characteristics of the dataset. To alleviate concerns about overfitting and enhance the reliability of the results, we additionally performed 5-fold cross-validation, as shown in
Table 6. The results indicate that the accuracy rate remained highly stable.
To assess the model’s feasibility for real-world deployment, we benchmarked its runtime performance on a GPU platform. On an NVIDIA RTX 3090Ti (NVIDIA Corporation, Santa Clara, CA, USA), PLTransformer achieved an average inference time of 12.4 milliseconds per image. These results demonstrate that the model maintains a good balance between accuracy and computational efficiency.
While our proposed model demonstrates strong performance on the PlantVillage dataset, it is important to acknowledge the limitations regarding real-world applicability and domain generalization. The PlantVillage dataset is collected under controlled conditions with clean backgrounds and uniform lighting, which differs significantly from complex field environments where disease symptoms may be occluded, affected by varying illumination, or mixed with environmental noise (e.g., soil, dew, or shadows).
Currently, our evaluation lacks in-the-wild testing on field-captured plant images or cross-dataset validation (e.g., from different geographical regions or imaging devices). In future work, we plan to incorporate domain adaptation techniques such as adversarial feature alignment or self-supervised fine-tuning to bridge the domain gap. Moreover, field deployment typically involves additional constraints such as computational cost on mobile devices and partial occlusions, which warrant specialized adaptation and model compression.
Evaluating the model’s robustness under such conditions and exploring domain generalization strategies are crucial next steps toward practical deployment in agricultural monitoring systems.
6. Conlusions
In this paper, we proposed PLTransformer, a hybrid architecture combining a symmetric multi-scale convolution module and an overlap-attentive channel downsampler to enhance both local and global feature representation for plant disease classification. The model has shown promising performance on the PlantVillage dataset, demonstrating its potential in accurate visual diagnosis of plant diseases. Looking ahead, we plan to extend this work in several important directions. First, we aim to evaluate the model on more challenging and diverse real-world datasets, including field images captured under varying lighting, occlusion, and background conditions, to assess its robustness and generalization. Second, we will explore lightweight model optimization and pruning techniques, such as knowledge distillation and neural architecture search, to enable deployment on edge devices like mobile phones or drones for in-field diagnosis. Third, we intend to investigate system-level integration of PLTransformer into intelligent agricultural platforms, allowing for real-time feedback, multi-sensor fusion, and continuous learning. By addressing these directions, our future work will not only improve the scalability and adaptability of PLTransformer but also contribute toward building practical AI-assisted systems for sustainable and efficient crop management in real-world agricultural settings.
Author Contributions
Conceptualization, T.Y. and C.X.; methodology, C.X.; software, T.Y.; validation, T.Y. and C.X.; formal analysis, T.Y.; investigation, C.X.; resources, C.X.; data curation, C.X.; writing—original draft preparation, C.X.; writing—review and editing, T.Y.; visualization, T.Y.; supervision, T.Y.; project administration, C.X. All authors have read and agreed to the published version of the manuscript.
Funding
This research received no external funding.
Data Availability Statement
Conflicts of Interest
The authors declare no conflicts of interest.
References
- Kotwal, J.; Kashyap, R.; Pathan, S. Agricultural plant diseases identification: From traditional approach to deep learning. Mater. Today Proc. 2023, 80, 344–356. [Google Scholar] [CrossRef]
- Hassan, S.M.; Maji, A.K. Plant disease identification using a novel convolutional neural network. IEEE Access 2022, 10, 5390–5401. [Google Scholar] [CrossRef]
- Vaswani, A.; Shazeer, N.; Parmar, N.; Uszkoreit, J.; Jones, L.; Gomez, A.N.; Kaiser, Ł.; Polosukhin, I. Attention is all you need. In Advances in Neural Information Processing Systems 30, Proceedings of the Annual Conference on Neural Information Processing Systems 2017, Long Beach, CA, USA, 4–9 December 2017; NeurIPS: San Diego, CA, USA, 2017; Volume 30. [Google Scholar]
- Wang, W.; Xie, E.; Li, X.; Fan, D.; Song, K.; Liang, D.; Lu, T.; Luo, P.; Shao, L. Pyramid vision transformer: A versatile backbone for dense prediction without convolutions. In Proceedings of the IEEE/CVF International Conference on Computer Vision, Montreal, BC, Canada, 11–17 October 2021; pp. 568–578. [Google Scholar]
- Yuan, L.; Chen, Y.; Wang, T.; Yu, W.; Shi, Y.; Jiang, Z.; Tay, F.E.H.; Feng, J.; Yan, S. Tokens-to-token vit: Training vision transformers from scratch on imagenet. In Proceedings of the IEEE/CVF International Conference on Computer Vision, Montreal, BC, Canada, 11–17 October 2021; pp. 558–567. [Google Scholar]
- Touvron, H.; Cord, M.; Douze, M.; Massa, F.; Sablayrolles, A.; Jegou, H. Training data-efficient image transformers & distillation through attention. In Proceedings of the 38th International Conference on Machine Learning (PMLR), Virtual, 18–24 July 2021; pp. 10347–10357. [Google Scholar]
- Zeng, Q.; Sun, J.; Wang, S. DIC-Transformer: Interpretation of plant disease classification results using image caption generation technology. Front. Plant Sci. 2024, 14, 1273029. [Google Scholar] [CrossRef]
- Li, Y.; Nie, J.; Chao, X. Do we really need deep CNN for plant diseases identification? Comput. Electron. Agric. 2020, 178, 105803. [Google Scholar] [CrossRef]
- Kamal, K.C.; Yin, Z.; Wu, M.; Wu, Z. Depthwise separable convolution architectures for plant disease classification. Comput. Electron. Agric. 2019, 165, 104948. [Google Scholar]
- Zhao, Y.; Sun, C.; Xu, X.; Chen, J. RIC-Net: A plant disease classification model based on the fusion of Inception and residual structure and embedded attention mechanism. Comput. Electron. Agric. 2022, 193, 106644. [Google Scholar] [CrossRef]
- Lee, S.H.; Goëau, H.; Bonnet, P.; Joly, A. Attention-based recurrent neural network for plant disease classification. Front. Plant Sci. 2020, 11, 601250. [Google Scholar] [CrossRef]
- Wang, X.; Cao, W. Bit-plane and correlation spatial attention modules for plant disease classification. IEEE Access 2023, 11, 93852–93863. [Google Scholar] [CrossRef]
- Yu, X.; Wang, J.; Zhao, Y.; Gao, Y. Mix-ViT: Mixing attentive vision transformer for ultra-fine-grained visual categorization. Pattern Recognit. 2023, 135, 109131. [Google Scholar] [CrossRef]
- Patil, R.R.; Kumar, S. Rice transformer: A novel integrated management system for controlling rice diseases. IEEE Access 2022, 10, 87698–87714. [Google Scholar] [CrossRef]
- Zheng, H.; Wang, G.; Li, X. Swin-MLP: A strawberry appearance quality identification method by Swin Transformer and multi-layer perceptron. J. Food Meas. Charact. 2022, 16, 2789–2800. [Google Scholar] [CrossRef]
- Bi, C.; Hu, N.; Zou, Y.; Zhang, S.; Xu, S.; Yu, H. Development of deep learning methodology for maize seed variety recognition based on improved swin transformer. Agronomy 2022, 12, 1843. [Google Scholar] [CrossRef]
- Guo, Y.; Lan, Y.; Chen, X. CST: Convolutional Swin Transformer for detecting the degree and types of plant diseases. Comput. Electron. Agric. 2022, 202, 107407. [Google Scholar] [CrossRef]
- Li, X.; Li, X.; Zhang, S.; Zhang, G.; Zhang, M.; Shang, H. SLViT: Shuffle-convolution-based lightweight Vision transformer for effective diagnosis of sugarcane leaf diseases. J. King Saud-Univ. Inf. Sci. 2023, 35, 101401. [Google Scholar] [CrossRef]
- Li, X.; Chen, X.; Yang, J.; Li, S. Transformer helps identify kiwifruit diseases in complex natural environments. Comput. Electron. Agric. 2022, 200, 107258. [Google Scholar] [CrossRef]
- Mohanty, S.P.; Hughes, D.P.; Salathé, M. Using deep learning for image-based plant disease detection. Front. Plant Sci. 2016, 7, 215232. [Google Scholar] [CrossRef]
- Krizhevsky, A.; Sutskever, I.; Hinton, G.E. ImageNet classification with deep convolutional neural networks. Commun. ACM 2017, 60, 84–90. [Google Scholar] [CrossRef]
- Simonyan, K.; Zisserman, A. Very deep convolutional networks for large-scale image recognition. arXiv 2014, arXiv:1409.1556. [Google Scholar]
- Koonce, B. EfficientNet. In Convolutional Neural Networks with Swift for Tensorflow: Image Recognition and Dataset Categorization; Apress: Berkeley, CA, USA, 2021; pp. 109–123. [Google Scholar]
- Iandola, F.N.; Han, S.; Moskewicz, M.W.; Ashraf, K.; Dally, W.J.; Keutzer, K. SqueezeNet: AlexNet-level accuracy with 50x fewer parameters and < 0.5 MB model size. arXiv 2016, arXiv:1602.07360. [Google Scholar]
- Dosovitskiy, A.; Beyer, L.; Kolesnikov, A.; Weissenborn, D.; Zhai, X.; Unterthiner, T.; Dehghani, M.; Minderer, M.; Heigold, G.; Gell, S.; et al. An image is worth 16x16 words: Transformers for image recognition at scale. arXiv 2020, arXiv:2010.11929. [Google Scholar]
- Liu, Z.; Lin, Y.; Cao, Y. Swin transformer: Hierarchical vision transformer using shifted windows. In Proceedings of the IEEE/CVF International Conference on Computer Vision, Montreal, BC, Canada, 11–17 October 2021; pp. 10012–10022. [Google Scholar]
- Han, K.; Xiao, A.; Wu, E.; Guo, J.; Xu, C.; Wang, Y. Transformer in transformer. In Advances in Neural Information Processing Systems, Proceedings of the Annual Conference on Neural Information Processing Systems, Virtual, 6–14 Decmber 2021; NeurIPS: San Diego, CA, USA, 2021; Volume 34, pp. 15908–15919. [Google Scholar]
- Chu, X.; Tian, Z.; Wang, Y.; Zhang, B.; Ren, H.; Wei, X.; Xia, H.; Shen, C. Twins: Revisiting the design of spatial attention in vision transformers. In Advances in Neural Information Processing Systems, Proceedings of the Annual Conference on Neural Information Processing Systems, Virtual, 6–14 Decmber 2021; NeurIPS: San Diego, CA, USA, 2021; Volume 34, pp. 9355–9366. [Google Scholar]
- Jiao, J.; Tang, Y.M.; Lin, K.Y.; Gao, Y.; Ma, A.J.; Wang, Y. Dilateformer: Multi-scale dilated transformer for visual recognition. IEEE Trans. Multimed. 2023, 25, 8906–8919. [Google Scholar] [CrossRef]
- Chattopadhay, A.; Sarkar, A.; Howlader, P.; Balasubramanian, V.N. Grad-cam++: Generalized gradient-based visual explanations for deep convolutional networks. In Proceedings of the 2018 IEEE Winter Conference on Applications of Computer Vision (WACV), Lake Tahoe, NV, USA, 12–15 March 2018; IEEE: New Hoboken, NJ, USA, 2018; pp. 839–847. [Google Scholar]
- Singh, D.; Jain, N.; Jain, P.; Kayal, P.; Kumawat, S.; Batra, N. PlantDoc: A dataset for visual plant disease detection. In Proceedings of the 7th ACM IKDD CoDS and 25th COMAD, Hyderabad, India, 5–7 January 2020; pp. 249–253. [Google Scholar]
| Disclaimer/Publisher’s Note: The statements, opinions and data contained in all publications are solely those of the individual author(s) and contributor(s) and not of MDPI and/or the editor(s). MDPI and/or the editor(s) disclaim responsibility for any injury to people or property resulting from any ideas, methods, instructions or products referred to in the content. |
© 2025 by the authors. Licensee MDPI, Basel, Switzerland. This article is an open access article distributed under the terms and conditions of the Creative Commons Attribution (CC BY) license (https://creativecommons.org/licenses/by/4.0/).


