1. Introduction
The development of new directions of science and technology development is an urgent problem of modern production. Their research results allow one to effectively master new schemes of their development. One of the promising directions in continuum mechanics is technologies and processes based on the effects of plastic molding under conditions of an additional controlling influence. In practice, it is associated with the combination of technological operations where one is the main one, and the other is additional but controlling. The control shall have certain qualitative indicators and, first of all, the magnitude of loading, which shall be less than the main one. The interaction of loadings allows the revealing of the effects of the plastic flow of metals associated with changes in the stress state of the deformed medium, the strengthening of the deformation characteristics of the metal flow, such as shear, etc. The control part of loading in technological operations, in addition to experimental studies, should have a broad theoretical basis confirmed by fundamental solutions in continuum mechanics.
The combination of technological operations and controlling action on the plastic deformation zone is presented in the literature as a global and fundamental issue of production development. This paper [
1] shows several combined processes: the continuous casting of the steel and plastic treatment of the cast billet and the plastic deformation of steel and thermal treatment of the material in the flow of the mill, the so-called thermomechanical treatment of steel, or “controlled rolling”. Comprehensive studies [
2] carried out in various technological directions have shown a number of control effects in mechanical processes. These include effects related to the plastic processing of the material; the realization of the physical and technical effects of pulse processing; and the use of shock-absorbing and nanostructured coatings to control contact friction forces during the manufacturing process, including plastic processing. The combination of technological operations in metal-forming processes is a widespread phenomenon, which simplifies and reduces the cost of production technology in many respects. For certain reasons, it became necessary to roll a hot-rolled truck rim profile with a wavy center section. However, there was a problem with the center section, as the rim in use needed to have a flat center section. It had to be leveled beforehand, which required additional labor costs. That was highly undesirable.
At the wheel factory [
2,
3], it was proposed to combine the operation of “curling” the strip into the shell with the transverse straightening of the thin-walled part of the profile in the first technological operation of wheel rim production. Load matching has been shown to be effective without additional labor costs. Paper [
4] presents different technologies for the rolling of long sections where combined deformation loading takes place, including reductions and bending, extension–compression and rotation, extension–compression and shear, and other combinations.
There are quite a lot of works devoted to combining the processes of setting and torsion [
5,
6,
7,
8], where torsion is presented as an additional effect on the deformation zone. In paper [
5], while combining two operations of setting and rotation, intensive transverse shear deformation is realized, resulting in a reduction in the force load. The rotational action in the deformation zone is defined here as an additional control action.
The publication [
6] shows the effect of additional exposure during setting by rotation, with an unambiguous influence on the mechanical characteristics of the workpiece processed. In [
7], the issue of energy consumption when combining technological operations of precipitation and rotation is highlighted. The use of additional actions in these cases provides certain advantages in the implementation of technological operations. The combination of technological operations published in [
5] also takes place in cross rolling [
8]. The mill design creates two directions of plastic shaping on the roll side, where radial reductions and additional shear deformations are formed. This ensures not only intensive grain refinement to the submicron level (less than 1 µm), but also a uniform distribution of high-angle boundaries throughout the entire volume of the workpiece.
A scheme of oblique rolling is presented in [
9]. Here occurs the deformation of a sheet billet in rolls, the axes of which are rotated in the plane of the sheet by an angle relative to the transverse direction of the sheet. This allows for the intensification of the process of additional shear due to an additional impact in the deformation zone.
The authors of [
10] showed the influence of the factor of the non-uniformity of plastic deformation on the parameters of the process of plastic shape change. The geometry of the center zone is different; on one side it is made rectilinear and on the other side it is in the form of a wave surface. The shape of the thin-walled part of the profile significantly changes the magnitude of the non-uniform interaction and affects the parameters of the stress state in different ways. By adjusting the magnitude of the longitudinal force that results from the law of additional stresses [
11], stresses are generated in the thin-walled part that relieve the load on the thin-walled part of the profile. As a result, the rolling process of a complex profile with a large number of controlled elements is stabilized. The control approach to regulate the stress state in the reduction zone was used in practice in the development of wheel rim profiles of a reduced metal intensity. This allowed the technology of an additional impact to be used in the development of highly economical profiles of a reduced metal intensity [
12].
In the theoretical work [
13], there was asymmetry of loading along the length of the deformation zone. According to the physical model, a force controlling the influence was formed in the overlapping zones. It was physically and mathematically possible to identify its features. The effects of the plastic shape change closely related to the zone of reachability of the ultimate deformation zone are revealed. The limit deformation zone corresponds to the process of rolling stability loss (slippage). Within this zone, a decrease in the force of the shape change with an increasing deformation load was recorded [
14].
It became possible to estimate the asymmetry of loading in the opposite directional metal flow of differently loaded zones of lagging and advance when a new modern method for solving problems of continuum mechanics was used: the method of the argument of functions of complex variables. The method is quite detailed in highly ranked journals. It is highly versatile and can be applied in different areas of mechanics, including the theory of dynamic processes [
15], theory of elasticity [
16], and theory of plasticity [
13]. The closed problem of plasticity theory is solved in the theory of plasticity, which indicates the potential of the method as a fundamental direction for the development of continuum mechanics. The validity of the result obtained is strengthened. The peculiarity of the method is that with its help, we find not the solutions of problems, but the conditions of their existence, which is largely explained by the use of Cauchy–Riemann differential relations and Laplace equations. If we look at the method from the point of view of the theory of differential equations, we should emphasize that, taking into account complex functions [
17], the method allows us to obtain solutions of different types of differential equations from general positions, including the use of Cauchy–Riemann invariant relations and so on.
The results of this study of the loading of the rolled product from the side of rolls with different geometric, mechanical, and physical characteristics are presented in [
18]. The appearances of the non-uniformity of plastic deformation along the height and the change of the kinematic, force, and deformation parameters of the process are noted. The effects of longitudinal compressive and extensional stresses and forces were recorded at the ends of the deformation zone. The curvature of the roll at the entry and exit of the deformation zone in the vertical plane indicates the presence of different draws along the height of the billet, hence the presence of the non-uniformity of reduction. In works [
18,
19,
20,
21,
22,
23], the reduction in force by 20–40% at rolling with one non-driven roll was recorded.
The application of supplemental forces within the plastic deformation zone significantly enhances the controllability of metal-forming processes, notably in longitudinal symmetrical rolling. This approach, documented in [
10], acts as an additional control mechanism, refining the shaping process beyond conventional methods. A crucial aspect of this supplementary force is its scale: it must be significantly smaller than the primary forming force, allowing for adjustable control throughout the various stages of metal processing. The nature of these supplemental influences is diverse, encompassing various force and deformation factors. These can include asymmetries within the deformation zone itself or inconsistencies in the interaction of forces along the longitudinal axis [
13].
Chigirinsky et al. [
13] explored theoretical models demonstrating the impact of lengthwise asymmetric loading within the deformation zone. Their work identified the creation of a controlling force influence within overlapping zones of the material, characterized both physically and mathematically. This research highlighted the intricate relationship between plastic shape changes and the zone of reachability of the ultimate deformation zone—the point at which rolling stability is lost and slippage occurs. A notable observation was the decrease in the shaping force with an increasing deformation load within this critical zone.
The obtained result on the asymmetry of loading is of great practical importance and the force of plastic shaping is reduced. This leads to a decrease in the elastic deformation of the working cage, which allows you to narrow the rolling tolerances, increase the accuracy, and save metal; reduce the wear of the working tool (rolls); realize the process of intense plastic deformation by strengthening the shear component; and adjust the structure of the metal during rolling, therefore working to order.
A novel methodological advancement—utilizing the argument of the functions of complex variables, a technique detailed in numerous high-impact journals—enabled the quantification of loading asymmetry within opposing metal flows in differently loaded zones (leading and lagging regions). This method, a powerful tool in continuum mechanics, provides unprecedented insight into these complex interactions. Its versatility extends beyond metal forming, finding application in diverse areas of mechanics. This is a development of the method of the harmonic functions of a complex variable in relation to a closed planar problem in the theory of plasticity.
The method’s effectiveness in analyzing dynamic systems is demonstrated [
15]. This work likely focused on transient phenomena and wave propagation within deforming materials, providing a deeper understanding of how the applied forces affect the material’s behavior over time. This dynamic perspective is critical, as the response of the material to the supplemental forces is not static, but evolves throughout the deformation process.
Its application in elasticity, as evidenced by [
16], likely focuses on the elastic response of the material both before and after the onset of plastic deformation. Understanding the elastic behavior is crucial for accurately predicting the overall deformation response and optimizing the control strategies. These works likely explored the stress and strain distributions under various loading conditions, incorporating the effects of the supplementary forces. The analyses may have involved finite element modeling or other computational techniques to solve the complex boundary value problems inherent in the elasticity theory.
The method’s use extends beyond these listed applications; it can be adapted to address a wider range of problems within material science and engineering. For example, it could be employed to model the effects of temperature gradients within the deformation zone, which can significantly influence the material behavior. Similarly, it could be extended to incorporate more complex material models that account for phenomena like strain hardening and strain rate sensitivity, providing even greater accuracy in predicting the material response to applied forces.
Furthermore, future research could explore the optimal design of the supplemental force field, considering factors like its spatial distribution, magnitude, and temporal variation. This optimization would be crucial for achieving precise control over the final shape and microstructure of the rolled material. The potential for feedback control systems, using real-time measurements of the deformation process to adjust the supplemental forces, also represents a promising avenue for future work. These advancements could lead to significant improvements in the efficiency, precision, and quality of metal-forming processes, ultimately leading to the production of higher-quality metal products.
The unevenness of plastic deformation during rolling has been studied by many researchers. This issue is especially relevant when rolling long profiles. This is due to the fact that the profiles have a simple or complex shape, but with one common geometric factor associated with different thicknesses in the width of the deformation site. To solve this technological problem, it is necessary to have uneven deformation along the roll width, which was assessed as a negative factor in supporting the process.
One of the disadvantages of solving actual production problems was the use of a linear problem of plasticity theory. In a framework that did not take into account the features of the process in a single focus of deformation, the problem was solved separately for the lag and advance zones, which did not allow us to take into account the interaction of differently loaded sections in a single deformation focus or assess the effect of loading asymmetry.
During the transition to a new level of scientific development, the development of variational principles in the processes of continuum mechanics furthers the development of the calculation methods—the finite element method—boundary surfaces, and the use of problem solutions using digital technologies.
Despite this, in most solutions, there is one common feature, there is no closed solution to the problems of continuum mechanics. The problem is solved either in stresses or deformations (strain rates) without taking into account the temperature factor, which limits the reliability of the result. For example, in variational problems (hence, in the finite element method), the functional varies either in deformations or stresses, which is not enough for a closed solution. In this case, the functional must be varied both in terms of deformations and stresses. However, this is practically not carried out due to the cumbersome calculations and the additional variation of the functional voltage. This limits the reliability of the result. It seems that at this stage of the development of continuum mechanics, tasks should be posed and solved in a closed manner. There should be comprehensive approaches to stresses, strain rates, and temperature problems, then many restrictions could be removed, which would enhance the practical result. In this paper, the stress problem is considered, but the stresses are the result of solving a closed planar problem in the theory of plasticity. This makes it possible to set and solve a problem of particular complexity related to the asymmetry of loading in different directions.
3. Development of the Theory and Mathematical Model for Controlling Additional Impact on the Plastic Deformation Zone
The shift from symmetric to asymmetric loading in plastic deformation significantly alters the theoretical framework and computational complexity. This force shift necessitates a re-evaluation of the fundamental problem, expanding the scope beyond the simpler symmetric case [
13]. The increased complexity stems primarily from a dramatic increase in boundary conditions. While symmetric deformation might involve relatively straightforward constraints, asymmetric loading introduces multiple interacting factors, requiring specification at numerous points along the deforming body’s boundary. For instance, consider a simple tensile test: symmetric loading only necessitates boundary condition specification at the grips, whereas asymmetric loading (e.g., tension with a simultaneously applied bending moment) requires boundary conditions describing both a tensile force and bending moment at each grip. This translates to a significant increase in the number of equations and unknowns in the system.
Furthermore, the introduction of asymmetry necessitates the inclusion of new coordinate functions in the mathematical model to accurately capture the non-uniform stress and strain fields. Variables like AΦ and θ, representing a potentially angular displacement and stress orientation, now become crucial parameters, leading to a higher-dimensional problem compared to the symmetric case. Finding analytical or numerical solutions thus becomes significantly more challenging, demanding more sophisticated computational methods like finite element analysis (FEA) with advanced meshing techniques to handle the non-uniform stress concentration. The enhanced computational complexity arises from the need for a finer mesh resolution, particularly at the points of a high stress concentration that are hallmarks of asymmetric deformation. The physical model, as illustrated in
Figure 1, explicitly highlights this increased complexity, demanding boundary condition satisfaction at four distinct points instead of two, typical of the symmetric scenario. This increase in the number of boundary conditions directly impacts the computational time and resource requirements of any numerical solution strategy. Finally, the force characteristics themselves undergo a profound transformation under asymmetric loading, deviating significantly from the symmetric case and exhibiting a more complex relationship with the deformation parameters. This necessitates advanced constitutive models that can accurately capture this anisotropic plastic behavior.
Using the physical model of the additional impact and a new method of solving problems of continuum mechanics, the “method of argument of functions of complex variable” [
15,
16], the closed problem of plasticity theory [
6] was solved, on the basis of which the theory of the asymmetric loading of a plastic medium from the roll side of a rolling mill was developed.
We have a statement system of equations for the closed problem of plasticity theory [
25], which includes equilibrium equations, the Huber–Mises plasticity condition, coupling equation, volume constancy condition, and equation of the continuity of the strain rates, heat conduction equation, and boundary conditions:
Boundary conditions:
where
σx, are normal stresses;
τxy is the tangential stress;
k is the plastic shear resistance (variable);
ξx,
ξy,
γxy are linear and shear strain rates;
T is the metal temperature at a given point; and
,
are the boundary conditions in the stresses and strain rates.
In [
13], and in this study, based on the solution of the closed-loop problem, the asymmetric interaction is considered, with a simplified formulation of the system of equations. In this case, the condition of the coexistence of strain rates in stresses is added to the positional system:
The limit conditions are as follows:
Considering the equilibrium equations and plasticity condition, after the joint solution of the system, we obtained a generalized equilibrium equation [
26], in the form of:
where
is the tangential stress intensity.
Using the constraints in the nonlinearity and the fundamental substitution, we have the tangent stress for Equation (6):
where
are unknown arguments of the coordinate function determined by the solution of the problem. Expression (7) assumes two substitutions, a trigonometric one and a fundamental one. Trigonometric substitution is used to linearize boundary conditions and the differential Equation (6); the fundamental one is used in solving linear partial differential equations. In order to obtain the result, we write Equation (6) in terms of a function of a complex variable. The tangential stress of expression (7), taking into account the complex variable [
27], is as follows:
where
is the parameter defining the dimensionality of the stresses. The function
sets different boundary conditions at the entry and exit of the deformation zone, which corresponds to the physical model of the process.
The right part of Equation (6), taking into account the complex variable, is as follows:
In accordance with (6), the second coordinate derivatives are determined [
25] as follows:
and further:
Substituting (10), (11), and (12) into the differential Equation (6), after some transformations, we obtained [
25]
With different exponents, we have two operators with the same brackets
. By taking them as equal to zero, the non-linearity disappears in expression (13), and simplifications take place:
The Cauchy–Riemann relations appear as follows:
It can be shown using the Cauchy–Riemann relations that the operators in the parentheses are zero, then after simplifications, we have
Taking the second derivatives as equal to zero in the last expressions (13), we are able to obtain the identity. Thus, dependence (6) identically satisfies the differential Equation (6), provided that the Cauchy–Riemann conditions and the Laplace differential equations are fulfilled:
When closing the differential Equation (13), it can be shown that one of the solutions of the equation is the function:
where
,
,
, and
are the integration constants determining the boundary conditions at points 1, 2, 3, and 4,
Figure 1.
The solution considers the case when the value of
is variable. Using (7) and (8), substituting them into the differential equations of the equilibrium after differentiation, we obtain
where
is the mean normal stress, determined by the differential equation of the jointness of the system (4).
We determine the normal components of the stress tensor. By considering the deviatory component of the normal voltage
, separating the variables, and integrating the expression, we have
The expression can be simplified by introducing the notation:
By taking this integral in parts:
By denoting the variables:
The integral can be simplified by using the Cauchy–Riemann differential relation of the form (11):
By substituting the variable, we obtain
By writing down the deviatory component, taking into account the integral
and the Cauchy–Riemann relations:
Similarly, we define the deviatory component
and, therefore, we obtain
The unknowns are the average normal voltage
and the integral characteristics
and
. For their compatibility with the solution of the problem, we use the equation of the continuity of deformations (4):
Taking into account expression (13), we determine the average normal voltage:
We show that the right-hand side of expression (16) is the solution of differential Equation (18). Taking into account (16), (17), and (18), the first derivatives can be written down:
The change in the sign is determined by the solution of the problem. After differentiating the equations, integrating them in parts, and using the Cauchy–Riemann relations (15), in the absence of the second derivatives of the variable
, we obtain the identities in the form:
Thus, the equation of the continuity of deformation will be identically satisfied, i.e.:
The identical satisfaction of the continuity equation presupposes the following:
For partial derivatives up to a constant of integration, we can assume the following:
Taking into account the latest transformations, we have
The normal voltages can be rewritten taking into account (17):
The obtained result (21) satisfies the Huber–Mises plasticity condition; therefore:
As can be seen, solution (21) uniquely satisfies the stated system of Equation (4). Based on the obtained solution, the plasticity condition can be implemented under other conditions when both stresses have the same sign. This conclusion follows from Mohr diagrams. In metal pressure treatment processes, this is a minus sign. The plasticity condition will be satisfied when:
In expressions (16), this can be carried out by using the average normal voltage, in the form:
It was shown in [
13,
16] that such a representation of the average contact stress satisfies the equations of the continuity of deformation (18).
As a result, the solution of the posed system of Equation (4) using the method of the argument of the functions of a complex variable is made up of the components of the stress tensor of the form:
by
It should be added that the functions θ and AΦ, unknown at the beginning of the argument, are fully identified due to the Laplace equations and the Cauchy–Riemann differential relations. The peculiarity of the generalized method is that it is not the solutions themselves that are obtained, but the conditions of their existence.
To use the mathematical model (19), it is necessary to know the values of the arguments of the functions
θ and
AΦ and the boundary conditions defining the integration constants. To identify these functions, it is necessary to solve the Laplace equations and satisfy the Cauchy–Riemann relations (19). The solutions have shown:
Knowing the first argument function
AΦ (23), using the Cauchy–Riemann relations (14) and the second Laplace equation, the second argument function
θ is determined. To do this, it is necessary to take the partial derivatives of the
AΦ function in the coordinates. The partial derivatives have the form:
Substituting the derivatives into the Cauchy–Riemann relations (14), we have
Integrating over our variables, we obtain the following:
where
,
,
, and
are constant values determined by boundary conditions at four points. The function
θ (24) satisfies the Laplace equation and functionally determines the effect of the contact surfaces of two rolls. The expression for determining the variable
is shown by expression (12). Dependencies (12) and (20) allow us to determine constant values for the four control points of the deformation focus: two at the entrance to the deformation site and two at the exit from the site on the side of the upper and lower rolls. Each of these points has its own boundary conditions that need to be set. To do this, we use boundary conditions of the form:
where
are the plastic shear resistance for the four fixed points at the entry and exit of the deformation zone. Each point is fixed by boundary coordinates and is assigned its own purpose. Using boundary conditions, it is possible to fix the expression of the constants
,
,
,
(12).
The above boundary conditions determine much of the orientation of the problem, with their mechanical characteristics, while:
To simplify the analysis and generalize the result, the stresses were determined in relative terms, divided by the resistance to plastic shear. Such a complex design of loading asymmetry interactions in different directions makes it possible to visually obtain the characteristics of the stress state of the medium at each point of the plastic flow zone. If you substitute the intermediate Expressions (12), (20), and (21) into the basic Formulas (19), we can finally obtain working calculation expressions for determining the stress state of the plastic medium under conditions of a controlling effect on the deformation focus.
at
The model presents four different directions that form the asymmetry of the deformation and force loading between the working rolls in the height and length of the deformation focus. The model is constructed in such a way that if one of the four fixed points is considered, then the rest are eliminated from consideration. For example, if we consider a roll whose position in space is determined by the condition y = (h(x))/2, in this case, expression (22) is simplified by eliminating dependencies for the lower roll. At x = −l/2, the dependencies associated with the advance zone for the upper roll are eliminated. By reducing expression (27) to a special case, a symmetrical process relative to a horizontal line, we can compare the calculated data with the experimental data [
21,
22]. The authors of [
21,
22] conducted experimental studies on the measurements of contact-specific pressures using point measures.
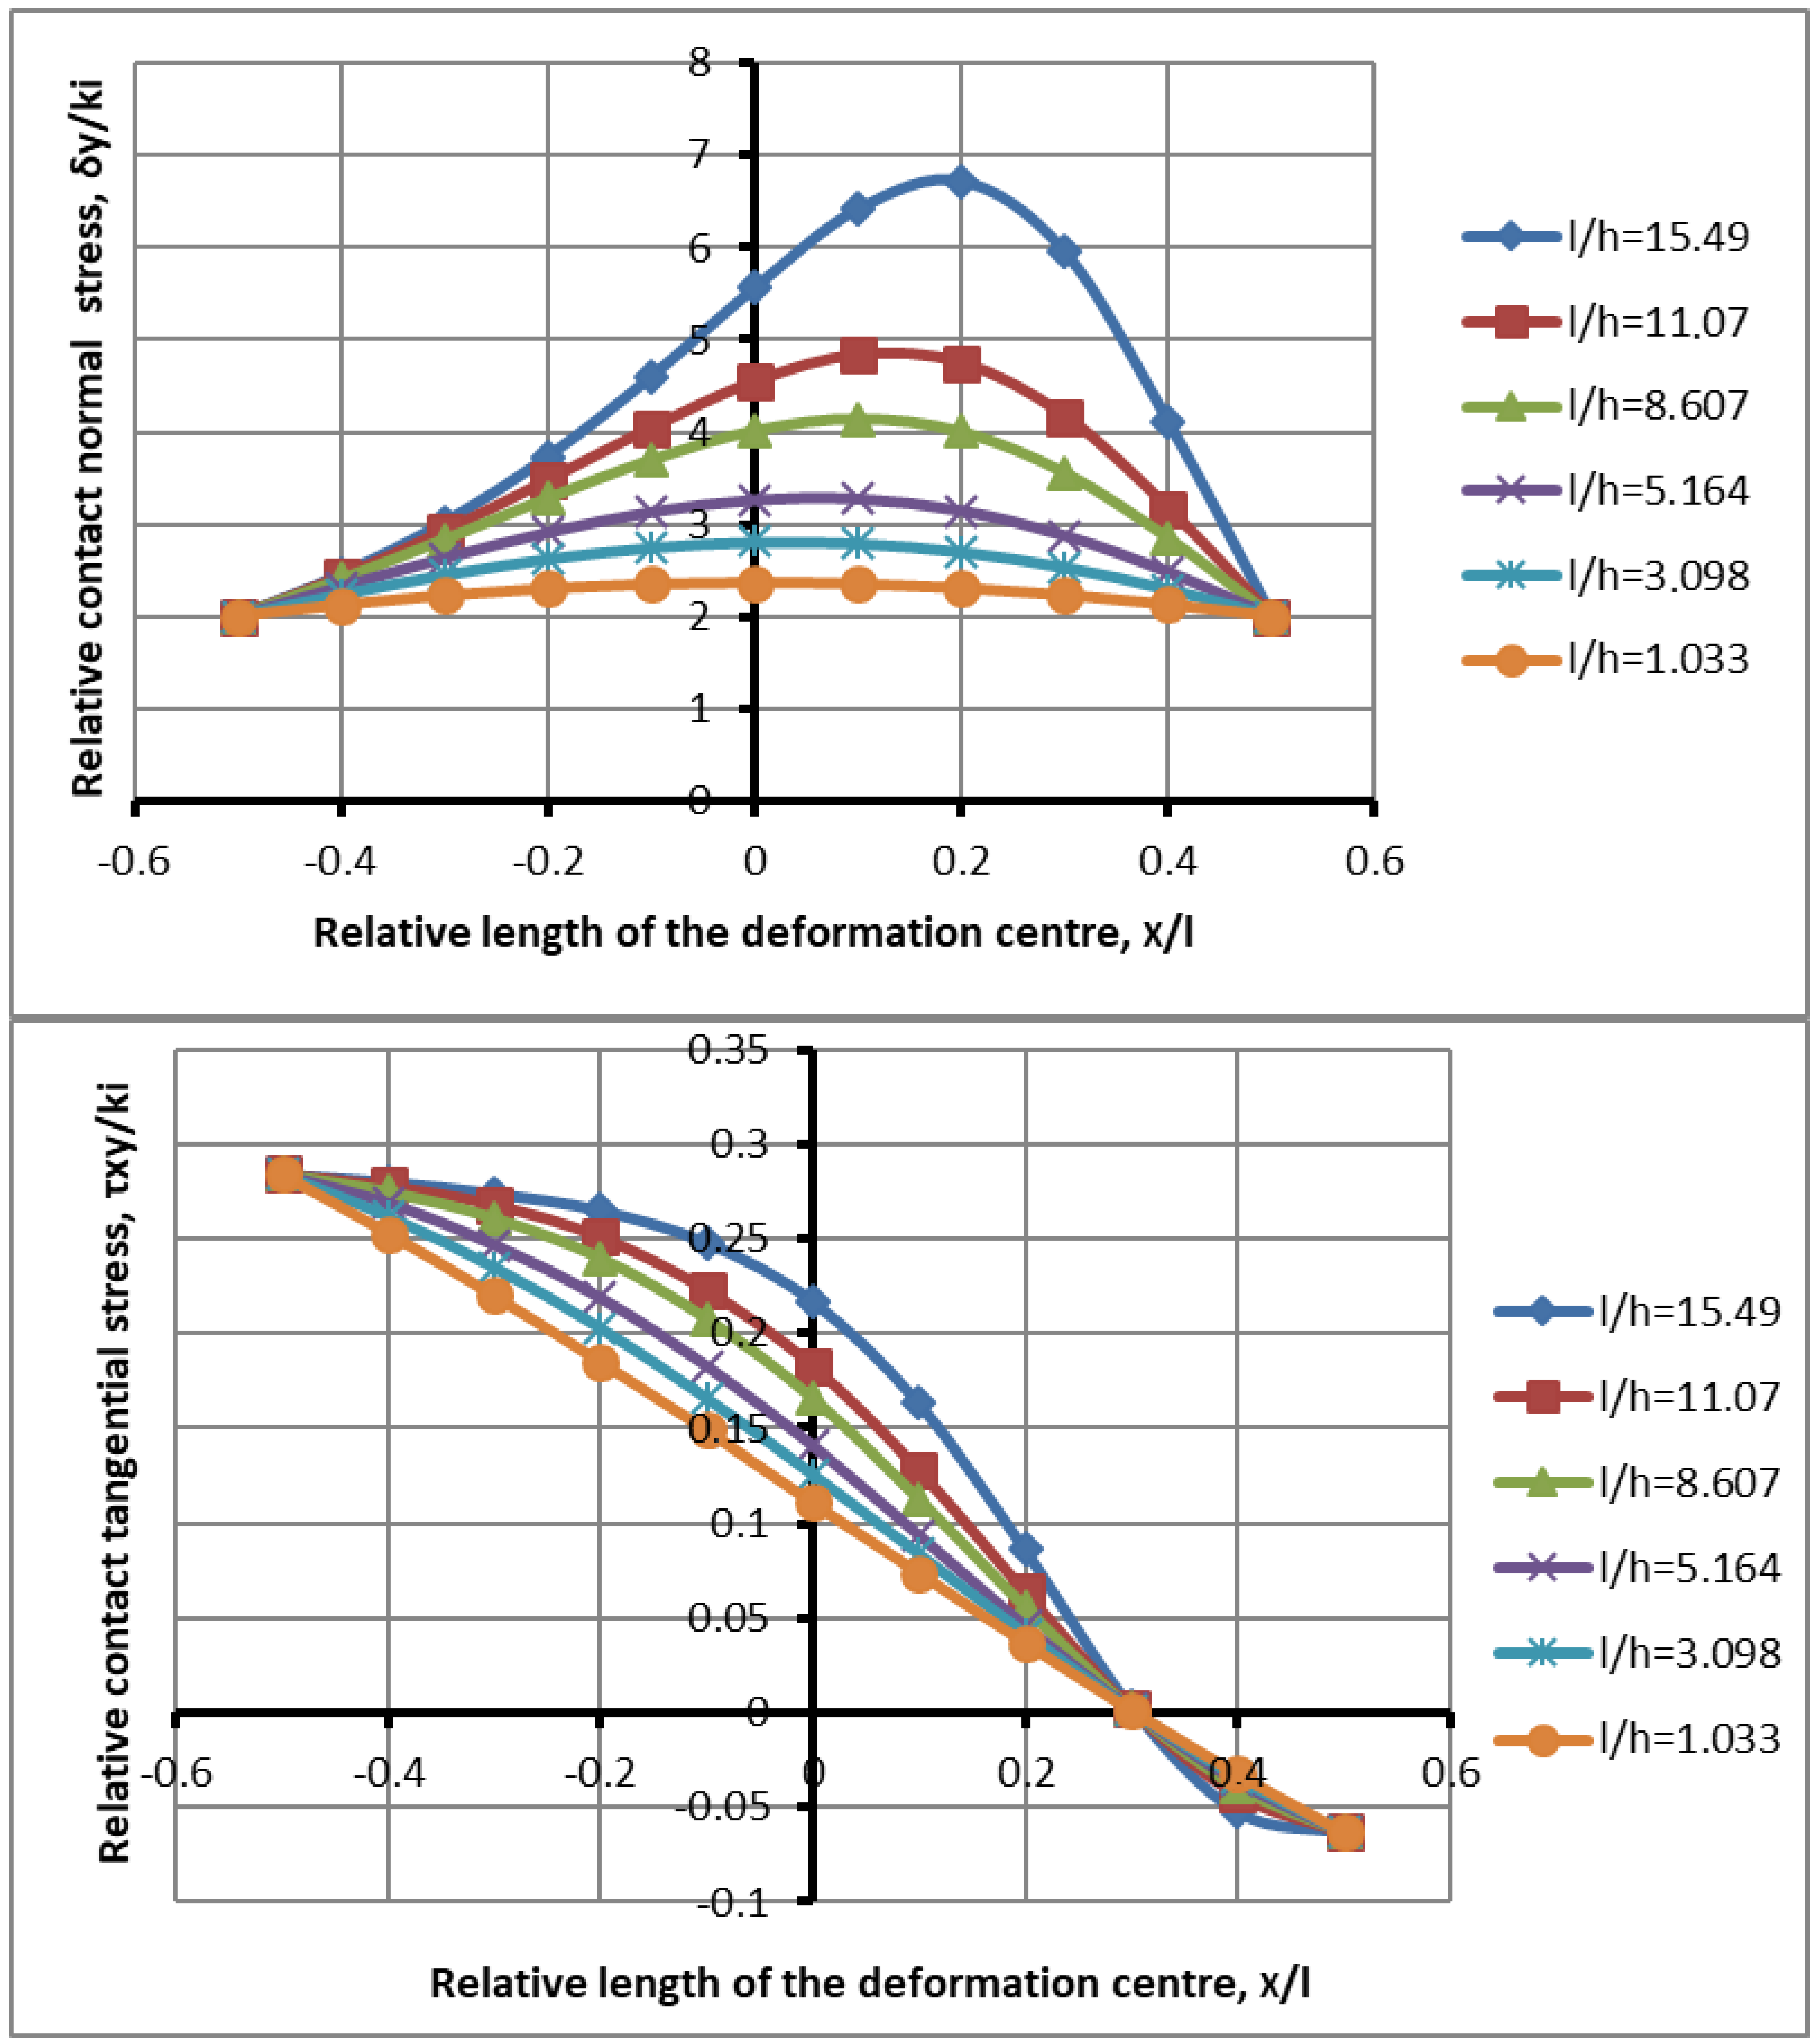
Figure 2 and
Figure 3 show the distribution of normal contact and tangential stresses along the length of the deformation zone at different parameters of the shape factor, friction factor, and reduction for a symmetrical process along the height of the deformation zone, in accordance with expression (27).
In the case of the process shown in
Figure 2, the distribution of contact stresses along the length of the deformation zone is shown for a symmetrical process, with a friction factor
, gripping angle
, and shape factor values
.
A comparative analysis of the experimental data from [
22] with the theoretical calculations presented in
Figure 2 reveals a qualitative agreement in the contact stress distribution during metal rolling. Both datasets demonstrate that increasing the shape factor leads to higher contact stresses, with the stress maximum shifting towards the exit of the metal from the rolls. A shape factor near unity results in minimal specific pressures, exhibiting a symmetrical and nearly uniform stress distribution for a given friction coefficient. This observation highlights the significant interplay between the shape factor and stress distribution.
Figure 3 shows the process of the loss of stability at low values of the coefficient of friction.
In quantitative terms, there are certain discrepancies between the compared values since the theoretical data are presented in relative terms, while the experimental data are presented in absolute terms. If 40 MPa is taken as the base, using the capabilities of the mathematical model, it can be recalculated and compared with the experimental values [
21],
Figure 2. For example, the maximum numerical value of the experimental plot is 185 MPa, with a shape factor of 6.9. Turning to relative values, we have 185/40 = 4.6. In our case, the maximum value is 4.1. In addition to the shape factor, the coefficients of friction and compression have a great influence. At the same time, in [
20], the plots were compared at different compressions and friction coefficients, which made it possible to recalculate the data. Minor deviations in the shape factor were noted. Having recalculated the experimental data in relative terms, taking into account the above observations, we are convinced of the comparability of the results within 3–7%. Tangential stresses at a given coefficient of friction change sign when passing through zero from the lag zone to the advance zone, which coincides with the experimental data. A feature of the rolling process is the marked deflection of the plots in the lag zone when rolling the medium and especially thin strips,
Figure 2 and
Figure 3 [
13,
22].
As for the reliability of the result, it is achieved not only by comparing experimental and theoretical data, but also by theoretical approaches to the tasks being solved. When solving a closed problem of the theory of plasticity [
25], when the stress, strain state, and temperature problem are linked into one common solution, the expressions of these variables contain the same functional relationships. Then, it can be argued that the load on the deformation site is not virtual, but real. This is the reliability of the theoretical solution of the problem [
28,
29].
In expression (27), there are differences of
,
,
,
, which are crucial in this decision, where
,
,
,
are the constant values determined by the function θ at fixed points of the deformation,
Figure 1.
Substituting the coordinates of points 1–4,
Figure 1, into expression (24), we obtain the values
,
,
,
. We have the following:
The obtained result (28)–(31) ensures the fulfillment of different boundary conditions at the points of the hearth,
Figure 1, and is used for further analysis. Consider and analyze the difference
,
,
,
, which are crucial in the decision and then write it down:
Differences (32)–(35) are substituted into expression (27) to determine the stress state in the deformation focus. It is of interest to analyze the common blocks of the models in expressions (32)–(35). The structure of the formulas is approximately the same. Odd values,
, characterize the upper roll; even values,
, characterize the lower roll. Each of the four directions has its own set of boundary conditions. The interaction between the upper roll and the lower roll is indicated by the difference between these amounts and adjacent components. If any amount is equal to zero, then the parameters of friction and the angle of the capture of this roll disappear from consideration, meaning that a height-symmetric process has taken place. In this case, we can take
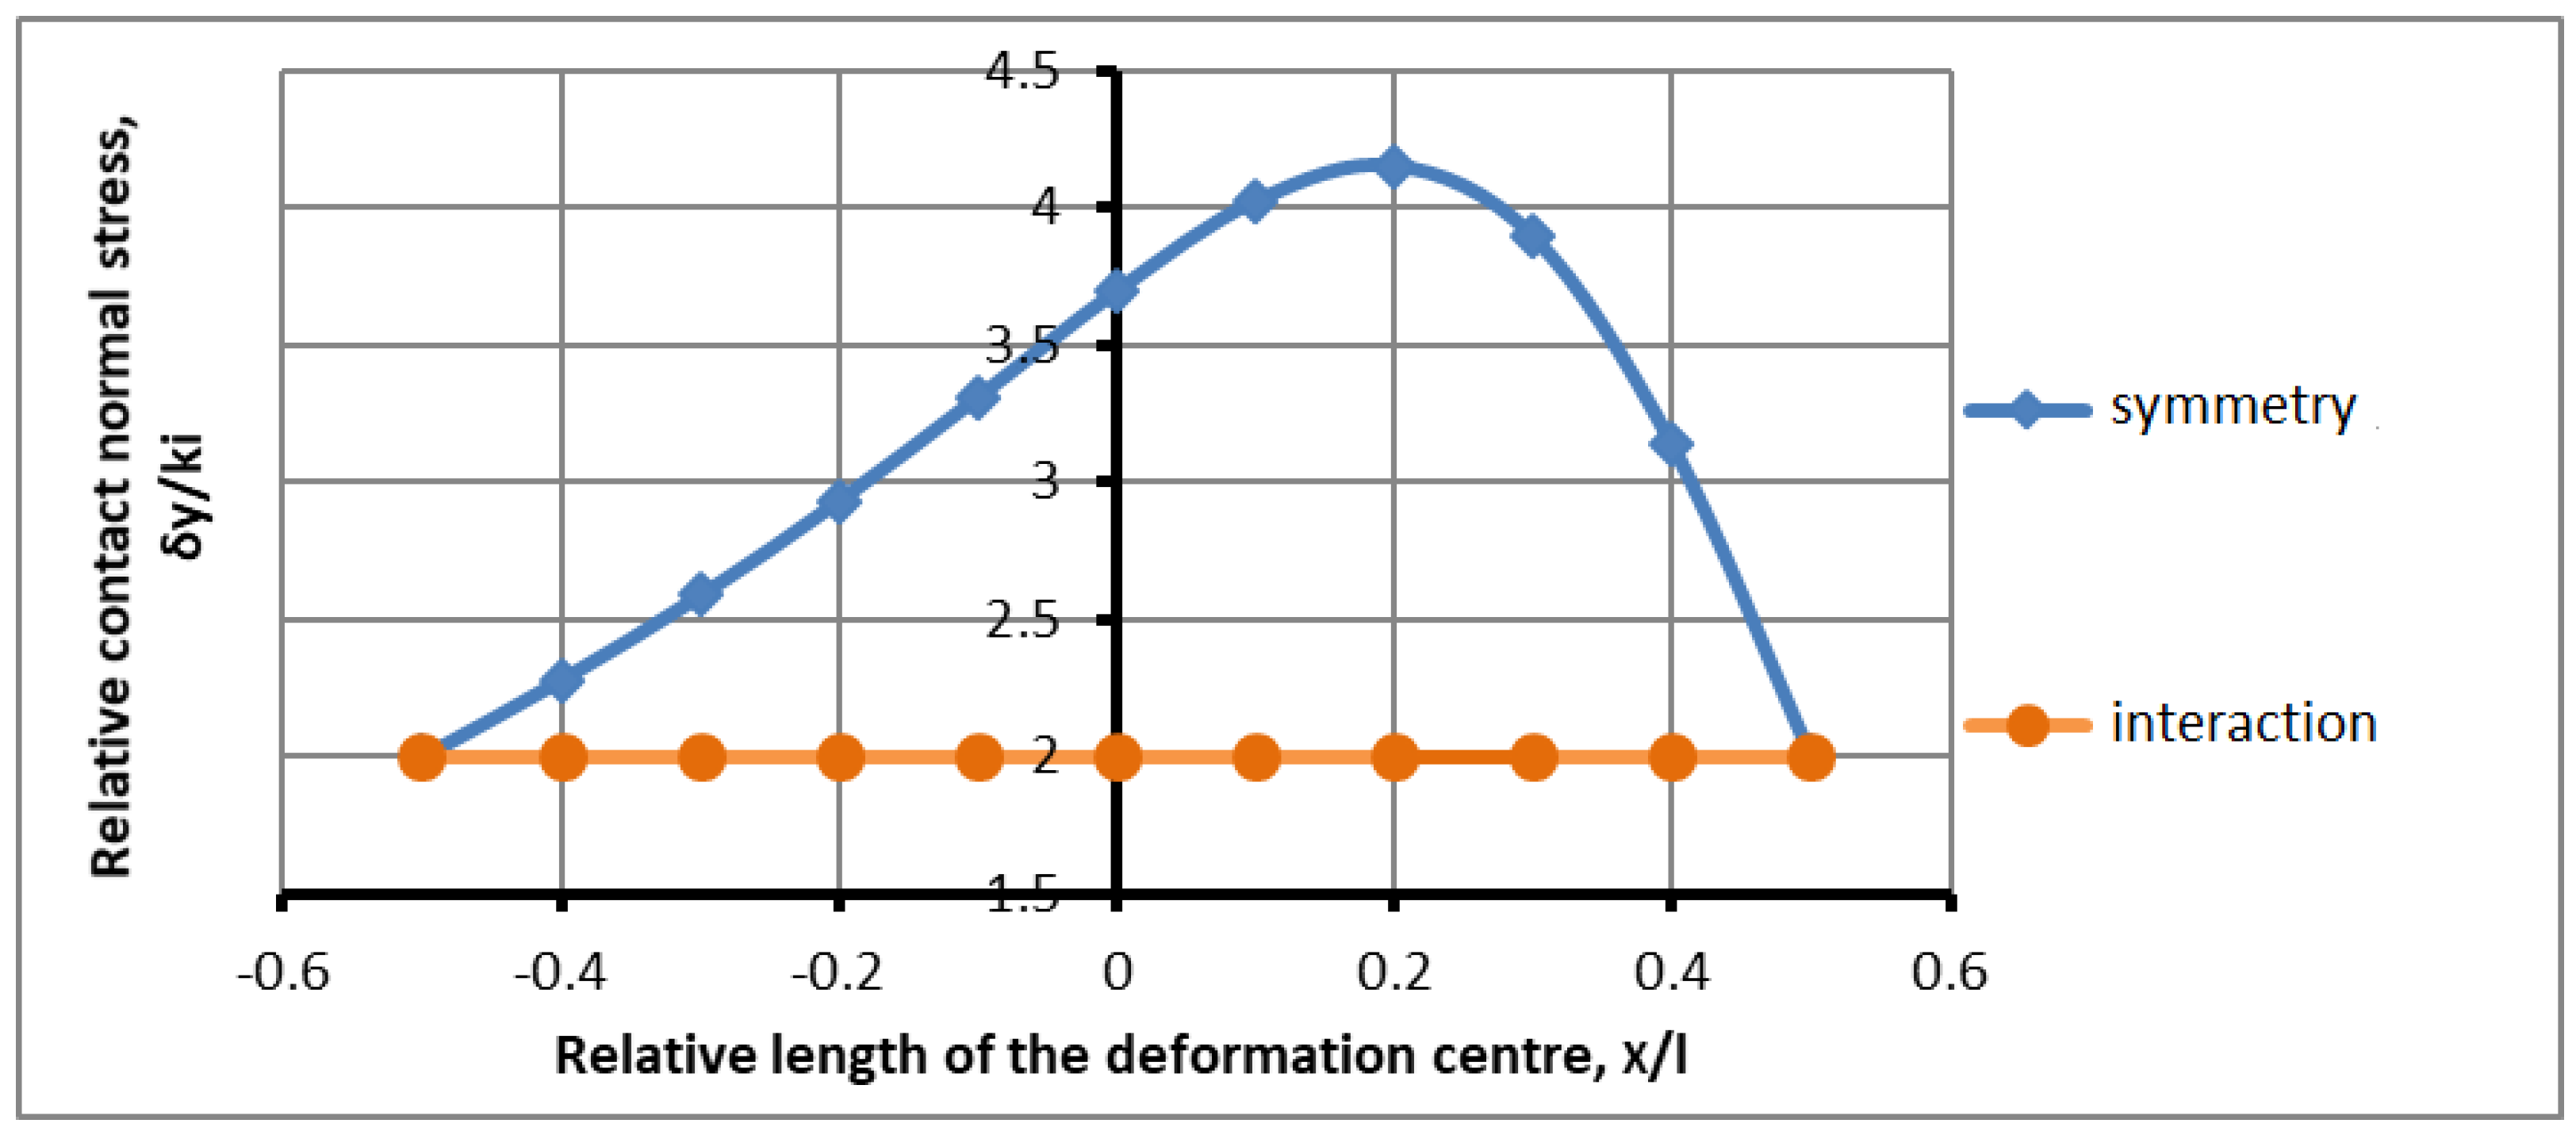
Figure 4 (upper curve).
The symmetry values determine the maximum load. In this case, the simplified mathematical model of the process (27) coincides with the mathematical model of symmetrical rolling work [
20]. If the amounts are non-zero, then there is a difference in expressions (32)–(35), and if the interaction between the rolls is maximal, then the difference tends to zero and the exponent value tends to unity,
Figure 4 (lower curve). In this case, the limits of interaction on the part of the rolls have been determined. The analysis shows that expressions (32)–(35) can be transformed or simplified to the form:
The differences in the interaction between the rolls have been preserved, but in a slightly different combination. Expressions (36)–(39), from the side of the entrance to the deformation site, are the same, equal to zero, and from the side of the exit, they are also the same, equal to zero. In the middle of the deformation site, there is a sufficiently complex interaction between the directions that form an asymmetry of interaction from the rolls and along the deformation site. It becomes necessary to determine the constants
,
,
,
. To determine the constants, we use the expression of the first argument of function (23) and boundary conditions (25), substituting them:
Point 4
where
,
are the gripping angles on the upper and lower rolls;
,
,
,
are the friction index in the lag and advance zones on the upper and lower rolls;
is the length of the deformation focus; and
is the thickness of the compression zone.
Substituting (40) into (36)–(39), we have the following:
where
,
are brackets that define the different types of roughness on the upper and lower rolls and
is the difference that determines the different gripping angles on the upper and lower roll. It follows from the last expressions that the overlap of the lag and advance zones is characterized by inverse differences (41)–(44) in the friction and gripping angles. At the same time:
where
f is the coefficient of friction.
It follows from the last expressions that the overlap of the lag and advance zones is characterized by inverse differences, (41)–(44), in the friction and gripping angles. At the same time, in order to meet the lower limit value, the following conditions must be met:
Taking into account (41)–(44), the following variables are used in the graphical construction:
The differences determine the nature of the interaction of the rolls in terms of the friction, angle of capture, or compression. As the difference increases, the interaction between the rolls decreases and the process approaches the metric process in terms of its power characteristics, i.e., the maximum value. As the difference decreases, the interaction between the rolls increases and the force load of one roll compensates for the increasing force load of the other roll. Overlapping zones appear, with an oppositely compensating effect (contact friction forces). In order to evaluate the regulatory loading associated with the unevenness of plastic deformation in the vertical direction, it becomes necessary to study the effect of this force interaction on the process parameters.
4. Analysis of the Results Obtained
The complexity of the interaction of the differently compressed zones of the deformation focus causes a certain difficulty in analyzing the result. A mathematical model of the stress state has been developed in (27), (36)–(39), (41)–(44), which allows us to present different loading options and schemes under conditions of additional asymmetric control action. The following defining loading schemes are presented. The purpose of this analysis is to adjust the area of the asymmetric impact.
With constant deformation parameters and constant differences in the grip angles, the effect of the contact friction on the nature of the force interaction of variously compressed zones of the deformation focus is investigated. Accepted constant differences in the angles of capture are as follows:
For each value of the angle difference, the following variable values of the friction factor are taken:
Furthermore, with the force parameters unchanged and the differences in the friction factor constant, the effect of the deformation parameter on the nature of the force interaction of the variously compressed zones of the deformation focus is investigated. Accepted constant differences in the friction factors are as follows:
For each value of the difference in the friction factor, the following angle variables are assumed:
The process beyond the implementation of an asymmetric impact is considered. Constant differences in the angles of capture are assumed:
For each value of the difference in the angles of capture, the following variable values are taken according to the friction factors:
Let us imagine the result (27), (36)–(39), (41)–(44), in a visual way and let us analyze it in detail.
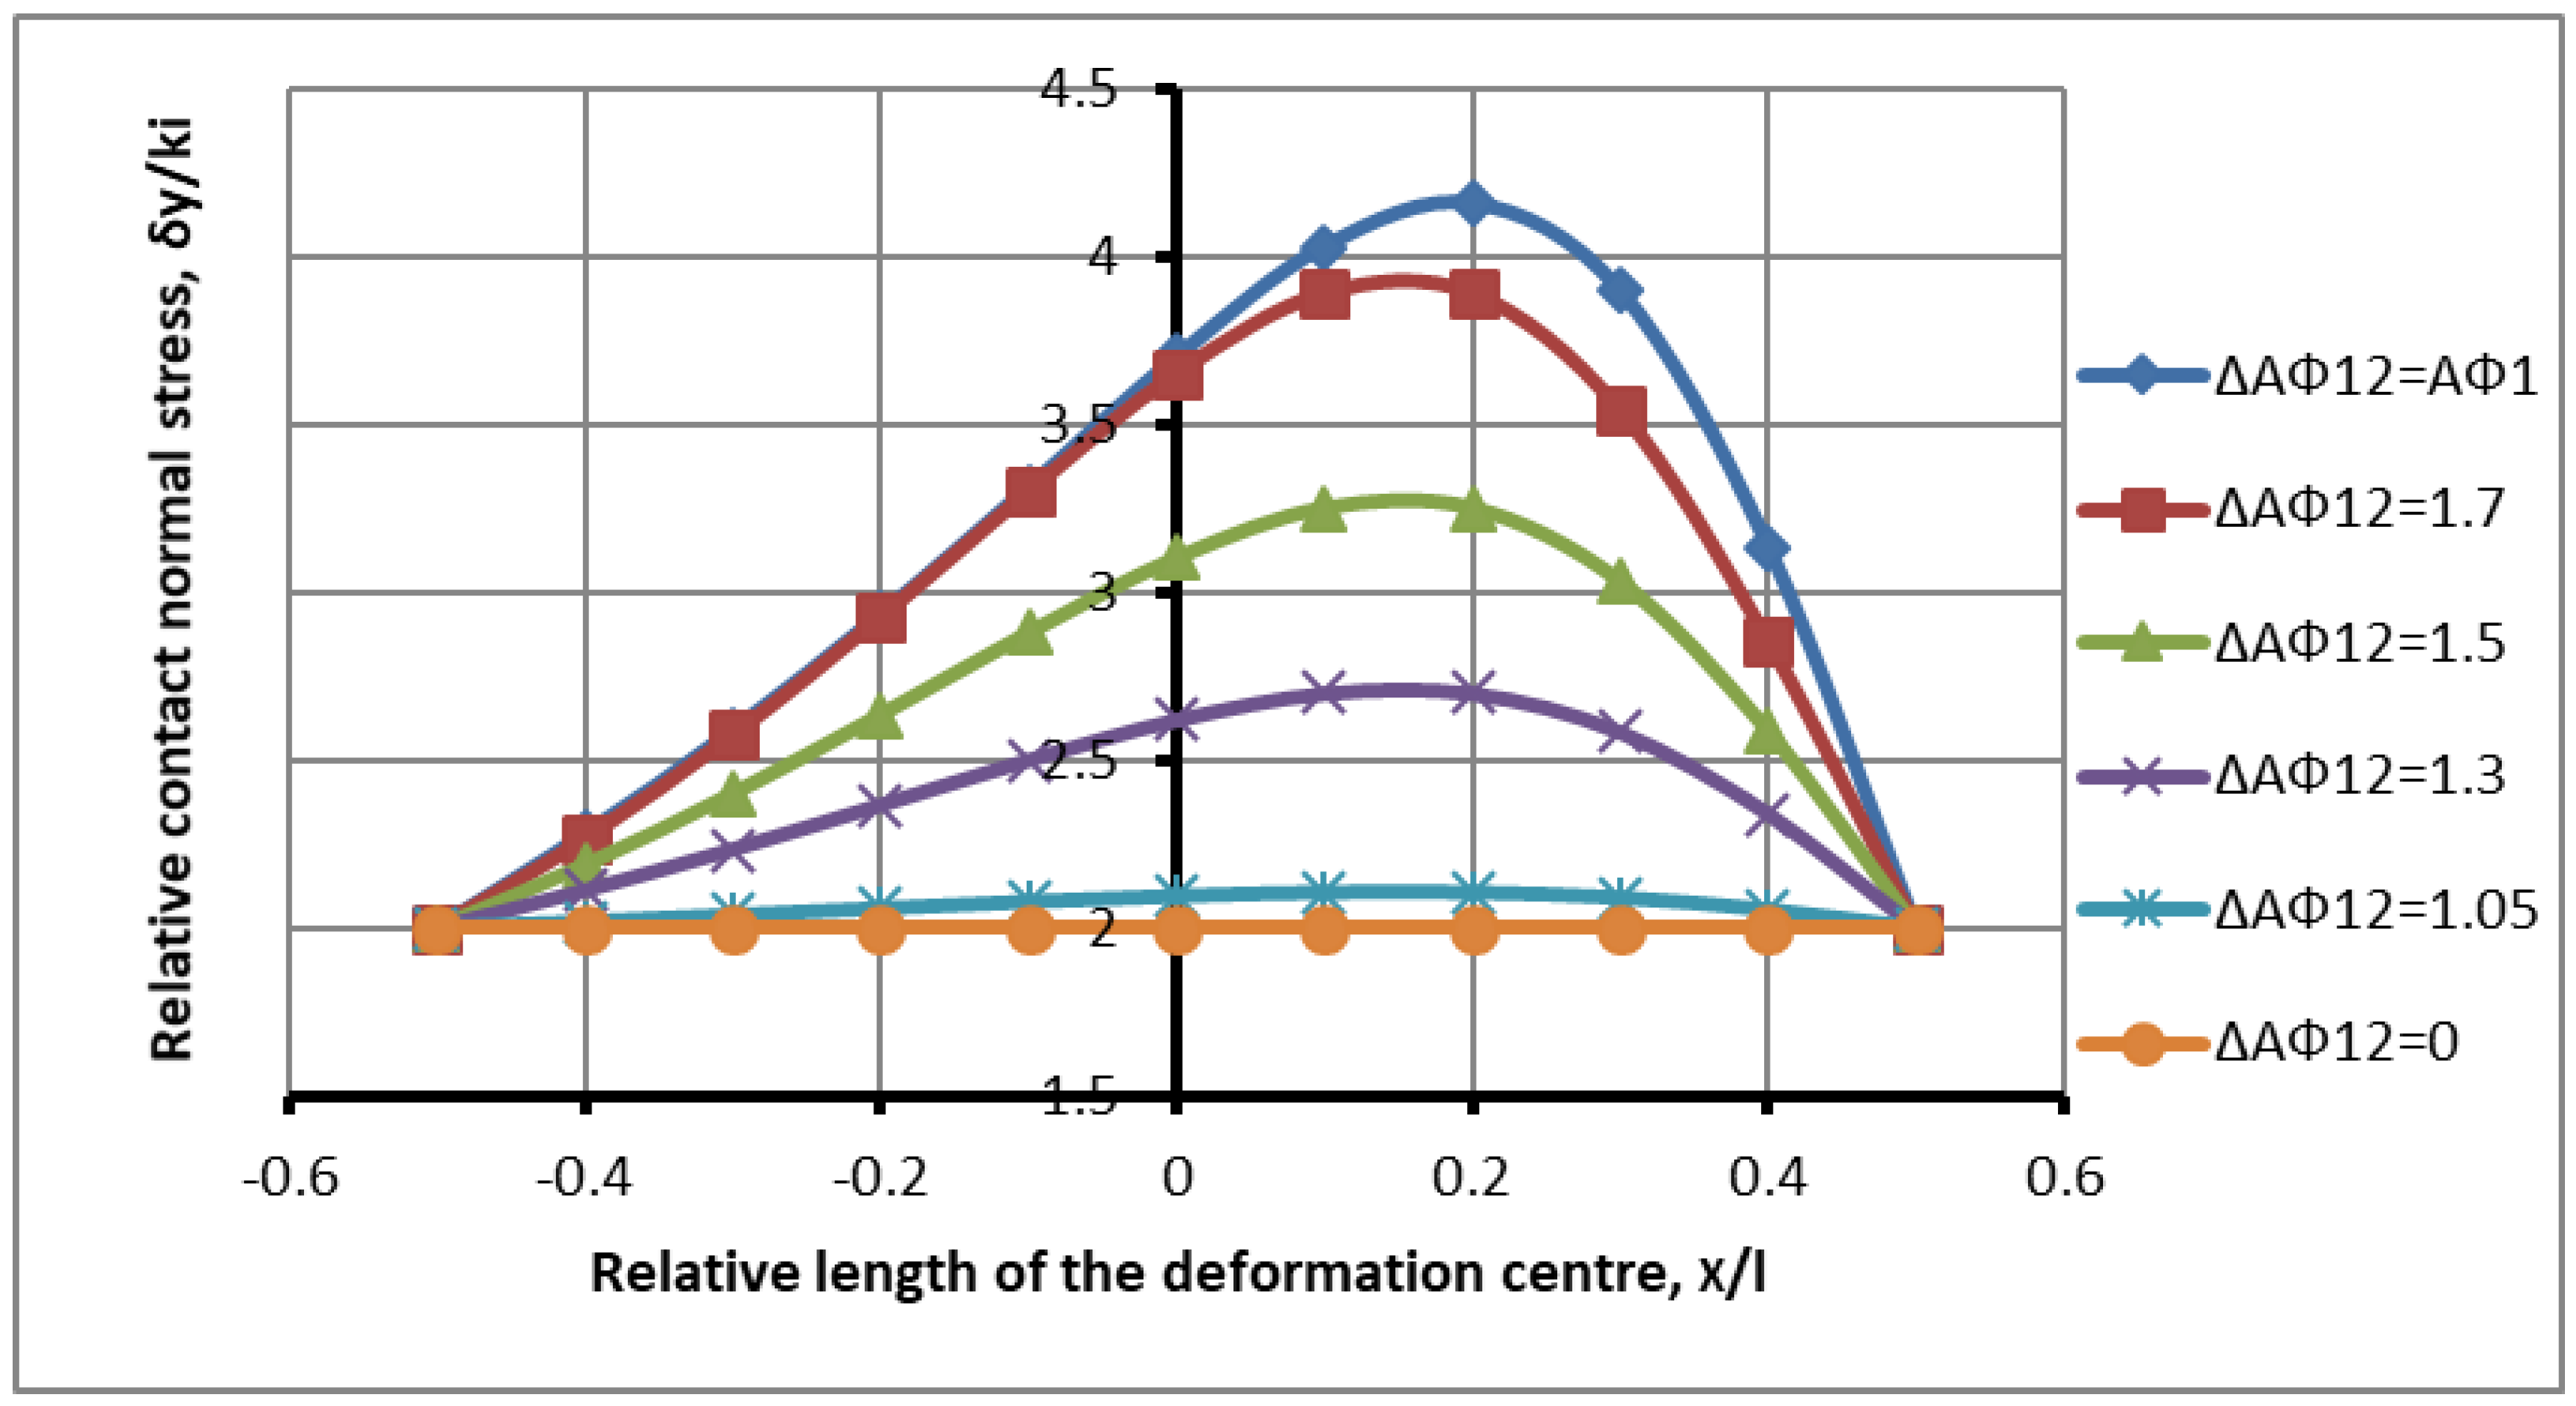
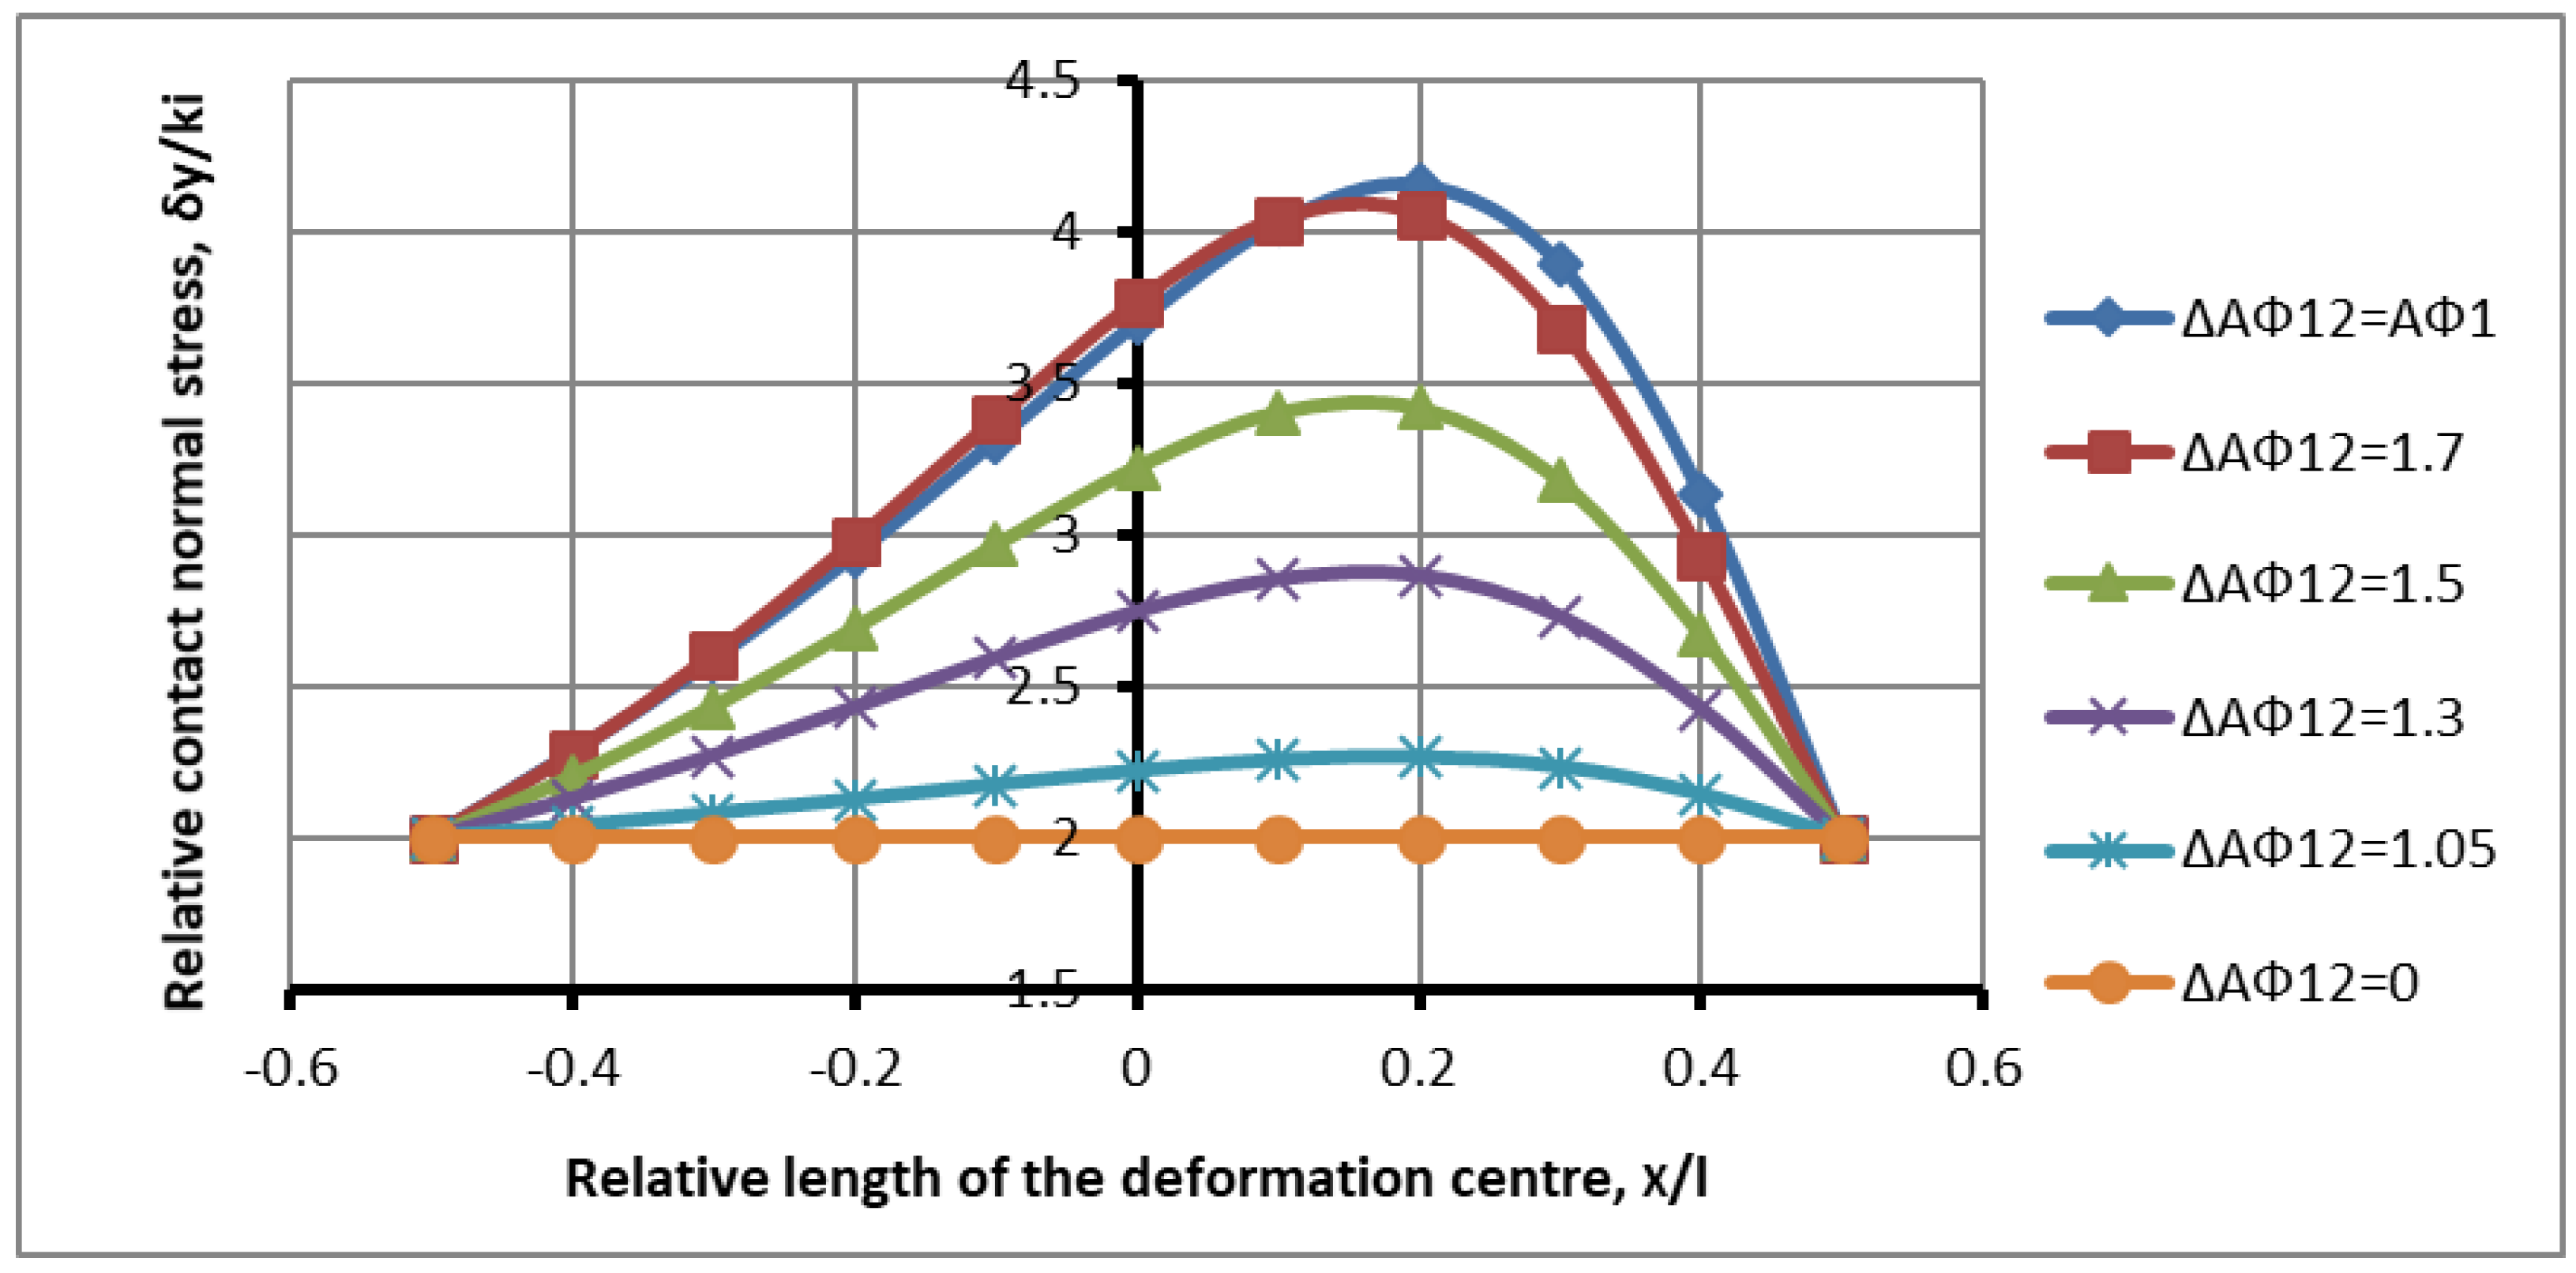
Figure 5 shows the distribution of the contact stresses along the length of the deformation zone at
for different roughness values within the limits
using dependencies (41)–(44).
Contact stresses with an increase in the force difference with a constant strain show an increase in the stress state, with access to the boundary of symmetrical loading in the lag zone. The numerical values of the maximum stresses with an increase in the difference in the friction indices, respectively, with a zero angle difference, are
In this case, the interaction of the zones decreases and the overlap area of the advance and lag zones decreases, hence the influence of plastic shear on the process weakens. The impact from the second roll is reduced and the loading process approaches its maximum value. The contact stress diagrams correspond to the experimental data [
18].
It follows from the graph of the contact pressure diagrams that with the regulating effect on the deformation site caused by the unevenness of the deformation between the rolls, there is a controlled effect of reducing the force load in the deformation site.
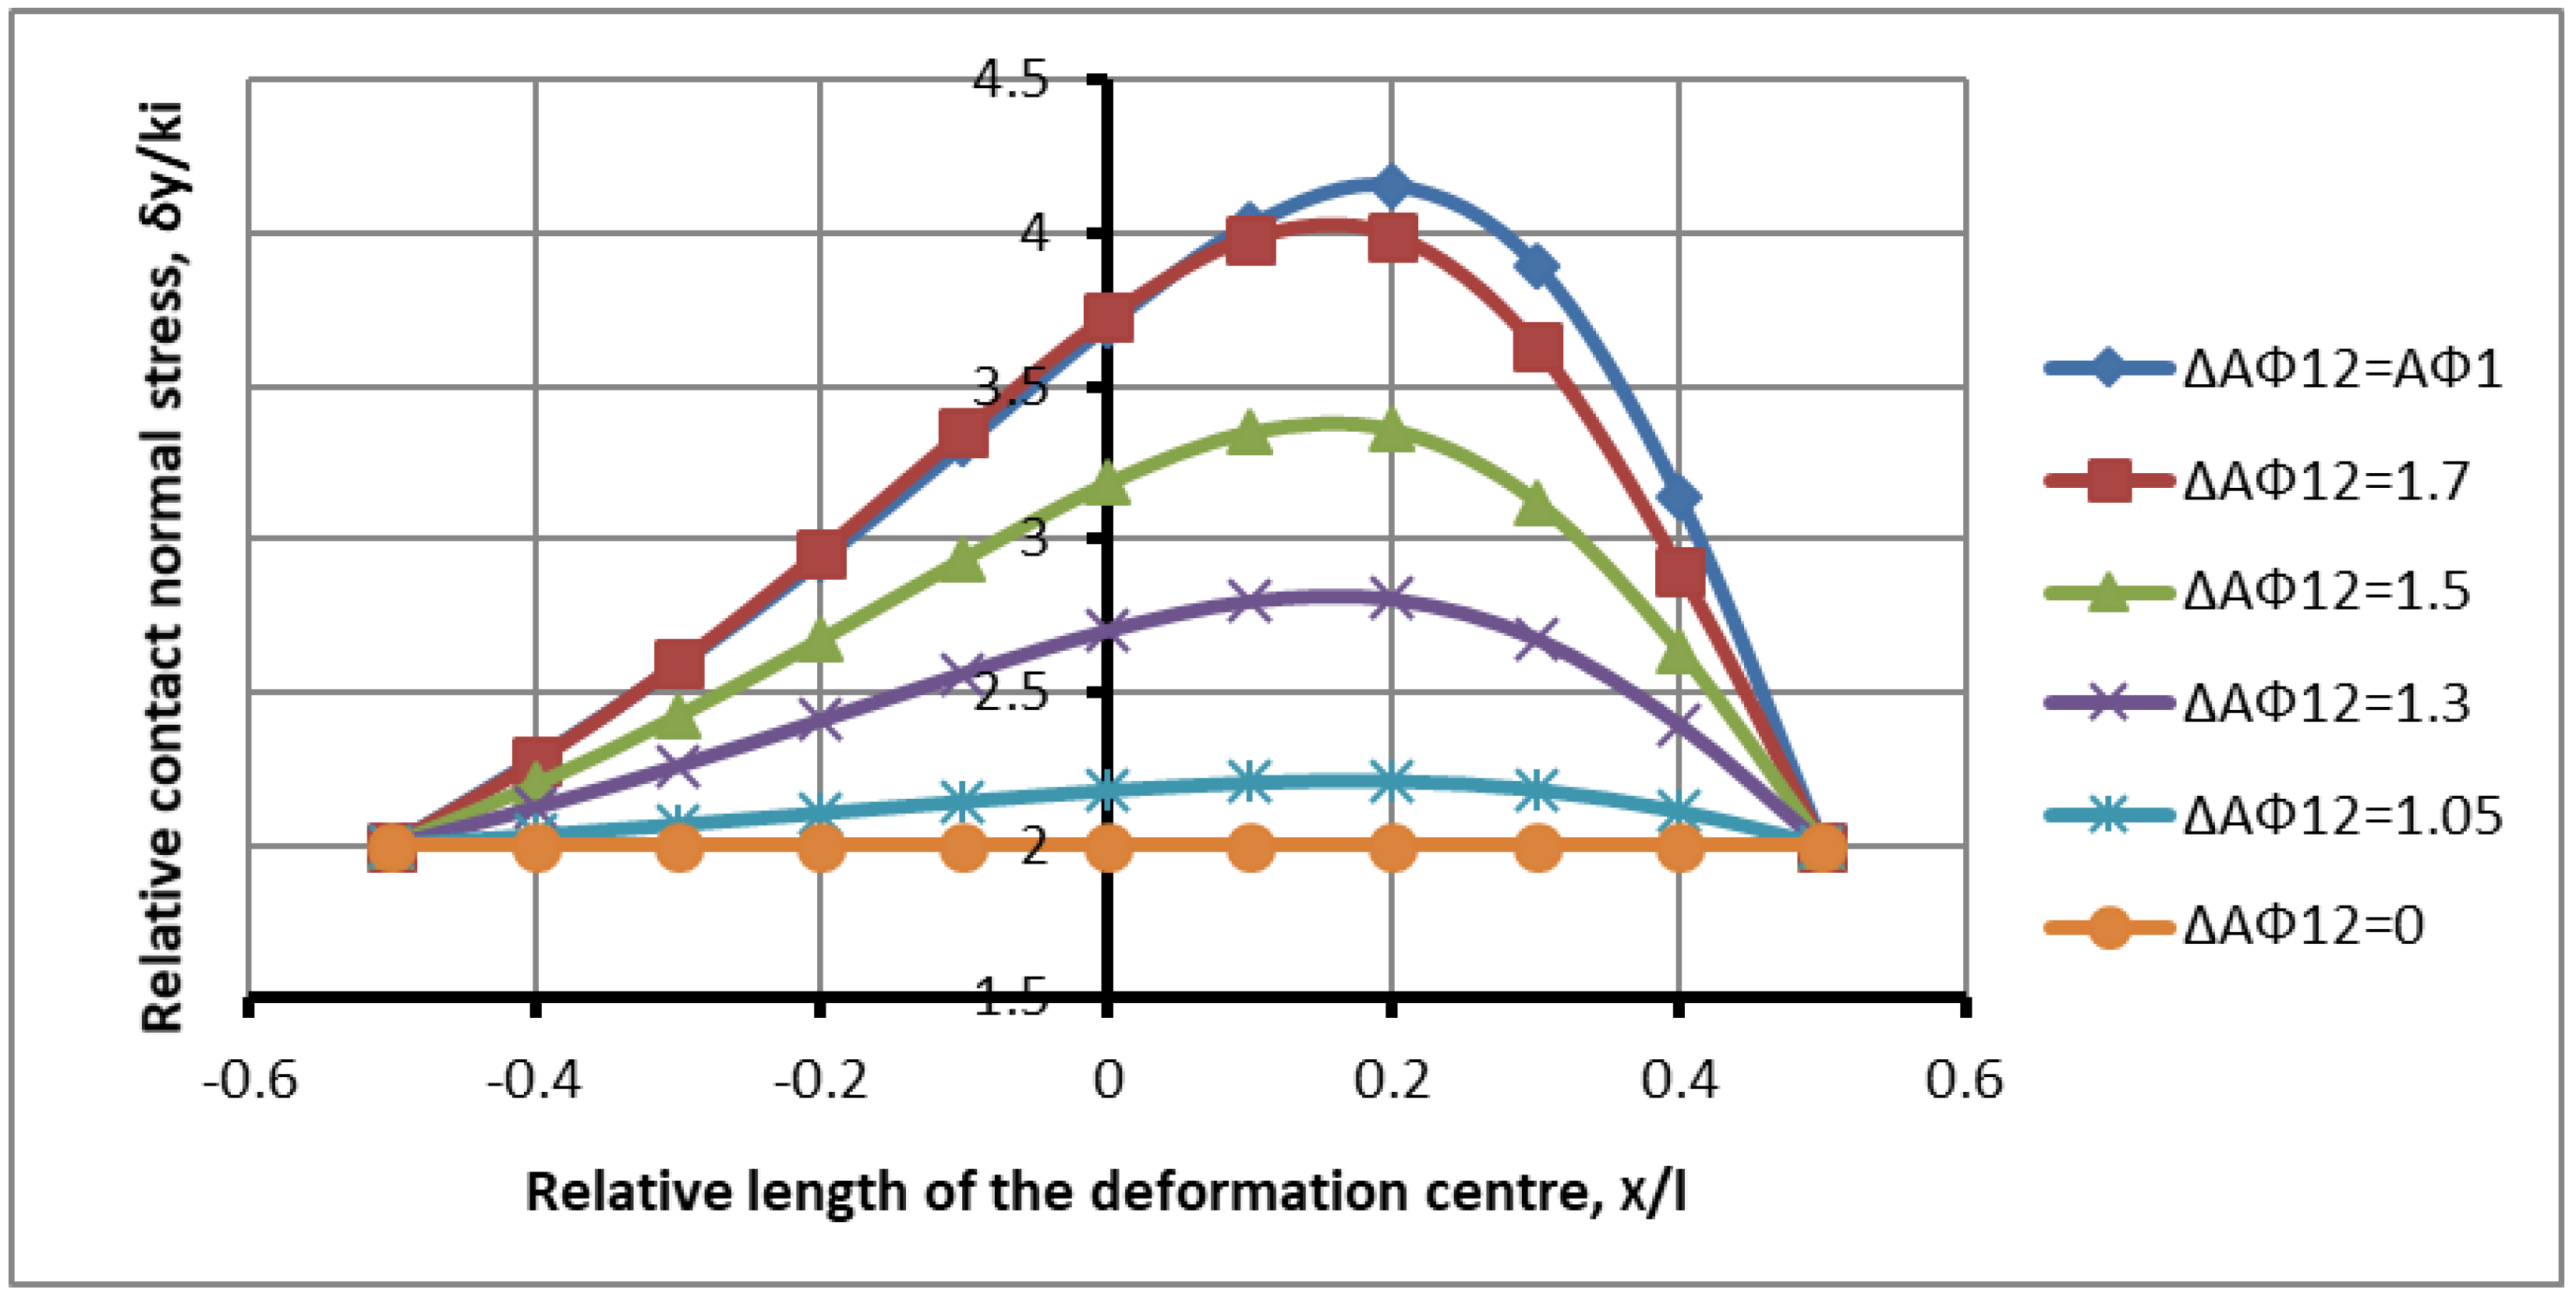
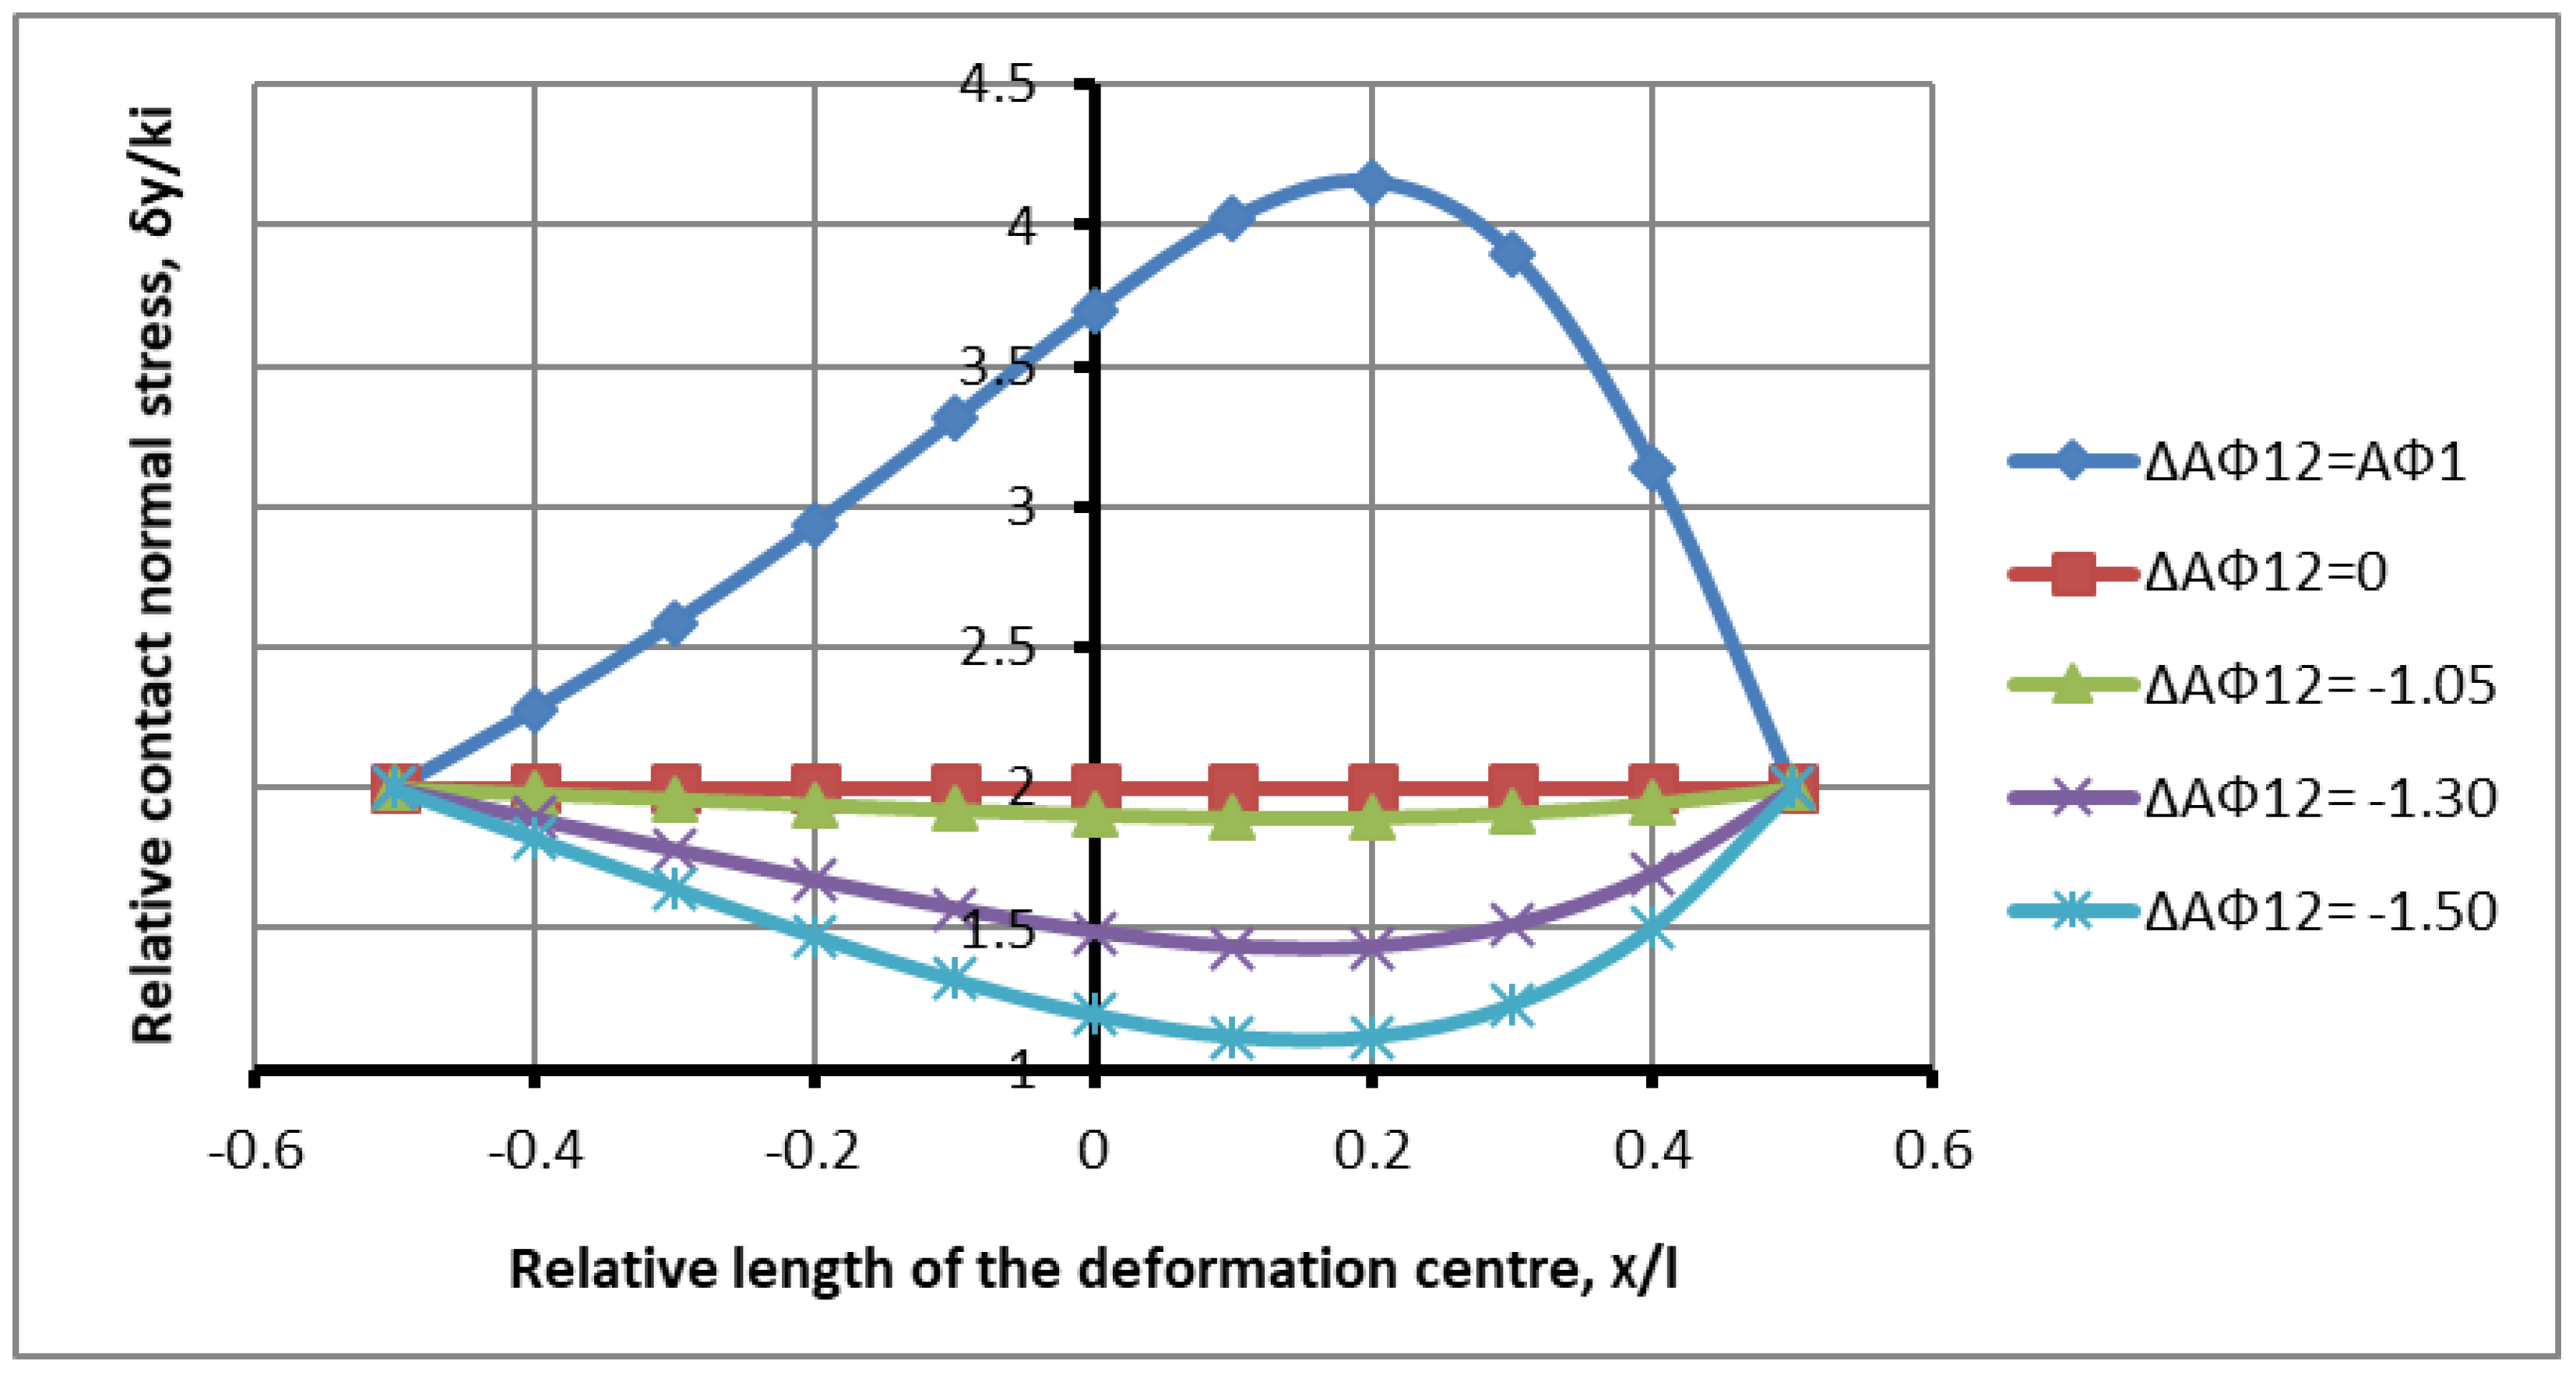
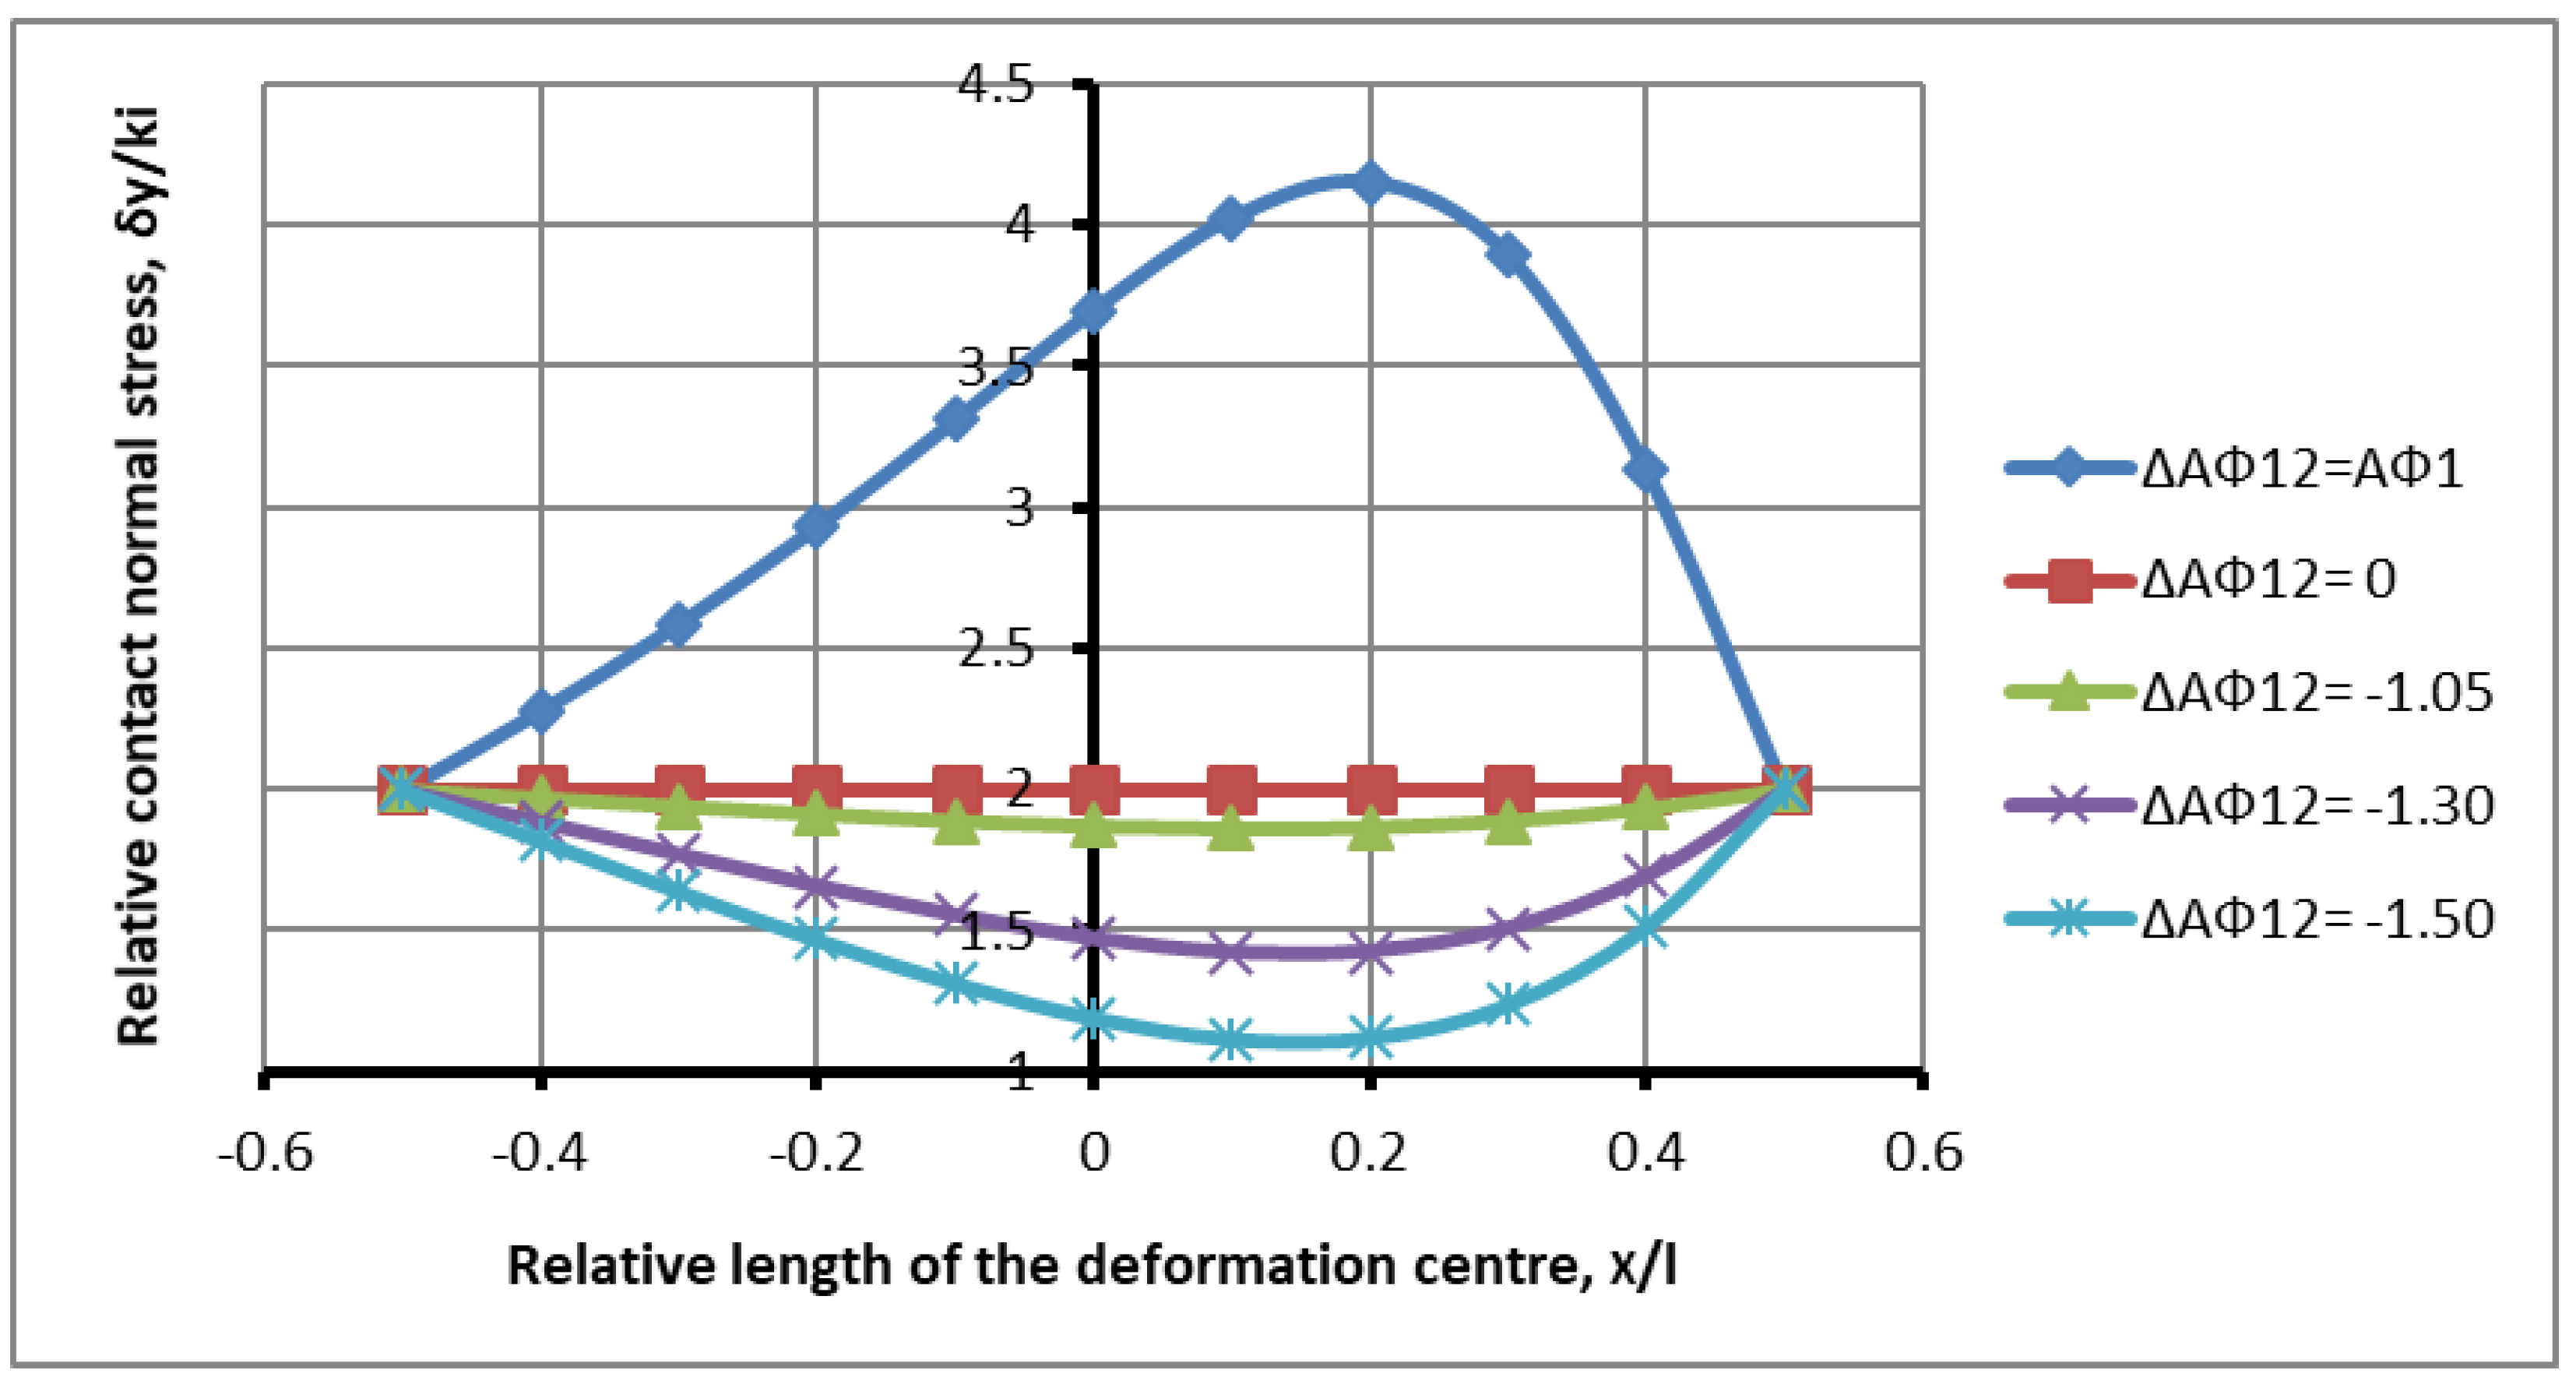
Figure 6 shows the distribution of contact normal stresses for the same friction parameters я
, but with values
From
Figure 6, it is evident that increasing the difference
from 0 to 0.014 with the same friction parameters increases the load on the deformation zone, and the result more actively approaches the symmetrical rolling process. The numerical values of the maximum stresses with an increase in the difference in the friction indices, the increased angle difference to 0.014, respectively, are
In comparison with the data of the maximum stresses in
Figure 5, it can be seen that an increase in the angle difference to 0.014 leads to a slight increase in the maximum stresses, in the range of 3.1–4.7%. The curves of the plots in the advance zone are located somewhat closer to the limit curve of symmetrical loading. It follows that an increase in the difference in the angles of capture and the difference in friction factors leads to an increase in the stress state in the shaping zone.
Figure 7 shows the distribution of the normal contact stress for friction parameters
, for values
.
From
Figure 7, it is clear that the filling of the interlimit space, with an increase in the difference
from 0 to 0.019, occurs at large values of contact stresses, which indicates a decrease in the interaction between the rolls of the system. The influence of the less active roll weakens and the difference increases. The numerical values of the maximum stresses with an increased angle difference, increased to 0.019 depending on the friction factor, are, respectively, equal to:
In comparison with the data of the maximum stresses in
Figure 5, there is an increase in stresses in the range of 3.1–7.1%. At the same time, growth mainly occurs in the lagging area. An increase in the angle difference with the simultaneous action of an unchanged friction factor shows the obvious effect of the difference in the angle of capture on the characteristics of the stress state of the metal in the deformation zone. An increase in the stress state of the medium indicates a weakening of the interaction between the rolls, but the stress plots are located between the limiting curves; therefore, in comparison with the symmetrical process, the interaction between the rolls takes place.
Figure 8 shows the distribution of the normal contact stress for the friction parameters
for the values
Increasing the difference
to 0.025 contributes to a further increase in the influence of friction on the parameters of the stress state of the metal under conditions of non-uniform loading,
Figure 8. Instead of four curves, only three remained due to the increased load, and one curve was beyond the scope of the task. This indicates a significant increase in contact stresses with an increase in the angular difference to a value of 0.025. The maximum contact stresses with an increase in the friction factor are as follows:
In comparison with the data of the maximum stresses in
Figure 5, there is an increase in stresses in the range of 3.1–9.9%.
The mathematical model of the process becomes clear from the presented data (27). There are influencing factors, such as contact friction and the angle of capture, more precisely, compression from the rolls or, even more precisely, the unevenness of compression between the rolls. The smaller the influence of one of the rolls, i.e., the greater the difference between these parameters, the closer the symmetrical rolling process is and the greater the load. There is no interaction between the rolls during symmetrical rolling. The presence of such an interaction is characterized by an asymmetry of geometric, force, and other process parameters.
To make the interaction process obvious and confirm the results, consider a study with constant differences in the friction factor and a change in the difference for the gripping angles.
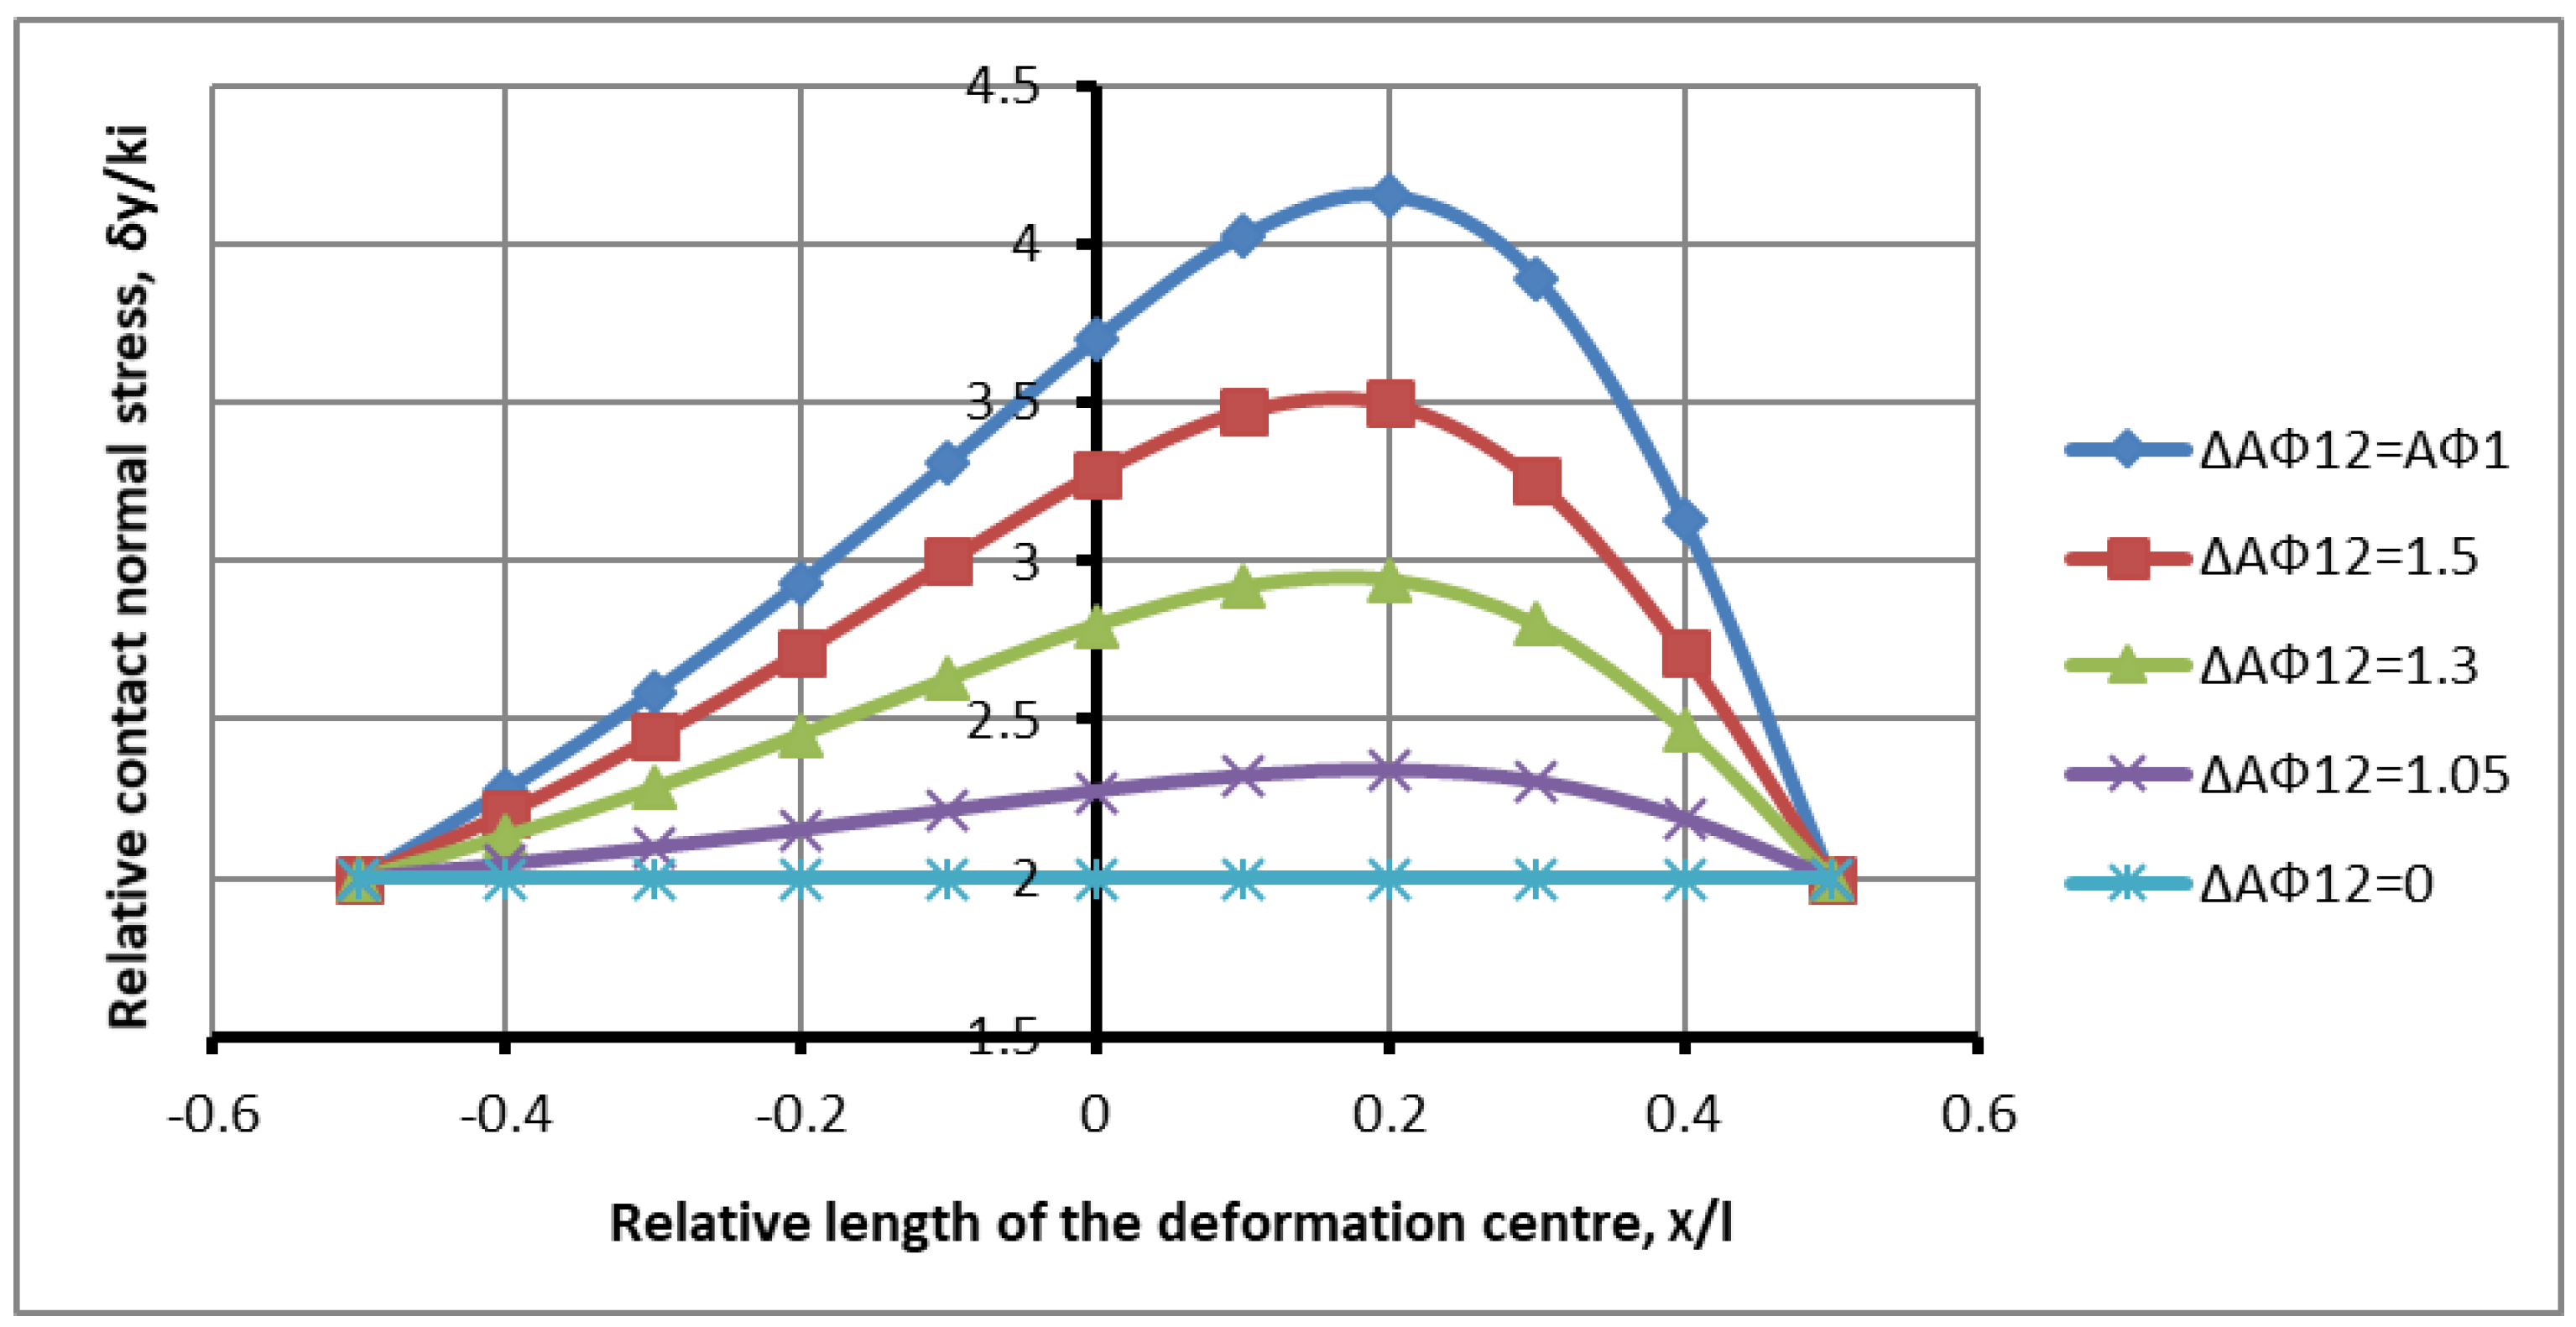
Figure 9 shows the distribution of contact stresses along the length of the deformation zone with roughness values of
, with differences in the grip angles of
.
Analyzing the diagrams of contact stresses in
Figure 9, the same increase in force loading in filling the inter-limit space is observed, as with an increase in friction. The difference is that the combination of the curves of the diagrams occurs not from the side of the lagging zone, but from the side of the leading zone. This is due to a different interaction pattern not with friction, but with grip angles. In this case, there is no influence of contact friction. The friction process is symmetrical. The numerical values of the maximum stresses, with an increase in the difference in the angles of capture, with a constant difference in the friction factor, are equal to:
An important circumstance is the increase in contact stresses with increasing compression, which confirms the physical model of the process about the relationship between the force interaction of the zones and the unevenness of compression on the part of the rolls of the deformation center. If the processes of increasing contact stresses under increasing strain loading are possible, then the reverse pattern of change is also possible such as a reduction in the stress state under the increasing action of plastic longitudinal shear in the deformation site. At the same time, the overlap zones on the side of the rolls increase; one force longitudinal action is compensated by another increasing action. The analytical model of such an interaction is a functional shift represented by expressions (33)–(35), (36)–(40), and (27).
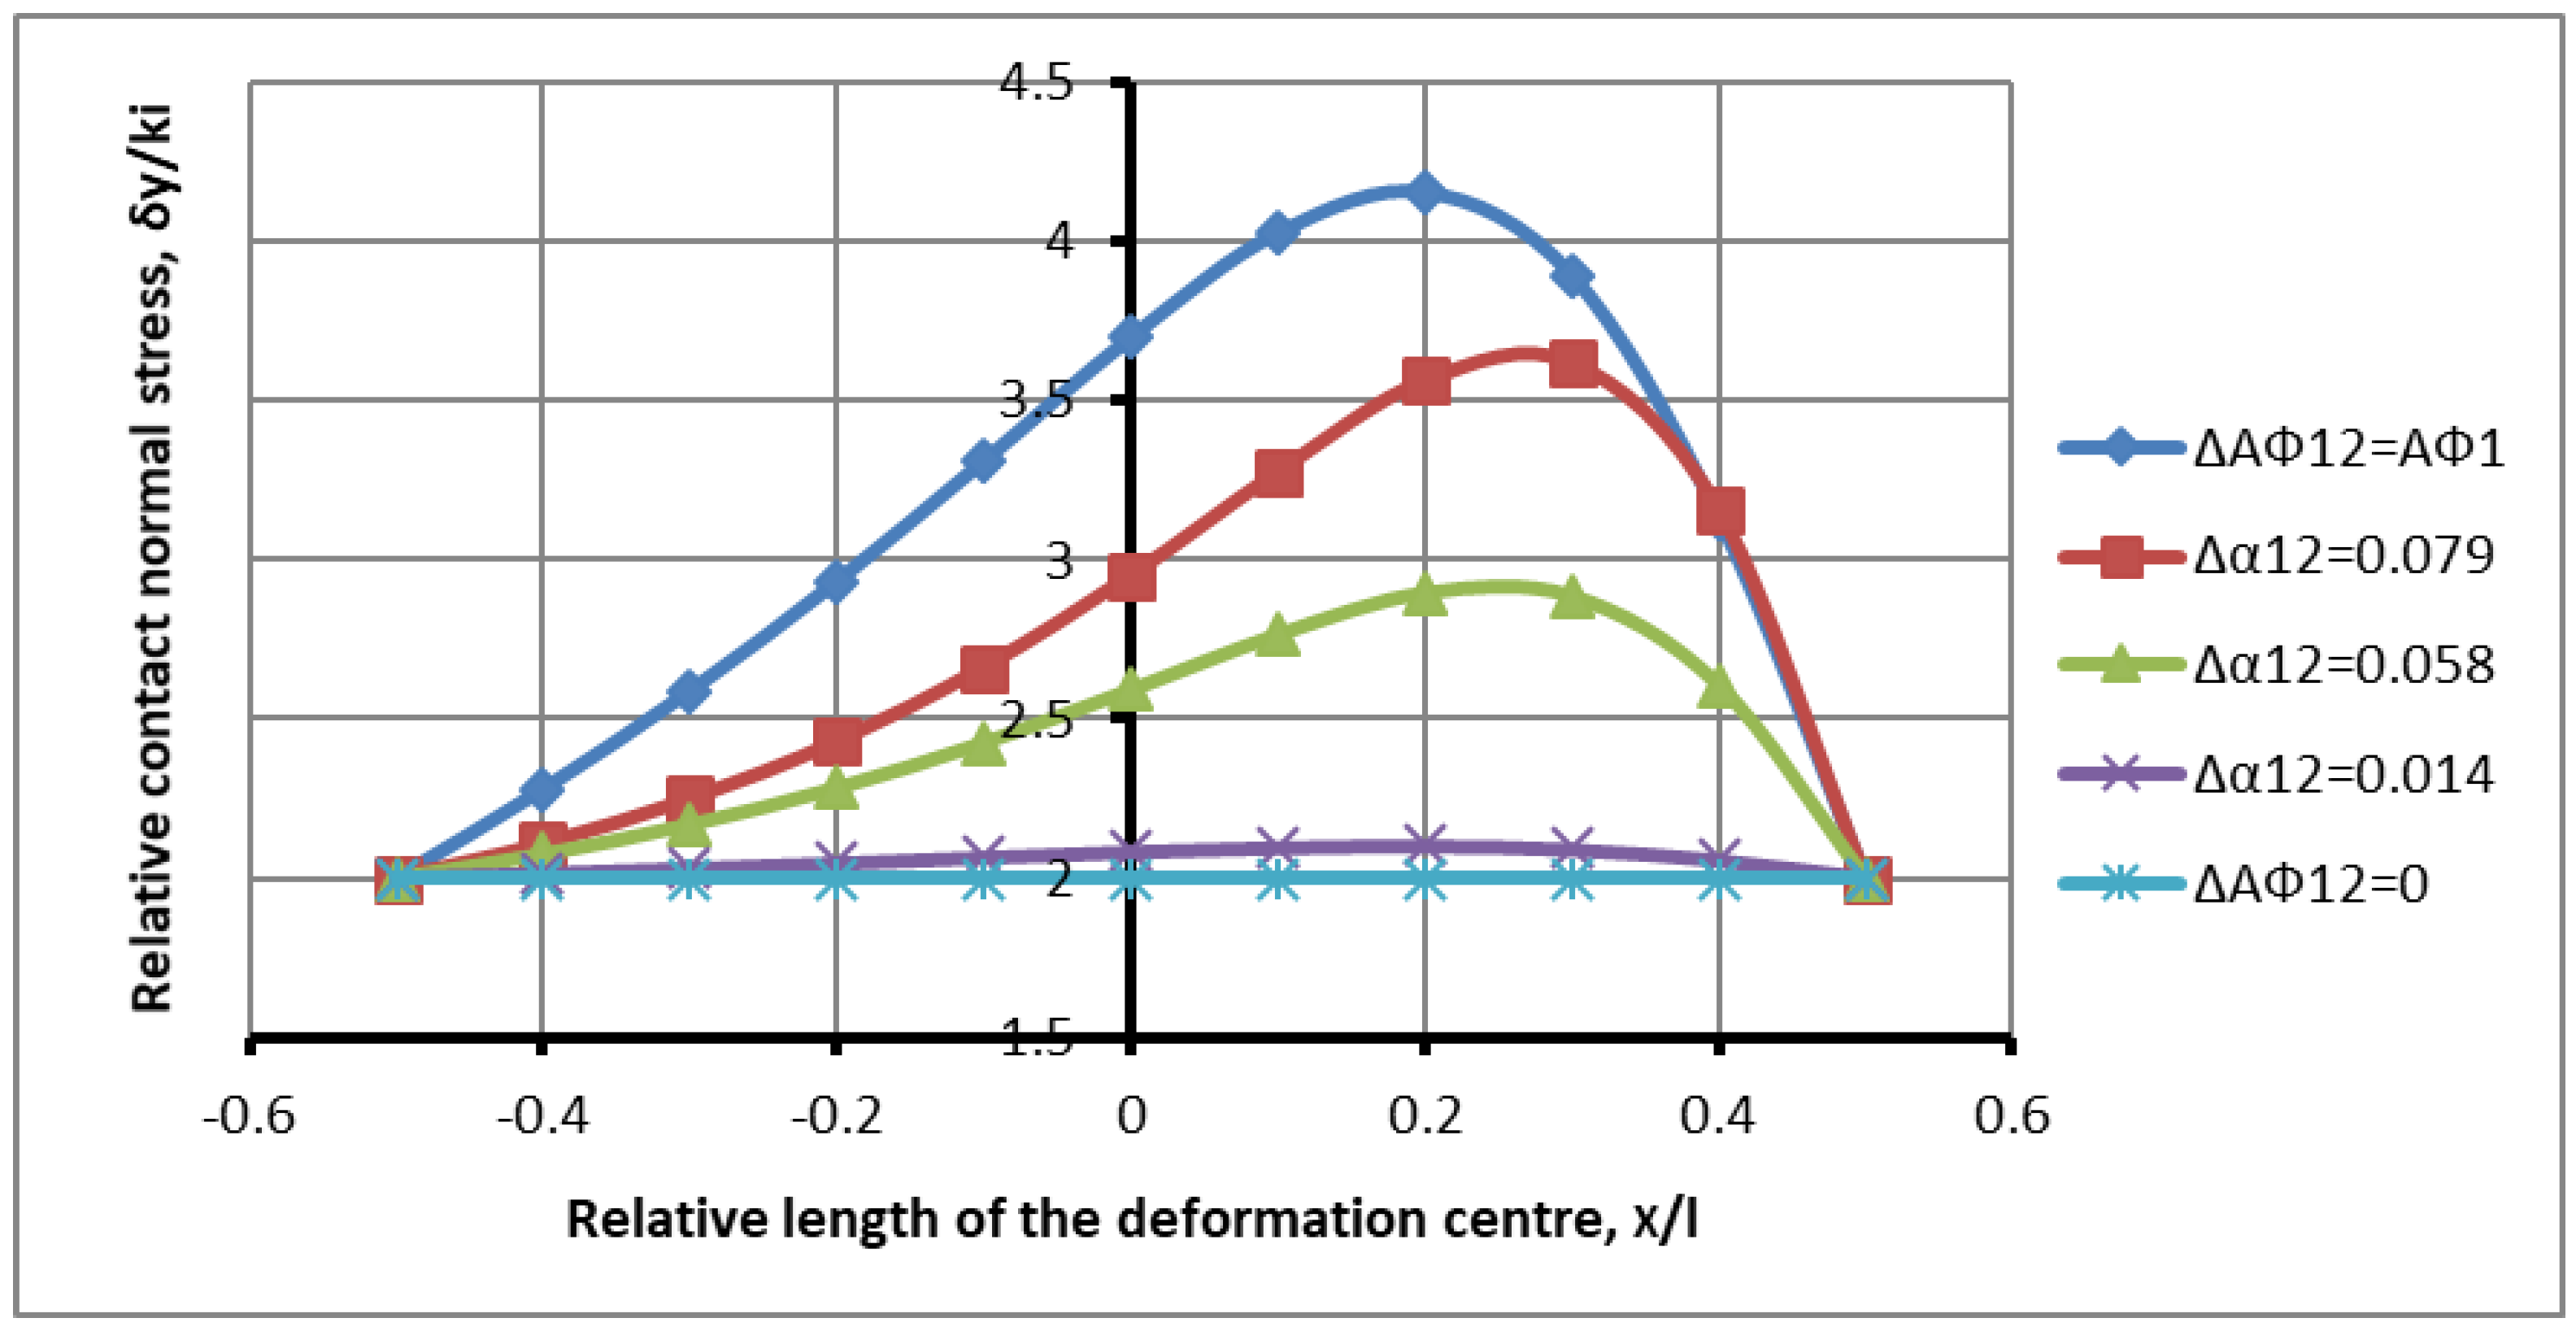
Figure 10 shows the distribution of contact stresses along the length of the deformation zone with roughness values of
, with differences in the grip angles of
.
The combined effect of a constant friction factor
,
and a variable factor
is presented within the range of 0.014, 0.058, and 0.079. Analyzing the qualitative characteristics of the distribution, a slight increase in the stress on the deformation site is seen. The lines of the plots, as in
Figure 9, coincide from the side of the advance zone, which indicates a different loading model, as shown in
Figure 5,
Figure 6,
Figure 7 and
Figure 8. The numerical values of the maximum stresses, with an increase in the difference in the angles of capture, the constant friction factor, are equal to:
In comparison with the data of the maximum stresses in
Figure 9, there is an increase in stresses in the range of 0–3.4%, with a maximum deviation in the region of the minimum angle difference. The increase in the difference between the friction factor and the angle of capture occurs in one direction, which explains the decrease in the interaction of the non-compressed zones on the part of the rolling rolls. The fact of reducing the impact of plastic shear is confidently confirmed, gradually restoring the kinematics of the symmetrical rolling process and reducing the overlap of the interaction zones. Different approaches to evaluating the interaction from the lagging zone and from the leading zone enhance the reliability of the result and allows one to evaluate the reliability of the mathematical model.
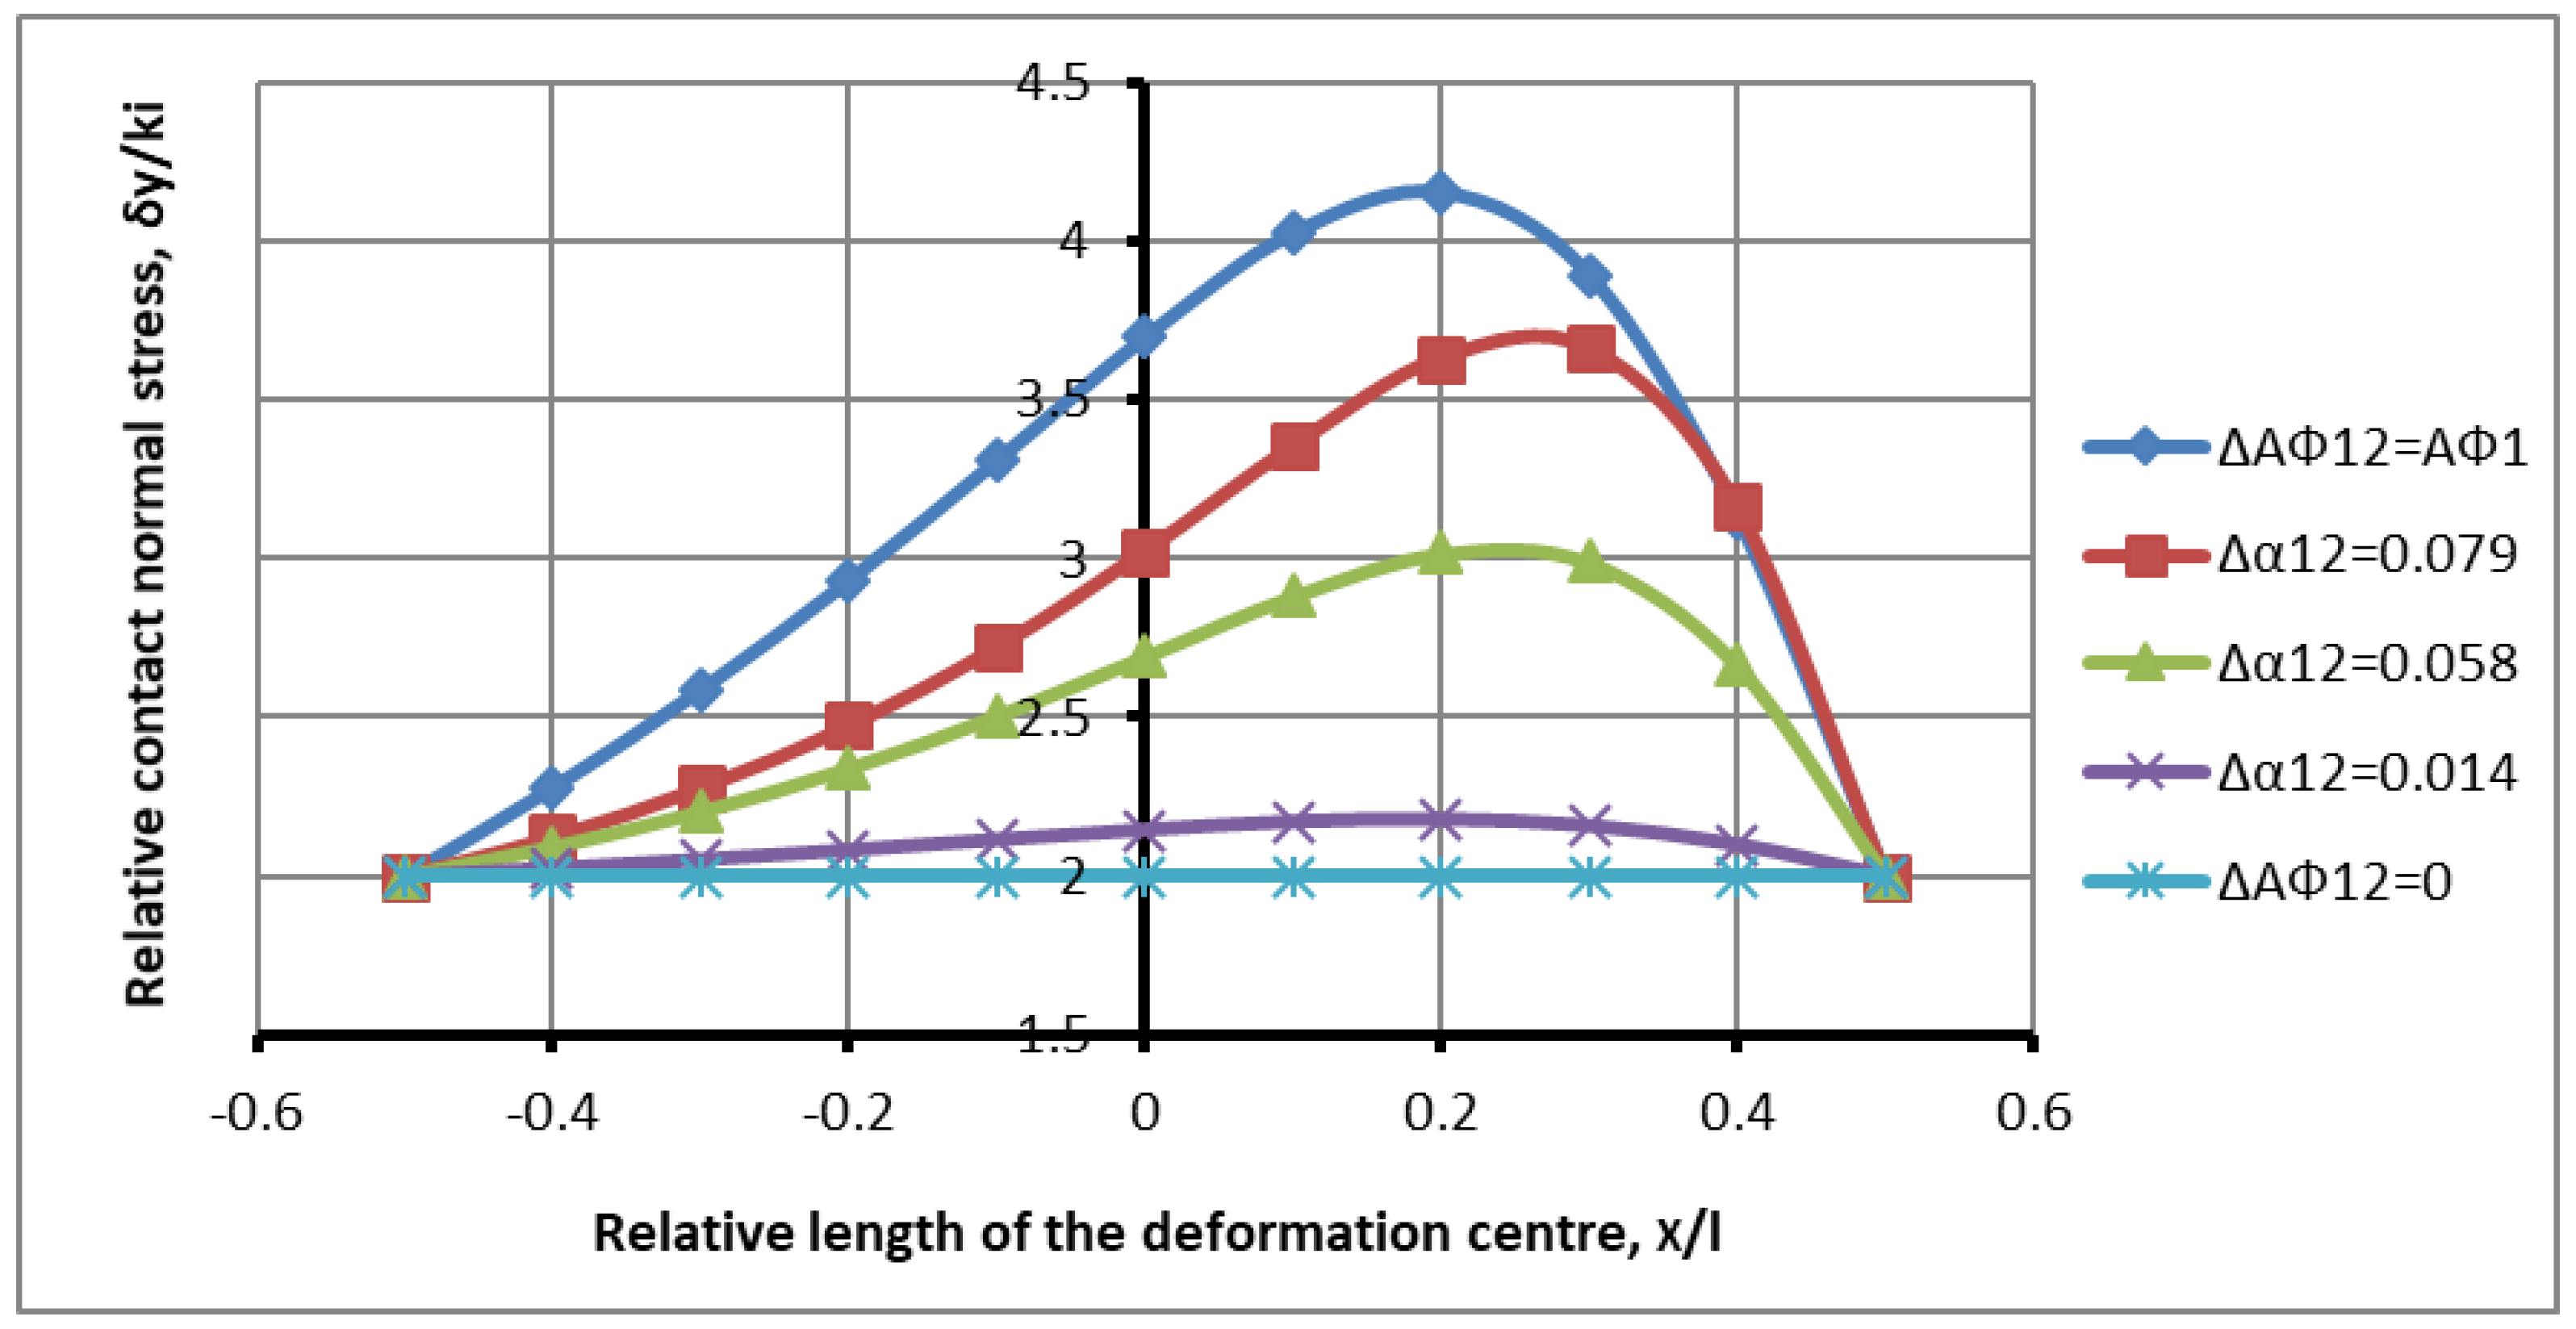
Figure 11 shows the distribution of contact stresses along the length of the deformation zone with roughness values of
,
,
.
It can be seen from
Figure 11 that in the inter-boundary space, due to the increase in contact stresses, only two curves,
, fit. There is an increased joint unidirectional effect of contractual friction and the difference in the grip angles. Going beyond the designated space of the curve with the maximum difference indicates that the process designated by the maximum difference does not obey the law of regulatory action because there is no longitudinal shift, no overlap of zones, no interaction of disparate zones, and the mathematical model beyond the upper limit of the symmetrical process does not work within the specified confidence. The numerical values of the maximum stresses, for different values of the angle difference, are
In comparison with the data of the maximum stresses in
Figure 9, there is an increase in stresses in the range of 0–25%. Such a rapid increase in contact stresses in the zone of the minimum difference indicates different schemes for calculating changes in the directions of angles when combined with an increased value of the friction factor.
Figure 12 shows the distribution of contact stresses along the length of the deformation zone with roughness values of
,
,
.
From
Figure 12, as in the previous case (
Figure 11), it is evident that only two curves,
, fit in the inter-limit space due to the increase in contact stresses. However, the contact stresses are significantly higher and the difference in stresses at
practically coincided with the symmetrical process. An increase in the difference indicators is equivalent to a decrease and a tendency toward zero of the parameters of a less active roll. The numerical values of the maximum stresses, at different angle values, are
In comparison with the data of the maximum stresses in
Figure 9, there is an increase in stresses in the range of 0–34%.
Figure 5,
Figure 6,
Figure 7,
Figure 8,
Figure 9,
Figure 10,
Figure 11 and
Figure 12 show the dynamics of the load changes in the inter-boundary space shown in
Figure 4. The presence of this space is determined by the overlap zone or the shift. From the point of view of the physical model, this is a space in which there are two contact surfaces of rolls with friction forces acting on them in the opposite direction, in which the coefficient of support tends to zero. In a symmetrical process, the friction forces in the lag and advance zones are always directed in the same direction, i.e., in the absence of an overlap or shear zone, from the point of view of the mathematical model, the overlap zone is the difference between the analytical expressions of the upper and lower rolls, (27), (36)–(39), (41)–(44), or a functional shift. If there is no difference in these expressions, then there is a special solution case for the symmetric problems shown in
Figure 2 and
Figure 3. If the difference increases, as follows from the above diagrams of contact stresses in
Figure 6,
Figure 7,
Figure 8,
Figure 9,
Figure 10,
Figure 11,
Figure 12 and
Figure 13, then the effect of the subtracting term decreases, the overlap zone decreases, and the effect of the zero back-up coefficient decreases, leading to an increase in the stress state as a whole. If the difference decreases, this is due to an increase in the subtractive term, which increases the overlap zone, reducing the difference in impacts on the entire deformation site. The zero support extends over the entire length of the deformation site and the total load is reduced to zero, which is indicated by the lower straight line of
Figure 4. For zero support, the maximum interaction between the rolls should be realized, which is the opposite force action relative to each other, which reduces the difference in the mathematical model to zero.
The interaction is of interest, which is determined by the growth of the subtractive term to the value of what is subtracted in the difference, followed by it exceeding the subtracted value in magnitude. A difference in expressions (27), (36)–(39), and (41)–(44) shows how it becomes negative. Thus, let us consider the behavior of the mathematical model beyond the limits of asymmetric loading.
Figure 13 and
Figure 14 show the diagrams of contact stresses when the sign changes between the friction parameters in zones one and four, as well as three and two.
The values of the difference in grip angles were, respectively, taken as 0.0 and −0.019.
The zone between the limit values of the interaction area remains unfilled. The peculiarity of this analysis is that in all variants, the diagram of the contact stresses is concave. From a physical point of view, this means that the rolling process has lost stability, i.e., there is no reduction in the deformation zone and the strip slips in the rolls. Such conclusions were made in a paper [
13] when the friction coefficient was taken to be equal to 0.05 and the capture angle to be 0.168. In our studies,
Figure 3, a loss of process stability was also noted at a friction coefficient of
. According to updated approaches, the loss of stability of the rolling process is determined not by a known method, where the friction coefficient should not be less than the grip angle:
but based on real contact stress diagrams. The presence of a single-zone deformation zone, characterized by tangential stresses, does not automatically imply a loss of process stability in metal rolling if plastic deformation occurs primarily under normal stresses. A non-concave normal stress diagram is key here. Concavity in this diagram, as illustrated in
Figure 13 and
Figure 14 (which are assumed to be diagrams showing a concave curve indicating a lack of plastic flow), signifies the absence of plastic deformation. This is because a concave profile indicates a region where the material is experiencing compressive forces exceeding its yield strength, leading to elastic deformation or even fracturing, but not the plastic flow expected in rolling.
The reason for this behavior lies in the interplay between forces within the rolling process. In symmetrical rolling, the balance of forces along the deformation zone, between the leading and trailing sides of the workpiece, is crucial for stable operation. However, asymmetrical vertical loading introduces a significant imbalance. The forces exerted by the rolls themselves, particularly in the context of roll bending or an uneven roll pressure distribution, come into play. These forces can act to further enhance the pushing effect on the metal, effectively reducing the gripping force of the rolls. This diminished grip, caused by the imbalance in vertical forces, can lead to slippage, a loss of control over the material, and ultimately, a halt in the rolling process. The resulting concave normal stress diagram reflects this process failure, indicating the absence of continuous plastic deformation because the material is not undergoing the intended plastic flow.
This phenomenon highlights the critical role of the force equilibrium and homogeneity in the rolling process. In reality, perfect homogeneity is rarely achieved. The developed physical model, supported by both the literature and experimental data, emphasizes the impact of heterogeneity and unevenness in plastic deformation. This leads to the emergence of shear effects within the plastic deformation zone, representing a significant departure from the ideal rolling behavior. These shear effects introduce a new level of complexity, acting as additional control parameters influencing the overall process.
The physical model of the process has shown that there are possibilities of an additional impact on the plastic deformation site in the form of shear unbalanced longitudinal loading. The balancing of the external system of forces is possible due to force changes in the plastic focus of deformation. To do this, it became necessary to substantiate the effect of additional exposure using the fundamental principles of continuum mechanics. Based on the argument of functions of a complex variable method, which has been repeatedly tested in publications and reports at international conferences, the task was solved. Based on the closed problem of the theory of plasticity, which largely indicates the reliability of the result [
25,
29], the counter-directional force effect was taken into account in the construction of a mathematical model for both argument functions. Their maximum counter-directional interaction zeroed out the loading in the deformation center, which is shown by real theoretical calculations. In those cases, where the counter-directional interaction was reduced to zero, there was a special case of solving the proposed problem, i.e., a symmetrical rolling process. Using theoretical solutions, generalized patterns of changes in force loading in the deformation site under conditions of asymmetric loading, including boundary ones, have been identified.
Thus, the appearance of uneven plastic deformation along the roll height, due to the asymmetry of the loading of the plastic medium from the rolls, led to additional effects on the zone of the plastic flow of the metal. According to a number of distinctive features, the additional impact was characterized as controlling. One of the main signs is the appearance of a new quality of force loading. The uneven deformation on the part of the rolls of the working stand of the mill led to the appearance of counter-directional shear forces. The occurrence of a force shift from the boundary conditions has changed the kinematic and force parameters of the process, which, under conditions of additional control actions, reduces the rolling force.
In conclusion, the following should be noted. Based on the literature and experimental and theoretical data, a physical and mathematical model of the process has been developed that determines the effect of inhomogeneity and uneven deformation on the processes of plastic shaping. This is confirmed by the new quality of the process and the shear effects on the plastic deformation site. The implementation of the new quality leads to shape-changing effects associated with a reduction in the force load in the plastic flow zone.
Indeed, as a result of uneven compression in the height of the workpiece, an unbalanced system of forces arises at the boundary of the deformation center, in the form of counter oppositely directed force actions. This type of loading causes the interaction of additional forces and uneven compression, with the force characteristics of the deformation site. There is an impact on the deformation site in the form of controlled force loading, with a complex force structure. Such a force structure causes asymmetry of the interaction, which must be balanced by the opposite effect from the source of deformation. A shear component appears in the deformation site, which changes the kinematics of the metal flow and the stress state of the plastic medium, and the asymmetry of loading occurs in the deformation site itself.
A mathematical model of the process was developed based on the method of the argument of functions of a complex variable, which makes it possible to characterize the stress state with a complex asymmetric structure. The reaction of the deformation focus to the boundary shift causes the appearance of a functional shift in the mathematical model.
The modern theory under consideration has a number of its own features, which made it possible to solve the flat problem of plasticity theory in an analytical form and strengthen the result with a new understanding of solutions to problems of continuum mechanics. Many theoretical papers overlook the theoretical validity of the solution obtained. This applies to the variational principles of mechanics, the finite element method, and most of all, calculation methods using digital technologies. Solutions to a non-closed problem of the theory of plasticity are presented. The problems are solved either in stresses or in deformations or strain rates, without taking into account the temperature field. For example, solving a variational closed problem involves varying the functions not only in terms of deformations, but also in terms of stresses, which makes it more complicated. It seems that there is no such need to accept such complications as the calculation can be supported by the experimental data. This is acceptable, but there are some circumstances required. Closed solutions remove some simplifications that limit the theoretical reliability of the result and the possibilities of a solution. In the case of a closed problem, the stress state is not virtual, but real, which characterizes the theoretical reliability of the result. When implementing the solution itself, many conventions and restrictions are removed.
In the proposed method, the argument of the functions is proposed to determine not the solutions themselves, but the conditions of their existence, using the Cauchy–Riemann differential relations and Laplace differential equations. It follows from the conclusion that these functions are harmonic functions, of which, in principle, there can be an infinite number, which can later be adjusted by boundary conditions.
The possibilities of the method are demonstrated in the proposed solution. A complex asymmetric problem has been solved along the lines of a single deformation focus in an analytical form. The result of reducing the force of the shape change under conditions of a control action and longitudinal plastic shear is shown.
The practical significance of reducing the rolling force is determined by: reducing the spring of the mill’s working stand, narrowing the rolling tolerances, improving the accuracy, saving metal, reducing the wear on the working tools (rolls), implementing the process of intense plastic deformation by strengthening the shear component, and adjusting the metal structure during rolling—therefore, working to order.

