Abstract
TGA kinetic analysis can assess the thermal stability and degradation properties of PCMs by calculating activation energies and onset degradation temperatures, which are critical elements when developing optimal PCM composition and assessing long-term performance in thermal energy storage applications. In this study, we utilize a thermogravimetric analyzer to examine the thermal stability of both solar salt phase change material (i.e., commonly used in medium-temperature applications) (NaNO3 + KNO3) and a composite eutectic PCM mixture (i.e., PCM with 20% biochar). The activation energies of both the pure solar salt and composite solar salt PCM sample were evaluated using a variety of different kinetic models such as Kissinger–Akahira–Sunose (KAS), Flynn–Wall–Ozawa (FWO), and Starink. For pure PCM, the mean activation energies calculated using the KAS, FWO, and Starink methods are 581.73 kJ/mol, 570.47 kJ/mol, and 581.31 kJ/mol, respectively. Conversely, for the composite solar salt PCM sample, the calculated experimental average activation energies are 51.67 kJ/mol, 62.124 kJ/mol, and 51.383 kJ/mol. Additionally, various machine learning models, such as linear regression, decision tree regression, gradient boosting regression, random forest regression, polynomial regression, Gaussian process regression, and KNN regression models, are developed to predict the degradation behaviour of pure and composite solar salts under different loading rates. In the machine learning models, the mass loss of the samples is the output variable and the input features are PCM type, heating rate, and temperature. The machine learning models had a great prediction performance based on experimental TGA data, with KNN regression outperforming the other models by achieving the lowest RMSE of 0.0318 and the highest R2 score of 0.977.
1. Introduction
In modern society, energy demand is rapidly growing in households and in industrial sectors as well [1]. This increasing demand results in energy production from fossil fuel combustion, which causes pollution and toxic gas emissions [2]. Solar energy is a prominent renewable energy alternative that provides a high supply of environmentally friendly energy. To combat the intermittent nature of solar radiation, thermal energy storage (TES) systems are used to store excess energy for later use [3]. TES technologies typically include sensible heat storage, chemical reaction, and latent heat storage systems. Latent heat storage systems are generally the most preferable from the perspective of thermal energy storage due to their high energy storage density in a limited amount of physical space, especially at the phase transition temperatures. Phase change materials (PCMs) store a significantly larger amount of thermal energy per unit volume than sensible heat storage materials [4]. Also, the lower cost of PCMs means that they are some of the most cost-effective and space-efficient options for storing large amounts of thermal energy using the additively reversible phase changing between the solid- and liquid-state concepts [5].
Phase change materials (PCMs) are categorized into organic and inorganic types. Organic PCMs, including paraffin waxes, fatty acids, alkanes, and their eutectic mixtures, are suited for low-temperature thermal energy storage (<120 °C). Inorganic PCMs, such as salt hydrates (<120 °C), nitrates (<300 °C), and chlorides (<500 °C), support a broader temperature range [6,7]. Organic PCMs are non-corrosive, non-toxic, chemically stable, and exhibit minimal super cooling, making them ideal for applications like building insulation and electronics cooling [8]. However, they are flammable, have low thermal conductivity, and offer lower energy storage density. In contrast, inorganic PCMs, like salt hydrates, provide higher energy storage capacity and moderate latent heat and are cost-effective for large-scale applications like solar thermal systems, but are often corrosive, being prone to super cooling, phase segregation, or toxicity [9]. Among inorganic PCMs, nitrates stand out for their enhanced stability, good thermal conductivity, and high volumetric energy storage density. Eutectic PCMs, which melt and freeze at fixed temperatures, enable precise phase transitions, making them valuable for applications like medical storage and electronics cooling due to their high energy density and customizable temperature ranges [10]. Eutectics also offer better thermal stability than some inorganic PCMs and superior heat transfer compared to organic PCMs, enhancing their utility in HVAC, renewable energy, and cold chain logistics [11]. Additives such as expanded graphite, expanded perlite, diatomite, and kaolin are incorporated to prevent leakage or enhance thermal conductivity, with expanded graphite preferred for its lightweight properties and volume stability [11].
Additives such as expanded graphite (EG) and biochar modify PCMs in thermal energy storage due to their respective distinct contributions. Li et al. [12] developed a binary eutectic composite from LiNO3 + KNO3 using a static mixed melting method with a 30% weight fraction of EG. This produced 16 times the thermal conductivity of pure PCM salts. They utilized a similar medium-temperature solar application composite salt (Ca(NO3)2 + NaNO3/EG) that contained 7% weight fraction of EG, which produced more than 7.3 times the thermal conductivity of pure PCM [13]. TGA is used to analyze the thermal stability, with degradation kinetic analysis used to perform further analysis on the durability of the PCM. Biochar is gaining more attention than EG due to its cost, sustainability, and production simplicity when using large sources of biomass (e.g., crop residue). Biochar has a mesoporous structure that can be effective in stabilizing PCMs and preventing leakage while still offering sufficient thermal stability, even at a substantially lower levels of PCM loading. Biochar’s less disruptive environmental footprint meets sustainable material needs in terms of renewable energy storage.
This study incorporates innovation in creating bio-based composite solar salts for use in solar thermal energy storage. This composite improves upon the efficiency and sustainability of energy storage systems by adding natural, biodegradable materials. Functional biomaterials can be used to produce environmentally friendly, degradable coatings found in silk fibroin [14], melanin [15], and biomass-derived biochar [16]. Furthermore, the composites contain PCMs, such as polyethylene glycol (PEG), and other natural polymers to reduce thermal stability and increase energy storage [16].
The thermal conductivity of PCMs is increased as much as 13.8 times from that of pure PCMs when biochar is added [15]. Some biocomposites have very good solar-to-thermal efficiencies, reaching higher than 96.8%, and so they can easily be incorporated into solar thermal energy systems. These thermal energy storage materials have high thermal efficiency and more capacity for heat storage. These types of materials would be advantageous to solar thermal energy systems [17,18], as they also address heat storage and are very effective thermal management methods. Kalidasan et al. [19] demonstrated a clear improvement in the thermal conductivity benefits of organic phase change materials (PCMs) through the addition of bio-based nanoparticles derived from coconut shells. Mehling et al. [19] showed a new degradation mechanism in heat storage by using a systematic method that could also be used to find undiscovered performance problems in PCMs. However, the materials reported good performance and good stability, especially with the composites produced from carbon quantum particles and bamboo fibers, as they were suitable for high-temperature uses. The thermal degradation of Polyamide 4 (PA4) was found to proceed through a two-stage pyrolysis process, influenced by crystallinity. The addition of calcium chloride was shown to improve thermal stability, emphasizing the importance of understanding degradation mechanisms to enhance the processing and application of bio-based polymers [20]. B. et al. [21] studied an experimental investigation using 1-tetradcanol with different compositions of activated hydrochar and graphene nanoparticles. The results of their study showed that the thermal conductivity and thermal effusivity with sample, 1-tetradecanol + 40% of biochar + 1% graphene, were 526.42% and 187.72%, respectively, compared to pure 1-tetradcanol.
TGA kinetic analysis is an important aspect of assessing the stability and degradation of the phase change materials (PCMs) to ensure that you can use them as intended in applications such as thermal energy storage. The two main kinetic analysis approaches are model-fitting techniques and model-free methods such as Kissinger–Akahira–Sunose (KAS), Flynn–Wall–Ozawa (FWO), Starink, etc. Model-free methods can calculate the activation energy and variation in activation energy with heating rate, providing information on decomposition kinetics. TGA is a mass loss measurement, as a function of temperature, that also identifies safe operating temperatures and degradation concerns when looked at, particularly regarding bio-based PCMs. The proper screening of materials and designs can enhance the efficacy and longevity of thermal management systems. Venkitaraj and Suresh [22] showed that adding Al2O3 nanoparticles to pentaerythritol increases the thermal degradation point at higher heating rates but reduces activation energy, acting as a catalyst. Sun et al. [23] enhanced flame-retardant properties by co-microencapsulating ammonium polyphosphate and pentaerythritol using MF resin, with consistent activation energy values across Flynn–Wall–Ozawa and Kissinger methods. Xiang et al. [24] found that polypropylene (PP) hollow-fiber membranes encapsulating paraffin exhibited the highest porosity (85.09%) and latent heat. PP also had the highest decomposition temperature and an activation energy of 99.30 kJ/mol, making it the best support material for PCMs.
In recent years, machine learning (ML) approaches have been shown to be effective in terms of predicting the mechanical properties of composite systems, increasing the efficiency and accuracy of the material design process [25,26]. Because they can assess intricate trends, these are crucial for material optimization and speeding up the design [27]. ML models have been extensively used to receive optimized mechanical properties of laminated fiber-reinforced polymers with better prediction accuracy [28]. ML has successfully uncovered the effect of defects on the mechanical properties of doped graphene, demonstrating its adaptability to a wide range of materials [29]. Zuccarini et al. [30] standardized systems to define material properties (speedy + feasible) using existing datasets, leading to an increase in the precision of property prediction. Gradient boosting and statistical analyses were successful in detecting key features, decreasing computational cost and increasing model interpretability [31]. Data-driven methods can customize the lattice materials, facilitating superior mechanical performance [32]. Recently, a two-tiered ML framework achieved less than a 10% error for the prediction of elastic modulus, validating the credibleness and accuracy of ML material design [32]. ML applications extend to practical fields such as aerospace, where models have been used to optimize materials for spacecraft re-entry, displaying their utility in demanding environments [30]. Despite these advances, challenges remain, including the need for experimental validation and the better integration of domain knowledge to further enhance prediction accuracy [33]. Analyzing degradation behaviour is a crucial consideration when choosing phase change materials (PCMs) for use in medium-temperature TES systems, as highlighted in studies [25,26]. While numerous studies have investigated the degradation kinetics of low-temperature-range PCMs, there remains a significant gap in the literature concerning the degradation kinetics of salt-based PCMs, particularly for medium-temperature applications [34,35,36,37]. Earlier review studies have pointed out the lack of a thorough and systematic assessment of the thermal stability of composite phase change materials (PCMs) based on NaNO3-KNO3 mixtures.
A thorough review of the available literature reveals a major research gap regarding detailed investigation into the thermal stability of biochar-enhanced solar salt PCMs for medium-temperature TES systems. This research aims to fill this gap by quantitatively investigating the kinetic properties of pure solar salt and biochar-based composite solar salt in an effort to use them effectively for thermal energy storage in applications including solar thermal power plants and industrial heating applications. The study applies model-free integral kinetic models to assess the thermal degradation behaviour of the thermal energy storage sample materials, using non-isothermal thermogravimetric analysis (TGA) experiments conducted at multiple heating rates to estimate the material response as thermal conditions change. The goal was to assess the kinetic parameters responsible for controlling the thermal stability and phase change. Further, the research will also expand, using advanced machine learning models to predict the long-term stability of solar salt and biochar-based solar salt, with respect to input parameters such as PCM composition, heating rates, and temperatures correlating to the specific % conversion, with mass loss as the output parameter. The machine learning predictive models show good R2 values, indicating a high degree of assurance for accurate predictions of experimental results, which may be used as a design optimization tool. The dual nature of conducting the kinetic and machine learning analysis not only provides an improved and comprehensive understanding of the performance of biochar-based solar salt, but also contributes to the development of sustainable high-efficiency TES technology for renewable energy systems.
2. Materials and Methods
The eutectic PCM combination consisting of sodium nitrate and potassium nitrate proves highly suitable for applications at moderate temperatures (200–300 °C), as highlighted in the introduction. The eutectic PCM combination is made up of sodium nitrate (NaNO3), as 60% of the content, and potassium nitrate (KNO3), as 40% of the content [26]. The 50 gm PCM sample was prepared, containing 30 gm sodium nitrate and 20 gm potassium nitrate. The thermophysical properties of the selected PCM samples are listed in Table 1.

Table 1.
Thermophysical properties of selected PCMs and their eutectic PCM composition.
2.1. Synthesis of Composite PCM Sample
Preparation of Pure PCM
The schematic representation of pure solar salt is highlighted in Figure 1. The eutectic mixture of NaNO3 and KNO3 (60:40 wt ratio) is prepared by weighing 50 g of salts. Next, the salts are thoroughly mixed together. Then, 200 mL of demineralized water is added to the salt mixture, and the solution is stirred with a magnetic stirrer (900 RPM). This vigorous agitation is repeated until depth of dissolution is achieved, usually within a time frame of approximately 3 h. Then, an ultrasonicator is used to make the mixture more uniform and homogeneous. After the ultrasonication, the sample is dried at 180 °C to remove the water contents of the eutectic salt mixture, giving a dry physicochemical product [28]. The reason for selecting a drying temperature of 180 °C was to ensure the water content of the solar salt was effectively removed, taking into consideration that 180 °C was not close to the melting point or the on-start degradation temperature of solar salt, which are much higher.
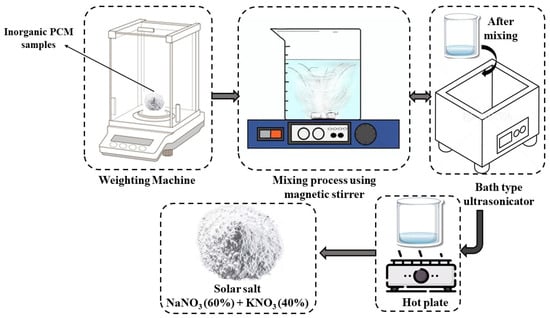
Figure 1.
Preparation of pure solar salt.
2.2. Preparation of Composite Solar PCM Salt
Biochar acts as an additive when working to prepare the composite phase change material (PCM). Overall, it is clear from the literature review that biochar is a great support material for improving the thermal conductivity of PCM materials. First, the biomass-derived expandable material is heated in a muffle furnace at a temperature of 200 °C to dry the sample. The eutectic salt mixture, consisting of NaNO3 and KNO3 in a 60:40 weight ratio, is weighed and mixed thoroughly. This mixture is combined with 200 mL of demineralized water and stirred using a magnetic stirrer at 900 RPM. During the continuous stirring process, biochar particles (20 wt.%) are gradually introduced into the solution. The well-blended composite eutectic sample undergoes further homogenization, using an ultrasonicator to ensure the uniform dispersion of biochar within the mixture. After homogenization, the composite mixture is heated to remove water, yielding a moisture-free sample. Finally, the sample is elevated to its melting-point temperature to complete the preparation process for the biochar-enhanced composite PCM. The procedure for the preparation of composite solar PCM salt is depicted in Figure 2.
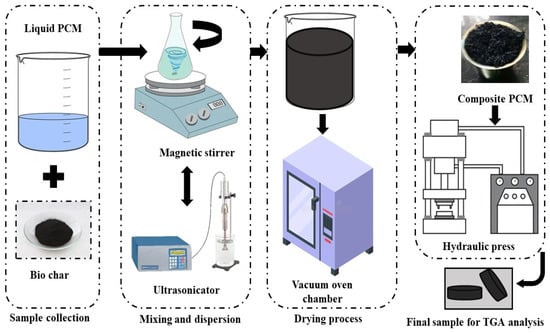
Figure 2.
Procedure of composite solar PCM salt preparation.
2.3. Characterization of Prepared Composite PCM Salt
FTIR spectra of pure PCM and composite PCM salt samples are shown in Figure 3. The composite solar salt has a symmetric bending band of NO3− at 1375 cm−1 and an asymmetrical stretching band at 825 cm−1. Biochar, which is pure carbon, has no functional groups. The FTIR spectrum of composite solar salt is similar to that of pure solar salt because the addition of biochar does not create new chemical bonds or alter the molecular structure of the eutectic salt PCM. Instead, biochar becomes a physical additive material and support, interacting minimally with the existing solar salt bonds. Furthermore, no new peaks or shifts were observed in the characteristic nitrate bands and both spectra were identical. Although it is assumed that the porous, honeycomb structure of biochar can enhance physical properties such as absorption capacity, the FTIR results indicate no evidence that biochar alters the chemical bonding environment of the PCM. The analogous FTIR spectra indicate that the composite retains all intrinsic chemical properties identified in the pure PCM and indicates that thermal storage properties are primarily driven by the eutectic salts.
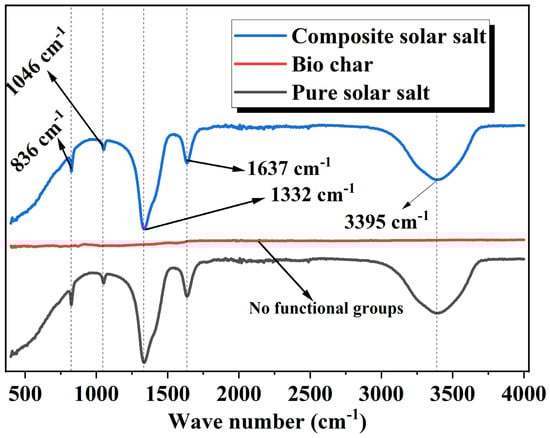
Figure 3.
FTIR spectrum of prepared composite solar salt.
Figure 4 presents scanning electron microscope (SEM) images of the eutectic PCM in pure form and the PCM composite samples. The pure solar salt (Figure 4a) is a eutectic mixture of NaNO3 and KNO3, 60:40 wt.%, where nitrate ions (NO3−) are bound ionically to Na+ and K+ ions, resulting in a crystalline structure that is stable and applicable for medium-temperature thermal energy storage. The composite solar salt (Figure 4b) is 20 wt.% biochar, which is made of porous carbon that has an absence of functional groups (confirm FTIR in Figure 3), and acts as an ingestible substrate, where it does not interfere with the existing chemical bonds of the eutectic salt. In terms of identifying characteristics, it behaves as scaffold material to improve the structural integrity and thermal conductivity. The biochar particles are porous in nature and act like a scaffold for PCM molecules. The PCM particles are all tightly distributed in the range of biochar pores, as demonstrated in Figure 4b. A higher rate of inclusion of biochar particles allows for a higher void volume capacity for PCM particles. This is attributed to the increase in the number of pores, enhancing both surface tension and capillary action in the material structure. The unique honeycomb configuration subsequently enhances the absorption capacity of PCM in its liquid state and works towards improving the overall structural integrity of native PCM.
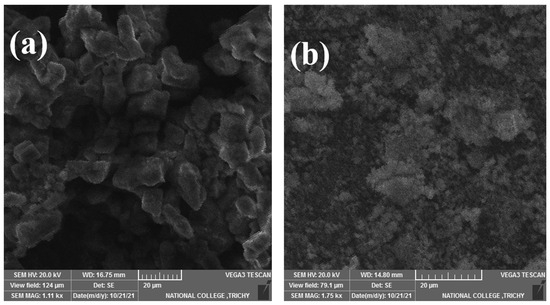
Figure 4.
SEM plots of the prepared samples: (a) pure base salt; (b) composite solar salt.
2.4. Uncertainty Assessment
The uncertainties associated with various properties and parameters of the PCM samples are summarized in Table 2. These values were determined using the error propagation method.
Table 2.
Uncertainty values of the measured instruments.
3. Thermogravimetric Analysis of Prepared Composite Solar Salt PCM Samples
Model-Free Kinetic Methods
We used one of the widely employed kinetic equations to analyze the thermal degradation of solid-state reactions. It was estimated as a one-step kinetic equation. The one-step kinetic equation is mathematically presented in Equation (1) [25]:
In these terms, α stands for the reaction rate conversion, k(T) is called the reaction rate constant, and G(α) is the reaction model definition applied to the reaction mechanism.
The conversion of the reaction rate α can be derived using Equation (2) [25]:
where is the initial mass of the PCM sample, is the mass of the sample at reaction temperature, and is the final residual mass of the PCM sample after complete decomposition. Expressed as a kinetic rate equation with conversion, the Arrhenius expression used is shown in Equation (3) [25]:
By integrating Equation (3) into the Equation (1), the one step-kinetic equation can be mathematically expressed in Equation (4) [25].
The constant heating rate (K/min) is defined as the gradual rise in temperature with respect to time (where T is the absolute temperature (K), is the activation energy (kJ/mol), β the heating rate (K/min) and the universal gas constant (in J·K−1·mol−1)) and it is expressed in Equation (5):
Equation (6) can be obtained by placing Equation (5) into Equation (4).
The integral representation of Equation (6) is shown below:
A numerical method is used to estimate the cumulative temperature integral p(z).
Conversely, the iso-conversional method obtains the kinetic parameters via constant conversion at a constant heating rate. It is worth mentioning that this approach does not involve prior knowledge about the reaction kinetics, but only needs the degradation temperature of the prepared PCM sample to calculate its reaction rate. The iso-conversional method can be differential or integral, a choice which can be made based on the method being implemented. The methods commonly used to extract kinetic parameters include integral methods such as FWO, KAS, and Starink, etc. Hence, in this study, the authors explored three iso-conventional models, which are called model-free methods, for kinetic determination, as recommended by ICTAC. The Kissinger–Akahira–Sunose (KAS), Flynn–Wall–Ozawa (FWO) and Starink models fall into this category. Specifically, the activation energy (Ea) values were obtained by means of Equation (8), Equation (9) and Equation (10) for the KAS, FWO, and Starink methods, respectively.
The activation energy of the aforementioned model-free methods were determined for the respective conversion rates interval (i.e., at step size of 0.1) by obtaining the slope of regression line for at and versus at various heating rates.
4. Machine Learning Methods
In this study, thermogravimetric analysis (TGA) was used to explore the degradation of phase change materials; several machine learning algorithms were to be trained up using the above-mentioned data. The appropriate models for the analysis include linear regression, polynomial regression, decision tree, gradient boosting, Gaussian process, K-nearest neighbors (KNNs), and random forest (RF). Descriptions of these machine learning models are clearly provided in our previous research works [25,41]. These algorithms were employed to predict trends in thermal degradation, utilizing the experimental data that was acquired through TGA tests with different heating rates. When evaluating the performance of the models, we used two important metrics, R2 (the coefficient of determination) and the root mean squared error (RMSE) (Equation (11)), to determine the better ML model. R2 (Equation (12)) indicates the proportion of variance in the data that the model can explain, while RMSE measures the accuracy of the model’s predictions, with lower values indicating better performance [41].
The comparison of those techniques allowed us to evaluate and finally choose the most suitable algorithm(s) to describe the degradation kinetics of the various PCM samples.
5. Results
The activation energy was calculated using three iso-conventional model-free methods: Kissinger–Akahira–Sunose (KAS), Starink, and Flynn–Wall–Ozawa (FWO). Comparison of Values: The values of the activation, obtained using the above three models, were compared with each other. PAN equipment was used to analyze pure PCM by TGA at three heating rates—15 °C/min, 25 °C/min, and 30 °C/min—in a nitrogen atmosphere, where the PCM was heated between 25 °C to 900 °C. The results show that the degradation onset temperature increases with increasing heating rate. The values of the degradation onset temperature were 670.24 °C, 702.76 °C, and 730.15 °C for heating rates of 15 °C/min, 25 °C/min, and 30 °C/min, respectively. The temperature of the maximum mass weight loss is in the range from 680 °C to 900 °C. The degradation onset temperature values of composite PCM, determined by using TGA analysis at different heating rates (10 °C/min, 15 °C/min, 20 °C/min, and 25 °C/min), are observed as 556.58 °C, 556.88 °C, 569.64 °C, and 565.37 °C, respectively. The values differ slightly with the heating rate due to thermal hysteresis. As shown in Figure 5 and Figure 6, the degradation temperature of composite PCM was lower than that of pure PCM (556.88 °C vs. 670.24 °C) before the 556.88 °C temperature onset at a heating rate of 15 °C/min, as shown in the Figure 5 and Figure 6. The TGA plots confirm that the decomposition start temperature is reduced by 16.91% with the addition of biochar in the composite PCM.
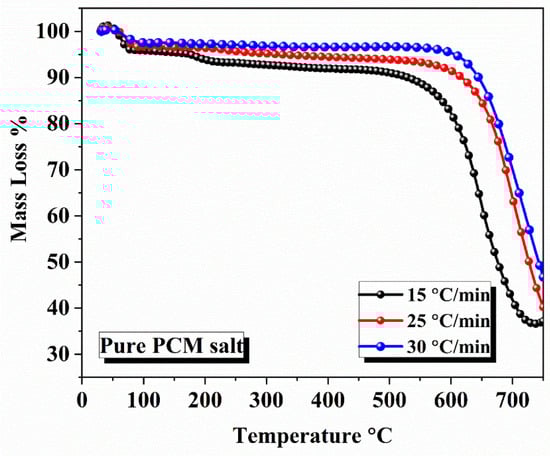
Figure 5.
TGA plots of pure PCM salt at different heating rates.
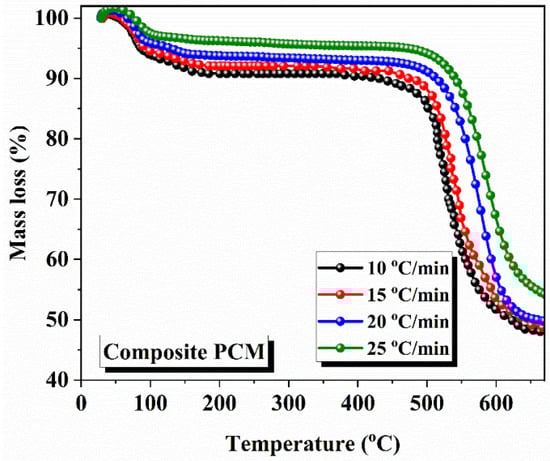
Figure 6.
TGA plots of composite solar salt PCM at different heating rates.
Figure 5 and Figure 6 show mass losses versus temperature, with all the samples displaying a single-stage decomposition profile. In these varying diagrams, the one-stage mass loss profile can be seen indicative of the one-stage thermal decomposition profile, occurring at the maximal temperature of the eutectic NaNO3-KNO3 mixture. Specifically, there appears to be a longer time frame at the temperature range where there is no mass loss; then, rapid mass loss occurs at the onset temperature of degradation. The derivatives of the mass loss rates show all three ramp rates. The onset temperatures were 670.24 °C, 702.76 °C, and 730.15 °C, respectively; this was the fast-decomposition first-order reaction where the most mass lost (~80%) was seen, with thermal decomposition clearly occurring between 680 °C and 900 °C, shown by the steep downward trajectories of the kinetic parameters at the higher ramp rates. The decomposition reaction occurred more quickly, as suggested by the thermal hysteresis, showing that there truly was not much of a time frame for the material to equilibrate prior to mass loss being observed. Beyond 900 °C, the curves can be seen to flatten, suggesting almost total thermal decomposition (the recovery mass was essentially negligible at this point). However, the curves in Figure 6 show far more gradual mass loss to ~550 °C, with an incline, and the curves become sharper as mass begins to decline, indicating the first signs of thermal degradation between 556.58 °C and 569.64 °C, as noted in Section 5. The mass loss and the rate of increase in degradation were compounded compared to block heating rates with respect to the impact of thermal hysteresis on the thermal decomposition relative to the heating rate, which was lowest at higher heating rates (25 °C/min; 565.37 °C) versus lower heating rates (10 °C/min; 556.58 °C), causing some blocking of heat transfer via the biochar packing method. This suggests to us that the biochar would reduce thermal stability and likely be continuously updated with pure PCM rather than composite PCM to display onset at 670.24 °C.
5.1. Degradation Kinetic Analysis of Pure PCM and Composite Solar Salt PCM
The kinetic analysis of pure PCM and composite PCM was performed using three methods. Using the TGA data, we initially determined the average temperature value at each conversion point. For all heating rates, we found that as conversion increases, the average temperature increases. The variation in average temperature at different heating rates with respect to the degree of conversion of pure PCM and composite solar salt PCM is shown in Table 3 and Table 4, respectively. The same evaluation of kinetic analysis of pure PCM and composite PCM is highlighted in Figure 7 and Figure 8.
Table 3.
Degree of conversion vs. temperature for pure PCM sample.
Table 4.
Degree of conversion vs. temperature for composite solar salt PCM sample.
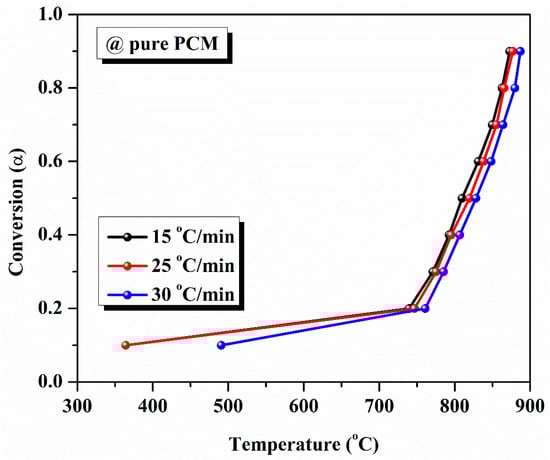
Figure 7.
Conversion curve for pure PCM at varying heating rates.
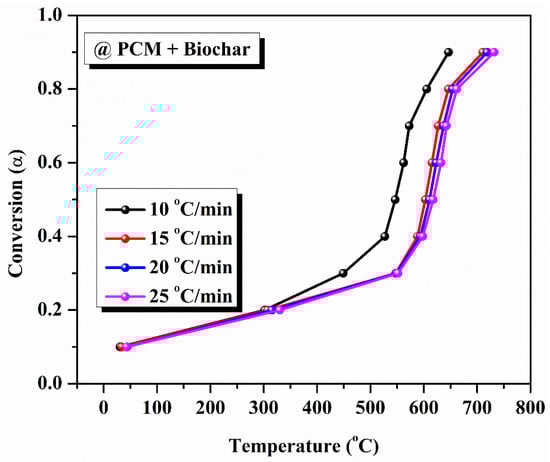
Figure 8.
Conversion curve for composite solar salt PCM at varying heating rates.
As demonstrated, the model-free approach was used to evaluate the degradation kinetics of different PCM samples. We performed a model-free kinetic analysis that defined the relationship between the conversion level and the activation energy (the energy required to stop the degradation reaction). The activation energy of pure eutectic PCM was calculated using various model-free methods like KAS, FWO, and Starink. The determination of activation energy was performed as per the steps described previously. For pure PCM, the average activation energies obtained from KAS, FWO, and Starink methods are 581.73 kJ/kmol, 570.47 kJ/mol, and 581.31 kJ/mol, respectively, highlighted in Figure 9. The average activation energy values, determined using the KAS, FWO, and Starink methods for composite solar salt PCM, are 51.67 kJ/mol, 62.124 kJ/mol and 51.383 kJ/mol, respectively, as shown in the Figure 10.
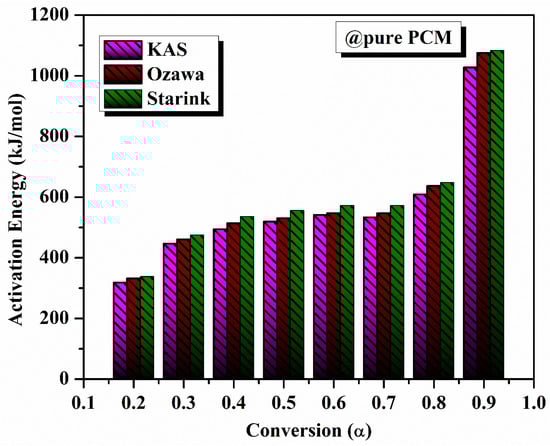
Figure 9.
Variation in activation energy with conversion for pure PCM.
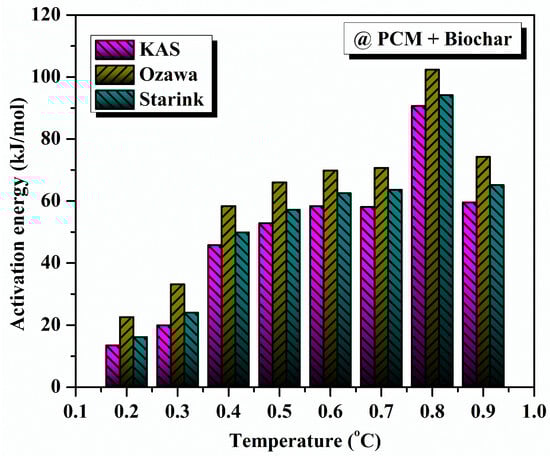
Figure 10.
Activation energy variation with conversion for composite solar salt PCM.
There was remarkable consistency across the three methods, with very similar predictive values. KAS and Starink obtained virtually the same values, while FWO had a small deviation from the results of KAS and Starink. This suggests the kinetic parameters attained from each method are robustly reliable, capturing the energy barrier required for thermal degradation equally, regardless of heating rate.
Thermal hysteresis occurs here via faster heating rates, allowing less time for decomposition to begin due to kinetic restrictions. This behaviour further reinforces the importance of considering the effects of heating rates in thermal energy storage applications through a proper evaluation of the impact on operating stability of the PCM. The general agreement of KAS, Starink, and FWO methods supports their usability in characterizing the thermal degradation kinetics of pure solar salt PCM, and provides reliable datasets in determining the medium-temperature thermal energy storage performance potential.
The non-monotonic behaviour of the activation energy of the PCM-biochar composite is portrayed in Figure 10. This behaviour can be attributed to the heterogeneity of the composite and the variability in degradation kinetics imparted to the composite by the porous structure of the biochar. In comparison, pure PCM (Figure 9) experiences a more homogenous decomposition, while in the biochar composite, multi-step processes occur, whereby the initial step is the volatilisation of surface-adsorbed species, distinguished from the degradation of the encapsulated PCM that is seated in the biochar pores, as indicated in the SEM image. Consequently, the observed fluctuations in activation energy reflect changes in the degradation mechanism that becomes dominant at different conversion stages as the processes compete.
5.2. Machine Learning for Thermal Property Prediction and Optimization
Figure 11 shows the pair plot of the TGA dataset, which effectively aids in exploratory data analysis by helping to examine relationships between input features. It displays scatter plots for each pair of variables, making it easier to identify correlations, patterns, and potential outliers. The diagonal plots illustrate feature distributions, providing valuable insights into data spread. From Figure 11, it is evident that as the heating rate (°C/min) increases, the temperature (i.e., °C) rises significantly. Additionally, the presence of biochar has a notable impact on the degradation temperature of the PCM sample, lowering the operating temperature at each heating rate.
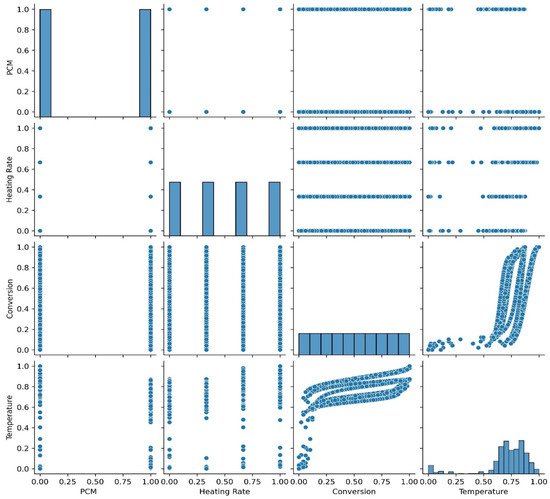
Figure 11.
Pair plot of TGA dataset.
Figure 12 displays a heatmap plot. This is a crucial visualization tool in machine learning, primarily used for correlation analysis to identify relationships between features and detect multicollinearity, aiding in effective feature selection. Additionally, heatmaps are commonly employed to evaluate model performance, such as visualizing a confusion matrix in dataset. The analysis utilizes the Pearson correlation coefficient (PCC) to assess the connections among dependent and independent variables. The PCC, ranging from −1 to +1, quantifies the linear correlation between these variables. A PCC coefficient approaching 1 signifies a strong direct linear relationship, while values near −1 indicate a significant inverse linear connection. A PCC coefficient near 0 suggests the lack of a substantial linear association between the independent variables. From Figure 12, it can be observed that the P-value for the relationship between the type of PCM and temperature is −0.35, indicating the existence of an inverse relationship. In contrast, the heating rate and temperature exhibit a positive linear relationship, with a P-value of 0.14. Among all features, the conversion rate has the most significant impact, directly influencing the degradation temperature; higher conversion rates correspond to higher degradation temperatures.
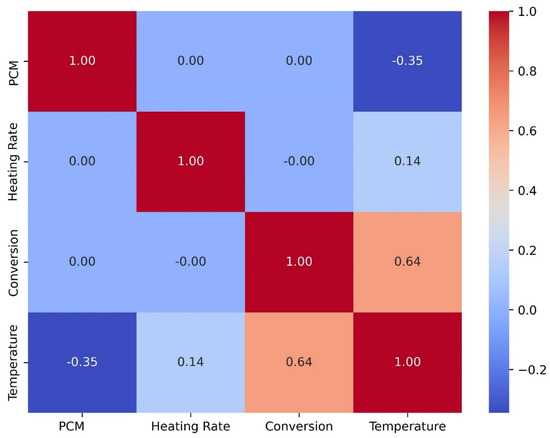
Figure 12.
Heatmap plot of TGA dataset.
Figure 13a–g illustrate the performance of each model, showing the observed versus predicted TGA data for each algorithm. As the figures progress from linear regression (Figure 13a) to KNN regression (Figure 13b), a clear improvement in model accuracy is evident, with the prediction curves becoming increasingly closer to the observed experimental data. The initial output, Figure 13a, shows significant deviation from the observed values, particularly at higher temperatures. However, as the models improve, Figure 13b through Figure 13f show better alignment with the observed data, with the curves of polynomial regression, Gaussian processing, and KNN regression (Figure 13e–g) exhibiting minimal deviations from the experimental values.
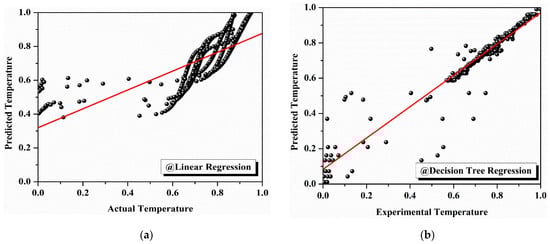
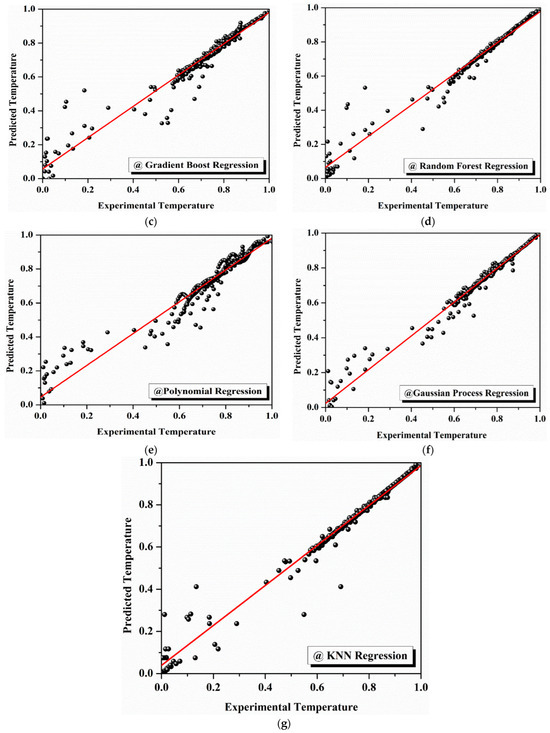
Figure 13.
Machine learning models for thermal property prediction: (a) comparison of actual and predicted temperatures using linear regression; (b) comparison of actual and predicted temperatures using decision tree regression; (c) comparison of actual and predicted temperatures using gradient boost regression; (d) comparison of actual and predicted temperatures using random forest regression; (e) comparison of actual and predicted temperatures using polynomial regression; (f) comparison of actual and predicted temperatures using Gaussian process regression; (g) comparison of actual and predicted temperatures using KNN regression.
In the trial, the performance using the linear regression model was the worst, showing values of R2 = 0.5149 and RMSE = 0.1461, meaning that the model only captured around 51% of the variance in the experimental data. This indicates that linear regression does not accurately model the degradation kinetics of the PCM used in this study. Conversely, decision tree regression showed an excellent improvement, arriving at an R2 of 0.8571 and an RMSE of 0.0793. It assigned higher dependence to the model with experimental data, but still improved.
Gradient boosting regression proved to be even better, with an R2 value of 0.8846 and an RMSE value of 0.0713. This increased R2 value indicated that the model exposed nearly 88% of variance in the TGA data with relatively a low prediction error, adequately justifying that it was appropriate for this type of analysis. Similarly, random forest regression also performed fairly well, with an R2 value of 0.8866 and an RMSE of 0.0706, indicating almost similar performance relative to gradient boosting, even if marginal improvement is required in terms of predictive accuracy. Polynomial regression (second-degree polynomial regression i.e., at n-degree value = 2) improved the results even further, reaching values of R2 = 0.9393 and RMSE = 0.0517. This model accounted for almost 94% of the variance in the degradation data, a significantly better fit than exhibited by the previous models. Prediction accuracy was improved even more with the Gaussian process regression model, where the R2 was 0.9662 and the RMSE was 0.0385. This means that Gaussian process regression was able to account for more than 96% of the variance in the experimental data, highlighting its accuracy and predictive power as one of the best-performing models. Overall, the best model was K-nearest neighbor (KNN) regression which gave the following values: R2 = 0.9770 and RMSE = 0.0318. This model explained greater than 97% of variance in the TGA data with the lowest root mean square error (RMSE) value, indicating it provided the best fit regarding the observed degradation kinetics of the PCM samples. The statistical indices parameters, such as the RMSE and R2 values of the machine learning models developed, are listed in Table 5.
Table 5.
Sensitivity report of developed machine learning models.
The composite solar salt phase change material underwent FTIR analysis after being held at temperatures below its decomposition threshold for 2880 h to evaluate its long-term stability in high-temperature environments. The FTIR spectra of the examined sample are illustrated in Figure 14, showing distinct peaks associated with NaNO3, KNO3, and biochar. Notably, no new peaks emerged during the extended exposure period, which suggests that the biochar particles remain inert and do not contribute to decomposition or initiate any new chemical reactions beneath the degradation onset temperature. These findings indicate that the composite PCM retains excellent chemical stability, even at elevated operating temperatures. Therefore, this prepared composite solar salt PCM exhibits outstanding durability over time under such conditions.
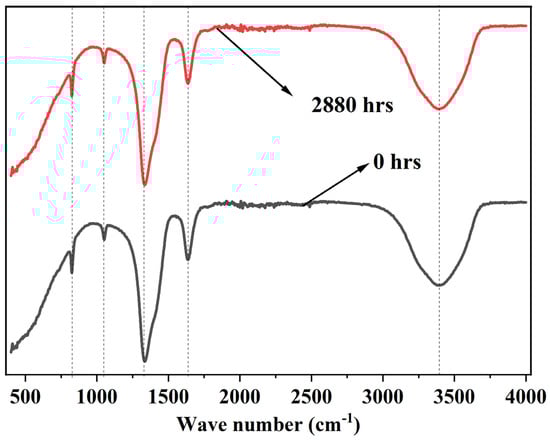
Figure 14.
FTIR spectra of composite solar salt PCM before and after 2880 hrs exposure near onset of degradation temperature.
6. Conclusions
In this study, TGA analysis of samples of pure solar salt and composite solar salt PCM samples was carried out using a variety of heating rates. The activation energies of both the pure solar salt and composite solar salt PCM sample were evaluated using a variety of different kinetic models such as KAS, FWO, and Starink models. Using these models, the average activation energy values calculated for pure solar salt PCM samples were 581.73 kJ/mol, 570.47 kJ/mol, and 581.31 kJ/mol, respectively. For the composite solar salt PCM sample, the calculated experimental average activation energies are 51.67 kJ/mol, 62.124 kJ/mol, and 51.383 kJ/mol, respectively. The thermal stability of the composite solar salt PCM material is evaluated to assess thermal stability over a long period of time by heating the sample at a temperature below the degradation onset temperature for 2880 h. The results show that the composite solar salt PCM exhibited good chemical stability under long-term temperature elevation. In addition, several machine learning models were constructed in order to predict the thermal degradation behaviour of the PCM samples. These models included linear regression, decision tree regression, gradient boosting regression, random forest regression, polynomial regression, Gaussian process regression, and KNN regression. These machine learning models demonstrated strong predictive capability based on the TGA experimental data, and KNN regression had the best results overall, showing an R2 score of 0.977 and an RMSE of 0.0318, which were the best out of the various machine learning models constructed. The models generated could accurately predict the experimental TGA dataset of PCM samples across a wide range of operating conditions. In summary, the findings of this work add to a better understanding of the thermal degradation that composite solar salt PCM undergoes when it is used for medium-temperature thermal storage applications.
Author Contributions
Conceptualization, R.K.K., S.P., K.K.P., and A.S.D.M.; methodology, R.K.K., S.M., M.S.G., S.P., and R.R.; software, R.K.K., S.P., and A.S.D.M.; validation, R.K.K., S.P., and K.K.P.; formal analysis, R.K.K.; investigation, R.K.K.; resources, R.K.K., S.M., M.S.G., S.P., R.R., K.K.P., A.S.D.M., and D.G.; data curation, R.K.K., S.M., M.S.G., R.R., K.K.P., and A.S.D.M.; writing—original draft preparation, R.K.K., S.M., M.S.G., S.P., R.R., K.K.P., and A.S.D.M.; writing—review and editing, R.K.K., S.P., and D.G.; visualization, R.K.K., and S.P.; supervision, R.R., A.S.D.M., and D.G.; project administration, R.K.K., S.P., and A.S.D.M.; funding acquisition, R.K.K., S.P., and A.S.D.M. All authors have read and agreed to the published version of the manuscript.
Funding
The research funding from the Ministry of Science and Higher Education of the Russian Federation (Ural Federal University Program of Development within the Priority-2030 Program).
Data Availability Statement
The original contributions presented in this study are included in the article. Further inquiries can be directed to the corresponding authors.
Conflicts of Interest
The authors declare that they have no known competing financial interests or personal relationships that could have appeared to influence the work reported in this paper.
References
- Wan, Y.; Chen, Y.; Cui, Z.; Ding, H.; Gao, S.; Han, Z.; Gao, J. A Promising Form-Stable Phase Change Material Prepared Using Cost Effective Pinecone Biochar as the Matrix of Palmitic Acid for Thermal Energy Storage. Sci. Rep. 2019, 9, 11535. [Google Scholar] [CrossRef]
- Ma, F.; Liang, Y.; Tao, Z.; Guo, X.; Guo, Q.; Liu, Z. A Novel PCM/Expanded Graphite Composite Sphere with High Thermal Conductivity and Excellent Shape Stability Used for a Packed-Bed Thermal Energy System. Diam. Relat. Mater. 2024, 145, 111102. [Google Scholar] [CrossRef]
- Saleel, C.A. A Review on the Use of Coconut Oil as an Organic Phase Change Material with Its Melting Process, Heat Transfer, and Energy Storage Characteristics. J. Therm. Anal. Calorim. 2022, 147, 4451–4472. [Google Scholar] [CrossRef]
- Tyagi, V.V.; Chopra, K.; Sharma, R.K.; Pandey, A.K.; Tyagi, S.K.; Ahmad, M.S.; Sarı, A.; Kothari, R. A Comprehensive Review on Phase Change Materials for Heat Storage Applications: Development, Characterization, Thermal and Chemical Stability. Sol. Energy Mater. Sol. Cells 2022, 234, 111392. [Google Scholar] [CrossRef]
- Yan, X.; Zhao, H.; Feng, Y.; Qiu, L.; Lin, L.; Zhang, X.; Ohara, T. Excellent Heat Transfer and Phase Transformation Performance of Erythritol/Graphene Composite Phase Change Materials. Compos. Part. B Eng. 2022, 228, 109435. [Google Scholar] [CrossRef]
- Hassan, N.; Minakshi, M.; Ruprecht, J.; Liew, W.Y.H.; Jiang, Z.-T. A Binary Salt Mixture LiCl–LiOH for Thermal Energy Storage. Materials 2023, 16, 1434. [Google Scholar] [CrossRef]
- Hassan, N.; Minakshi, M.; Liew, W.Y.H.; Amri, A.; Jiang, Z.-T. Thermal Characterization of Binary Calcium-Lithium Chloride Salts for Thermal Energy Storage at High Temperature. Energies 2023, 16, 4715. [Google Scholar] [CrossRef]
- Senthilkumar, M.; Balasubramanian, K.R.; Kottala, R.K.; Sivapirakasam, S.P.; Maheswari, L. Characterization of Form-Stable Phase-Change Material for Solar Photovoltaic Cooling. J. Therm. Anal. Calorim. 2020, 141, 2487–2496. [Google Scholar] [CrossRef]
- Ravi Kumar, K.; Balasubramanian, K.R.; Jinshah, B.S.; Abhishek, N. Experimental Analysis and Neural Network Model of MWCNTs Enhanced Phase Change Materials. Int. J. Thermophys. 2021, 43, 11. [Google Scholar] [CrossRef]
- Gür, M.; Gürgenç, E.; Coşanay, H.; Öztop, H.F. Novel Nano-Y2O3/Myristic Acid Nanocomposite PCM for Cooling Performances of Electronic Device with Various Fin Designs. J. Energy Storage 2024, 100, 113646. [Google Scholar] [CrossRef]
- Ramaraj, B.K.; Kottala, R.K. Preparation and Characterisation of Binary Eutectic Phase Change Material/Activated Porous Bio Char/Multi Walled Carbon Nano Tubes as Composite Phase Change Material. Fuller. Nanotub. Carbon. Nanostruct. 2023, 31, 75–89. [Google Scholar] [CrossRef]
- Li, Y.; Li, P.; Zhu, Q.Z.; Li, Q.F. Preparation and Thermal Characterization of Nitrates/Expanded Graphite Composite Phase-Change Material for Thermal Energy Storage. Int. J. Thermophys. 2016, 37, 104. [Google Scholar] [CrossRef]
- Ren, Y.; Xu, C.; Yuan, M.; Ye, F.; Ju, X.; Du, X. Ca(NO3)2-NaNO3/Expanded Graphite Composite as a Novel Shape-Stable Phase Change Material for Mid- to High-Temperature Thermal Energy Storage. Energy Convers. Manag. 2018, 163, 50–58. [Google Scholar] [CrossRef]
- Zhai, M.; Duan, X.; Wen, Z.; Tang, J.; Huang, J.; Shi, F.; Zhang, J.; Wang, J.; Liu, Q. Salt-Resistant, Environment-Friendly Silk/Melanin Composite Aerogel with Directional Channel for Solar-Driven Evaporation. Colloids Surf. A Physicochem. Eng. Asp. 2024, 691, 133913. [Google Scholar] [CrossRef]
- Das, D.; Bordoloi, U.; Muigai, H.H.; Kalita, P. A Novel Form Stable PCM Based Bio Composite Material for Solar Thermal Energy Storage Applications. J. Energy Storage 2020, 30, 101403. [Google Scholar] [CrossRef]
- Zhang, H.-C.; Kang, B.; Sheng, X.; Lu, X. Novel Bio-Based Pomelo Peel Flour/Polyethylene Glycol Composite Phase Change Material for Thermal Energy Storage. Polymers 2019, 11, 2043. [Google Scholar] [CrossRef]
- NematpourKeshteli, A.; Iasiello, M.; Langella, G.; Bianco, N. Using Metal Foam and Nanoparticle Additives with Different Fin Shapes for PCM-Based Thermal Storage in Flat Plate Solar Collectors. Therm. Sci. Eng. Prog. 2024, 52, 102690. [Google Scholar] [CrossRef]
- NematpourKeshteli, A.; Iasiello, M.; Langella, G.; Bianco, N. Optimization of the Thermal Performance of a Lobed Triplex-Tube Solar Thermal Storage System Equipped with a Phase Change Material. Heliyon 2024, 10, e36105. [Google Scholar] [CrossRef]
- Kalidasan, B.; Pandey, A.; Rahman, S.; Buddhi, D.; Tyagi, V. Thermodynamic and Thermal Degradation Kinetics Analysis of Coconut Shell Biomass Based Phase Change Material. IOP Conf. Ser. Earth Environ. Sci. 2023, 1281, 012038. [Google Scholar] [CrossRef]
- Prabhu, B.; Nižetić, S.; Arıcı, M.; Nallamuthu, R. A Comprehensive Assessment on Bio-Mass Derived Form-Stabilized Composite Phase Change Materials for Solar Thermal Energy Storage Systems. J. Energy Storage 2024, 86, 111278. [Google Scholar] [CrossRef]
- Hari, B.; Suresh, S.; Kottala, R.K.; Praveenkumar, S. Synthesis and Characterization of High Thermal Conductive Leak Resistant Phase Change Material for Solar Photovoltaic Panel Cooling Applications. J. Energy Storage 2025, 122, 116656. [Google Scholar] [CrossRef]
- Venkitaraj, K.P.; Suresh, S. Experimental Thermal Degradation Analysis of Pentaerythritol with Alumina Nano Additives for Thermal Energy Storage Application. J. Energy Storage 2019, 22, 8–16. [Google Scholar] [CrossRef]
- Sun, L.; Qu, Y.; Li, S. Co-Microencapsulate of Ammonium Polyphosphate and Pentaerythritol and Kinetics of Its Thermal Degradation. Polym. Degrad. Stab. 2012, 97, 404–409. [Google Scholar] [CrossRef]
- Xiang, L.; Luo, D.; Yang, J.; Sun, X.; Qi, Y.; Qin, S. Preparation and Comparison of Properties of Three Phase Change Energy Storage Materials with Hollow Fiber Membrane as the Supporting Carrier. Polymers 2019, 11, 1343. [Google Scholar] [CrossRef]
- Kottala, R.K.; Chigilipalli, B.K.; Mukuloth, S.; Shanmugam, R.; Kantumuchu, V.C.; Ainapurapu, S.B.; Cheepu, M. Thermal Degradation Studies and Machine Learning Modelling of Nano-Enhanced Sugar Alcohol-Based Phase Change Materials for Medium Temperature Applications. Energies 2023, 16, 2187. [Google Scholar] [CrossRef]
- Balasubramanian, K.R.; Ravi Kumar, K.; Sathiya Prabhakaran, S.P.; Jinshah, B.S.; Abhishek, N. Thermal Degradation Studies and Hybrid Neural Network Modelling of Eutectic Phase Change Material Composites. Int. J. Energy Res. 2022, 46, 15733–15755. [Google Scholar] [CrossRef]
- Lu, Y.; Wang, S.; Zhang, C.; Chen, R.; Dui, H.; Mu, R. Adaptive Maintenance Window-Based Opportunistic Maintenance Optimization Considering Operational Reliability and Cost. Reliab. Eng. Syst. Saf. 2024, 250, 110292. [Google Scholar] [CrossRef]
- Sorour, S.S.; Saleh, C.A.; Shazly, M. A Review on Machine Learning Implementation for Predicting and Optimizing the Mechanical Behaviour of Laminated Fiber-Reinforced Polymer Composites. Heliyon 2024, 10, e33681. [Google Scholar] [CrossRef]
- Shahbaz, P.; Sharma, S.; Ajori, S. Machine Learning Approach on the Prediction of Mechanical Characteristics of Pristine, Boron Doped and Nitrogen Doped Graphene. Phys. Scr. 2023, 98, 126001. [Google Scholar] [CrossRef]
- Zuccarini, C.; Ramachandran, K.; Jayaseelan, D.D. Material Discovery and Modeling Acceleration via Machine Learning. APL Mater. 2024, 12, 090601. [Google Scholar] [CrossRef]
- Jung, S.G.; Jung, G.; Cole, J.M. Gradient Boosted and Statistical Feature Selection Workflow for Materials Property Predictions. J. Chem. Phys. 2023, 159, 194106. [Google Scholar] [CrossRef] [PubMed]
- Liu, F.; Wu, H.; Wu, X.; Xiang, Z.; Huang, S.; Chen, M. Data-Driven Bi-Directional Lattice Property Customization and Optimization. Materials 2024, 17, 5599. [Google Scholar] [CrossRef] [PubMed]
- Guo, P.; Moghaddas, S.A.; Liu, Y.; Meng, W.; Li, V.C.; Bao, Y. Applications of Machine Learning Methods for Design and Characterization of High-Performance Fiber-Reinforced Cementitious Composite (HPFRCC): A Review. J. Sustain. Cem.-Based Mater. 2025, 1–24. [Google Scholar] [CrossRef]
- Liu, Z.; Li, X.; Dai, W.; Liu, J.-J.; Lin, M.-J. Naphthalenediimide and Perylenediimide Based Donor-Acceptor Crystalline Hybrid Materials: Structures and Applications. Coord. Chem. Rev. 2025, 526, 216350. [Google Scholar] [CrossRef]
- Zhang, J.; Wang, L.; Zhong, A.; Huang, G.; Wu, F.; Li, D.; Teng, M.; Wang, J.; Han, D. Deep Red PhOLED from Dimeric Salophen Platinum(II) Complexes. Dye. Pigment. 2019, 162, 590–598. [Google Scholar] [CrossRef]
- Jia, Y.; Chen, G.; Zhao, L. Defect Detection of Photovoltaic Modules Based on Improved VarifocalNet. Sci. Rep. 2024, 14, 15170. [Google Scholar] [CrossRef]
- Yu, Y.; Li, S.; Lu, J.; Xi, F.; Chen, X.; Wu, D.; Ma, W.; Deng, R. Green Recycling of End-of-Life Photovoltaic Modules via Deep-Eutectic Solvents. Chem. Eng. J. 2024, 499, 155933. [Google Scholar] [CrossRef]
- Zheng, H.; Li, Y.; Shi, D.; Cheng, X.; Gong, S.; Wang, X. Preparation and Thermal Property of Unusual Morphology NaNO3 Modified by Solution Combustion for Thermal Energy Storage. J. Energy Storage 2020, 29, 101366. [Google Scholar] [CrossRef]
- Ji, M.; Lv, L.; Liu, J.; Rong, Y.; Zhou, H. NaNO3-KNO3/EG/Al2O3 Shape-Stable Phase Change Materials for Thermal Energy Storage over a Wide Temperature Range: Sintering Temperature Study. Sol. Energy 2023, 258, 325–338. [Google Scholar] [CrossRef]
- Kumar, K.R.; Balasubramanian, K.R.; Kumar, G.P.; Bharat Kumar, C.; Cheepu, M.M. Experimental Investigation of Nano-Encapsulated Molten Salt for Medium-Temperature Thermal Storage Systems and Modeling of Neural Networks. Int. J. Thermophys. 2022, 43, 145. [Google Scholar] [CrossRef]
- Kottala, R.K.; Balasubramanian, K.R.; Jinshah, B.S.; Divakar, S.; Chigilipalli, B.K. Experimental Investigation and Machine Learning Modelling of Phase Change Material-Based Receiver Tube for Natural Circulated Solar Parabolic Trough System under Various Weather Conditions. J. Therm. Anal. Calorim. 2023, 148, 7101–7124. [Google Scholar] [CrossRef]
Disclaimer/Publisher’s Note: The statements, opinions and data contained in all publications are solely those of the individual author(s) and contributor(s) and not of MDPI and/or the editor(s). MDPI and/or the editor(s) disclaim responsibility for any injury to people or property resulting from any ideas, methods, instructions or products referred to in the content. |
© 2025 by the authors. Licensee MDPI, Basel, Switzerland. This article is an open access article distributed under the terms and conditions of the Creative Commons Attribution (CC BY) license (https://creativecommons.org/licenses/by/4.0/).