1. Introduction
The Internet of Things(IoT) has revolutionized the way people live and interact with devices, enabling seamless connectivity and data exchange between various objects, systems, and networks [
1,
2,
3]. However, compared with the traditional Internet, the overall risk of the IoT is also more serious. The IoT has the characteristics of huge scale and wide distribution of devices, multi type communication protocols between devices, also the cloud data center of the IoT sharing data for all devices and users. If there is a vulnerability to network threats, its impact scope is greatly increased compared with the Internet. The asymmetry between normal traffic and attack traffic in statistical distribution, such as traffic patterns, protocol behavior, and temporal characteristics, will be greater. Furthermore, IoT device manufacturers lack unified security standards. This often results in numerous network threats and vulnerabilities in IoT devices. As a result, the likelihood of IoT security risks increases. In fact, the impact of large-scale attacks such as distributed denial of service(DDoS) caused by attackers using the IoT is very significant and widespread. For instance, in October 2016, the Mirai botnet controlled a large number of IoT devices to launch DDoS attacks with a traffic rate of up to 620 Gb/s, resulting in network outages in most of the United States and becoming a landmark event for IoT security [
4].
The characteristics of IIoT and the traditional Internet are also different, so many general intrusion detection algorithms are not applicable. IIoT has the characteristics of industrial networks and IoT, but it also has many differences from the two. This article analyzes its three characteristics and proposes a novel intrusion detection system based on graph neural networks.
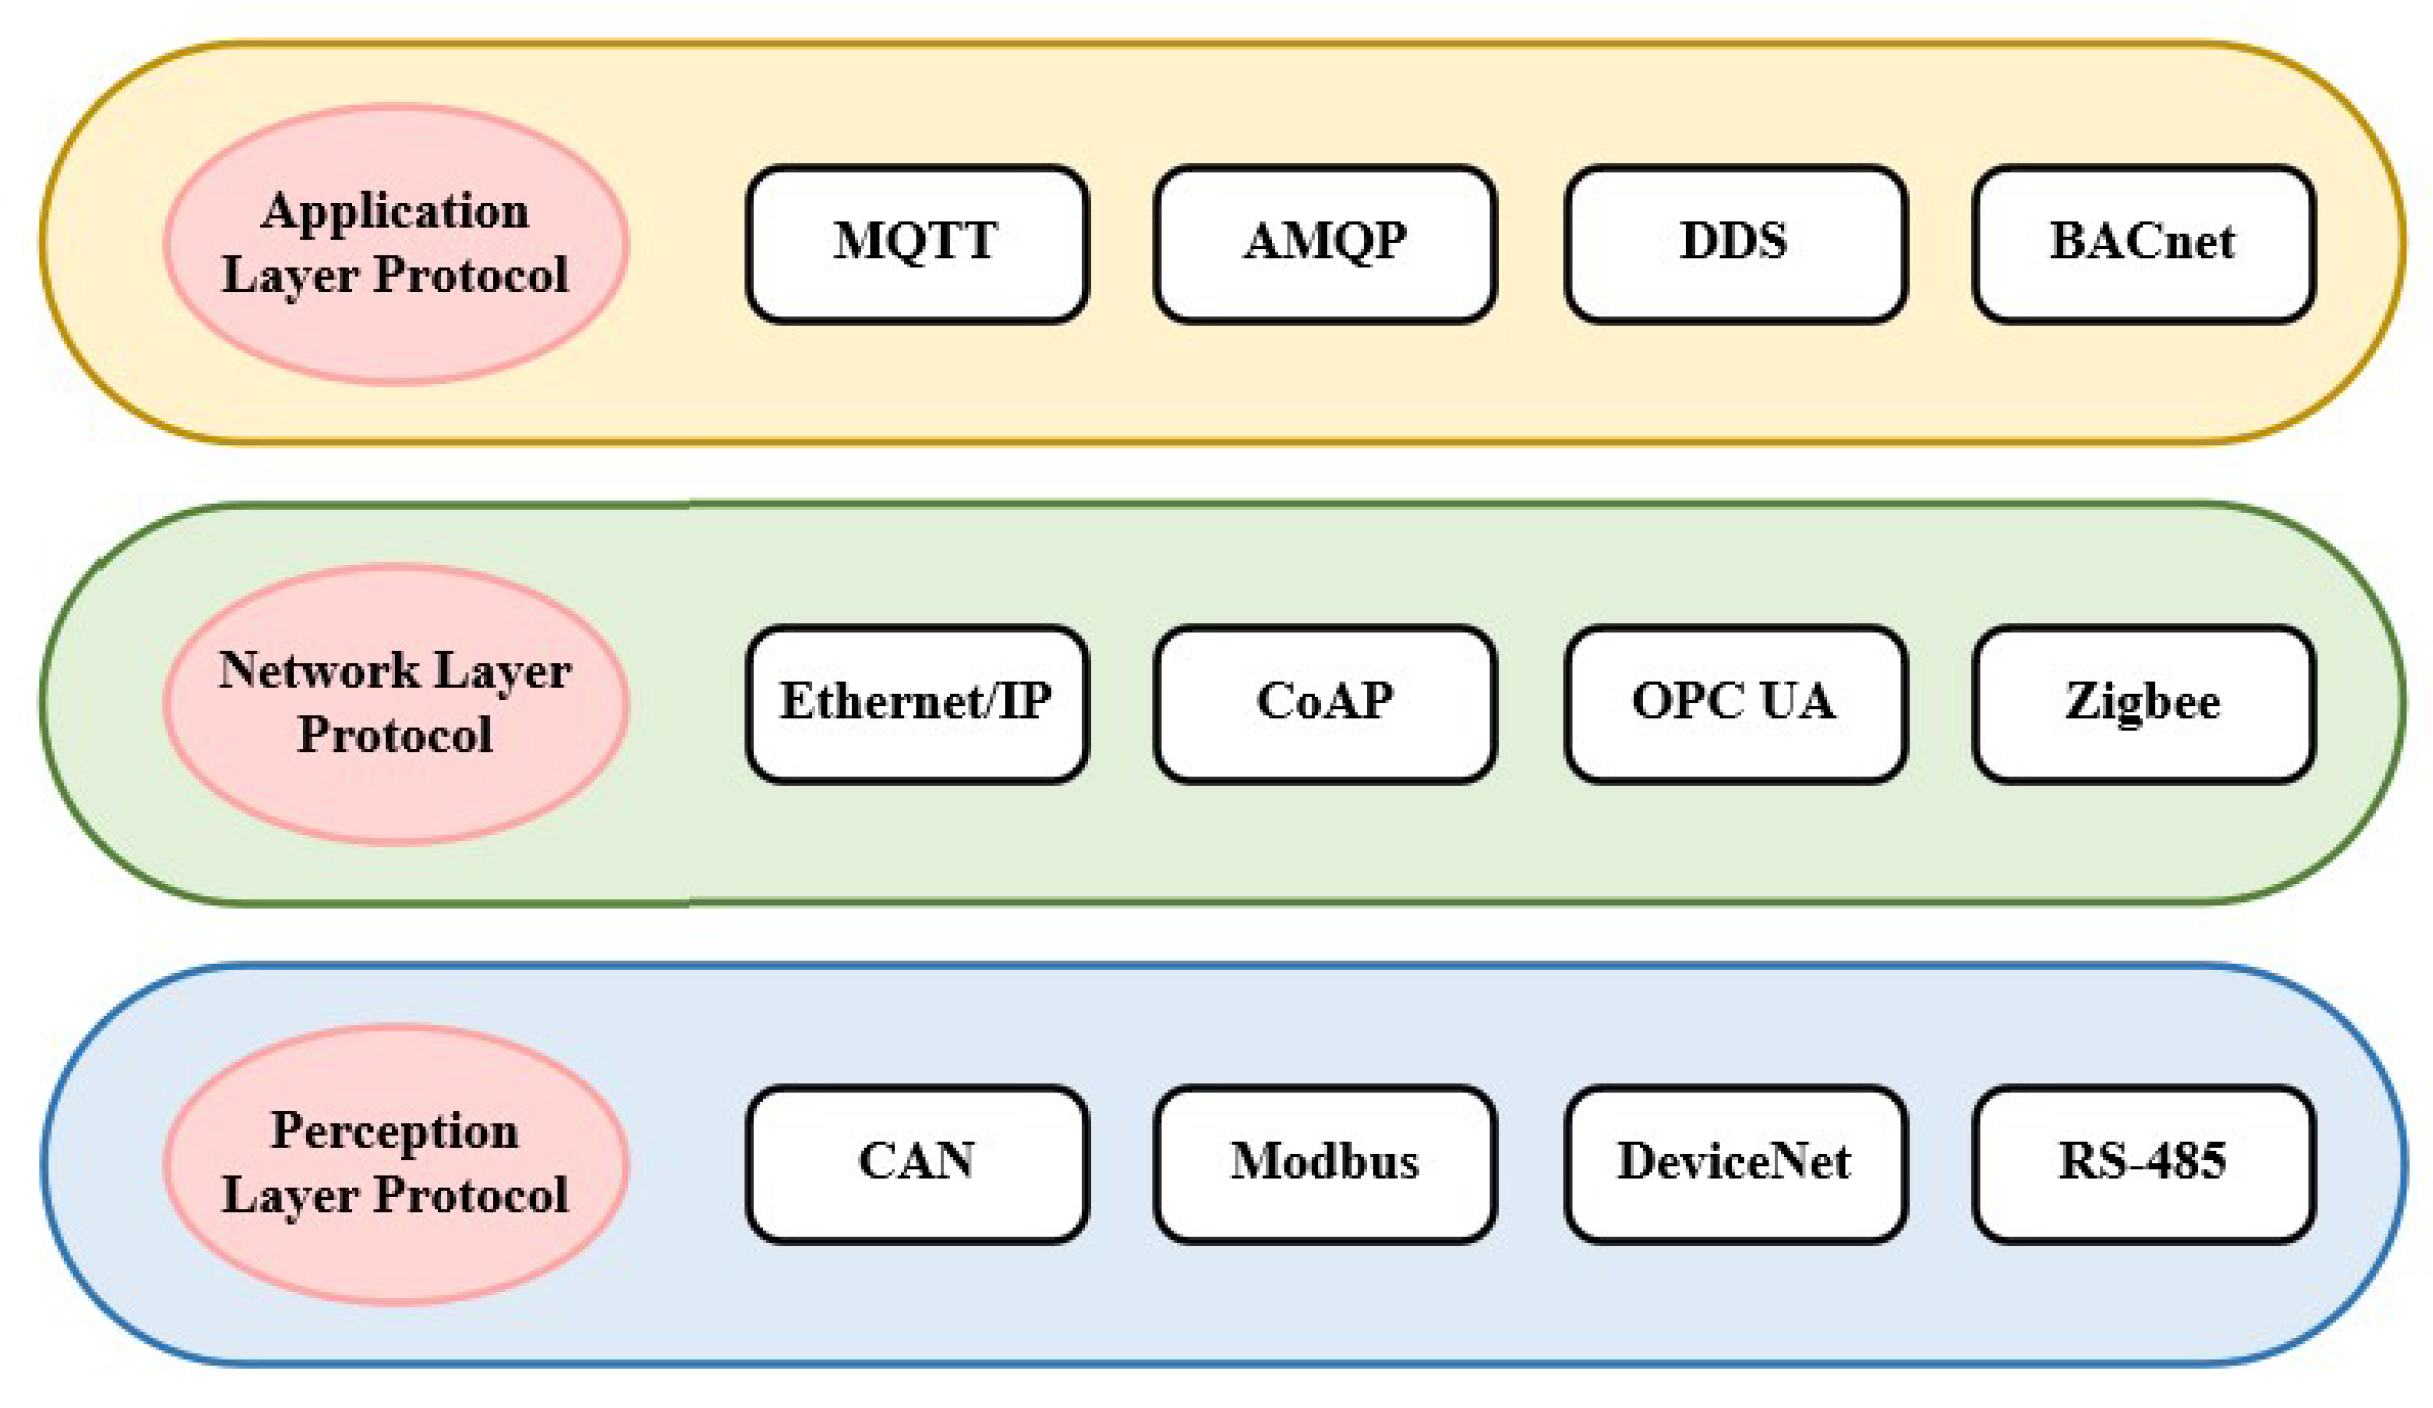
As shown in
Figure 1, the industrial sector encompasses various industries, each with distinct requirements such as real-time performance, reliability, security, energy efficiency, and communication range. As a result, there are numerous IIoT protocols [
5,
6]. In addition, different device manufacturers may also support different protocols, leading to a wide and diverse range of protocols in the industrial Internet of Things [
7].
The network traffic of IIoT has a strong temporal correlation [
8], and most of the data in the IIoT is the transmission command signals of control devices and the physical collection data of perception devices. The transmission of these data has a certain periodicity.
IIoT requires stronger data processing capabilities, stricter real-time requirements, and higher data accuracy and reliability. Currently, the field of industrial control mainly uses Industrial Control Systems (ICS) [
9] to complete real-time data collection, system monitoring, and automatic control and management of industrial processes.
The general intrusion detection algorithm focuses too much on the content characteristics of the traffic, resulting in the correlation between different network traffic being easily ignored and unable to capture the characteristics of traffic structure. Complex networks belong to topological structures, and for a network node, traffic data arrive at every moment. However, traffic data are not independent and often have a certain correlation. The correlation between traffic data often includes the structural characteristics of intrusions.
The diversity and heterogeneity of the IoT make its security distinct from that of traditional systems. IoT networks are composed of randomly distributed devices with various functions, leading to multi-source heterogeneous network traffic characterized by high real-time data demands and large volumes. Due to the lack of labeled abnormal data, traditional anomaly detection algorithms used for the Internet do not perform well in the IoT environment. As a special structure, graphs can effectively describe the structural characteristics of network topology. Over the years, many researches have used network traffic graph or source graph to detect Internet intrusion. Recently, GNN has achieved success in learning graph representations and have high expressive power [
10,
11,
12], making them used for efficient and intuitive detection of anomalies in graphs.
Therefore, this paper proposes an intrusion detection algorithm based on graph neural networks. This article uses mini-batch technology to support parallel data operations in distributed systems. Taking advantage of the strong real-time characteristics of the industrial Internet of Things, focusing on its temporal variation characteristics, LSTM is used to aggregate neighbor information at each time step. This method can simultaneously capture spatial and temporal dependencies. It has universality for scenarios where industrial IoT, a multi type protocol, leads to different abnormal data characteristics.
2. Related Work
2.1. Internet of Things Intrusion Detection
IoT security is a essential aspect that requires a multi-layered approach to ensure the protection of IoT devices, networks, and data. The prominent methods widely discussed and implemented in IoT security are developing security policies and strengthening verification mechanisms. Despite the inclusion of these security mechanisms, the IoT networks remain vulnerable to security threats [
13]. Therefore, IoT network requires a technical system for monitoring intrusion detection [
14]. The intrusion detection system (IDS) has been promoted as a great solution. IDS can significant enhance the security of a network, as well as plays a crucial role in detecting and preventing various security threats and attacks. Although, IDS performance well in traditional network, the challenge in optimize detection mechanism to adapt IoT network is still an urgent problem need to be solve [
15].
Network intrusion detection has expanded the security management capabilities of network administrators from the perspectives of network monitoring, intrusion recognition, and response. According to detection principles, detection techniques can be mainly divided into two categories, including misuse-based intrusion detection techniques [
16] and anomaly-based intrusion detection techniques [
17,
18].
Misuse-based intrusion detection technology [
19,
20] involves comparing collected data with various attack patterns in a predetermined feature knowledge base to determine the presence of an attack, but cannot determine unknown attacks, which has high detection accuracy, low false alarm rate, and relatively mature technology, making it easy to maintain the system. The anomaly-based intrusion detection technology [
21] detects intrusions based on abnormal behavior of the computer and resource usage, first constructing a statistical model of user normal behavior, and then comparing current behavior with the characteristics of normal behavior to detect intrusions. With the rapid development of artificial intelligence technology, AI related technologies have also been widely applied in the field of anomaly-based network intrusion detection.
Nikolopoulos et al. [
21] utilize the system call dependency graph, obtained by capturing taint analysis traces and a set of various similarity metrics to detect whether an unknown test sample is malicious or benign. Buczak et al. [
22] have conducted extensive research on machine learning and data mining methods in this field, emphasizing the complexity and challenges of the methods. Mohammed et al. [
23] utilizes mutual information based feature selection algorithms to process linear and nonlinear correlated data features of network traffic to identify intrusion traffic. Junaid et al. [
24] proposed a framework for IoT leveraging collaboration among resource-constrained sensor and border nodes for detection of intruders.
Intrusions have been detected for years using graphs such as network flow graphs or provenance graphs [
25]. Recently, Graph Neural Networks (GNNs) have become successful in learning graph representations [
26] has high expressive power and is therefore used to efficiently and intuitively detect anomalies in graphs.
2.2. The Application of Graph Neural Network
Recently, with advancements in Convolutional Neural Networks (CNNs) and Graph Representation Learning (GRL), researchers have explored GNN. Unlike traditional neural networks, GNN is specifically designed to process graph-structured data, allowing it to effectively capture complex relationships between nodes and edges [
27]. The structural isomorphism symmetry inherent in GNN critically enhances classification tasks by enabling robust discrimination between normal and abnormal network traffic. By inherently capturing invariant structural patterns, this symmetry allows GNNs to generalize across isomorphic subgraphs, improving detection accuracy for traffic anomalies while maintaining resilience to variations in node ordering or superficial feature noise.
Diagram is a fundamental concept in mathematics and computer science used to represent the relationships between objects. In graph theory, a graph is typically composed of nodes (or vertices) and edges. A graph can be defined as an ordered pair , where V is a non empty finite set representing nodes in the graph, and E is a finite set representing edges between nodes. Set as node, as edge, and the neighbors of the node are represented as .
The core idea behind GNN is to update the representation of nodes by fusing information from adjacent nodes. The general framework of GNN will be introduced in this section. Starting from the initial node representation , two key functions are implemented at each layer to facilitate the message passing process, namely aggregation and update. The general framework of GNN can be mathematically defined as follows.
Initialization: Initial node representation.
Aggregation: This function is responsible for aggregating messages based on the current representation of nodes and their neighbors.
Update: This function is used to calculate the new features of a node based on its current characteristics and incoming messages.
The output can be customized through various mechanisms when graph structure and node content information are input into GNN, addressing different graph analysis tasks.
(1) Node level tasks involve predicting or classifying individual nodes in the graph. Node level tasks mainly utilize the final node representation after the message passing process.
(2) Edge level tasks that focus on predicting connections between edges or nodes. For this task, GNN typically needs to calculate the representation of the edges based on the representation of the connected nodes.
(3) Graph level task, which involves predicting the entire graph. This task typically requires a readout function to aggregate information from all nodes and edges in the graph to generate a graph level representation. Graph level analysis involves examining the entire graph structure to consider the current overall environment and identify various types of attacks.
Graph Sample and aggregate (GraphSAGE) [
28] was the first method designed for information propagation within large graphs, marking a significant advancement for Network Intrusion Detection Systems (NIDS). This is particularly important because graph structures derived from traffic data are typically extensive. However, the primary goal of NIDS is to identify abnormal network traffic, which is generally approached as an edge classification problem since traffic information is integrated into the graph’s edge attributes. This poses a challenge for methods like Graph Convolutional Network (GCN) and GraphSAGE, which are more suited for node and graph-level tasks, limiting their effectiveness in this context. Zheng et al. [
29] learning information from dynamic graphs using GCN and attention mechanisms in sequential models. Chang et al. [
30] designed enhanced E-GraphSAGE and E-ResGAT algorithms, which transformed the original edge classification task into a node classification task by constructing a line graph. Dong et al. [
31] focused on studying the progress of GNN in the IoT. The tasks in this field include intrusion detection, performance diagnosis, time series prediction, and environmental monitoring. They found that applying GNN to IoT intrusion detection is an emerging trend.
However, existing research predominantly concentrates on optimizing graph neural network models during the traffic processing stage. By contrast, there has been insufficient attention paid to the preprocessing phase prior to data transmission to central nodes, resulting in a lack of effective frameworks to establish a integrated intrusion detection system. This study aims to fill these gaps by developing a novel intrusion detection system, which features a detection framework for IIoT, comprising a device-level edge intrusion detection module and a gateway-level centralized intrusion detection module. Additionally, the intrusion detection algorithm has been optimized to significantly enhance detection efficiency.
3. The GIDS Framework
3.1. Framework
In large-scale IIoT scenarios, a large amount of data is uploaded to the data center, which on the one hand causes a lot of data congestion and puts enormous pressure on the data center. On the other hand, when the data center is far from the IIoT subnet, it will generate significant data transmission delays. A novel intrusion detection system has been developed based on the aforementioned considerations, featuring device-level edge detection modules and gateway-level centralized detection modules, with parallel computing capabilities implemented in distributed systems to enhance traffic processing efficiency.
IIoT scenarios often include both intelligent sensors and traditional sensors. Intelligent sensors are not only capable of measuring certain physical quantities or environmental information, but also possess the ability to process, analyze, self learn, and adjust data. This makes smart sensors more suitable for detection tasks in complex environments. In contrast, traditional sensors typically only provide basic data information and require manual intervention to interpret the meaning of this data. Therefore, as shown in the
Figure 2, the device-level edge intrusion detection module can aggregate the data processed by intelligent sensors, while the gateway-level centralized intrusion detection module will collect all the data from traditional sensors before processing.
3.2. Basic Model
The proposed model is based on GraphSAGE. Therefore, the basic model is introduced first. The GraphSAGE algorithm is a node embedding method for graph data, designed for effective node representation learning on large-scale graph data. The main process of the GraphSAGE algorithm can be summarized as the following steps.
(1) Sampling Neighborhood: For each node in the graph, randomly sample a fixed number of nodes from its neighboring nodes.
(2) Aggregating Feature Information: Once neighboring nodes are selected, an aggregation function is used to summarize the feature information of these neighboring nodes. Aggregation functions can be various, such as average pooling, LSTM, Max pooling, etc. Their function is to fuse the features of different neighboring nodes into a fixed length vector representation.
(3) Updating Node Representations: Combining the features of a node itself with the aggregated features of its neighbors typically updates the node’s representation through a nonlinear transformation, such as a simple neural network layer. This step may also include concatenation or weighted summation with the characteristics of the node itself.
(4) Multi-layer Propagation: This process can be iterated multiple times, each iteration is equivalent to expanding the receptive field, so that the node representation is not only based on direct neighbors, but also indirectly includes information from further neighboring nodes.
(5) Generating Node Embedding: After the above process, each node will obtain a final vector representation, which is the embedding of the node and can be used for various downstream tasks, such as node classification, link prediction, etc.
Among them, represents the aggregated representation of adjacent nodes of node , and represents the representation of node at layer l.
4. Industrial Internet of Things Intrusion Detection System Based on Graph Neural Network
Due to the fact that IIoT traffic is a typical real-time big data, its data packets contain a large number of feature attributes, and the correlation between features leads to a high degree of feature redundancy. Therefore, in order to establish an accurate correlation model between traffic characteristics and anomalies, this section intends to use a long short-term memory network aggregator to update node features.
For two different scenarios mentioned above, device-level edge intrusion detection and gateway-level centralized intrusion detection. Traditional sensors act as device units for gateway level, and the gateway collects traffic data to form multiple sets of data with a fixed size. Intelligent sensors, as independent device level devices, collect their own device traffic data to form a data collection called . The dataset , as a subset of the entire training dataset, is referred to as mini-batch. The GIDS model performs forward and backward propagation on each mini-batch to update its parameters.
Figure 3 shows an overview of proposed GIDS algorithm. The GIDS is powered by three tightly coupled components. Firstly, the dataset is divided into training and testing sets, and a network graph is generated. Then, in the next step, the training set network graph is input into the multi-layer supervised training process of the GIDS model for feature aggregation, node representation updates, multi-layer propagation, and node embedding generation. Finally, validation was conducted through the test set.
(1) Figure construction: Once the device is connected to the industrial Internet of Things network, data packets will be generated based on certain configuration functions and application services. These data packets include network configuration information (such as NTP, DNS), routing information between devices and servers, and data generated due to user device interaction. They typically consist of fields used to identify the source and destination of communication. The rest of the record field includes some extended information, such as timestamps, byte counts, packet labels, etc. The network traffic dataset is a collection of data packets generated by a series of source devices and sensors over time. In the graph construction phase, the dataset is partitioned into training and testing sets. The network traffic data within both subsets are then modeled through graph representations.
(2) GIDS model training: Algorithm 1 illustrates the structure of the GIDS model. For each device node, the GraphSAGE model iteratively aggregates adjacent device nodes at a depth of l hops. In each iteration, a set of associated device nodes is sampled to reduce the spatial and temporal complexity of the algorithm. Meanwhile, utilizing the correlated device node information from sampling to enhance the embedded information representation of the current device node. In the
layer, based on the sampling neighborhood
, the device node neighborhood information
aggregated at device node v is represented as
In the formula, represents adjacent device nodes, is the embedding at the device node in the previous layer, and these adjacent device node embedding representations are aggregated into the embedding representation vector of node in the layer.
The aggregation process is as follows: first, use the aggregation function to aggregate the l-hop neighborhood node features of each device node. Then connect the aggregated representation from the sampled neighbors with the node representation of oneself,
. Next, the model weight
was applied and the results were passed to the nonlinear activation function
(such as ReLU) to obtain the final node embedding
,
is the weight matrix with the overall formula being
| Algorithm 1 The GIDS structure |
Input: Graph G Input node feature: mini-batch B Depth length L Non-linearity Weight matrices Differentiable aggregator functions , Output: Vector representations , for all for
do for do AGG: CONCAT: end for end for
|
(3) Test verification: After completing the anomaly detection training, input the embedded representation vector of the generated device association graph nodes into a commonly used anomaly detection classifier to perform classification tasks.
5. Experiments
In the experimental part, this paper evaluates the binary classification task and the multiclass classification task respectively, and verifies the generality and scenario suitability of the models. binary classification task is suitable for scenarios where normal data is known but attack samples are lacking. In real industrial environments, the types of attacks may be unknown or evolving, and the performance of the binary classification task can be evaluated to test the sensitivity of the model to abnormal data. The multiclass classification task, which is suitable for scenarios with known attack types and sufficient labeled data, can help users quickly identify specific attack types and localize threats. The combination of the two tasks verifies the model’s ability to balance between accurate classification of known threats and generalized detection of unknown threats, which meets the needs of dynamic threat environments in industrial scenarios.
5.1. Datasets Description
This experiment selected four datasets of IoT traffic from recent years, including the BoT-IOT dataset [
32], ACI-IoT-2023 dataset [
33] and the OPCUA dataset [
34]. The different distributions of the four datasets result in imbalanced data that can better reflects real-world scenarios. Different datasets can also better detect the universality of the model.
BoT-IoT: The Bot-IoT dataset is a comprehensive and realistic dataset designed to facilitate the development and validation of security analytics applications for IoT environments. The raw network packets (Pcap files) of the BoT-IoT dataset were created in the network range laboratory of the Australian Cybersecurity Centre (ACCS). The dataset aims to promote the development of security analysis applications in IoT operations, especially in network intrusion detection and network forensics systems, which incorporates legitimate and simulated IoT network traffic, along with various types of attacks.
ACI-IoT-2023: The Army Cyber Institute (ACI) Internet of Things (IoT) Network Traffic Dataset 2023 (ACI-IoT-2023) is a novel dataset tailored for machine learning (ML) applications in the realm of IoT network security. This effort focuses on delivering a distinctive and realistic dataset designed to train and evaluate ML models for IoT network environments.
OPCUA: OPCUA dataset is formed by statistics of Cyber-Physical Production Systems (CPPS).The generation of the dataset containing OPC UA traffic was possible due to the setup and execution of a laboratory CPPS testbed. This CPPS uses OPC UA standard for horizontal and vertical communications.
The full OPCUA dataset and ACI-IoT-2023 dataset are utilized in this study, both complete datasets are employed without sampling. Given the substantial scale of the BoT-IoT dataset, a 10% proportionally sampled subset was systematically constructed through randomized selection to maintain representativeness. In terms of training and evaluating data segmentation, 70% of the flow records in each dataset are selected for training, and 30% of the flow records are retained for testing and evaluation.
5.2. Experimental Evaluate
5.2.1. Experimental Implementation
The proposed algorithm is implemented in PyTorch and PyTorch Geometry. The software versions utilized in this study include Python 3.8, PyTorch 1.9.0, CUDA 12.1, and PyTorch Geometry 2.0.2.
Before training, it is necessary to clean the data. Use target encoding techniques to convert non numeric features in the dataset into integer data, and any null or infinite values generated during this process will be replaced with the value 0. Normalize the training and testing sets using the L2 normalization method before generating them.
5.2.2. Evaluation Metrics
Several experiments have been conducted to evaluate the performance and effectiveness of the proposed algorithm. For this purpose, the accuracy rate, precision rate, recall rate and F-measure metrics are applied. The accuracy metric, precision rate and recall rate and F-measure are defined by
where True Positive (
) is the number of actual attacks classified as attacks, True Negative (
) is the number of actual normal records classified as normal ones, False Positive (
) is the number of actual normal records classified as attacks, and False Negative (
) is the number of actual attacks classified as normal records.
5.2.3. Comparison and Results Analysis
This section, two types of labels are used to evaluate the ability of models in detecting abnormal traffic. First, binary classification experiments were performed to evaluate the capability of distinguishing between benign and malicious network flows. Additionally, in accordance with multiple types of attack labels, the multiclass classification are designed experiments to demonstrate the ability for models to identify attack types.
(1): Binary Classification Results: In the binary classification experiment, the
Table 1 shows the corresponding results of comparing the GIDS classifier and F1 Score with the related works in each dataset. From the table, it can be seen that in terms of F1 Score, GIDS performs better than the currently reported classifiers in BoT-IoT, ACI-IoT and OPCUA datasets.
To further validate the performance of the model, as shown in
Figure 4, this paper simulated existing research methods based on a homogenous dataset and compared the proposed method with decision tree model, random forest model, LCCDE model [
35] and Anomal-E model [
36].
(2): Multiclass Classification Results: Multiclass classification task is much harder than binary classification task, which aims to distinguish between different types of attacks and benign traffic. In the multiclass classification experiment, the proposed method was compared against the following baseline NIDS methods, as shown in
Table 2.
Confusion matrix is a fundamental performance measurement technique commonly used to describe the performance of classification models on test datasets, and it was also used to observe the performance of the proposed models. Therefore, the experiment calculated the confusion matrix to demonstrate the effectiveness of the GIDS model. The confusion matrix is shown in
Figure 5.
As shown in the
Figure 5, the GIDS algorithm demonstrates strong robustness on the multi-classification tasks on the ACI-IoT-2023 dataset. The false alarm rates for all categories are low, indicating excellent model generalization. Notably, The false alarm rate for normal traffic is extremely low, which is robust and suitable for practical deployment. Among them, the false negative rate for OS Scan detection is relatively high, likely due to its multi-port probing behavior, which may be confused with normal service scanning.
6. Discussion
The experiments were conducted based on three IoT datasets, including BoT-IoT, ACI-IoT-2023 and OPCUA datasets. BoT-IoT and ACI-IoT-2023 cover general-purpose IoT devices and simulate real network traffic. OPCUA focuses on communication scenarios based on the OPC UA protocol in the industrial IoT, such as the vertical and horizontal communication in the industrial control system. This targeting allows the dataset to directly serve IoT-specific protocol and vulnerability scenarios. The proposed GIDS algorithm performs well on all three datasets in the binary classification task. Its F1 values of 94.34%, 97.68% and 100.00% indicate that the model balances both precision and recall.
The implementation selected Random Forest and Decision Tree, which are widely used classification algorithms in traditional machine learning and have long been used as benchmark models in the field of intrusion detection. By comparing with the classical algorithms, it can be verified whether the GIDS algorithm has advantages in performance, generalization and robustness. Meanwhile, the LCCDE and Anomal-E methods in the field of intrusion detection in recent years are selected as the control experimental group, which can verify whether the GIDS methods has an advantage over similar excellent methods. The GIDS methods consistently outperform these algorithms, demonstrating clear advantages over existing approaches.
It is more difficult in multiclass classification task as compared to binary classification task. The proposed GIDS algorithm experimentally obtained F1 values of 94.55%, 94.12% and 99.99% on the three datasets, which indicates that the model performs well in recognizing all types of cybersecurity attack types with good generalization. Follow-up work is needed to optimize the types of cybersecurity attacks where the model performs poorly. For example, designing specific optimization strategies for OS Scan, optimizing feature engineering related work, and selecting higher-order features needed by the model, such as protocol interaction patterns. Meanwhile, the algorithm proposed in this paper has some limitations in small sample detection, which deserves further research.
7. Conclusions
In this paper, we propose a novel intrusion detection system, different from some recent researches, which designs a detection framework for IIoT, including device-level edge detection module and gateway-level centralized detection module, and implements parallel computing capability in the distributed system to improve the efficiency of traffic processing. The intrusion detection algorithm is also improved to enhance the efficiency. The experimental evaluation based on three IoT NIDS benchmark datasets, implementing extensive evaluation of an GNN-based NIDS for IoT using network flow data. The results show that proposed method performs well, whether solving binary or multi classification problems. In summary, the model effectively leverages the natural distribution characteristics of network traffic across both temporal and spatial dimensions, as experimentally validated on three IoT datasets. For binary classification, the model achieves accuracies of 93.63%, 97.34% and 100%, while for multiclass classification, it attains 92.34%, 93.68%, and 99.99%. Compared to classical intrusion detection methods and recent algorithms, the model demonstrates superior performance in both accuracy and F1-score.


