Article

Cross-Scenario Interpretable Prediction of Coal Mine Water Inrush Probability: An Integrated Approach Driven by Gaussian Mixture Modeling with Manifold Learning and Metaheuristic Optimization

School of Economics and Management, Beijing University of Posts and Telecommunications, Beijing 100876, China
*
Author to whom correspondence should be addressed.
Symmetry 2025, 17(7), 1111; https://doi.org/10.3390/sym17071111
Submission received: 4 June 2025 / Revised: 27 June 2025 / Accepted: 8 July 2025 / Published: 10 July 2025
(This article belongs to the Section Mathematics)

Abstract

Predicting water inrush in coal mines faces significant challenges due to limited data, model generalization, and a lack of interpretability. Current approaches often neglect the inherent geometrical symmetries and structured patterns within the complex hydrological parameter space, rely on local parameter optimization, and struggle with interpretability, leading to insufficient predictive accuracy and engineering applicability under complex geological conditions. This study addresses these limitations by integrating Gaussian mixture modeling (GMM), manifold learning, and data augmentation to effectively capture multimodal hydrological data distributions and reveal their intrinsic symmetrical configurations and manifold structures, thereby reducing feature dimensionality. We then apply a whale optimization algorithm (WOA)-enhanced XGBoost model to forecast water inrush probabilities. Our model achieved an R2 of 0.92, demonstrating a greater than 60% error reduction across various metrics. Validation at the Yangcheng Coal Mine confirmed that this balanced approach significantly enhances predictive accuracy, interpretability, and cross-scenario applicability. The synergy between high accuracy and transparency provides decision makers with reliable risk insights, enabling bidirectional validation with geological mechanisms and supporting the implementation of targeted, proactive safety measures.

1. Introduction

Water inrush incidents in coal mines represent a significant safety threat, marked by a pronounced cascading disaster evolution mechanism. During such incidents, substantial amounts of groundwater stored in high-pressure aquifers can quickly infiltrate the tunnel system through structurally weak zones, destabilizing the ventilation system and resulting in secondary equipment failures, such as power outages and communication disruptions [1,2,3]. Additionally, the coupling of water and rock can trigger instability events, including ceiling collapses and floor heave, creating a vicious cycle of water inrush–surrounding rock failure–secondary water inrush. The ensuing delayed disasters lead to greater environmental damage and increased casualties [4,5,6]. Therefore, optimizing the utilization of limited exploration data for precise water inrush risk assessment and prediction has become a critical focus of contemporary research [7], aspiring to implement proactive risk mitigation measures and enhance preventative strategies [8].
In recent years, with the advancement of intelligent technology and interdisciplinary research, current studies have focused on developing an intelligent control framework that integrates geological, engineering, and monitoring information [9,10,11]. At the mechanistic research level, scholars, both domestically and internationally, have gradually unveiled the dynamic correlation mechanisms between rock fracturing evolution and permeability changes under the stress disturbance from mining activities, based on theories such as the lower three zones [12], rock–water–stress coupling models [13], and dominant structural surface theory [14]. Through numerical simulations—such as the RFPA hydro–mechanical coupling model [15], the MODFLOW groundwater flow model [16], and the COMSOL multiphysics coupling model [17]—semi-quantitative representations of the water inrush disaster processes have been achieved. However, existing models still struggle to accurately depict the synergistic effects of high water pressure, strong disturbances, and heterogeneous geological structures in deep mining [18]. They primarily analyze the mechanisms and developmental trends of water inrush disasters but do not provide site-specific probabilities of water inrush incidents.
In the field of monitoring and early warning, the integration of geophysical methods—such as transient electromagnetic methods and microseismic monitoring—with intelligent systems has become mainstream [19,20,21]. The establishment of three-dimensional seismic exploration [22], GIS spatial analysis [23,24], and dynamic databases for predicting water inrush precursors has significantly improved the accuracy of identifying water inrush pathways [25,26,27]. Nonetheless, the existing technologies still demonstrate insufficient adaptability to complex deep environments. Issues such as the weak anti-interference capabilities of sensors under high-stress conditions and low efficiency in integrating heterogeneous multi-source data hinder the timeliness of early warnings, with false alarm rates for water inrush precursor signal extraction still reaching 20% to 30% [28,29]. Furthermore, the existing monitoring data often exhibit characteristics of small sample sizes and high noise levels; traditional interpolation or oversampling methods tend to distort data distributions, which limits the generalization capabilities of machine learning models.
Data-driven methods for assessing water inrush risks in coal mines have achieved significant improvements. Compared to traditional statistical models, single machine learning models (such as SVMs and BP neural networks) better represent the nonlinear coupling effects of rock–water–stress in deep mining [20,30]. However, parameter optimization often relies on local search strategies, making it difficult to achieve global optimums in high-dimensional, non-convex feature spaces, which compromises prediction stability. While shallow neural networks and static ensemble models (such as bagging and stacking) improve prediction consistency through multi-model fusion [13], their static weight allocation strategies fail to account for the heterogeneity of geological conditions across different mining areas [31]. In addressing the challenges of diverse data source characteristics and limited sample sizes in coal mine water inrush scenarios, traditional oversampling techniques (such as SMOTE) generate synthetic samples through interpolation but neglect the multimodal distribution characteristics of water inrush parameters (for instance, the bimodal characteristics of karst water pressure), leading to discrepancies between expanded data and actual geological conditions [32]. Additionally, existing models often exhibit “black box” characteristics, making it difficult to quantitatively analyze the contributions of key disaster-inducing factors [33,34]. For example, although hidden Markov models (HMM) can capture the temporal patterns of water inrush volumes, their state transition matrices cannot correlate to geological parameters (such as fault dip angles), resulting in a lack of operability in the early warning outcomes [3]. While models based on gray relational analysis attempt to quantify the degrees of correlation among indicators, their weight allocation relies on subjective experience (with differences in expert scoring weights and correlation coefficients of measured data reaching 0.31), thereby diminishing decision-making credibility. Currently, interpretable models are rarely applied in water inrush risk regression prediction. Incorporating explainable AI methods such as SHAP, a unified approach to explain the output of any machine learning model by computing each feature’s contribution to the prediction, and LIME to explain individual predictions by fitting interpretable local surrogate models can reveal key factors and eliminate uncertainties associated with black-box models [35].
In summary, this study proposes a Gaussian mixture–WOA-XGBoost–SHAP integrated framework that systematically addresses core challenges in water inrush prediction for coal mines, including limited data fidelity, inadequate model generalization, and insufficient interpretability. Our main contributions include the following:
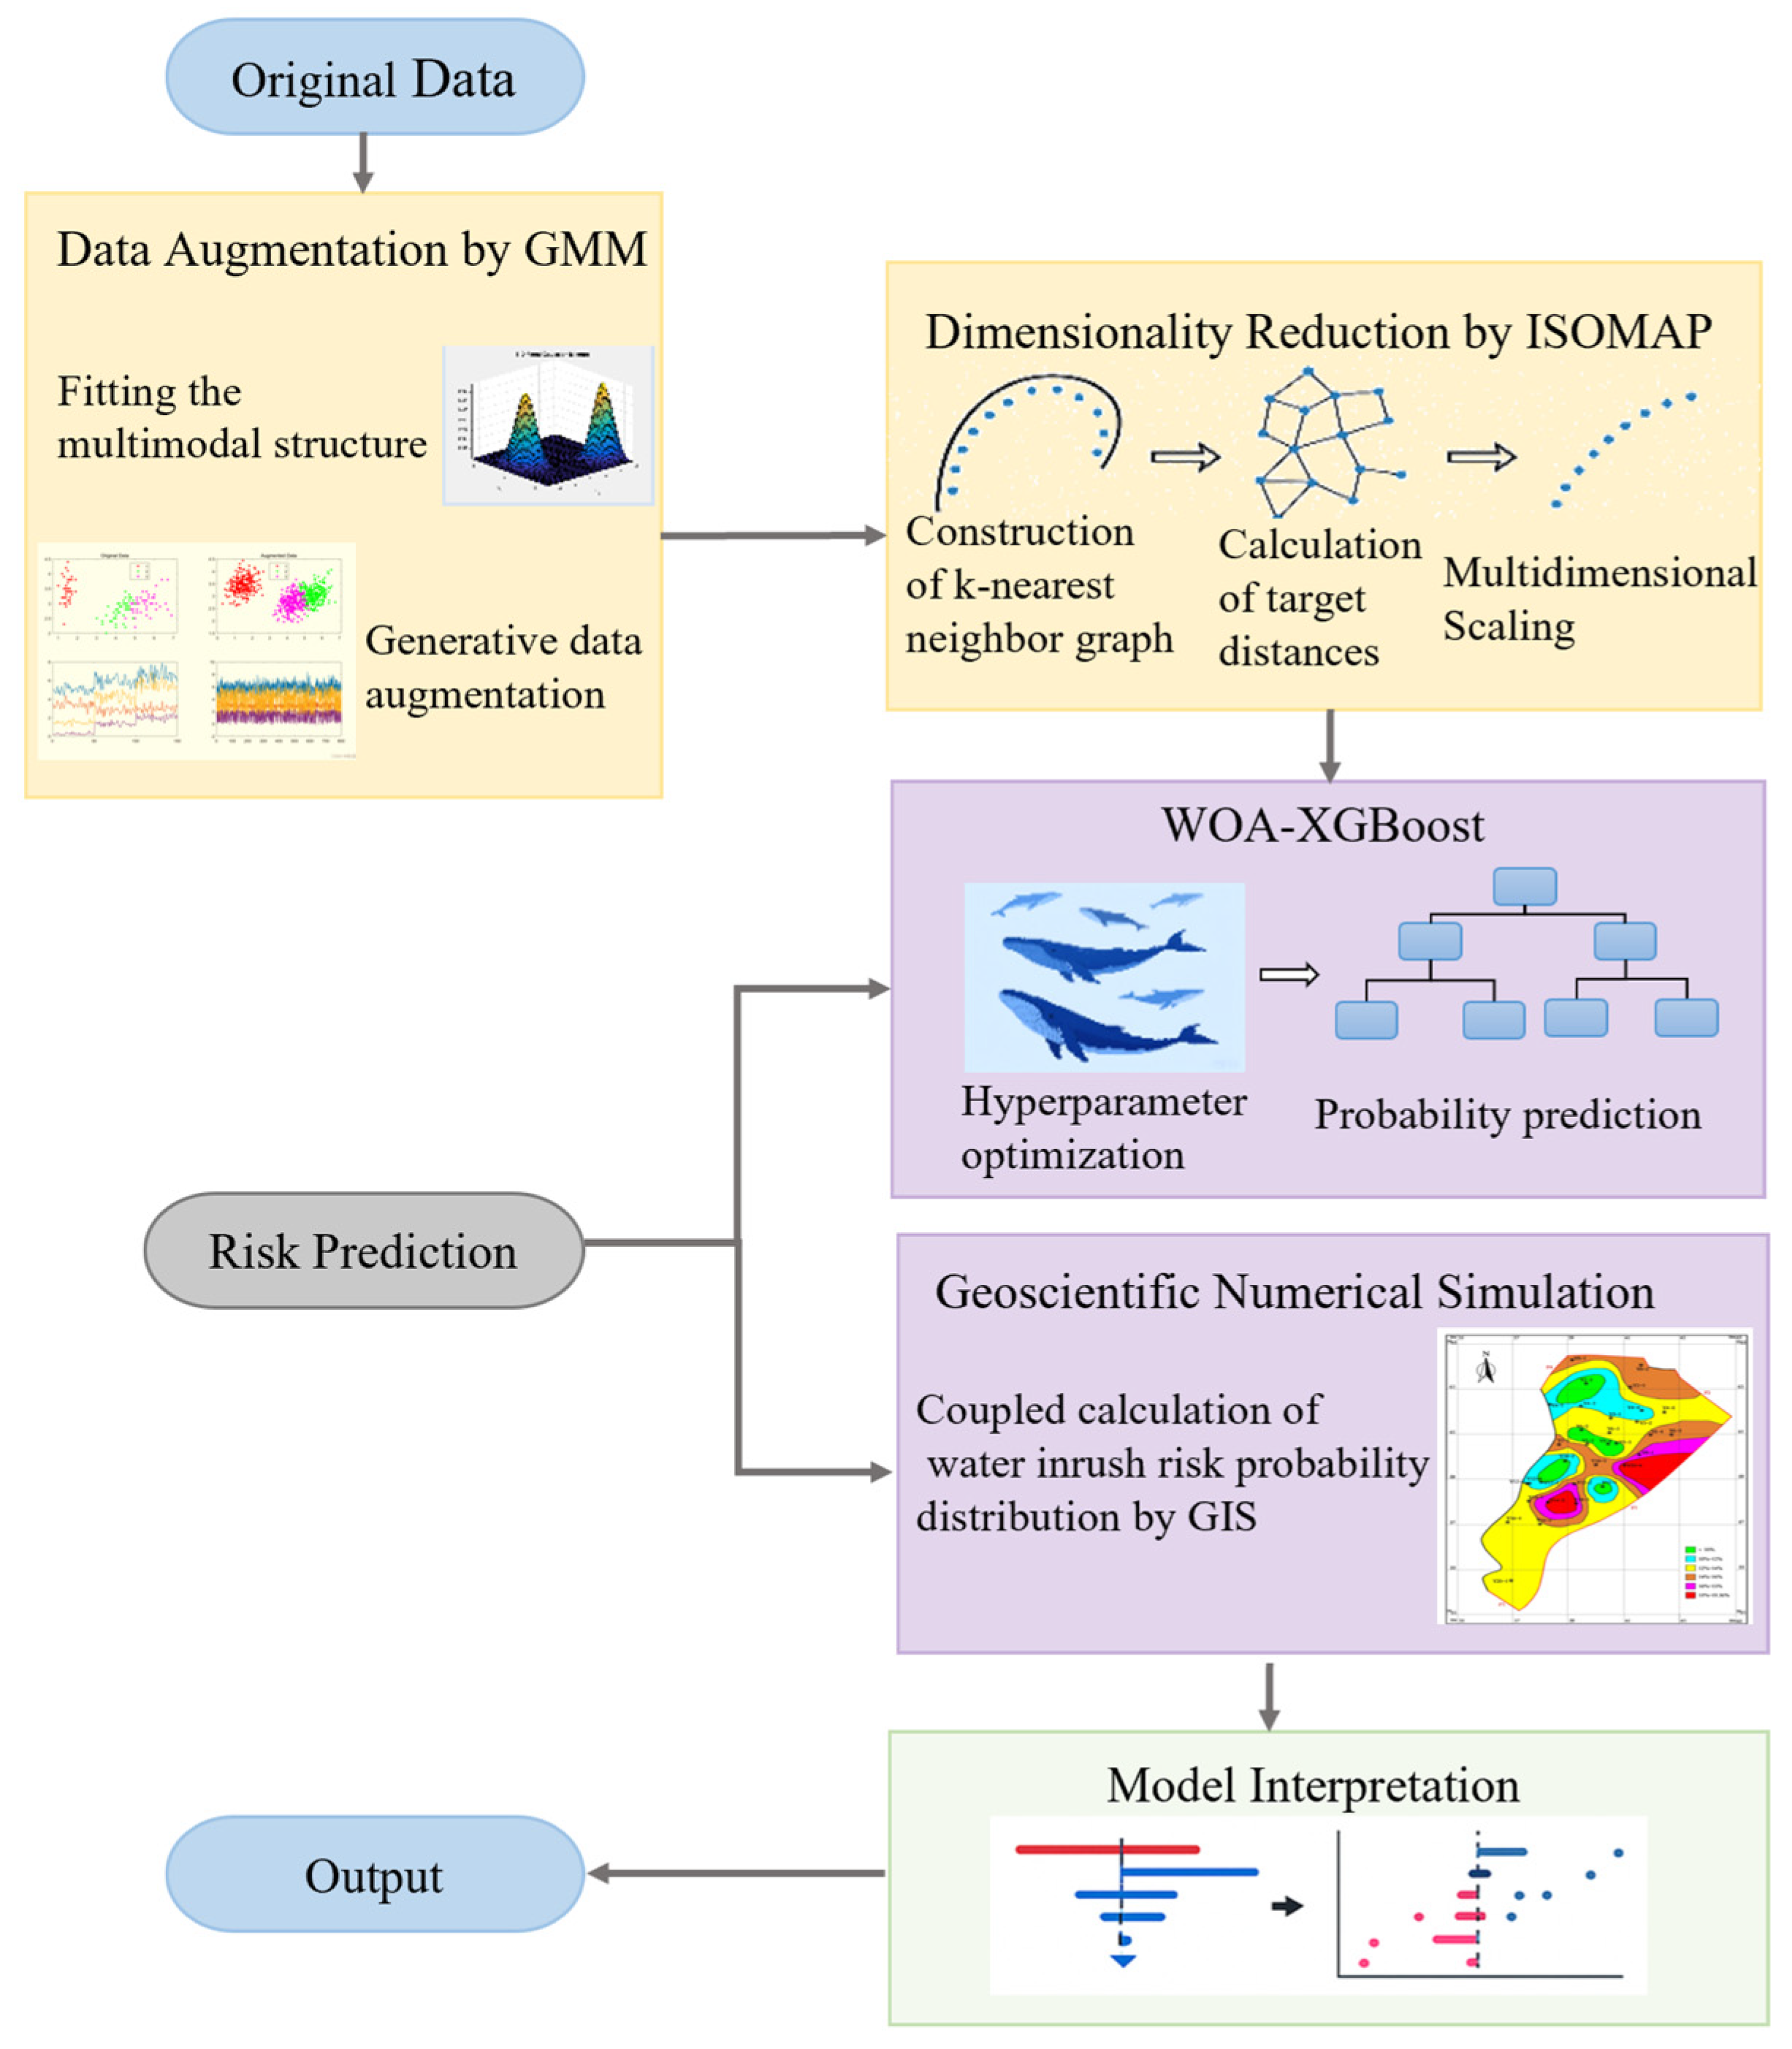
  • A novel GMM-based data augmentation method that precisely models multimodal hydrological parameter distributions, overcoming the statistical distortion of traditional techniques and generating geomechanically consistent datasets.
  • A robust WOA-XGBoost optimization strategy that globally tunes the hyperparameters, ensuring superior prediction accuracy and stability compared to those of local optimization approaches in high-dimensional feature spaces.
  • Integration of the SHAP framework to provide quantitative, transparent interpretability of water inrush predictions, offering critical insights into the nonlinear synergistic effects of key factors and facilitating data-driven engineering decisions.
  • Validation of an integrated framework’s real-world applicability and robustness in complex deep mining environments, demonstrating a significant paradigm shift toward data-driven dynamic regulation for water-associated hazard prevention and control.

2. Algorithmic Principles

2.1. Data Augmentation Based on Gaussian Mixture Model

The Gaussian mixture model (GMM), as a probabilistic generative framework, demonstrates remarkable advantages in the realm of data augmentation. Unlike traditional augmentation techniques, GMM adeptly captures the underlying distributional characteristics of the original data by fitting a mixture of multiple Gaussian components, thereby producing new samples that maintain statistical coherence [36,37]. This approach not only enhances the naturalness and diversity of generated data, avoiding the biases introduced by simplistic transformations, but also effectively fills sparse regions within the original dataset, thereby bolstering the model’s generalization capabilities. Particularly in scenarios characterized by limited data or class imbalance, the employment of GMM serves to mitigate overfitting and enhances the model’s adaptability to complex data structures [38]. The probability density function is defined as follows [39]:
p ( x ) = k = 1 K π k N ( x | μ k , Σ k )
In the formula, K signifies the number of Gaussian components, π k indicates the mixture weight for the k-th component, and N ( x | μ k , Σ k ) corresponds to the k-th Gaussian distribution, with parameters including the mean μ k and the covariance matrix Σ k .
The main parameters of the Gaussian mixture model, denoted as ( π k , μ k , Σ k ) , are estimated using the expectation–maximization (EM) algorithm. After randomly initializing the means, covariances, and weights of the components, the posterior probability that a sample xi belongs to the k-th component is computed as follows [40]:
γ i k = π k × N ( x i | μ k , Σ k ) j = 1 K π j × N ( x i | μ j , Σ j )
Utilize the posterior probabilities within the Gaussian Mixture Model to update relevant parameters:
N k = i = 1 N γ i k , π k n e w = N k N , μ k n e w = 1 N k i = 1 N γ i k x i , Σ k n e w = 1 N k i = 1 N γ i k ( x i μ k n e w ) ( x i μ k n e w ) T
Repeat the expectation calculation and parameter iteration process until convergence of the likelihood function is achieved:
log p ( X ) = i = 1 N log k = 1 K π k × N ( x i | μ k , Σ k )
Perform polynomial sampling based on the mixture weights of the trained GMM model to select the component index k:
k ~ Categorical ( π 1 , π 2 , , π K )
Sample data points from the selected Gaussian distribution to generate augmented data:
x n e w ~ N ( μ k , Σ k )

2.2. ISOMAP Feature Extraction

Isometric feature mapping (ISOMAP) is an algorithm used in manifold learning that projects high-dimensional data into a lower-dimensional space while preserving the geodesic distances between data points [41]. It introduces a neighborhood graph, connecting each sample only to its neighboring samples. By using geodesic distance to represent Euclidean distance, ISOMAP retains the geometric properties of the data, facilitating the identification of nonlinear manifolds within high-dimensional data and effectively capturing the distribution of the samples. The algorithm’s brief workflow is as follows [42]:
(1)
Construct the weighted neighborhood graph G. Given a set of sample points and a target dimension d, use the Euclidean distance d(i,j) as the measure of distance between points. If two sample points are each other’s k-nearest neighbors, connect nodes i and j with an edge whose length is d(i,j). Otherwise, the distance between the samples is considered infinite.
(2)
Estimate the geodesic distance matrix. Approximate the true geodesic distance between two points on the manifold structure by calculating the shortest path dG(i,j) between points on the neighborhood graph G using Dijkstra’s algorithm.
(3)
Construct a low-dimensional embedding. Employ the multidimensional scaling (MDS) algorithm to embed RD into a low-dimensional space Rd, beginning with the construction of the ISOMAP kernel through the inner product matrix:
G C = 1 2 H S G H
where S G = [ d G 2 ( i , j ) ] , H = I J / N is the centering matrix, I is the identity matrix, and J is the matrix with all elements equal to one.
(4)
Eigenvalue decomposition. The singular value decomposition of GC is given by
G C = M Λ M
In the equation, Λ = diag ( λ 1 , λ 2 , , λ N ) , λ 1 λ 2 λ N is the diagonal matrix composed of eigenvalues, and M = [ m 1 , m 2 , ... , m N ] is the matrix formed by the corresponding eigenvectors. By selecting the top d eigenvalues Λ d and their corresponding eigenvectors Md, the calculation formula for the low-dimensional matrix Y that represents the new coordinate values mapped to the d-dimensional space is given by
Y = M d Λ d
(5)
Validating dimensionality reduction. Introduce the KNN reconstruction error to assess the efficacy of the reduction, measuring the data’s reconstructive capability post-embedding. The calculation Formula (10) is as follows. A smaller value indicates superior preservation of local neighborhood structure and reduced information loss during reconstruction.
R E = 1 N i = 1 N x i x ^ i 2
Here, N represents the total number of samples, xi denotes the true high-dimensional vector of the i-th data point, and x ^ i is the reconstructed point obtained by inversely aggregating its neighbors in the low-dimensional space.

2.3. WOA-XGBOOST

(1)
WOA
The whale optimization algorithm (WOA), proposed by S. Mirjalili in 2016, is a heuristic optimization technique inspired by the natural hunting behavior of whales. Compared to particle swarm optimization (PSO), Bayesian optimization (BO), and genetic algorithms (GAs), the WOA effectively preserves population diversity, mitigating the propensity of PSO and GAs to become trapped in local optima. Its mechanism exhibits low sensitivity to initial conditions and demonstrates remarkable stability. Moreover, the WOA excels in high-dimensional, multimodal, complex search spaces, outperforming BO. Consequently, this study adopts the WOA as the parameter optimization method. The complete mathematical formulation and operational principles of WOA are comprehensively detailed in the foundational work [43]. Its mathematical model is represented by Equation (11).
x ( t + 1 ) = x r a n d D 1 D 1 = c x r a n d x ( t ) A = 2 a r 1 a c = 2 a r 2 a = 2 2 t / T max
In the equation, xrand represents the randomly selected whale position from the population; A and C are coefficients; r1 and r2 are random numbers in the interval [0, 1]; and Tmax is the maximum number of iterations. Assuming that the current candidate solution is the optimal solution, the other whale individuals continuously update the optimal position, as represented by the mathematical model in Equation (12):
x ( t + 1 ) = x * ( t ) A D 2 D 2 = c x * ( t ) x ( t )
Set the probability coefficient p; when p ≥ 0.5, the position is updated using a spiral approach; otherwise, an encircling approach is used. The mathematical models are represented by Equations (13) and (14):
x ( t + 1 ) = x * ( t ) + D 3 e b l cos ( 2 π l ) D 3 = x * ( t ) x ( t )
x ( t + 1 ) = x * ( t ) A D 2 , p < p i x * ( t ) + D 3 e b l cos ( 2 π l ) , p p i
In the equations, b = 1; l 1 , 1 , and pi is 0.5.
(2)
XGBoost Algorithm
The XGBoost algorithm is an approach grounded in the principles of boosting ensemble methods, utilizing both first-order and second-order derivatives. The incorporation of second derivatives facilitates faster and more precise gradient descent. To mitigate the risk of overfitting, XGBoost integrates a regularization term within its objective function to manage model complexity [44]. The objective function is defined as follows in Equations (15) and (16):
O = i = 1 n l ( y i , y ^ i ) + i = 1 t Ω ( f i )
y i = i = 1 n f t ( s i ) , f t ( ) F
In the equations, s i represents the i-th sample, y ^ i denotes the predicted value of the i-th sample, y i indicates the actual value of the i-th sample, f t ( s i ) refers to the regression equation established by the i-th regression tree for the i-th sample, F is the collection of all regression trees, and Ω ( f i ) signifies the regularization term. Ultimately, the final objective function is derived through the Taylor expansion formula, as shown in Equation (17):
O = t = 1 n g i f t ( s i ) + 1 2 h i f t 2 ( s i ) + Ω ( f i )
In the equations, g i f t ( s i ) represents the first-order derivative of y i t 1 , and 1 2 h i f t 2 ( s i ) denotes the second-order derivative of y i t 1 .
(3)
WOA-XGBoost Model Prediction Process
The whale optimization algorithm (WOA) is employed to optimize parameters such as tree depth, learning rate, and the number of sub-models within the XGBoost framework, thereby enhancing model accuracy. The fitness function is calculated using the root mean square error (RMSE) from model training.
First, the topology of the XGBoost model is established, along with the identification of the parameters to be optimized. Next, the population is initialized, and each individual’s fitness value is computed, followed by continuous position updates. Finally, the optimal individual’s fitness value and position are recorded and transmitted to the XGBoost model for training, resulting in the final predictive model. Notably, the proposed WOA-XGBoost model demonstrates strong generalization capability. In particular, when handling high-dimensional input features, the high search efficiency of the WOA combined with the robustness of XGBoost allows the model to maintain high accuracy and stability in complex, multidimensional data environments. The specific process is illustrated in Figure 1.

3. Model Construction

This study develops a data-driven predictive framework for mine water inrush risk, integrating Gaussian mixture models (GMM), ISOMAP, and WOA-XGBoost, with a strong emphasis on interpretability. The core predictive model and data processing pipeline were implemented in Python 3.9, utilizing standard libraries such as XGBoost, scikit-learn, and SHAP. The detailed process is outlined below and illustrated in Figure 2.
Step 1: By researching relevant cases and combining empirical data, we select 15 factors as input features, including face slope length, aquiclude thickness, water quality, and water pressure, with the probability of water inrush as the output variable. The dataset is divided, with 80% used for for training and 20% for testing.
Step 2: We employ Gaussian mixture models to augment the original training set, thoroughly exploring the correlations among risk factors.
Step 3: ISOMAP is utilized to reduce the dimensionality of the original 15 influencing factors.
Step 4: WOA-XGBoost is applied, integrating the outputs from the previous models to generate predictions. The final results are obtained, and the model’s performance is analyzed by calculating the mean absolute error (MAE), root mean squared error (RMSE), mean absolute percentage error (MAPE), and mean bias error (MBE).
Step 5: A SHAP-based interpretability analysis was conducted on the model’s predictive results. This crucial step determined the contribution of each feature, allowing for the identification of the most influential factors. It also provided local explanations for individual samples, illustrating how specific features influenced predicted values, while simultaneously revealing global feature importance and interactions, thereby significantly enhancing the model’s transparency.

4. Engineering Case Studies

4.1. Selection and Processing of Sample Data

The mechanism of disaster occurrence due to water inrush incidents in coal mines exhibits significant characteristics of multi-factor coupling. The reliability of risk prediction heavily relies on the systematic selection of key disaster factors and the scientific representation of data. This study draws from a typical case database for water inrush mines in Northern and Southern China, integrating geological exploration reports, records of water inrush incidents, and real-time monitoring data to identify 15 core risk factors. These factors are categorized into three main classes—“Hydrogeological Conditions”, “Mining Engineering Disturbances”, and “Geological Structure Characteristics”, as shown in Table 1, aiming to construct a comprehensive evaluation system that encompasses the three essential elements of source–pathway–driving force in water inrush scenarios. The characteristics of the aquifers and the structure of the aquicludes collectively form the material–energy basis for the occurrence of water inrush, including six indicators: aquifer water temperature (X12), aquifer water pressure (X2), aquiclude thickness (X4), and its lithological composition (proportions of sandstone X6, mudstone X7, and limestone X8).
The aquifer water pressure (X2) directly reflects the potential for the hydraulic gradient to breach the aquiclude, significantly increasing the risk of bottom floor water inrush. The thickness of the aquiclude (X4) and its lithological composition determine its impermeability; the proportion of mudstone (X7) exhibits a positive correlation with the tensile strength of the aquiclude; whereas limestone (X8), due to the development of dissolution fractures, may create latent water pathways. The reshaping of the surrounding rock stress field by mining activities serves as a dynamic trigger for water inrush, encompassing seven parameters: mining depth (X11), mining height (X9), coal seam dip angle (X14), coal seam thickness (X15), the incline length of the working face (X1), the strike length of the working face (X13), and the monthly advance step (X3). Among these, mining depth (X11) and coal seam dip angle (X14) jointly determine the original distribution of the geological stress field, while the geometric parameters of the working face (X1, X13, X3) modulate the development rate of water inrush pathways by influencing the failure pattern of the roof and floor of the goaf. The faults and the floor failure zone act as primary water-conducting pathways for water inrush, with their geometric characteristics exerting a decisive influence on the water inrush path. This category includes two indicators: fault displacement (X10) and the depth of floor damage (X5). Fault displacement (X10) not only reflects the potential for tectonic activation but also governs the connectivity of the water-conducting fracture zones; the depth of floor damage (X5) quantifies the extent of damage to the aquiclude caused by mining stress. When it penetrates an effective aquiclude, the risk of water inrush escalates instantaneously.
To eliminate dimensional discrepancies and improve model convergence efficiency, all 15 water inrush-related factors were normalized using the min–max method. Outliers were removed based on the Grubbs’ test, resulting in a correction of 7.2% of the original data. Given the geological differences between Northern and Southern China, a stratified sampling strategy was adopted, with 58% of samples from Northern China and 42% from Southern China, ensuring dataset representativeness. Furthermore, to address multicollinearity among input features, the variance inflation factor (VIF) was calculated for each variable. When the VIF indicated a risk of severe collinearity between certain variables, the redundant features were removed based on their correlation with the target variable, geological interpretability, and modeling performance, retaining only the most informative features. As a result, the final 15 retained features all exhibited VIF values below 5, indicating acceptable levels of multicollinearity. The K-S test confirmed that the distribution of each normalized factor aligned with expected geological patterns (p > 0.05). This data framework provides a solid scientific foundation for developing an intelligent prediction model incorporating the coupled mechanisms of rock, water, and stress. Among the standardized data collected from 50 coal mine working faces, samples 1–40 were used for training, and samples 41–50 were reserved for testing.

4.2. Model Application

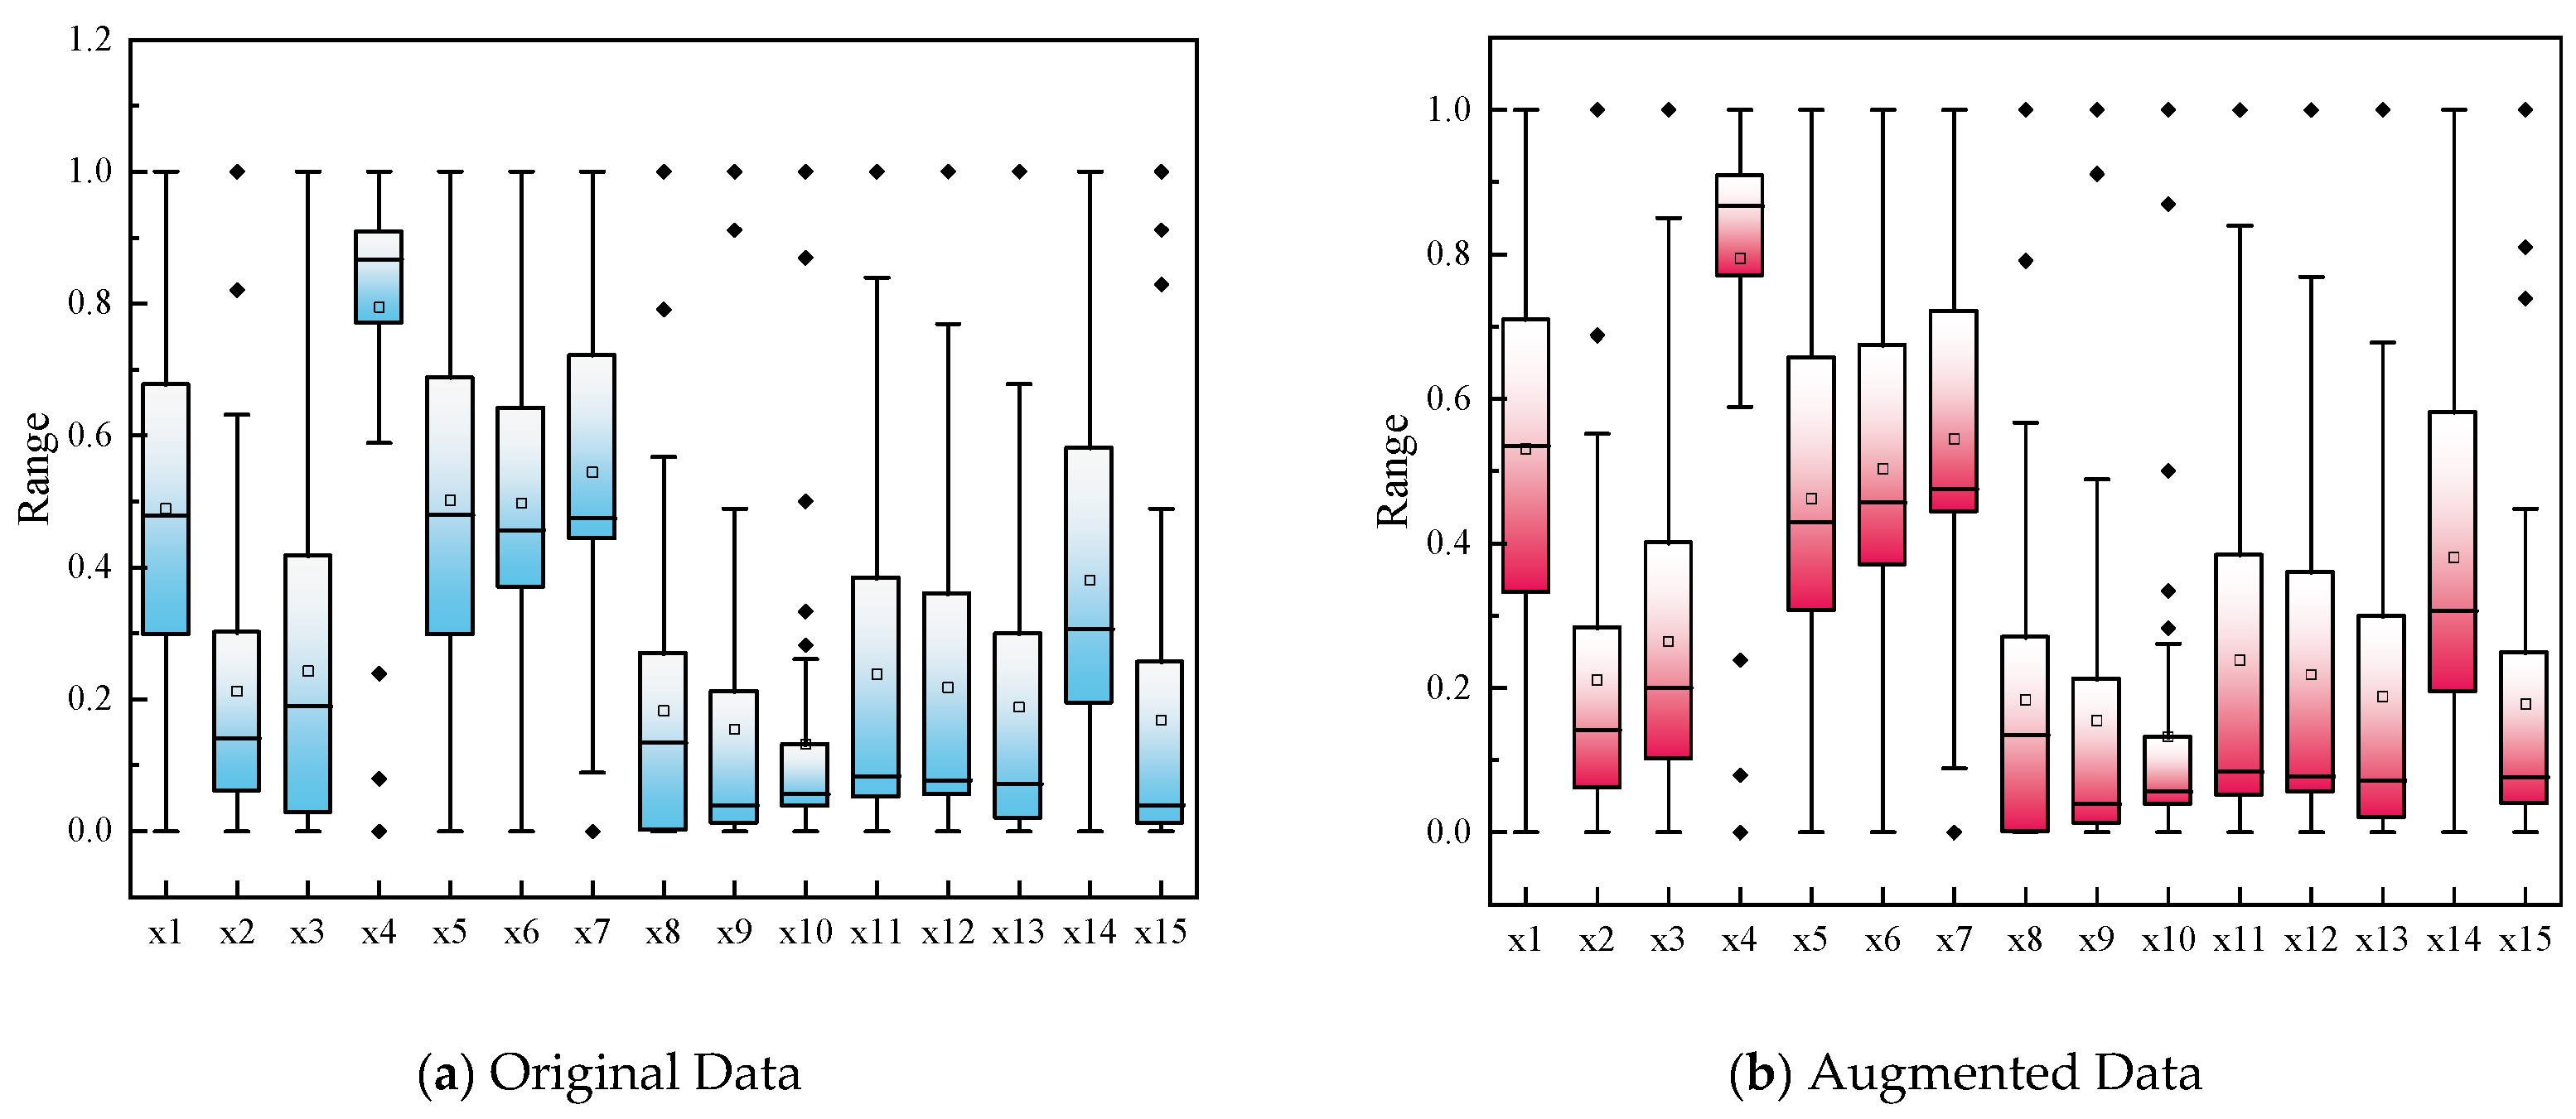
4.2.1. Data Augmentation Results

Using Gaussian mixture data augmentation, the 40 training sets were expanded to generate 200 samples for the mine water inrush training dataset. By comparing box plots of the original dataset and the synthetic data expanded fivefold through the Gaussian mixture model (GMM) (Figure 3), it is evident that both datasets exhibit significant consistency in regards to their core statistical properties. The median, interquartile range, and data range of the expanded data closely mirror those of the original dataset, indicating that the augmentation did not alter the central tendency or dispersion of the data. Further analysis of the outlier distribution revealed that the proportions of outliers beyond the whiskers in the box plots for the augmented and original datasets were 4.7% and 4.3%, respectively, with similar spatial distribution patterns, validating the GMM’s precise modeling capability of the tail characteristics of the original distribution. These results indicate that this method significantly enhances data density by increasing the sample size without introducing distribution skew or false patterns, confirming the effectiveness of the Gaussian mixture model in the data augmentation task for faithful expansion.
To quantitatively assess the distributional similarity between the original and augmented datasets, the KL divergence for each feature was calculated and illustrated as a bar chart (see Figure 4). All feature-wise KL divergence values were below 0.07, with the maximum value observed for X2/X12 (0.063) and the minimum for X11 (0.016), confirming that the augmented dataset preserves the statistical structure of the original data with minimal deviation. The low divergence across all 15 input dimensions further supports the effectiveness of the data augmentation strategy in maintaining feature-level distributional consistency.

4.2.2. Extraction of Key Factors

(1)
Determination of Optimal Dimension d and Nearest Neighbors k
To assess the effectiveness of dimensionality reduction, the KNN reconstruction error was introduced as a measurement criterion. The range of data dimensions d and the number of nearest neighbors k was established between [2, 10]. Analysis of the residuals for each combination of (d,k) revealed that, at each dimension d, the residuals generally increased as k increased. The smallest residuals were achieved at k = 2 or k = 3. A comprehensive comparison of the overall residuals for k = 2 and k = 3 (as shown in Table 2) indicated that the errors were relatively lower at k = 3. Therefore, the parameter k was determined to be 3.
ISOMAP residuals corresponding to different dimensions when k = 3 are plotted as shown in Figure 5, and the residuals are minimized when the data dimension d = 9.
To further justify the selection of ISOMAP for dimension reduction, we conducted a comparative analysis using several widely adopted linear and nonlinear methods as baselines, including principal component analysis (PCA), t-distributed stochastic neighbor embedding (t-SNE), locally linear embedding (LLE), multidimensional scaling (MDS), and autoencoder-based nonlinear projection (Table 3). Each method was applied to the same 15-dimensional normalized dataset and reduced to 9 dimensions. The KNN reconstruction residual was used to evaluate the preservation of local neighborhood structures. Among all methods, ISOMAP achieved the lowest residual (0.41), followed by Autoencoder (0.47), t-SNE (0.55), LLE (0.58), MDS (0.62), and PCA (0.68). These results indicate that ISOMAP best captures the intrinsic geometric relationships in complex and nonlinear hydrogeological features, thus supporting its inclusion in the proposed model pipeline.
(2)
Presentation of Results Before and After Dimensionality Reduction
After dimensionality reduction, the original 24-dimensional dataset was effectively reduced to 9 dimensions, yielding optimal results. In the case of the nine-dimensional representation, a significantly lower KNN reconstruction error was observed, indicating that the dataset’s information was retained more efficiently while redundant information was adequately eliminated. This reduction not only preserved the integrity of the data structure but also decreased computational complexity, thereby providing a more compact and information-rich representation for further data analysis and processing.
Using gray relational analysis, the correlations between the extracted features and the target factors were computed, as illustrated in Figure 6. The degree of association before and after dimensionality reduction indicates that the nine influencing factors post-reduction exhibit a maximum gray relational degree of 0.998 and a minimum of 0.726, with eight of these factors exceeding a correlation of 0.9. The top nine influencing factors exhibit relatively minor differences in correlation, stabilizing between 0.81 and 0.84. Overall, the gray relational degree between the influencing factors and the target factors demonstrated a significant increase after ISOMAP dimensionality reduction, with an average improvement of 14.9% over the pre-reduction values.

4.2.3. Comparative Analysis

To evaluate the predictive performance of the proposed model, the WOA-XGBoost model was selected as the primary framework. Tri-linear interpolation was employed for data augmentation, enabling the comprehensive extraction of effective information from the dataset. Concurrently, ISOMAP was utilized to enhance the correlation and attribute the reduction of the input factors, resulting in the extraction of nine key indicators: mining height of working face (X9), strike length of working face (X13), mining depth of working face (X11), aquiclude thickness (X4), coal seam thickness (X15), aquifer water pressure (X2), depth of floor damage (X5), inclined length (X1), and monthly advance distance of the working face (X3).
The nine-dimensional risk factors, after dimensionality reduction, were used as inputs, while the probability of mine water inrush was set as the output variable. The population size for the WOA was set to 20, with a decay factor of 0.5 and a maximum of 100 iterations, during which the parameters of the XGBoost model (learning rate = 0.1, tree depth = 6, reg_alpha = 0.3, reg_lambda = 1.2, etc.) were optimized to determine the best combination. To further illustrate the internal optimization mechanism of the proposed model, we plotted the convergence curve of the loss function during the training process. The convergence curve in Figure 7 clearly illustrates the effectiveness of the WOA in optimizing the XGBoost model’s hyperparameters. In the initial 20 iterations, the loss significantly decreased from approximately 7.8 to 2.1. This rapid descent shows that the optimization algorithm quickly identified promising regions within the hyperparameter search space. For instance, at iteration 40, the optimized parameters included a learning rate of 0.1, a maximum tree depth of 6, a reg_alpha of 0.3, and a reg_lambda of 1.2, yielding a training RMSE of about 0.33. Subsequently, the loss function gradually stabilized, with only marginal improvements observed after roughly 55 iterations. At this point, the hyperparameters had finely adjusted to a learning rate of 0.085, a reg_alpha of 0.28, and a reg_lambda of 1.15. This consistent trend demonstrates that the WOA effectively guided the search toward near-optimal hyperparameters, successfully avoiding local minima and ensuring the resulting model’s robustness.
Figure 8 visually compares the predicted probabilities of water inrush generated by four distinct XGBoost-integrated models—WOA (whale optimization algorithm), ISOMAP-WOA (isometric feature mapping-whale optimization algorithm), GMM-WOA (Gaussian mixture model-whale optimization algorithm), and GMM-ISOMAP-WOA (Gaussian mixture model–isometric feature mapping–whale optimization algorithm)—against the actual observed values. The figure clearly indicates that the WOA-XGBoost models without dimensionality reduction or data augmentation exhibit noticeable deviations from the true values. In stark contrast, the GMM-ISOMAP-WOA model, which incorporates both the Gaussian mixture model for data augmentation and ISOMAP for nonlinear dimensionality reduction, yields predictions that are remarkably closer to the ground truth across nearly all samples. This compelling result strongly confirms the advantage of integrating both Gaussian mixture models for enhancing input data quality and nonlinear dimensionality reduction via ISOMAP in significantly boosting the model’s generalization capability. The enhanced alignment between prediction and reality also supports the statistical performance results summarized in Table 4.
Figure 9 presents a comparison of the prediction results, illustrating that the water inrush prediction model based on data augmentation using ISOMAP-WOA-XGBoost significantly outperforms the other models. Table 4 outlines the performance metrics for each model, showing that the water inrush risk prediction model utilizing data augmentation achieved reductions in RMSE of 60.6%, 26.57%, and 19.90% compared to the results for the WOA-XGBoost model, the ISOMAP-WOA-XGBoost model without data augmentation, and the WOA-XGBoost model with data augmentation, respectively. In terms of MAPE, the reductions were 73.12%, 30.38%, and 3.24%; for MAE, the reductions amounted to 65.56%, 35.31%, and 22.58%; and for MBE, the reductions were 62.12%, 26.82%, and 6.82%. These results clearly demonstrate that the integration of a composite model with data augmentation facilitates the self-mining of associative information, thereby effectively improving sample distribution and enhancing sample diversity, which contributes to the accuracy and effectiveness of water inrush risk predictions. A critical aspect of this study is the rigorous comparison with KPCA-DBO-SVR, representing a robust approach combining nonlinear feature transformation with optimization. While KPCA-DBO-SVR shows improvement over a standalone SVR, our model significantly outperforms it for small sample, nonlinear water inrush probability prediction. First, our model incorporates GMM for data enhancement. In small, sparse datasets, GMM effectively models underlying probabilistic distributions, enriching feature representation crucial for robust learning. Second, our choice of ISOMAP for dimensionality reduction is pivotal. While KPCA transforms features, ISOMAP excels at manifold learning, preserving crucial intrinsic geometric structures in complex nonlinear data, providing a more discriminative input. Finally, the synergistic combination of WOA-optimized XGboost is powerful. XGboost, an inherently robust ensemble method, excels at nonlinear regression, even with limited data. When precisely tuned by WOA and fed with GMM and ISOMAP-enhanced features, it learns more precise patterns.

4.3. Model Interpretability Analysis

Utilizing SHAP’s global explanation tool, the average SHAP values for each feature across all samples were computed, resulting in a ranking of feature importance. Here, the global significance of each feature is represented by the average absolute value across all provided samples. In Figure 10, the x-axis denotes the average absolute SHAP values of the input parameters, while the y-axis reflects the importance ranking of each influencing factor. It is evident that the primary risk factors for water inrush in coal mining are aquifer water pressure (X2), depth of floor damage (X5), and aquiclude thickness (X4), which serve as core driving factors for water inrush predictions, with their contributions significantly surpassing those of other features, aligning closely with hydrogeological and mechanical principles. Specifically, groundwater pressure in the aquifer emerges as the foremost contributing feature, as it directly reflects the penetrating pressure of groundwater on the aquiclude, constituting a necessary condition for water inrush.
The substantial contribution of the depth of floor damage (X5, SHAP = 2.08) reveals the destructive mechanism of mining stress on the integrity of the aquiclude. In practical engineering scenarios, a greater depth of damage to the floor strata due to mining reduces the effective aquiclude thickness (X4), and this interaction amplifies the cascading effect of declining water barrier capacity. Moreover, the negative contribution of the aquiclude thickness (X4, SHAP = −1.25) indicates its role as a natural barrier against water inrush, showing a significant negative correlation with the probability of its occurrence.
This finding strongly aligns with established hydrogeological principles and domain knowledge of mine water control. High water pressure (X2) is a direct measure of the hydraulic head acting on the mine strata. According to Darcy’s law, the flow rate of water is directly proportional to the hydraulic gradient. Therefore, elevated water pressure in overlying or adjacent aquifers significantly increases the driving force for water to infiltrate into underground excavations. This pressure reduces the effective stress within the rock mass, decreasing its shear strength and increasing the likelihood of hydraulic fracturing or structural instability, which are precursors to sudden inrushes. Similarly, floor damage (X5) serves as a critical proxy for the structural integrity and permeability of the mine floor strata. In coal mining, the floor often consists of aquicludes or aquifuges that separate the working face from underlying confined aquifers. Damage such as fractures, fissures, or weak structural planes in the floor creates preferential seepage pathways. These pathways increase the hydraulic conductivity of the rock mass, allowing water from high-pressure aquifers to flow rapidly into the mine workings, bypassing the intact low-permeability layers. This aligns with rock mechanics and hydrogeological models that emphasize the role of rock mass integrity and fracture networks in controlling groundwater flow and stability.
Among the features with moderate contributions, the working face inclined length (X1, SHAP = 0.53) and the mining depth (X11, SHAP = 0.31) reflect the engineering scale effects: longer working faces increase the extent of floor damage, while deeper mining enhances the coupling of geological stress and water pressure. Together, these factors indirectly affect the risk of water inrush by altering the distribution of the stress field. The low contribution of the working face strike length (X13, SHAP = 0.18) suggests that the sensitivity of the strike dimension to floor damage is lower than that of the dip dimension, aligning with the conclusion from numerical simulations that indicate a higher concentration of shear stress along the dip profile. Notably, the contribution of coal seam thickness (X15, SHAP = 0.02) and the exclusion of the coal seam dip angle (X14) are minimal, which may be attributed to the stability of the coal seam structure within the study area, or it could be that the mining height parameter (X9, SHAP = 0.25) has already captured its mechanical effects. Furthermore, the lithological combinations of the aquiclude (X6, X7, X8) did not appear among the high-contribution features, indicating that, within the current dataset, lithological differences are dominated by macro parameters such as thickness (X4) and water pressure (X2). Therefore, further examination through modeling of the mesoscopic fracture network is needed for deeper analysis.
Based on the global explanation analysis derived from the SHAP beeswarm plot depicted in Figure 11, the model’s predictions for water inrush risk exhibit significant nonlinear decision boundaries and feature interaction effects. In terms of the influence direction of the features, aquifer water pressure (X2), floor damage depth (X5), and mining height (X9) act as positive drivers of water inrush risk, while factors such as aquiclude thickness (X4) and working face slant length (X1) demonstrate negative suppression characteristics. This indicates that the model is capable of capturing the mechanical antagonistic relationships within the “water pressure–rock mass–mining” system. Notably, the high SHAP value distribution for aquifer water pressure (X2) exhibits a right-skewed characteristic, signifying that when the water pressure exceeds a critical threshold, its marginal contribution to risk increases sharply, corroborating the model’s sensitivity to the “hydraulic critical threshold”.
From the overall behavior of the model, its decision logic follows a hierarchical mechanism characterized by core dominating factors, with modulating auxiliary factors: X2, X5, and X4 form the primary framework for risk determination (accounting for 86% of the cumulative contribution), while engineering parameters such as X1, X11, and X9 indirectly influence the output by modulating the stress field and water pressure transmission pathways. The model exhibits a strong synergistic response to the combination of high water pressure and deep failure conditions (with a SHAP interaction value reaching 1.8). However, it demonstrates robust performance against isolated changes in individual medium- and low-risk factors (such as X3 and X15), indicating its capability to effectively identify critical disaster states arising from the coupling of multiple parameters, while avoiding excessive sensitivity to non-critical disturbances. This feature provides an algorithmic basis for constructing a “graded-interactive” prevention and control system, suggesting that priority should be given to monitoring synergistic exceedances of high-weight features in engineering practice rather than to isolated parameter thresholds. To capture feature dependencies more effectively, SHAP interaction values were introduced. A notable interaction was identified between aquifer water pressure (X2) and floor damage depth (X5), with an interaction value of 1.8, highlighting a strong hydro–mechanical coupling effect. This reinforces the model’s interpretability and aligns with the “water–rock–mining” interaction framework.
From a practical engineering perspective, the interpretability analysis based on SHAP not only reveals the core mechanisms underlying water inrush events, but also provides actionable knowledge for accident prevention. Specifically, the identification of high-contribution factors—such as aquifer water pressure (X2), floor damage depth (X5), and aquiclude thickness (X4)—enables focused monitoring of high-risk zones. The model also highlights strong feature interactions, such as the coupling effect between water pressure and floor damage, which may act as precursors to catastrophic failures. Therefore, the proposed model offers a basis for the early-warning and graded-intervention strategies in water inrush management, contributing to proactive accident prevention in underground coal mines.

4.4. Method Verification and Application

To validate the generalizability and accuracy of the risk prediction method based on data augmentation and associative information self-mining proposed in this study, the Yangcheng Coal Mine, which presents a risk of water inrush, was selected for engineering case validation. In the study area, the coal seam mining elevation ranges from −250 m to −1100 m above sea level, with a general topography characterized by higher elevations in the south and lower elevations in the north. The stratigraphic composition includes Ordovician, Carboniferous, Permian, and Quaternary units, primarily consisting of typical fine-grained clastic rocks found in the Northern China Coalfield. The Permian Shanxi Formation (P1s) contains three extractable coal seams, while the Carboniferous Taiyuan Formation (C3t) consists of extractable seams No. 3, No. 16, and No. 17. Among these, seam No. 3 is the primary extractable coal seam, with a thickness ranging from 4 to 9.5 m and an average thickness of 7.5 m, exhibiting a dip angle between 9° and 30°. The study area contains three aquifers, listed from top to bottom: the Lower Quaternary gravel aquifer, the sandstone aquifer at the top and bottom of coal seam No. 3, and the Middle Ordovician limestone aquifer, with an average thickness of 165 m. This last aquifer serves as the recharge source for water inrush into coal seam No. 3, posing a direct threat to mining safety.
Given the production parameters from 30 drilling points at the working face in the study area—specifically the mining height, working face strike length, mining depth, coal seam thickness, groundwater pressure, and floor failure depth—a regression prediction model was constructed. Notably, there were three missing dependent variables compared to the number in the original training dataset. The aggregated data was then input into the model for regression predictions. The dataset reveals a good fit between the predicted values and the actual risk probabilities, as shown in Figure 12. Additionally, Figure 13 compares the water inrush hazard zoning of the Yangcheng Coal Mine. Based on the prediction results, the data-driven model established in this study demonstrates a strong adaptability to the varying hydrogeological conditions in coal mines. It effectively discriminates the prospective probabilities of water inrush risk, achieving a coefficient of determination (R2) greater than 0.9. This indicates that even in the presence of dimensional data deficiencies, the model exhibits remarkable generalization capabilities and precision in predictive performance.
Given the limited size of the test dataset (n = 30), the reported R2 > 0.9, while promising, may be sensitive to sampling variability. To address this, we employed a leave-one-out cross-validation (LOOCV) strategy, wherein each sample was iteratively used as a test case while training on the remaining nine. The averaged R2 across LOOCV rounds was 0.91, with a standard deviation of 0.04, confirming the robustness of the model despite the limited test-set size. Additionally, prediction intervals at the 95% confidence level were computed, showing that 90% of actual values fell within the estimated intervals, reinforcing the model’s generalization ability.

5. Discussion

To assess the practical applicability of the proposed model, a case study was carried out using real-world data from the Yangcheng Coal Mine. The model achieved strong predictive accuracy and maintained interpretability under complex geological conditions, underscoring its potential value in field applications. However, several limitations remain. Most notably, the analysis is based on data from a single mining site, which makes it difficult to fully evaluate the model’s performance across varying geological settings. One key obstacle is the lack of publicly available, standardized datasets from multiple coalfields, which restricts large-scale validation.
Despite this, the model’s modular and data-driven design allows for flexibility and potential adaptation to different environments. It is crucial to highlight that while leave-one-out cross-validation (LOOCV) was employed in this study to maximize the utility of the limited data, the current test sample size (n = 30) remains relatively small. This inherently affects statistical confidence, particularly when assessing performance across a wide range of input scenarios, and may limit the generalizability of the model. Future studies will aim to include data from multiple mining regions to support broader validation and improve the model’s robustness under diverse in situ conditions. We plan to collaborate with additional mining sites to collect larger and more diverse datasets, enabling a comprehensive evaluation of the model’s performance on independent datasets not utilized during training or internal validation. This cross-regional, large-scale external validation is critical for confirming the model’s generalization capabilities and practical applicability. Additionally, the current study does not yet account for the site-specific thresholds of water inrush indicators, which are critical for operational deployment. Addressing this gap will require the integration of regionally calibrated thresholds and spatiotemporal data in future work.
Further improvements will involve the adoption of more interpretable AI techniques—such as interaction-based SHAP analysis and counterfactual examples—to ensure that the model’s decision-making process is more transparent for end users. Finally, moving toward real-time application through integration with intelligent monitoring and early-warning systems is a vital direction. Future work will explore incremental and transfer learning strategies, along with automated retraining, to allow the model to adapt to evolving geological conditions. Embedding the model in operational platforms will also facilitate real-time feedback and continuous refinement.

6. Conclusions

This study proposes an integrated prediction framework for mine water inrush risk, combining Gaussian mixture model (GMM)-based data augmentation, ISOMAP nonlinear dimensionality reduction, and a WOA-XGBoost ensemble learning model. The methodology was comprehensively validated using real-world datasets, and the key findings are summarized as follows:
(1)
The GMM-based augmentation strategy effectively expands limited samples of water inrush data. Box plots and KL divergence (all < 0.07) confirm the statistical integrity of the augmented dataset, ensuring distributional similarity and robustness in learning.
(2)
ISOMAP successfully reduced 15 input features to 9, improving feature compactness and eliminating redundancy. After dimensionality-reduction, the average gray relational degree increased by 14.9%. Compared with PCA, LLE, and t-SNE, ISOMAP exhibited the lowest KNN residual error (0.41), supporting its application in revealing the underlying symmetrical manifold structures of the data.
(3)
The proposed GMM-ISOMAP-WOA-XGBoost model significantly outperformed three baselines in all metrics. The RMSE, MAPE, MAE, and MBE were reduced by up to 60.6%, 73.1%, 65.6%, and 62.1%, respectively. The confidence intervals further supported the statistical reliability of these gains. Validation at the Yangcheng Coal Mine showed R2 > 0.9, indicating strong model generalizability, even with small or incomplete datasets.
(4)
SHAP-based interpretability tools highlighted the most influential features. The model offers a transparent and interpretable risk decision tool that aligns with current trends in explainable AI (XAI) for geosciences. Compared to traditional black-box models, the framework balances accuracy, transparency, and data-efficiency, making it suitable for practical deployment.

Author Contributions

Conceptualization, methodology, and writing—original draft preparation, Q.Z.; data analyses and writing—original draft preparation, formal analysis, and review and editing, C.W. All authors have read and agreed to the published version of the manuscript.

Funding

This research was funded by the Major Project of the National Social Science Foundation of China (grant 22&ZD135) and the BUPT Excellent Ph.D. Students Foundation (CX20242042).

Data Availability Statement

The data used to support the findings of this study are included within the article.

Conflicts of Interest

The authors declare no conflicts of interest.

References

  1. Dong, S.; Fan, M.; Guo, X.; Liu, Y.; Guo, K.; Ji, Z.; Li, C.; Xue, X. Characteristics and prevention and control techniques of typical water hazards in coal mines in Shaanxi Province. J. China Coal Soc. 2024, 49, 902–916. [Google Scholar]
  2. Gai, Q.; Gao, Y.; Zhang, X.; He, M. A New Method for Evaluating Floor Spatial Failure Characteristics and Water Inrush Risk Based on Microseismic Monitoring. Rock Mech. Rock Eng. 2024, 57, 2847–2875. [Google Scholar] [CrossRef]
  3. Kong, H.-Q.; Zhang, N. Risk assessment of water inrush accident during tunnel construction based on FAHP-I-TOPSIS. J. Clean. Prod. 2024, 449, 141744. [Google Scholar] [CrossRef]
  4. Liu, Y.; Ji, M.; Wang, Y.; Liu, G.; Gu, P.; Wang, Q. Fractal mechanical model of variable mass seepage in karst collapse column of mine. Phys. Fluids 2024, 36, 022031. [Google Scholar] [CrossRef]
  5. Wang, W.; Cui, X.C.; Qi, Y.; Xue, K.L.; Liu, J.; Zuo, C. Research on the evaluation model of emergency rescue capability of coal mine water penetration accident. Sci. Rep. 2025, 15, 6462. [Google Scholar] [CrossRef] [PubMed]
  6. Wang, W.; Wang, H.R.; Li, X.P.; Qi, Y.; Cui, X.C.; Bai, C.H. Prediction model of water inrush risk level of coal seam floor based on KPCA-DBO-SVM. Sci. Rep. 2025, 15, 10393. [Google Scholar] [CrossRef]
  7. Li, B.; Xiang, X.; Wu, Q.; Wang, J.; Zeng, Y.; Li, T. Comparison of multiple methods for identifying water sources of mine water inrush and quantitative analysis of mixed water sources based on isotope theory. Earth Sci. Inform. 2025, 18, 26. [Google Scholar] [CrossRef]
  8. Ji, Y.; Yu, L.; Wei, Z.; Ding, J.; Dong, D. Research Progress on Identification of Mine Water Inrush Sources: A Visual Analysis Perspective. Mine Water Environ. 2025, 44, 3–15. [Google Scholar] [CrossRef]
  9. Shen, S.; Li, H.; Chen, W.; Wang, X.; Huang, B. Seismic Fault Interpretation Using 3-D Scattering Wavelet Transform CNN. IEEE Geosci. Remote Sens. Lett. 2022, 19, 8028505. [Google Scholar] [CrossRef]
  10. Liu, F.; Wang, Y.; Kou, M.; Liang, C. Applications of Microseismic Monitoring Technique in Coal Mines: A State-of-the-Art Review. Appl. Sci. 2024, 14, 1509. [Google Scholar] [CrossRef]
  11. Liu, J.; Zhao, Y.; Tan, T.; Zhang, L.; Zhu, S.; Xu, F. Evolution and modeling of mine water inflow and hazard characteristics in southern coalfields of China: A case of Meitanba mine. Int. J. Min. Sci. Technol. 2022, 32, 513–524. [Google Scholar] [CrossRef]
  12. Zheng, Q.; Wang, C.; Yang, Y.; Liu, W.; Zhu, Y. Identification of mine water sources using a multi-dimensional ion-causative nonlinear algorithmic model. Sci. Rep. 2024, 14, 3305. [Google Scholar] [CrossRef] [PubMed]
  13. Zhang, C.; Bai, Q.; Han, P. A review of water rock interaction in underground coal mining: Problems and analysis. Bull. Eng. Geol. Environ. 2023, 82, 157. [Google Scholar] [CrossRef]
  14. An, P.; Li, M.; Ma, S.; Zhang, J.; Huang, Z. Analysis of the thickness of the outburst prevention layer in karst tunnels under the control of compressive faults. Tunn. Undergr. Space Technol. 2024, 147, 105710. [Google Scholar] [CrossRef]
  15. Chun’an, T.; Liexian, T.; Lianchong, L.I.; Changwen, L.I. Centrifugal loading method of RFPA for the failure process analysis of rock and soil structure. Chin. J. Geotech. Eng. 2007, 29, 71–76. [Google Scholar]
  16. de Graaf, I.E.M.; Sutanudjaja, E.H.; van Beek, L.P.H.; Bierkens, M.F.P. A high-resolution global-scale groundwater model. Hydrol. Earth Syst. Sci. 2015, 19, 823–837. [Google Scholar] [CrossRef]
  17. Zhou, S.W.; Zhuang, X.Y.; Rabczuk, T. Phase-field modeling of fluid-driven dynamic cracking in porous media. Comput. Methods Appl. Mech. Eng. 2019, 350, 169–198. [Google Scholar] [CrossRef]
  18. Yin, H.; Zhang, G.; Wu, Q.; Yin, S.; Soltanian, M.R.; Thanh, H.V.; Dai, Z. A Deep Learning-Based Data-Driven Approach for Predicting Mining Water Inrush From Coal Seam Floor Using Microseismic Monitoring Data. IEEE Trans. Geosci. Remote Sens. 2023, 61, 4504815. [Google Scholar] [CrossRef]
  19. Gai, Q.; He, M.; Gao, Y.; Lu, C. A two-dimensional model test system for floor failure during automatic roadway formation mining without pillars above confined water. Eng. Fail. Anal. 2024, 162, 108369. [Google Scholar] [CrossRef]
  20. Li, N.; Du, W. Enhanced Methods for Evaluating Water-inrush Risk from Underlying Aquifers: Incorporating Dynamic Weight Theory and Uncertainty Analysis Model. Water Resour. Manag. 2024, 38, 4615–4631. [Google Scholar] [CrossRef]
  21. Wang, W.; Cui, X.C.; Qi, Y.; Xue, K.L.; Liang, R.; Sun, Z.P.; Tao, H.J. Mine water inrush source discrimination model based on KPCA-ISSA-KELM. PLoS ONE 2024, 19, e0299476. [Google Scholar] [CrossRef]
  22. Liang, Z.; Li, H.; Tang, J. The description technology of three dimensional space for fault and its fracture development zone. Fault Block Oil Gas Field 2022, 29, 496–501. [Google Scholar]
  23. Chen, W.; Zhang, S.; Li, R.; Shahabi, H. Performance evaluation of the GIS-based data mining techniques of best-first decision tree, random forest, and naive Bayes tree for landslide susceptibility modeling. Sci. Total Environ. 2018, 644, 1006–1018. [Google Scholar] [CrossRef]
  24. Kia, M.B.; Pirasteh, S.; Pradhan, B.; Mahmud, A.R.; Sulaiman, W.N.A.; Moradi, A. An artificial neural network model for flood simulation using GIS: Johor River Basin, Malaysia. Environ. Earth Sci. 2012, 67, 251–264. [Google Scholar] [CrossRef]
  25. Zheng, Q.; Wang, C.; Pang, L. Overburden and surface subsidence with slicing paste filling mining in thick coal seams. Front. Earth Sci. 2023, 10, 1027816. [Google Scholar] [CrossRef]
  26. Zheng, Q.; Wang, C.; Zhu, Z. Research on the prediction of mine water inrush disasters based on multi-factor spatial game reconstruction. Geomech. Geophys. Geo-Energy Geo-Resour. 2024, 10, 41. [Google Scholar] [CrossRef]
  27. Li, Z.-Q.; Nie, L.; Xue, Y.; Li, W.; Fan, K. Model Testing on the Processes, Characteristics, and Mechanism of Water Inrush Induced by Karst Caves Ahead and Alongside a Tunnel. Rock Mech. Rock Eng. 2025, 58, 5363–5380. [Google Scholar] [CrossRef]
  28. Isniarno, N.F.; Aziz, G.; Iswandaru, I. Hydrological monitoring in open PIT mining areas using geodatabase attribute in Geographic Information Systems (GIS). In Proceedings of the International Conference on Innovation in Engineering and Vocational Education 2019 (ICIEVE 2019), PTS 1-4, Bandung, Indonesia, 26 November 2019. [Google Scholar]
  29. Kim, S.-M.; Choi, Y.; Suh, J.; Oh, S.; Park, H.-D.; Yoon, S.-H.; Go, W.-R. ArcMine: A GIS extension to support mine reclamation planning. Comput. Geosci. 2012, 46, 84–95. [Google Scholar] [CrossRef]
  30. Naidu, G.; Ryu, S.; Thiruvenkatachari, R.; Choi, Y.; Jeong, S.; Vigneswaran, S. A critical review on remediation, reuse, and resource recovery from acid mine drainage. Environ. Pollut. 2019, 247, 1110–1124. [Google Scholar] [CrossRef]
  31. Li, W.; Wang, Y.; Ye, Z.; Liu, Y.A.; Wang, L. Development of a mixed reality assisted escape system for underground mine- based on the mine water-inrush accident background. Tunn. Undergr. Space Technol. 2024, 143, 105471. [Google Scholar] [CrossRef]
  32. Shao, J.; Zhang, Q.; Zhang, W. Evolution of mining-induced water inrush disaster from a hidden fault in coal seam floor based on a coupled stress-seepage-damage model. Geomech. Geophys. Geo-Energy Geo-Resour. 2024, 10, 78. [Google Scholar] [CrossRef]
  33. Huang, L.; Li, J.; Hao, H.; Li, X. Micro-seismic event detection and location in underground mines by using Convolutional Neural Networks (CNN) and deep learning. Tunn. Undergr. Space Technol. 2018, 81, 265–276. [Google Scholar] [CrossRef]
  34. Xu, J.; Zheng, L.; Lan, H.; Zuo, Y.; Li, B.; Tian, S.; Tian, Y. Research on an identification model for mine water inrush sources based on the HBA-CatBoost algorithm. Sci. Rep. 2024, 14, 23508. [Google Scholar] [CrossRef] [PubMed]
  35. Almeida, J.; Soares, J.; Lezama, F.; Limmer, S.; Rodemann, T.; Vale, Z. A systematic review of explainability in computational intelligence for optimization. Comput. Sci. Rev. 2025, 57, 100764. [Google Scholar] [CrossRef]
  36. Janousek, J.; Gajdos, P.; Radecky, M.; Snasel, V. Gaussian Mixture Model Cluster Forest. In Proceedings of the 2015 IEEE 14th International Conference on Machine Learning and Applications (ICMLA), Miami, FL, USA, 9–11 December 2015; pp. 1019–1023. [Google Scholar]
  37. Zhang, J.; Zhu, Z.; Zou, J. Supervised Gaussian Process Latent Variable Model Based on Gaussian Mixture Model. In Proceedings of the 2017 International Conference on Security, Pattern Analysis, and Cybernetics (SPAC), Shenzhen, China, 15–17 December 2017; pp. 124–129. [Google Scholar]
  38. Hajihosseinlou, M.; Maghsoudi, A.; Ghezelbash, R. A semi-supervised learning framework for intelligent mineral prospectivity mapping: Incorporation of the CatBoost and Gaussian mixture model algorithms. J. Geochem. Explor. 2025, 274, 107755. [Google Scholar] [CrossRef]
  39. Yao, X.; Su, K.; Zhang, H.; Zhang, S.; Zhang, H.; Zhang, J. Remaining useful life prediction for lithium-ion batteries in highway electromechanical equipment based on feature-encoded LSTM-CNN network. Energy 2025, 323, 135719. [Google Scholar] [CrossRef]
  40. Liu, Y.; Li, P.; Liu, Y. Penalized empirical likelihood estimation and EM algorithms for closed-population capture-recapture models. Stat. Comput. 2025, 35, 25. [Google Scholar] [CrossRef]
  41. Tseng, J.C.-H.; Tsai, B.-A.; Chung, K. Sea surface temperature clustering and prediction in the Pacific Ocean based on isometric feature mapping analysis. Geosci. Lett. 2023, 10, 42. [Google Scholar] [CrossRef]
  42. Wang, Y.; Zhang, Z.; Lin, Y. Multi-Cluster Feature Selection Based on Isometric Mapping. IEEE-CAA J. Autom. Sin. 2022, 9, 570–572. [Google Scholar] [CrossRef]
  43. Qiu, Y.; Zhou, J.; Khandelwal, M.; Yang, H.; Yang, P.; Li, C. Performance evaluation of hybrid WOA-XGBoost, GWO-XGBoost and BO-XGBoost models to predict blast-induced ground vibration. Eng. Comput. 2022, 38, 4145–4162. [Google Scholar] [CrossRef]
  44. Wu, Y.; Sang, W.; Cao, X.; He, L. Research on the Parameter Prediction Model for Fully Mechanized Mining Equipment Selection Based on RF-WOA-XGBoost. Appl. Sci. 2025, 15, 732. [Google Scholar] [CrossRef]
Figure 1. WOA-XGBoost procedure.
Symmetry 17 01111 g001
Figure 2. Interpretative prediction model for coal mine water inrush risk driven by data and associative information self-mining.
Symmetry 17 01111 g002
Figure 3. Comparison of indicator characteristics before and after data augmentation.
Symmetry 17 01111 g003
Figure 4. Feature-wise KL divergence between original and augmented data.
Symmetry 17 01111 g004
Figure 5. Reconstruction errors in different dimensions.
Symmetry 17 01111 g005
Figure 6. Comparison of influential factor correlation before and after dimensionality reduction.
Symmetry 17 01111 g006
Figure 7. Loss convergence during training.
Symmetry 17 01111 g007
Figure 8. Predicted vs. true values from optimized XGBoost regression models.
Symmetry 17 01111 g008
Figure 9. Comparison of model performance metrics.
Symmetry 17 01111 g009
Figure 10. Feature importance based on SHAP.
Symmetry 17 01111 g010
Figure 11. Global explanation diagram from SHAP.
Symmetry 17 01111 g011
Figure 12. Predictive fit evaluation.
Symmetry 17 01111 g012
Figure 13. Yangcheng Coal Mine water inrush probability.
Symmetry 17 01111 g013
Table 1. Overview of the main control indexes.
No.Key Control IndicatorsUnitEvaluation Criteria
X1Inclined LengthmActual width of the working face
X2Aquifer Water PressureMPaActual water pressure value
X3Monthly Advancement Distance of Working FacemActual advancement distance of the working face
X4Aquiclude ThicknessmActual thickness of the aquiclude
X5Depth of Floor DamagemActual depth of floor damage
X6Percentage of Sandstone in the AquicludeNoneActual percentage of sandstone in the aquiclude
X7Percentage of Mudstone in the AquicludeNoneActual percentage of mudstone in the aquiclude
X8Percentage of Limestone in the AquicludeNoneActual percentage of limestone in the aquiclude
X9Mining Height of
Working Face
mActual mining height of the working face
X10Fault DisplacementmActual displacement value
X11Mining Depth of
Working Face
mActual coal seam mining depth
X12Water Temperature°CActual water temperature value
X13Strike Length of
Working Face
mActual strike length of the working face
X14Coal Seam Dip Angle°Actual coal seam dip angle
X15Coal Seam ThicknessmActual thickness of the coal seam
Table 2. Comparison of residuals for different d and k values.
d2345678910
k
20.1540.1160.0930.0710.0560.0510.0490.0510.046
30.2040.1230.0980.0600.0510.0470.0440.0410.042
40.2500.1310.0960.0860.0670.0610.0500.0490.049
50.2770.1740.1190.0930.0680.0580.0530.0480.050
60.2480.1470.1200.0770.0690.0560.0500.0490.049
70.2410.1630.1060.0820.0750.0640.0550.0510.051
80.2460.1540.1080.0800.0680.0580.0570.0550.054
90.2760.1840.1310.0950.0770.0610.0620.0600.057
100.2620.1740.1180.0880.0700.0670.0650.0610.059
Table 3. KNN reconstruction residuals of different dimension reduction methods.
MethodTypeKNN Residual
ISOMAPNonlinear0.41
AutoencoderNonlinear0.47
t-SNENonlinear0.55
LLENonlinear0.58
MDSLinear0.62
PCALinear0.68
Table 4. Comparison of model performance metrics.
RMSEMAPEMAEMBE
BPNN0.896 ± 0.0430.479 ± 0.0380.805 ± 0.0450.567 ± 0.029
SVR0.871 ± 0.0390.442 ± 0.0350.774 ± 0.0440.541 ± 0.024
XGboost0.803 ± 0.0350.408 ± 0.0330.701 ± 0.0310.512 ± 0.024
PSO-XGboost0.805 ± 0.0420.414 ± 0.0350.725 ± 0.0370.524 ± 0.025
DBO-XGboost0.814 ± 0.0440.423 ± 0.0330.748 ± 0.0350.529 ± 0.022
WOA-XGboost0.764 ± 0.0410.372 ± 0.0290.691 ± 0.0330.425 ± 0.025
KPCA-DBO-SVR [6]0.492 ± 0.0310.207 ± 0.0220.406 ± 0.0240.313 ± 0.022
GMM-WOA-XGboost0.453 ± 0.0340.187 ± 0.0160.394 ± 0.0270.190 ± 0.018
GMM-ISOMAP-WOA-XGboost0.301 ± 0.0260.100 ± 0.0110.238 ± 0.0190.161 ± 0.015
ISOMAP-WOA-XGboost0.504 ± 0.0370.213 ± 0.0180.482 ± 0.0310.275 ± 0.021
Improvement vs. WOA-XGboost60.6%73.12%65.56%62.12%
Disclaimer/Publisher’s Note: The statements, opinions and data contained in all publications are solely those of the individual author(s) and contributor(s) and not of MDPI and/or the editor(s). MDPI and/or the editor(s) disclaim responsibility for any injury to people or property resulting from any ideas, methods, instructions or products referred to in the content.

