Article

A Multi-Objective Method for Enhancing the Seismic Resilience of Urban Water Distribution Networks

1
College of Architecture and Civil Engineering, Chengdu University, Chengdu 610106, China
2
Northwest Research Institute of Engineering Investigation and Design, Xi’an 710003, China
*
Author to whom correspondence should be addressed.
Symmetry 2025, 17(7), 1105; https://doi.org/10.3390/sym17071105
Submission received: 30 May 2025 / Revised: 4 July 2025 / Accepted: 7 July 2025 / Published: 9 July 2025
(This article belongs to the Section Engineering and Materials)

Abstract

Enhancing the seismic resilience of urban water distribution networks (WDNs) requires the improvement of both earthquake resistance and rapid recovery capabilities within the system. This paper proposes a multi-objective method to enhance the seismic resilience of the WDNs, focusing on system restoration capabilities while comprehensively considering the hydraulic recovery index, maintenance time, and maintenance cost. The method utilizes a random simulation approach to generate various damage scenarios for the WDN, considering pipe leakage, pipe bursts, and variations in node flow resulting from changes in water pressure. It characterizes the functions of the WDN through hydraulic service satisfaction and quantifies system resilience using a performance response function. Additionally, it determines the optimal dispatch strategy for emergency repair teams and the optimal emergency repair sequence for earthquake-damaged networks using a genetic algorithm. Furthermore, a comprehensive computational platform has been developed to systematically analyze and optimize seismic resilience strategies for WDNs. The feasibility of the proposed method is demonstrated through an example involving the WDN in Xi’an City. The results indicate that the single-objective seismic resilience improvement method based on the hydraulic recovery index is the most effective for enhancing the seismic resilience of the WDN. In contrast, the multi-objective method proposed in this article reduces repair time by 17.9% and repair costs by 3.4%, while only resulting in a 0.2% decrease in the seismic resilience of the WDN. This method demonstrates the most favorable comprehensive restoration effect, and the success of our method in achieving a symmetrically balanced restoration outcome demonstrates its value. The proposed methodology and software can provide both theoretical frameworks and technical support for urban WDN administrators.

1. Introduction

The urban water distribution networks (WDNs) are crucial components of urban infrastructure, essential for the city’s normal functioning and the daily lives of its residents. However, the increasing frequency of natural disasters, particularly destructive earthquakes, poses significant threats to urban WDNs, causing numerous water supply pipelines to leak or rupture, leading to a decline in water supply functionality or even a total loss of capacity, which consequently fails to meet the drinking water needs of earthquake victims, as well as their medical and firefighting requirements, thereby severely impacting disaster relief efforts. Therefore, it is imperative to enhance the seismic resilience of urban WDNs, minimize damage to the WDN, and enable the rapid restoration of water supply functionality. Therefore, this paper proposes an earthquake resilience enhancement model for WDNs to formulate the optimal repair sequence and reasonably schedule repair crews, maximizing the effectiveness of limited resources and enabling the WDN to recover to its pre-earthquake level more quickly.

2. Related Works

Seismic resilience of urban WDNs refers to the capacity of each component to resist and absorb seismic disturbances, ensuring basic operational continuity during earthquakes, as well as the ability to recover swiftly post-disturbance and to adapt and evolve to mitigate future seismic impacts [1,2]. The quantitative assessment of seismic resilience primarily encompasses two methodologies: the cumulative consequence-based assessment method and the performance curve characterization-based assessment method. The cumulative consequence-based assessment method, first proposed by Bruneau [2], utilizes the “area of the triangle” formed by the performance level curve of the engineering system and the coordinate axis to characterize resilience. This method has gained widespread adoption because it encompasses the entire process of the engineering system’s response to seismic events, thus providing a more comprehensive portrayal of resilience characteristics. Some scholars have made significant adjustments to Bruneau’s method, focusing on the calculation time of cumulative consequences and the shape of the performance level curve [3,4,5,6]. The performance curve characterization-based method further incorporates factors such as the total performance factor, absorption, repair time, and volatility associated with the performance evolution curve, building upon the cumulative consequence method [7,8,9,10,11]. The primary objective of resilience assessment is to enhance overall resilience. Currently, both domestic and international researchers focus on improving the seismic resilience of WDNs through two key stages: pre-earthquake and post-earthquake.
Enhancing the seismic resilience of pre-earthquake water distribution networks primarily involves modifying the pipeline network to improve the system’s ability to withstand seismic events. These reconstruction measures can be categorized into two strategies: unit retrofitting and network optimization. The unit retrofitting strategy emphasizes measures that enhance the seismic resistance of individual components within the WDN, such as ductile retrofitting of pipelines [12], structural reinforcement of water treatment plants [13], and installation of power backups for pumping stations. Among these, ductile retrofitting of pipelines is a commonly employed measure in WDNs [12]. In contrast, the network optimization strategy focuses on enhancing network performance to withstand seismic disasters, involving measures such as network meshing expansion [14], redundancy design [15], and self-healing and self-adaptive response mechanisms [16]. Among these strategies, network meshing expansion is frequently utilized and straightforward to implement [14]. For instance, Lorenz and Pelz enhance the resilience of the existing pipe network by incorporating additional pipes into the main line of the WDN [17]. A cost–benefit optimization method is proposed to maximize the resilience of the WDN by adding pipelines, considering the constraints of a limited investment budget. Zhao et al. [18] compared the effects of the ductile retrofitting strategy and the meshed expansion strategy on the seismic resilience of the WDN from two perspectives: technology and organization. They assert that the ductile retrofitting strategy is an effective approach to significantly enhance the resilience of the WDN across multiple dimensions; however, the impact of the meshed expansion strategy on the seismic resilience of the WDN is negligible in both the technical and organizational perspectives.
The methods for enhancing the seismic resilience of the WDN post-earthquake primarily concentrate on optimizing repair strategies [19,20,21,22,23]. Liu et al. [24] compared three pipeline recovery strategies: static importance-based, damage-based, and distance-based strategies. The results indicate that among the three strategies, the static importance-based strategy is the most effective in enhancing the seismic resilience of the WDN. Furthermore, the effectiveness of restoration strategies based on static and dynamic importance was further compared. It was found that although both strategies are effective in enhancing the resilience of WDNs, the static importance strategy significantly reduces computation time. Building on Liu’s methodology, Song et al. [25] further classified water supply pipelines into critical and general categories and established the order of emergency repairs using static and dynamic importance indexes, respectively. Liu and Wu [26] proposed a post-earthquake recovery strategy for WDN based on dynamic importance, which considers the damage to water towers, pumping stations, water treatment plants, and pipelines. The results demonstrate that when accounting for multiple components, the dynamic importance strategy can significantly enhance the seismic resilience of the WDN and reduce repair time compared to the static importance strategy. Han et al. [22] developed a dynamic cost–benefit method to enhance the seismic resilience of the WDN. Compared to the global optimization method, the resilience improvement levels of the two methods are similar; however, the computational complexity of the former is significantly lower, at only 0.1% to 0.34% of that of the global optimization method. Mazumder et al. [27] proposed a computational model for determining the optimal recovery sequence, which integrates topological network efficiency, a modified resilience index, and hydraulic availability. The topology-based functionality measure provides information regarding the physical stability of the network, while hydraulic-based measures offer insights into the hydraulic capacity and functionality of the WDN. It was found that adhering to an optimal sequence for repairing damaged pipelines reduces post-disaster suffering and enhances functionality throughout the repair period. However, the methodology assumes that only one repair task can be performed at a time, which does not reflect the reality of post-earthquake conditions. In addition to resilience-based single-objective optimization methods for repair strategies, some scholars have also focused on multi-objective pipeline repair strategy research. Alfonso et al. [28] employed genetic algorithms (GA) to determine Pareto-optimal operational interventions for contaminant flushing in WDNs. Their model concurrently minimized public health risks from residual contaminants and operational expenditures associated with flushing procedures. Osman et al. [29] provided a tool to optimize the scheduling of repair crews in WDNs using GA. They considered two repair methods to minimize the time and cost of repair actions and the cumulative pipeline criticality index. Assad et al. [30] developed a resilience-driven multi-objective restoration model that concurrently minimizes total recovery duration, reduces aggregate rehabilitation costs, and maximizes systemic resilience enhancement. This formulation was resolved through weighted sum scalarization and optimized using GA, with computational experiments demonstrating GA’s superior performance over Ant Colony Optimization and Tabu Search in solution diversity and constraint satisfaction metrics. However, the aforementioned studies did not consider their application in the context of seismic disasters. Based on the studies of Osman et al. and Assad et al., Long et al. [31] established a multi-objective optimization model for repair crew scheduling, considering the impact of earthquakes and incorporating hydraulic recovery index, repair time, and repair cost. The proposed method was applied to a seismic damage scenario of a water supply network, providing an optimized repair sequence for the damaged pipelines. In terms of optimization algorithms, apart from the commonly used genetic algorithm, some scholars have attempted to apply other algorithms to seismic resilience enhancement studies of WDNs [32,33,34]. Haghighi et al. employed artificial neural network methods to conduct seismic vulnerability assessment of WDNs, providing an innovative perspective for resilience evaluation and enhancement [32]. Fan and Yu [35] trained a reinforcement learning model to optimize WDN restoration sequences, taking into account consumer needs and dynamic water demand patterns. This approach significantly improves repair efficiency and effectively enhances the seismic resilience of WDNs. Fan et al. [36] developed a novel graph convolutional neural network-integrated deep reinforcement learning model to support optimal repair decisions to improve WDN resilience after earthquakes. The topology and performance of service nodes are inputs to the graph convolutional neural network; the outputs of graph convolutional neural network are the reward values corresponding to each repair action, which are fed into the deep reinforcement learning process to select the optimal repair sequence from a large action space to achieve the highest system resilience.
Based on the literature review, several gaps were identified in the literature that required a tailored approach to consider the problem of WDN seismic resilience enhancement. These gaps/needs can be summarized as:
(1)
Prevailing research on enhancing seismic resilience of WDNs predominantly focuses on specific earthquake damage scenarios, failing to systematically account for uncertainties inherent in seismic inputs, system responses, and recovery processes during resilience assessment. These uncertainties cascade and accumulate across phases, significantly compromising the accuracy of seismic resilience evaluations.
(2)
Current research predominantly focuses on theoretical methodologies for resilience enhancement, yet fails to develop integrated software platforms. This gap significantly impedes the provision of technical decision-support tools for urban WDN administrators to implement resilience enhancement strategies.
Therefore, based on the Monte Carlo simulation approach and considering the uncertainties during the resilience enhancement process, this paper proposes a theoretical framework for multi-objective seismic resilience enhancement analysis of WDNs, which takes into account the hydraulic recovery index, repair time, and repair costs. Meanwhile, the theoretical methods are integrated to develop a software tool for multi-objective seismic resilience enhancement strategy analysis.

3. Methodology

3.1. Seismic Hazard Analysis

Seismic hazard analysis involves the examination of the magnitude and frequency of potential seismic effects on a specific engineering site over a defined future period. This analysis includes a quantitative description of prospective seismic parameters, source characteristics, and earthquake types. The primary purpose of seismic hazard analysis is to predict the probability, or exceedance probability, of earthquakes of varying intensities occurring at the site over a specified period [37]. Currently, the methods of seismic hazard analysis primarily include deterministic seismic hazard analysis [38,39] and probabilistic seismic hazard analysis [40]. The deterministic seismic hazard analysis method is fundamentally based on the principles of historical earthquake recurrence and geological structure classification. This method utilizes data such as regional historical seismic activity characteristics, the tectonic background of seismic geology, and the attenuation relationships of seismic intensity to estimate the locations and magnitudes of the maximum potential earthquakes in the study area. The probabilistic seismic hazard analysis method estimates the likelihood of seismic ground motion at a given site exceeding a specified threshold by considering the seismic activity characteristics of various potential source zones within the study area and the probabilities of earthquakes of different magnitudes. The selection of ground motion attenuation models is critically important among these two methods. This article employs ground motion attenuation models that are widely accepted in China [41], as illustrated in Equation (1).
lg Y = C 1 + C 2 M + C 3 M 2 + C 4 lg R + C 5 e C 6 M
where Y represents the peak ground acceleration; M denotes the surface wave magnitude; R is the epicentral distance; C1, C2, C3, C4, C5, and C6 are the regression coefficients.

3.2. Seismic Vulnerability Analysis of Water Supply Pipelines

Seismic vulnerability analysis is a technique employed to predict the probability of damage at varying levels to a specific structure under different magnitudes of earthquake impact [42,43]. The results of this analysis can be depicted through seismic fragility curves. Seismic fragility curves quantitatively represent the relationship between earthquake intensity and the vulnerability of disaster-bearing entities. Depending on the construction methods utilized, seismic fragility curves can be classified into four categories: (1) empirical fragility curves derived from earthquake damage data; (2) fragility curves based on expert judgment; (3) analytical fragility curves developed from static and dynamic analysis results of structural models; and (4) hybrid fragility curves created by integrating the aforementioned methods. This article employs empirical vulnerability curves to illustrate the probability of different damage states of water supply pipelines subjected to various seismic actions. It is generally assumed that pipeline damage occurs randomly and independently along the length L of the pipeline, following a Poisson distribution. Therefore, the probability of different damage states of the pipeline can be expressed as follows:
{ P f 3 = 1 e 0.15 · R f · L P f 2 = 1 e 0.85 · R f · L P f 1 = 1 P f 2 P f 3
where Pf1, Pf2, and Pf3 denote the probability of the pipeline being basically intact, moderately damaged, and severely damaged, respectively; L is the length (km) of the pipeline. Rf is the pipe repair rate, expressed as repairs/km, the value of which depends on factors such as pipe diameter, pipe material, topography, and liquefaction [44].

3.3. Hydraulic Analysis of the WDN

The seismic functional reliability of the WDN pertains to the network’s service performance under potential seismic intensity, typically quantified by water pressure or flow at network nodes in a damaged state. Under destructive seismic action, the WDN may experience leakage or pipe bursts, leading to a drop in water pressure at user nodes, resulting in low-pressure operation with leakage in the network. To accurately evaluate the hydraulic performance of the compromised network, this paper develops a hydraulic calculation model for a seismically damaged network, taking into account pipeline leakage, burst conditions, and variations in node flow with pressure, which is solved using the Newton–Raphson iteration method. The pipeline leakage flow is determined using the orifice flow model.
Q L = 4 . 427 μ A L H L
A L = ( P 1 ω 1 + P 2 ( ω 2 + ω 1 ) 2 + P 3 ( 1 3 ω 2 2 + 2 ω 2 3 ) 3 ( 1 ω 2 ) 2 ) A
where μ is the orifice flow coefficient, which takes the value from 0.60 to 0.90; QL, AL, and HL are the leakage point flow rate (m3/s), leakage area (m2), and water pressure (m), respectively, where AL is calculated by the approximate probability density estimation method [45].
The head loss at the breakage point can be determined from the head loss relationship along the pipeline segment from the upstream node to the breakage point. In this study, the virtual reservoir model developed by Shi [19] was used to determine the flow rates at pipe breakage points. In addition, the nodal flow rate is calculated by using the pressure-driven model proposed by Gupta and Bhave [46,47].
Q i = { 0 H i H i m i n Q i r e q ( H i H i m i n H i d e s H i m i n ) 1 / n H i m i n < H i < H i d e s Q i r e q H i H i d e s
where Qi and Qireq is the actual flow rate (m3/s) and the required flow rate (m3/s) at node i, respectively. Hi, Himin, and Hides is the actual water pressure (m), the minimum design pressure (m), and the reference pressure (m) at node i, respectively. n is an empirical coefficient, usually ranging from 1.5 to 2.

3.4. Resilience Evaluation Model

Engineering resilience refers to the capacity of an engineering system to decrease the likelihood of damage during an earthquake, minimize the extent of damage post-earthquake, and rapidly restore system functionality through timely interventions. The performance response function method is frequently employed to quantify system resilience. As depicted in Figure 1, the vertical axis represents system functionality, the horizontal axis denotes time, and the red line segment illustrates the variations in system functionality before, during, and after the earthquake. The level of seismic resilience in an engineering system is intricately linked to the definition of system functionality and the recovery process.
This article defines the ratio of the water pressure at supply nodes following an earthquake to the required pressure as the hydraulic service satisfaction of those nodes. The weighted sum of the hydraulic service satisfaction across all supply nodes is defined as the hydraulic service satisfaction of the WDN. The hydraulic service satisfaction of the WDN serves to characterize the functionality of the system. The resilience of the WDN can be computed using the following formula [24].
R = 1 t c t 0 t 0 t c SP ( t ) dt
where tc represents the control time. t0 indicates the time at which the earthquake occurs. SP(t) represents the functional level of the WDN at time t.

3.5. The Multi-Objective Approach to Enhance the Resilience of WDNs

Enhancing the resilience of the WDNs can be achieved by strengthening the network’s capacity to withstand earthquakes prior to their occurrence and optimizing repair strategies in the aftermath. This article focuses exclusively on the second aspect, strategically applying symmetric consideration to three critical factors—hydraulic recovery index, repair time, and repair cost—to enhance the seismic resilience of the WDN. The hydraulic recovery index is defined as the sum of the products of the hydraulic static importance and sequential importance coefficients for all leaking and burst pipes, as presented in Equation (7). Repair time is defined as the duration required by the longest-working team, encompassing the time for repairing leaks and burst pipes, as calculated by Equation (8). Repair cost is defined as the total of the expenses incurred for repairing leaks and burst pipes, as presented in Equation (9). Furthermore, a multi-objective scheduling model for repair crews is developed utilizing a linear weighting method [29,30], as illustrated in Equation (10).
T S D I = z = 1 n μ I z , j = z = 1 n 1 z 1 β n 1 I z , j
T T = max ( j = 1 n k = 1 m x i , j , k T i , j , k )   i c
T C = i = 1 c j = 1 n k = 1 m x i , j , k C i , j , k
M i n Z = α 1 T S D I 0 T S D I T S D I 0 + α 2 T T T T 0 T T 0 + α 3 T C T C 0 T C 0
where TSDI is the hydraulic recovery index of WDN, μ is the importance coefficient of pipeline repair order, n is the total number of leakage and pipe burst pipeline, z is the pipeline repair order, Iz,j is the repair order of z pipeline static hydraulic importance, β is the importance coefficient, and according to the engineering repair experience to take the value, this paper is unified to take the value of 0.3. TT is the total time required to repair the WDN, c is the number of repair crews, m is the number of repair methods, xi,j,k is a binary variable with the value of 1 when repair crew i repairs the leaking pipe line j by using the repair method k and 0 otherwise, and Ti,j,k is the time spent by the repair crew i in repairing the pipe line j by using the repair method k. TC is the total cost of repairing leaks and bursts, Ci,j,k is the cost of repairing leaks or bursts by repair crew i using repair method k; α1, α2, and α3 are the weighting coefficients, which represent the relative importance of hydraulic recovery index, time, and cost objectives, respectively, with the weighting coefficients summing up to one. Rescue decision-makers can adjust the values of α1, α2, and α3 according to post-earthquake conditions. For instance, when funding and resources are limited, appropriately reducing the value of α3 would be advisable. TSDI0, TT0, and TC0 are the optimal values calculated according to the hydraulic recovery index model, the repair time model, and the repair cost model, respectively; TSDI, TT, and TC are the hydraulic recovery index, the repair time, and the repair cost corresponding to a certain repair sequence, respectively.
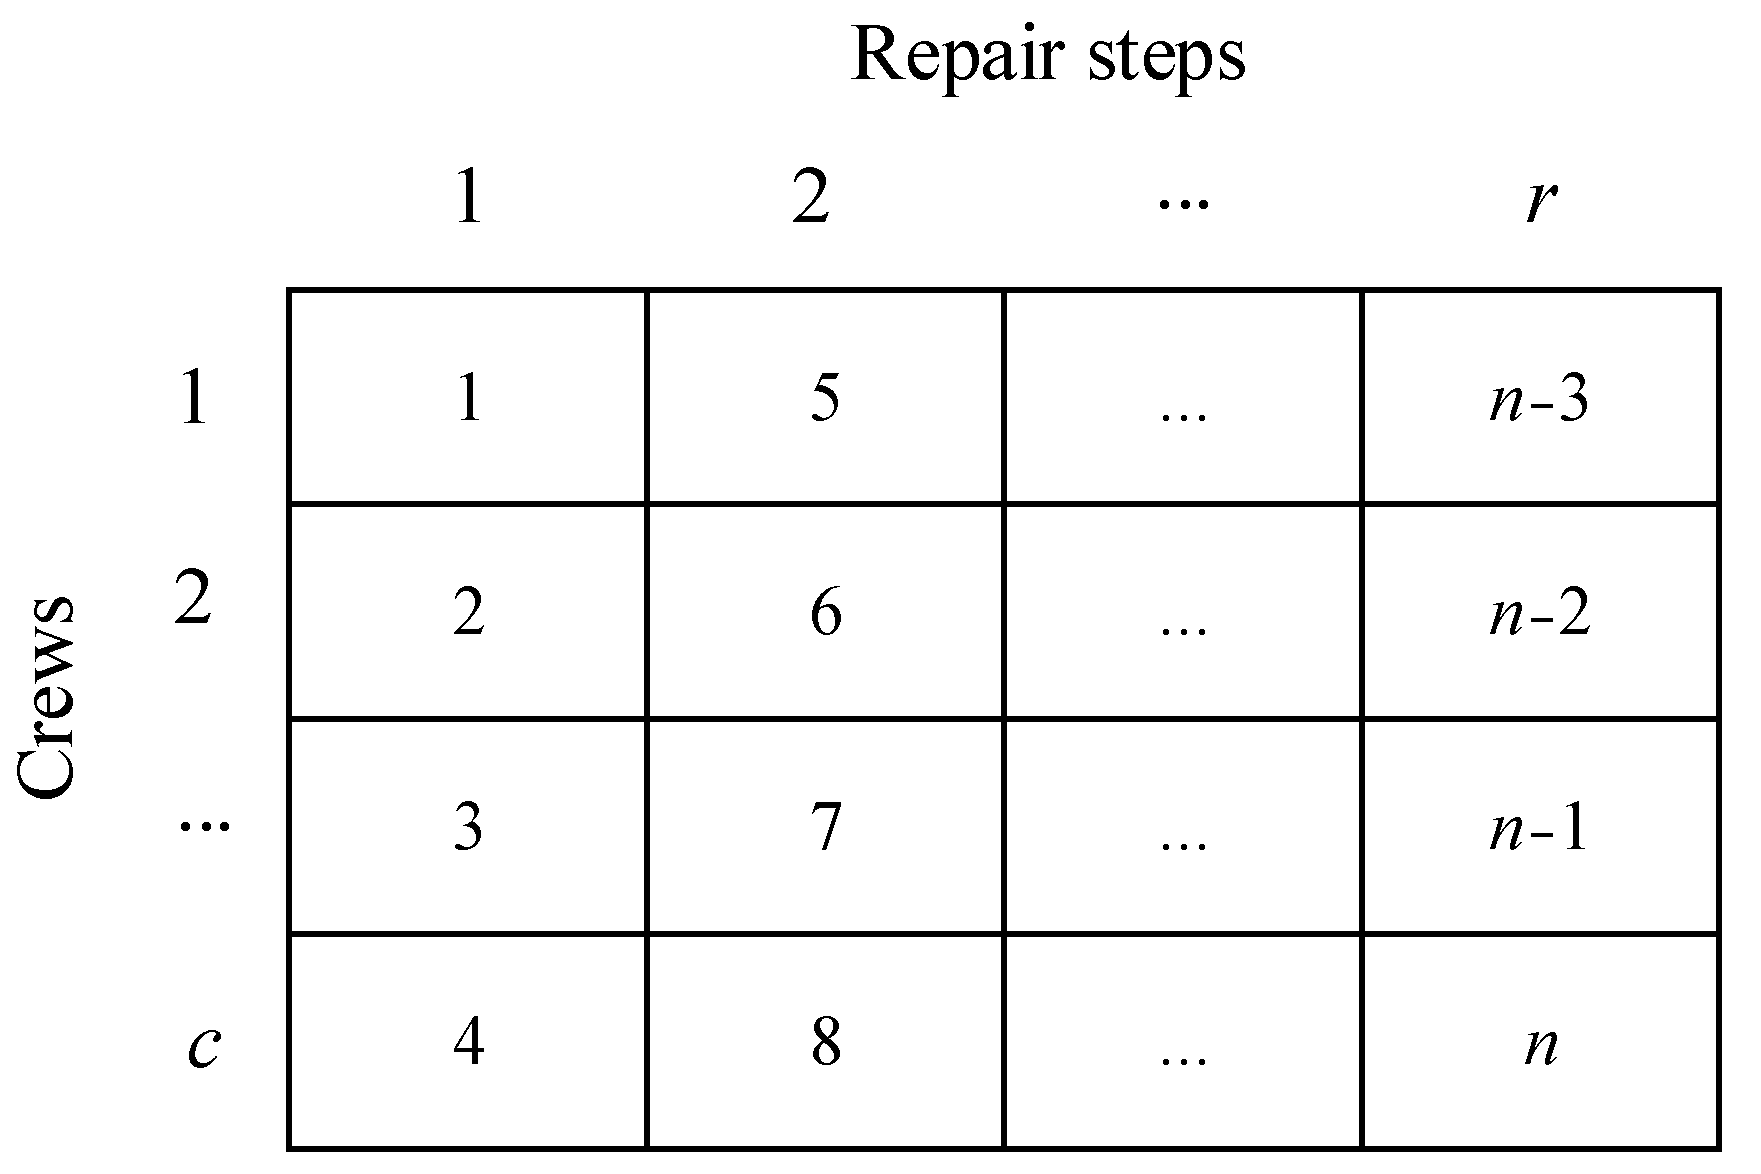
The search space of this problem is big. GA is well-known for its ability to handle large-scale search spaces and impose fewer restrictions on the problem itself. It is widely applied in fields such as combinatorial optimization, process control, and engineering optimization. Therefore, this study adopts GA to optimize the dispatch of repair crews for the WDN, thereby enhancing the resilience of the WDN [31,48]. The computational steps of the GA include encoding, generating the initial population, selecting the fitness function, selection operations, crossover operations, and mutation operations. This study employs a matrix encoding approach (see Figure 2), where the matrix dimensions are c × r. Here, c represents the number of repair crews, and r denotes the number of repair steps, calculated as the ceiling of the ratio of the number of leaking pipelines (n) to the number of repair crews (c). When r equals the ratio of n to c, each cell in the matrix is randomly assigned a leaking pipeline number. Otherwise, each cell in all columns except the last column is randomly assigned a leaking pipeline number, with the remaining pipeline numbers randomly placed in the last column. This encoding signifies that the leaking pipelines corresponding to each row of the matrix are repaired sequentially by the designated repair crew according to the corresponding repair steps. The fitness function is defined as the reciprocal of the objective function. The selection operator utilizes fitness-proportional selection (roulette wheel selection), while the crossover operator adopts two-point crossover and the mutation operator implements swap mutation.

3.6. Monte Carlo Simulation

Since earthquake-induced pipeline damage is represented by seismic failure probabilities, the pipeline status after an earthquake event is a random variable. Consequently, the MCS [49] method is employed to generate damage samples of pipelines and evaluate the probabilistic resilience of the WDN. If the number of MCS samples is denoted as N, then the system resilience is estimated by the mean value of the results from these N samples. The post-earthquake system resilience F(X) of the WDN, as estimated by the MCS simulation, is given by:
μ F = 1 N k = 1 N F ( X k )
where F(Xk) is the post-earthquake system resilience in the kth MCS sample.

3.7. Software Development

To improve the efficiency of seismic resilience assessment for the WDN, this article integrates the aforementioned methods and develops a comprehensive analysis management system for evaluating the seismic resilience of the WDN (WDNSRE V1.0). This system encompasses functions such as basic data management, seismic damage prediction, seismic reliability analysis, resilience assessment and enhancement, and visualization. This software system employs the plugin tree development concept derived from the SharpDevelop system [50], with ESRI® ARCGIS Engine technology as its core. It utilizes .NET [51] as the development platform and incorporates the spatial data engine ArcSDE along with the large relational database Oracle for unified management of spatial and attribute data [52]. The development of this software platform offers technical support for the engineering case applications presented in Section 4.
The flowchart for evaluating seismic resilience, utilizing the aforementioned models from Section 3.1, Section 3.2, Section 3.3, Section 3.4, Section 3.5 and Section 3.6, is presented in Figure 3. The analysis steps are as follows.
(1)
Input the fundamental data of the WDN, encompassing its topology, physical structure, and hydraulic parameters; additionally, specify the analysis parameters for the genetic algorithm and the number of Monte Carlo simulations, denoted as N.
(2)
Set the ground motion parameters and calculate the ground motion intensity for each pipeline segment across the WDN, utilizing the seismic hazard analysis model outlined in Section 3.1.
(3)
Utilizing the ground motion intensity in conjunction with the seismic vulnerability analysis model for water supply pipelines as outlined in Section 3.2, determine the probability of each pipeline being in a state of basic intactness, moderate damage, or severe damage.
(4)
The Monte Carlo simulation method is employed to generate a random number within the range of 0 to 1, which is then compared to the pipeline damage probability to determine whether the pipeline is in a state of intactness, leakage, or bursting, thereby determining the damage scenario of the WDN following the earthquake.
(5)
Utilizing the hydraulic analysis model outlined in Section 3.3, determine the post-earthquake hydraulic head for each node within the earthquake-damaged pipe network, and subsequently evaluate the seismic performance of the WDN.
(6)
By configuring the number of repair crews and repair costs, randomly generating pipeline repair times, and leveraging the optimization model in Section 3.5, the genetic algorithm is applied to derive the optimal repair sequences for repair time, repair cost, hydraulic recovery index, and multi-objective optimization for all damaged pipelines.
(7)
Based on the four repair sequences, the corresponding seismic performance recovery process curves of the WDN is plotted, and the seismic resilience, repair time, and cost are calculated.
(8)
Steps (4)–(7) are repeated N times to obtain the average values of seismic resilience, repair time, and cost for the WDN.

4. Case Study

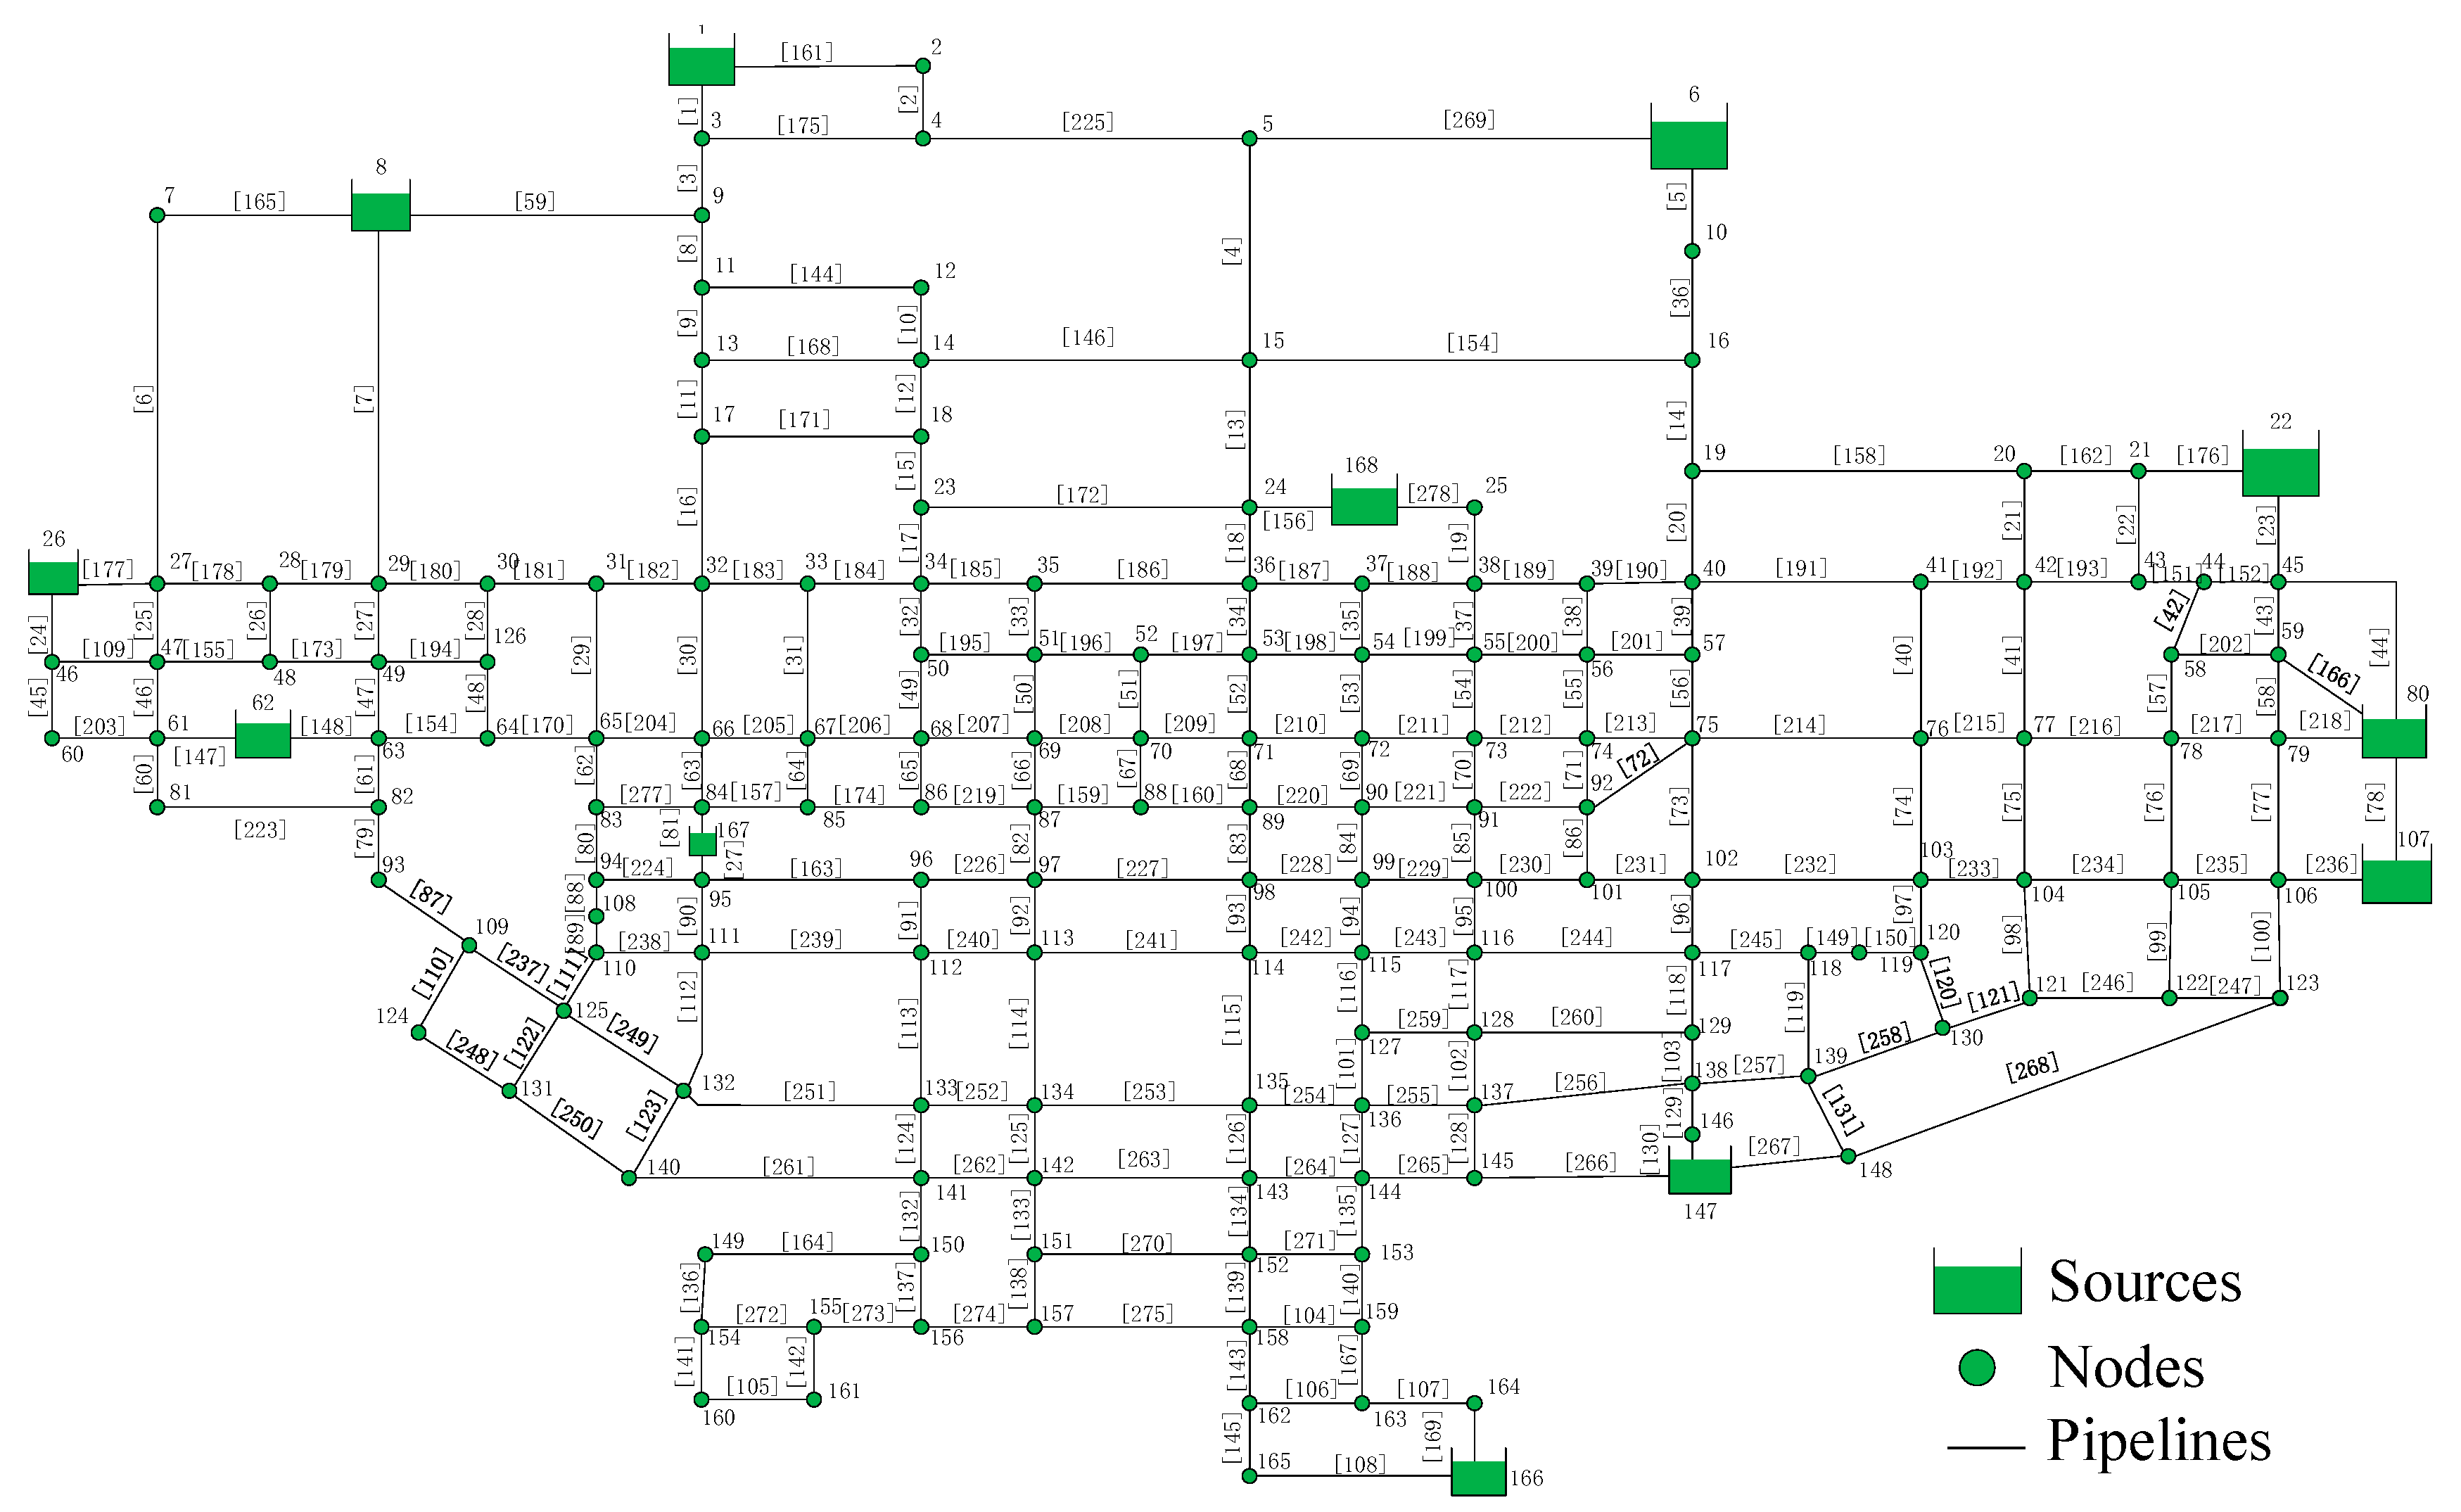
This article utilizes the urban WDN of Xi’an as a case study, employing the developed software platform to validate the method’s applicability. Xi’an has established two primary water supply systems consisting of three surface water treatment plants and four groundwater extraction facilities. The total actual production capacity of the seven water plants is 1.6 million cubic meters per day, with surface water treatment plants producing 1.22 million cubic meters per day and groundwater extraction facilities producing 380,000 cubic meters per day. The average actual water supply is 900,000 cubic meters per day, with a maximum daily supply reaching 1.05 million cubic meters. The primary urban area of Xi’an has constructed a water distribution pipeline network spanning 1426 km, with pipe diameters ranging from DN75 to DN2000. The pipeline materials primarily consist of gray cast iron pipes, ductile iron pipes, steel pipes, and polyethylene pipes. As the network renovation progresses, some gray cast iron pipes have been replaced with ductile iron or polyethylene pipes, which exhibit higher seismic resistance. The WDN of Xi’an has been appropriately simplified, with the distribution map of the main simplified pipelines presented in Figure 4, which includes 168 nodes, 278 pipelines, and 111 loops.

4.1. Seismic Hazard

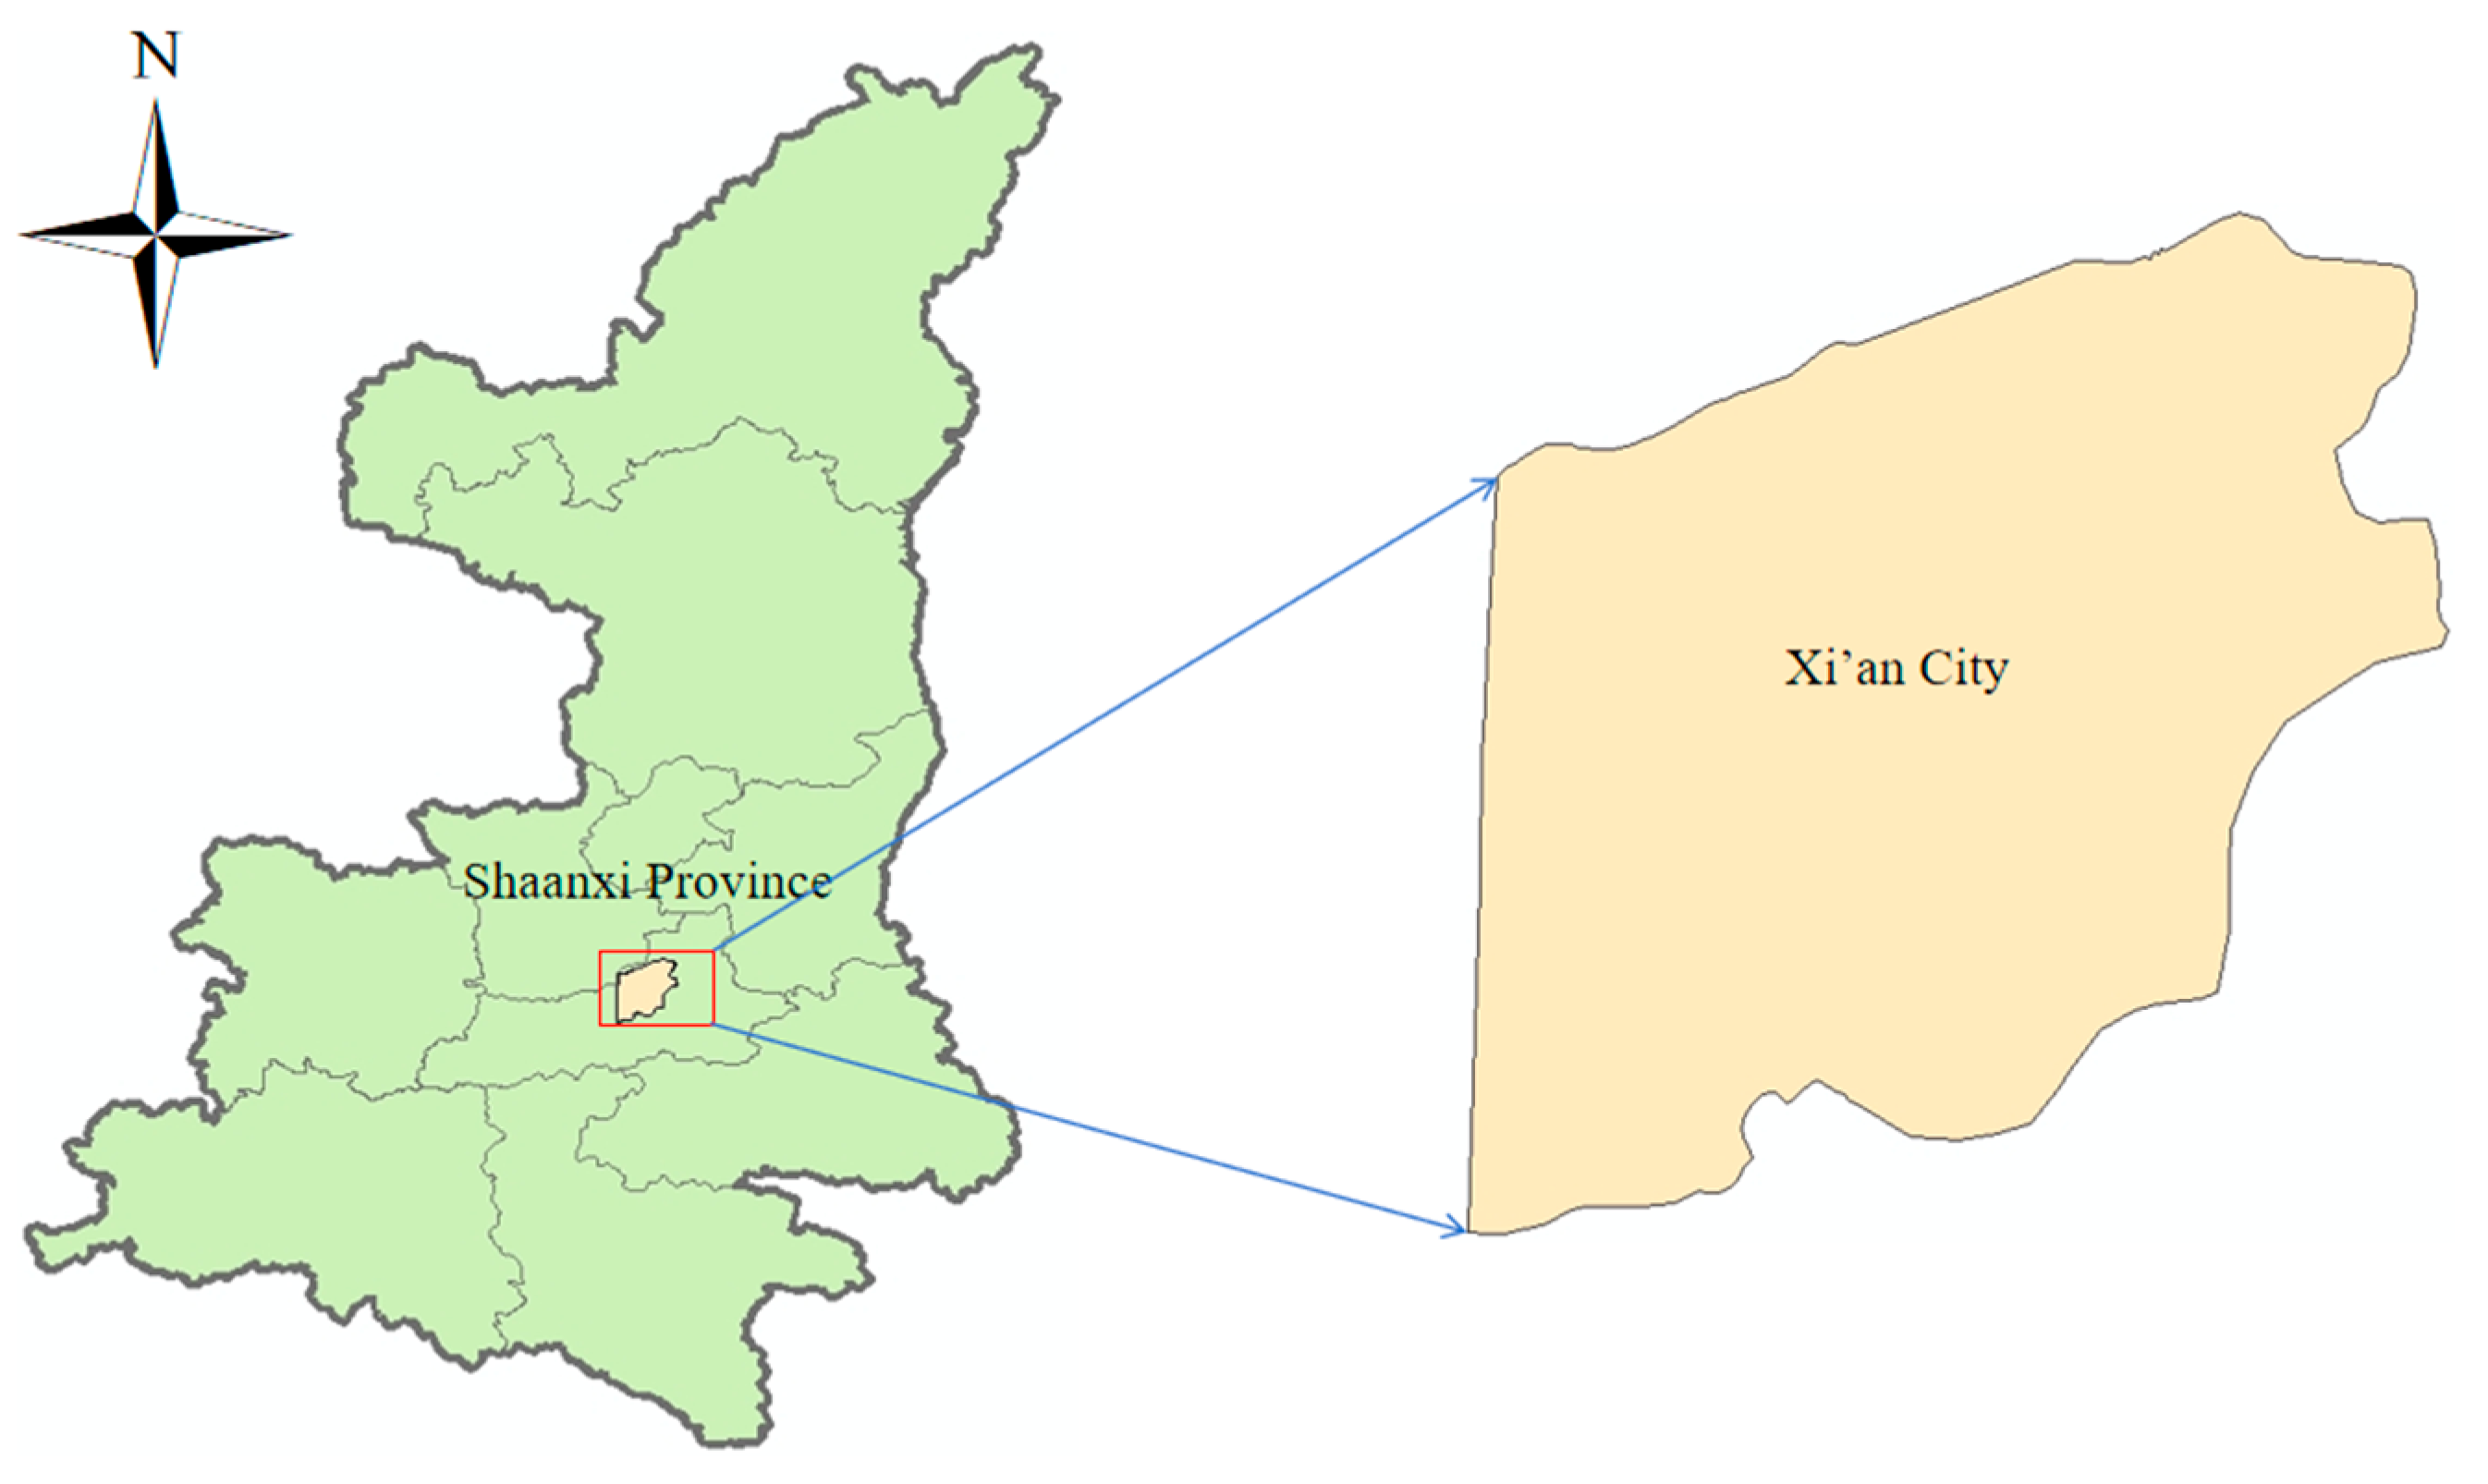
This article focuses on the seismic zoning area of Xi’an for the purpose of conducting seismic hazard analysis. The longitude range of the study area extends from 108°47′17″ E to 109°7′59″ E, while the latitude range spans from 34°5′49″ N to 34°27′18″ N, encompassing an area of approximately 1075 square kilometers, as illustrated in Figure 5. The geological structure of the Xi’an region is complex, characterized by significant tectonic deformation and active neotectonic processes. The site classification for this region is designated as Class II. In this context, a deterministic seismic hazard analysis method is employed to assess the seismic hazard of Xi’an. The selected seismic motion corresponds to the great earthquake of 1556 in Huaxian, Shaanxi, which had a magnitude of 8.0, an epicenter located at 34°44′ N, 110°16′ E, and a focal depth of 14 km. This earthquake is noted as one of the most severe in recorded history, resulting in intense ground deformation, widespread destruction of nearly all buildings, and significant casualties. The primary seismogenic structures associated with the great Huaxian earthquake include the Huashan Frontal Fault, the Weihe Fault, and the Weinan Yuan Frontal Fault. To consider the unique loess landforms of the study area, the bedrock acceleration attenuation formula for the Guanzhong region of Shaanxi, proposed by Fan et al. [41] based on reversible mapping transformation, is utilized. The site effect is calculated employing the multi-factor site effect model proposed by Chen [53], which comprehensively considers site seismic intensity, shear wave velocity, and the thickness of the overlying soil layers.
lg Y a = 0.841 + 1.275 M 0.061 M 2 1.587 lg R + 0.710 e 0.477 M   σ = 0.232 lg Y b = 1.133 + 1.262 M 0.058 M 2 1.550 lg R + 0.405 e 0.527 M   σ = 0.232
where Ya and Yb represent the peak ground acceleration values for the long axis and short axis, respectively; M denotes the surface wave magnitude; R is the epicentral distance; and σ represents the standard deviation.
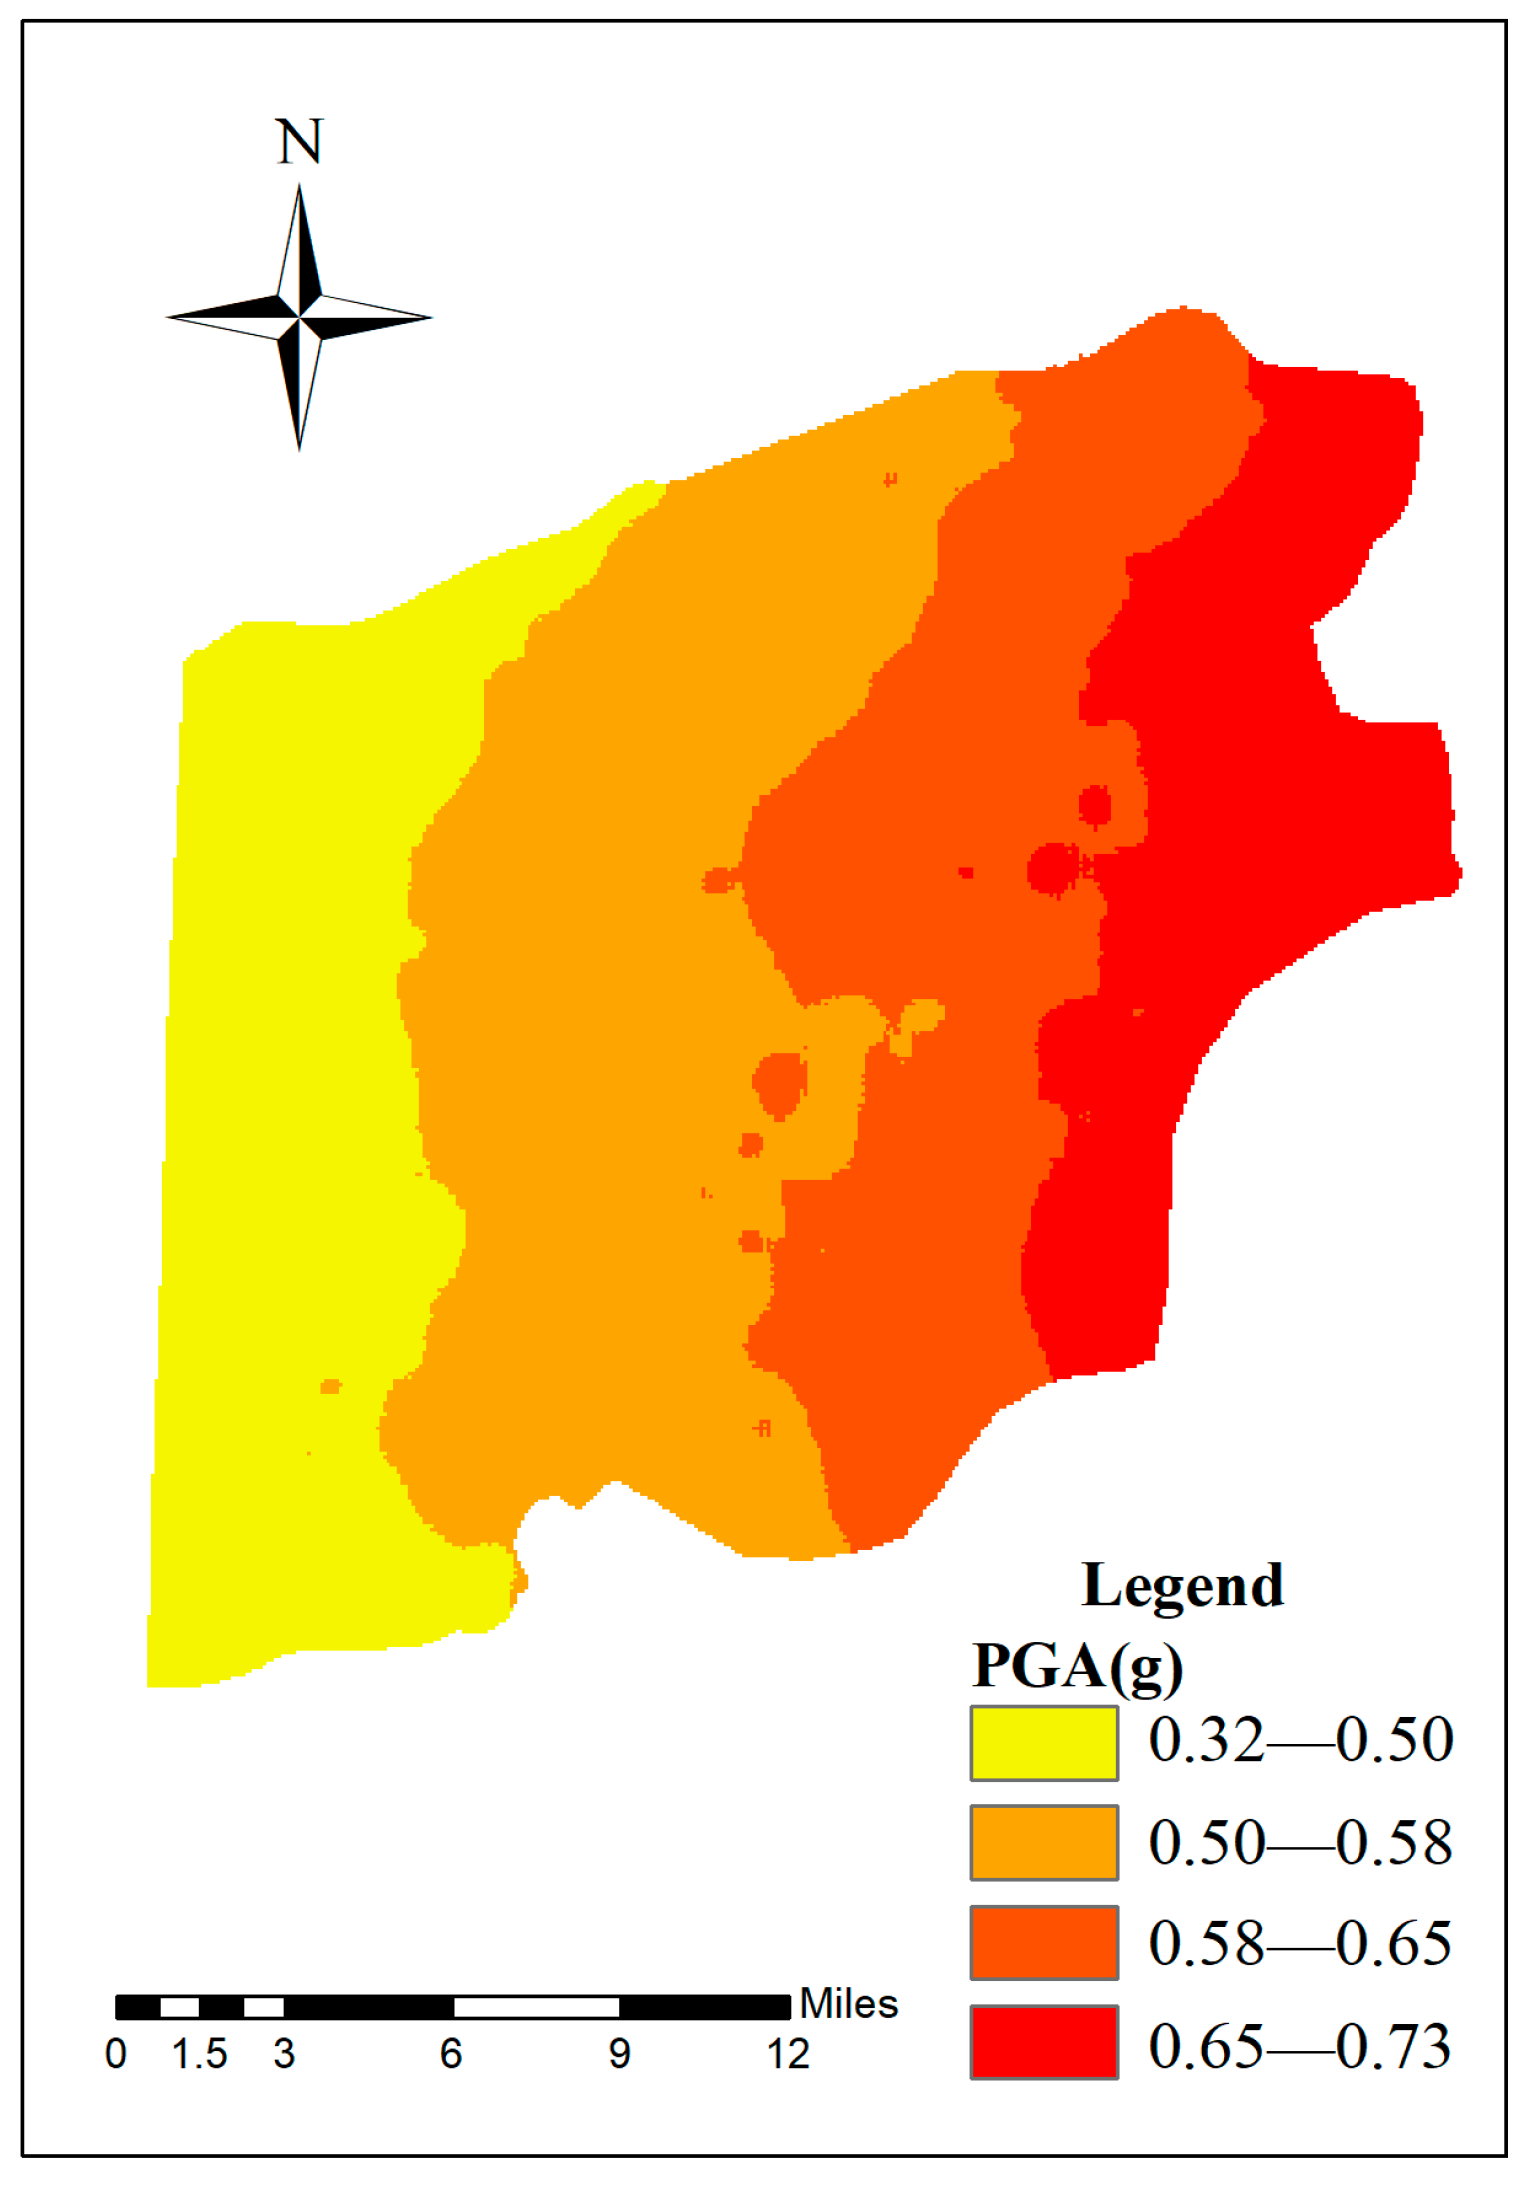
Utilizing the aforementioned parameter settings, the analysis generates the peak ground acceleration distribution map for the Xi’an region as a result of the Huaxian earthquake, as illustrated in Figure 6. The peak ground acceleration predominantly ranges from 0.32 g to 0.73 g. According to the China national standard GB 18306-2015 [54], the peak ground acceleration ranges for Class II sites corresponding to intensities VIII and IX are 0.19 g to 0.38 g and 0.38 g to 0.75 g, respectively. The results obtained from the method employed in this study are generally consistent with the actual intensity of earthquake damage, thereby validating the validity of the proposed method.

4.2. Pipeline Failure Probability

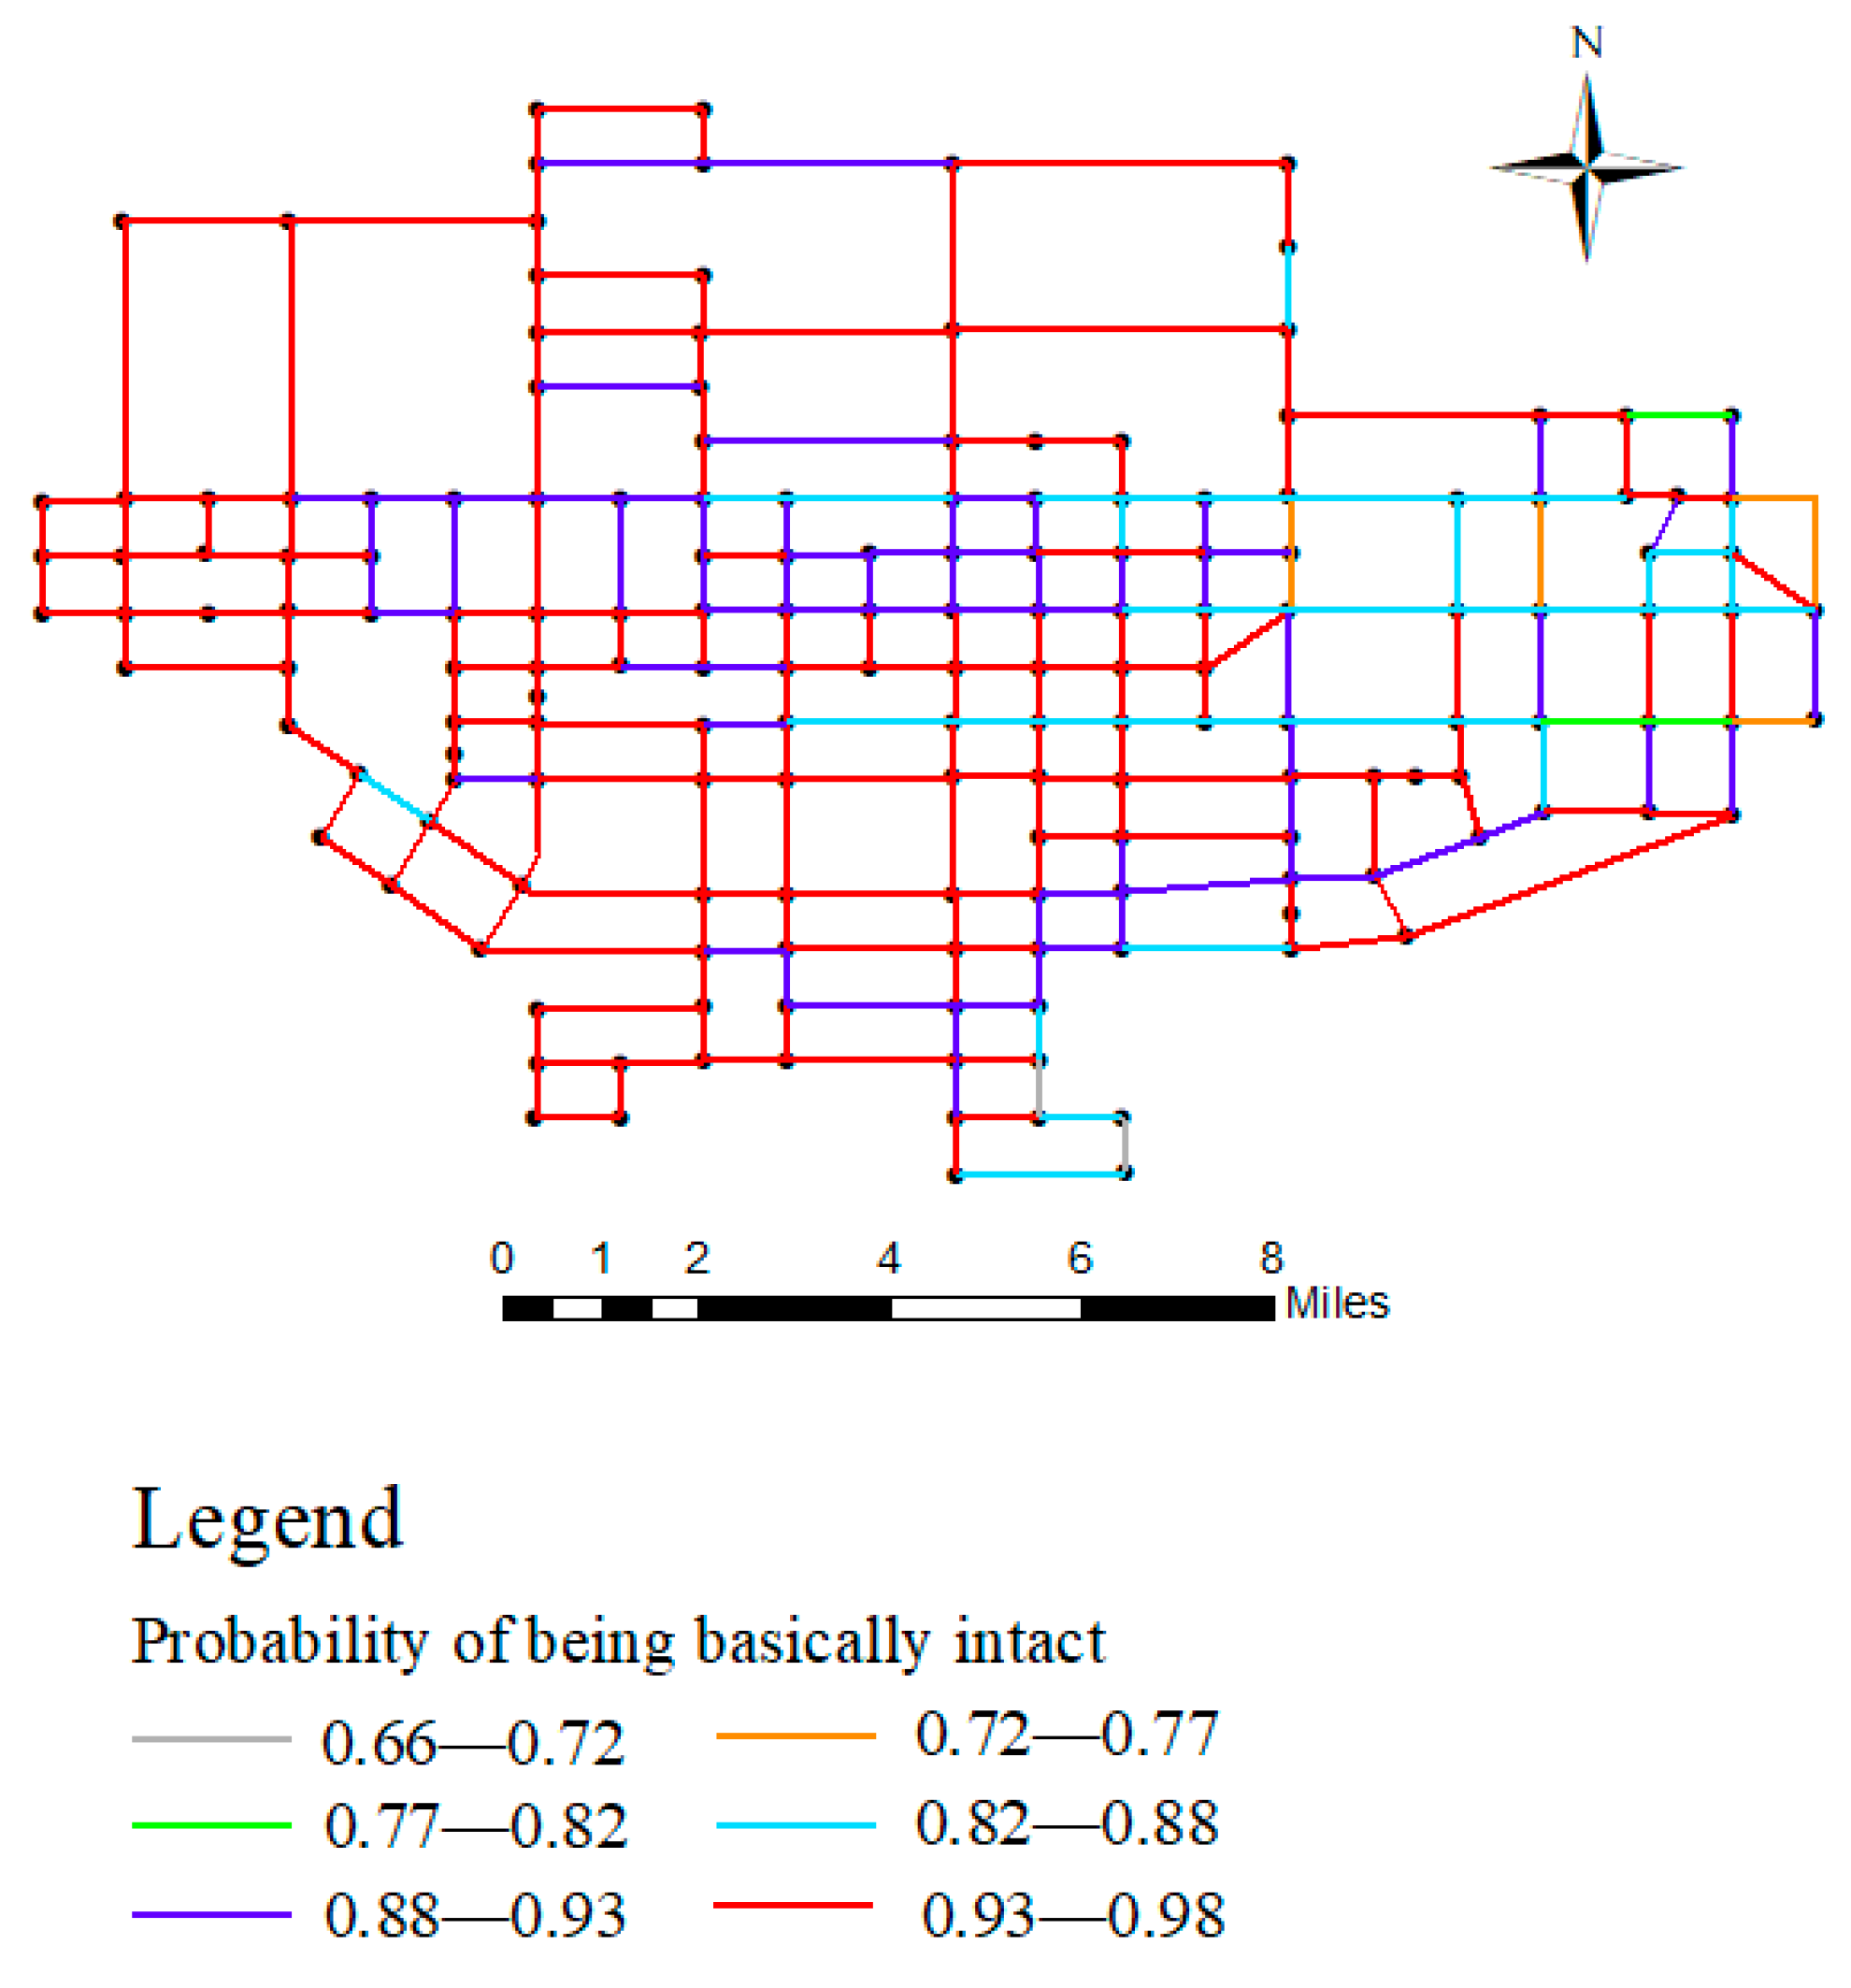
Based on the aforementioned analysis of the peak ground shaking acceleration in Xi’an, the peak acceleration in the WDN area is determined to range from 0.41 g to 0.68 g. The probability of each damage state of the water supply pipelines in Xi’an is calculated using the seismic vulnerability analysis method described in Section 3.2, as illustrated in Figure 7. The probability of basic integrity of the pipelines ranges from 0.66 to 0.98 (see Figure 8), while the probability of pipeline damage ranges from 0.02 to 0.34 (see Figure 9). Given that the pipes in the Xi’an WDN consist of polyethylene pipes, steel pipes, and ductile iron pipes, their earthquake resistance is robust, resulting in a generally low failure probability. Furthermore, as the epicenter of the Huaxian earthquake was located on the eastern side of the study area, the pipelines in this region experienced a higher intensity of ground shaking and an increased probability of damage.

4.3. Seismic Resilience Improvement Strategy

In the seismic resilience assessment of the WDN, the minimum design water pressure and the reference water pressure at all nodes are set at 5 m and 20 m, respectively. The head loss in the pipeline is calculated using the Hazen–Williams formula, employing a Newton–Raphson iteration accuracy of 0.0001. The roughness coefficients for all pipelines are uniformly set at 100. There are four emergency repair crews available. The time required for a complete pipe repair crew to repair a leaky pipe follows a normal distribution, with a mean of 6 h and a variance of 3 h, and the time needed to repair a broken pipe follows a normal distribution, with a mean of 12 h and a variance of 6 h [55]. The costs associated with pipeline repair are calculated in accordance with the China national standard GB/T 18208.4-2011 [56], which includes direct costs such as mechanical costs, road-breaking costs, material costs, and labor costs. The weighting coefficients α1, α2, and α3 are all set to 1/3. The algorithm parameters are configured as follows: population size = 100, maximum generations = 400, selection rate = 0.7, crossover probability = 0.9, and mutation probability = 0.05. Additionally, an elitism preservation strategy is adopted to accelerate convergence. The search terminates when the relative error between the maximum fitness values of the population remains below 1 × 10⁻⁶ over 50 consecutive generations, indicating that a near-optimal solution has been found. The repair control time is set at 84 h, and the number N of MCS is established at 5000.
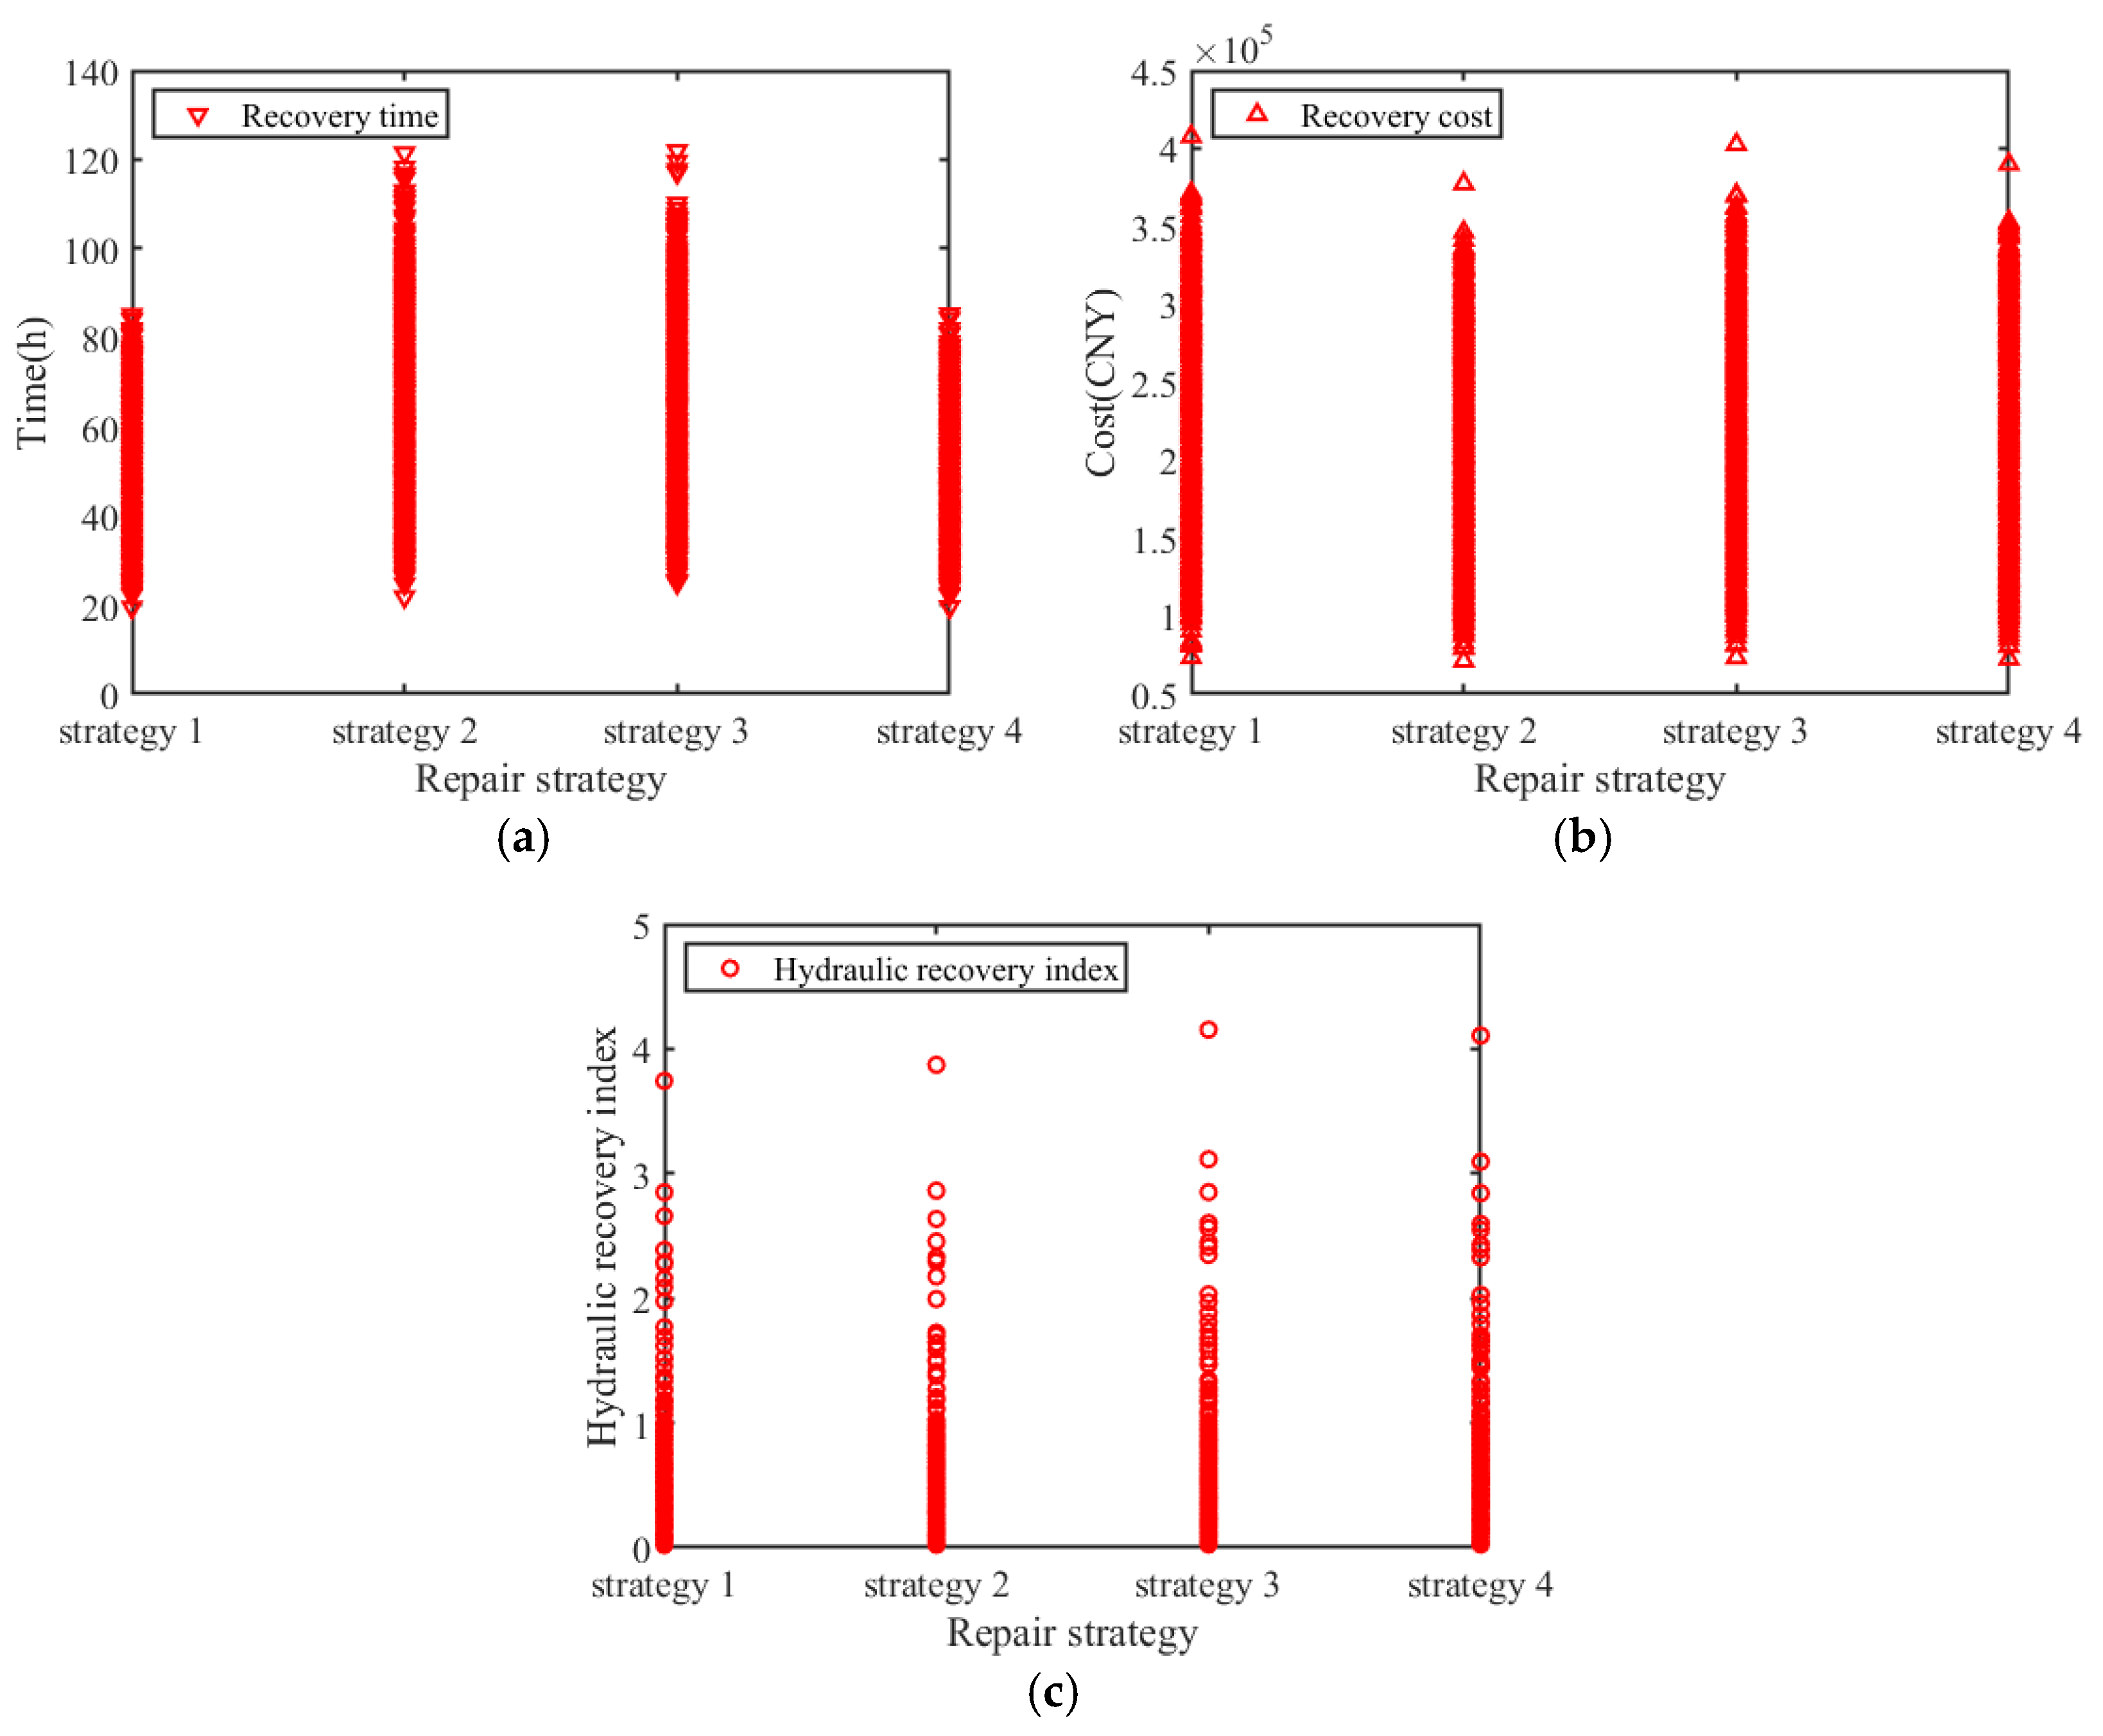
Figure 10 illustrates the hydraulic recovery index, repair cost, and repair time associated with four repair sequences: the optimal repair time maintenance sequence (strategy 1), the optimal repair cost maintenance sequence (strategy 2), the optimal hydraulic recovery index maintenance sequence (strategy 3), and the multi-objective optimal maintenance sequence (strategy 4). The results indicate that due to the varying damage scenarios of pipelines in each simulation, the maintenance time, maintenance cost, and hydraulic recovery index produced by the four repair strategies exhibit significant fluctuations. The average values derived from the 5000 simulations are presented in Table 1. Table 1 indicates that strategy 1 requires the shortest repair time, totaling 48.85 h, whereas strategies 2, 3, and 4 require 125.6%, 122.3%, and 100.4% of the time utilized by strategy 1, respectively. Strategy 2 incurs the lowest repair cost, amounting to CNY 201,418.49. The repair costs associated with strategies 1, 3, and 4 are 107.0%, 106.6%, and 102.9% of the cost incurred by strategy 2, respectively. Strategy 3 is associated with the highest hydraulic recovery index, recorded at 0.3973. The hydraulic recovery indices for strategies 1, 2, and 4 are 90.6%, 91.2%, and 99.4% of that of strategy 3, respectively. Although the multi-objective restoration strategy does not achieve the optimal repair cost, repair time, or hydraulic recovery index, it yields the most favorable overall result, enabling a higher hydraulic recovery index to be attained with reduced repair time and cost.
The scheduling order of repair crews and the repair order of damaged pipelines for four repair methods in a pipeline damage scenario are presented in Table 2. In this earthquake scenario, a total of 24 pipelines were damaged; specifically, pipelines 30, 181, and 192 experienced bursts, while the remaining pipelines sustained leakage damage. Each emergency repair team is assigned tasks to repair six pipelines, i.e., with 6 repair steps, and carries out the repairs sequentially according to the established repair sequence. For example, in strategy 4, repair crew 1 is assigned the task of sequentially repairing six water pipelines numbered 17, 10, 228, 256, 58, and 204. As revealed in Table 2, the repair tasks and repair sequences assigned to repair crews vary significantly across different optimization methods. Figure 11 illustrates the repair completion time for each damaged pipeline across the four maintenance methods. Although strategy 1 prioritizes repairing all damaged pipelines, the functional restoration of the WDN is only marginally improved with each repair. Strategies 3 and 4 can rapidly restore the functionality of the WDN in the initial stages of repair; however, strategy 4 accomplishes this in a shorter time frame. The seismic resilience of the WDN repaired using strategies 1 to 4 is 0.9163, 0.9188, 0.9396, and 0.9422, respectively, with strategy 4 demonstrating the highest seismic resilience. However, the simulation results do not accurately or comprehensively indicate which repair method is most effective in enhancing the earthquake resilience of the WDN, necessitating additional data samples for thorough analysis.
The seismic resilience values for the WDN across each simulation for the four strategies are illustrated in Figure 12, while the average resilience values are depicted in Figure 13. Figure 13 indicates that when strategies 1, 2, 3, and 4 are employed to repair the WDN, the corresponding system resilience values are 0.8876, 0.8917, 0.9293, and 0.9274, respectively. Strategy 3 achieved the highest system resilience, with the resilience values of strategies 1, 2, and 4 being 4.49%, 4.05%, and 0.20% lower than that of strategy 3, respectively. In comparison to strategy 1, strategy 4 requires an additional 0.18 h but reduces costs by CNY 8265.3, improving the seismic resilience of the WDN by 4.5%. And compared to strategy 2, strategy 4 increases costs by 2.9% while saving 12.3 h and enhancing the seismic resilience of the WDN by 4.0%. Although the average resilience value for strategy 4 is 0.2% lower than that of strategy 3, in 2 out of 5 simulation instances during the 5000 repair processes, the resilience value achieved by strategy 4 exceeded that of strategy 3. Furthermore, the average time and cost associated with strategy 4 are 10.7 h and CNY 7375.8 lower than those of strategy 3, respectively. Overall, the multi-objective resilience improvement strategy enhances the seismic resilience of the WDN while concurrently reducing maintenance time and costs.

5. Discussion

5.1. Discussion of Uncertainty

In the multi-objective simulation for seismic resilience assessment of the WDN, the post-earthquake seismic performance of the WDN exhibits uncertainty due to the random generation of pipeline damages based on their damage probabilities. The number of damaged pipelines in each simulation is variable, and the occurrence of leaking and bursting pipelines varies. After 5000 simulations, the seismic performance of the WDN ranged from a minimum of 0.13 to a maximum of 0.96. Since the repair time for leaking and burst pipelines post-earthquake is determined using random numbers following a normal distribution, the time required for pipeline repairs is uncertain. In 5000 simulations, the repair time post-earthquake ranged from a minimum of 19.52 h to a maximum of 84.13 h. Although the repair sequence for damaged pipelines post-earthquake is optimized using a genetic algorithm, the specific repair sequence in each simulation remained uncertain, leading to uncertainty in the final evaluated seismic resilience of the WDN. Across 5000 simulations, the seismic resilience values ranged from 0.66 to 0.99. It can be seen that in the seismic resilience assessment of the WDN, uncertainties exist in pipeline damage, the network’s overall seismic performance, and the post-earthquake repair times, leading to significant variability in the seismic resilience assessment results across simulations. Therefore, characterizing the seismic resilience of the WDN using the average resilience value from multiple Monte Carlo simulations is more reasonable, as it accounts for the uncertainties inherent in the seismic resilience assessment process.

5.2. Discussion of Resilience Enhancement Effects

After an earthquake, damaged pipelines are typically discovered at varying times. In the actual repair process, damaged pipelines detected first are usually repaired earliest, resulting in a randomly determined repair sequence. Thus, a randomized approach is employed to generate the repair sequence for damaged pipelines and calculate the seismic resilience value of the WDN under this randomized repair sequence. This is then compared with the seismic resilience value of the WDN under a repair sequence derived from multi-objective optimization to evaluate the effectiveness of resilience enhancement. Based on 3000 simulations, the results indicate that the average pipe network resilience under a randomized repair sequence was 0.8836, with corresponding average values of 0.354 for the hydraulic recovery index, 62.02 h for repair time, and CNY 217,266.56 for repair cost. In contrast, the multi-objective-based repair method proposed in this study achieved an average pipe network resilience of 0.9255, with corresponding average values of 0.389 for the hydraulic recovery index, 49.50 for repair time, and CNY 209,099.09 for repair cost. Comparatively, the analysis reveals that the multi-objective assessment method proposed in this study improves resilience by 9.89%, while the hydraulic recovery index, repair time, and repair cost are enhanced by 10%, 20.18%, and 3.76%, respectively. Overall, the multi-objective method proposed in this study significantly outperforms the conventional approach based on a randomized repair sequence in terms of seismic resilience, hydraulic performance, repair time, and cost efficiency of the WDN.

6. Conclusions

This article presents a multi-objective method for enhancing seismic resilience of the WDN, which comprehensively considers the hydraulic recovery index, maintenance time, and maintenance cost. This method significantly enhances the seismic resilience of the WDN while concurrently shortening maintenance time and reducing associated costs. The developed resilience enhancement strategy analysis platform can provide technical support for urban WDN managers.
(1)
The seismic resilience of the WDN varies significantly across different pipe network failure scenarios. This study employs a random simulation method to account for various uncertainties, including the number of damaged pipelines, types of damage, maintenance time, and repair sequences. In contrast to traditional deterministic methods, the results of this analysis are more accurate and comprehensive.
(2)
Given that the water supply pipeline materials in Xi’an City primarily consist of steel pipes, polyethylene pipes, and ductile iron pipes, each of which has good seismic performance, the number of pipeline damages is minimal under the earthquake scenarios defined in this study. The seismic resilience of the WDN exceeds 0.88 across all four repair strategies, indicating a generally favorable overall resilience.
(3)
The seismic resilience improvement method that utilizes the hydraulic recovery index attains the highest average seismic resilience for the WDN. In contrast, while the multi-objective seismic resilience improvement method results in a 0.2% decrease in the average seismic resilience effect of the WDN, it simultaneously reduces the average maintenance time by 10.7 h and saves maintenance costs amounting to CNY 7375.8. Furthermore, in comparison to the conventional random repair approach for damaged pipelines, the multi-objective-based repair method proposed in this study demonstrates superior performance in enhancing seismic resilience, improving hydraulic recovery index, reducing repair costs, and minimizing repair time.
Although this paper has established a multi-objective framework for seismic resilience assessment and enhancement of WDNs, there are still some limitations in certain aspects. For example, although the ground motion prediction equations have considered the different intensities of seismic motions experienced by different pipelines, further consideration can be given to the uncertainties of seismic motions themselves, their spatial variability, and the uncertainties in the regression analysis of the ground motion prediction equations. In the post-earthquake repair phase, the varying numbers of repair teams that different cities may have in reserve and the differences in their work efficiency should be taken into account. Additionally, the travel time between different repair locations should also be considered, especially for large-scale WDNs. When the urban road network data are complete, the travel time can be represented by the ratio of the shortest travel distance between failure points to the post-earthquake relocation speed. In the multi-objective optimization phase, further comparisons with other optimization algorithms can be made to enrich the optimization methods and provide more choices for urban emergency rescue decision-makers. Urban emergency rescue decision-makers can refer to the case applications in this paper and conduct WDN repair crews scheduling based on the seismic hazard, the number of emergency crews in reserve, and their work efficiency in their own cities to enhance seismic resilience.

Author Contributions

Conceptualization, L.L.; Methodology, L.L. and H.Y.; Software, L.L.; Validation, L.L., Y.Y. and F.L.; Formal analysis, Z.P., Y.Y. and F.L.; Investigation, Z.P. and Y.Y.; Resources, Z.P., H.Y. and Y.Y.; Data curation, Y.Y.; Writing—original draft, L.L.; Writing—review & editing, L.L.; Visualization, Z.P. and F.L.; Supervision, H.Y.; Project administration, H.Y.; Funding acquisition, H.Y. All authors have read and agreed to the published version of the manuscript.

Funding

The research described in this paper is carried out with funding by the Chengdu University New Faculty Start-up Funding (No. 2081923062) and Sichuan Science and Technology Program (2025ZNSFSC1315).

Data Availability Statement

The original contributions presented in this study are included in the article. Further inquiries can be directed to the corresponding author.

Conflicts of Interest

Author Yong Yang is employed by the Northwest Research Institute of Engineering Investigation and Design. The remaining authors declare that the research was conducted in the absence of any commercial or financial relationships that could be construed as a potential conflict of interest.

References

  1. Klise, K.A.; Bynum, M.; Moriarty, D.; Murray, R. A software framework for assessing the resilience of drinking water systems to disasters with an example earthquake case study. Environ. Model. Softw. 2017, 95, 420–431. [Google Scholar] [CrossRef] [PubMed]
  2. Bruneau, M.; Chang, S.E.; Eguchi, R.T.; Lee, G.C.; O’Rourke, T.D.; Reinhorn, A.M.; Shinozuka, M.; Tierney, K.; Wallace, W.A.; Von Winterfeldt, D. A framework to quantitatively assess and enhance the seismic resilience of communities. Earthq. Spectra 2003, 19, 733–752. [Google Scholar] [CrossRef]
  3. Cimellaro, G.P.; Reinhorn, A.M.; Bruneau, M. Framework for analytical quantification of disaster resilience. Eng. Struct. 2010, 32, 3639–3649. [Google Scholar] [CrossRef]
  4. Ouyang, M.; Dueñas-Osorio, L.; Min, X. A three-stage resilience analysis framework for urban infrastructure systems. Struct. Saf. 2012, 36, 23–31. [Google Scholar] [CrossRef]
  5. Reed, D.A.; Kapur, K.C.; Christie, R.D. Methodology for assessing the resilience of networked infrastructure. IEEE Syst. J. 2009, 3, 174–180. [Google Scholar] [CrossRef]
  6. Zobel, C.W. Quantitatively representing nonlinear disaster recovery. Decis. Sci. 2014, 45, 1053–1082. [Google Scholar] [CrossRef]
  7. Ayyub, B.M. Systems resilience for multihazard environments: Definition, metrics, and valuation for decision making. Risk Anal. 2014, 34, 340–355. [Google Scholar] [CrossRef]
  8. Munoz, A.; Dunbar, M. On the quantification of operational supply chain resilience. Int. J. Prod. Res. 2015, 53, 6736–6751. [Google Scholar] [CrossRef]
  9. Nan, C.; Sansavini, G. A quantitative method for assessing resilience of interdependent infrastructures. Reliab. Eng. Syst. Saf. 2017, 157, 35–53. [Google Scholar] [CrossRef]
  10. Tran, H.T.; Balchanos, M.; Domercant, J.C.; Mavris, D.N. A framework for the quantitative assessment of performance-based system resilience. Reliab. Eng. Syst. Saf. 2017, 158, 73–84. [Google Scholar] [CrossRef]
  11. Qi, Q.; Shao, C.; Yang, H.; Cui, H.; Chen, Z.; Gong, W. Axial-flexure-shear model for seismic analysis of RC thin-walled hollow piers. Soil Dyn. Earthq. Eng. 2025, 195, 109375. [Google Scholar] [CrossRef]
  12. Esposito, S.; Giovinazzi, S.; Elefante, L.; Iervolino, I. Performance of the L’Aquila (central Italy) gas distribution network in the 2009 (Mw 6.3) earthquake. Bull. Earthq. Eng. 2013, 11, 2447–2466. [Google Scholar] [CrossRef]
  13. Kircher, C.A.; Whitman, R.V.; Holmes, W.T. HAZUS earthquake loss estimation methods. Nat. Hazards Rev. 2006, 7, 45–59. [Google Scholar] [CrossRef]
  14. Yazdani, A.; Otoo, R.A.; Jeffrey, P. Resilience enhancing expansion strategies for water distribution systems: A network theory approach. Environ. Model. Softw. 2011, 26, 1574–1582. [Google Scholar] [CrossRef]
  15. Ouyang, M.; Yu, M.H.; Huang, X.Z.; Luan, E.J. Emergency response to disaster-struck scale-free network with redundant systems. Phys. A Stat. Mech. Its Appl. 2008, 387, 4683–4691. [Google Scholar] [CrossRef]
  16. Pahwa, S.; Hodges, A.; Scoglio, C.; Wood, S. Topological analysis of the power grid and mitigation strategies against cascading failures. In Proceedings of the 2010 IEEE International Systems Conference, San Diego, CA, USA, 5 April 2010; pp. 272–276. [Google Scholar]
  17. Lorenz, I.S.; Pelz, P.F. Optimal resilience enhancement of water distribution systems. Water 2020, 12, 2602. [Google Scholar] [CrossRef]
  18. Zhao, X.; Chen, Z.; Gong, H. Effects comparison of different resilience enhancing strategies for municipal water distribution network: A multidimensional approach. Math. Probl. Eng. 2015, 2015, 438063. [Google Scholar] [CrossRef]
  19. Shi, P. Seismic Response Modeling of Water Supply Systems. Ph.D. Dissertation, Cornell University, Ithaca, NY, USA, 2006. [Google Scholar]
  20. Li, W.; Mazumder, R.K.; Li, Y. Topology-based resilience metrics for seismic performance evaluation and recovery analysis of water distribution systems. J. Pipeline Syst. Eng. Pract. 2023, 14, 04022070. [Google Scholar] [CrossRef]
  21. Long, L.; Yang, H.; Zheng, S.; Cai, Y. Seismic Resilience Evaluation of Urban Multi-Age Water Distribution Systems Considering Soil Corrosive Environments. Sustainability 2024, 16, 5126. [Google Scholar] [CrossRef]
  22. Han, Z.; Ma, D.; Hou, B.; Wang, W. Seismic resilience enhancement of urban water distribution system using restoration priority of pipeline damages. Sustainability 2020, 12, 914. [Google Scholar] [CrossRef]
  23. Afandizadeh, S.; Jahangiri, A.; Kalantari, N. Determination of the optimal network configuration for emergency evacuation by simulated annealing algorithm. Nat. Hazards 2013, 69, 1315–1335. [Google Scholar] [CrossRef]
  24. Liu, W.; Song, Z.; Ouyang, M.; Li, J. Recovery-based seismic resilience enhancement strategies of water distribution networks. Reliab. Eng. Syst. Saf. 2020, 203, 107088. [Google Scholar] [CrossRef]
  25. Song, Z.; Liu, W.; Shu, S. Resilience-based post-earthquake recovery optimization of water distribution networks. Int. J. Disaster Risk Reduct. 2022, 74, 102934. [Google Scholar] [CrossRef]
  26. Liu, W.; Wu, Q.X. Seismic resilience analysis of water distribution networks with multi-components and resilience improvement strategies. J. Seismol. Res. 2023, 46, 271–279. [Google Scholar]
  27. Mazumder, R.K.; Salman, A.M.; Li, Y. Post-disaster sequential recovery planning for water distribution systems using topological and hydraulic metrics. Struct. Infrastruct. Eng. 2022, 18, 728–743. [Google Scholar] [CrossRef]
  28. Alfonso, L.; Jonoski, A.; Solomatine, D. Multiobjective optimization of operational responses for contaminant flushing in water distribution networks. J. Water Resour. Plan. Manag. 2010, 136, 48–58. [Google Scholar] [CrossRef]
  29. Osman, H.; Ammar, M.; El-Said, M. Optimal scheduling of water network repair crews considering multiple objectives. J. Civ. Eng. Manag. 2017, 23, 28–36. [Google Scholar] [CrossRef]
  30. Assad, A.; Moselhi, O.; Zayed, T. Resilience-driven multiobjective restoration planning for water distribution networks. J. Perform. Constr. Facil. 2020, 34, 04020072. [Google Scholar] [CrossRef]
  31. Long, L.; Zheng, S.S.; Yang, Y.; Zhou, Y. Research on the recovery strategy of the urban water supply networks after an earthquake. J. Seismol. Res. 2022, 45, 352–361. [Google Scholar]
  32. Haghighi, M.; Delnavaz, A.; Safehian, M.; Delnavaz, M. Strategic Management and Seismic Resilience Enhancement of Water Distribution Network Using Artificial Neural Network Model. J. Pipeline Syst. Eng. Pract. 2025, 16, 04024053. [Google Scholar] [CrossRef]
  33. Pudasaini, B.; Shahandashti, S.M. Seismic resilience enhancement of water pipe networks using hybrid metaheuristic optimization. In Planning and Design, Proceedings of Lifelines 2020 Conference, San Antonio, Texas, 9–12 August 2020; Pulido, J.F., Poppe, M., Eds.; American Society of Civil Engineers: Reston, VA, USA, 2020; pp. 428–436. [Google Scholar]
  34. Zong, C.; Ji, K.; Wen, R.; Bi, X.; Ren, Y.; Zhang, X. Seismic resilient three-stage enhancement for gas distribution network using computational optimization algorithms. Soil Dyn. Earthq. Eng. 2022, 152, 107057. [Google Scholar] [CrossRef]
  35. Fan, X.; Yu, X. Resilience of Water Distribution Network: Enhanced Recovery Assisted by Artificial Intelligence (AI) Considering Dynamic Water Demand Change. In 1971 San Fernando Earthquake and Lifeline Infrastructure, Proceedings of Lifelines 2022 Conference, Online, 31 January—11 February 2022; Davis, C.A., Yu, K., Taciroglu, E., Eds.; American Society of Civil Engineers: Reston, VA, USA, 2022; pp. 880–891. [Google Scholar]
  36. Fan, X.; Zhang, X.; Yu, X. A graph convolution network-deep reinforcement learning model for resilient water distribution network repair decisions. Comput.-Aided Civ. Infrastruct. Eng. 2022, 37, 1547–1565. [Google Scholar] [CrossRef]
  37. Xie, L.L.; Ma, Y.H.; Zhai, C.H. Performance-Based Seismic Design and Design Ground Motion; Science Publishing Institute: Beijing, China, 2009. [Google Scholar]
  38. Panza, G.F.; Vaccari, F.; Cazzaro, R. Deterministic seismic hazard assessment. In Proceedings of the Vrancea Earthquakes: Tectonics, Hazard and Risk Mitigation: Contributions from the First International Workshop on Vrancea Earthquakes, Bucharest, Romania, 1–4 November 1997; Springer: Dordrecht, The Netherlands, 1999; pp. 269–286. [Google Scholar]
  39. Dai, K.; Bi, K.; Song, G.; Jiang, Z.; Yu, X. Evaluating the Seismic Risk of FRP Retrofitting Schemes for Corroded RC Frame Structures Based on Benefit-Cost Assessment. Earthq. Eng. Resil. 2025, 4, 97–115. [Google Scholar] [CrossRef]
  40. Cornell, C.A. Engineering seismic risk analysis. Bull. Seismol. Soc. Am. 1968, 58, 1583–1606. [Google Scholar] [CrossRef]
  41. Fan, W.; Du, W.; Wang, X.; Shao, H.; Wen, Y. Seismic motion attenuation relations in Shaanxi areas. Earthq. Eng. Eng. Dyn. 2011, 31, 47–54. [Google Scholar]
  42. Kassem, M.M.; Nazri, F.M.; Farsangi, E.N. The seismic vulnerability assessment methodologies: A state-of-the-art review. Ain Shams Eng. J. 2020, 11, 849–864. [Google Scholar] [CrossRef]
  43. Dai, K.Y.; Yu, X.H.; Lu, D.G.; Qian, K. Fragility functions for corroded reinforced concrete columns. J. Build. Eng. 2024, 82, 108124. [Google Scholar] [CrossRef]
  44. Isoyama, R.; Ishida, E.; Yune, K.; Shirozu, T. Seismic damage estimation procedure for water supply pipelines. Water Supply 2000, 18, 63–68. [Google Scholar]
  45. Chen, L.L.; Li, J. Aseismatic serviceability analysis of water supply network. Eng. Mech. 2004, 21, 45–50. [Google Scholar]
  46. Choi, J.; Kang, D. Improved hydraulic simulation of valve layout effects on post-earthquake restoration of a water distribution network. Sustainability 2020, 12, 3492. [Google Scholar] [CrossRef]
  47. Gupta, R.; Bhave, P.R. Comparison of methods for predicting deficient-network performance. J. Water Resour. Plan. Manag. 1996, 122, 214–217. [Google Scholar] [CrossRef]
  48. Mirjalili, S. Genetic algorithm. Evolutionary algorithms and neural networks. In Theory and Applications; Springer Nature: Berlin/Heidelberg, Germany, 2019; pp. 43–55. [Google Scholar]
  49. Mahadevan, S. Monte carlo simulation. In Mechanical Engineering; Marcel Dekker: New York, NY, USA; Basel, Switzerland, 1997; pp. 123–146. [Google Scholar]
  50. Surhone, L.M.; Timpledon, M.T.; Marseken, S.F. SharpDevelop; Betascript Publishing: Beau Bassin, Mauritius, 2010. [Google Scholar]
  51. Lam, H.; Thai, T.L. NET Framework Essentials, 3rd ed.; O’Reilly: Sebastopol, CA, USA, 2003. [Google Scholar]
  52. Pacurari, D.I. The Use of Oracle Spatial and ArcSDE for Geodatabase Access; West Virginia University Libraries: Morgantown, WV, USA, 2002. [Google Scholar]
  53. Chen, F.G. Research on Site Effect Based on Multiple Factors and Its Application. Master’s Thesis, Xi’an University of Architecture and Technology, Xi’an, China, 2020. [Google Scholar]
  54. GB 18306-2015; Seismic Ground Motion Parameters Zonation Map of China. China Standard Press: Beijing, China, 2015.
  55. FEMA. Multi-Hazard Loss Estimation Methodology, Earthquake Model (HAZUS-MHMR4). Washington, D.C. 2003. Available online: https://www.fema.gov/sites/default/files/2020-09/fema_hazus_flood-model_technical-manual_2.1.pdf (accessed on 4 January 2025).
  56. GB/T 18208.4-2011; Post-Earthquake Field Works-Part 4: Assessment of Direct Loss. Seismological Press: Beijing, China, 2011.
Figure 1. Resilience curve.
Symmetry 17 01105 g001
Figure 2. Chromosome encoding.
Symmetry 17 01105 g002
Figure 3. Analysis process for improving seismic resilience of the WDN based on stochastic simulation.
Symmetry 17 01105 g003
Figure 4. Layout map of Xi’an City WDN.
Symmetry 17 01105 g004
Figure 5. Seismic zoning outline map of Xi’an City.
Symmetry 17 01105 g005
Figure 6. Distribution map of peak ground acceleration in the Xi’an region resulting from the Huaxian earthquake.
Symmetry 17 01105 g006
Figure 7. Peak ground acceleration at the pipelines location.
Symmetry 17 01105 g007
Figure 8. Probability distribution diagram of pipelines being basically intact.
Symmetry 17 01105 g008
Figure 9. Probability distribution diagram of pipelines failure.
Symmetry 17 01105 g009
Figure 10. (a) Cost, (b) time, and (c) hydraulic recovery index associated with the four restoration strategies (5000 simulations).
Symmetry 17 01105 g010
Figure 11. Comparison of resilience curves of four repair methods.
Symmetry 17 01105 g011
Figure 12. Seismic resilience of the WDN under four restoration strategies.
Symmetry 17 01105 g012
Figure 13. Average values of seismic resilience of the WDN under four repair strategies.
Symmetry 17 01105 g013
Table 1. Average values of cost, time, and hydraulic recovery index associated with the four restoration strategies.
MethodsStrategy 1Strategy 2Strategy 3Strategy 4
Indicators
Time/h 48.849261.365059.733249.0257
Cost/CNY 215,526.53201,418.49214,637.07207,261.23
Hydraulic recovery index 0.35990.36240.39730.3950
Table 2. Dispatch order for emergency repair teams and pipeline repair sequence for various repair methods.
Optimization MethodsRepair CrewsPipelines Repair Sequence
Strategy 11Pipe 58➔99➔43➔67➔260➔171
2Pipe 256➔228➔92➔204➔17➔181
3Pipe 167➔169➔189➔30➔182➔274
4Pipe 192➔36➔49➔235➔53➔10
Strategy 21Pipe 274➔36➔204➔53➔30➔260
2Pipe 10➔43➔49➔99➔58➔235
3Pipe 182➔181➔167➔169➔92➔67
4Pipe 228➔189➔192➔256➔17➔171
Strategy 31Pipe 92➔17➔10➔235➔67➔169
2Pipe 189➔256➔49➔182➔171➔99
3Pipe 192➔167➔30➔43➔204➔53
4Pipe 228➔181➔36➔58➔274➔260
Strategy 41Pipe 17➔10➔228➔256➔58➔204
2Pipe 67➔189➔49➔171➔36➔53
3Pipe 192➔182➔274➔43➔260➔99
4Pipe 92➔181➔235➔167➔30➔169
Disclaimer/Publisher’s Note: The statements, opinions and data contained in all publications are solely those of the individual author(s) and contributor(s) and not of MDPI and/or the editor(s). MDPI and/or the editor(s) disclaim responsibility for any injury to people or property resulting from any ideas, methods, instructions or products referred to in the content.