Article

Symmetric Dual-Phase Framework for APT Attack Detection Based on Multi-Feature-Conditioned GAN and Graph Convolutional Network

1
School of Computer and Information Engineering, Tianjin Chengjian University, Tianjin 300384, China
2
Smart Education Research and Development Center, Open University, Tianjin 300191, China
*
Author to whom correspondence should be addressed.
Symmetry 2025, 17(7), 1026; https://doi.org/10.3390/sym17071026
Submission received: 27 May 2025 / Revised: 23 June 2025 / Accepted: 27 June 2025 / Published: 30 June 2025
(This article belongs to the Section Computer)

Abstract

Advanced persistent threat (APT) attacks present significant challenges to cybersecurity due to their covert nature, high complexity, and ability to operate across multiple temporal and spatial scales. Existing detection techniques often struggle with issues like class imbalance, insufficient feature extraction, and the inability to capture complex attack dependencies. To address these limitations, we propose a dual-phase framework for APT detection, combining multi-feature-conditioned generative adversarial networks (MF-CGANs) for data reconstruction and a multi-scale convolution and channel attention-enhanced graph convolutional network (MC-GCN) for improved attack detection. The MF-CGAN model generates minority-class samples to resolve the class imbalance problem, while MC-GCN leverages advanced feature extraction and graph convolution to better model the intricate relationships within network traffic data. Experimental results show that the proposed framework achieves significant improvements over baseline models. Specifically, MC-GCN outperforms traditional CNN-based IDS models, with accuracy, precision, recall, and F1-score improvements ranging from 0.47% to 13.41%. The MC-GCN model achieves an accuracy of 99.87%, surpassing CNN (86.46%) and GCN (99.24%), while also exhibiting high precision (99.87%) and recall (99.88%). These results highlight the proposed model’s superior ability to handle class imbalance and capture complex attack behaviors, establishing it as a leading approach for APT detection.

1. Introduction

1.1. Advanced Persistent Threat

Advanced persistent threat (APT) represents a highly sophisticated and meticulously orchestrated attack paradigm in modern cyberspace. These attacks are typically driven by clear motivations and specific targets, particularly focusing on national governments as well as core economic and commercial organizations [1,2]. APT leverages advanced malware and zero-day vulnerabilities to meticulously conceal attribution features and evade defensive measures. Through these advanced technical means, it aims to acquire sensitive information and disrupt digital infrastructures, thereby presenting significant technical challenges for defense and attribution. Research [3] has proposed a professional and clear definition of APT: advanced, persistent, and threatening. Furthermore, research [4] provides a comprehensive overview, encompassing its evolution, anatomy, attribution, and countermeasures. Distinct from conventional cyber threats, APT campaigns typically adhere to a multiphase lifecycle comprising: target reconnaissance, payload weaponization, delivery vectorization, foothold establishment, command-and-control (C2) infrastructure activation, lateral movement within networks, and ultimate objective realization. The detection of APTs typically involves analyzing complex network traffic data, which requires significant computational resources. In our approach, the computational overhead is minimized while maintaining detection accuracy. We have provided a detailed overview of the computational requirements, including training time and inference latency, in the Section 4. These figures highlight the significant computational demands of the model, which are primarily driven by the use of complex machine learning techniques such as multi-scale convolution and graph convolutional networks. Despite these challenges, the model remains efficient enough for practical deployment, balancing accuracy with real-time applicability.

1.2. Problem Statement

Currently, research on APT attack detection has achieved significant progress, with a variety of detection methods emerging. Study [5] summarizes the latest multilayered detection approaches, including network traffic analysis, host behavior monitoring, log auditing, machine learning and AI-driven detection technologies, as well as comprehensive detection solutions integrating threat intelligence. Among these, network traffic data constitutes the most critical raw data source [6], encapsulating comprehensive user behavioral patterns and anomalous activity signatures. The synergistic integration of ML and AI-driven detection with network traffic analysis techniques demonstrates particular efficacy in identifying and analyzing subtle anomalous behavioral patterns, thereby enabling effective detection and prediction of APT attacks.
Nevertheless, studies [7,8,9,10] reveal three persistent challenges confronting network traffic analysis-based APT detection:
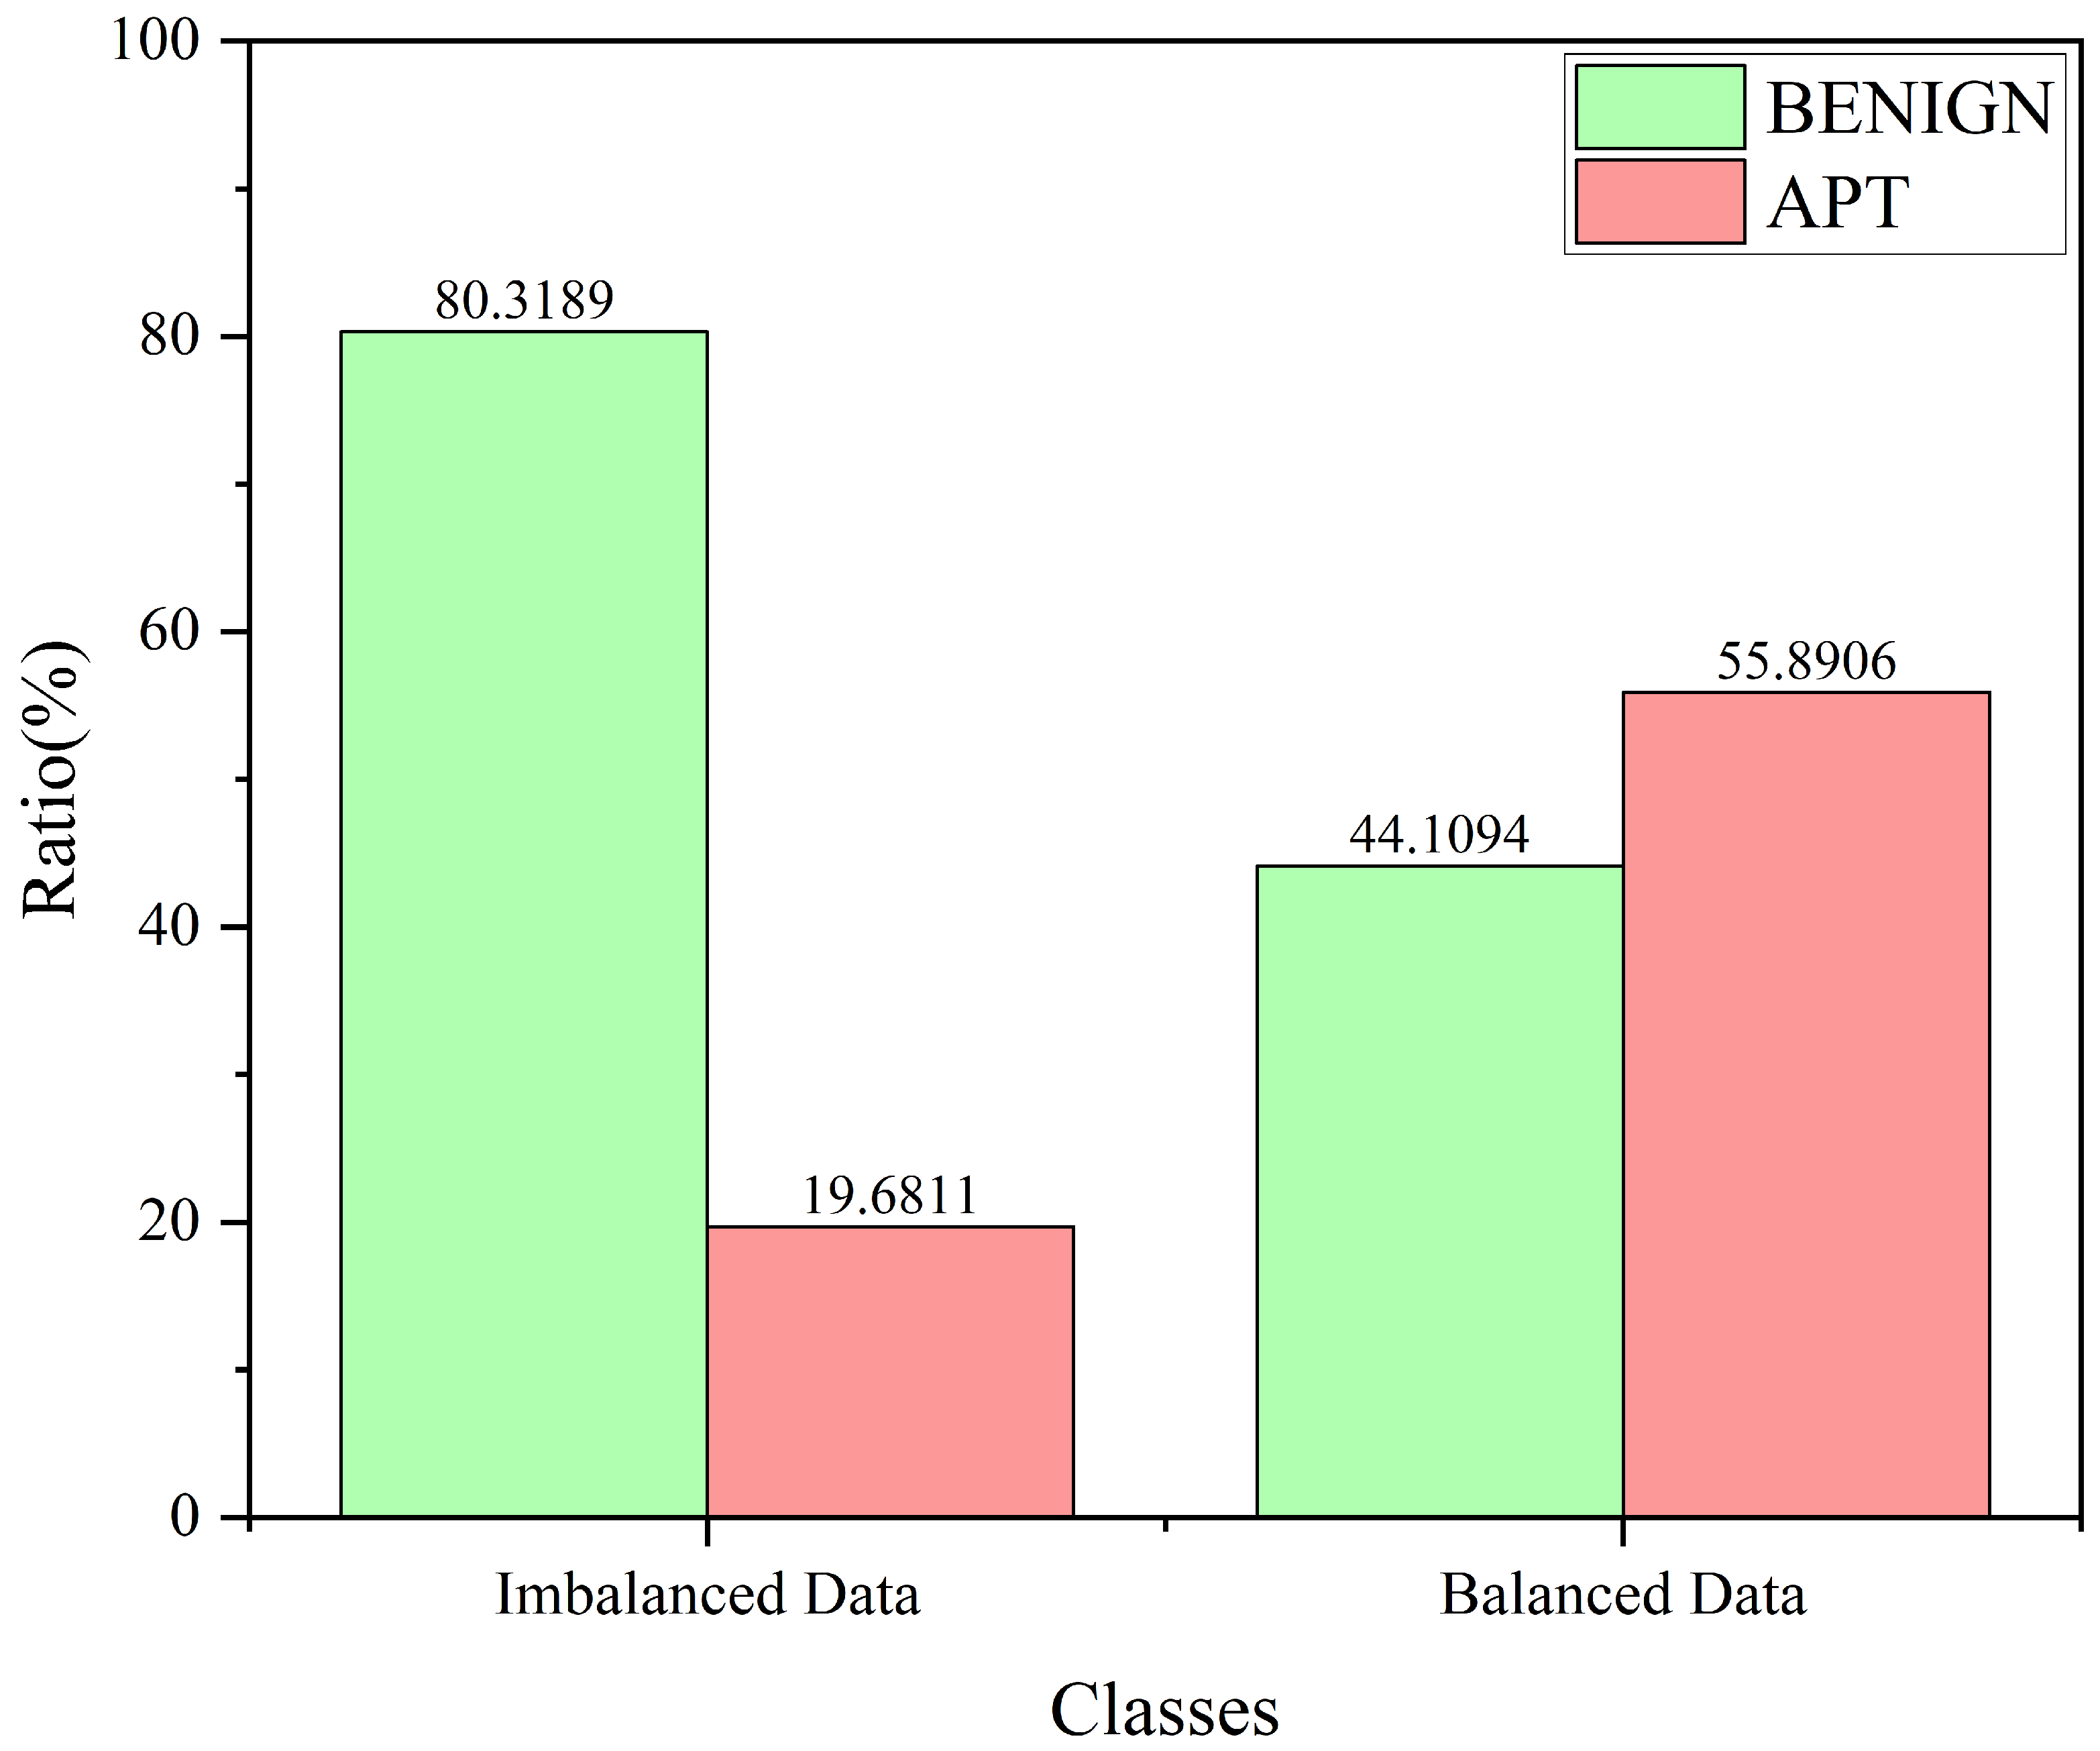
  • Class imbalance in datasets: Research indicates that class imbalance occurs when the prevalence of one class significantly exceeds that of another within a dataset. A critical pain point in detecting APT attacks lies in the overwhelming complexity of network traffic data, where attack-class traffic typically constitutes less than one-hundredth (or even lower proportions) of benign traffic volumes. This asymmetry severely skews classifiers towards majority classes, consequently diminishing the detection model’s sensitivity to APT attacks and impairing its capacity to identify latent attack threats. Deep learning models designed to uncover underlying APT attack patterns require both sufficient sample quantities and rationally distributed class structures to effectively learn discriminative features and generate accurate classifications. Consequently, substantial disparities in class distributions not only degrade the model’s detection performance metrics (e.g., precision–recall trade-offs) but also undermine its generalization capability when confronted with novel or mutated APT attack variants [7,8].
  • Limitations of non-intelligent feature extraction: APT attacks exhibit three intrinsic characteristics: high stealthiness, behavioral complexity, and prominent cross-spatiotemporal patterns. Their anomalous patterns manifest not only through multi-scale temporal distribution but also across multilayer network hierarchies, demonstrating highly dynamic inter-feature correlations. This has rendered the feature extraction process for APT detection more complex. Traditional detection methods primarily rely on static features, such as rule-based or signature-based identification techniques, which determine malicious behavior by matching known attack patterns. However, these methods exhibit limitations when dealing with APT attacks, particularly due to the highly dynamic nature of APT. Different stages of an APT attack may employ varying strategies and techniques, making it difficult for fixed static features to comprehensively cover the entire attack chain, thereby reducing detection effectiveness. Consequently, more intelligent and efficient feature extraction methods are required [9].
  • Graph representation learning: Malicious behaviors in APT attacks typically involve intricate interactions among multiple IP addresses and ports. Compared with conventional methods that merely analyze isolated data points, graph-structured detection approaches for APT attacks have demonstrated superior efficacy in capturing multi-hop attack dependencies. Nevertheless, constructing logically coherent and computationally efficient graph structures persists as a critical challenge in contemporary research. As a universal representation formalism, graphs provide systematic, high-level abstractions that capture complex relational patterns across network entities. This contrasts sharply with flat data structures, in which semantic fragmentation limits anomaly detection capabilities. The inherent topological properties of graphs (e.g., node centrality, community structures) enable richer semantic representations specifically tailored for APT detection scenarios. Therefore, the application of graph representation learning methods for network attack detection still necessitates certain innovations [10].

1.3. Solutions

1.3.1. Proposed Methodology

To address the challenges delineated in Section 1.2, this paper introduces an innovative framework for APT attack detection, comprising two synergistic components: a multi-feature-conditioned generative adversarial network (MF-CGAN) for data reconstruction and a multi-scale convolution and channel attention-enhanced graph convolutional network (MC-GCN) for attack detection. By integrating multi-scale convolution, channel attention mechanisms, and graph-based learning, the proposed solution achieves the following objectives:
Data reconstruction method based on feature engineering and conditional generative adversarial network (MF-CGAN model): This process comprises two meticulously designed stages:
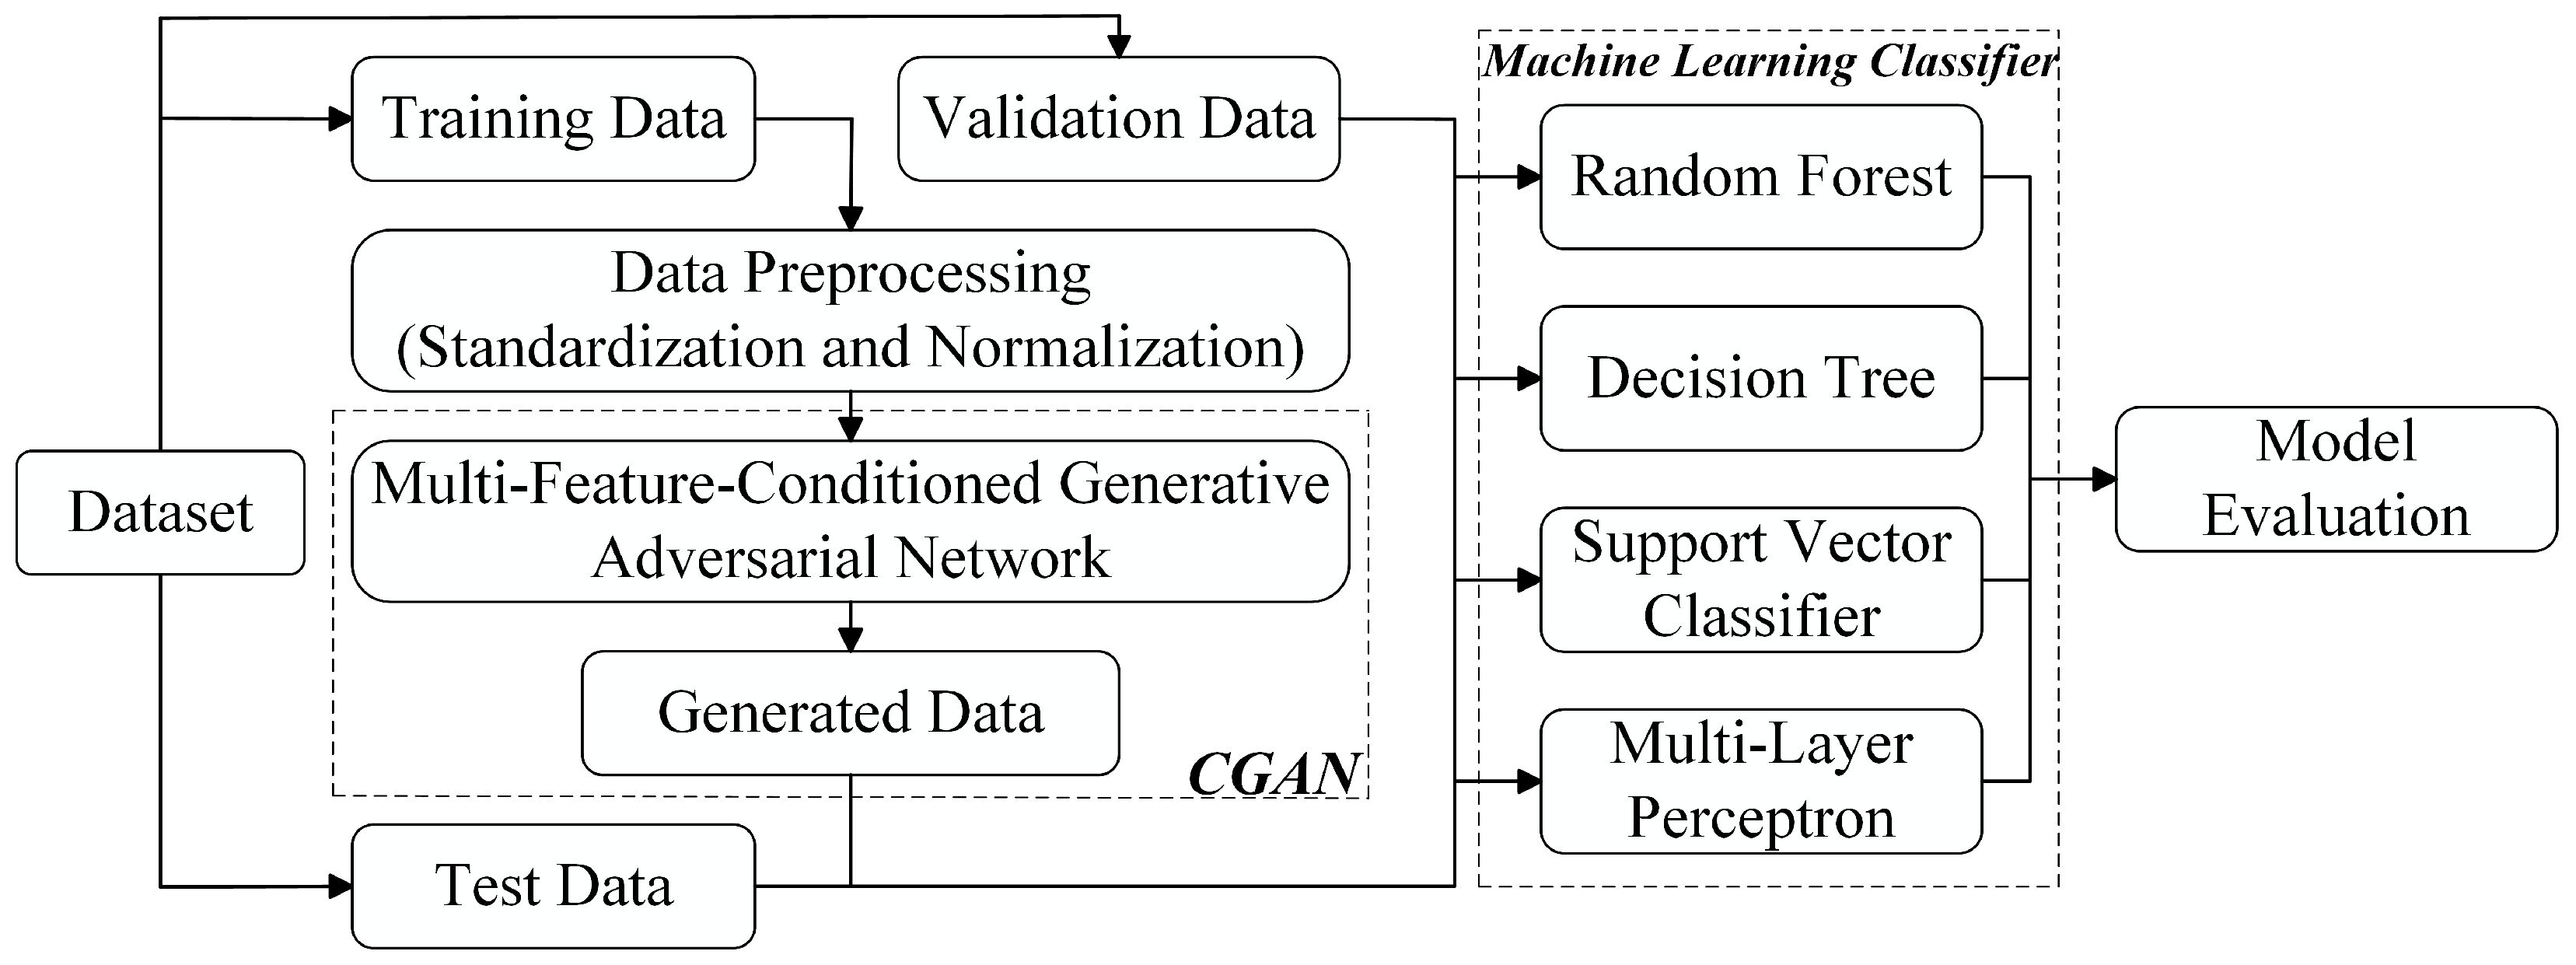
  • Phase 1: Perform feature cleansing and standardization on network traffic dataset features using feature engineering, followed by applying information gain techniques.
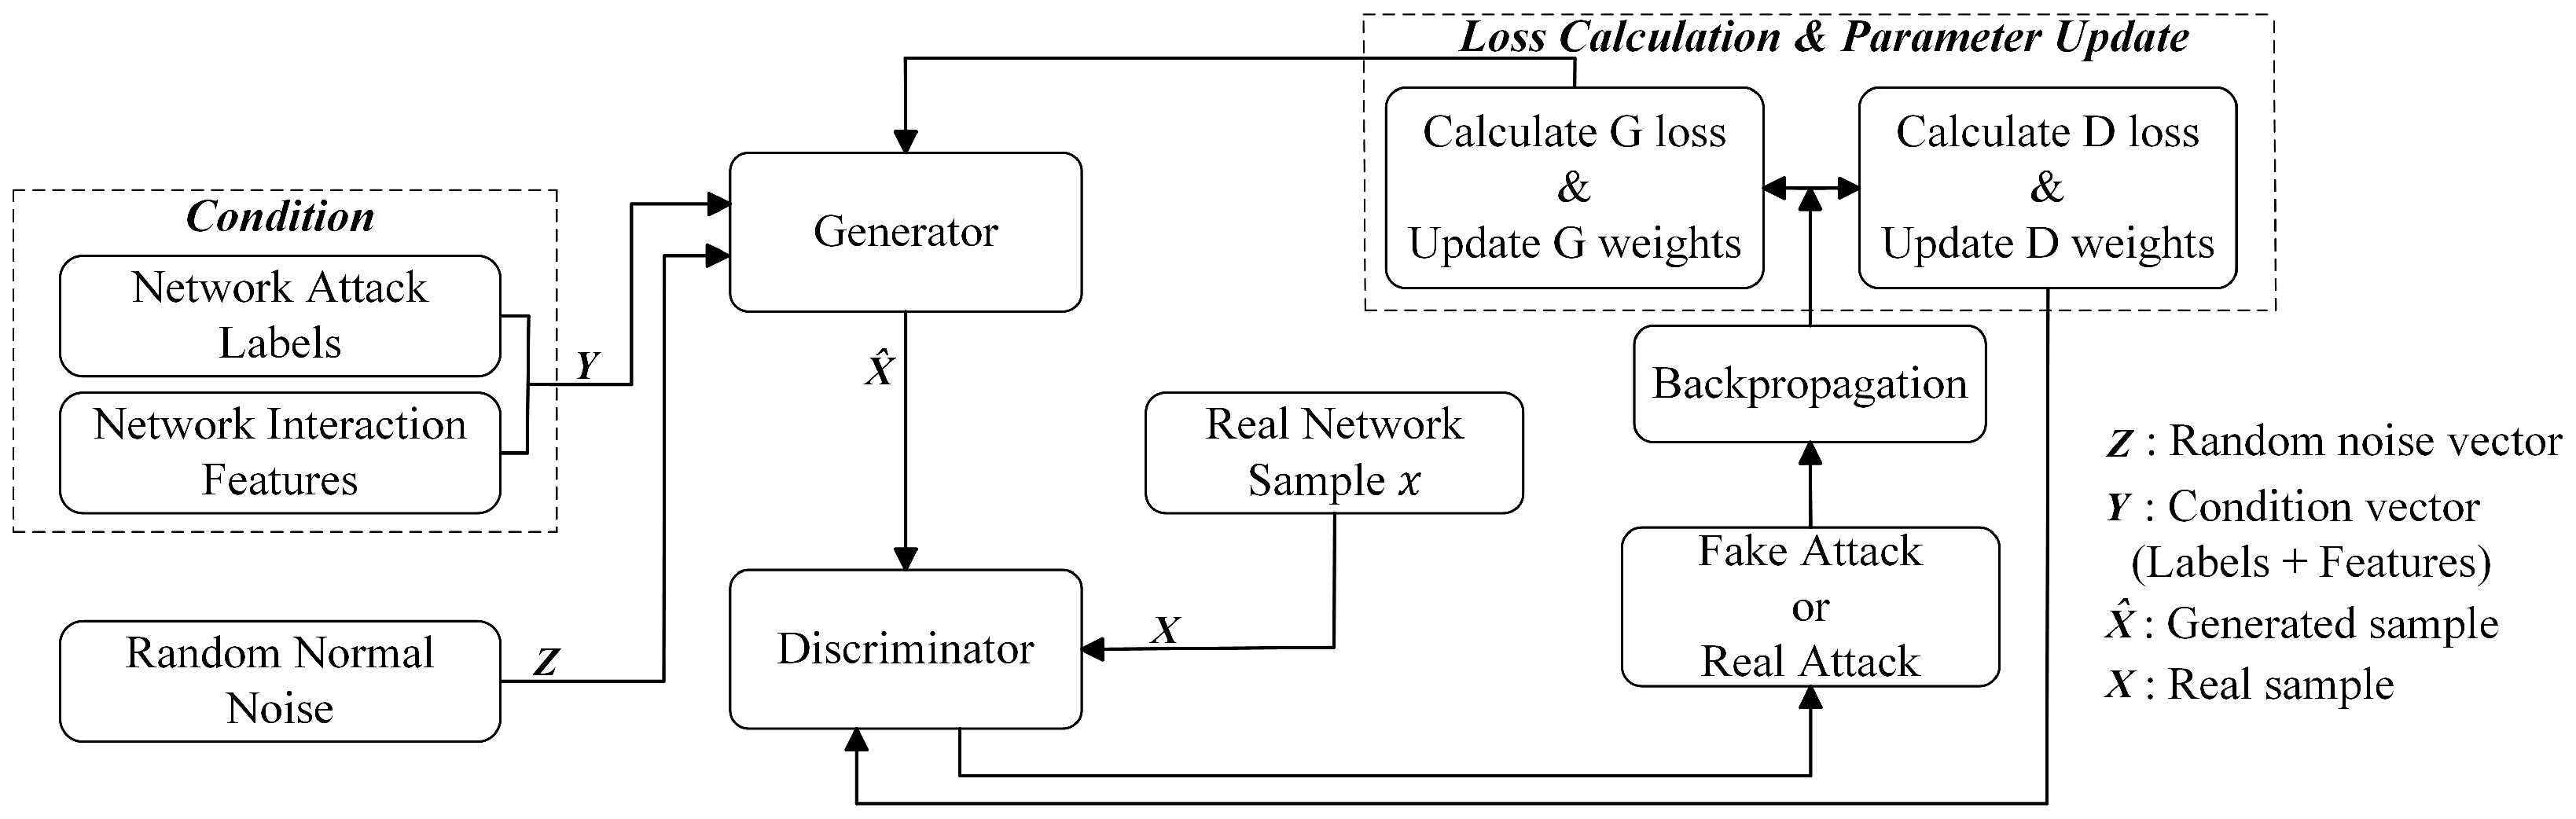
  • Phase 2: Propose a data generation model MF-CGAN. We enhance the conditional generative adversarial networks (CGANs) framework by incorporating conditional features that guide data generation, developing a multi-feature-conditioned generative adversarial network to generate minority-class samples for class imbalance mitigation.
Methodology based on feature enhancement techniques and graph neural networks (MC-GCN model): This process comprises two meticulously designed stages:
  • Phase 1: Leverage convolutional neural networks (CNNs)-based feature extraction with a multi-scale convolution strategy, deploying varying kernel sizes to holistically capture hierarchical data features. Subsequently, integrate a channel attention mechanism to prioritize pivotal feature representations, thereby significantly enhancing the model’s discriminative capacity for critical characteristics.
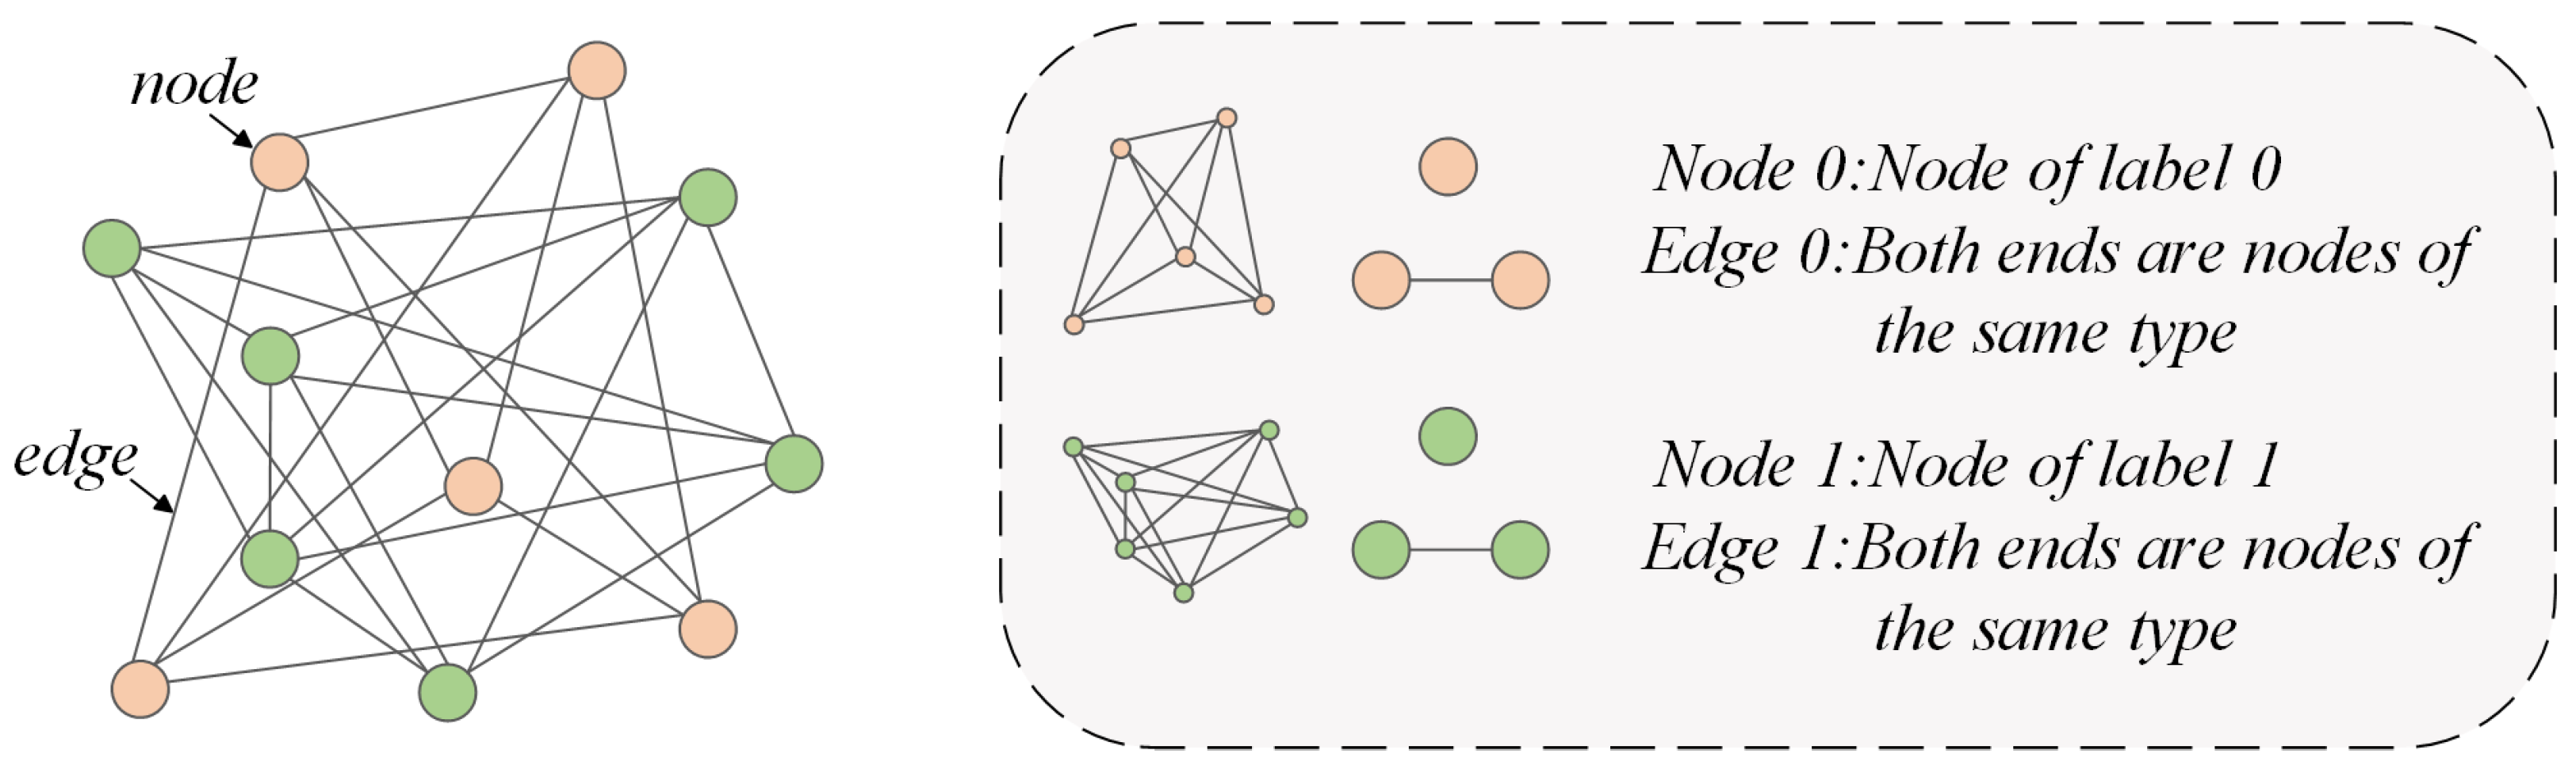
  • Phase 2: Construct graph structures by establishing edge connections to organize homogeneous nodes into local graphs, thereby achieving graph-based representation of data structures. The preliminary features extracted via CNN are transferred as augmented inputs to a graph convolutional network (GCN), enabling graph-structured feature fusion. The GCN leverages graph convolution operations to aggregate adjacent node features at the topological level, which facilitates high-throughput information propagation and deep reinforcement of node embeddings.

1.3.2. Scientific Basis of Solutions

In response to the issues raised in Section 1.2, this section presents specific scientific rationales for the proposed solutions to these problems:
The issue of class imbalance in datasets: This paper proposes a data reconstruction method integrating feature engineering and conditional generative adversarial networks. Specifically, in the preliminary phase of data reconstruction, critical features are extracted, selected, and transformed from the raw dataset. Through dimensionality reduction, discretization, and standardization of high-dimensional features, feature engineering enables noise reduction and enhances information density, thereby ensuring improved learnability for generative models. Furthermore, feature engineering effectively amplifies subtle patterns within the dataset that are otherwise challenging to capture, allowing the generative model to prioritize pivotal characteristics during data synthesis, which elevates the representativeness and quality of generated data. Subsequently, the enhanced CGAN model is employed for data generation and reconstruction post-feature engineering. As a variant of generative adversarial networks, CGAN introduces conditional variables to control class or feature distributions during generation, producing data samples that adhere to specified criteria. In our framework, the CGAN generator receives preprocessed feature inputs and synthesizes new data samples driven by noise distributions. The discriminator iteratively refines the generator’s output quality through adversarial training between real and synthetic data, progressively aligning the generated samples with the original data distribution. The synergistic integration of these methodologies preserves essential data characteristics while generating more diverse and higher-quality samples. This data augmentation and reconstruction strategy substantially mitigates data scarcity issues, restores class distribution symmetry, enhances model adaptability to complex data distributions, and provides robust support for improving real-world model performance.
The issue of limitations of non-intelligent feature extraction: In traditional network traffic analysis, non-intelligent feature extraction methods predominantly rely on domain expertise to manually design features for capturing critical patterns in data. This approach exhibits three fundamental limitations: limited adaptability, information loss, and high computational overhead. To address these challenges, leveraging the network traffic data provided in the preceding phase, this paper introduces systematic improvements and innovations to conventional CNN. Specifically, the model design incorporates multi-scale convolution and a channel attention mechanism. The multi-scale convolution enables adaptive aggregation of information across varying scales, thereby comprehensively capturing both normal patterns and anomalous behaviors in network traffic. The channel attention mechanism enhances the focus on critical features by assigning different weights to each channel, while simultaneously suppressing interference from irrelevant or redundant features. In the context of network traffic data, the channel attention mechanism enables the model to more effectively identify feature channels associated with anomalous behaviors, thereby improving detection accuracy. By integrating multi-scale convolution and the channel attention mechanism to refine CNN, the limitations of traditional feature extraction methods are overcome, allowing the model to demonstrate significant advantages in automated feature learning and anomaly detection. This innovative approach delivers a more robust and intelligent solution for network traffic analysis and anomaly detection.
The issue of graph representation learning: This study introduces an advanced graph representation learning framework for detecting APT attacks, which employs a GCN architecture. The framework initiates by constructing a graph structure where nodes correspond to preprocessed network traffic frames and edges encode bidirectional communication relationships between nodes. Nodes exhibiting homogeneous behavioral or protocol-based attributes are interconnected to form local subgraphs, thereby embedding domain-specific structural priors into the graph topology. Node features are hierarchically refined through stacked graph convolutional layers, where each node dynamically aggregates features from its topological neighbors while preserving its intrinsic attributes. By iteratively propagating spatial information across multiple GCN layers, the model progressively enhances the discriminative power of node embeddings, enabling the capture of latent multi-scale patterns inherent to APT attacks. This adaptive message-passing mechanism leverages the inherent symmetry of graph structures, empowering the GCN to identify subtle adversarial behaviors and cross-node dependencies that conventional methods often overlook.

1.3.3. Contributions of This Paper

The main contributions of this paper are as follows:
  • To address class imbalance in network traffic datasets, this study proposes the MF-CGAN model, a novel symmetric two-stage data reconstruction model combining feature engineering and CGAN. The model optimizes both preprocessing and data balancing by first refining raw network traffic data into discriminative representations and subsequently generating synthetic minority-class samples. This dual-stage approach demonstrates significant improvements in preprocessing efficiency and class distribution equilibrium, providing a robust foundation for downstream analysis and model training.
  • To address challenges in graph representation learning, this study proposes the MC-GCN model, a novel framework for APT attack detection. The MC-GCN innovatively integrates two core components to construct a flexible and efficient detection architecture. By enhancing the accuracy of APT attack identification, the model simultaneously achieves a significant reduction in false positive rates. Experimental validation across diverse scenarios demonstrates that the proposed method outperforms state-of-the-art detection approaches in performance metrics, offering a more advanced solution for APT attack detection.
  • To address limitations in non-intelligent feature extraction, this study proposes an intelligent network traffic analysis framework that integrates spatial multi-scale perception and dynamic channel optimization. Specifically, the framework combines multi-scale convolution with channel attention mechanisms to enhance traffic processing and feature extraction. Unlike traditional paradigms that directly input statistical features, the method constructs a spatiotemporal mapping mechanism for traffic data: raw traffic sequences are transformed into image-like 2D tensors via IP session clustering and a sliding time window (50 × 50 frame structure). This representation effectively inherits the spatial representation advantages of CNN in image recognition.
  • This study proposes a new method for network traffic classification by constructing a highly effective GCN model. Experimental results demonstrate that the proposed approach achieves significant improvements in both overall detection rate and classification performance under class imbalance, providing a robust solution for complex traffic analysis scenarios.
This paper is organized as follows: Section 2 systematically reviews and discusses prior research on APT attack detection, summarizing the strengths and limitations of existing methodologies proposed by other researchers. Section 3 details the design principles and key technical innovations of the proposed approach. Section 4 presents empirical results to demonstrate the effectiveness of the method, supported by rigorous validation and comparative analyses. Finally, Section 5 synthesizes the primary contributions of this study and outlines potential research directions for addressing unresolved challenges in APT detection.

2. Related Work

2.1. Data Imbalance and Oversampling-Based Methodologies

The primary challenge in network traffic intrusion detection is the class imbalance problem. In nearly all standard intrusion detection datasets, benign classes dominate as the majority, while attack classes are underrepresented as minorities, leading to machine learning models biased toward majority classes. Consequently, researchers have gradually shifted their focus to an emerging method—generative adversarial networks (GANs) [11]. Study [12] proposed a GAN-based intrusion detection system to address data imbalance. This system generates minority-class samples aligned with the original class distribution in the CICIDS 2017 dataset [13] and classifies the augmented data using a random forest algorithm. Experimental results demonstrate that the proposed method outperforms both models ignoring class imbalance and traditional balancing techniques (e.g., SMOTE), particularly excelling in detecting minority-class attacks. Study [14] proposed IDSGAN, a generative adversarial network framework designed to synthesize adversarial malicious traffic records that deceive and bypass intrusion detection systems (IDSs). The model preserves the original attack functionality of adversarial traffic through a constrained modification mechanism and adapts to target IDS models via a dynamic learning strategy. Experimental results demonstrate that IDSGAN successfully evades diverse IDS models with strong robustness and generalization capabilities. While GANs are recognized for generating synthetic samples in intrusion detection datasets that closely resemble original data—thereby enhancing deep learning models’ focus on minority classes—they suffer from critical limitations. Study [15] highlights issues such as lack of class controllability, uneven class attention, and training instability in standard GANs. To address these challenges, conditional generative adversarial networks (CGANs) [16] have emerged as a superior solution, enabling precise class-specific sample generation and stable training.
Study [17] proposed a data generation model (DGM) based on conditional generative adversarial networks (CGANs), which guides CGANs to generate minority-class samples by given conditions, effectively addressing the scarcity of minority-class samples in the field of anomaly detection. The study validated its effectiveness through experiments on the NSL-KDD and UNSW-NB15 datasets. Compared with other methods, the DGM model demonstrated significant advantages in both the quality of generated anomaly samples and the improvement of classifier performance. Study [18] introduced an AE-CGAN-based model, which combines autoencoder dimensionality reduction and CGAN oversampling to address the issue of sample imbalance in datasets. Experimental results showed that AE-CGAN performed excellently on the CIC-IDS2017 dataset, achieving the best recall rate (93.29%) and F1-score (95.38%) compared with other models, particularly demonstrating clear advantages in handling imbalanced data. Study [19] proposed a method based on a conditional aggregated encoder–decoder structure within a conditional generative adversarial network (CE-GAN). By constructing a conditional aggregated encoder–decoder structure, this model alleviates data imbalance and enhances classifier performance. Experiments on the NSL-KDD and UNSW-NB15 datasets demonstrated that the proposed CE-GAN model effectively enhanced rare data samples, significantly improved classification metrics for imbalanced datasets, and exhibited excellent performance improvements in network intrusion detection. Study [20] developed a CGAN-based oversampling method tailored for binary classification tasks. Extensive experiments across 71 imbalanced datasets revealed that the CGAN consistently excelled in restoring data distribution and improving classifier robustness, particularly in complex scenarios where traditional methods (e.g., SMOTE) faltered. Building on these advancements, we employ the CGAN model to generate minority-class samples for imbalanced datasets. The technical details and experimental setup are comprehensively elaborated in Section 3.

2.2. Feature-Based Methodologies

2.2.1. Deep Feature Extraction and Sequence Modeling

Recent studies have proposed leveraging feature engineering to extract discriminative characteristics from network traffic for constructing cyberattack detection models, followed by deep learning-based detection. Study [21] introduced an automated malware detection framework integrating CNN with other machine learning algorithms. This approach converts malicious and benign network packets into flow data via NetMate, subsequently extracting 35 features for analysis. Experimental results indicate that the combined CNN and random forest (RF) model achieves accuracy, precision, and recall rates exceeding 85%, demonstrating significant improvements in malware detection efficacy. However, this study argues that the feature extraction capability of such methods may fail to encompass the full diversity of attacks, and their limited generalization capacity could lead to undetected latent malicious behaviors. Study [22] proposed a deep learning-based intrusion detection system (DL-IDS) that integrates CNN and long short-term memory (LSTM) networks to capture spatiotemporal features from network traffic, thereby enhancing detection accuracy and robustness. To address class imbalance, the model incorporates class-weighted loss functions to stabilize training. Evaluated on the CIC-IDS2017 dataset, DL-IDS demonstrates superior performance in detecting both conventional and emerging network attacks. However, the proposed model in this study exhibits certain limitations, demonstrating suboptimal detection performance for specific minority-class samples within the dataset. To address this, dedicated attention must be directed toward extremely rare attack classes, and traditional traffic characteristics should be prioritized during feature selection to enhance model robustness. Study [23] models network traffic as time-series data and applies supervised learning methods—including multilayer perceptron (MLP), CNN, CNN-recurrent neural network (CNN-RNN), CNN-long short-term memory (CNN-LSTM), and CNN-gated recurrent unit (CNN-GRU)—for intrusion detection. Evaluations on the KDDCup 99 dataset demonstrate that CNN and its hybrid architectures significantly outperform traditional machine learning classifiers in extracting high-level feature representations from network traffic. While this study acknowledges the methodological validity and detection efficacy of time-series-based traffic analysis, it highlights two critical limitations: the approach is computationally intensive (particularly for large-scale datasets, requiring substantial resources for model training) and relies on the outdated KDDCup 99 dataset, which may inadequately represent evolving attack patterns in modern network environments. Study [24] proposed a hybrid deep learning model integrating CNN and weight-decayed long short-term memory (WDLSTM) for network intrusion detection. This approach employs a deep CNN model to extract critical features from large-scale datasets, followed by WDLSTM to preserve long-term dependencies among features while mitigating overfitting caused by recurrent connections. Experimental results demonstrate that the hybrid model achieves superior detection performance on public benchmarks compared with conventional methods. Study [25] proposed a hybrid model based on bidirectional recurrent neural networks, which combines LSTM and GRU for network attack detection. Experimental results on the CIC-IDS2017 dataset demonstrated that the model achieved a classification accuracy of 99.13% and a lower false positive rate. By incorporating feature selection to reduce the input dimensionality, this method effectively improved detection efficiency, exhibiting excellent performance even when using only 58% of the features.

2.2.2. Attention Mechanism-Based Methodologies

Study [26] presents SE-DWNet, a lightweight residual network combining attention and depthwise separable convolution. Trained on a symmetrically preprocessed dataset using SMOTETomek and focal loss, it addresses feature imbalance and improves detection performance. Experiments on NSL-KDD, CICIDS2018, and ToN-IoT show that SE-DWNet outperforms existing IDS models across key metrics. Additionally, the method improved detection accuracy by removing certain features and enabling the model to directly learn features from high-dimensional data. Study [27] proposed FlowTransformer, a modular framework for implementing flow-based network intrusion detection systems (NIDSs) using Transformer models. The authors conduct a comprehensive evaluation of models like GPT-2 and BERT on three widely used public datasets. Results show that the choice of classification head has the most significant impact on performance, with global average pooling—commonly used in text tasks—performing poorly in the NIDS context. FlowTransformer offers an efficient and scalable approach for applying Transformer models in network security. Study [28] proposed an enhanced Transformer-based intrusion detection model aimed at addressing key limitations of existing approaches, including slow training, poor detection of overlapping classes, and suboptimal multi-class classification performance. The proposed model consists of: (i) a hybrid data sampling strategy that combines dimensionality reduction via stacked autoencoders with KNN-based undersampling and Borderline-SMOTE oversampling, improving training efficiency and overlapping class detection accuracy; (ii) a modified positional encoding method that incorporates feature position information to better capture dependencies between features; and (iii) a two-stage learning strategy, where the model first performs binary classification to detect intrusions, followed by multi-class classification using both the prediction results and original features to improve classification accuracy. Experimental results on the NSL-KDD dataset demonstrate that the proposed model outperforms existing methods in both accuracy and F1-score while also achieving faster training times. Study [29] proposed a Transformer-based network intrusion detection system (NIDS) designed to address the limitations of existing methods in capturing long-term behavioral features of network traffic. The model features a highly modular architecture, allowing flexible substitution of components such as the classification head, Transformer structure, and data preprocessing, making it adaptable to various flow-based network datasets. The authors evaluate several Transformer architectures—including shallow encoder, shallow decoder, and GPT-2—on three widely used NIDS benchmark datasets, including one specific to IoT environments. The evaluation covers key metrics such as accuracy, F1-score, precision, and recall. Results highlight that the choice of classification head plays a particularly significant role in determining model performance.
Overall, detection methods and applications based on feature engineering have been continuously evolving. Researchers have effectively enhanced the detection capabilities and efficiency of models by integrating deep learning with traditional feature extraction techniques while also significantly improving the models’ adaptability to novel attacks. Therefore, this paper proposes data reconstruction methods and feature extraction methods based on feature engineering, which have been experimentally validated as effective and rational.

2.3. Graph Neural Network (GNN)-Based Methodologies

Traditional deep learning models typically rely on flat data structures such as vectors or grids, which struggle to capture the complex attack patterns of APTs and zero-day attacks. These threats often manifest as long-term, weak-signal features that are difficult for traditional methods to effectively detect. In contrast, graphs, as a more expressive data structure, can better describe the complex relationships between entities in a network. By constructing graph structures, richer semantic information can be provided for intrusion detection. Graph representation learning (GRL) and graph neural networks (GNNs) have achieved remarkable results in tasks such as vulnerability detection, threat intelligence analysis, and malware detection due to their exceptional representation capabilities [10]. Consequently, researchers have begun to apply these innovative methods in the field of APT detection, with one of the most representative approaches being graph convolutional networks (GCNs) [30].
Study [31] proposed a novel deep learning model combining BiLSTM and GCN for detecting APT attacks through network traffic analysis. This methodology treats network traffic as IP-based flow sequences, reconstructs IP interaction patterns, and employs deep learning models to extract discriminative features for identifying APT attacks originating from external IP addresses. Experimental results demonstrated that the BiLSTM-GCN model outperformed traditional multilayer perceptrons (MLPs) and standalone GCN architectures across all evaluation metrics. However, this study contends that the aforementioned research fails to propose flow network-based APT feature enhancement methods. Furthermore, the simplistic flow network feature extraction approach may lead to the omission of critical information during APT IP detection. Study [32] proposed a graph neural network (GNN)-driven methodology for detecting P2P honeynets by embedding honeynet topologies into real traffic graphs. The framework employs a customized GCN architecture with random walk normalization to enhance detection performance. Experiments demonstrated that increasing the network depth significantly improves detection efficacy, validating the GNN’s capability to efficiently learn honeynet topological features in large-scale network graphs. However, the model exhibits strong dependency on training data quality and quantity. If the characteristics of honeynets are not sufficiently comprehensive or representative in the training data, the model may consequently produce misjudgments. Study [33] proposed GSD-BD, a backdoor defense method for graph neural networks (GNNs) that leverages the inherent symmetry in GNN behavior. A novel metric, logit margin rate (LMR), quantifies output symmetry across layers, and a graph self-distillation framework transfers symmetry knowledge from shallow to deep layers to enhance robustness. Experiments on four datasets show that GSD-BD effectively defends against multiple backdoor attacks, maintaining stability even under severe poisoning. Study [34] innovatively proposed an efficient network anomaly detection scheme by constructing an AnoGLA model. This model utilizes a GCN to model the complex communication patterns in network traffic and combines LSTM with an attention mechanism to extract dynamic information of graph structures across different time steps. The study evaluated the model on two real-world datasets, and experimental results demonstrated that the scheme can effectively detect anomalous flows, outperforming previous solutions in network anomaly detection tasks. Study [35] proposed a GCN-based APT attack detection method. This approach constructs a knowledge graph of vulnerabilities and attack behaviors and utilizes a GCN to process graph features, demonstrating excellent performance in intrusion detection on public datasets. Experimental results show that the GCN method achieves a detection accuracy of 95.9%, which is approximately 2.1% higher than that of GraphSage. Study [36] proposed a dynamic graph convolutional neural network (DGCNN) method, which extracts and classifies APT IP features by constructing a BiADG model. Through the flexible combination of different components in the model, this method effectively demonstrates the critical information and behaviors of APT attacks, achieving high detection accuracy and low false positive rates. Experimental results show that the model outperforms other methods across all metrics. Specifically, the precision of APT attack prediction results reached 84–91%, which is more than 7% higher than other studies. These experimental results validate the correctness and rationality of the proposed BiADG model in detecting APT attacks. Study [37] proposed a novel APT attack detection model named MIG, which integrates a multilayer perceptron (MLP), an inference layer (I), and a graph convolutional network (GCN). Specifically, the MLP layer extracts and aggregates IP attributes, the inference layer constructs IP information profiles, and the GCN layer analyzes and reconstructs features based on IP behaviors. This method innovatively combines and applies these technologies to APT detection based on network traffic, significantly improving accuracy and reducing false positive rates, thereby validating its effectiveness in both theory and practice. However, although the inference network performs well in computing and representing relationships within traffic, its coefficients remain fixed and lack a selection basis, leaving room for improvement. Leveraging the advantages of graph neural networks in intrusion detection, this paper effectively achieves the intended detection goals by constructing a GCN model, with detailed implementation methods being discussed in later sections. We summarize the comparison of the above typical works in Table 1.

3. Materials and Methods

Next, this section provides a detailed introduction to the model architecture proposed in Section 1.3. The proposed symmetric dual-phase detection framework integrating multimodal data reconstruction and deep feature learning consists of two main components: data reconstruction and an APT attack detection method based on feature enhancement and graph neural networks. The first phase focuses on data-level enhancement through synthetic augmentation, while the second mirrors it by enhancing feature-level representation through deep structural learning. This symmetric progression ensures balanced information flow and robust detection.

3.1. Data Reconstruction

This study proposes an effective data generation model for reconstruction: the multi-feature-conditioned generative adversarial network (MF-CGAN). The MF-CGAN model integrates feature engineering with conditional GAN (CGAN) as a data processing method to achieve the reconstruction of network traffic datasets. The workflow of data reconstruction is illustrated in Figure 1, and each component is elaborated in detail in this section.

3.1.1. Dataset

This study employs the CIC-IDS2017 dataset (provided by the Canadian Institute for Cybersecurity, CIC [13]), designed to authentically mirror traffic characteristics and potential attack behaviors in modern network environments. The data collection spanned 5 consecutive days, from 09:00 on Monday, 3 July 2017 to 17:00 on Friday, 7 July 2017, capturing both benign traffic and multiple attack scenarios. The implemented attacks include Brute-force FTP, Brute-force SSH, DoS, Heartbleed, Web Attack, Infiltration, Botnet, and DDoS, which were staged across different workdays. Table 2 provides the daily labels and the size of captured data samples for each day. The CIC generated analysis results using CICFlowMeter, exporting an 80-dimensional feature set in CSV format extracted from raw network traffic. The primary objective of the CIC-IDS2017 dataset is to simulate realistic background traffic, providing empirical scenario data for network intrusion detection and traffic modeling. To construct behavioral models of normal traffic, the CIC developed 25 abstract traffic profiles based on common protocols (e.g., SSH, FTP, HTTPS, HTTP), representing typical communication patterns in real-world networks.

3.1.2. Feature Engineering

This method consists of the following phases:
  • Stratified random sampling: Given the substantial volume of the CIC-IDS2017 dataset (comprising millions of records), processing the complete dataset would demand prohibitively high computational resources. To address this challenge, stratified random sampling was implemented in our experiments, with a sampling ratio of frac = 0.2 applied to each file. This strategy ensures a balanced distribution of data across distinct classes while maintaining statistical representativeness. Stratified sampling helps to avoid bias by preserving the original class proportions, allowing the model to learn from both majority and minority classes, thus mitigating overfitting and improving generalization.
  • Data processing: The merged dataset underwent comprehensive preprocessing through three core operations. First, all NaN/missing values, infinite values, constant features, and duplicate entries were systematically removed to ensure data cleanliness. Second, multimodal standardization was executed to resolve feature-scale discrepancies: each feature was normalized to a zero-mean and unit variance distribution; nominal data were converted into ordinal integers; individual samples were scaled to unit norms; median values were eliminated from feature columns; and interquartile range (IQR) scaling between the 1st and 3rd quartiles was applied. Finally, a binary encoding scheme assigned labels 0 and 1 to benign and anomalous traffic instances, respectively, establishing a foundation for supervised learning tasks.
  • Feature selection: Three correlation coefficients—Pearson’s linear correlation, Kendall’s tau, and Spearman’s rank correlation [38]—were employed to quantify inter-feature dependencies. Features exhibiting correlation coefficients exceeding the 0.95 threshold were systematically eliminated to mitigate multicollinearity-induced information redundancy. Furthermore, feature columns demonstrating constant values in ≥ 99.5 % samples and those with zero variance (i.e., constant features where all samples share identical values) were rigorously excluded. Through this iterative feature screening and dimensionality reduction pipeline, a refined 50-dimensional feature subspace was ultimately derived for experimental modeling, optimally balancing discriminative power and computational efficiency.

3.1.3. Conditional Generative Adversarial Network

The conditional generative adversarial network (CGAN) extends the classical generative adversarial network (GAN) framework by integrating auxiliary conditional information into both the generator and discriminator. Unlike standard GANs that rely solely on random noise as input, CGANs additionally incorporate conditional constraints—such as class labels, categorical tags, or multimodal data embeddings—to steer the generation of samples with predefined attributes. By incorporating conditional vectors into the adversarial training process, CGANs achieve precise control over generated outputs, enabling the synthesis of data samples that align with specified target distributions:
Generator: The generator network G receives random noise z and conditional input y, generating data samples through a neural network as G(z|y).
Discriminator: The discriminator network D takes a sample data x (whether real or generated) along with condition y and outputs a probability value D(x|y), which represents the likelihood that the input data comes from the true distribution.
Discriminator loss: The discriminator is trained by maximizing its ability to distinguish between real and generated data. Its loss function is defined as:
L D = E x p data log D ( x | y ) E z p z log 1 D ( G ( z | y ) | y )
where x represents real data; z is the noise vector; G(z|y) denotes the data generated by the generator; D(x|y) represents the probability output by the discriminator for real data; D(G(z|y)|y)) represents the probability output by the discriminator for generated data; p data ( x ) denotes the distribution of real data; and p z ( z ) denotes the distribution of noise.
Generator loss: The generator is trained by maximizing the probability that the discriminator misclassifies generated data. Its loss function is defined as:
L G = E z p z [ log D ( G ( z | y ) | y ) ]
The objective of the generator is to make the discriminator classify generated samples as real samples. Therefore, its loss function is the negative logarithm of the probability output by the discriminator.
Joint optimization objective (minimax game):
min G max D V ( D , G ) = E x p data log D ( x y ) + E z p z log 1 D G ( z y ) y .
CGAN introduces conditional variables to enable the generator to produce data under specified constraints. The dual optimization objectives are to ensure that the generated data closely mimics the real data distribution while training the discriminator to reliably distinguish between authentic and synthesized samples. Through adversarial training, both the generator and discriminator undergo continuous refinement, ultimately achieving the generation of high-quality data samples that strictly adhere to predefined conditions.
The MF-CGAN model undergoes simultaneous training of the generator and discriminator. Over time, as the discriminator becomes better at distinguishing real from generated data, the generator becomes increasingly proficient at producing data that closely resembles the real samples.
During training, the discriminator loss typically decreases, showing that the discriminator is successfully learning to distinguish between real and generated data. The generator loss also decreases as the generator learns to fool the discriminator, generating more realistic data. To ensure stable training and convergence, we implement several strategies:
  • Learning rate decay: gradually decreasing the learning rate helps avoid overshooting during optimization, facilitating smoother convergence.
  • Batch normalization: applied to stabilize the training process and prevent mode collapse, ensuring that both the generator and discriminator improve over time.
The adversarial loss function drives both networks toward a balance, where the generator produces high-quality synthetic data and the discriminator accurately differentiates between real and fake data. This continuous refinement results in the convergence of both models, achieving an optimal state where the generated samples closely match the real data distribution.

3.1.4. Data Reconstruction via MF-CGAN

By integrating the feature engineering methodologies outlined in Section 3.1.2, the MF-CGAN is deployed to synthesize minority-class samples, thereby addressing the inherent class imbalance problem. As depicted in Figure 2, the generator and discriminator networks engage in a minimax adversarial game, undergoing simultaneous training to refine their respective capabilities. Within the CIC-IDS2017 dataset, benign traffic accounts for over 80% of the total instances, while the remaining data is distributed across 14 distinct attack types. Notably, the rarest attack category constitutes a mere 0.0004% of the dataset, exemplifying extreme class imbalance. To mitigate this, the generator of the MF-CGAN model receives three critical inputs: network attack labels, six numerically encoded non-numeric features (representing network interaction patterns), and random noise vectors sampled from a latent distribution. Post-generation, the synthetic data is validated by training state-of-the-art machine learning classifiers to evaluate its discriminative utility. This process culminates in the creation of a class-balanced dataset that harmonizes the original data distribution while enhancing the representation of minority attack categories. The entire workflow is formally expressed as:
x ˜ G = G ( z y f )
D ( x y f ) [ 0 , 1 ]
min G max D V ( D , G ) = E x p data log D ( x | y | f ) + E z p z log ( 1 D ( G ( z | y | f ) | y | f ) )
where x represents real data; x ˜ G is the input of the generator; z is the noise vector; y is the one-hot encoded attack label ( y R d y ); f is the numerical network interaction feature vector ( f R 6 ); D ( x y f ) is the input of the discriminator; G ( z | y | f ) represents the data generated by the generator; D ( x | y | f ) is the discriminator’s output probability for real data; and D ( G ( z | y | f ) | y | f ) is the discriminator’s output probability for generated data.

3.2. APT Attack Detection via Feature Enhancement and Graph Neural Networks

3.2.1. Model Architecture

Figure 3 illustrates the architecture of the MC-GCN model based on feature enhancement and graph neural networks. This model comprises two primary modules, each with distinct processing workflows, encompassing the following key stages:
Multi-scale convolution channel attention module (MS-CCA) for feature enhancement: The MS-CCA module performs hierarchical feature extraction from network traffic data through two sequential stages:
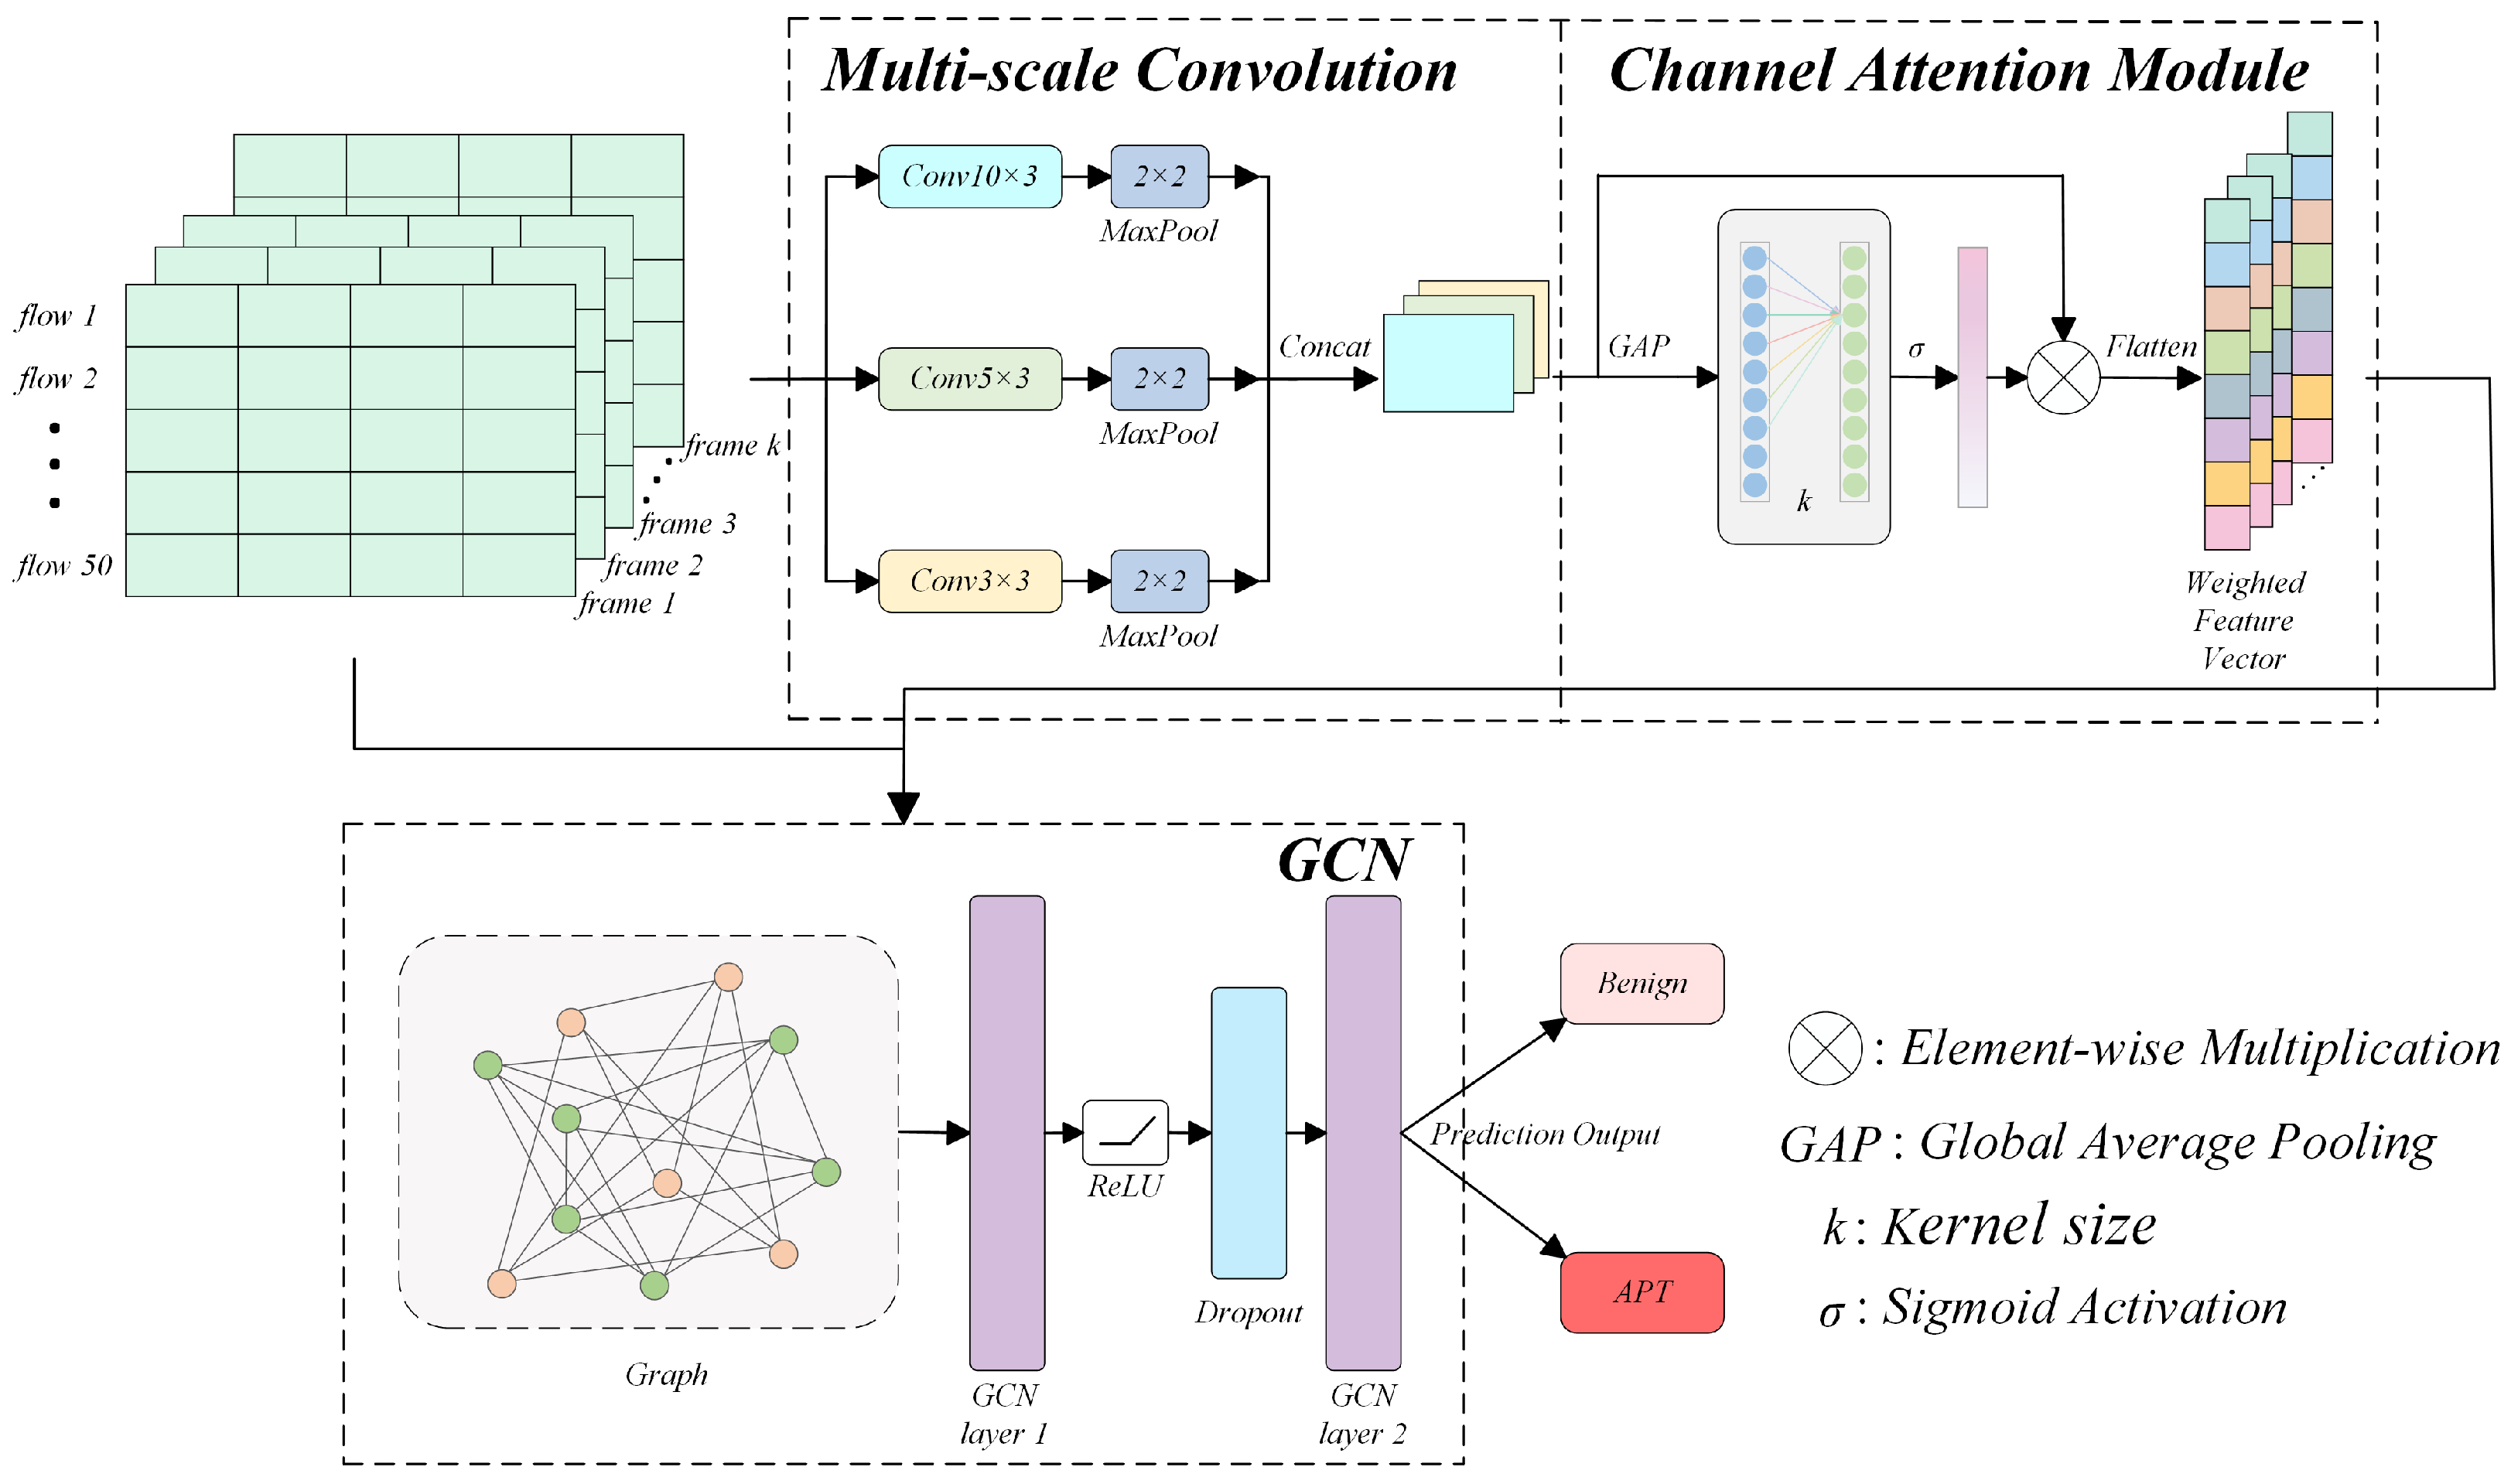
  • Phase 1: Frame construction from network traffic data: The balanced network traffic dataset processed during the data reconstruction phase is grouped by IP addresses and aggregated into frames of size m × n (m = 50; n = 50), where m denotes the number of flow entries per frame and n represents the feature count per flow entry.
  • Phase 2: Multi-scale feature extraction with channel attention: The constructed frames are fed into multi-scale convolutional layers equipped with convolutional kernels of varying sizes. Through multi-level convolutional operations, multi-grained network traffic features are extracted to generate feature maps. A channel attention mechanism is then introduced to dynamically weight feature channels, producing refined feature vectors that highlight salient characteristics per frame.
GCN-based graph convolutional network module: This module constructs a graph structure by connecting homogeneous nodes via edges to form local graphs, where the feature vectors extracted by the MS-CCA module are assigned as node attributes. The graph convolution operation propagates and aggregates features from neighboring nodes over the topological structure, thereby enhancing node representations and enabling effective identification of APT attacks through hierarchical information fusion.

3.2.2. Multi-Scale Convolution

In traditional convolutional operations, fixed-size convolutional kernels are employed to capture local patterns within input feature maps. However, in many practical tasks, the sizes of objects or features exhibit significant variability, rendering single-scale convolutional kernels insufficient for effectively processing all scale-dependent information. To address this limitation, multi-scale convolution utilizes convolutional kernels of varying sizes to extract features at different scales, enabling simultaneous capture of fine-grained details and global contextual patterns. A typical multi-scale convolutional architecture involves parallel computations with kernels of distinct dimensions (e.g., 3 × 3, 5 × 5, 7 × 7), followed by fusion strategies such as concatenation or weighted summation. This approach allows the model to robustly recognize and interpret structural patterns across a broader range of spatial resolutions.
Through grid search, we tested kernel sizes of 10 × 3, 5 × 3, and 3 × 3, evaluating the performance of each configuration using cross-validation. This approach allowed us to balance the extraction of local and global features, with the larger kernels capturing broader context and the smaller ones focusing on fine-grained details. The results demonstrated that this combination of kernel sizes provided the best performance in terms of both accuracy and robustness in detecting APT attacks. After the convolution operation, max pooling is applied for spatial dimensionality reduction to extract key features and enhance translation invariance. Subsequently, the outputs of multiple convolutional layers are fused along the channel dimension, allowing features of different scales to complement each other and thereby enriching the feature representation. The computational workflow is formalized as:
F out = Concat Maxpool 2 × 2 Conv i × j ( F in )
where Conv i × j ( · ) represents the use of a convolution kernel of size i × j to extract features, i = 10 , 5 , 3 ; j = 3 . Maxpool 2 × 2 ( · ) denotes the use of a 2 × 2 pooling window for max pooling operations. Concat ( · ) represents concatenating all features processed through pooling.

3.2.3. Channel Attention Mechanism

The channel attention mechanism is an attention mechanism applied to deep learning models, particularly suitable for convolutional neural networks (CNNs). Its core objective is to automatically learn and dynamically adjust the weights of different channels (or feature maps) to highlight critical information and suppress irrelevant features. By assigning adaptive weights to each channel, CA enhances the model’s discriminative power through hierarchical recalibration of channelwise feature responses. Specifically, it amplifies informative channels that contribute critically to task-specific representations while suppressing less relevant or redundant channels. This is achieved by adaptively weighting each channel of the input feature maps, thereby refining feature hierarchies and optimizing the network’s capacity to capture semantically salient patterns.
Global average pooling: Its goal is to average across the spatial dimensions of each channel to obtain a global feature representation for each channel. Given an input feature map X R C × H × W , where C is the number of channels and H and W are the spatial dimensions of the feature map; the global average pooling operation computes the average value for each channel. The formula is as follows:
g ( X ) = 1 H × W h = 1 H w = 1 W x c , h , w , c [ 1 , C ]
Here, g ( X ) represents the global average value of the c-th channel, and x c , h , w is the feature value of the input feature map X at spatial position ( h , w ) in channel c.
The calculation of the kernel size is determined adaptively based on the number of channels to ensure that the kernel size is an odd number. The formula is as follows:
k = C α ÷ α × α + 1
where C is the number of channels; α is a constant.
The channel attention mechanism enhances feature representations through the following sequential operations: The input feature map is first subjected to global average pooling (GAP), compressing the spatial features (of size H × W ) of each channel into a scalar to extract global channelwise information. Subsequently, a one-dimensional convolutional kernel with dynamically adjusted size is applied, where the kernel dimension is adaptively determined based on the total number of channels. Specifically, the kernel size is calculated by adding 1 to an intermediate value derived from the channel count, ensuring an odd-numbered kernel configuration. This odd-sized kernel preserves spatial symmetry during convolution, facilitates precise feature map dimension control, and mitigates boundary artifacts, thereby effectively capturing interdependencies among channels. The convolution results are passed through a sigmoid activation function to generate attention weights for each channel. These weights are then applied to each channel of the original input feature map, yielding a weighted feature map.

3.2.4. Graph Convolutional Network

Graph convolutional networks (GCNs) extend traditional convolutional neural networks (CNNs) to graph-structured data, enabling feature learning in non-Euclidean spaces. The key mechanism involves recursively aggregating neighborhood information through graph convolutional layers, thereby progressively extracting and learning higher-order representations of nodes. Unlike a traditional CNN constrained to grid-like data, GCN explicitly integrates both intrinsic node features and structural dependencies by synthesizing features from a node’s local neighborhood. This dual dependency mechanism allows GCN to holistically encode topological patterns, where node embeddings evolve through layerwise propagation of neighborhood characteristics. The key strength of GCN lies in its ability to model localized information diffusion across graph edges. Each node’s representation becomes a context-aware fusion of its own attributes and the features of adjacent nodes, mimicking message-passing dynamics in relational systems. By leveraging the inherent graph topology, GCN captures multi-hop interactions and hierarchical substructures, making it particularly effective for tasks requiring joint analysis of node attributes and connectivity (e.g., social network analysis, molecular property prediction). Compared with spectral graph convolution methods, GCN’s spatial aggregation paradigm offers enhanced scalability and adaptability to heterogeneous graphs while preserving computational efficiency through sparse matrix operations.
Adjacency matrix: Consider a graph G = ( V , E ) , where V is the set of nodes and E is the set of edges. The adjacency matrix A is an N × N matrix, where N is the number of nodes in the graph. A i j indicates whether there is an edge between node i and node j (1 represents the presence of an edge, and 0 represents the absence of an edge). The adjacency matrix is usually normalized to avoid the influence of differences in the number of nodes in the model. A symmetric normalized adjacency matrix A ^ is used:
A ^ = D 1 2 ( A + I ) D 1 2
where: A is the original adjacency matrix, I is the identity matrix, ensuring that each node has a self-loop. D is the degree matrix, where D i i = j A i j representing the degree of the node (i.e., the number of edges connected to it). D 1 2 is the inverse square root of the degree matrix.
Node feature matrix: Let X be the node feature matrix of size N × F , where F is the dimensionality of node features. Each node’s features can be represented by an F-dimensional vector x i , and the feature vectors of all nodes form the matrix X:
X = x 1 x 2 x N
Weight matrix: In each layer of the GCN convolution operation, a weight matrix W is used for the linear transformation of node features. Suppose at layer l that the input feature dimension is F l and the output feature dimension is F l + 1 . Then, the weight matrix W ( l ) has dimensions F l × F l + 1 .
Graph convolution operation: The convolution operation in GCN aggregates information by applying the adjacency matrix and the weight matrix for a linear transformation of the node features. If we denote the node feature matrix at layer l as H ( l ) , the convolution operation can be expressed as:
H ( l + 1 ) = σ A ^ H ( l ) W ( l )
where H ( l ) is the node feature at layer l, H ( 0 ) = X (i.e., the input feature matrix), A ^ is the normalized adjacency matrix, W ( l ) is the weight matrix at layer l, and σ is the ReLU activation function.
The primary role of GCN is to enhance the performance of anomaly detection tasks through graph structural information. The GCN framework maintains topological symmetry by aggregating features from neighboring nodes in a balanced fashion, enabling consistent representation across local subgraphs and preserving structural equilibrium. By performing convolutional operations on graph nodes in GCN, the model effectively extracts discriminative features from the topological structure of network traffic, thereby improving the accuracy of anomaly detection. As illustrated in Figure 4, nodes of the same type are connected as a fully connected undirected graph, forming spatially isolated local subgraphs. Following data preprocessing and CNN-based feature extraction, GCN facilitates context-aware information propagation based on inter-node relationships. Because two nodes connected by an edge belong to the same category, the aggregated features inherently encapsulate richer category-specific semantic details, enabling the model to capture subtle topological deviations indicative of advanced persistent threat.

3.3. Time and Space Complexity

3.3.1. MF-CGAN (Multi-Feature-Conditioned Generative Adversarial Network)

The computational complexity of the MF-CGAN model is primarily determined by the training process of both the generator and the discriminator networks, each consisting of multiple fully connected layers.
Time complexity: Each forward pass through the generator and discriminator involves matrix multiplications followed by activation functions. The time complexity per forward pass is O ( N · D 2 ) , where N is the batch size and D is the number of neurons in the layers. As both the generator and discriminator undergo multiple forward–backward passes during training, the total time complexity per epoch is O ( N · D 2 ) .
Space complexity: The space complexity is driven by the need to store activations, weights, and gradients during training. As the model involves dense layers, the space complexity for both the generator and discriminator is O ( N · D 2 ) , where N is the batch size and D is the number of neurons per layer.

3.3.2. MC-GCN (Multi-Scale Graph Convolutional Network)

The MC-GCN model is based on graph convolutions, which compute node representations by aggregating information from neighboring nodes and edges.
Time complexity: The time complexity of a single graph convolution layer is O ( N · E · D 2 ) , where N is the number of nodes, E is the number of edges, and D is the feature dimension. Because multiple graph convolution layers are employed, the total time complexity for the model is O ( L · N · E · D 2 ) , where L is the number of layers.
Space complexity: The space complexity arises from the need to store node features and the adjacency matrix. For graph convolutions, the space complexity is O ( N · E · D ) , where N is the number of nodes, E is the number of edges, and D is the feature dimension. Additionally, the multi-scale convolutions and any auxiliary operations add to the space requirements but remain proportional to the size of the graph.

4. Experimental Analysis and Results

This section empirically evaluates the performance and advantages of the proposed framework integrating data balancing strategies with deep learning models. First, we detail the experimental configurations and evaluation metrics. Subsequently, comparative experiments against state-of-the-art (SOTA) methods and ablation studies are conducted. The empirical results demonstrate that our method not only significantly enhances the detection of minority-class attacks but also surpasses most existing SOTA approaches in overall detection accuracy and robustness.

4.1. Experimental Setup and Model Training

The proposed deep learning framework was implemented using PyTorch 11.3 with Python 3.12. Experiments were conducted on a high-performance server equipped with a 13th Gen Intel® Core™ i9-13900K CPU, an NVIDIA GeForce RTX 4090 GPU, and 64 GB of RAM.
In this paper, a more balanced new dataset was successfully constructed using the class balancing strategy proposed in Section 3.1. This dataset not only achieves distribution balance but also retains the diverse traffic characteristics of the original CIC-IDS2017 dataset. The newly reconstructed dataset was then applied to the APT attack detection model proposed in this study. During the experiments, the dataset was divided into training, validation, and test sets at ratios of 70%, 15%, and 15%, respectively. This partitioning scheme aims to reduce overfitting and ensure effective model training, where the training set is used for model learning and the validation set is used for periodic evaluation and updating of model weights. After training, the test set was utilized to assess the model’s generalization ability on unseen data.

4.1.1. Hyperparameter Definitions

The hyperparameters of the MF-CGAN model and the MC-GCN model are defined in Table 3 and Table 4, respectively. To optimize the model’s performance, we conducted a random search and grid search over key hyperparameters, including the learning rate, batch size, and the number of layers in the model. These methods allowed us to explore a broad range of configurations and identify the optimal settings for our approach. To ensure stable training and prevent overfitting, we employed early stopping, monitored validation loss, and used learning rate decay to gradually reduce the learning rate during training. Additionally, batch normalization was applied to stabilize the training process and improve convergence speed.

4.1.2. Sensitivity Analysis of Hyperparameters

Following the hyperparameter tuning process, we performed a sensitivity analysis to further evaluate how changes in key hyperparameters affect the performance of the model. The analysis focused on three hyperparameters: learning rate, batch size, and number of layers. We tested a range of values for each hyperparameter, as outlined below:
  • Learning rate: We tested learning rates from 10 3 to 10 5 . The model performed optimally at a learning rate of 0.005, with lower rates leading to slower convergence and higher rates causing instability in training.
  • Batch size: Batch sizes of 32, 64, and 128 were evaluated. A batch size of 32 provided the best trade-off between training time and model accuracy, while larger batch sizes (64 and 128) did not lead to significant improvements in performance.
  • Number of layers: We experimented with the number of layers in the model, from 3 to 6 layers. The performance did not improve beyond four layers, suggesting that the model achieves stable performance with this configuration.
These results demonstrate that the model’s performance remains robust across a variety of hyperparameter configurations, confirming the flexibility and stability of the approach.

4.2. Experimental Evaluation

In the experiments of this paper, four main metrics and a confusion matrix were used to evaluate the model. Additionally, ROC curves were provided to further illustrate the effectiveness of the model.

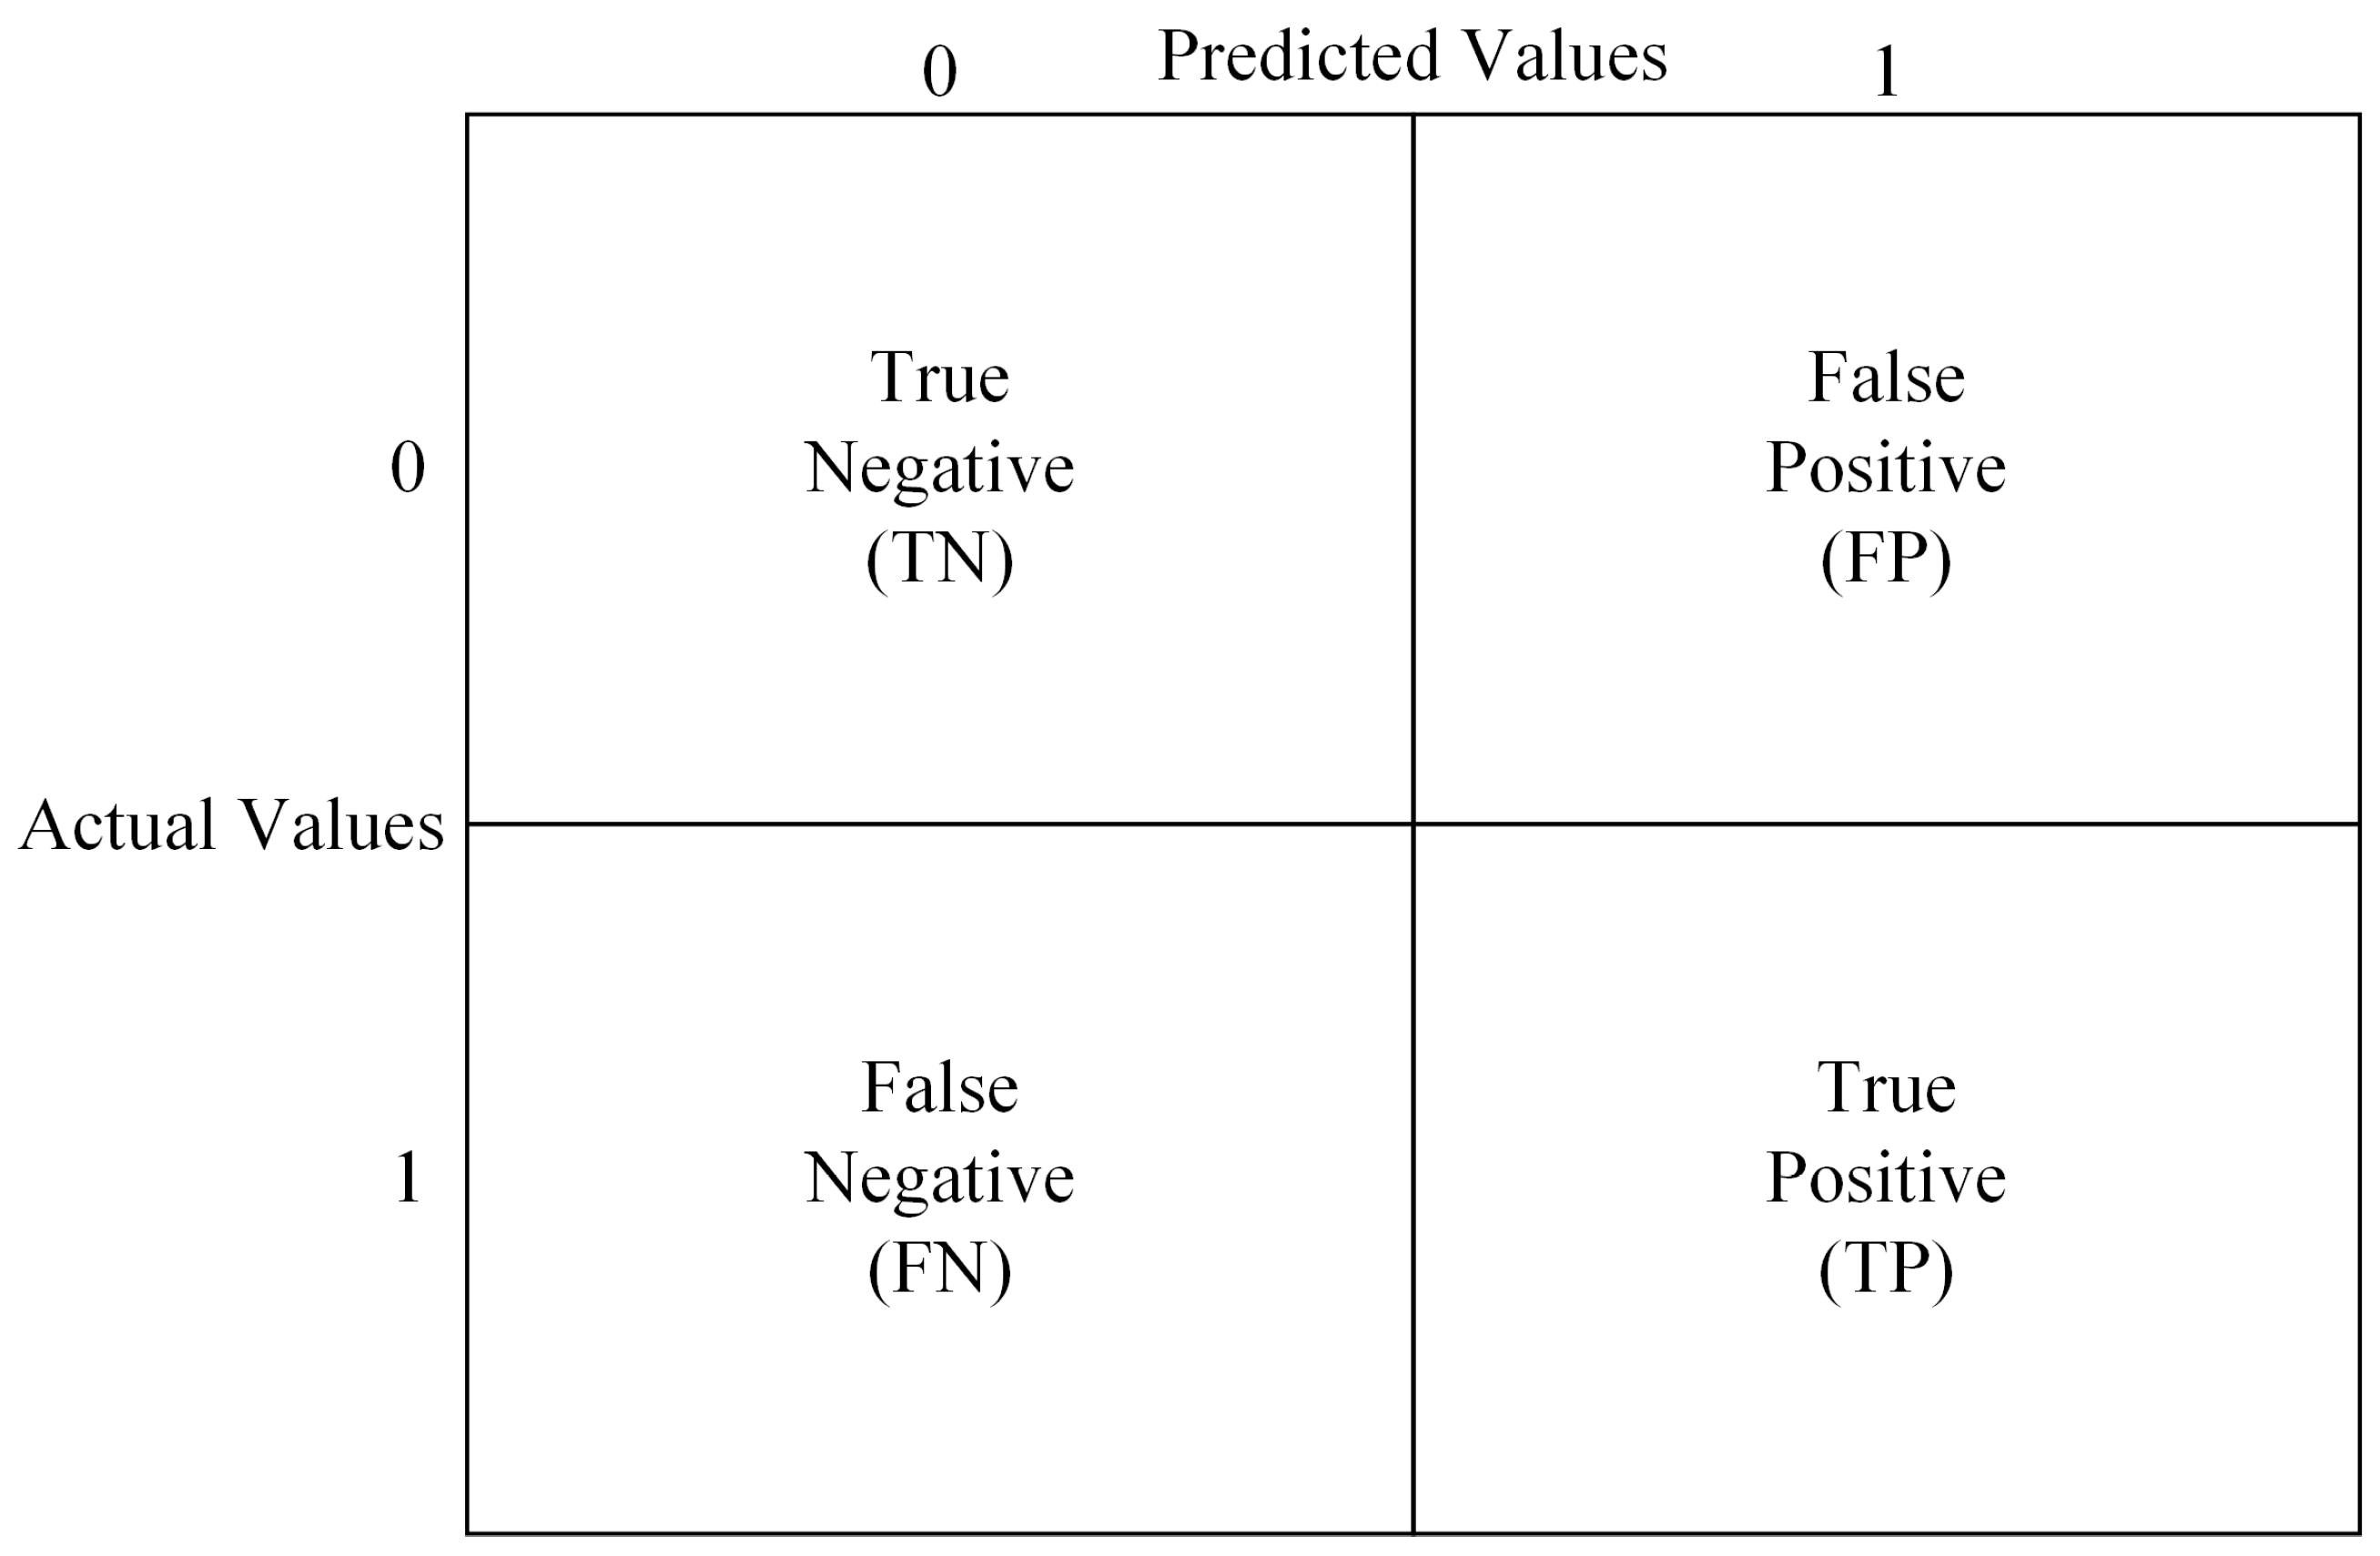
4.2.1. Confusion Matrix

The definition of the confusion matrix is illustrated in Figure 5. The confusion matrix primarily includes true positive (TP), true negative (TN), false positive (FP), and false negative (FN). The definitions of these elements are as follows:
TP: The number of actual attack samples correctly predicted as attacks.
TN: The number of actual normal samples correctly predicted as normal.
FP: The number of actual normal samples incorrectly predicted as attacks (false alarms).
FN: The number of actual attack samples incorrectly predicted as normal (missed detections).

4.2.2. Evaluation Metrics

The main evaluation metrics include accuracy, precision, recall, and F1-score. The formulas for calculating these metrics are as follows:
Accuracy: Measures the overall correctness of the model’s predictions.
A c c u r a c y = T P + T N T P + T N + F P + F N × 100 %
Precision: Measures the proportion of actual positive samples among those predicted as positive by the model.
P r e c i s i o n = T P T P + F P × 100 %
Recall (Sensitivity): Measures the proportion of actual positive samples that are correctly predicted as positive by the model.
R e c a l l = T P T P + F N × 100 %
F1-score: The harmonic mean of precision and recall, used to balance the evaluation of both.
F 1 = 2 × P r e c i s i o n × R e c a l l P r e c i s i o n + R e c a l l

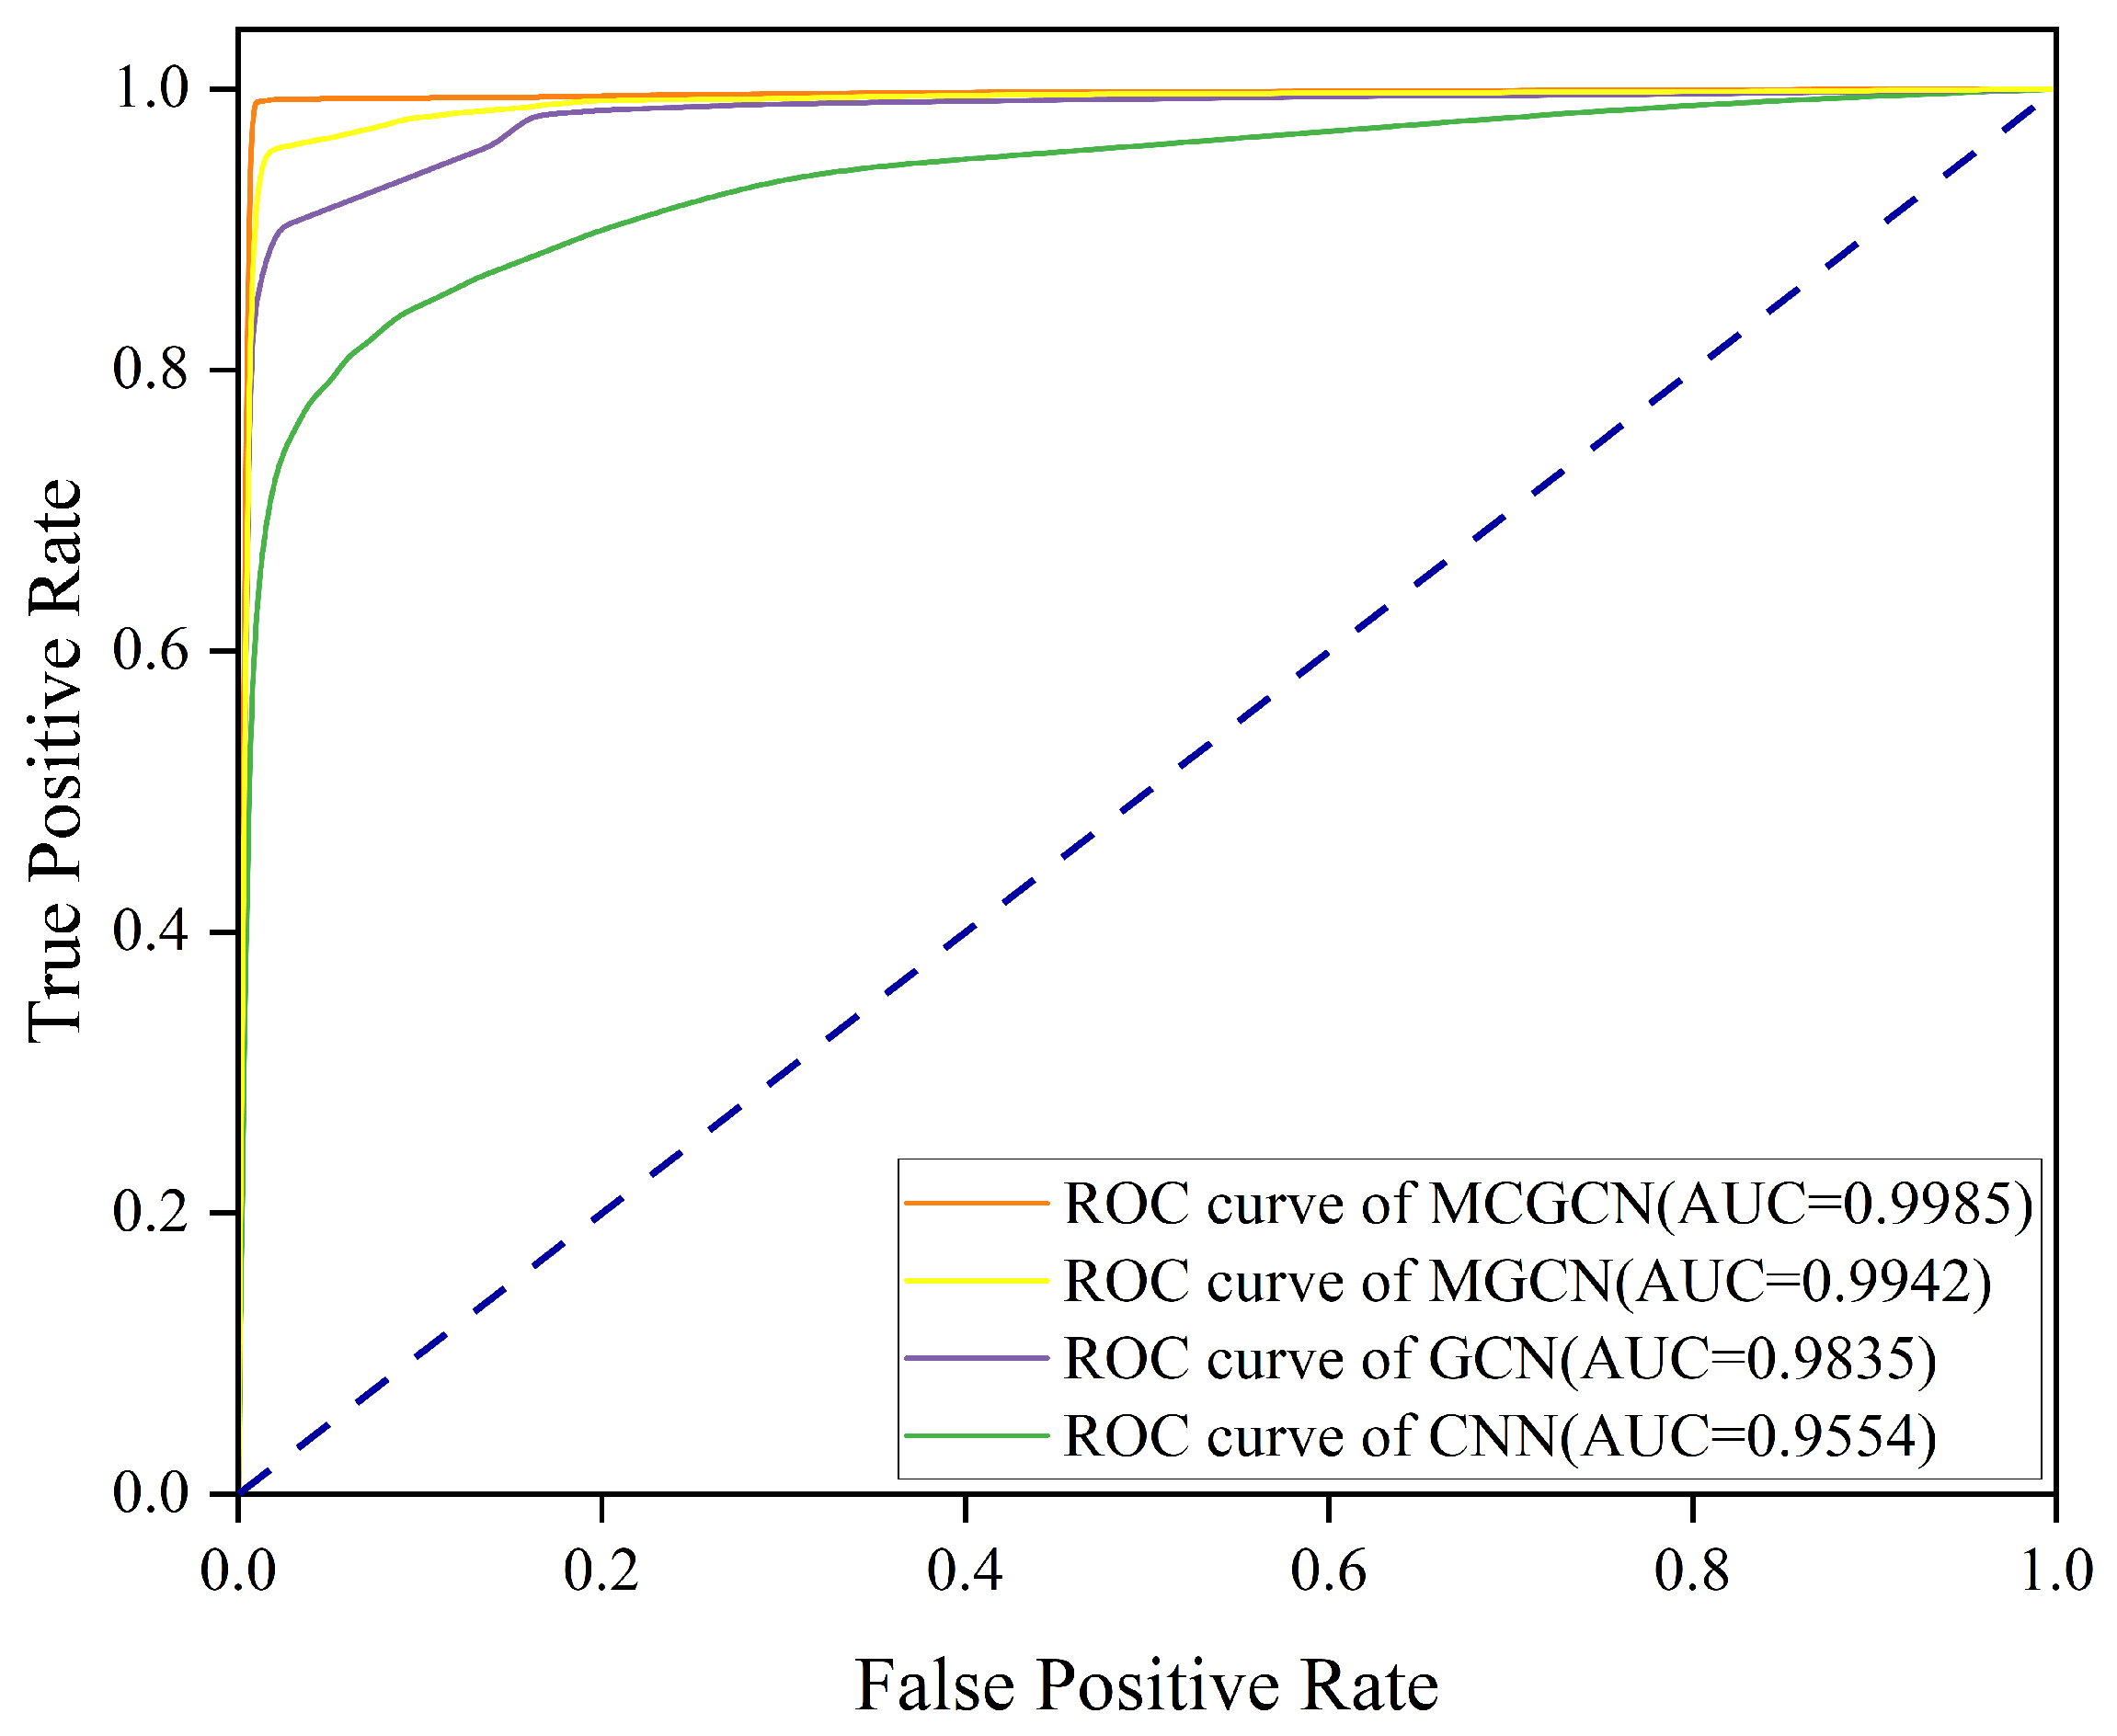
4.2.3. AUC-ROC Analysis

The ROC curve is commonly used to evaluate the performance of binary classification models. It is plotted based on calculating the true positive rate (TPR) and false positive rate (FPR), with FPR as the x-axis and TPR as the y-axis. The area under the ROC curve (AUC, area under curve) measures the model’s ability to distinguish between positive and negative classes. By adjusting the classification threshold, different prediction results can be computed, and the corresponding FPR and TPR can be derived. Generally, the larger the AUC value, the better the classification performance of the model. Definitions of TPR and FPR:
TPR: Also known as recall, it measures the proportion of actual positive samples correctly identified by the model:
T P R = T P T P + F N
FPR: Represents the proportion of actual negative samples erroneously classified as positive.
F P R = F P F P + T N
AUC Threshold Interpretation:
AUC = 1: The classifier exhibits perfect discrimination, flawlessly separating all positive and negative classes.
AUC = 0: The classifier demonstrates complete inversion, misclassifying all positives as negatives and vice versa.
0.5 < AUC < 1 : The classifier achieves statistically significant discriminative power, with fewer false negatives/positives and robust generalization.
AUC = 0.5: The classifier performs no better than random guessing, indicating no inherent class separation capability.

4.3. Experimental Results Analysis

This section evaluates the model’s effectiveness using the four metrics defined in the preceding section.

4.3.1. Experimental Results of Data Reconstruction

The data reconstruction experiments were conducted on the CIC-IDS2017 dataset. To ensure the statistical significance of the data-driven model and classifier outcomes, a k = 5-fold cross-validation methodology was rigorously applied. This approach mitigates overfitting risks and provides a robust assessment of model generalizability across diverse data partitions.
Table 5 presents the original and balanced class percentage distributions of the CIC-IDS2017 dataset. In the original dataset, benign traffic dominates 80% of the total samples, while all attack categories collectively account for only 20% of samples. Notably, minority classes such as Web_Attack_Sql_Injection and Heartbleed exhibit extremely low proportions of 0.0007% and 0.0004%, respectively. As highlighted in Section 1.2, such severe class imbalance biases the model toward prioritizing benign traffic detection, thereby achieving high accuracy at the expense of missing critical minority-class attacks—a direct contradiction to the core objective of APT attack detection. To resolve this issue, the proposed data reconstruction strategy establishes data-level symmetry by generating high-quality synthetic samples for minority classes using MF-CGAN. Figure 6 illustrates the contrast between imbalanced and balanced class distributions. Post-balancing, the refined dataset achieves 44% benign traffic and 56% attack traffic, with Web_Attack_Sql_Injection and Heartbleed proportions being increased to 0.0118% and 0.0052%, respectively. To preserve data authenticity, the augmentation of these ultra-rare classes was carefully constrained to avoid unrealistic synthetic sample generation, ensuring that the expanded data distribution aligns with real-world attack patterns. This rebalancing restores symmetry in class representation, which is essential for fair training, improved generalization, and effective APT detection across diverse threat types.
The experimental evaluation of data reconstruction outcomes reveals distinct performance variations across machine learning models. As demonstrated in Table 6, the MF-CGAN model achieves optimal results among the evaluated approaches. Figure 7 provides a comparative visualization of model effectiveness, where the random forest classifier attains the highest performance metrics with an average precision of 94%, recall of 89%, and F1-score of 91%. In contrast, other models exhibit suboptimal capabilities, particularly in detecting minority-class attacks. The decision tree model achieves 87% precision, 89% recall, and 88% F1-score, while the support vector classifier (SVC) performs notably worse with 80% precision, 88% recall, and 77% F1-score. The multilayer perceptron (MLP) model achieves 87% precision, 82% recall, and 82% F1-score, further underscoring systemic limitations in handling imbalanced data. Critically, all models fail to detect Web_Attack_Sql_Injection attacks at acceptable levels, and both MLP and SVC models demonstrate near-complete failure in identifying Web_Attack_Brute_Force attacks. These deficiencies highlight the necessity for advanced deep learning architectures tailored to rare attack signatures, prompting the development of the MC-GCN model, whose experimental validation is elaborated in subsequent sections.
As shown in Table 7, the proposed MF-CGAN model is rigorously compared with existing SMOTE-based statistical methods, including SMOTE-ENN (synthetic minority oversampling technique-edited nearest neighbors), Borderline-SMOTE, and SVM-SMOTE, through weighted F1-score evaluation across four machine learning models. The results demonstrate that MF-CGAN consistently outperforms all baseline methods in terms of synthetic data quality and detection robustness. Specifically, it achieves superior weighted F1-scores in anomaly detection tasks by generating minority-class samples that exhibit enhanced fidelity to real-world attack patterns while preserving feature distribution consistency. This capability enables MF-CGAN to significantly improve the generalization performance of diverse classifiers, thereby fulfilling the design objectives for imbalanced cybersecurity datasets.

4.3.2. Experimental Results of MC-GCN Model

Table 8 presents the classification performance of the proposed model and its comparison with existing methods. Experimental results demonstrate that the proposed model achieves the best detection performance across multiple evaluation metrics. Compared with traditional methods, our approach significantly outperforms current mainstream techniques on the reconstructed CIC-IDS2017 dataset in terms of all performance indicators. Specifically, MC-GCN attains an accuracy of 99.87%, surpassing CNN (86.46%), CNN-GRU (90.17%), and GCN (99.24%), highlighting its superiority in overall prediction precision. Furthermore, MC-GCN exhibits exceptional performance in both precision (99.87%) and recall (99.88%), indicating its capability to reduce false positive rates while effectively capturing positive class samples, thereby optimizing the classifier’s discriminative ability. Additionally, MC-GCN achieves an F1-score of 99.87%, demonstrating optimal balance between precision and recall, which confirms its outstanding accuracy and sustained high-efficiency classification performance. The experimental evaluation in this study used 5-fold cross-validation (k = 5), ensuring the robustness of the model’s performance across different data splits. These results collectively establish MC-GCN as a method with superior comprehensive performance compared with existing technologies.
Moreover, Figure 8 illustrates the confusion matrix of the proposed model on the test set. The results reveal that MC-GCN exhibits exceptional classification accuracy and robustness, particularly in distinguishing between BENIGN and APT classes. The low misclassification rates (both false positives and false negatives are minimal) further validate the model’s outstanding detection capability, making it highly suitable for high-precision classification tasks.
In addition to detection performance, we evaluated the computational efficiency of the proposed MC-GCN model to assess its suitability for practical deployment. The model was trained on a workstation equipped with an Intel® Core™ i9-13900K CPU, NVIDIA RTX 4090 GPU, and 64 GB of RAM. Under this setup, training the MC-GCN model on the reconstructed CIC-IDS2017 dataset took approximately 92 min for 200 epochs. The average inference latency was measured at 0.46 milliseconds per sample, enabling near-real-time detection capabilities. Despite the model’s architectural complexity—due to the integration of multi-scale convolution, channel attention, and graph convolution modules—its performance remains efficient and scalable, benefiting from parallelized GPU computations and optimized feature encoding. These results demonstrate that the MC-GCN model strikes an effective balance between detection accuracy and computational overhead, making it suitable not only for offline analytical tasks but also for semi-real-time intrusion detection scenarios.

4.4. Ablation Studies

4.4.1. Ablation Study of MF-CGAN

To verify the impact of data reconstruction in Section 3.1 on APT attack detection, Figure 8b presents the confusion matrix before balancing the dataset. It can be seen that when the original dataset is used for APT attack detection, there are certain biases in the model’s performance. Specifically, although most of the BENIGN samples are accurately classified (9049 correct predictions), there are still large errors in the prediction of APT class samples. Among them, 578 APT samples are misclassified as the BENIGN class (false negatives). In addition, 21 BENIGN samples are misclassified as APT (false positives), which indicates that in the case of data imbalance, the model has difficulty effectively distinguishing the minority-class APT attack samples, resulting in performance degradation. To solve this problem, the research further applies MF-CGAN to perform data reconstruction on the imbalanced dataset. Table 9 shows the evaluation results after applying MF-CGAN to process the imbalanced dataset. After the data is processed by MF-CGAN, the model has excellent detection performance. In particular, the recall rate increases from 74.22% of the original dataset to 99.88%, indicating that the model effectively solves the difficulty of detecting minority-class samples caused by dataset class imbalance, thereby improving the model’s ability to identify APT attacks. In addition, the significant improvement of other indicators also proves that the MF-CGAN model has significant advantages in the attack detection task.

4.4.2. Ablation Study of MC-GCN Model

To conduct an in-depth evaluation of the contributions of each model component to the performance of the MC-GCN method, this paper carried out ablation experiments. By gradually removing the key components from the model, the impact of each component on the overall performance of the model can be quantitatively analyzed. The ablation experiments include the following models:
MC-GCN: The complete model that encompasses all components and design choices.
MGCN: The model with the channel attention mechanism removed.
GCN: The model with the multi-scale convolution component removed.
Figure 9 shows the ROC curves of different models. It can be seen that the MC-GCN model performs well on the ROC curve. After removing the key components, the AUC values of other models have significantly decreased. Table 10 provides the confidence intervals. As shown, the MC-GCN method demonstrates statistically significant improvements over both MGCN and GCN, with performance gains of 1.47% (p < 0.05) and 1.87% (p < 0.05), respectively, as confirmed by non-overlapping confidence intervals, indicating large effect sizes. While the comparison between MGCN and GCN shows no significant difference, suggesting that the multi-scale convolution component alone provides only modest improvements, the integration of the channel attention mechanism in MC-GCN leads to substantial and statistically significant performance gains. A computational cost analysis was also conducted to assess the trade-offs between performance improvements and computational complexity across the different architectures. While the MC-GCN demonstrates significant gains in accuracy, it incurs a slightly higher computational cost relative to MGCN and GCN due to the integration of the additional channel attention mechanism. Specifically, the associated overhead in terms of memory usage and processing time is estimated to be approximately 5–10% higher than that of the baseline models. Nevertheless, this trade-off is considered acceptable given the substantial improvements in model accuracy and the reduction in error rates, which are particularly crucial in security-related applications. In addition, the above provides the confusion matrices of each model in the ablation experiments. The classification performance of the MGCN and GCN models has declined to a certain extent. The experimental results indicate that when the key components of the proposed model are removed, the performance will significantly decline, which fully demonstrates the positive contributions of each proposed component to the model performance. The channel attention mechanism and the multi-scale convolution module not only enhance the model’s feature representation ability but also enable it to perform well in the detection task of minority-class attack samples. Therefore, the design of the MC-GCN model is an effective combination strategy that can provide significant advantages in high - precision attack detection tasks.

5. Conclusions and Future Work

The MF-CGAN and MC-GCN models proposed in this paper provide innovative solutions for APT attack detection. MF-CGAN combines feature engineering with conditional generative adversarial networks (CGANs) to construct a category-balanced and effective dataset, enhancing the diversity of training data, particularly optimizing the generation of minority-class samples. MC-GCN integrates multi-scale convolution, channel attention mechanisms, and graph convolutional networks, achieving significant improvements in feature extraction and representation learning for network traffic data, thereby increasing the accuracy of APT attack detection. Experimental results on the reconstructed CIC-IDS2017 dataset show that the MC-GCN model achieves an accuracy of 99.87%, significantly outperforming existing mainstream methods, especially excelling in the detection of minority-class attacks. Furthermore, the model’s advantages in key metrics such as precision (99.87%) and recall (99.88%) further demonstrate its efficiency and robustness in addressing complex attack patterns, highlighting its high innovation and application value. Overall, the integration of data-level balancing and architectural duality demonstrates a multilayered expression of symmetry—spanning data distributions, model components, and feature representation—which aligns with the foundational principles of symmetry-aware learning systems.
While the proposed model demonstrates strong performance, there are several potential limitations in real-world deployment scenarios: (1) Class imbalance: The model may struggle to detect attacks in datasets with highly imbalanced classes, where certain attack types are underrepresented or absent from the training data. (2) Dataset expansion and real-world challenges: The current evaluation is based on the CIC-IDS2017 dataset, which, while comprehensive, may not fully capture all possible attack vectors encountered in real-world environments. Therefore, our model’s generalizability across different datasets is crucial for real-world deployment. A broader evaluation on diverse datasets, such as KDD99 or NSL-KDD, will help identify and address potential deployment challenges related to variations in data quality, attack patterns, and environmental conditions. (3) Scalability: The computational demands of training the model, especially for large datasets, can pose challenges for real-time applications. Optimizing for scalability while maintaining detection accuracy is an area for future research.
In the future, research will focus on optimizing the architecture of generative adversarial networks (GANs) to enhance the stability and quality of generated samples. Additionally, given the complexity and diversity of APT attacks, more diverse real-world network traffic datasets will be introduced to evaluate the generalization capability of the proposed models, particularly their adaptability and effectiveness in detecting different types of APT attacks, including zero-day attacks. Exploring zero-day attack detection will be a key area of future work, as these types of attacks are typically more difficult to detect due to their unknown nature and novel patterns.

Author Contributions

Conceptualization, Q.L. (Qi Liu); investigation, Q.L. (Qi Liu) and J.W.; funding acquisition, Q.L. (Qi Liu), J.W. and L.N.; methodology, Y.D.; software, Y.D. and J.W.; validation, Y.D. and C.Z.; writing—original draft, Y.D.; supervision, H.D. and C.Z.; project administration, H.D. and C.Z.; writing—review and editing, H.D.; data curation, J.W. and Q.L. (Qiqi Liang); formal analysis, L.N.; resources, L.N. and Q.L. (Qiqi Liang). All authors have read and agreed to the published version of the manuscript.

Funding

This research was funded by the Tianjin Municipal Science and Technology Program (Grant No. 23YDTPJC00350).

Data Availability Statement

Original contributions introduced in this study are included in the article. For further inquiries, please contact the corresponding author directly. This research utilized the publicly available dataset: CIC-IDS2017. The CIC-IDS2017 dataset is provided by the Canadian Institute for Cybersecurity. Detailed information and download options can be obtained at the following https://www.unb.ca/cic/datasets/ids-2017.html (accessed on 30 March 2024).

Conflicts of Interest

The authors declare no conflicts of interest.

References

  1. Alshamrani, A.; Myneni, S.; Chowdhary, A.; Huang, D. A survey on advanced persistent threats: Techniques, solutions, challenges, and research opportunities. IEEE Commun. Surv. Tutor. 2019, 21, 1851–1877. [Google Scholar] [CrossRef]
  2. Talib, M.A.; Nasir, Q.; Nassif, A.B.; Mokhamed, T.; Ahmed, N.; Mahfood, B. APT beaconing detection: A systematic review. Comput. Secur. 2022, 122, 102875. [Google Scholar] [CrossRef]
  3. Cole, E. Advanced Persistent Threat: Understanding the Danger and How to Protect Your Organization; Newnes: Oxford, UK, 2012. [Google Scholar]
  4. Sharma, A.; Gupta, B.B.; Singh, A.K.; Saraswat, V.K. Advanced persistent threats (apt): Evolution, anatomy, attribution and countermeasures. J. Ambient. Intell. Humaniz. Comput. 2023, 14, 9355–9381. [Google Scholar] [CrossRef]
  5. Malik, V.; Khanna, A.; Sharma, N. Advanced Persistent Threats (APTs): Detection Techniques and Mitigation Strategies. Int. J. Glob. Innov. Solut. (IJGIS) 2024. [Google Scholar] [CrossRef]
  6. Van Duong, L.; Nikolaevich, T.V.; Do, H.; Long, N.Q.D.; Hoang, N.Q. Detecting APT attacks based on network flow. Int. J. Emerg. Trends Eng. Res. 2020, 8, 3134–3139. [Google Scholar] [CrossRef]
  7. Sauber-Cole, R.; Khoshgoftaar, T.M. The use of generative adversarial networks to alleviate class imbalance in tabular data: A survey. J. Big Data 2022, 9, 98. [Google Scholar] [CrossRef]
  8. Akbar, K.A.; Wang, Y.; Islam, M.S.; Singhal, A.; Khan, L.; Thuraisingham, B. Identifying tactics of advanced persistent threats with limited attack traces. In Proceedings of the Information Systems Security: 17th International Conference, ICISS 2021, Patna, India, 16–20 December 2021; Proceedings 17. Springer International Publishing: Berlin/Heidelberg, Germany, 2021; pp. 3–25. [Google Scholar] [CrossRef]
  9. Xuan, C.D.; Cuong, N.H. A novel approach for APT attack detection based on feature intelligent extraction and representation learning. PLoS ONE 2024, 19, e0305618. [Google Scholar] [CrossRef]
  10. Bilot, T.; El Madhoun, N.; Al Agha, K.; Zouaoui, A. Graph neural networks for intrusion detection: A survey. IEEE Access 2023, 11, 49114–49139. [Google Scholar] [CrossRef]
  11. Goodfellow, I.; Pouget-Abadie, J.; Mirza, M.; Xu, B.; Warde-Farley, D.; Ozair, S.; Courville, A.; Bengio, Y. Generative adversarial nets. Adv. Neural Inf. Process. Syst. 2014, 27, 139–144. [Google Scholar] [CrossRef]
  12. Lee, J.H.; Park, K.H. GAN-based imbalanced data intrusion detection system. Pers. Ubiquitous Comput. 2021, 25, 121–128. [Google Scholar] [CrossRef]
  13. Sharafaldin, I.; Lashkari, A.H.; Ghorbani, A.A. Toward generating a new intrusion detection dataset and intrusion traffic characterization. In Proceedings of the 4th International Conference on Information Systems Security and Privacy-ICISSP, Funchal, Portugal, 22–24 January 2018; Volume 1, pp. 108–116. [Google Scholar] [CrossRef]
  14. Lin, Z.; Shi, Y.; Xue, Z. Idsgan: Generative adversarial networks for attack generation against intrusion detection. In Proceedings of the Pacific-Asia Conference on Knowledge Discovery and Data Mining, Chengdu, China, 16–19 May 2022; Springer International Publishing: Cham, Switzerland, 2022; pp. 79–91. [Google Scholar] [CrossRef]
  15. Zheng, M.; Li, T.; Zhu, R.; Tang, Y.; Tang, M.; Lin, L.; Ma, Z. Conditional Wasserstein generative adversarial network-gradient penalty-based approach to alleviating imbalanced data classification. Inf. Sci. 2020, 512, 1009–1023. [Google Scholar] [CrossRef]
  16. Mirza, M. Conditional generative adversarial nets. arXiv 2014, arXiv:1411.1784. [Google Scholar] [CrossRef]
  17. Dlamini, G.; Fahim, M. DGM: A data generative model to improve minority class presence in anomaly detection domain. Neural Comput. Appl. 2021, 33, 13635–13646. [Google Scholar] [CrossRef]
  18. Lee, J.H.; Park, K.H. AE-CGAN model based high performance network intrusion detection system. Appl. Sci. 2019, 9, 4221. [Google Scholar] [CrossRef]
  19. Yang, Y.; Liu, X.; Wang, D.; Sui, Q.; Yang, C.; Li, H.; Li, Y.; Luan, T. A CE-GAN based approach to address data imbalance in network intrusion detection systems. Sci. Rep. 2025, 15, 7916. [Google Scholar] [CrossRef] [PubMed]
  20. Douzas, G.; Bacao, F. Effective data generation for imbalanced learning using conditional generative adversarial networks. Expert Syst. Appl. 2018, 91, 464–471. [Google Scholar] [CrossRef]
  21. Yeo, M.; Koo, Y.; Yoon, Y.; Hwang, T.; Ryu, J.; Song, J.; Park, C. Flow-based malware detection using convolutional neural network. In Proceedings of the 2018 International Conference on Information Networking (ICOIN), Chiang Mai, Thailand, 10–12 January 2018; pp. 910–913. [Google Scholar] [CrossRef]
  22. Sun, P.; Liu, P.; Li, Q.; Liu, C.; Lu, X.; Hao, R.; Chen, J. DL-IDS: Extracting Features Using CNN-LSTM Hybrid Network for Intrusion Detection System. Secur. Commun. Netw. 2020, 2020, 8890306. [Google Scholar] [CrossRef]
  23. Vinayakumar, R.; Soman, K.P.; Poornachandran, P. Applying convolutional neural network for network intrusion detection. In Proceedings of the 2017 International Conference on Advances in Computing, Communications and Informatics (ICACCI), Udupi, India, 13–16 September 2017; pp. 1222–1228. [Google Scholar] [CrossRef]
  24. Hassan, M.M.; Gumaei, A.; Alsanad, A.; Alrubaian, M.; Fortino, G. A hybrid deep learning model for efficient intrusion detection in big data environment. Inf. Sci. 2020, 513, 386–396. [Google Scholar] [CrossRef]
  25. Gautam, S.; Henry, A.; Zuhair, M.; Rashid, M.; Javed, A.R.; Maddikunta, P.K.R. A composite approach of intrusion detection systems: Hybrid RNN and correlation-based feature optimization. Electronics 2022, 11, 3529. [Google Scholar] [CrossRef]
  26. Zhang, K.; Zheng, R.; Li, C.; Zhang, S.; Wu, X.; Sun, S.; Yang, J.; Zheng, J. SE-DWNet: An Advanced ResNet-Based Model for Intrusion Detection with Symmetric Data Distribution. Symmetry 2025, 17, 526. [Google Scholar] [CrossRef]
  27. Manocchio, L.D.; Layeghy, S.; Lo, W.W.; Kulatilleke, G.K.; Sarhan, M.; Portmann, M. Flowtransformer: A transformer framework for flow-based network intrusion detection systems. Expert Syst. Appl. 2024, 241, 122564. [Google Scholar] [CrossRef]
  28. Liu, Y.; Wu, L. Intrusion detection model based on improved transformer. Appl. Sci. 2023, 13, 6251. [Google Scholar] [CrossRef]
  29. Ibrahim, N.; Shehmir, S.; Yadav, A.; Kashef, R. A Transformer-Based Model for Network Intrusion Detection: Architecture, Classification Heads, and Transformer Blocks. In Proceedings of the International IOT, Electronics and Mechatronics Conference; Springer Nature: Singapore, 2024; pp. 149–163. [Google Scholar] [CrossRef]
  30. Kipf, T.N.; Welling, M. Semi-supervised classification with graph convolutional networks. arXiv 2016, arXiv:1609.02907. [Google Scholar] [CrossRef]
  31. Do Xuan, C.; Dao, M.H.; Nguyen, H.D. APT attack detection based on flow network analysis techniques using deep learning. J. Intell. Fuzzy Syst. 2020, 39, 4785–4801. [Google Scholar] [CrossRef]
  32. Zhou, J.; Xu, Z.; Rush, A.M.; Yu, M. Automating botnet detection with graph neural networks. arXiv 2020, arXiv:2003.06344. [Google Scholar] [CrossRef]
  33. Wang, H.; Wan, L.; Yang, X. Defending Graph Neural Networks Against Backdoor Attacks via Symmetry-Aware Graph Self-Distillation. Symmetry 2025, 17, 735. [Google Scholar] [CrossRef]
  34. Ding, Q.; Li, J. AnoGLA: An efficient scheme to improve network anomaly detection. J. Inf. Secur. Appl. 2022, 66, 103149. [Google Scholar] [CrossRef]
  35. Ren, W.; Song, X.; Hong, Y.; Lei, Y.; Yao, J.; Du, Y.; Li, W. APT Attack Detection Based on Graph Convolutional Neural Networks. Int. J. Comput. Intell. Syst. 2023, 16, 184. [Google Scholar] [CrossRef]
  36. Xuan, C.D.; Nguyen, T.T. A novel approach for APT attack detection based on an advanced computing. Sci. Rep. 2024, 14, 22223. [Google Scholar] [CrossRef]
  37. Nguyen, H.C.; Xuan, C.D.; Nguyen, L.T.; Nguyen, H.D. A new framework for APT attack detection based on network traffic. J. Intell. Fuzzy Syst. 2023, 44, 3459–3474. [Google Scholar] [CrossRef]
  38. Lewis-Beck, M.S.; Bryman, A.; Liao, T.F. Encyclopedia of Social Science Research Methods; Sage Publishing: New York, NY, USA, 2004; pp. 1143–1144. [Google Scholar] [CrossRef]
  39. Riyaz, B.; Ganapathy, S. A deep learning approach for effective intrusion detection in wireless networks using CNN. Soft Comput. 2020, 24, 17265–17278. [Google Scholar] [CrossRef]
  40. Bakhshi, T.; Ghita, B. Anomaly detection in encrypted internet traffic using hybrid deep learning. Secur. Commun. Netw. 2021, 2021, 5363750. [Google Scholar] [CrossRef]
  41. Halbouni, A.; Gunawan, T.S.; Habaebi, M.H.; Halbouni, M.; Kartiwi, M.; Ahmad, R. CNN-LSTM: Hybrid deep neural network for network intrusion detection system. IEEE Access 2022, 10, 99837–99849. [Google Scholar] [CrossRef]
Figure 1. Flowchart of data reconstruction.
Symmetry 17 01026 g001
Figure 2. MF-CGAN model Architecture Diagram.
Symmetry 17 01026 g002
Figure 3. MC-GCN model architecture diagram.
Symmetry 17 01026 g003
Figure 4. Graph construction.
Symmetry 17 01026 g004
Figure 5. Confusion matrix.
Symmetry 17 01026 g005
Figure 6. Comparison of imbalanced vs. balanced class distribution.
Symmetry 17 01026 g006
Figure 7. Machine learning model performance comparison.
Symmetry 17 01026 g007
Figure 8. Confusion Matrix of different models. (a) is the confusion matrix of the MC-GCN model; (b) is the confusion matrix of original dataset predictions; (c) is the confusion matrix of the MGCN model; (d) is the confusion matrix of the GCN model.
Symmetry 17 01026 g008
Figure 9. ROC curves of different models.
Symmetry 17 01026 g009
Table 1. Comparison of latest approaches with the proposed MC-GCN model.
ReferenceYearMethodDataset(s)Imbalance HandlingLimitation
Lee et al. [12]2021GAN-based (CGAN)NSL-KDD, CIC-IDS2017GAN-based data augmentationData redundancy, model instability
Yang et al. [19]2025GAN-based (CE-GAN)CIC-IDS2017, UNSW-NB15GAN-based data augmentationHigh complexity, training cost
Gautam et al. [25]2022Feature-based (Hybrid RNN + Correlation)NSL-KDD, UNSW-NB15, CIC-IDS2017Hybrid feature optimizationHigh computational demand
Zhang et al. [26]2025Attention-based (SE-DWNet)CSE-CIC-IDS2018, ToN-IoTSymmetric data distributionSlow inference, complexity
Manocchio et al. [27]2024Attention-based (FlowTransformer)CIC-IDS2017, IoT datasetsGlobal average pooling (GAP)Poor performance in NIDS, suboptimal in data imbalance
Xuan et al. [36]2024GNN-based (Graph-based APT Detection)UNSW-NB15, CSE-CIC-IDS2018Graph-based sampling and GCNLimited dataset adaptability
Ren et al. [35]2023GNN-based (GCN for APT Detection)ToN-IoT, NSL-KDDGraph-based data augmentationSlow training time, high resource consumption
Proposed MC-GCN2025Hybrid (MF-CGAN + GCN + Multi-scale CNN)CIC-IDS2017MF-CGAN-based synthetic data generation-
Note: GAN = generative adversarial network; RNN = recurrent neural network; GCN = graph convolutional network; SE = squeeze and excitation.
Table 2. Daily label of dataset.
DayAttack Type(s)Attack DetailsSize
MondayBenign Traffic11 G
TuesdayBrute Force AttacksSFTP, SSH11 G
WednesdayDoS, HeartbleedSlowloris, Slowhttptest, Hulk, GoldenEye13 G
ThursdayWeb, InfiltrationWeb BForce, XSS, SQL Injection, Dropbox, Cool Disk7.8 G
FridayDDoS, Botnet, ScanLOIT, ARES Botnet, PortScan8.3 G
Note: LOIT = low orbit ion cannon; SQL = structured query language; XSS = cross-site scripting; Web BForce = web brute force. Attack types are grouped by traffic scenario for each weekday.
Table 3. Hyperparameters used in the MF-CGAN model for both the generator and discriminator.
ParameterGeneratorDiscriminator
Learning rate0.00050.0005
Epochs20002000
OptimizerSGDSGD
Layers44
Input layer neurons3335
Layer 1 neurons128512
Layer 2 neurons256256
Layer 3 neurons512128
Layer 4 neurons341
Output layer neurons351
Batch size128128
Random noise dimension32
ActivationReLUReLU
Note: Bold indicates activation function used in each model component. ‘–’ means not applicable.
Table 4. Hyperparameters used in the MC-GCN model.
ParameterValue
Learning rate0.005
Epochs200
OptimizerAdam
Loss functionCross-entropy
Batch size32
ActivationReLU
Note: Bold font indicates the activation function used in the model.
Table 5. Class percentage distribution of the CICIDS2017 dataset.
ClassOriginal CountOriginal Ratio (%)Balanced CountBalanced Ratio (%)
BENIGN2,271,31180.3189227,13244.1094
DoS_Hulk230,1248.137767,96513.1989
PortScan158,8045.615760,54911.7587
DDoS128,0254.527357,68811.2031
DoS_GoldenEye10,2930.364026,3515.1174
FTPPatator79350.280620,3823.9582
SSHPatator58970.208515,2652.9645
DoS_slowloris57960.205014,7932.8728
DoS_Slowhttptest54990.194514,1692.7516
Bot19560.069249820.9675
Web_Attack_Brute_Force15070.053338260.7430
Web_Attack_XSS6520.023116590.3222
Infiltration360.0013800.0155
Web_Attack_Sql_Injection210.0007610.0118
Heartbleed110.0004270.0052
Note: Original and balanced class distributions are shown for training consistency. Underscore characters are retained in class names to match the original CIC-IDS2017 label notation.
Table 6. Classification results on balanced data.
ClassRFDTSVCMLP
Prec. Rec. F1 Prec. Rec. F1 Prec. Rec. F1 Prec. Rec. F1
Bot1.001.001.001.001.001.000.970.990.981.001.001.00
DDoS0.981.000.990.981.000.990.980.940.960.981.000.99
DoS_GoldenEye1.001.001.001.001.001.000.990.980.991.001.001.00
DoS_Hulk1.000.990.990.990.990.990.900.980.930.960.920.94
DoS_Slowhttptest0.991.001.000.980.990.990.930.940.930.880.970.92
DoS_slowloris1.001.001.001.001.001.001.001.001.001.001.001.00
FTPPatator1.001.001.001.001.001.001.001.001.001.001.001.00
Heartbleed1.000.810.900.500.730.600.070.730.130.880.640.74
Infiltration1.001.001.001.001.001.001.001.001.001.001.001.00
PortScan0.981.000.990.980.990.990.980.970.980.981.000.99
SSHPatator0.730.800.760.730.730.731.000.150.250.690.950.80
Web_Attack_Brute_Force1.000.500.670.570.670.620.040.670.080.000.000.00
Web_Attack_Sql_Injection0.470.330.380.420.420.420.340.980.500.780.040.07
Web_Attack_XSS0.981.000.990.990.990.990.951.000.980.991.000.99
Note: RF = random forest; DT = decision tree, SVC = support vector classifier; MLP = multilayer perceptron. Precision (Prec.), recall (Rec.), and F1-scores are reported per class.
Table 7. Weighted F1-score comparison of balancing methods.
Balancing MethodRFDTSVCMLP
SMOTEENN99.5999.4198.0898.96
Borderline-SMOTE99.7099.5697.5099.01
SVMSMOTE99.7299.4897.7799.01
MF-CGAN99.7799.7099.2899.42
Note: Results represent weighted F1-scores in percentage (%). The highest values for each classifier are highlighted in bold. RF = random forest, DT = decision tree, SVC = support vector classifier, MLP = multilayer perceptron.
Table 8. Performance comparison between the proposed model and baseline methods. All metrics are expressed as percentages (%).
ReferenceMethodAccuracyPrecisionRecallF1-Score
Riyaz B et al. [39]CNN86.4677.9491.0693.84
Bakhshi T et al. [40]CNN-GRU90.1792.3491.2492.05
Ding Q et al. [34]GCN99.2498.5098.6298.72
Halbouni A et al. [41]CNN-LSTM99.6499.5699.7099.60
 Our proposed method MC-GCN 99.87 99.87 99.88 99.87
Table 9. Impact of MF-CGAN application on detection performance. All metrics are expressed as percentages (%).
MethodAccuracyPrecisionRecallF1-Score
Original94.7098.7574.2284.75
 MF-CGAN 99.87 99.87 99.88 99.87
Table 10. Confidence intervals.
ModelAvgAcc95% Confidence Interval
  MC-GCN0.99712(0.99632, 0.99879)
  MGCN0.982387(0.97741, 0.98742)
  GCN0.978474(0.97353, 0.98341)
Disclaimer/Publisher’s Note: The statements, opinions and data contained in all publications are solely those of the individual author(s) and contributor(s) and not of MDPI and/or the editor(s). MDPI and/or the editor(s) disclaim responsibility for any injury to people or property resulting from any ideas, methods, instructions or products referred to in the content.

