Article

A Bridge Defect Detection Algorithm Based on UGMB Multi-Scale Feature Extraction and Fusion

School of Computer and Software Engineering, Huaiyin Institute of Technology, Huai’an 223003, China
*
Author to whom correspondence should be addressed.
Symmetry 2025, 17(7), 1025; https://doi.org/10.3390/sym17071025
Submission received: 27 May 2025 / Revised: 20 June 2025 / Accepted: 25 June 2025 / Published: 30 June 2025
(This article belongs to the Section Computer)

Abstract

Aiming at the problems of leakage and misdetection caused by insufficient multi-scale feature extraction and an excessive amount of model parameters in bridge defect detection, this paper proposes the AMSF-Pyramid-YOLOv11n model. First, a Cooperative Optimization Module (COPO) is introduced, which consists of the designed multi-level dilated shared convolution (FPSharedConv) and a dual-domain attention block. Through the joint optimization of FPSharedConv and a CGLU gating mechanism, the module significantly improves feature extraction efficiency and learning capability. Second, the Unified Global-Multiscale Bottleneck (UGMB) multi-scale feature pyramid designed in this study efficiently integrates the FCGL_MANet, WFU, and HAFB modules. By leveraging the symmetry of Haar wavelet decomposition combined with local-global attention, this module effectively addresses the challenge of multi-scale feature fusion, enhancing the model’s ability to capture both symmetrical and asymmetrical bridge defect patterns. Finally, an optimized lightweight detection head (LCB_Detect) is employed, which reduces the parameter count by 6.35% through shared convolution layers and separate batch normalization. Experimental results show that the proposed model achieves a mean average precision (mAP@0.5) of 60.3% on a self-constructed bridge defect dataset, representing an improvement of 11.3% over the baseline YOLOv11n. The model effectively reduces the false positive rate while improving the detection accuracy of bridge defects.

1. Introduction

With the long-term development of global transportation infrastructure, the issue of bridge “aging” has become increasingly severe. According to data from the World Road Association (PIARC), over 40% of bridges worldwide have exceeded their design service life and entered a high-risk period of structural performance degradation [1]. For example, in 2022, the collapse of the Seongsu Bridge in South Korea was caused by the aging and rupture of steel cables [2], and in 2023, a bridge collapse in Bihar, India, resulted in significant casualties [3]. These incidents highlight the severe consequences of failures in monitoring bridge structural defects. Traditional manual inspections rely heavily on experience and are inefficient in identifying concealed defects such as cracks, concrete deterioration, and steel corrosion. Moreover, they struggle to accurately detect defects of varying scales, making them inadequate for addressing the safety and maintenance needs of aging bridges [4,5]. The limitations of traditional methods have driven a strong demand for technological innovation, with deep learning becoming a focal point of research in this field.
In recent years, significant progress has been made in defect detection research within the field of concrete structural health monitoring using deep learning technologies. For instance, Fernandez et al. [6] introduced distributed fiber optic sensing technology into concrete structure monitoring, significantly enhancing the sensitivity to minor defects. Zhang et al. [7] proposed a real-time crack detection method based on a multi-task compressed sensing algorithm, which improves detection accuracy by enhancing sparse patterns in generative models while reducing data compression losses. Rao et al. [8] innovatively integrated attention-based R2U-Net with a random forest regressor, achieving outstanding high-precision performance in crack detection tasks. Flah et al. [9] developed an automated detection model based on image processing and deep learning, which improved the classification accuracy for crack length, width, and angle. Tang et al. [10] employed deep transfer learning methods to identify defects in prefabricated components, offering a new pathway for reliability detection in complex structural scenarios. Although these studies have advanced the field through algorithm optimization and cross-modal integration, challenges such as interference from complex backgrounds, capturing subtle features, and multi-scale defect recognition in bridge detection scenarios remain to be addressed.
Against this backdrop, the YOLO series object detection algorithms have brought new momentum to bridge defect detection [11]. However, it is important to note that bridge detection scenarios have unique characteristics. At the level of detection targets, defects exhibit multidimensional complexity, ranging from millimeter-scale micro-defects like early-stage cracks to meter-scale macro-damages like concrete cavities [12]. Furthermore, these defects are distributed on irregular structural surfaces, with irregular geometric shapes that are highly coupled with the background, distinguishing them from the linear distribution of road cracks and the planar features of PCB defects. At the level of environmental adaptability, challenging conditions such as suspended cables in high-altitude areas and water-related regions often involve uneven lighting, rain and fog blurring, motion blur, and perspective distortion, making image acquisition conditions far less stable than conventional detection scenarios [13]. At the level of accuracy requirements, bridge maintenance demands near-zero missed detection rates and precise differentiation between structural and non-structural defects [14,15]. The semantic understanding precision must meet engineering-grade safety standards, leaving far less tolerance for errors compared to other fields. These characteristics impose higher requirements on detection algorithms for multi-scale feature fusion capabilities, robustness in complex backgrounds, and semantic understanding precision.
Specifically, current detection algorithms face two major challenges: First, defects exhibit multi-scale features, including millimeter-scale fine cracks and meter-scale concrete cavities, with some defects distributed densely or in close proximity within images. Second, outdoor bridge environments are affected by uneven lighting, shadows, and other interferences (e.g., defect features blurred under strong light or detail loss in backlighting conditions) [16,17,18]. The existing YOLOv11n algorithm [19] has limitations in its multi-scale feature extraction mechanism, making it difficult to efficiently adapt to the detection demands of complex scenarios.
To address these industry challenges, this study explores solutions based on a dataset of 6300 real-world bridge defect images. This dataset closely replicates engineering scenarios, encompassing diverse lighting conditions (e.g., strong light, low light, backlight) and covering five types of defects: corrosion, cracks, concrete degradation, concrete cavities, and moisture. The dataset also features significant variations in defect scales and densely distributed spatial patterns. Based on this, the study focuses on improving the multi-scale feature extraction capabilities of the YOLOv11n algorithm by optimizing the network architecture. The aim is to enable the model to accurately capture features of defects at varying scales, overcome detection bottlenecks in scenarios involving complex lighting and densely distributed targets, and provide technological support for the intelligent and precise maintenance of aging bridges [20,21] Through innovative structural designs and algorithmic optimizations, this study seeks to enhance the model’s robustness and detection accuracy in complex scenarios, advancing bridge maintenance towards intelligent and refined operations. The main contributions of this paper are as follows:
(1)
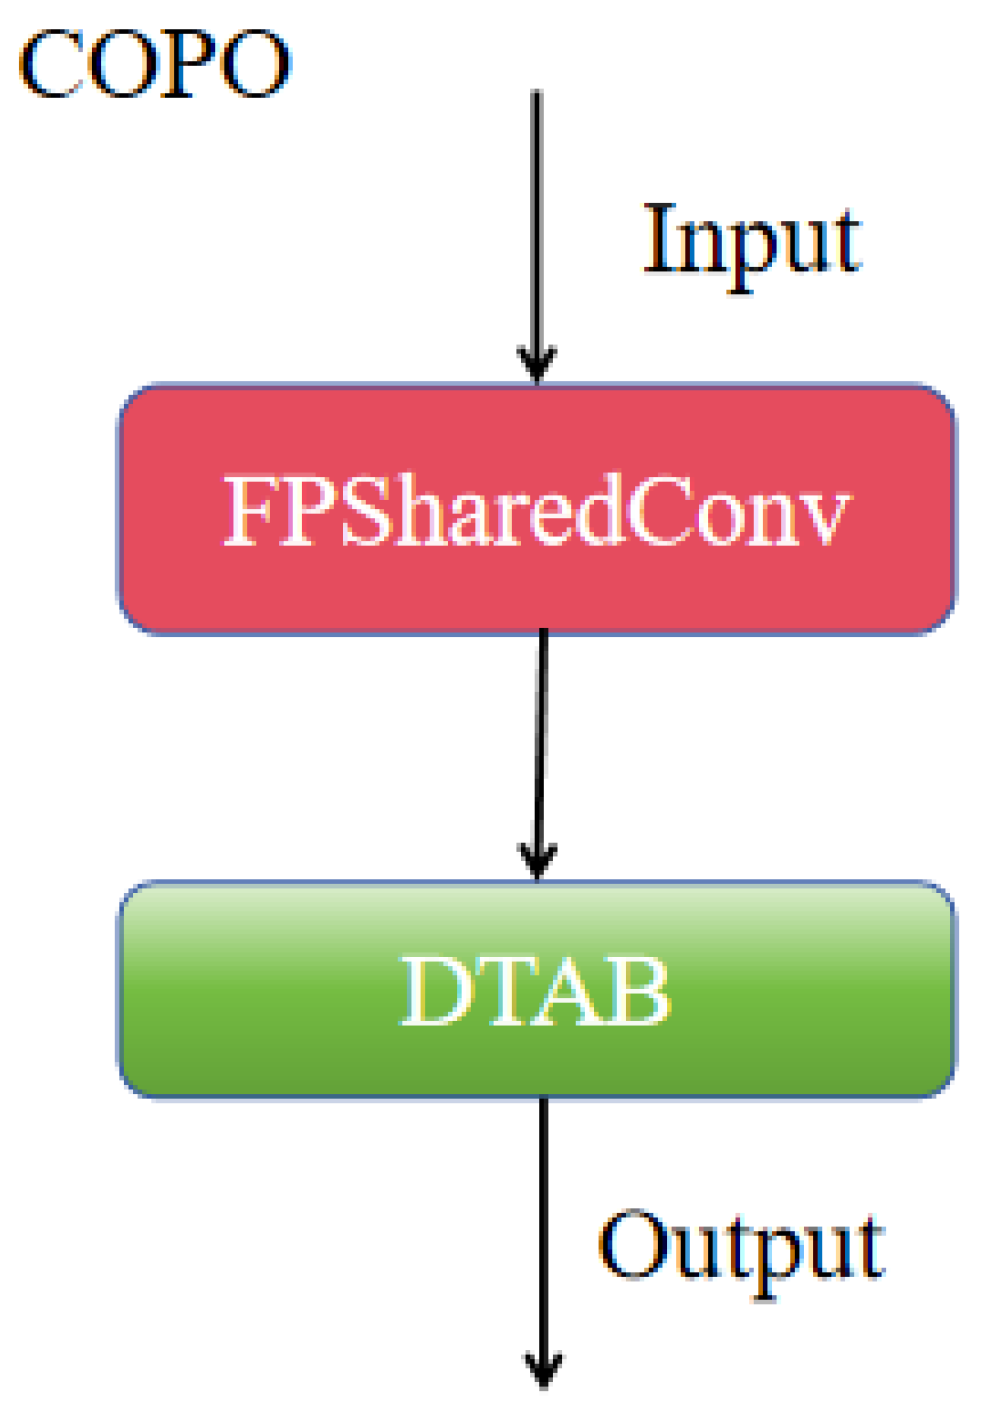
Collaborative Optimization Module (COPO): The designed COPO module incorporates the proposed FPSharedConv and DATB modules to capture multi-scale feature information as well as local and global feature information. This collaborative optimization module expands the receptive field while enhancing feature learning capabilities, effectively improving the detection capability for multi-scale targets.
(2)
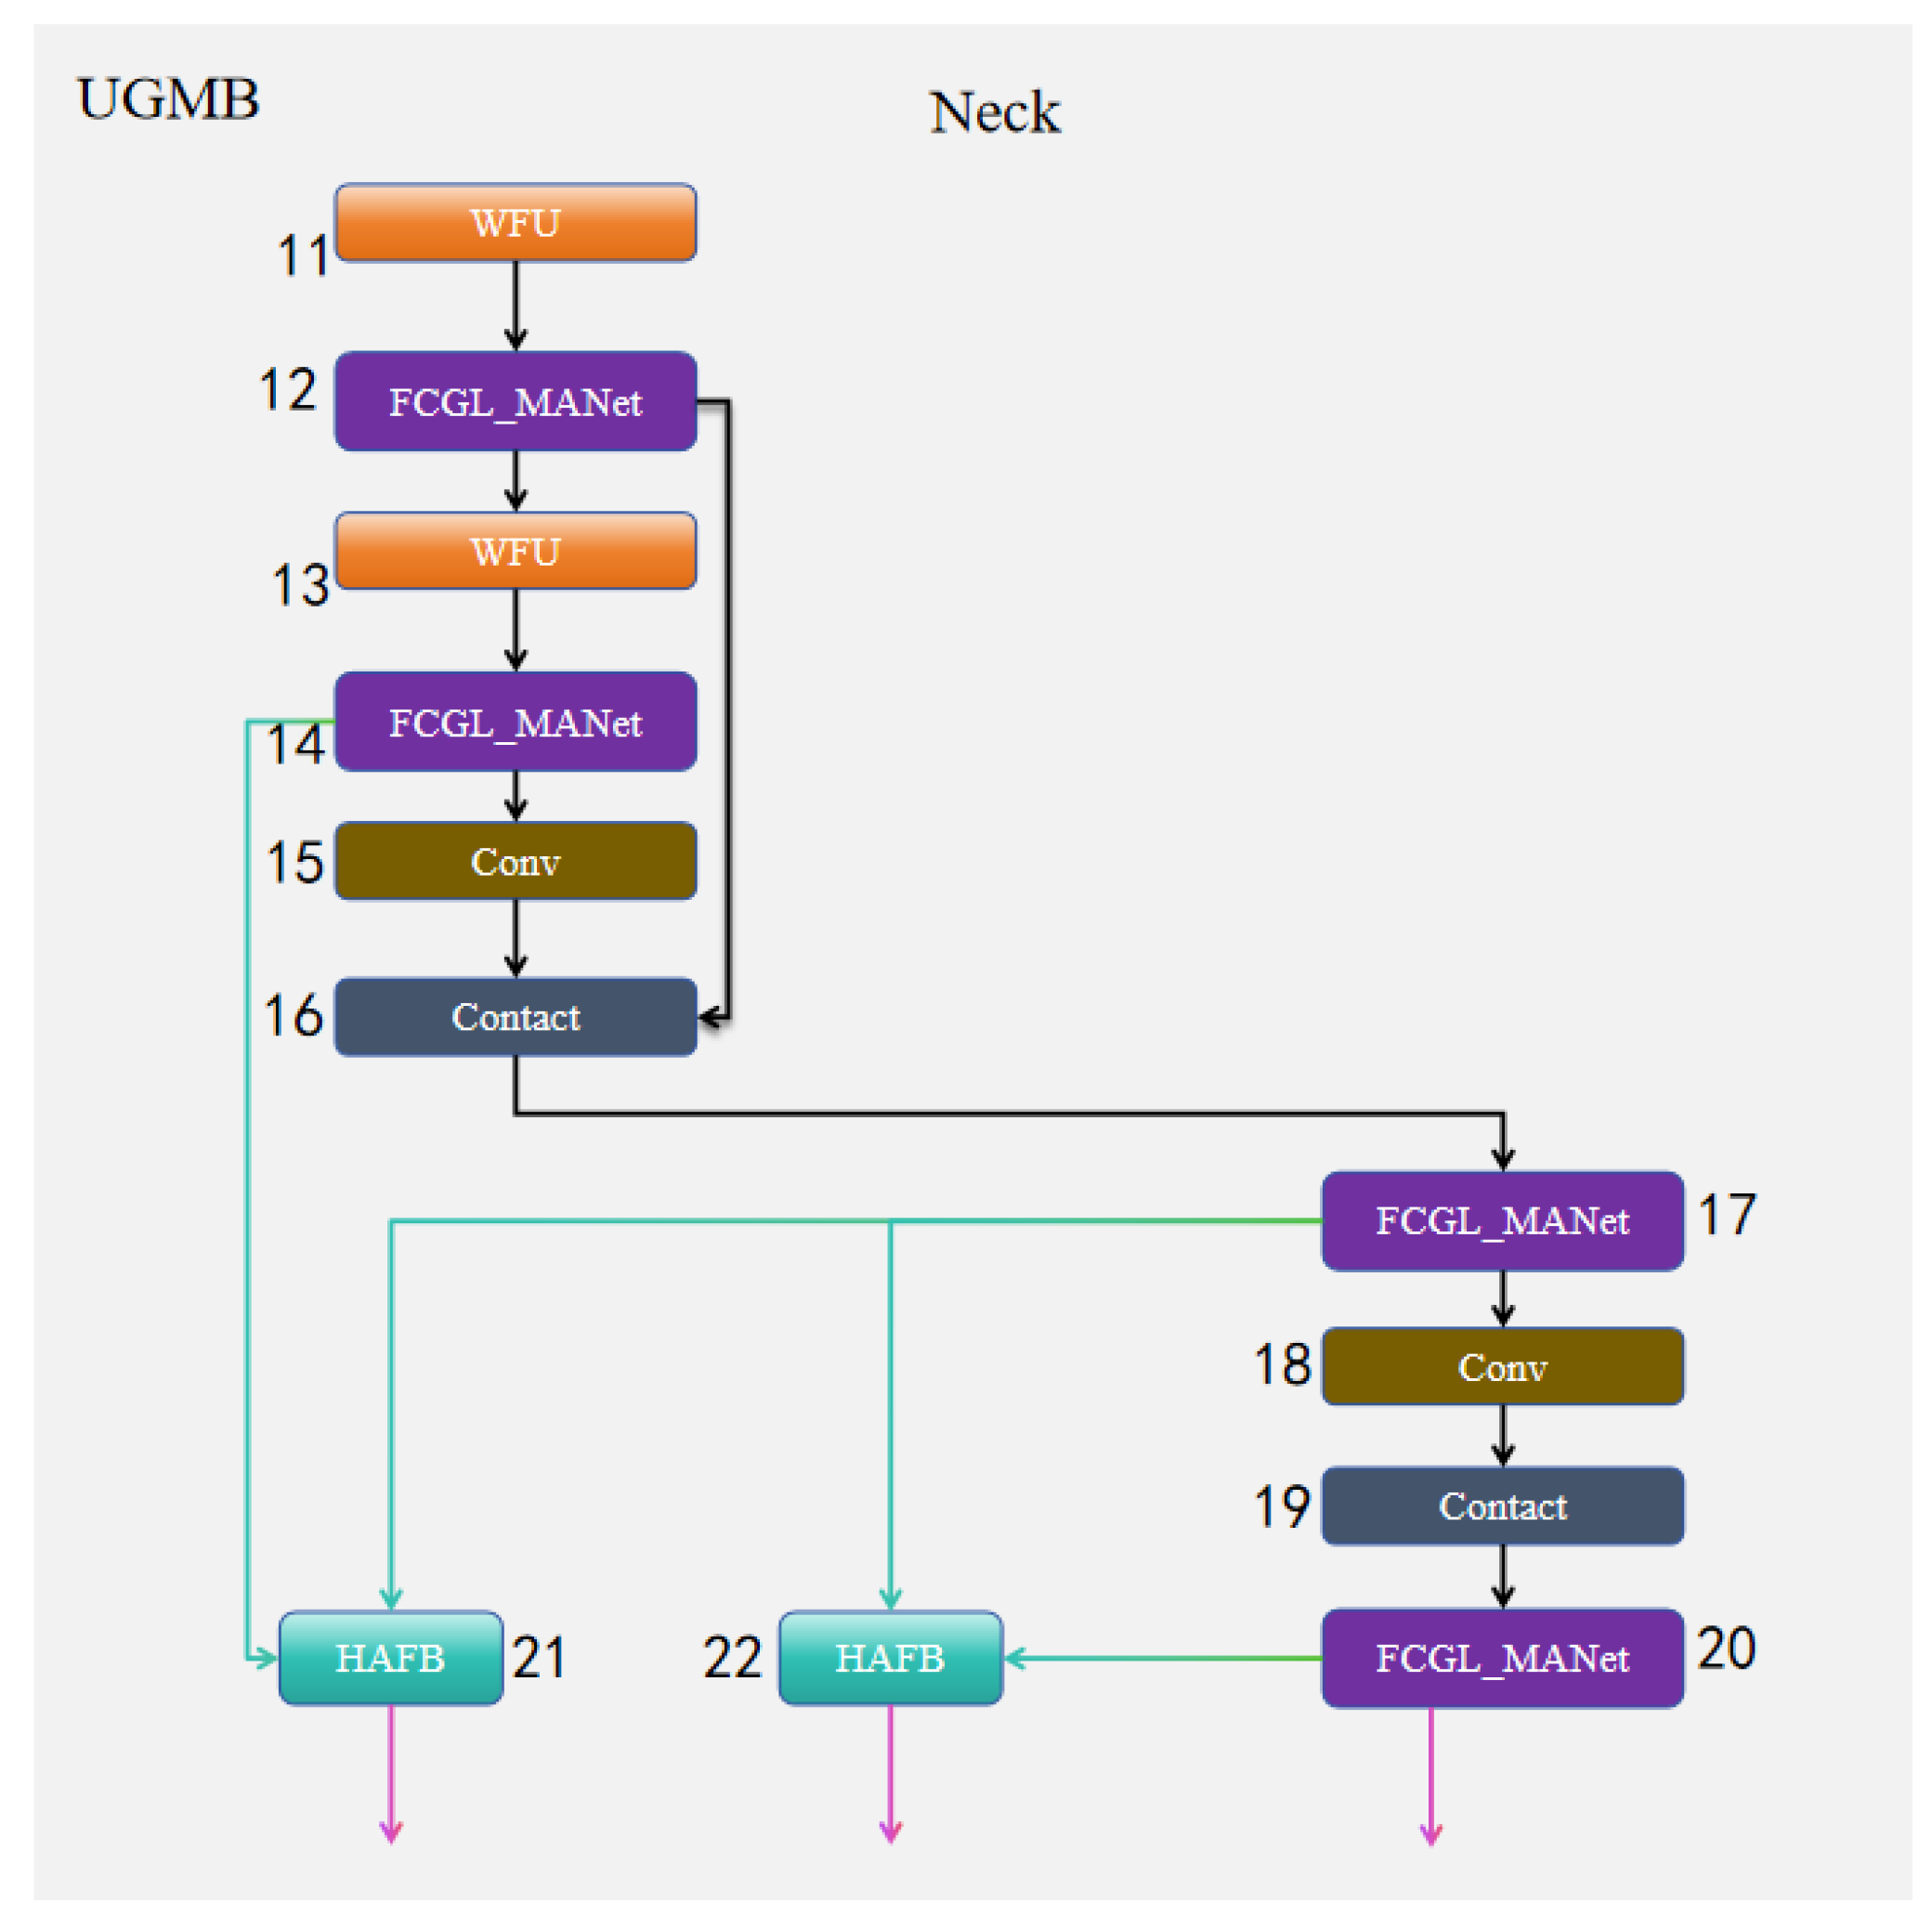
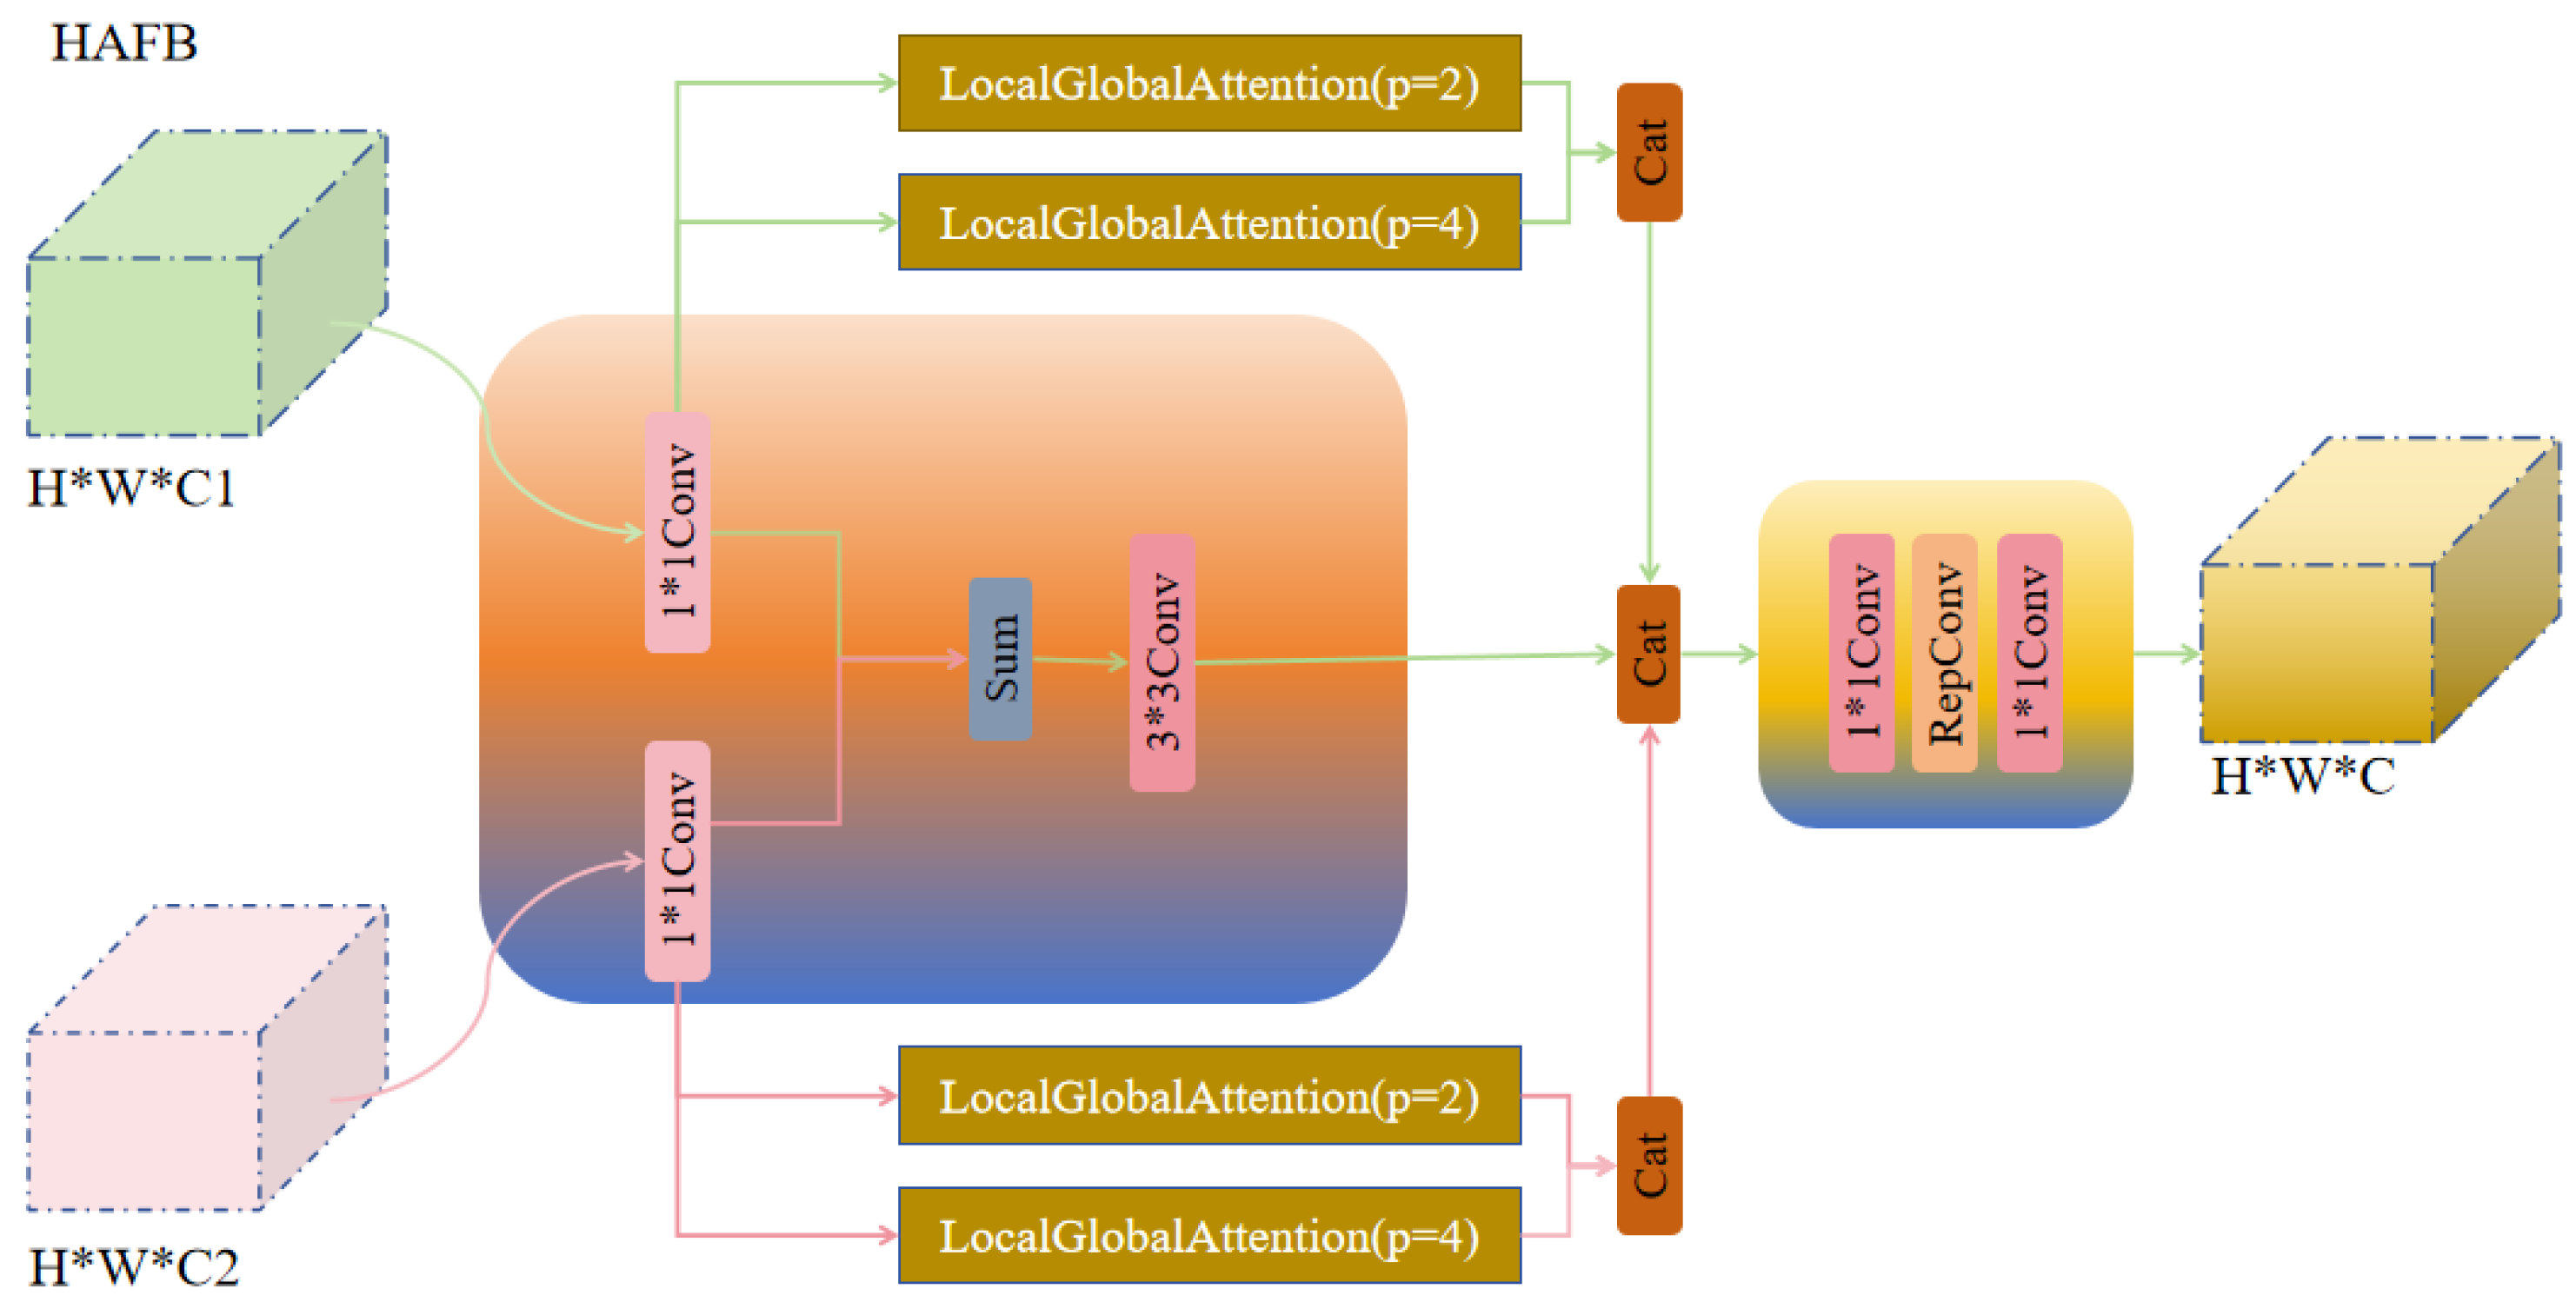
UGMB Feature Pyramid Module: The proposed UGMB module combines multi-scale feature fusion, local feature enhancement, and global attention mechanisms to strengthen feature representation capabilities, thereby improving the detection accuracy and computational efficiency of the model.
(3)
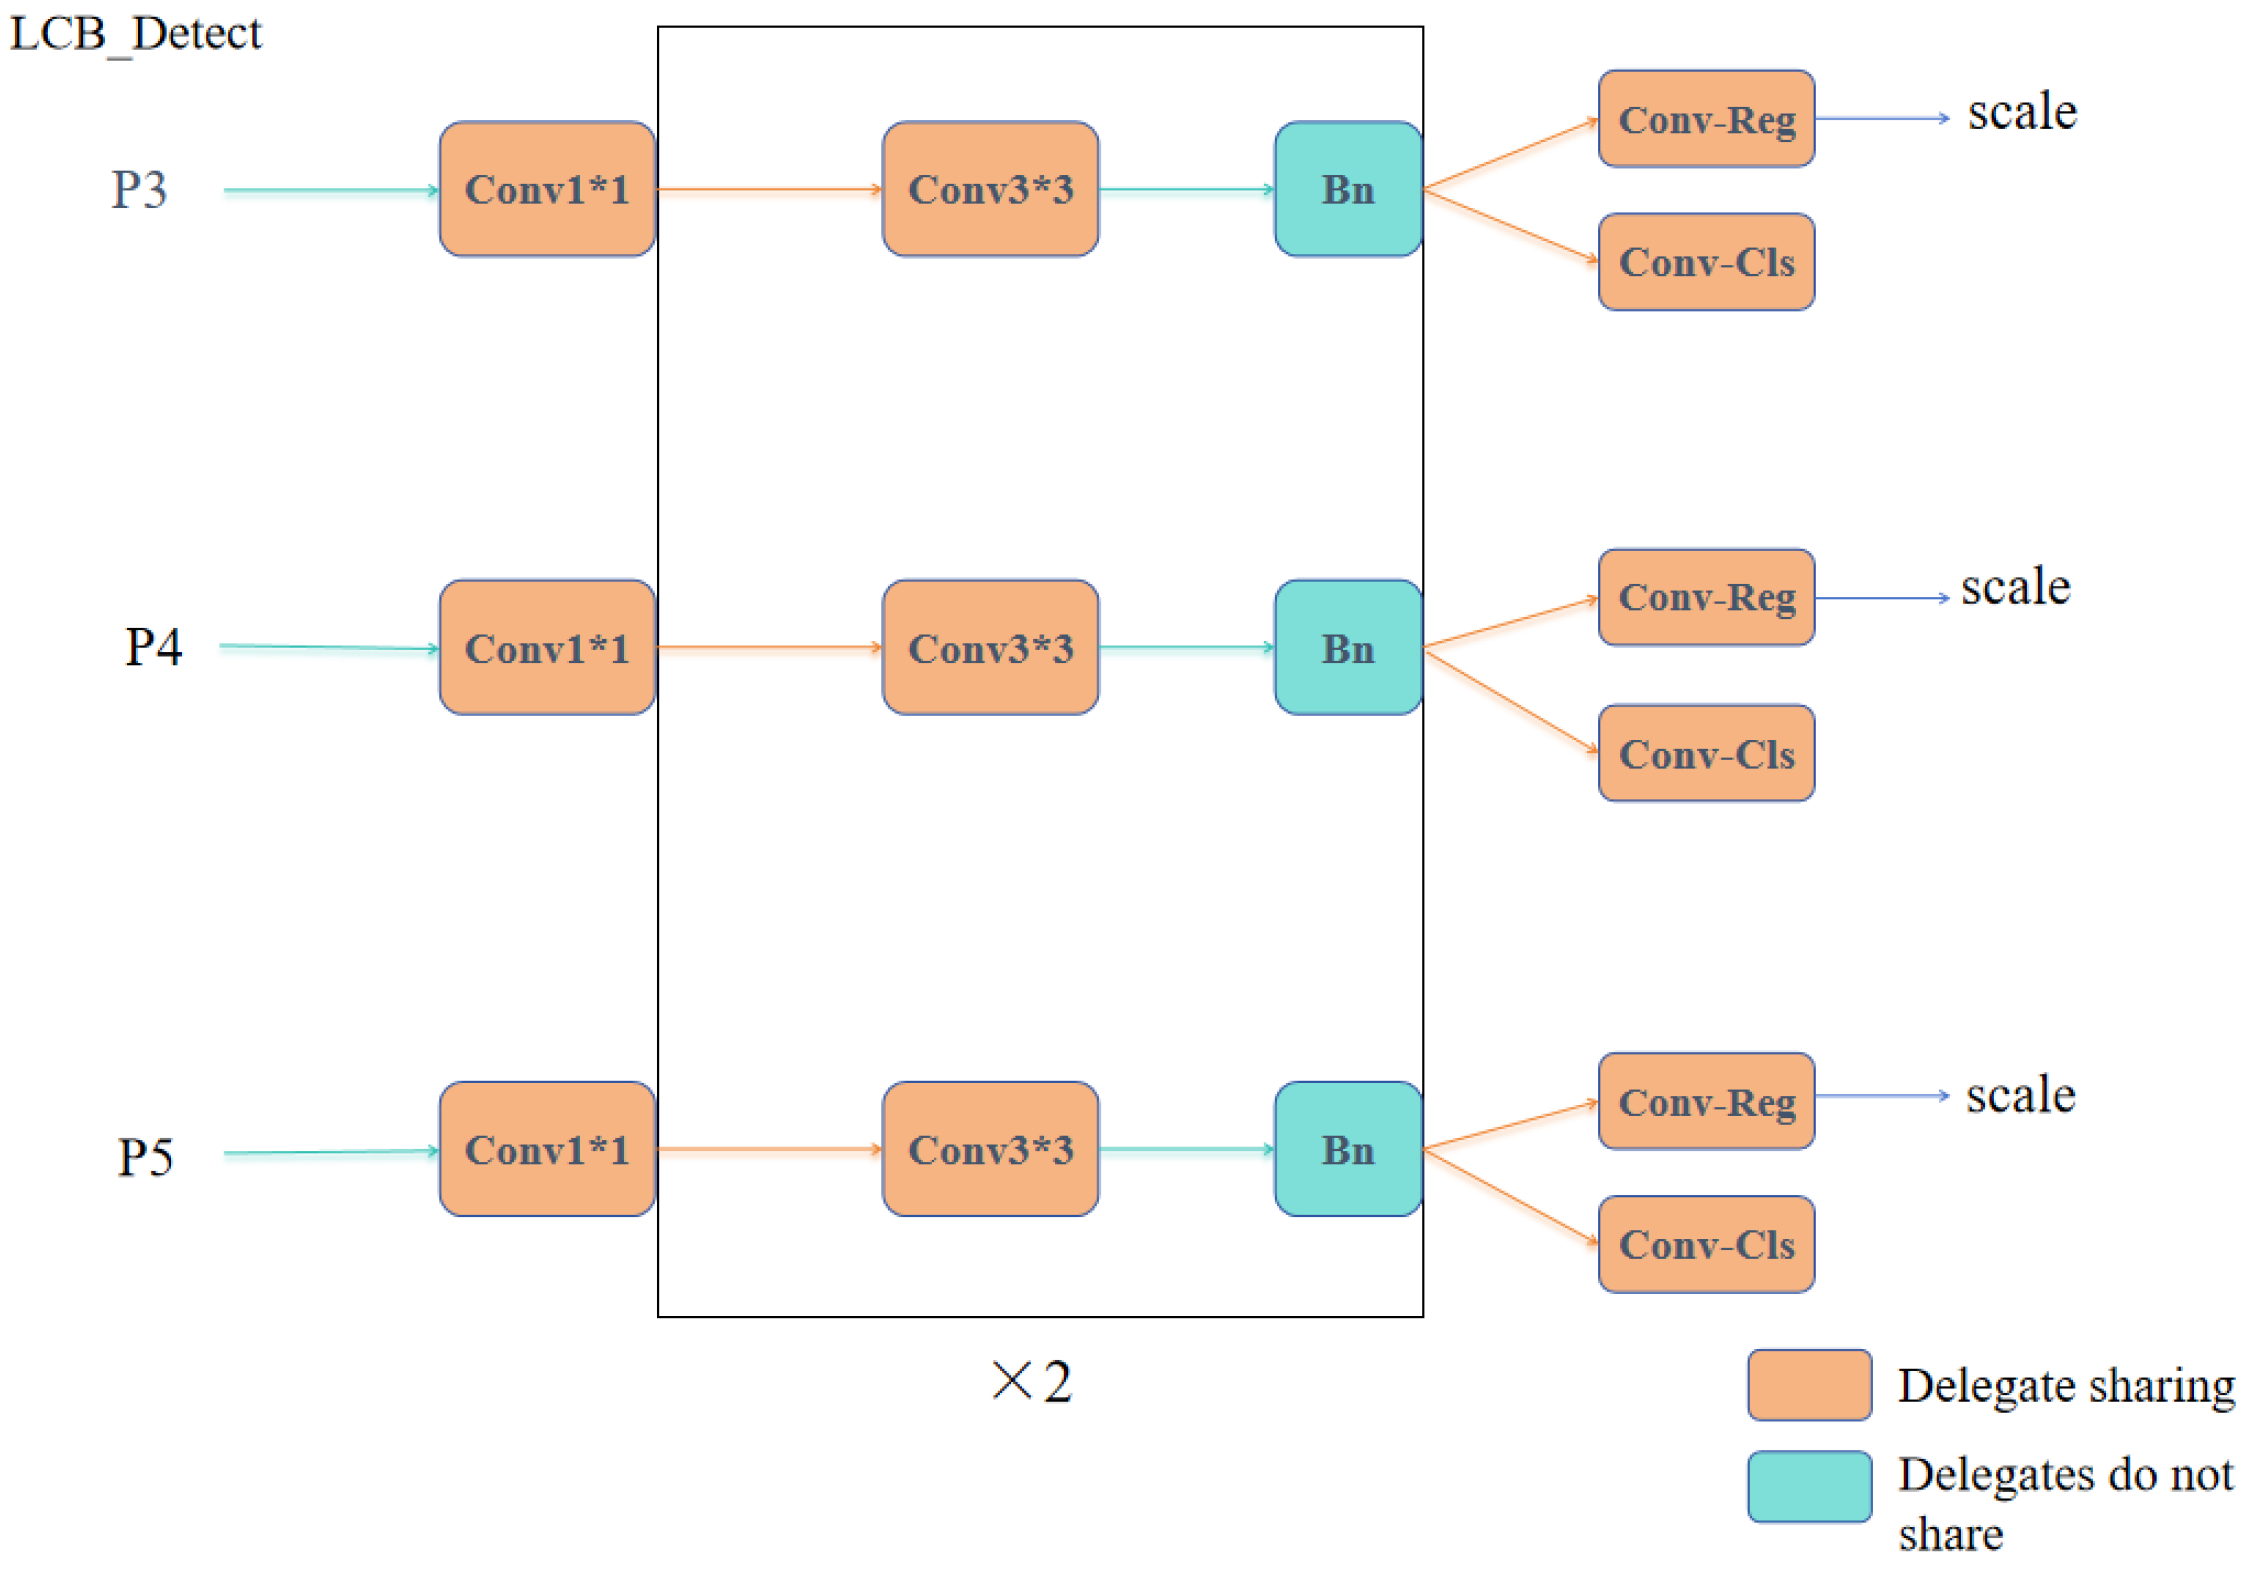
LCB_Detect Module: This module employs a lightweight shared convolution architecture to achieve cross-layer parameter sharing, reducing computational redundancy. It combines independent batch normalization to differentiate normalization across multi-scale feature maps, decouples the classification and regression branches, and introduces dynamic scale factors and the DFL mechanism. These optimizations enhance the detection head’s performance in terms of lightweight adaptability, multi-scale capability, and robustness in complex scenarios.

2. YOLOv11 Model

In September 2024, Ultralytics released the YOLOv11 series, including the YOLOv11n network designed specifically for embedded devices. The YOLOv11n network comprises three main components: the backbone, the neck, and the detection head [19].
The backbone network incorporates the C3K2 module [22] and the LSKA (Large Kernel Decomposition Attention) mechanism [23]. The C3K2 module reduces computational costs through cascaded convolutions and adjusts the computational load using dynamic channel pruning. Meanwhile, the LSKA module decomposes convolutions to expand the effective receptive field, enhancing robustness in detecting elongated and small objects.
The neck utilizes a bidirectional SPFF (Spatial Pyramid Feature Fusion) architecture [24] combined with the Re-Calibration FPN mechanism [25] to achieve efficient multi-scale feature fusion. This design improves the detection accuracy of occluded objects while optimizing the preservation of edge details.
The detection head employs an NMS-Free decoupled head with a dynamic label assignment strategy. By separating the classification and regression branches, the inference process is simplified, and sample matching rules are dynamically adjusted. Additionally, the joint distillation loss function enhances the collaborative optimization of classification and localization [26].
This network achieves a balance between detection accuracy and inference speed, making it well-suited for embedded applications.

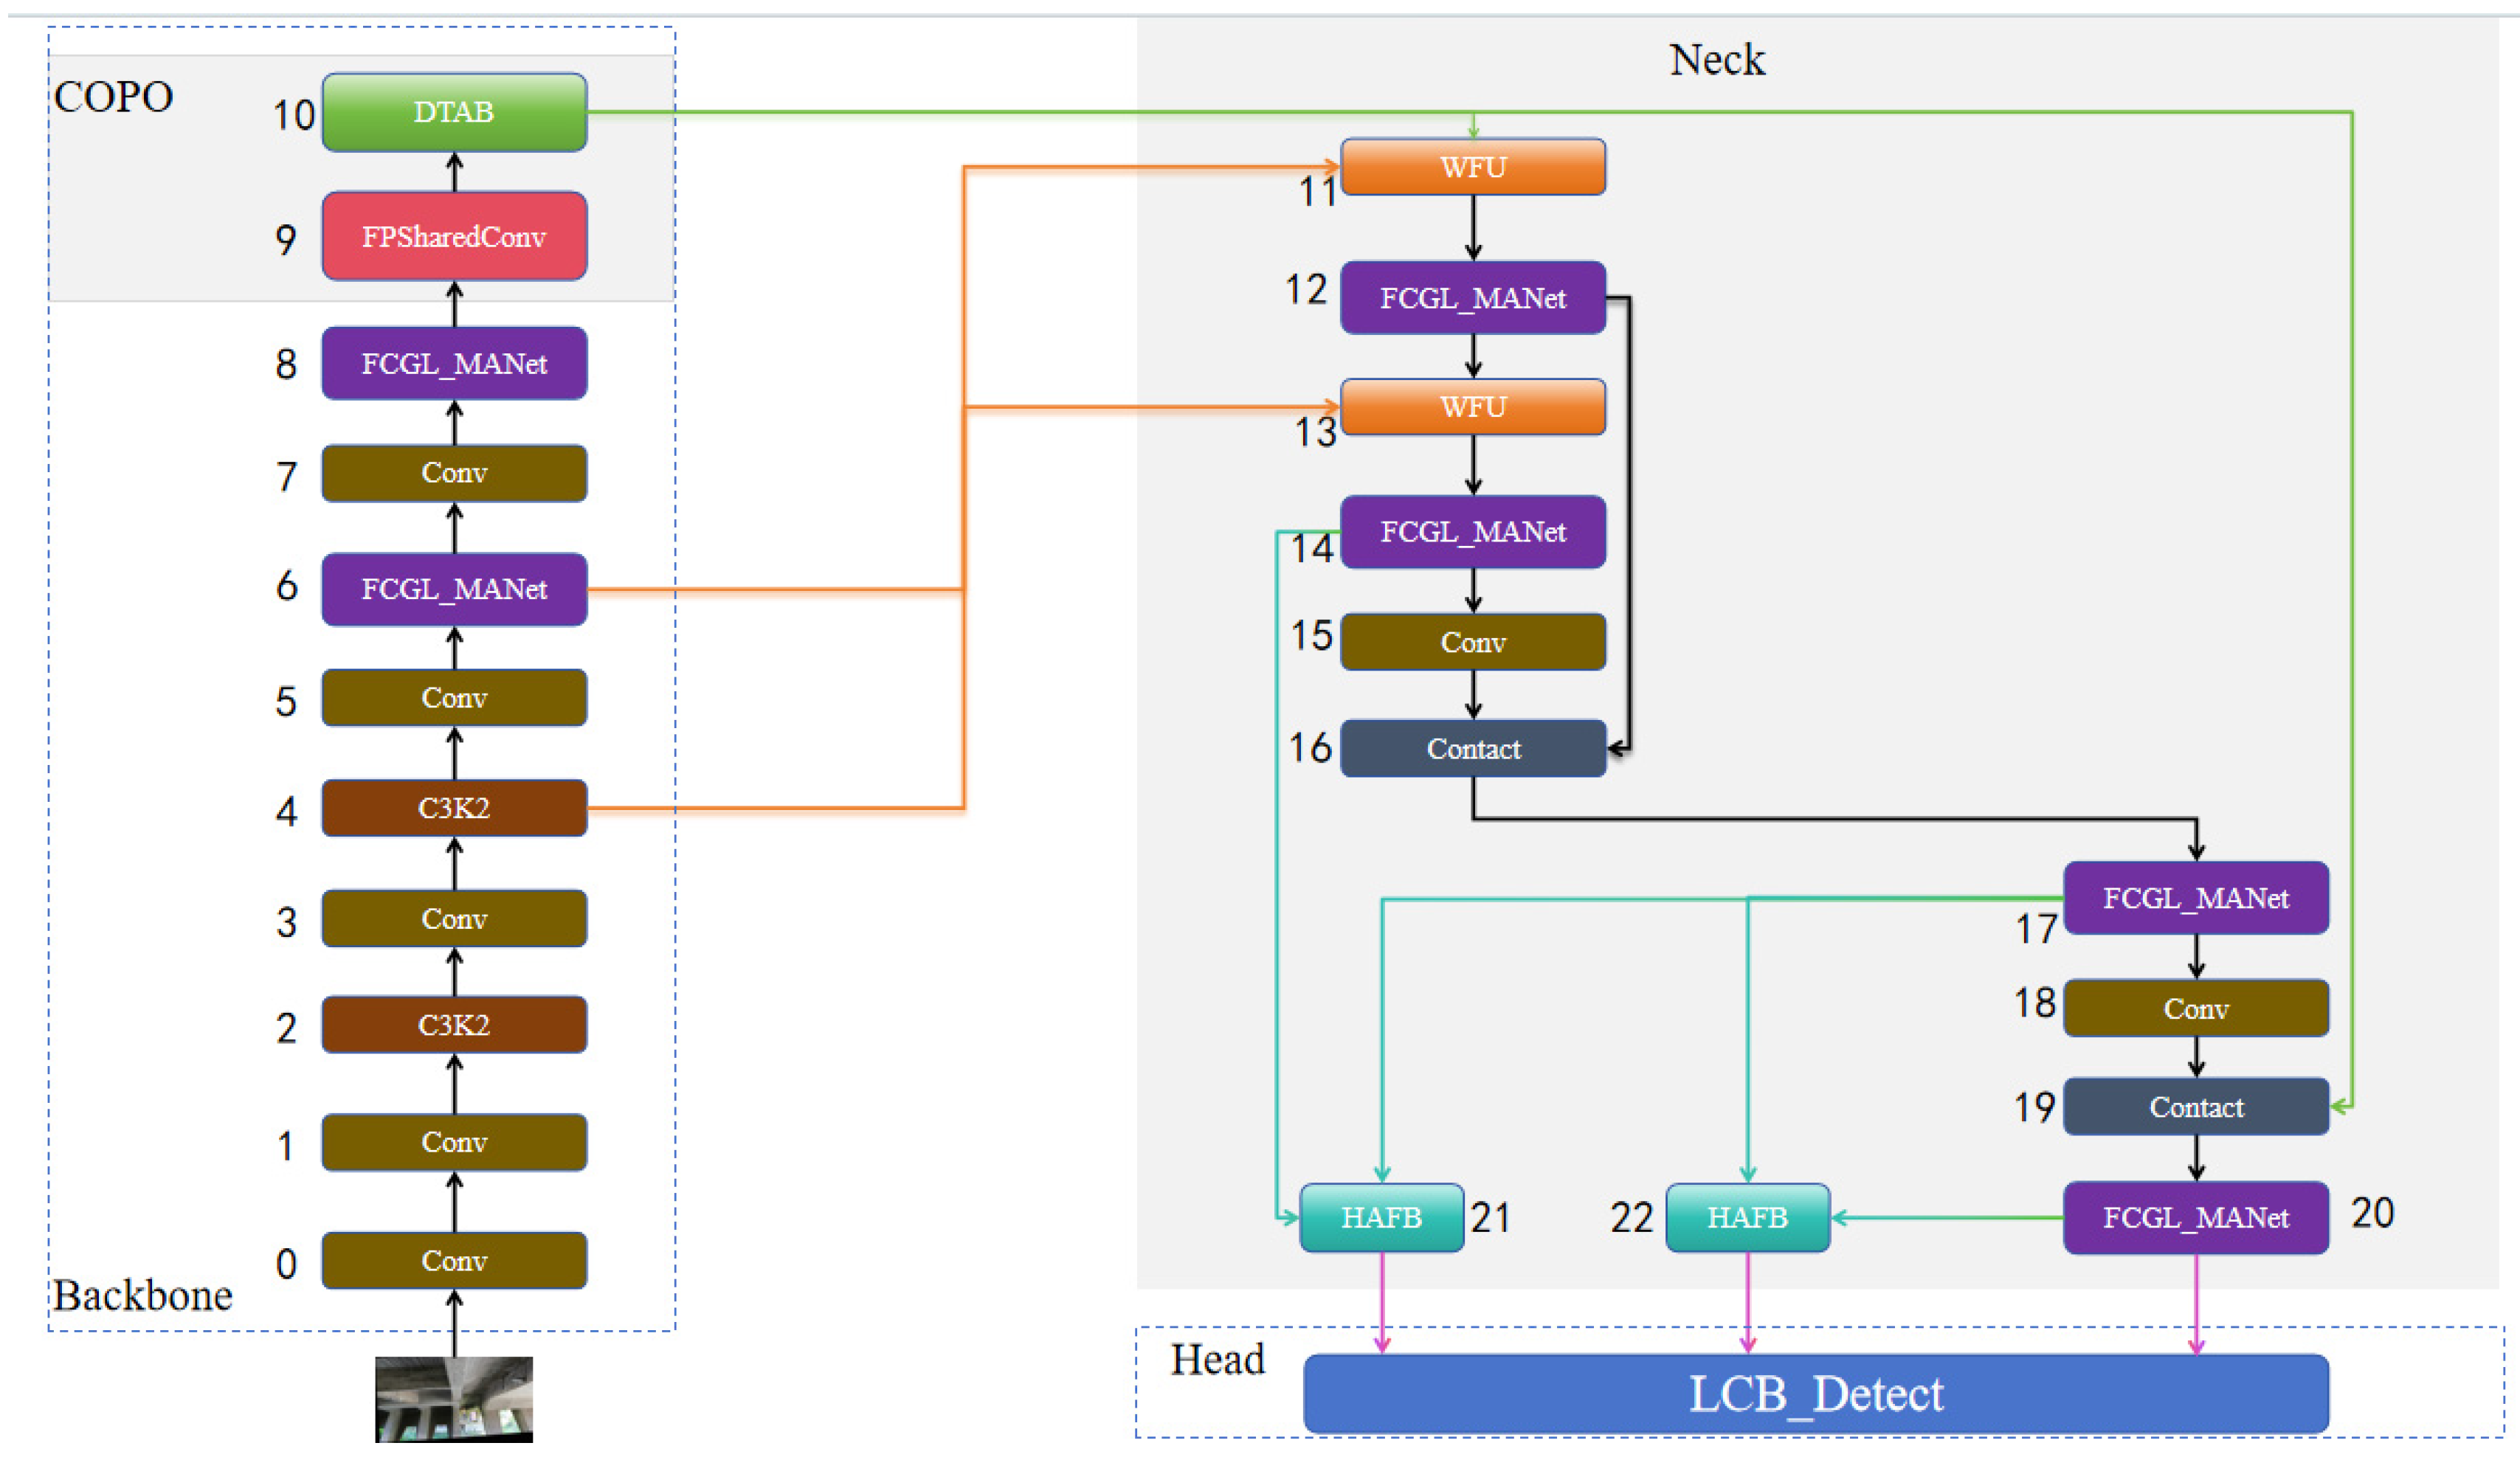
3. AMSF-Pyramid-YOLOv11n Model

The structure of the improved YOLOv11 model is illustrated in Figure 1. First, the FPSharedConv module from the COPO framework replaces the original SPPF, while the DTAB module replaces the C2PSA. The FPSharedConv module dynamically captures multi-scale contextual information through a combination of shared convolution kernels and multi-dilation rates (d = 1/3/5), significantly reducing nearly half the parameters while avoiding information loss caused by pooling. The DTAB module not only reduces the computational complexity of attention mechanisms and enhances long-range dependency modeling but also improves robustness in detecting less prominent targets.
Secondly, the UGMB feature pyramid module replaces the original FPN + PAN structure [27,28]. By leveraging Haar wavelet decomposition to preserve high-frequency details [29] and incorporating local-global dynamic attention with p = 2/p = 4 windows, the UGMB module achieves adaptive cross-layer feature weighting and fusion, thereby improving the precision of small object detection.
Finally, the LCB_Detect module is introduced to replace the traditional detection head. This module reduces redundant computations through a collaborative architecture of shared convolution kernels and separate batch normalization (BN). Additionally, it incorporates a lightweight RepConv optimization pathway [30], achieving efficient compression of both parameters and computational costs. This design effectively balances lightweight deployment with detection performance.

3.1. COPO Cooperative Optimization Module

The proposed COPO (Cooperative Optimization) module is designed to address challenges in feature extraction efficiency and background interference suppression under complex scenarios. By deeply integrating FPSharedConv (multi-level dilated shared convolution) and DTAB (dual-domain attention block), the COPO module effectively overcomes the limitations of traditional methods in handling these challenges. The structure of the COPO module is shown in Figure 2.
The COPO module includes the FPSharedConv multi-scale feature extraction module and the DTAB dual-domain attention screening module
To address the issue of insufficient multi-scale feature extraction in bridge defect detection, where traditional methods struggle to balance multi-scale adaptability and lightweight design, the COPO module introduces the FPSharedConv component. The structure of the FPSharedConv module is illustrated in Figure 3. As a feature enhancement module, its core innovation lies in improving feature representation capability through shared convolution kernels [31] and multi-scale feature capture. The input to this module is a feature map x with a shape of C × H × W. First, the input feature map is passed through a 1 × 1 convolution layer to transform the channel dimension. The output feature map has a shape of C′ × H × W, and this step can be expressed as: x′ = Conv1 × 1(x), where Conv1 × 1 represents the 1 × 1 convolution operation.
For the initial feature x′ obtained after the 1 × 1 convolution, shared convolution kernels are applied across multiple branches with different dilation rates. The specific convolution operation is defined by Equation (1):
F i = C o n v F i 1 , W , d i l a t i o n = d i , p a d d i n g = d i ,
Here, denotes the shared convolution kernel, represents the dilation rate of the i-th convolution, is the output feature map from the previous convolution, and is the output feature map of the current convolution. The parameter dilation refers to the dilation factor. The shape of the output feature map for each convolution operation remains constant at C′ × H × W because appropriate padding is applied during the convolution process to ensure that the spatial dimensions of the feature map are preserved. This design enables the same set of convolution parameters to capture multi-scale contextual information, ranging from a basic receptive field (e.g., r = 1, corresponding to a 3 × 3 receptive field) to an expanded receptive field (e.g., r = 5, corresponding to an 11 × 11 equivalent receptive field). Compared to traditional independent branch schemes, this approach significantly reduces the total number of parameters. For instance, in the case of three branches, the total number of parameters is only 1/3 of that in the traditional approach. In a conventional independent branch scheme, using three 3 × 3 convolution kernels with different dilation rates would require a total of 3 × (3 × 3 × C′) parameters. In contrast, the proposed module includes only one 3 × 3 convolution kernel and the subsequent 1 × 1 convolution parameters.
Finally, features from different scales are aggregated to obtain the fused multi-scale information, which enhances the model’s ability to represent and leverage contextual features effectively.
FPSharedConv utilizes different dilation factors to control the kernel size of ShareConv. This approach not only expands the receptive field of the model to extract more feature information but also reduces the computational complexity of the model.
To address the issues of false positives and missed detections caused by background interference in bridge defect detection, the COPO module incorporates the DTAB module [32], whose structural diagram is shown in Figure 4. This module is a feature processing unit that integrates multi-dimensional attention with an efficient feed-forward network. Its core principle involves generating QKV through a 1 × 1 convolution, followed by expanding the receptive field using a 3 × 3 depthwise convolution with a dilation rate of 2. Subsequently, cross-channel attention is computed in the channel branch, while spatial attention is calculated in the spatial branch through overlapping windows (with a window size of M and an overlap ratio of 0.5) and dual positional encoding. Each branch enhances features via dual dilated convolution feed-forward networks, and feature fusion is achieved through a four-stage residual connection.
The main advantages of this module are as follows: dilated convolutions expand the receptive field to improve multi-scale feature capture capabilities; overlapping windows combined with dual positional encoding optimize spatial attention and reduce target confusion in dense scenes; the use of depthwise separable convolutions and other designs reduces computational complexity; and the four-stage residual connections preserve multi-level features, enhancing representational capacity. This design allows the model to balance lightweight characteristics while improving detection accuracy and robustness in complex scenarios.
The DTAB module demonstrates the components of Dilated G-CSA (Dilated Global Channel Self-Attention), Dilated FFN (Dilated Feed-Forward Network), and Dilated M-WSA (Dilated Multi-Window Self-Attention), as well as their internal connections and processing flows. These include LayerNorm (Layer Normalization), Dilated Dconv (Dilated Depthwise Convolution) with different specifications, GeLU activation functions, and Conv (Convolution) operations.

3.2. UGMB Feature Pyramid Module

In the field of object detection, effectively capturing feature information from targets of different scales is crucial for improving model performance. The UGMB (Unified Global-Multiscale Bottleneck) module, designed in this study as an innovative structure for multi-scale feature extraction and fusion, aims to overcome the limitations of traditional feature pyramids and significantly enhance the model’s ability to detect targets across various scales. The structure of the UGMB module is shown in Figure 5. Its core innovations integrate multiple advanced mechanisms, enabling more efficient and precise feature extraction and fusion.
The UGMB enhances the robustness of the model in detecting bridge defects at different scales by utilizing WFU and FCGL_MANet for multi-scale feature extraction and fusion. Additionally, it employs HAFB to perform hierarchical attention fusion on features at different scales, emphasizing important information across scales while suppressing irrelevant information that may interfere with the detection head.
The upsampling process in YOLOv11 leads to the loss of semantic information and blurred spatial details. To address this issue, the WFU (Wavelet Feature Upsampling) module [33] is introduced, with its structure shown in Figure 6. The module first utilizes the Haar wavelet transform to decompose the input into a low-frequency component and three high-frequency detail components (H, V, D). The low-frequency component is used to capture the main structural information of the feature map, while the high-frequency components are processed using residual blocks to extract edge and texture information in different directions. Finally, the inverse wavelet transform is applied to reconstruct the processed and concatenated feature maps back to the original resolution.
The WFU module effectively preserves detailed information of the target, improves the utilization efficiency of low-level features, and enhances the detection accuracy for small objects.
F s represents the high-resolution feature map of the input bridge defect, and F s + 1 represents the low-resolution feature map of the bridge defect. After wavelet transformation and feature fusion, F s  a high-resolution feature map of the bridge defect is obtained.
To enhance feature representation capabilities, the UGMB module incorporates the FCGL_MANet module, whose structure is shown in Figure 7. This module utilizes partial convolution and gated linear units (GLU) to dynamically control the flow of information [34]. By combining multi-branch feature fusion, lightweight spatial operations, and a dynamic gating mechanism, FCGL_MANet improves the richness and robustness of feature representation while maintaining computational efficiency.
In the structural diagram, each branch and module has a specific role: preprocessing expands the feature space, multi-path branches extract differentiated information, bottleneck blocks progressively enhance features, and the final fusion outputs an efficient feature representation.
In the feature integration stage, the UGMB module incorporates the HAFB (Hierarchical Attention Fusion Block) module to achieve hierarchical attention fusion [35]. By leveraging a local-global attention mechanism, HAFB suppresses background noise and highlights defect features. Its structural diagram is shown in Figure 8.
HAFB first applies global average pooling along the channel dimension to generate semantic weights, which filter out highly discriminative channels. Then, it enhances key target region features along the spatial dimension using local window attention. The fusion component dynamically adjusts weights based on the importance of multi-scale features, effectively suppressing background noise and achieving an adaptive balance between feature resolution and semantic intensity. This design improves the detection accuracy and robustness for small and medium-sized defects while maintaining a lightweight structure.
The HAFB Module shows the flow of input features through different convolutions and local-global attention operations, followed by stitching fusion and subsequent convolution processing.
The UGMB module integrates several innovative mechanisms to build a comprehensive multi-scale feature processing pipeline. These include wavelet domain feature enhancement from the WFU module, dynamic feature regulation from the FCGL_MANet module, multi-scale feature concatenation through multiple Concat operations, and hierarchical attention filtering from the HAFB module. Together, these components form a cohesive system for efficient and robust multi-scale feature processing.

3.3. LCB_Detect Optimized Lightweight Detection Head

The core innovation of the LCB_Detect module lies in constructing a hybrid architecture of shared feature extraction and separated normalization, effectively addressing the issues of large parameter sizes in traditional detection heads and insufficient adaptation to multi-scale features. Its structural diagram is shown in Figure 9.
In the feature preprocessing phase, cross-layer shared convolution (ShareConv) is employed. Using a set of shared 3 × 3 + 1 × 1 convolutional kernels, feature maps from different levels (P3, P4, P5) are processed, avoiding redundant calculations to improve computational efficiency. The formulation of shared convolution is presented in Equation (2). After the shared convolution, layer-specific batch normalization (SeparateBN) is applied, where independent batch normalization layers are assigned to each detection layer. This ensures that different scale features (e.g., high-resolution shallow features from P3 and low-resolution deep features from P5) maintain independent normalization statistics, avoiding cross-layer scale confusion and better adapting to multi-scale features.
Moreover, the module achieves task decoupling and scale adaptation through separate classification-regression branches and scale-aware adjustments (Scale). The regression branch utilizes 1 × 1 convolutions to generate distribution parameters required for DFL (Distribution Focal Loss), enabling high-precision bounding box regression. The classification branch employs independent 1 × 1 convolutions to produce n-dimensional category probabilities, avoiding feature competition between classification and regression tasks. Additionally, before the regression branch, a learnable scaling factor is introduced to dynamically weight the regression outputs of different feature levels, adaptively adjusting the contribution of features at various scales to bounding box regression. This significantly improves the localization accuracy of small objects.
Simultaneously, the LCB_Detect module enhances training stability and inference efficiency through dynamic anchor generation and lightweight post-processing. The dynamic anchor generation function is described in Equation (4). During training, multi-scale independent processing paths are preserved, and exclusive independent BN layers are utilized to adapt to the scale-specific characteristics of each layer, avoiding cross-layer interference. During inference, multi-scale outputs are integrated through feature concatenation, and resolution-agnostic detection is achieved using the dynamic anchor generation function. This eliminates the biases caused by fixed anchor priors. While retaining the simplicity of YOLO’s end-to-end architecture, lightweight post-processing is employed to enhance inference speed and deployment generalizability.
F l = A c t SeparateBN C o n v 1 × 1 C o n v 3 × 3 F l ,
Δ x y w h = D F L S c a l e c v 2 F l ,
A n c h o r s = m a k e n c h o r s x , s t r i d e , 0.5 ,
In Equation (2), F l represents the input features of the l-th layer. C o n v 3 × 3 denotes a shared 3 × 3 convolution, C o n v 1 × 1 represents a shared 1 × 1 convolution, and SeparateBN refers to the separable batch normalization operation. A c t is the activation function used to introduce non-linearity, enhancing the model’s expressive capabilities. F l  denotes the output features of Equation (2), which serve as the input features for Equation (3).
In Equation (3), c v 2 refers to a 1 × 1 convolution. Scale performs adaptive scaling on the output of Conv1 × 1, enabling better adaptation to target scales. DFL (Distribution Focal Loss) processes the scaled features to obtain the boundary box regression offsets, which are used to achieve high-precision bounding box regression.
In Equation (4), s t r i d e  represents the downsampling stride of the feature map relative to the original image, x denotes the input feature map, m a k e n c h o r s is a function responsible for dynamically generating anchors based on the input parameters, and  A n c h o r s represents the generated anchors.
LCB_Detect achieves significant reductions in computational cost while maintaining high accuracy through the following key designs: multi-scale feature enhancement by sharing convolution to extract commonality and an independent BN to adapt scale differences, decoupled regression and classification branches include task-specific modeling, and a lightweight structural design includes parameter sharing and efficient convolutions.
In the structural diagram, branches for different scales achieve efficient parameter utilization through shared convolution, while independent BN ensures scale specificity. The clearly separated regression branch (Conv-Reg) and classification branch (Conv-Cls) enable task decoupling. Together, these components form a lightweight multi-task detection head, making it well-suited for real-time detection scenarios.
LCB_Detect introduces a lightweight and efficient paradigm for multi-scale detection heads through three key innovations: parameter reduction via shared convolution, scale preservation via separate BN, and enhanced interpretability via decoupled branches. Its core value lies in balancing parameter efficiency and feature adaptation capabilities within the detection head. This design not only effectively avoids the scale confusion issues inherent in traditional shared architectures but also addresses the computational redundancy of independent architectures. As a result, it provides a general-purpose solution for real-time object detection tasks that achieves both high accuracy and efficiency.

4. Analysis of Experimental Results

4.1. Datasets and Experimental Environments

This experiment involves the construction of a bridge defect detection dataset, with the specific details as follows: a new bridge defect detection dataset was synthesized by extracting a portion of images from the dacl10k-toolkit [36] and cracktree200 [37] datasets, combined with bridge defect images obtained from online sources. The dataset consists of 6300 color images, with a unified resolution of 2048 × 1536, covering five types of typical defects on bridge pillar surfaces and road surfaces. These defects include corrosion, cracks (fissures), degraded concrete, concrete cavities, and dampness. The number of samples and their proportions for each category are shown in Table 1. The dataset was divided into training, validation, and testing sets in a ratio of 8:1:1, resulting in 5040 images in the training set, 630 images in the validation set, and 630 images in the test set.
The dataset contains a total of 55,242 labeled targets, classified by size as follows: 39,205 large targets (size > 96 × 96), 13,548 medium targets (size between 96 × 96 and 32 × 32), and 2487 small targets (size < 32 × 32).
The hardware configuration for the experiment is as follows: the testing environment is Python 3.8, CUDA 11.3, with an NVIDIA RTX 4090 GPU (24 GB memory). The specific experimental parameter settings are detailed in Table 2.

4.2. Comparative Experiments

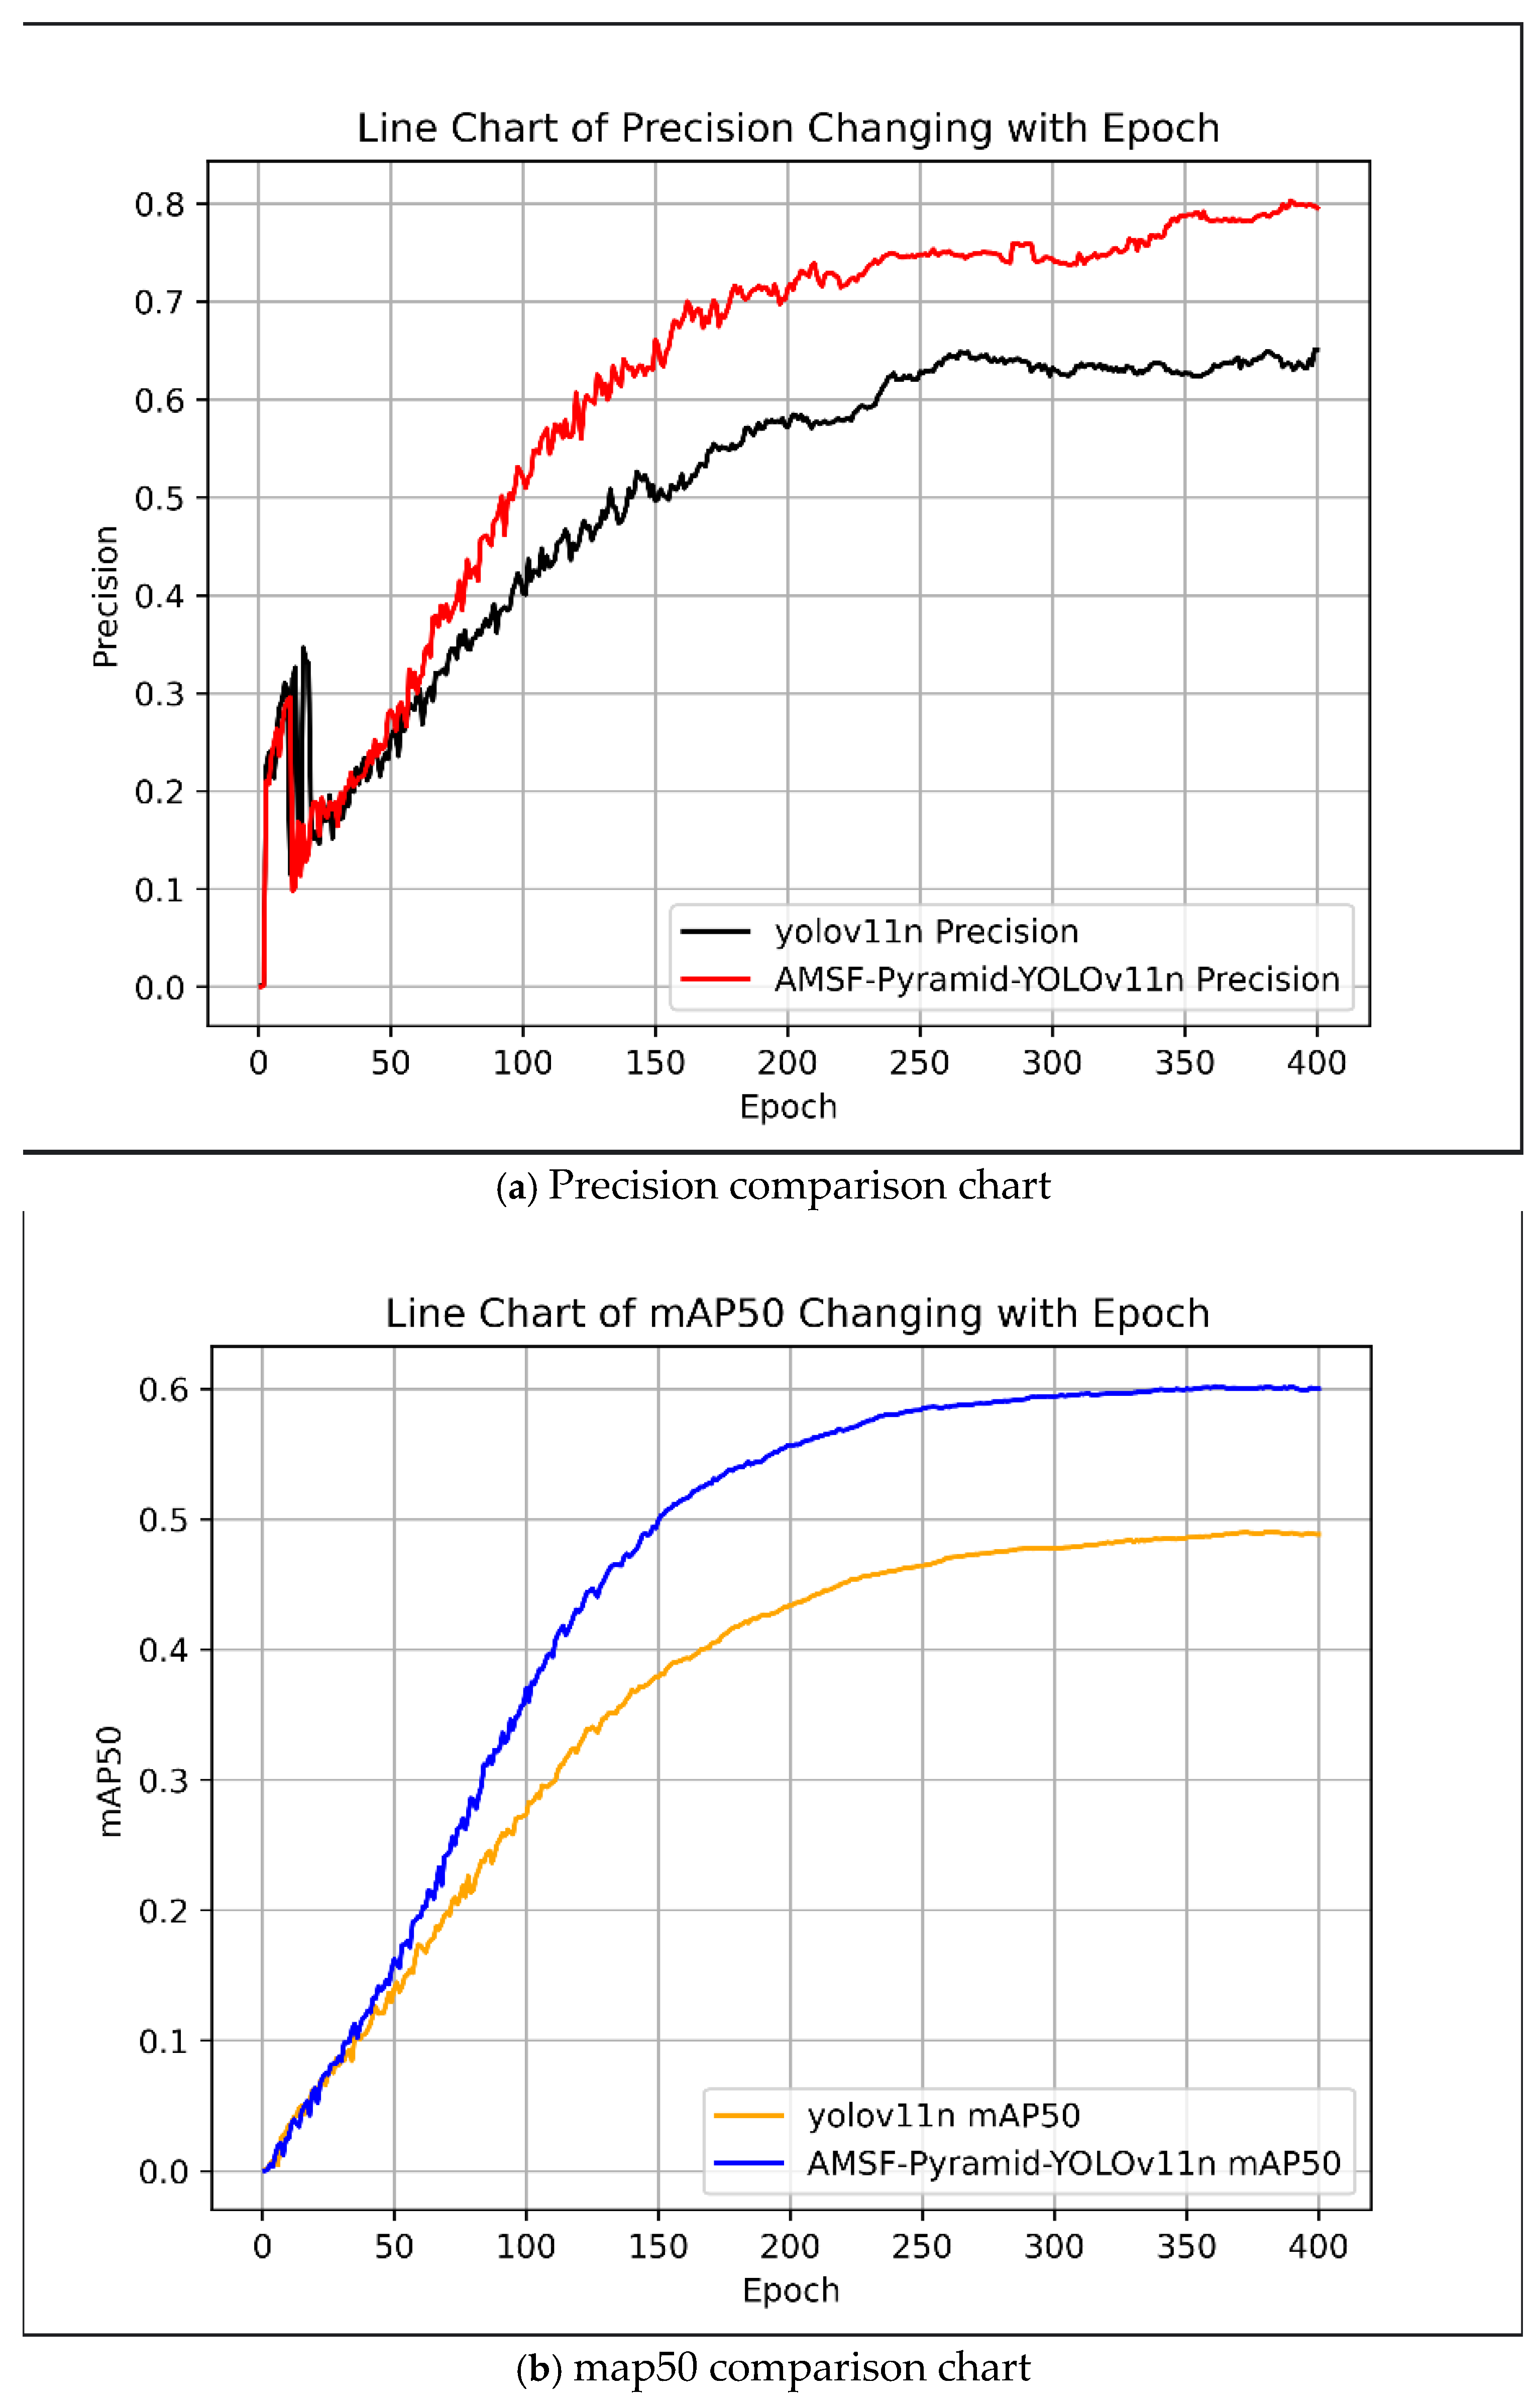
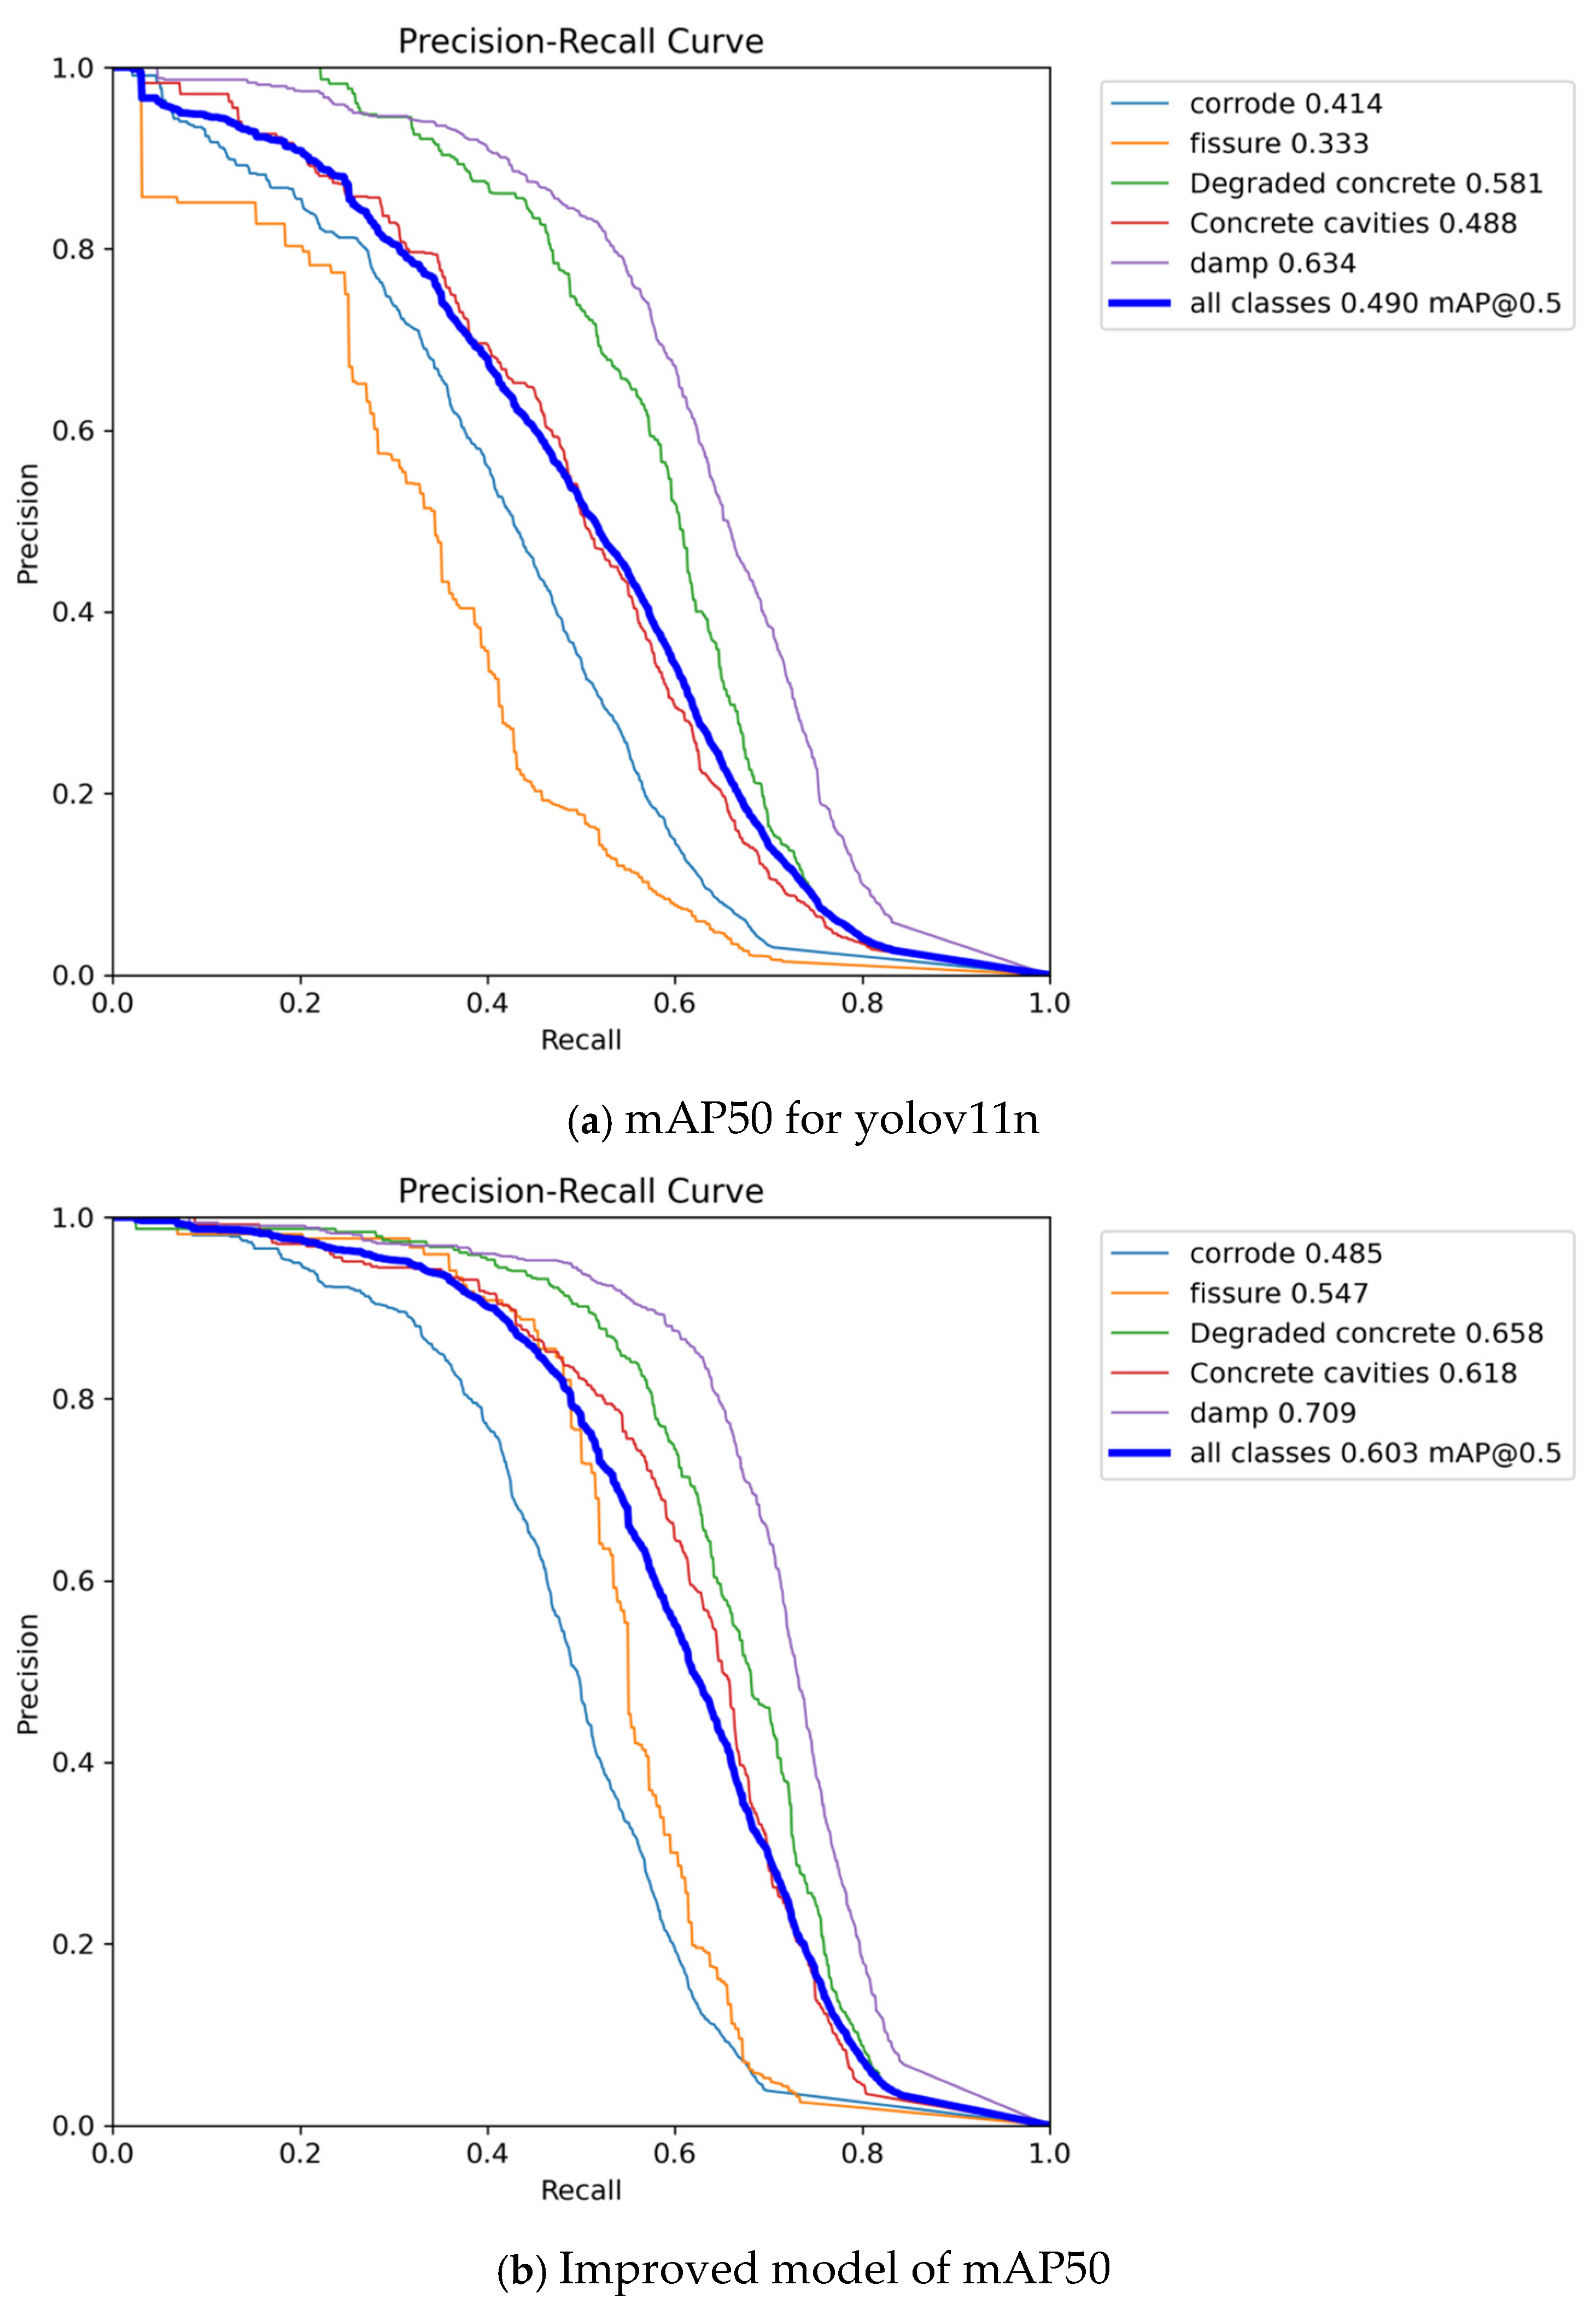
Comparative Experiments on Improved Effects

To provide a more intuitive observation of the model improvement effects, the original model (YOLOv11n) and the improved model (AMSF-Pyramid-YOLOv11n) were tested on the same experimental platform, and the comparison results are shown in Figure 10. As depicted in Figure 10a, both models exhibit an upward trend in precision with increasing epochs. However, the AMSF-Pyramid-YOLOv11n (red curve) achieves a steady and continuous improvement in precision throughout the training process, eventually stabilizing at around 0.8, which is significantly higher than the original YOLOv11n model (black curve, stabilizing at approximately 0.65). This improvement is primarily attributed to the enhanced model’s use of the FCGL_MANet dynamic gating mechanism (channel-level feature filtering) and the LCB Detect decoupled classification branch, which effectively suppresses background noise and false detections (e.g., avoiding confusion between humid regions and corrosion). Notably, it achieves more accurate classification for categories with complex textures and high susceptibility to interference in bridge defects, such as degraded concrete and corrosion. Furthermore, the FPSharedConv shared dilated convolution enhances multiscale feature consistency, reducing cross-scale feature misjudgments. As a result, the model achieves significantly improved defect classification accuracy under complex backgrounds.
Figure 10b shows that the improved AMSF-Pyramid-YOLOv11n (blue curve) rapidly increases mAP50 and eventually stabilizes at around 0.6, far surpassing the original YOLOv11n model (yellow curve, stabilizing at approximately 0.49). This highlights the improved model’s comprehensive detection advantages for multiscale targets in the bridge defect dataset, such as corrosion and cracks. The core improvements include: leveraging FCGL_MANet’s multi-branch fusion and FPSharedConv’s dilation convolutions to address fine-grained feature extraction for small-size defects (e.g., cracks) and global shape modeling for large-size defects (e.g., concrete voids), thereby significantly enhancing recall rates across defect scales. The LCB Detect’s DFL regression branch further optimizes the localization accuracy of irregular defects, while the WFU weighted feature fusion dynamically balances multiscale feature weights, avoiding information loss commonly found in traditional feature pyramids. Lightweight design techniques, such as shared convolution, reduce parameter counts and mitigate overfitting risks, ensuring that the model continues to optimize multi-class detection accuracy even in the later stages of training. Ultimately, the model achieves a significant breakthrough in detecting all categories of bridge defects through a “three-level optimization” framework of multiscale feature enhancement, cross-layer fusion, and decoupled detection.
Figure 10a illustrates the changes in the Precision of the model before and after improvement over 400 epochs. The black curve represents the Precision variation of YOLOv11n, while the red curve represents the Precision variation of AMSF-Pyramid-YOLOv11n.
Figure 10b shows the changes in mAP50 of the model before and after improvement over 400 epochs. The yellow curve represents the mAP50 variation of YOLOv11n, and the blue curve represents the mAP50 variation of AMSF-Pyramid-YOLOv11n.
In the comparative experiments presented in Table 3, several classic models, including Faster R-CNN, SSD, CenterNet, as well as mainstream YOLO series models such as YOLOv5n and YOLOv11, were selected for evaluation. In terms of accuracy, the final version of the proposed model achieved a precision of 0.791, a recall of 0.53, and mAP@0.5 and mAP@0.5:0.95 scores of 0.603 and 0.305, respectively, on the bridge defect detection dataset used in this study. These results outperform the classic models, Faster R-CNN, SSD, and CenterNet, as well as YOLO series models such as YOLOv8n and YOLOv11s. Moreover, the proposed model significantly surpasses the latest YOLOv12s and Hyper-YOLO models.
In terms of model complexity, the parameter count of the proposed model is 6,861,920, and its Gflops is 11.9, which demonstrates that it reduces computational burden while maintaining high accuracy compared to models like YOLOv5s, YOLOv11s, and YOLOv12s. This achieves an optimized balance between detection precision and efficiency, fully validating the advanced nature of the proposed improvement strategies.
Furthermore, as shown in the visualized detection results in Figure 11, the improved model exhibits superior capability in detecting fine details. Compared to YOLOv11n, the improved model not only achieves an overall mAP@0.5 improvement of 11.3%, but also enhances the mAP@0.5 for all defect categories in the dataset. The improvement is particularly notable for bridge defects of varying scales and those with less distinctive features. The mAP@0.5 of YOLOv11n is shown in Figure 10a, while the improved YOLOv11n’s mAP@0.5 is displayed in Figure 10b.
Taking corrosion as an example, the mAP@0.5 improved from 0.414 to 0.485 after the enhancement. At the same recall rate, the improved model achieves higher precision, and its precision-recall curve approaches the upper-right corner, highlighting the improved accuracy and completeness of corrosion defect detection. For fissures, the mAP@0.5 increased significantly from 0.333 to 0.547, with the curve shifting notably upward, indicating that the model’s ability to recognize fissure defects has been strengthened, with fewer false positives and missed detections. For dampness, the mAP@0.5 rose from 0.634 to 0.709, maintaining higher precision even at high recall rates, demonstrating better detection stability.
From the overall curves, the mAP@0.5 for all defect categories improved from 0.490 before enhancement to 0.603 after enhancement. The blue curve representing “all classes” is consistently above that of the original model and covers a larger area, indicating that the improved model achieves a better balance between precision and recall across all types of bridge defects. The model demonstrates more stable and efficient detection performance for various defects, effectively reducing the probabilities of false positives and missed detections. This enhancement improves the model’s generalization ability and practical application value significantly.

4.3. Ablation Experiments

The improved algorithm is based on YOLOv11n, and ablation experiments were conducted to verify the effectiveness of the four modules. In these experiments, A, B, C, and D represent the addition of the UGMB, FPSharedConv, DTAB, and LCB_Detect modules, respectively, to YOLOv11n. The experimental process strictly controlled variables to ensure consistent conditions, with multiple independent repetitions conducted for each module to calculate average values and reduce the influence of randomness in deep learning results. The experimental results, shown in Table 4, indicate that each module contributes to performance improvement and complements the others.
Although Module A has relatively limited individual effects, it optimizes feature quality when combined with other modules. This is because Module A is based on the Haar wavelet transform, whose orthogonal symmetry ensures structural independence of frequency components during decomposition, while its core functionality lies in multiscale feature extraction and fusion by decomposing features into different frequency components (low-frequency structures and high-frequency details) and then recombining them. When used alone, the lack of initial feature processing by backbone modules (e.g., multiscale feature extraction in Module B or attention reinforcement in Module C) limits their integration of high-quality features, resulting in weaker performance. However, when combined with other modules, it processes the features pre-processed by preceding modules, using wavelet transforms to further optimize the complementarity of multiscale information and semantic hierarchy. This provides higher-quality input for the detection head, playing a critical role in “feature fusion optimization” within the multi-module collaboration and enhancing the overall detection performance.
Module B demonstrates initial success in multiscale feature extraction, achieving mAP@0.5 = 52.3% when used independently. This is because Module B focuses on multiscale feature processing by leveraging mechanisms such as shared convolution and dilation factors, enabling the model to capture multiscale information of bridge defects. When used alone, it can preliminarily integrate features at different scales, improving the model’s ability to recognize defects of varying sizes, thus achieving mAP@0.5 = 52.3%. However, due to the absence of deep semantic feature mining (e.g., attention mechanisms in Module C) and optimization of the detection head (e.g., Module D), its enhancement effect is limited, with improvements confined to multiscale feature extraction.
Module C strengthens feature representation and localization through a dual-attention mechanism, achieving mAP@0.5 = 57.7% when used independently, which is a remarkable result. This is attributed to Module C’s incorporation of spatial attention and channel attention mechanisms. Spatial attention focuses on the spatial location information of the feature map, enhancing the localization of defect targets while suppressing irrelevant background. Channel attention filters important channels from the feature dimensions, amplifying responses related to bridge defects while suppressing redundant channels. This dual-attention mechanism deeply mines spatial and semantic information from features, enabling more precise feature representation and accurate localization of bridge defects.
Module D optimizes the detection head and achieves mAP@0.5 = 52.7% when used independently. This is due to its improvements in the decoding, classification, and regression logic for object detection. However, the performance of the detection head relies on the quality of the features extracted and processed by the preceding modules. When used alone, if the input features (e.g., foundational features from Module A, multiscale features from Module B, or enhanced features from Module C) are not optimized, the detection head can only operate on raw or preliminarily processed features. While it improves detection logic, its overall enhancement effect remains limited. However, when combined with other modules, the optimized detection head processes high-quality feature inputs, significantly improving detection accuracy.
When used in combination, Modules B + C improve precision to 73.0% and mAP@0.5 to 57.1%. Adding Module A (i.e., A + B + C) further increases precision to 77.4% and boosts mAP@0.5 to 59.5%. When all modules (A + B+C + D) are integrated, the model achieves a precision of 79.1%, mAP@0.5 of 60.3%, and recall of 53.0%, while maintaining a manageable computational cost (Gflops = 11.9). This demonstrates a multidimensional collaborative optimization process, encompassing feature extraction, attention enhancement, target focusing, and detection head optimization. The result is a comprehensive improvement in precision, recall, and robustness for bridge defect detection. The ablation study fully validates the effectiveness of the multi-module design in enhancing detection performance.
In the UGMB feature pyramid module, the components a, b, and c represent the addition of WFU, FCGL_MANet, and HAFB, respectively, to the baseline YOLOv11n model, which already includes the FPSharedConv, DTAB, and LCB_Detect modules. According to Table 5, which presents the UGMB ablation experiment results, each method significantly impacts model performance. Multiple independent repetitions were conducted for each module to calculate average values, thereby reducing the influence of randomness in deep learning experiments.
When Module a is enabled individually, the precision (P) is 71.5%, the recall (R) is 49.0%, and mAP@0.5 reaches 55.2%, demonstrating strong feature processing capabilities. This arises from Module a’s foundation on the Haar wavelet transform, which not only performs multiscale decomposition (low-frequency approximations and high-frequency details) and integration of features but also leverages the orthogonal symmetry of Haar wavelets to maintain structural consistency across decomposition levels. This symmetry ensures that low-frequency components and high-frequency components are mutually complementary yet structurally aligned. By exploiting this symmetry, Module a enhances the multiscale expression of features across different frequency domains, improving feature diversity and complementarity—specifically, it enables consistent modeling of symmetrical defect patterns while preserving the discriminative power for asymmetrical anomalies. As a result, its multiscale feature fusion capability, bolstered by symmetrical structural constraints, directly optimizes feature quality, providing richer, more balanced information for detection even when used in isolation.
When Module b is enabled individually, the precision decreases to 65.8%, the recall is 45.8%, and the mAP@0.5 is 51.0%. This is because Module b enhances the model’s ability to perform nonlinear transformations of features and improves their abstract representation, thereby strengthening semantic information. However, when used alone, it lacks the multiscale feature support provided by Module a. Relying solely on its nonlinear transformations makes it difficult to fully capture defect features.
When Module c is enabled individually, the precision is 65.7%, the recall is 47.62%, and mAP@0.5 is 51.11%. This is because Module c uses attention mechanisms to filter key features, integrate information from different branches, and optimize the importance weight distribution of features. However, when used alone and without multiscale feature inputs (such as the multiscale, multi-frequency features from Module a), the attention mechanism struggles to accurately locate and integrate valuable information.
When combining modules, the performance varies depending on the combination. The combination of Modules b + c results in mAP@0.5 dropping to 49.0%, indicating poor performance. The combination of Modules a + c achieves mAP@0.5 = 52.4%, and Modules a + b achieves mAP@0.5 = 53.6%, both showing some improvement but still limited. However, when all three modules (a, b, and c) are enabled together, the mAP@0.5 increases significantly to 60.3%, the precision rises to 79.1%, and the recall reaches 53.0%. Although the Gflops increases to 11.9, the overall detection accuracy and effectiveness are greatly enhanced.
These results fully demonstrate the significant optimization effect of combining Modules a, b, and c on model performance. The three components collaborate synergistically, collectively enhancing the model’s ability to capture and detect bridge defect features. The combination achieves a comprehensive improvement in detection precision and effectiveness, validating the importance of integrating these modules for robust defect detection.

4.4. Generalization Validation

To evaluate the generalization capability of the improved AMSF-Pyramid-YOLOv11n model, this study conducts generalization experiments using the AMSF-Pyramid-YOLOv11n model and the original YOLOv11n model on the structural bridge detail dataset COCO-Bridge [45]. This masonry crack dataset is divided into a training set and a test set, containing 1321 and 136 images, respectively. The experimental environment is consistent with Section 4.1. The experimental results are shown in Table 6.
Experiments conducted on the COCO-Bridge dataset reveal that, compared to the original YOLOv11n model, the AMSF-Pyramid-YOLOv11n model achieves improvements of 3.2%, 3.0%, and 1.8% in precision (P), recall (R), and mAP@0.5, respectively. However, the increase in the mAP@0.5:0.95 metric is relatively limited, with only a 0.13% improvement. Considering that the improved model achieves 85.2 FPS, it demonstrates a certain level of real-time capability. Based on the experimental data, it can be concluded that the AMSF-Pyramid-YOLOv11n model outperforms the original YOLOv11n model in detection performance.
These findings fully demonstrate that the improved AMSF-Pyramid-YOLOv11n model has good generalization capability. The proposed improvements significantly enhance the model’s effectiveness and robustness.

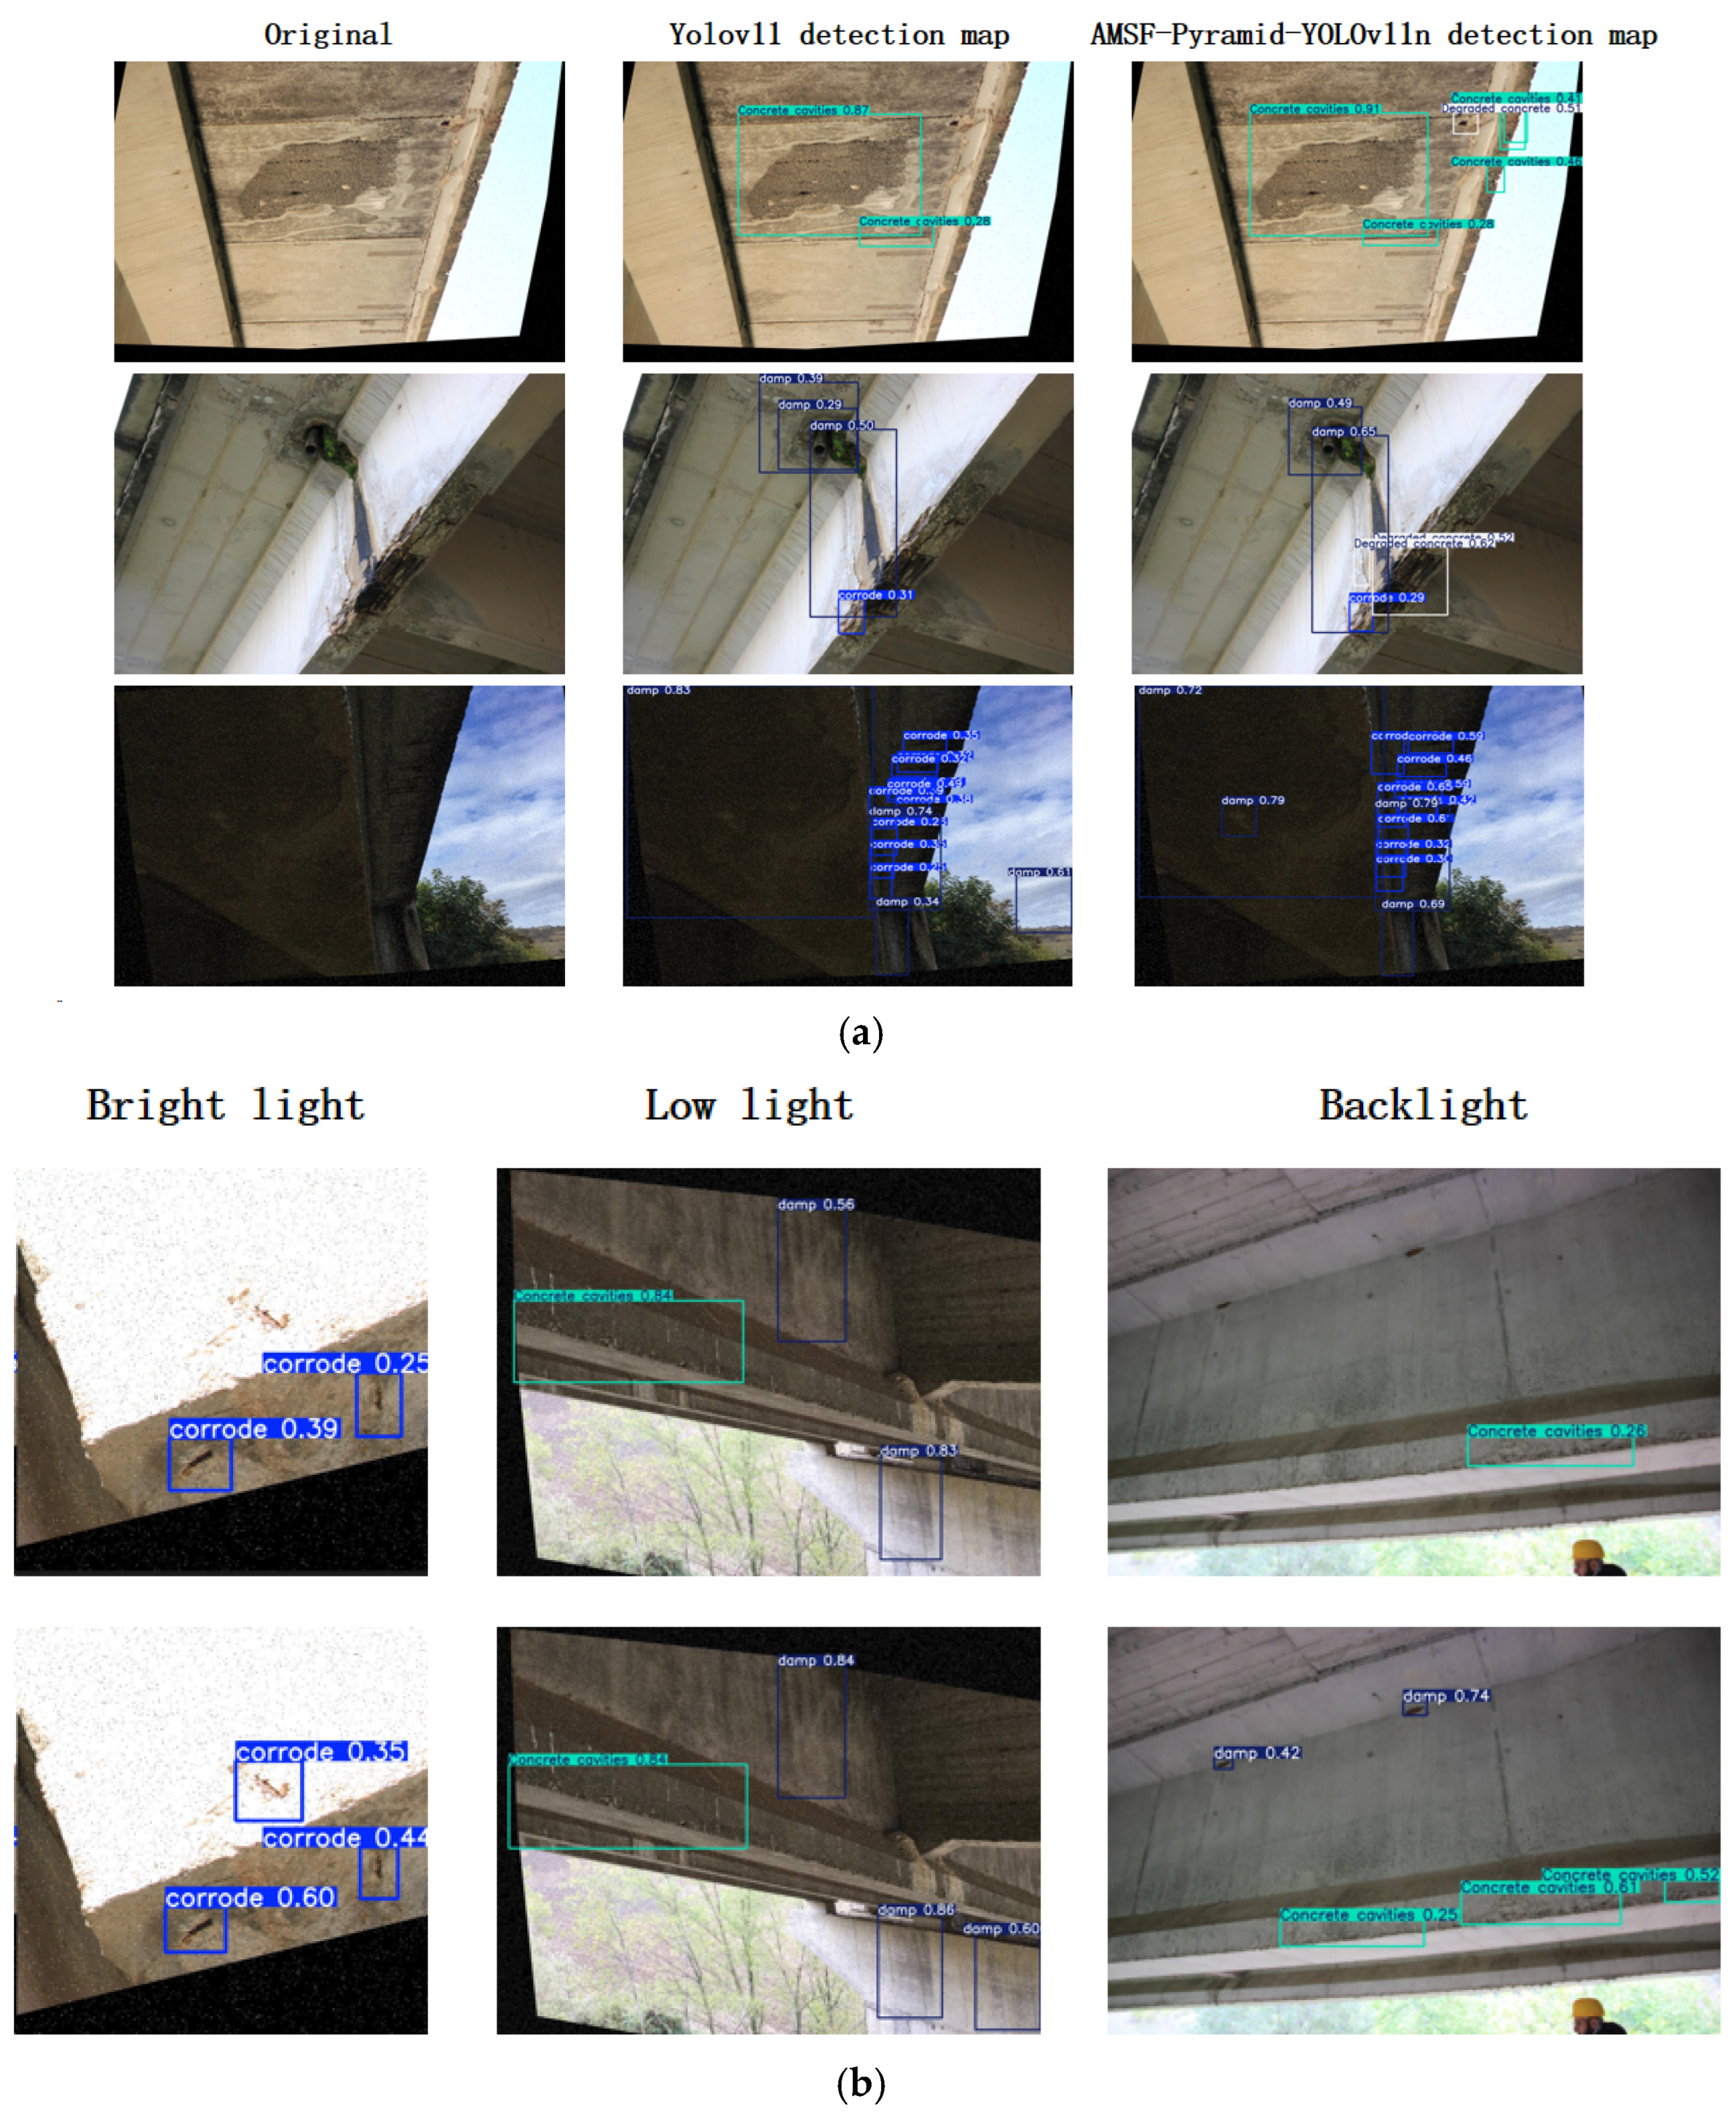
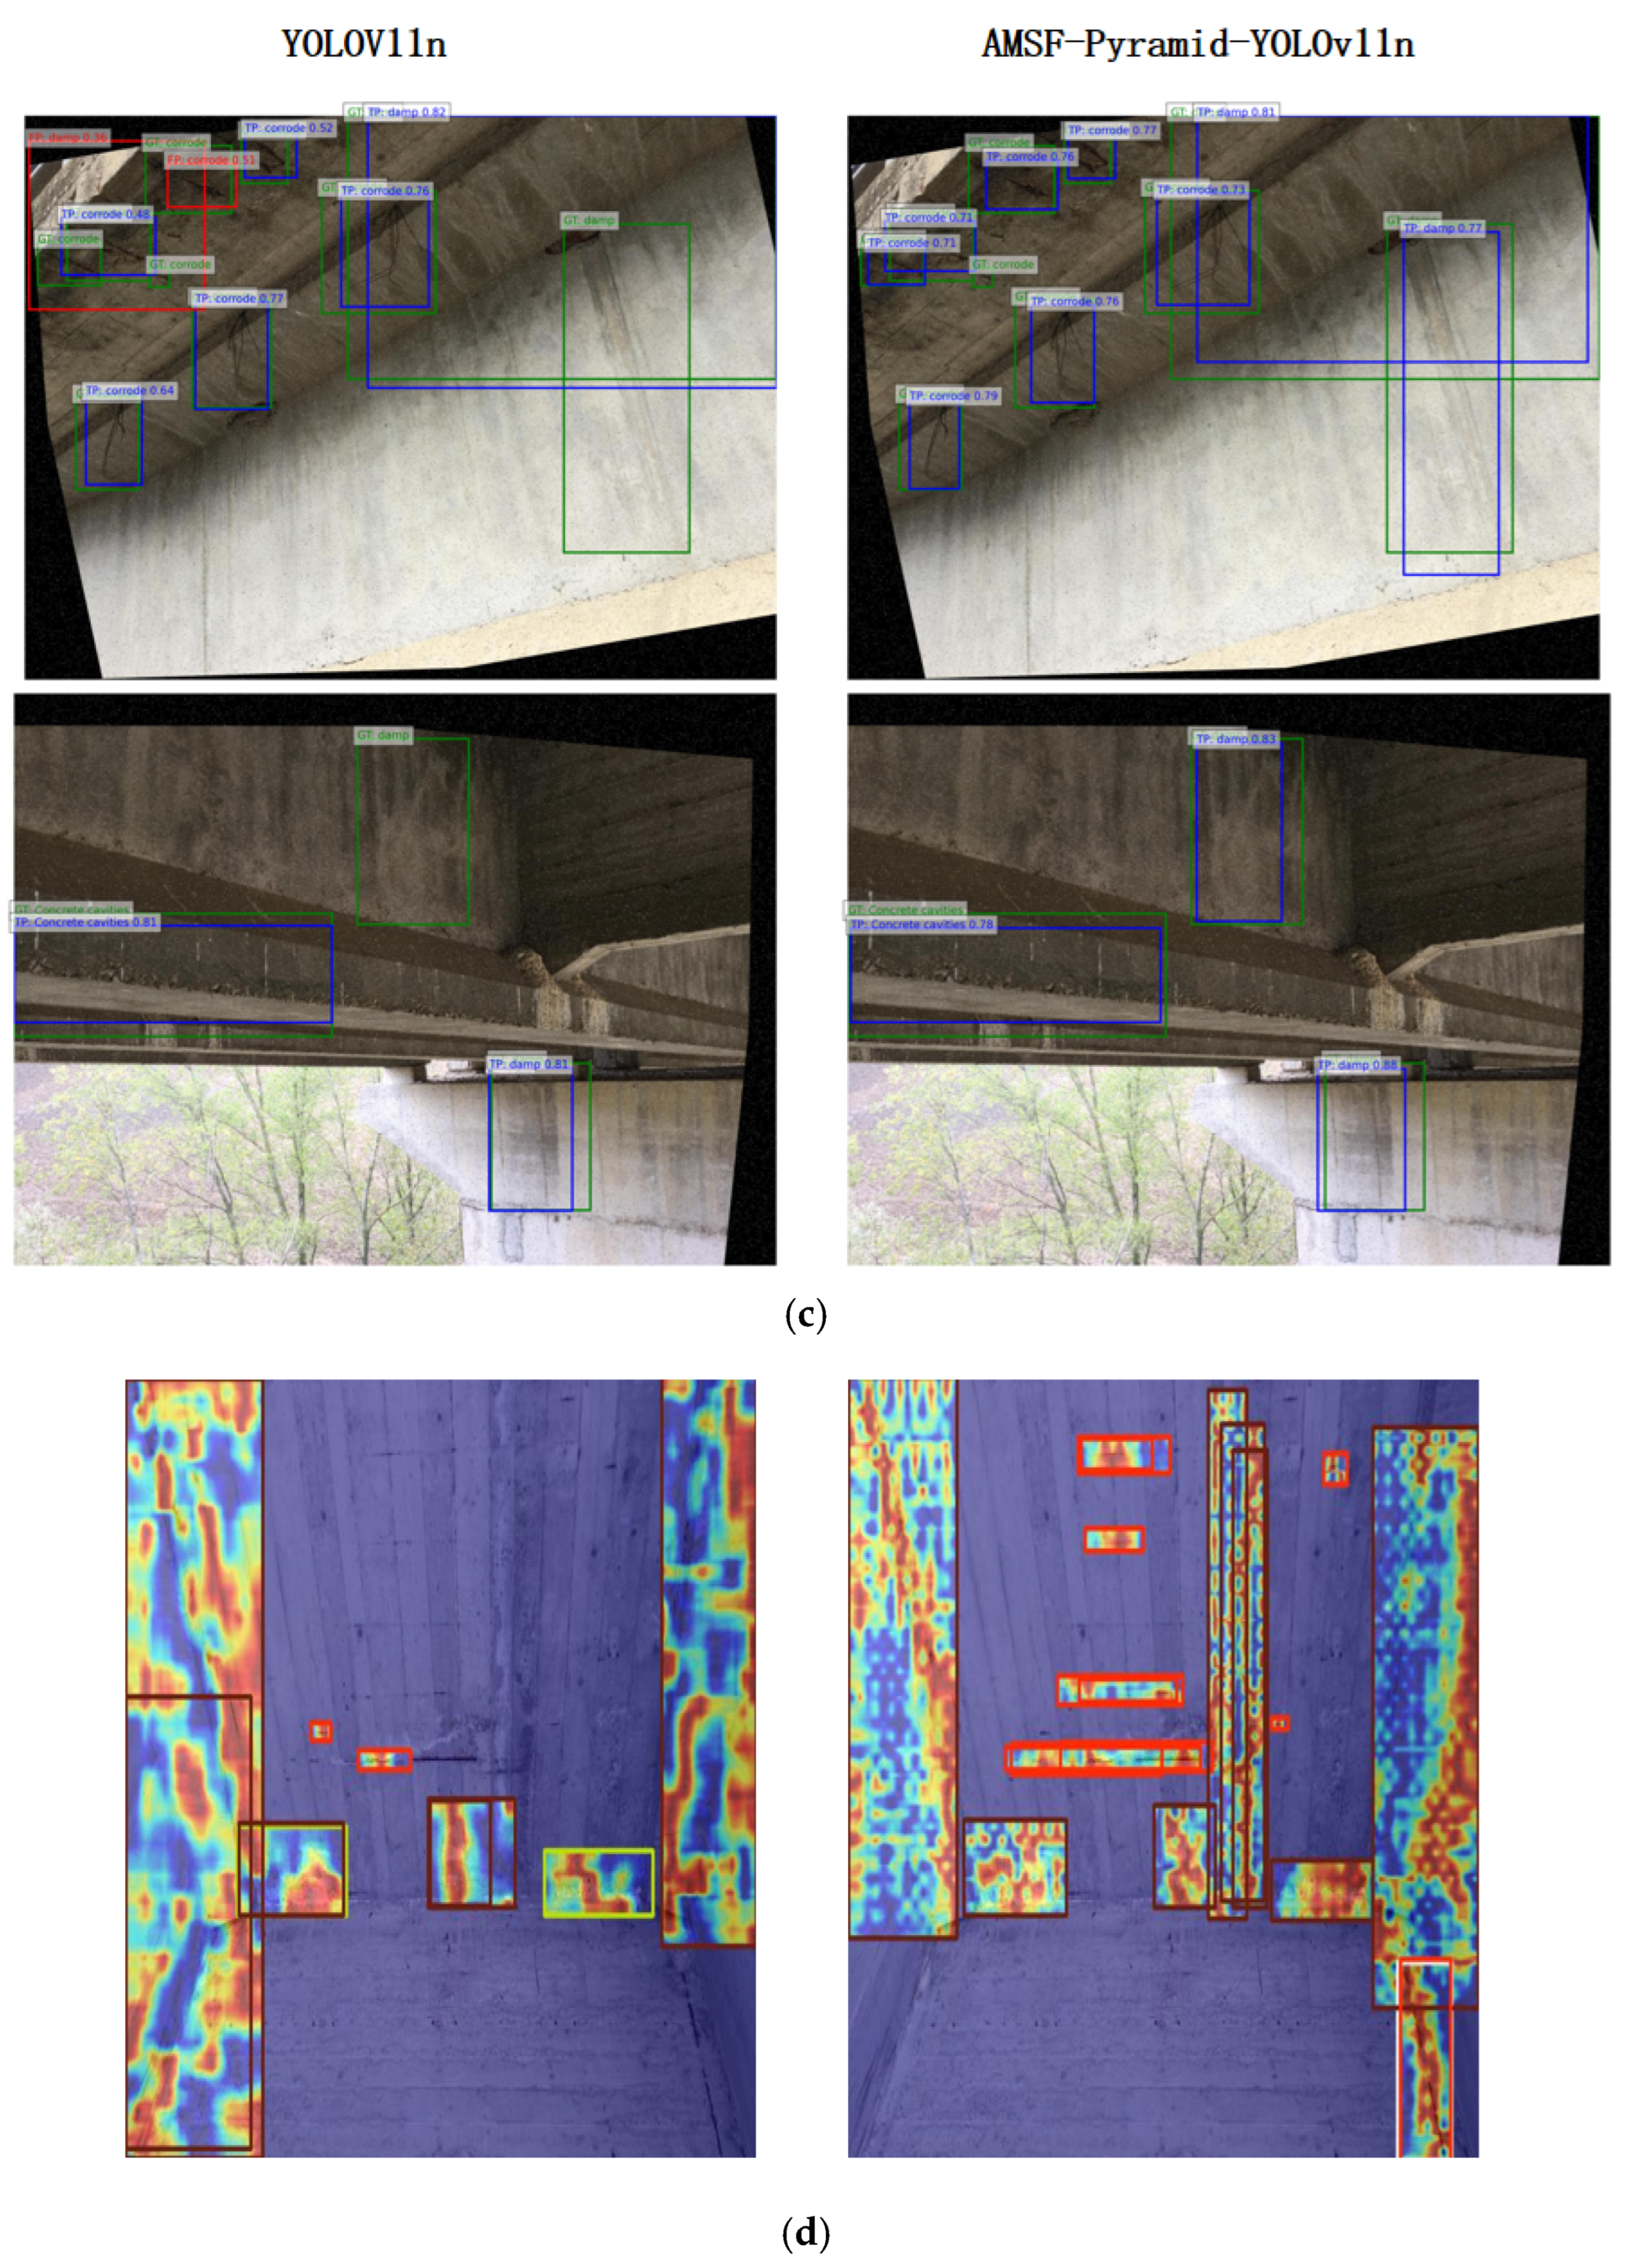
4.5. Visualization of Inspection Results

In this experiment, a visual structural comparison was conducted on the constructed bridge defect dataset, and the detection result comparison is shown in Figure 12a. As illustrated in the first row of images, the original YOLOv11 model detected only two instances of the “Concrete convuls” category, resulting in missed detections. In contrast, the improved model not only detected the same category but also identified an additional “Degraded concrete” defect. This demonstrates that the improved model has stronger multi-class defect detection capabilities, effectively reducing the miss rate for targets in the images.
In the second row of images, for the “damp” target, the improved model achieves higher confidence scores than the original model and successfully detects the “Detachment concrete” category, which was missed by the original model. This indicates that the improved model provides more accurate target discrimination, enabling more reliable localization and recognition of defects.
In the third row of images, the original YOLOv11 model produces dense detection boxes, some with low confidence scores, and even misclassifies a section of the sky as the “damp” category, highlighting issues of redundancy and false detection. In contrast, the improved model generates simpler detection boxes without misclassifying the sky as “damp.” The confidence score distribution is also more reasonable, indicating that the improved model more effectively suppresses background interference, highlights true targets, and improves detection quality and reliability.
Figure 12b compares the performance of YOLOv11n and AMSF-Pyramid-YOLOv11n in detecting targets on bridge structures (e.g., corrosion, damage, and concrete cover) under various lighting scenarios, including bright environments, low light, and backlight. The results demonstrate that AMSF-Pyramid-YOLOv11n offers significant advantages over YOLOv11n.
In bright environments, while YOLOv11n is able to detect “corrode,” its confidence is low, and it identifies fewer targets. AMSF-Pyramid-YOLOv11n, on the other hand, achieves higher confidence and detects a greater number of corrosion targets. Under low-light conditions, YOLOv11n struggles with poor confidence and incomplete detection of targets like “damp.” In contrast, AMSF-Pyramid-YOLOv11n significantly improves confidence for “damp” targets and detects more instances of the same type. In backlit environments, YOLOv11n detects only a limited number of targets, whereas AMSF-Pyramid-YOLOv11n identifies significantly more, including “damp” and “concrete cover.”
In summary, AMSF-Pyramid-YOLOv11n demonstrates superior detection performance across diverse lighting conditions, making it better suited for bridge inspection tasks. It exhibits enhanced target detection capabilities in challenging lighting environments.
Figure 12c provides a comparative visualization of missed and false detections between the YOLOv11n and AMSF-Pyramid-YOLOv11n models. Horizontally, the comparison is between the two models, while vertically, the results are divided into missed detections (top row) and false detections (bottom row). Green boxes (GT) represent ground truth labels, blue boxes (TP) indicate correct predictions, and red boxes (FP) denote false predictions.
In the top-row comparison of missed detections, YOLOv11n exhibits a higher number of missed detections (GT boxes without corresponding TP boxes) and false detections (FP boxes). Conversely, AMSF-Pyramid-YOLOv11n shows fewer FP boxes and achieves better TP coverage of GT boxes, indicating improved control over missed detections. In the bottom-row comparison of false detections, YOLOv11n produces a significant number of FP boxes, whereas AMSF-Pyramid-YOLOv11n dramatically reduces false detections.
In conclusion, by optimizing feature processing, AMSF-Pyramid-YOLOv11n effectively lowers both missed and false detection rates in bridge defect detection. This improvement enhances the model’s robustness and effectiveness, making it more suitable for real-world bridge inspection scenarios.
The heatmap comparison is shown in Figure 12d (with the left side representing the heatmap of the original model and the right side representing the heatmap of the improved model). The heatmap of the original model on the left shows a more dispersed focus on the target regions, with insufficient concentration, potentially leading to missed targets or incorrect focus. By contrast, the heatmap of the improved model on the right demonstrates a more concentrated heat distribution over the target regions (e.g., the elongated object in the middle and the targets at the top). This indicates more precise recognition and localization of the targets. Additionally, the improved model generates more detection boxes with denser distributions (e.g., several additional detection boxes are observed at the top), effectively enhancing its ability to capture targets, reducing interference from non-relevant regions, and improving the comprehensiveness and accuracy of the detection results.
Figure 13a and Figure 13b, respectively, illustrate the changes in the receptive field of the Backbone and feature pyramid before and after the improvements (the left side represents the receptive field of the Backbone, and the right side represents the receptive field of the feature pyramid). In the improved YOLOv11n model, the receptive field gradually decreases from the Backbone to the pyramid structure, which is primarily related to the design of the network architecture and the method of feature processing.
The Backbone typically consists of multiple layers of convolution and down-sampling operations. As the number of layers increases, the receptive field of each unit in the feature map progressively expands, allowing it to capture a broader range of image information. In contrast, the feature pyramid mainly focuses on feature fusion and detail processing rather than continuing the Backbone’s down-sampling strategy to further expand the receptive field.
In the feature pyramid structure, the emphasis lies more on the fusion of features from different levels or processing higher-level features, which inherently have smaller receptive fields. Additionally, some modules prioritize detail extraction and multiscale feature integration rather than expanding the receptive field. Consequently, the final receptive field of the pyramid structure is smaller than that of the Backbone.
This design achieves a balance between global and local information: the Backbone leverages a large receptive field to capture global semantics, while the pyramid structure in the Neck uses a smaller receptive field to process details, thereby improving the accuracy of multiscale object detection.
In Figure 13a, the left image represents the size of the receptive field of the backbone before the model improvement, while the right image represents the size of the receptive field of the feature pyramid before the model improvement. In Figure 13b, the left image represents the size of the receptive field of the backbone after the model improvement, while the right image represents the size of the receptive field of the UGMB feature pyramid after the model improvement.

5. Summary and Outlook

To address challenges in bridge defect detection, including insufficient multiscale feature extraction and complex background interference, this study proposes an enhanced YOLOv11 model integrating four innovative modules. The UGMB module improves detection of low-contrast defects (e.g., early corrosion) via dynamic feature enhancement. The FPSharedConv module achieves cross-scale detection with 40% fewer parameters while improving AP by 3.3% through shared kernels and multi-rate dilated feature extraction. The DTAB module suppresses background noise in dense defect scenes using dilated convolution-enhanced dual attention, boosting AP by 8.7%. The LCB_Detect head enhances adaptability to environmental variations. Evaluated on a five-category bridge defect dataset, the model achieves 60.3% mAP@0.5, outperforming the baseline YOLOv11 by 11.3%.
Future directions include: (1) lightweighting and self-supervised learning to enhance small-sample generalization, (2) cross-modal fusion (infrared/LiDAR) for a unified “detection-diagnosis-prediction” system, and (3) dynamic inference frameworks to balance accuracy and efficiency in UAV-based inspections.

Author Contributions

H.Z. Funding acquisition, Project administration, Supervision, Visualization, Writing–review and editing. C.T. Conceptualization, Formal analysis, Methodology, Software, Validation, Resources, Data curation, Writing–original draft, Writing–review and editing. A.Z. Visualization, Formal analysis, Software, Validation, Writing–original draft, Writing–review and editing. Y.L. Investigation, Validation, Writing–original draft. G.G. Resources, Data curation, Writing–review and editing. Z.Z. Conceptualization, Methodology, Formal analysis, Writing–review and editing. T.Y. Investigation, Validation, Writing–original draft. N.Z. Visualization, Software, Writing–original draft, Writing–review and editing. All authors have read and agreed to the published version of the manuscript.

Funding

This work was supported by the Postgraduate Research and Practice Innovation Program of Jiangsu Province (No. SJCX25_2188).

Data Availability Statement

The self-constructed bridge defect dataset used in this study is publicly available and can be accessed via the following link: https://pan.quark.cn/s/a4ca67bffb17 (accessed on 1 April 2025). The dataset includes 6300 color images of bridge defects (resolution: 2048 × 1536), covering five categories (corrode, fissure, Degraded concrete, Concrete cavities, and damp) under diverse lighting conditions. The dataset is permanently accessible and free for research use. For any questions about data usage, please contact the corresponding author.

Conflicts of Interest

The authors declare no conflicts of interest.

References

  1. Dirmeier, J.; Paterson, J. Renewal and Rejuvenation of Aging Infrastructure. In Routes/Roads; World Road Association (PIARC): Paris, France, 2022; Volume 394. [Google Scholar]
  2. Ye, H.W.; Huang, R.S.; Liu, J.L.; Wang, Y.Q.; Huang, X.J. Analysis of the continuous collapse process of South Korea’s Seongsu Bridge. World Bridges 2021, 49, 87–93. [Google Scholar]
  3. GR, A.N.; Adarsh, S.; Muñoz-Arriola, F. Introducing a climate, demographics, and infrastructure multi-module workflow for projected flood risk mapping in the greater Pamba River Basin, Kerala, India. Int. J. Disaster Risk Reduct. 2024, 112, 104780. [Google Scholar] [CrossRef]
  4. Deng, L.; Wang, W.; Yu, Y. State-of-the-art review on the causes and mechanisms of bridge collapse. J. Perform. Constr. Facil. 2016, 30, 04015005. [Google Scholar] [CrossRef]
  5. Deng, Z.; Huang, M.; Wan, N.; Zhang, J. The current development of structural health monitoring for bridges: A review. Buildings 2023, 13, 1360. [Google Scholar] [CrossRef]
  6. Fernandez, I.; Berrocal, C.G.; Almfeldt, S.; Rempling, R. Monitoring of new and existing stainless-steel reinforced concrete structures by clad distributed optical fibre sensing. Struct. Health Monit. 2023, 22, 257–275. [Google Scholar] [CrossRef]
  7. Zhang, H.; Wu, S.; Huang, Y.; Li, H. Robust multitask compressive sampling via deep generative models for crack detection in structural health monitoring. Struct. Health Monit. 2024, 23, 1383–1402. [Google Scholar] [CrossRef]
  8. Rao, A.S.; Nguyen, T.; Le, S.T.; Palaniswami, M.; Ngo, T. Attention recurrent residual U-Net for predicting pixel-level crack widths in concrete surfaces. Struct. Health Monit. 2022, 21, 2732–2749. [Google Scholar] [CrossRef]
  9. Flah, M.; Suleiman, A.R.; Nehdi, M.L. Classification and quantification of cracks in concrete structures using deep learning image-based techniques. Cem. Concr. Compos. 2020, 114, 103781. [Google Scholar] [CrossRef]
  10. Tang, H.; Xie, Y. Deep transfer learning for connection defect identification in prefabricated structures. Struct. Health Monit. 2023, 22, 2128–2146. [Google Scholar] [CrossRef]
  11. Sohaib, M.; Arif, M.; Kim, J.M. Evaluating YOLO Models for Efficient Crack Detection in Concrete Structures Using Transfer Learning. Buildings 2024, 14, 3928. [Google Scholar] [CrossRef]
  12. Zhang, C.; Karim, M.M.; Qin, R. A multitask deep learning model for parsing bridge elements and segmenting defect in bridge inspection images. Transp. Res. Rec. 2023, 2677, 693–704. [Google Scholar] [CrossRef]
  13. Luo, K.; Kong, X.; Zhang, J.; Hu, J.; Li, J.; Tang, H. Computer vision-based bridge inspection and monitoring: A review. Sensors 2023, 23, 7863. [Google Scholar] [CrossRef]
  14. Campbell, L.E.; Connor, R.J.; Whitehead, J.M.; Washer, G.A. Benchmark for evaluating performance in visual inspection of fatigue cracking in steel bridges. J. Bridge Eng. 2020, 25, 04019128. [Google Scholar] [CrossRef]
  15. Fukuoka, T.; Fujiu, M. Detection of bridge damages by image processing using the deep learning transformer model. Buildings 2023, 13, 788. [Google Scholar] [CrossRef]
  16. Chen, Y.; Yuan, X.; Wang, J.; Wu, R.; Li, X.; Hou, Q.; Cheng, M.-M. YOLO-MS: Rethinking multi-scale representation learning for real-time object detection. IEEE Trans. Pattern Anal. Mach. Intell. 2025, 47, 4240–4252. [Google Scholar] [CrossRef]
  17. Lu, Y.F.; Gao, J.W.; Yu, Q.; Li, Y.; Lv, Y.-S.; Qiao, H. A cross-scale and illumination invariance-based model for robust object detection in traffic surveillance scenarios. IEEE Trans. Intell. Transp. Syst. 2023, 24, 6989–6999. [Google Scholar] [CrossRef]
  18. Huang, L.; Huang, W. RD-YOLO: An effective and efficient object detector for roadside perception system. Sensors 2022, 22, 8097. [Google Scholar] [CrossRef]
  19. Khanam, R.; Hussain, M. Yolov11: An overview of the key architectural enhancements. arXiv 2024, arXiv:2410.17725. [Google Scholar]
  20. Li, S.-F.; Gao, S.-B.; Zhang, Y.-Y. Pose-guided instance-aware learning for driver distraction behavior recognition. J. Image Graph. 2023, 28, 3550–3561. [Google Scholar] [CrossRef]
  21. Hu, K.; Shen, C.; Wang, T.; Xu, K.; Xia, Q.; Xia, M.; Cai, C. Overview of Temporal Action Detection Based on Deep Learning. Artif. Intell. Rev. 2024, 57, 26. [Google Scholar] [CrossRef]
  22. Wang, C.Y.; Liao, H.Y.M.; Wu, Y.H.; Yeh, I.-H.; Chen, P.-Y.; Hsieh, J.-W. CSPNet: A new backbone that can enhance learning capability of CNN. In Proceedings of the IEEE/CVF Conference on Computer Vision and Pattern Recognition Workshops, Seattle, WA, USA, 13–19 June 2020; pp. 390–391. [Google Scholar]
  23. Lau, K.W.; Po, L.M.; Rehman, Y.A.U. Large Separable Kernel Attention: Rethinking the Large Kernel Attention Design in CNN. arXiv 2023, arXiv:2309.01439. [Google Scholar] [CrossRef]
  24. He, K.; Zhang, X.; Ren, S.; Sun, J. Spatial pyramid pooling in deep convolutional networks for visual recognition. IEEE Trans. Pattern Anal. Mach. Intell. 2015, 37, 1904–1916. [Google Scholar] [CrossRef]
  25. Hu, J.; Shen, L.; Sun, G. Squeeze-and-excitation networks. In Proceedings of the IEEE Conference on Computer Vision and Pattern Recognition, Salt Lake City, UT, USA, 18–23 June 2018; pp. 7132–7141. [Google Scholar]
  26. Zhou, L.; Zhou, Y.; Corso, J.J.; Socher, R.; Xiong, C. End-to-end dense video captioning with masked transformer. In Proceedings of the IEEE Conference on Computer Vision and Pattern Recognition, Salt Lake City, UT, USA, 18–23 June 2018; pp. 8739–8748. [Google Scholar]
  27. Lin, T.Y.; Dollár, P.; Girshick, R.; He, K.; Hariharan, B.; Belongie, S. Feature pyramid networks for object detection. In Proceedings of the IEEE Conference on Computer Vision and Pattern Recognition, Honolulu, HI, USA, 21–26 July 2017; pp. 2117–2125. [Google Scholar]
  28. Liu, S.; Qi, L.; Qin, H.; Shi, J.; Jia, J. Path aggregation network for instance segmentation. In Proceedings of the IEEE Conference on Computer Vision and Pattern Recognition, Salt Lake City, UT, USA, 18–23 June 2018; pp. 8759–8768. [Google Scholar]
  29. Zhang, Y.; Qiu, Q.; Liu, X.; Fu, D.; Liu, X.; Fei, L.; Cheng, Y.; Yi, L.; Hu, W.; Zhuge, Q. First Field-Trial Demonstration of L4 Autonomous Optical Network for Distributed AI Training Communication: An LLM-Powered Multi-AI-Agent Solution. arXiv 2025, arXiv:2504.01234. [Google Scholar]
  30. Ding, X.; Zhang, X.; Han, J.; Zhou, Y.; Ding, G.; Sun, J. Scaling up your kernels to 31 × 31: Revisiting large kernel design in cnns. In Proceedings of the IEEE/CVF Conference on Computer Vision and Pattern Recognition, New Orleans, LA, USA, 18–24 June 2022; pp. 11963–11975. [Google Scholar]
  31. Korban, M.; Li, X. Semantics-enhanced early action detection using dynamic dilated convolution. Pattern Recognit. 2023, 140, 109595. [Google Scholar] [CrossRef]
  32. Li, J.; Zhang, Z.; Zuo, W. Rethinking Transformer-Based Blind-Spot Network for Self-Supervised Image Denoising. In Proceedings of the AAAI Conference on Artificial Intelligence, Philadelphia, PA, USA, 25 February–4 March 2025; Volume 39, pp. 4788–4796. [Google Scholar]
  33. Li, W.; Guo, H.; Liu, X.; Liang, K.; Hu, J.; Ma, Z.; Guo, J. Efficient face super-resolution via wavelet-based feature enhancement network. In Proceedings of the 32nd ACM International Conference on Multimedia, Melbourne, Australia, 28 October–1 November 2024; pp. 4515–4523. [Google Scholar]
  34. Dauphin, Y.N.; Fan, A.; Auli, M.; Grangier, D. Language modeling with gated convolutional networks. In Proceedings of the International Conference on Machine Learning, PMLR, Sydney, Australia, 6–11 August 2017; pp. 933–941. [Google Scholar]
  35. Xu, S.; Zheng, S.; Xu, W.; Xu, R.; Wang, C.; Zhang, J.; Teng, X.; Li, A.; Guo, L. Hcf-net: Hierarchical context fusion network for infrared small object detection. In Proceedings of the 2024 IEEE International Conference on Multimedia and Expo (ICME), IEEE, Niagra Falls, ON, Canada, 15–19 July 2024; pp. 1–6. [Google Scholar]
  36. Flotzinger, J.; Rösch, P.J.; Braml, T. dacl10k: Benchmark for semantic bridge damage segmentation. In Proceedings of the IEEE/CVF Winter Conference on Applications of Computer Vision, Waikoloa, HI, USA, 3–8 January 2024; pp. 8626–8635. [Google Scholar]
  37. Zou, Q.; Cao, Y.; Li, Q.; Mao, Q.; Wang, S. CrackTree: Automatic crack detection from pavement images. Pattern Recognit. Lett. 2012, 33, 227–238. [Google Scholar] [CrossRef]
  38. Ren, S.; He, K.; Girshick, R.; Sun, J. Faster R-CNN: Towards real-time object detection with region proposal networks. arXiv 2012, arXiv:1504.08083. [Google Scholar] [CrossRef]
  39. Liu, W.; Anguelov, D.; Erhan, D.; Szegedy, C.; Reed, S.; Fu, C.-Y.; Berg, A.C. Ssd: Single shot multibox detector. In Computer Vision–ECCV 2016, Proceedings of the 14th European Conference, Amsterdam, The Netherlands, 11–14 October 2016; Proceedings, Part I 14; Springer International Publishing: Cham, Switzerland, 2016; pp. 21–37. [Google Scholar]
  40. Zhou, X.; Wang, D.; Krähenbühl, P. Objects as points. arXiv 2019, arXiv:1904.07850. [Google Scholar]
  41. Khanam, R.; Hussain, M. What is YOLOv5: A deep look into the internal features of the popular object detector. arXiv 2024, arXiv:2407.20892. [Google Scholar]
  42. Varghese, R.; Sambath, M. Yolov8: A novel object detection algorithm with enhanced performance and robustness. In Proceedings of the 2024 International Conference on Advances in Data Engineering and Intelligent Computing Systems (ADICS), Chennai, India, 18–19 April 2024; IEEE: Piscataway, NJ, USA, 2024; pp. 1–6. [Google Scholar]
  43. Tian, Y.; Ye, Q.; Doermann, D. Yolov12: Attention-centric real-time object detectors. arXiv 2025, arXiv:2502.12524. [Google Scholar]
  44. Feng, Y.; Huang, J.; Du, S.; Ying, S.; Yong, J.-H.; Li, Y.; Ding, G.; Ji, R.; Gao, Y. Hyper-yolo: When visual object detection meets hypergraph computation. IEEE Trans. Pattern Anal. Mach. Intell. 2024, 47, 2388–2401. [Google Scholar] [CrossRef]
  45. Bianchi, E.; Hebdon, M. COCO-Bridge 2021+ Dataset. University Libraries, Virginia Tech. Dataset. 2021. Available online: https://data.lib.vt.edu/articles/dataset/COCO-Bridge_2021_Dataset/16624495/1 (accessed on 30 April 2025).
Figure 1. Structure diagram of the AMSF-Pyramid-YOLOv11n multi-scale feature extraction and fusion algorithm.
Symmetry 17 01025 g001
Figure 2. Schematic diagram of COPO module structure.
Symmetry 17 01025 g002
Figure 3. Schematic diagram of the FPSharedConv module structure.
Symmetry 17 01025 g003
Figure 4. Schematic diagram of the DTAB module structure.
Symmetry 17 01025 g004
Figure 5. UGMB multi-scale extraction and fusion feature pyramid structure diagram.
Symmetry 17 01025 g005
Figure 6. The upsampling and feature fusion structure of WFU.
Symmetry 17 01025 g006
Figure 7. Schematic diagram of FCGL_MANet module structure.
Symmetry 17 01025 g007
Figure 8. Structure diagram of the HAFB module.
Symmetry 17 01025 g008
Figure 9. Structure diagram of the LCB_Detect multi-scale feature enhancement and decoupling regression detection head.
Symmetry 17 01025 g009
Figure 10. Comparison of improvements.
Symmetry 17 01025 g010
Figure 11. Comparative experiments on five types of bridge defect targets.
Symmetry 17 01025 g011
Figure 12. Before-and-after comparison chart of the improvement. (a) Comparison chart of detection results before and after improvements. (b) Comparison of detection results under different lighting conditions before and after improvement: the top row of images shows the detection results of YOLOv11n, while the bottom row of images shows the detection results of AMSF-Pyramid-YOLOv11n. (c) Bridge Defect Detection: Model Comparison Visualization of Missed Detections (top) and False Detections (bottom). (d) Improved before and after heat comparison chart.
Symmetry 17 01025 g012aSymmetry 17 01025 g012b
Figure 13. The changes in the receptive field of the backbone and feature pyramid before and after improvement.
Symmetry 17 01025 g013
Table 1. The number of samples and their proportions for each category in the bridge defect detection dataset.
Bridge Defect CategoryNumber of SamplesProportion
corrode17,59340.18%
fissure25115.73%
Degraded concreate553412.64%
Concreate cavities616414.08%
damp11,98527.37%
Table 2. Experimental parameter configuration table.
The Name of the ParameterParameter Value
Epochs400
Batch_size16
Image_size640 × 640
patience100
works16
Initial learning rate0.01
Final learning rate0.01
Weight-Decay0.0005
Table 3. Algorithm comparison experiment table.
MethodP(%)R(%)mAP
@0.5(%)
mAP
@0.5:0.95(%)
ParametersGflops
Faster R-CNN [38]43.5234.8831.66--200
SSD [39]45.9935.35535.57--30.7
CenterNet [40]54.639.952.0---
YOLOv5n [41]62.4 43.046.721.02,182,6395.8
YOLOv5s [41]72.351.358.527.57,815,55118.7
YOLOv8n [42]65.845.349.722.93,157,2008.9
YOLOv11n [19]65.044.749.023.42,624,0806.6
YOLOv11s [19]73.953.060.131.19,458,75221.7
YOLOv12n [43]54.838.340.718.92,602,2886.7
YOLOv12s [43]71.151.657.829.69,284,09621.7
Hyper-YOLO [44]67.247.151.424.73,621,7599.5
AMSF-Pyramid-YOLOv11n79.153.060.330.56,021,56011.9
Table 4. Table of ablation experiments.
ABCDP(%)R(%)mAP
@0.5(%)
mAP
@0.5:0.95(%)
Gflops
×××66.745.750.225.110.4
×××69.147.052.325.26.3
×××72.952.257.729.07.8
×××67.847.552.725.46.2
××68.246.551.426.010.2
××68.646.852.927.110.5
××65.647.451.025.110.3
××73.050.857.127.98.2
××68.347.753.325.17.0
××69.249.053.625.49.1
×77.452.659.529.812.2
×70.448.253.025.710.3
×60.739.241.920.45.3
×70.445.751.525.610.4
79.153.060.330.511.9
Table 5. UGMB ablation experiment table.
abcP(%)R(%)mAP
@0.5(%)
mAP
@0.5:0.95(%)
Gflops
××71.549.055.227.08.5
××65.845.851.023.87.8
××65.747.6251.1124.77.1
×67.144.849.024.17.6
×70.549.352.426.59.7
×69.249.053.625.410.1
79.153.060.330.511.9
Table 6. Generalization experiment results.
AlgorithmP(%)R(%)mAP
@0.5(%)
mAP
@0.5:0.95(%)
FPS
YOLOV11n19.013.615.95.95198.3
AMSF-Pyramid-YOLOv11n22.216.617.76.0885.2
Disclaimer/Publisher’s Note: The statements, opinions and data contained in all publications are solely those of the individual author(s) and contributor(s) and not of MDPI and/or the editor(s). MDPI and/or the editor(s) disclaim responsibility for any injury to people or property resulting from any ideas, methods, instructions or products referred to in the content.

