Article

Multi-Factor Analysis and Graded Remediation Strategy for Goaf Stability in Underground Metal Mines: Fluid–Solid Coupling Simulation and Genetic Algorithm-Based Optimization Approach

1
School of Resources, Environment and Materials, Guangxi University, Nanning 530004, China
2
Key Laboratory of Minerals Engineering, Guangxi Higher School, Nanning 530004, China
3
Archives, Guangxi Minzu University, Nanning 530006, China
*
Authors to whom correspondence should be addressed.
Symmetry 2025, 17(7), 1024; https://doi.org/10.3390/sym17071024
Submission received: 4 June 2025 / Revised: 23 June 2025 / Accepted: 25 June 2025 / Published: 30 June 2025
(This article belongs to the Section Mathematics)

Abstract

To ensure the green, safe, and efficient extraction of mineral resources and promote sustainability, the stability of mined-out areas has become a critical factor affecting safe production and ecological restoration in underground metal mines. The instability of underground goafs poses a significant threat to mine safety, especially when irregular excavation patterns interact with high ground stress, exacerbating instability risks. Most existing studies lack a systematic and multidisciplinary integrated framework for comprehensive evaluation and management. This paper proposes a trinity research system of “assessment–optimization–governance”, integrating theoretical analysis, three-dimensional fluid–solid coupling numerical simulation, and a filling sequence optimization method based on genetic algorithms. An analysis of data measured from 243 pillars and 49 goafs indicates that approximately 20–30% of the pillars have a factor of safety (FoS) below 1.0, signaling immediate instability risks; additionally, 58% do not meet the threshold for long-term stability (FoS ≥ 1.5). Statistical and spatial analyses highlight that pillar width-to-height ratio (W/H) and cross-sectional area significantly influence stability; when W/H exceeds 1.5, FoS typically surpasses 2.0. Numerical simulations reveal pore water pressures of 1.4–1.8 MPa in deeper goafs, substantially reducing effective stress and accelerating plastic zone expansion. Stability classification categorizes the 49 goafs into 7 “poor”, 37 “moderate”, and 5 “good” zones. A genetic algorithm-optimized filling sequence prioritizes high-risk area remediation, reducing maximum principal stress by 60.96% and pore pressure by 28.6%. Cemented waste rock filling applied in high-risk areas, complemented by general waste rock filling in moderate-risk areas, significantly enhances overall stability. This integrated method provides a scientific foundation for stability assessment and dynamic remediation planning under complex hydrogeological conditions, offering a risk-informed and scenario-specific application of existing tools that improves engineering applicability.

1. Introduction

To meet the growing demand for mineral resources driven by economic development and to maintain steady economic growth, mineral resource exploitation continues to extend deeper underground. Due to unreasonable mining practices during the early stages of extraction, the instability and collapse of underground goafs pose significant potential hazards to subsequent underground mining and roadway restoration processes [1,2,3]. In underground metal mines, the stability of the surrounding rock and goafs is directly related to the normal production and safety of the mine, and also affects the economic benefits of the mining operation [4,5,6]. The stability of goafs in metal mines has become a major challenge in the field of global mining engineering. Statistics show that most collapse accidents in underground metal mines are related to poor management of underground voids, and lead–zinc mines are particularly susceptible to the influence of unstable goafs due to the complex geometry of their ore bodies [7,8]. For example, at the Baiyin Nuoru lead–zinc mine, the volume of historically abandoned goafs exceeds one million cubic meters. These goafs have led to dynamic disasters such as rock ejection and roof collapse during roadway excavation [9]. At the Ordzhonikidze mine in Ukraine, the instability of goafs resulted in large-scale surface damage and casualties [10]. At the Yuanbaowan Coal Mine in Shuozhou, Shanxi, the room-and-pillar mining method resulted in the formation of numerous goafs, leading to the collapse of overlying coal pillars and the occurrence of strong ground pressure and surface subsidence in the longwall working face and at the surface [11]. These accidents not only result in significant economic losses, but also pose serious threats to the lives of miners.
The instability mechanism of goafs under underground mining conditions exhibits the following characteristics: (1) Under prolonged high-stress conditions, the edge regions of the pillar yield first, resulting in a gradual reduction in the effective load-bearing area. The stress is subsequently transferred toward the core area, ultimately triggering progressive failure from the outside inward [12,13,14]. (2) Chain reactions triggered by hydrogeological disturbances—particularly rock mass softening caused by water erosion in the karst regions of southern China—are factors that cannot be ignored [15,16]. Determining an effective method for goaf stability analysis is a prerequisite for goaf remediation and also a central theme in academic research in this field.
B.A. Poulsen et al. broke through the limitations of traditional pillar strength theories and, through analysis of the pressure arch effect, revealed the synergistic load-bearing mechanism between pillar geometric parameters and the spatial configuration of the roof [17]. Zhao Q et al. revealed the controlling effect of the structural surface network on the damage evolution pattern of goaf-surrounding rock through a systematic investigation of structural planes within the goaf [18]. P. Lunder et al., based on a summary of previous research, proposed that the long-term stability of pillars must satisfy both strength and stress equilibrium conditions, and derived a classical strength calculation formula [19]; Esterhuizen G. S. et al., combining field failure cases with numerical simulations, systematically elucidated pillar instability modes and proposed a strength prediction method based on failure patterns [20]. Fang Z et al. found that pillar fracturing exhibits nonlinear characteristics [21]. Xie X. B. et al. integrated catastrophe theory and rheological theory within a three-dimensional mechanical model, proposed a system stability criterion, and developed an analytical algorithm, emphasizing the critical roles of roof stiffness and goaf size [22]; Zhao Y et al. developed an overlapped roof strength reduction model based on catastrophe theory, revealing the influence of the thickness-to-span ratio on the factor of safety and the coupled instability mechanism between upper and lower sections [23]. Xu Z. C. et al. established a numerical model of goaf movement and deformation and analyzed surface subsidence through FLAC3D simulation to identify the extent of unstable zones [24]; Jia H. W. et al., based on dynamic feedback from multi-point displacement meter measurements, performed creep damage calculations using FLAC3D, comprehensively and intuitively illustrating the mechanical state of deformation and damage in their study area, thereby providing a more rational basis for risk identification [25].
In summary, for the complex engineering problem of goaf stability analysis in underground mines, the overall stability of projects is primarily studied using theoretical calculations combined with numerical simulation methods. However, research covering the full process of goaf risk assessment, structural optimization, and backfill remediation in specific mines involving combined open-pit and underground mining remains rare. This paper implements a structured “assessment–optimization–governance” framework, refining existing concepts by introducing a risk-driven optimization model supported by 3D fluid–solid coupling analysis limit span theory, fluid–solid coupling numerical simulation, and field monitoring data and constructing an optimization model targeting risk level, stress state, and spatial relationship. A graded remediation scheme is proposed, providing a theoretical reference for the stability evaluation and remediation of rock masses in underground mine goafs.

2. Research Methods

The Xijikeng lead–zinc mining area is located in Houlü Township, Guiping City, Guangxi Province, China, with a production capacity of 450,000 t/a. It is an old mine that has been in operation for many years. The ore body is nearly horizontal in shape and is mined using a combined open-pit and underground mining method. Early-stage mining formed two open pits and a large number of underground goafs. The open pits are divided into two benches, ranging from an elevation of +40 m to +20 m. The underground mining levels are divided into −20 m, −50 m, and −80 m levels. In order to further extend mineral resource exploitation to greater depths, it is necessary to first understand the basic conditions of the goafs and then use theoretical calculations and numerical simulations to analyze the risks of goaf instability and water inrush. Based on these analyses, recommendations are proposed in accordance with the actual conditions of the mine.

2.1. Goaf Failure Theory and Stability Analysis

Before conducting theoretical and numerical simulations for goaf stability analysis, it is necessary to determine the mechanical parameters of the rock mass. Directly applying physical and mechanical parameters obtained from laboratory rock samples to numerical simulations may lead to significant discrepancies from in situ conditions. Therefore, mining data were collected and categorized based on the characteristics of the surrounding rock and geological features of the mine. The following two main lithological units were considered: the surrounding rock (dolomite) and the ore body. The mechanical parameters of these rocks were processed using the Hoek–Brown criterion [26].
σ 1 = σ 3 + σ c ( m σ 3 σ c + S ) α
m b = m i exp ( G S I 100 28 14 D ) s = exp ( G S I 100 9 3 D ) α = 1 2 + 1 6 ( e G S I 15 e 20 3 )
where σ1 denotes the maximum principal stress at rock mass failure; σ3 refers to the minimum principal stress causing rock mass failure; σc represents the uniaxial compressive strength of intact rock; mi is the material constant of intact rock; D is the disturbance factor, ranging from 0 to 1; and S reflects the parameter reflecting the degree of rock mass fracturing.
The reduced mechanical parameters of the surrounding rock and ore body are shown in Table 1.
To improve the efficiency of goaf identification and enhance the clarity of graphical representations, a unified coding system was adopted for goafs resulting from current mining operations and those expected in the next 3–5 years. Goafs in the eastern wing are denoted by “EA”, with labels such as “East-1” simplified to “EA1”; those in the western wing are represented by “WA”, such that “West-1” becomes “WA1”. Goafs without directional designations are labeled with “A”, for example, “No. 1” becomes “A1”, and the rest follow accordingly. The classification of goaf codes is illustrated in Figure 1.
Based on Bieniawski’s pillar strength theory, a pillar stability evaluation method was adopted to calculate the factor of safety. This method requires first defining the load-bearing area assigned to each pillar. For the irregular layout of legacy pillars in the mine, a uniform area distribution approach was applied for systematic partitioning. If a pillar was located near the boundary of a goaf, the roof area was divided using a line connecting the midpoints between the pillar and the goaf boundary.
The pillar strength calculation formula recommended by Bieniawski is as follows [27]:
S p = S L · [ 0.64 + 0.36 ( W p / h ) ] α
F = S P ( r y · z y + r t · z t ) · S Y Z S K Z
where Sp denotes the strength of the pillar; SL represents the ultimate compressive strength of the pillar, taken as 8.93 MPa; Wp and h refer to the width and height of the pillar, respectively; α is a constant, assigned a value of 1.0; ry and rt indicate the unit weight of the surrounding rock and the overburden soil, respectively, taken as 28.5 KN/m3 and 18 KN/m3; zy and zt correspond to the thickness of the roof rock and the overburden soil, respectively (1 m); and Syz and Skz denote the support area and the area of the pillar, respectively.
By measuring the pillars within each subdivided goaf area and substituting the results into Equations (3) and (4), the pillar safety factors for each goaf were calculated, as shown in Figure 2.
Based on a comprehensive analysis of 243 pillar samples, a systematic statistical assessment is conducted on the geometric characteristics, safety performance, and stability status of the pillars. In terms of geometric parameters, the pillar height ranges from 9.83 m to 13.89 m, with an average height of 11.82 m, indicating that the pillar heights within the goafs are relatively concentrated, with most pillars falling between 10 m and 13 m. The pillar width exhibits a broader variation, ranging from a minimum of 6.04 m to a maximum of 17.93 m. Roof thickness is primarily distributed between 30 m and 55 m. The support area of the pillars varies significantly, with values ranging from 154 m2 to 577 m2, while the load-bearing area of the pillars themselves ranges from 24 m2 to 213 m2, reflecting a certain degree of dimensional heterogeneity among the pillars.
Figure 2a provides the statistical characteristics of the overall pillar stability level, which is helpful for determining the threshold for high-risk identification. As shown in Figure 2a, the distribution of the factor of safety (FoS) for the pillar samples exhibits a right-skewed pattern, with most FoS values concentrated between 1.0 and 2.0. The median near the peak of the distribution is approximately 1.37, and the average is 1.58. This indicates that, overall, the pillar design incorporates a slight but limited safety margin, with the majority of pillars falling between critically stable and moderately stable states.
However, the left tail of the FoS distribution reveals that a considerable proportion of pillars fall below the critical safety threshold of 1.0. In Figure 2a, the region where FoS < 1.0 is highlighted with a distinct background color to denote the high-risk zone. A secondary peak appears in the kernel density curve within this range, suggesting that a group of pillars have notably low safety factors and are at risk of structural instability. Statistical analysis shows that approximately 20–30% of the pillars have an FoS below 1.0, indicating a direct risk of failure. Furthermore, for long-term stability, the FoS must exceed 1.5; nearly 58% of the pillars do not meet this requirement (i.e., all with FoS < 1.5), warranting serious attention.
Figure 2b further reveals the controlling effect of pillar geometric parameters on stability. The scatter distribution and LOWESS (locally weighted scatterplot smoothing) fitted curve indicate a general positive correlation between the factor of safety (FoS) and width-to-height (W/H) ratio of the pillars: as the W/H ratio increases, the FoS rises significantly.
Qualitatively, this suggests that short and thick pillars (i.e., those with larger W/H ratios) tend to be more stable, whereas tall and slender pillars (those with lower W/H ratios) are more prone to failure. Quantitatively, this trend manifests as follows: when the W/H ratio increases from approximately 0.5 to 1.0, the FoS gradually increases from below 1.0 to nearly 1.5; as the W/H ratio continues to exceed 1.5, most pillars exhibit FoS values consistently above 2.0, indicating a sufficient safety margin. The LOWESS curve begins to level off at a W/H ratio of around 1.5, implying that once a pillar becomes sufficiently short and wide, further increases in width yield diminishing returns in terms of stability improvement.
These results demonstrate that the W/H ratio is one of the primary parameters governing pillar stability: the greater the W/H ratio (i.e., the relatively shorter and thicker the pillar), the more its load-bearing capacity increases relative to the self-weight of the overlying strata, and the more significantly its structural stability is enhanced.
Figure 2c extends the relationship between pillar width, height, and the factor of safety (FoS) into a higher-dimensional space by using point color to represent pillar thickness, thereby comprehensively reflecting the influence of multiple geometric parameters on stability. The figure shows that the distribution of FoS on the width–height plane exhibits clear zoning: regions with a large width and small height concentrate higher FoS values, with many points exceeding 2.0. The colors of these points also indicate relatively large thicknesses, implying larger cross-sectional areas.
In contrast, in regions where pillar width is small and height is large, almost all FoS values fall below 1.5—many even below 1.0—indicating instability, and these points are mostly associated with lower thickness values. Notably, the color gradient of the point cloud illustrates the auxiliary effect of pillar thickness (or cross-sectional area) on stability: under similar width and height conditions, pillars with a greater thickness generally exhibit higher FoS values, whereas those with an insufficient thickness are more likely to approach the instability threshold.
This demonstrates that, in addition to the width-to-height ratio, the absolute size of a pillar—particularly its cross-sectional area—is also a critical factor influencing stability. A larger cross-section implies a greater load-bearing area, reduced stress per unit area, and consequently, improved compressive stability.
Figure 2d clearly illustrates the spatial variability in pillar stability across different regions. As shown in the figure, there are significant differences in both the average factor of safety (FoS) and the proportion of unstable pillars among the various goaf subareas. For instance, subareas A3 and A5 exhibit notably low average FoS values, with an instability ratio reaching 100%, indicating that all pillars in these areas are in an unstable state, classifying them as high-risk goaf zones.
In contrast, subareas such as A4, WA5, and EA4 show higher average FoS values, with the vast majority of pillars remaining stable (e.g., in WA5, approximately 89% of the pillars are stable, with only about 11% being unstable). Particularly, in WA3, all four groups of pillars have FoS values exceeding the stability threshold.
This quantitative comparison based on the heatmap demonstrates that pillar stability is significantly influenced by the spatial location within the goaf. Variations in support conditions and geometric characteristics across regions lead to differing levels of structural stability. By using the heatmap to identify areas with high concentrations of unstable pillars, priority reinforcement or backfilling measures can be implemented in these zones, thereby providing a macro-level understanding and control of overall goaf stability.
To further enhance the accuracy and scientific rigor of the stability assessment, a comprehensive three-dimensional numerical simulation analysis will be conducted for the mining area, incorporating factors such as the mechanical properties of the rock mass, mining-induced disturbances, and groundwater seepage.

2.2. Stability Analysis of Goafs Based on FLAC3D 6.0

Based on previous risk assessments of goafs, a numerical model was developed to closely match the actual hydrogeological conditions, rock mass parameters, and spatial distribution of the goafs in the mining area. A fluid–solid coupling analysis method was employed to simulate the dynamic interaction between the groundwater seepage field and the stress field of the surrounding rock in the goafs.
In this study, FLAC3D 6.0 was selected as the numerical simulation platform. FLAC3D 6.0 is based on the Finite Difference Method (FDM), which discretizes the governing equations of continuum mechanics using explicit time-stepping schemes. This method is particularly effective for simulating nonlinear, large-strain, and time-dependent geotechnical problems such as excavation-induced deformation, plastic failure, and pore pressure evolution in rock masses. Compared to the Finite Element Method (FEM), FDM offers a greater computational efficiency and numerical stability for problems involving progressive failure and large plastic zones. Furthermore, FLAC3D 6.0 provides a built-in fluid–solid coupling module, allowing for the direct simulation of groundwater seepage and its interaction with the mechanical behavior of the rock mass, which is critical in goaf stability analysis under hydrogeological conditions.

2.2.1. Basic Assumptions

Due to the presence of various types of joints and fractures in actual rock masses, along with the combined effects of multiple external factors, the numerical simulation in this study is established based on the following assumptions:
  • Continuum assumption: The rock mass is considered as a continuous, homogeneous, or quasi-homogeneous medium, ignoring distinct structural fractures, joints, and other discontinuities, so that its deformation and failure can be described using the theory of continuum mechanics.
  • Equilibrium of initial stress and hydraulic conditions: It is assumed that the initial geostress field and pore water pressure field are in equilibrium at the time that the model is established. The distributions of initial stress, pore water pressure, and seepage conditions are considered to be stable.
  • Simplified one-way coupling: The seepage field is computed first, followed by the updating of mechanical parameters for stress analysis.
  • Fluid flow assumption: Fluid flow follows Darcy’s law, and hydraulic parameters such as permeability and porosity remain constant within a defined range. The fluid is assumed to be incompressible or only slightly compressible.
  • Simplified mechanical constitutive model: Rock mass behavior is described by a classical elastoplastic constitutive relationship using the Mohr–Coulomb model, while neglecting temperature effects, chemical reactions, and other complex influences.
  • Idealized boundary conditions: The far-field boundaries of the model are assumed to be fixed or subject to simple linear variations, ensuring that local disturbances in the goaf are not affected by unrealistic boundary effects.
In this study, the Mohr–Coulomb elastoplastic constitutive model was used for both the rock mass and the backfill materials in the FLAC3D 6.0 simulations. This model is widely adopted in geomechanical modeling and allows for a representation of shear failure through the friction angle and cohesion, and tensile failure through the tensile strength parameter.
Mechanical parameters for the surrounding rock and ore body were obtained from laboratory tests and adjusted using the Hoek–Brown criterion, as shown in Table 1. For cemented and uncemented waste rock backfill, reduced stiffness and strength values were applied to reflect their granular or semi-consolidated behavior. Neither strain-softening nor creep effects were considered in the current simulations.
The boundary conditions of the model were defined as follows: the bottom boundary was fixed in all directions to restrict displacement; lateral boundaries were fixed in the horizontal (normal) direction to prevent lateral movement; and the top surface was left free to deform under stress. In the fluid–solid coupling model, lateral and bottom boundaries were assumed to be impermeable, and a constant hydraulic head was applied at the top surface to simulate infiltration.

2.2.2. Numerical Simulation Research Framework

A numerical analysis method is employed to systematically investigate the coupled mechanical and seepage interactions between underground goafs and open-pit structures. First, a numerical simulation scheme incorporating fluid–solid coupling analysis is formulated based on the research objectives, engineering geological conditions, and technical requirements. Subsequently, a geological model is established under the existing geological settings, followed by mesh construction and the definition of boundary conditions, mechanical parameters, and hydraulic parameters.
Initial geostress and groundwater pressure fields are obtained through preliminary calculations. The excavation processes of each mining structure are then simulated sequentially, with real-time monitoring of the evolution of the stress field, displacement field, plastic zones, and pore water pressure. Finally, the stability of the underground goafs is comprehensively analyzed, and corresponding remediation measures are proposed.

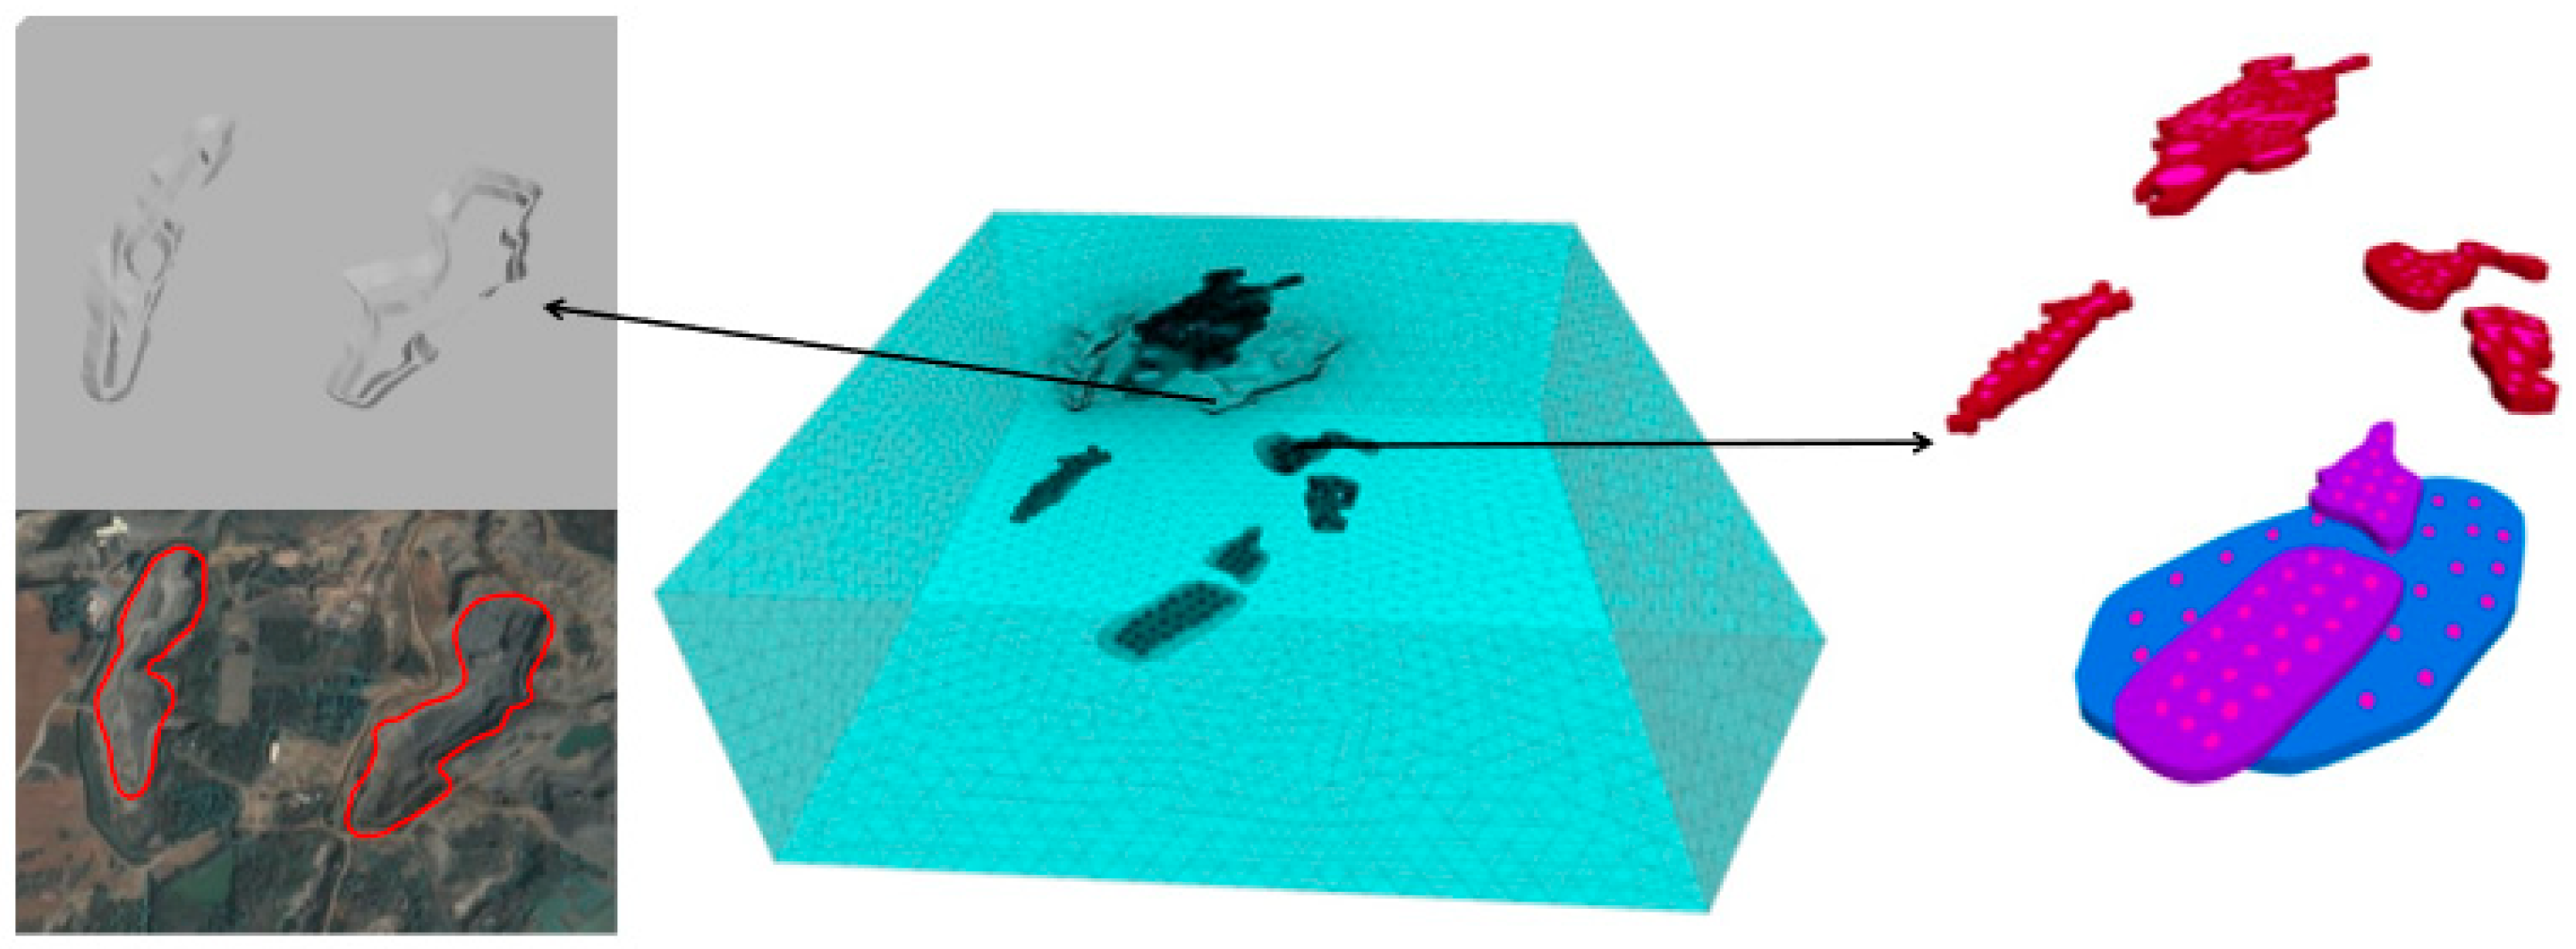
2.2.3. Model Construction and Mesh Generation

Considering the particularities of goaf modeling, the equivalent height modeling method was adopted for three-dimensional reconstruction. A collaborative modeling approach involving multiple software platforms—AutoCAD 2024, Rhino 7.0, and FLAC3D 6.0—was employed to ensure both the accurate representation of geological features and the numerical stability required for simulation. Mesh refinement was applied specifically in the goaf regions. The final model consisted of 509,736 mesh elements and 2,974,357 nodes. The structure of the established 3D model of the mining area is shown in Figure 3.

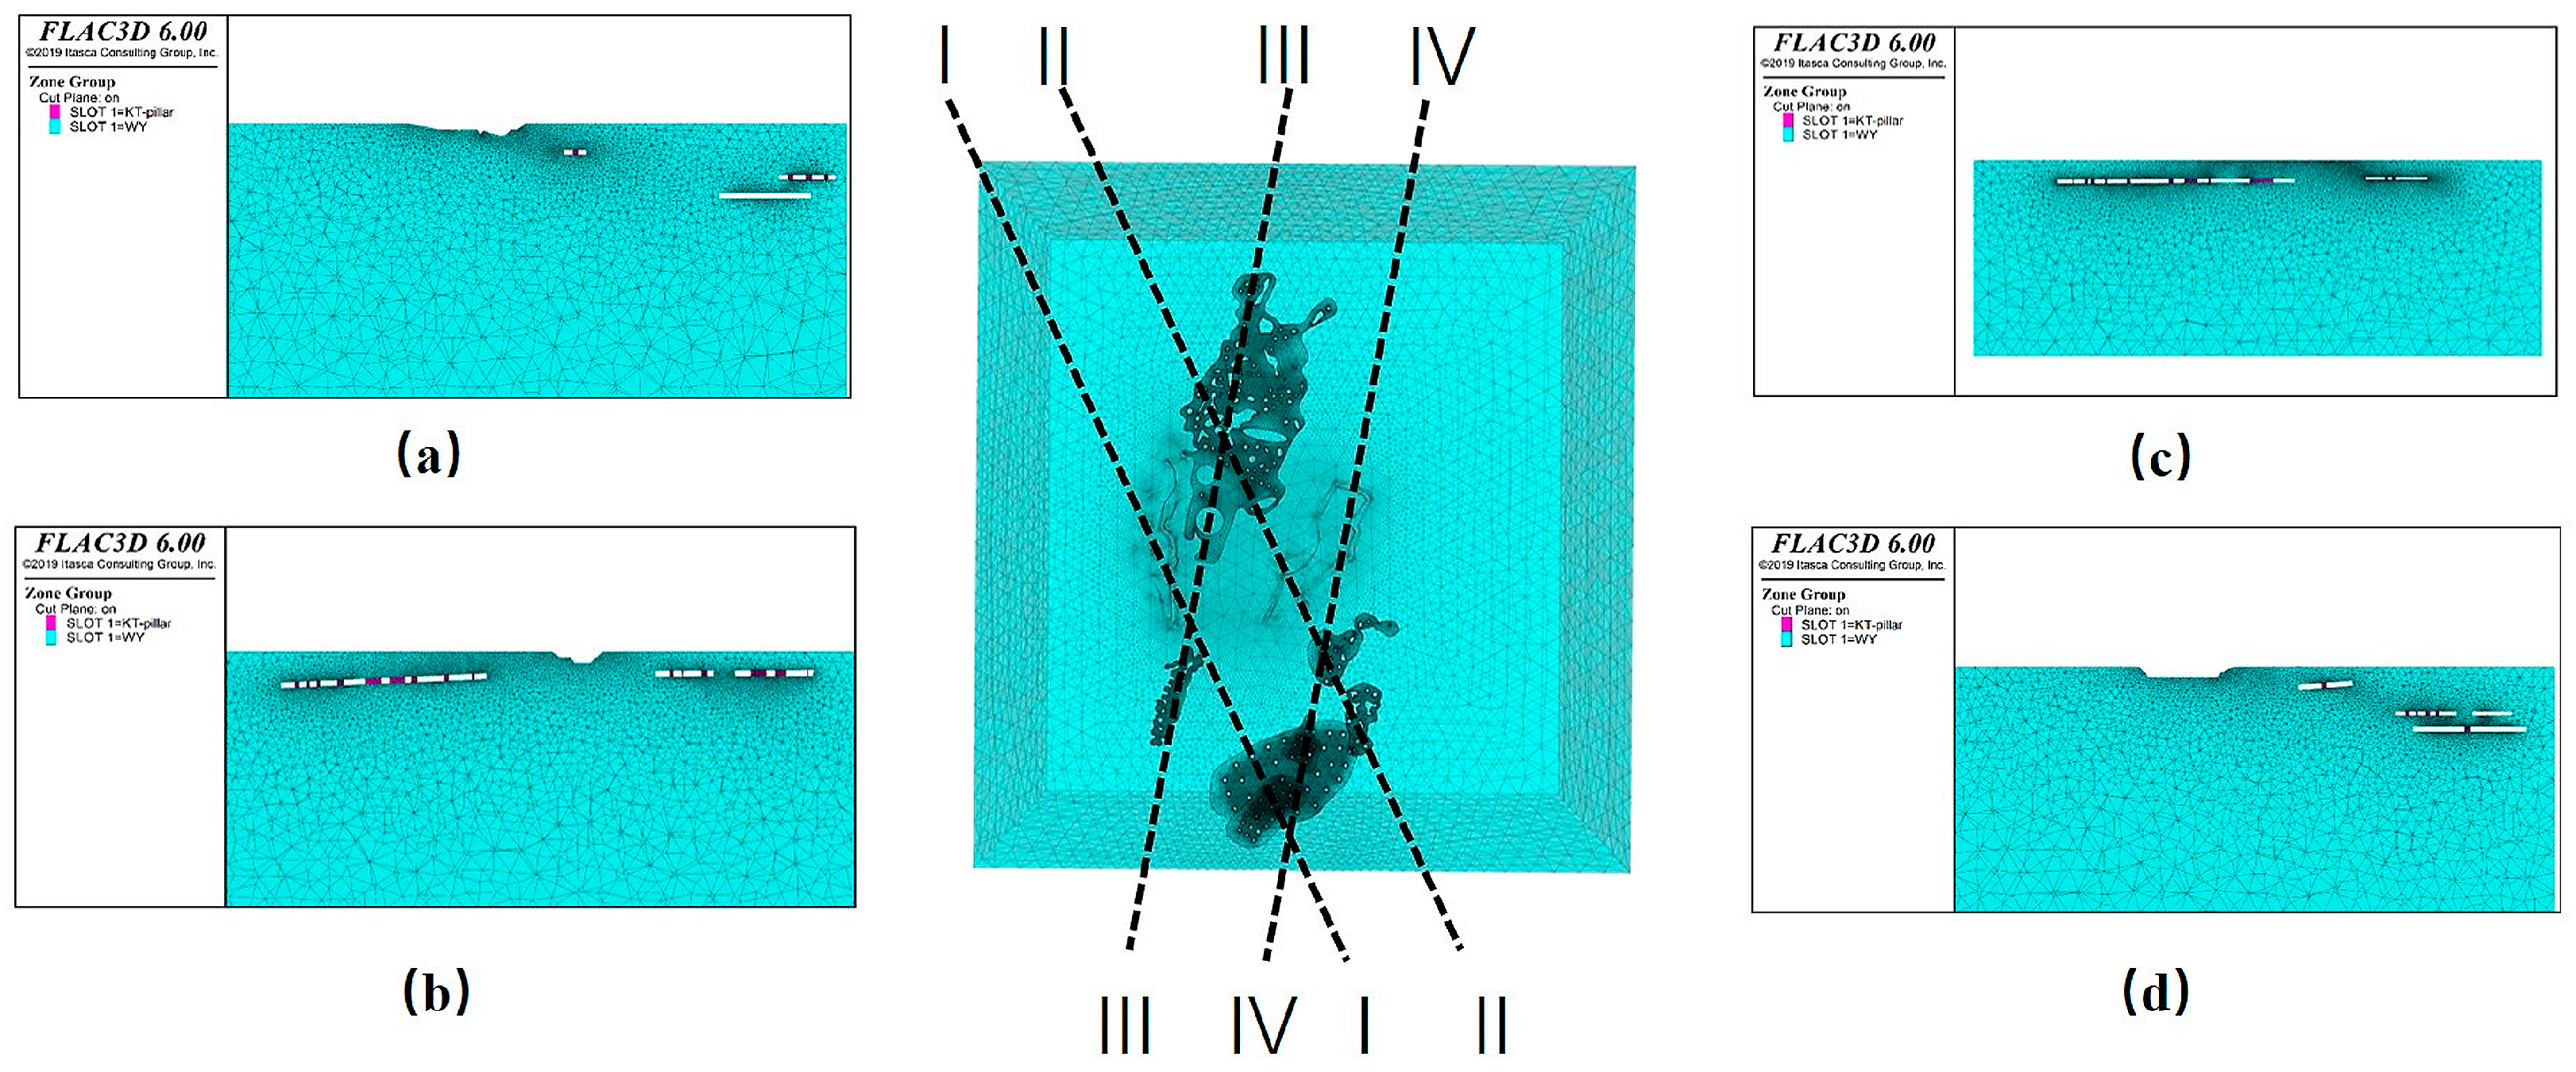
2.2.4. Initial Stress Field and Selection of Representative Cross-Sections

Based on the constructed FLAC3D 6.0 numerical model, material parameters were first assigned to the corresponding regions within the model, and the previously defined boundary conditions were applied before performing the stope excavation simulation. A three-dimensional initial geostress field for the overall model was then calculated. The vertical principal stress was generated based on the self-weight of the overlying strata, while the maximum horizontal principal stress was oriented in the north–south direction (i.e., along the y-axis of the model). The lateral pressure coefficient was automatically computed by the software according to Poisson’s ratio. The resulting distribution of the initial geostress field is shown in Figure 4, which serves as the initial stress basis for subsequent excavation simulations.
To analyze the effects of open-pit and underground mining, representative profiles were selected to study the evolution of surrounding rock displacement, stress distribution, pore water pressure, and plastic zones during the excavation process. The selected typical profiles are shown in Figure 5.

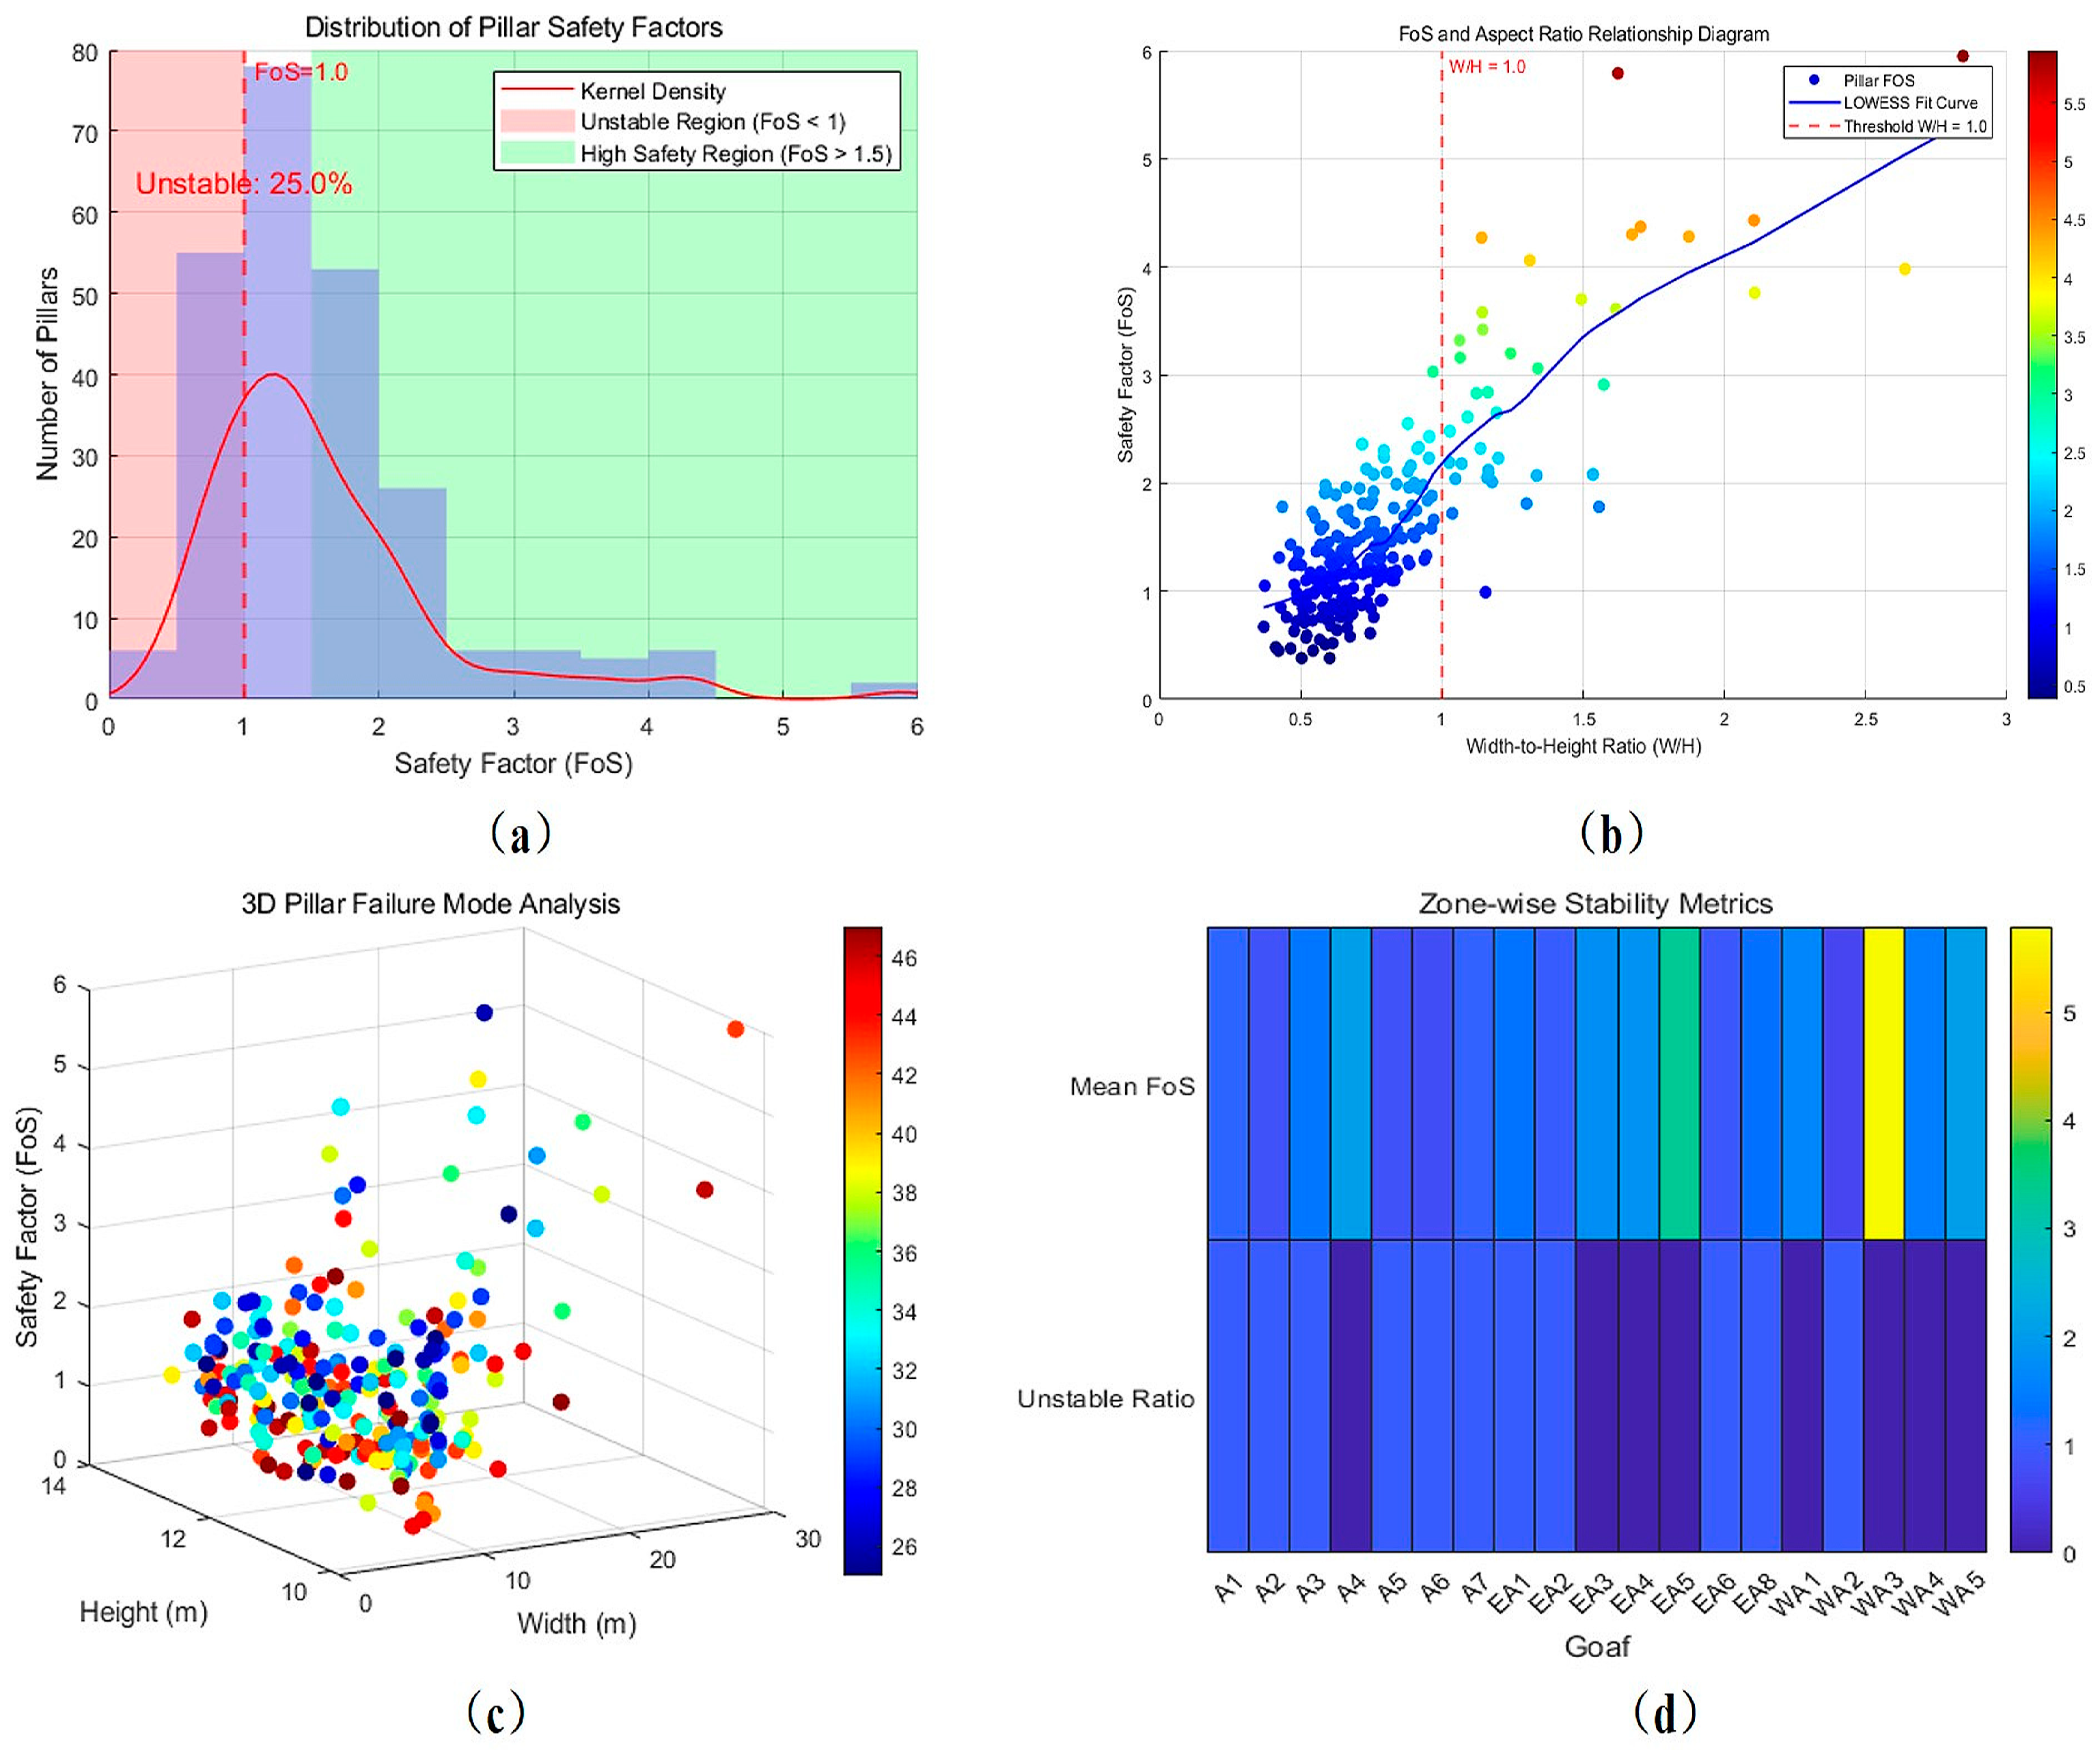
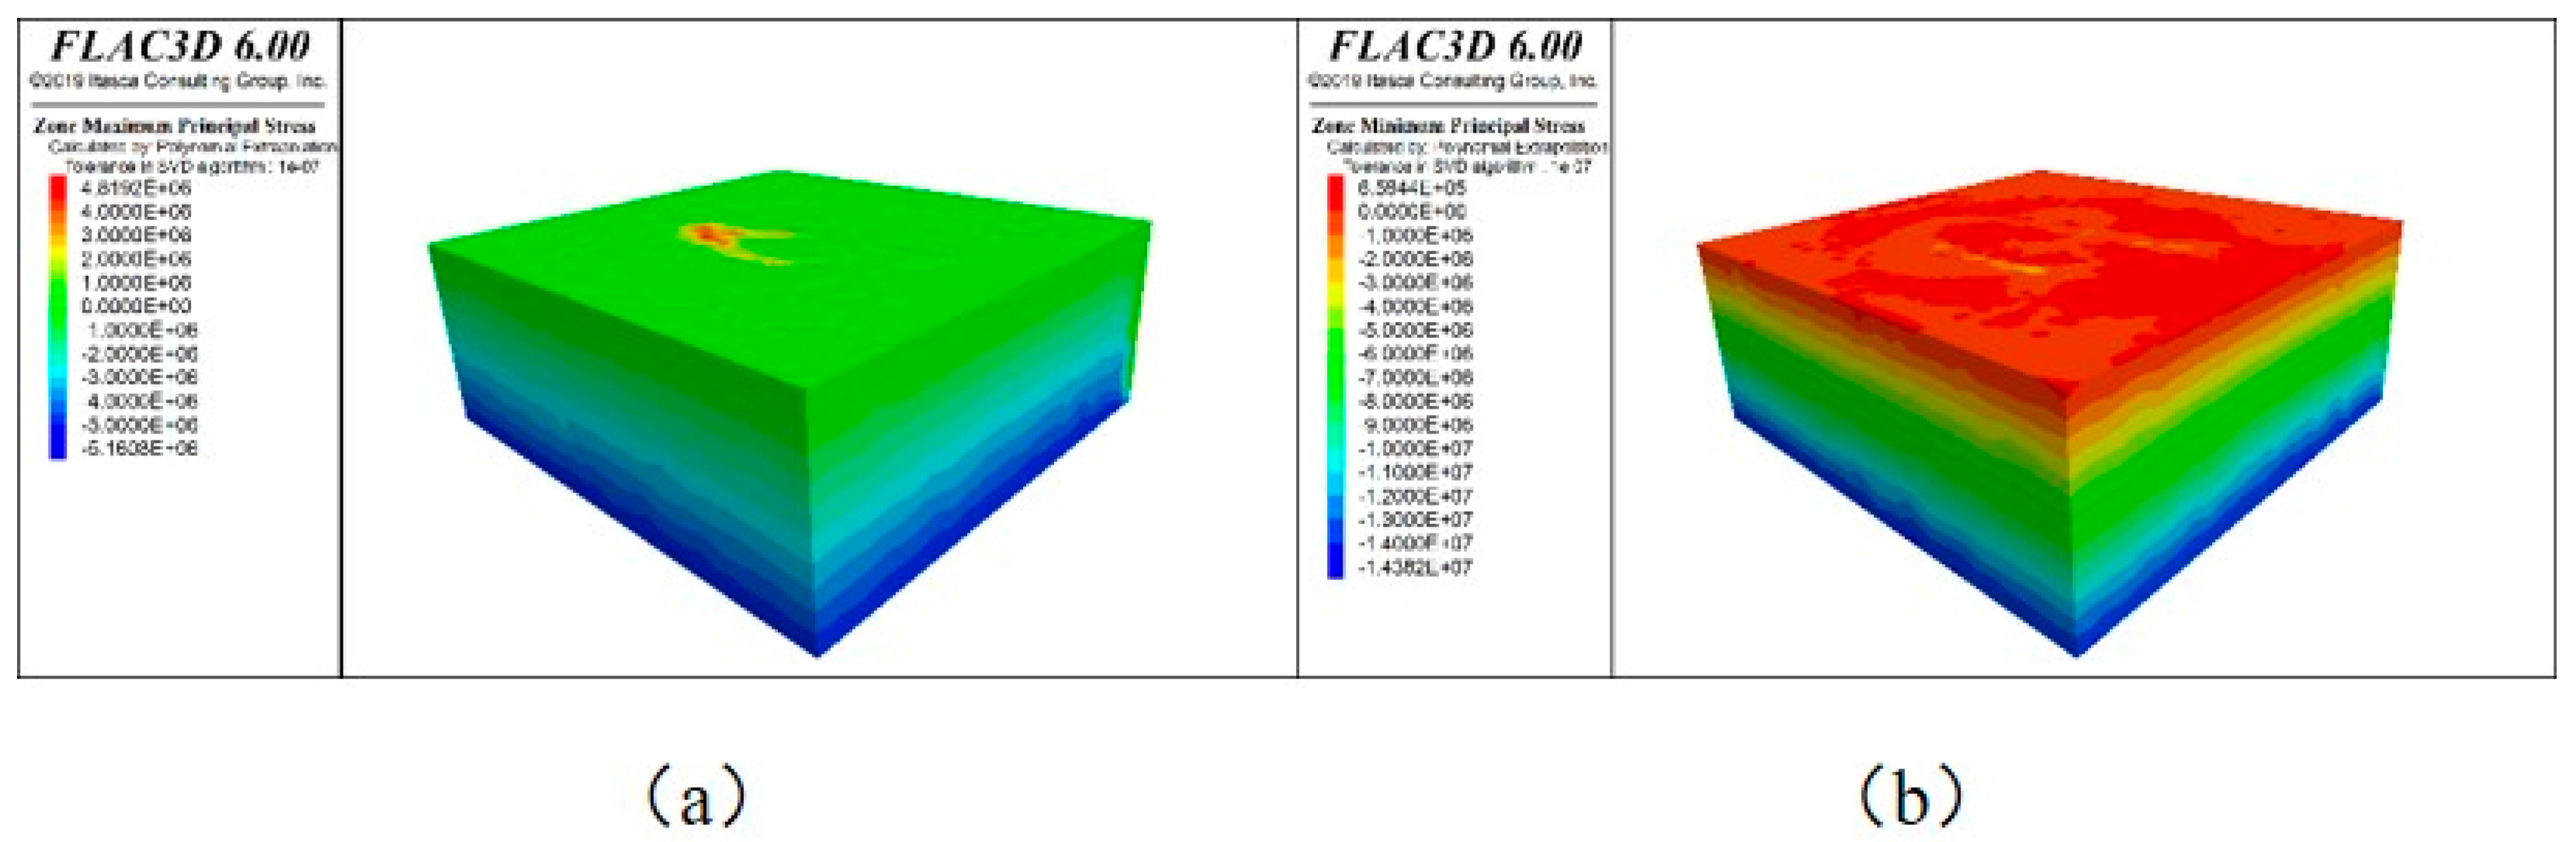
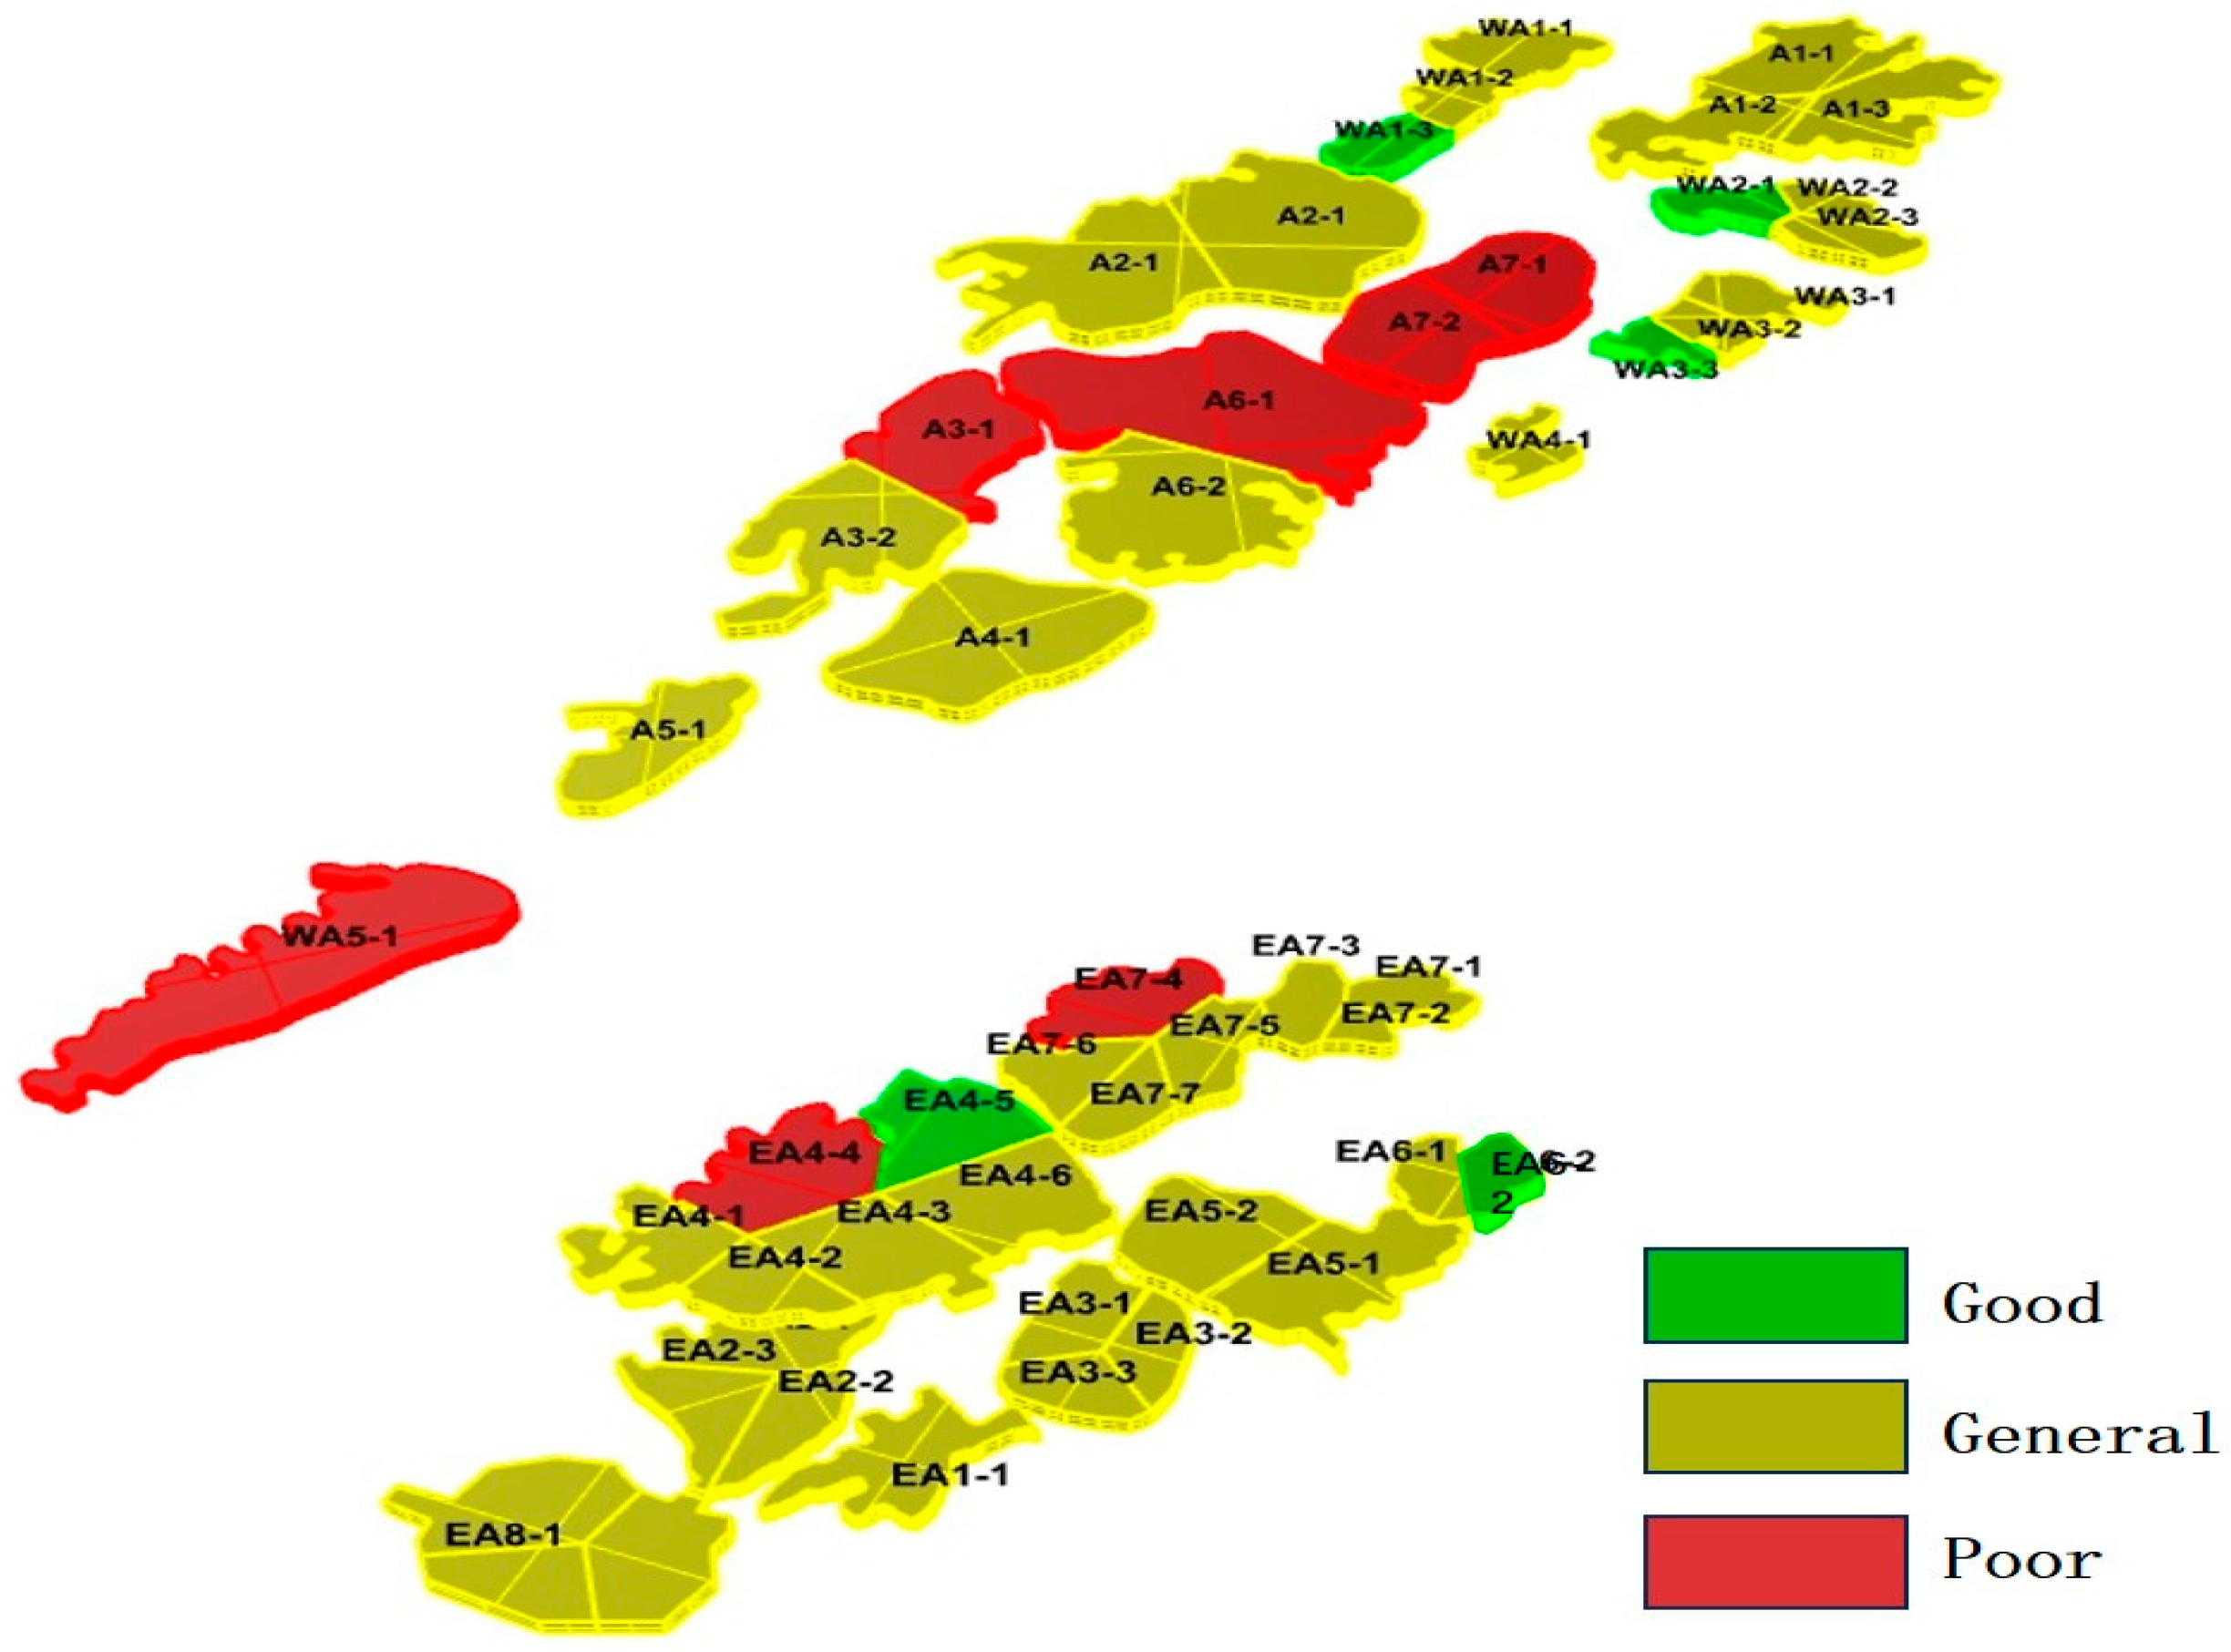
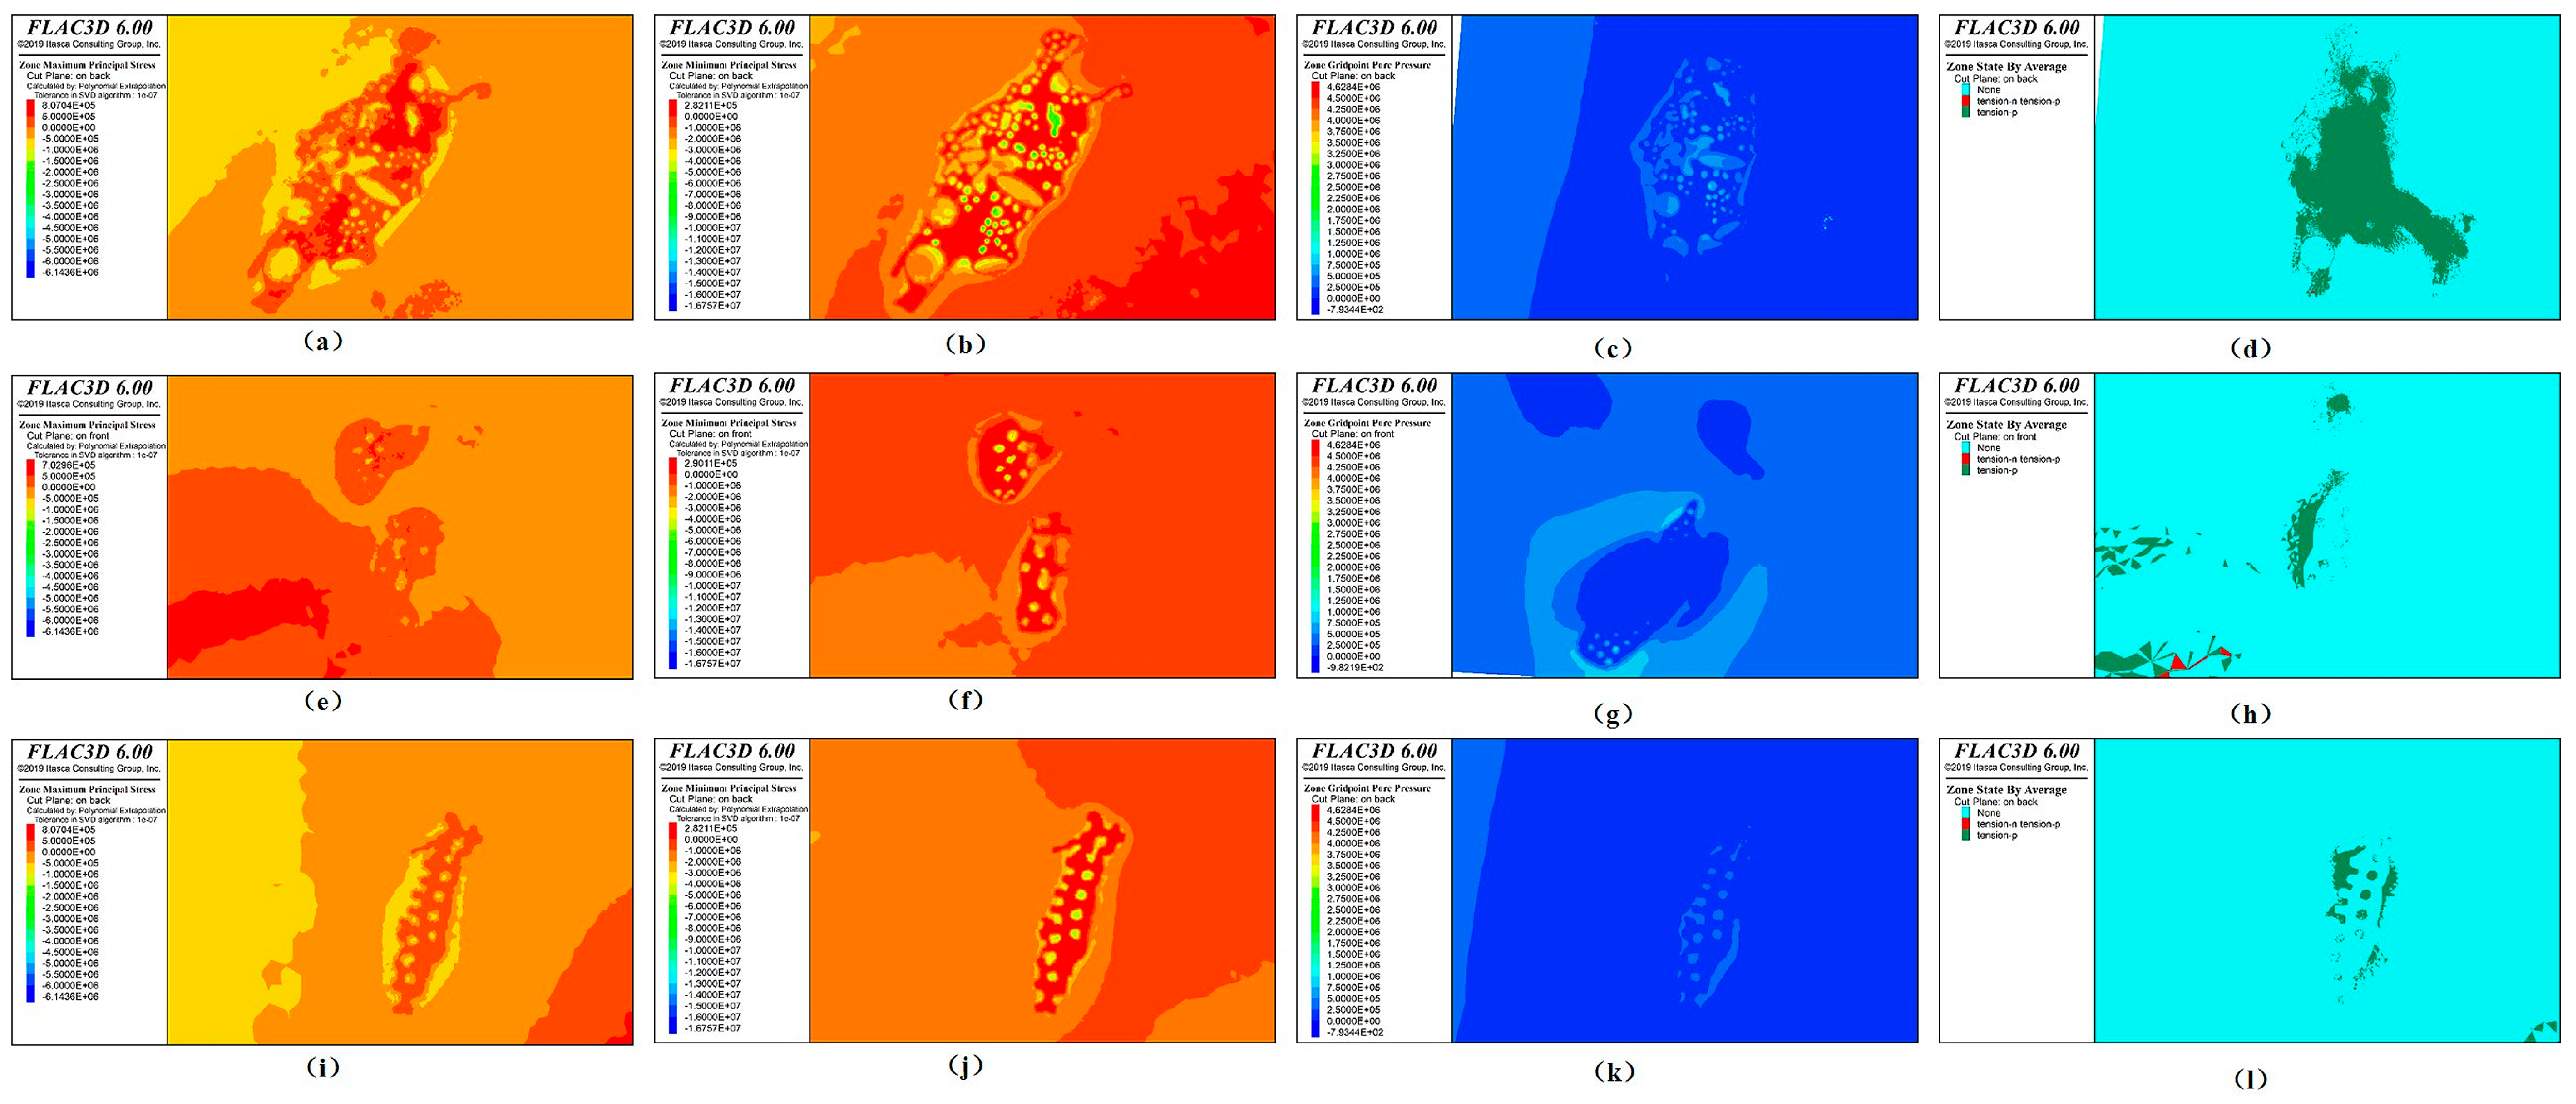
2.2.5. Stability Analysis Results of Goaf Based on Numerical Simulation

Based on the current mining conditions and the production plan for the next 3–5 years, numerical simulation analysis is conducted. At present, open-pit mining has reached its final limit. The simulation results include cloud diagrams of the maximum principal stress, minimum principal stress, maximum displacement, plastic zone distribution, and pore water pressure for each profile.
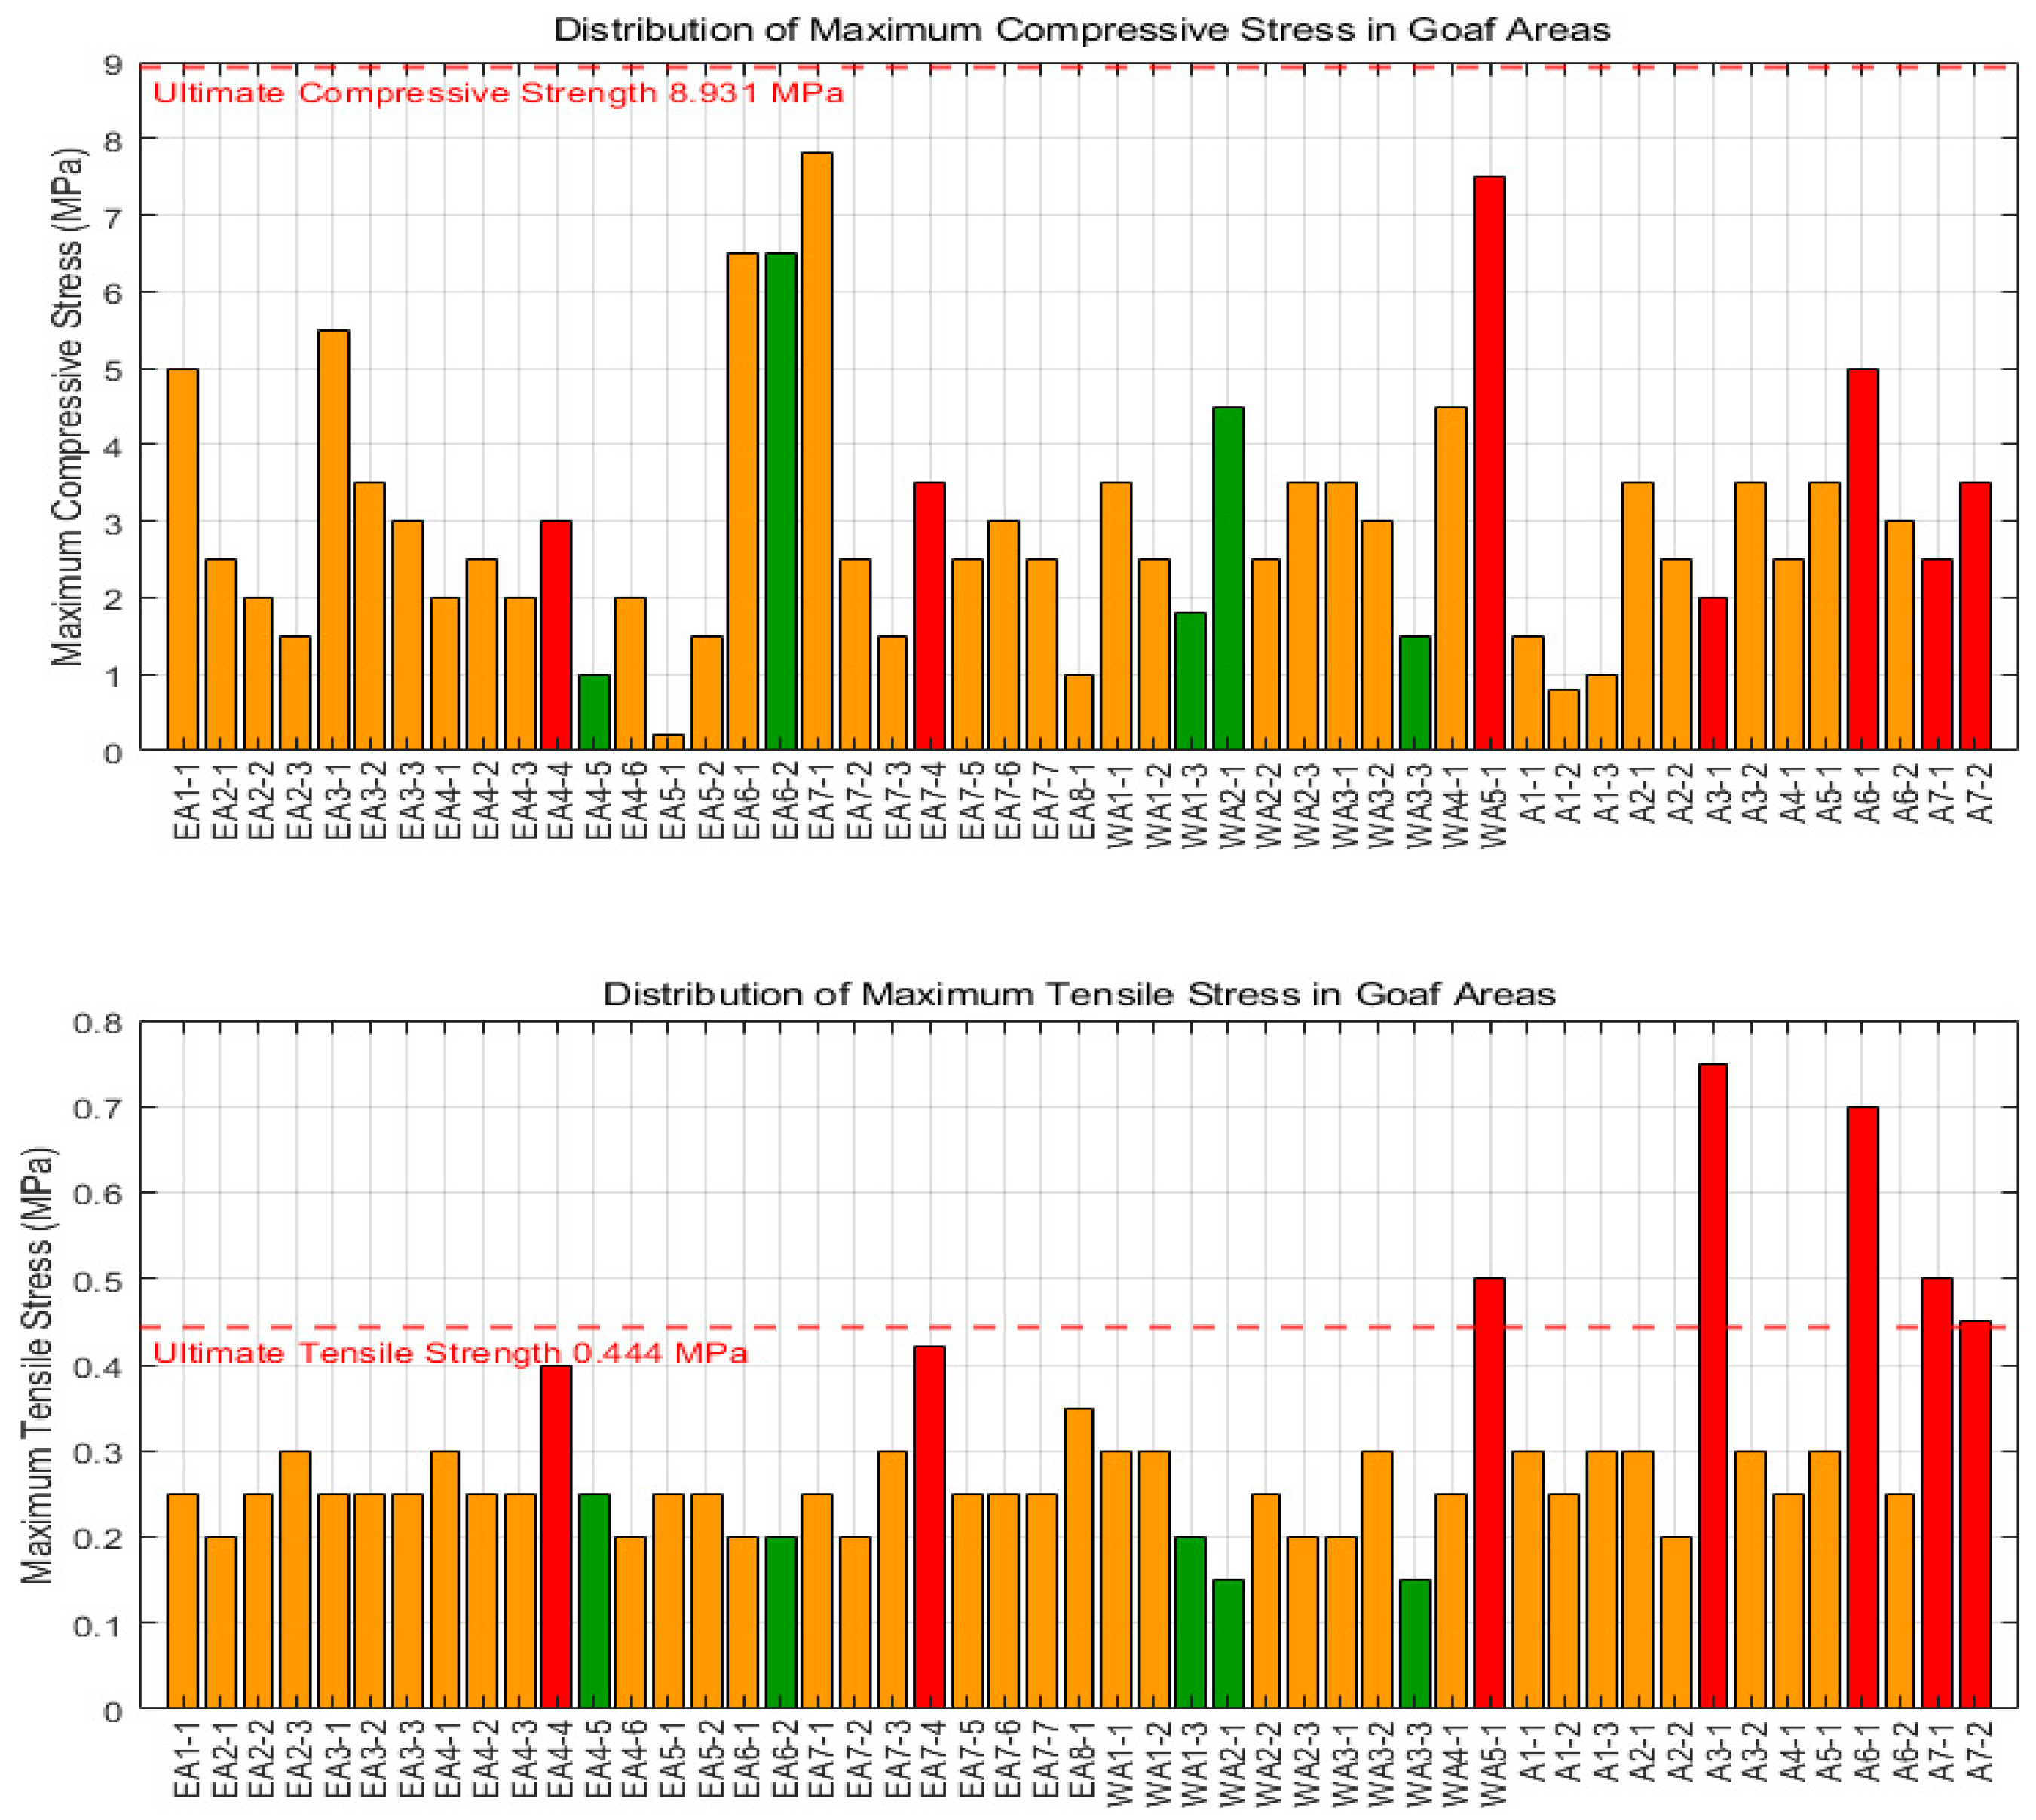
  • Analysis of Maximum and Minimum Principal Stresses
The cloud diagrams of the maximum and minimum principal stresses for the roof and floor of the goafs, pillars, and surrounding rock in each profile are shown in Figure 6.
As ore extraction progresses, the formation of goafs alters the original stress distribution within the rock mass. According to the simulation results shown in Figure 6a–h, the maximum principal stress increases progressively with mining depth, reflecting a gradual intensification of the compressive state in the surrounding rock. For gently inclined goafs, geometric asymmetry causes an uneven distribution of the maximum principal stress in the pillars, making them prone to shear failure or compound instability. In contrast, at the −80 m level of horizontally developed goafs, the maximum principal stress is more uniformly distributed, indicating a more consistent load-bearing capacity. Analysis of Figure 6a–d reveals that the tensile stress range experienced by the roof and floor surrounding rock at the −50 m and −80 m levels is 0.50–0.66 MPa, which exceeds the ultimate tensile strength of the rock mass (0.444 MPa). This stress state indicates that the roof rock has reached a critical failure threshold, posing a risk of tensile fracturing. Figure 6e–h show that the pillars are primarily subjected to compressive stress. Among them, the pillars at the −80 m level experience the highest compressive stress, ranging from 6.0 to 7.0 MPa, which remains below the ultimate compressive strength of the ore body (8.931 MPa). This indicates that the pillars currently possess a sufficient load-bearing capacity and play an effective supporting role.
According to the simulation results shown in Figure 6i–p, the minimum principal stress in the roof and floor of the goafs at the −20 m, −50 m, and −80 m levels generally appears as tensile stress. This is attributed to the unloading effect caused by stope excavation, which disrupts the stable triaxial in situ stress state. The release of radial stress in the direction of the excavation free face leads to the development of tensile stresses in localized roof areas. The pillars within the goaf are mainly subjected to compressive stress. During the formation of the goaf, as portions of the surrounding rock lose structural support, the original stress field is redistributed. The overburden load is primarily borne by the pillars and adjacent rock masses, resulting in a stress state dominated by vertical compressive stress within the pillars. As shown in Figure 6i–l, the roof of shallow goafs is subjected to relatively large tensile stresses, with measured values ranging from 0.02 to 0.0539 MPa, all of which are below the ultimate tensile strength of the rock mass (0.444 MPa). This is because the overburden thickness in shallow goafs is relatively small, and the excavation induces a significant unloading effect. Under the influence of self-weight, the roof rock undergoes flexural deformation, causing a localized tensile stress concentration. Figure 6m–p indicate that in parts of the west-wing goaf, as well as in goafs EA6 and EA7, pillar compressive stresses reach 6–8 MPa, approaching the ultimate compressive strength of the ore body (8.931 MPa), suggesting an imminent collapse risk. Moreover, the compressive stress in the pillars at the −50 m and −80 m levels reaches 10–12 MPa, already exceeding the material strength limit, indicating a serious threat of structural failure.
The results indicate that with an increasing mining depth, the stability issues of goafs become more pronounced. From the perspective of seepage mechanics, and in accordance with Biot’s consolidation theory [28], changes in pore water pressure disrupt the equilibrium between total stress and effective stress. This dynamic adjustment not only induces compressive or expansive deformation in the rock mass structure, but also intensifies stress field responses such as compressive stress concentration and tensile stress release.
2
Analysis of Plastic Zones and Maximum Displacement
As ore is extracted, the roof and floor of the goaf, as well as the pillars and surrounding rock, undergo deformation and displacement under the combined effects of self-weight loading and stress redistribution. Therefore, investigating the distribution characteristics and magnitudes of horizontal and vertical displacements induced by mining is of great significance for evaluating the deformation behavior and stability of goaf structures. The cloud diagrams of maximum displacement in the roof, floor, pillars, and surrounding rock for each profile are shown in Figure 7.
According to the distribution characteristics of plastic zones in the roof and floor shown in Figure 7a–d, no significant development of plastic zones is observed in the roof and floor of the −20 m level goaf. The rock mass exhibits a good overall integrity and remains in an elastic stress state, with no evidence of large-scale shear or tensile failure, indicating a stable surrounding rock environment. At the −50 m level, localized tensile failure zones have emerged in the roof of the goaf. Although these zones have not yet formed continuous failure surfaces, the rock mass is approaching a critical stability state and presents a potential risk of evolving into through-going structural failure. At the −80 m level, extensive tensile failure zones have already developed in the roof, forming continuous failure surfaces. The overall stability of the rock mass has deteriorated significantly, with some areas already being unstable, posing hazards of collapse or roof fall. The numerical analysis results indicate that as mining depth increases, the in situ stress level rises significantly. Combined with intensified excavation-induced unloading and seepage effects, the stability of the goaf roof weakens noticeably, and the risk of instability in the surrounding rock increases substantially.
Based on the plastic zone distribution characteristics of the pillars illustrated in Figure 7e–h, varying degrees of tensile failure are evident in the pillars of goafs WA2, EA6, and EA7. Some localized regions exhibit a combined shear–tensile failure mode, indicating partial instability of the rock mass and a noticeable trend of displacement propagation. These findings suggest that timely remediation measures are required in these areas. In contrast, no significant plastic failure is observed in the east-wing goaf pillars. The rock mass remains in an elastic state, demonstrating a relatively stable condition. At the −50 m level, the dominant failure pattern in the pillars is shear–tensile coupling, with shear slip occurring in localized zones. Due to a reduction in confining pressure, the shear strength of the pillars is weakened, resulting in a diminished overall stability. Meanwhile, the pillars at the −80 m level exhibit more severe damage, characterized by widespread shear failure and extensive plastic zone development. In some areas, obvious yield deformation is present, reflecting a considerable risk of structural instability.
Under the combined influence of open-pit and underground mining, excavation-induced unloading, and seepage effects, the originally stable stress field is disrupted, resulting in localized displacement of the surrounding rock and pillars. As shown in Figure 7i, under excavation at the −50 m and −80 m levels, the maximum vertical displacement of the goaf roof reaches 30–32.3 mm, inducing surface subsidence of 20–22.5 mm. This indicates a significant disturbance effect of excavation unloading on shallow strata, with roof subsidence patterns closely matching the goaf boundary. In Figure 7k, displacement monitoring along Profile III–III shows that the shallow goaf experiences displacement of only 6.50–7.42 mm, suggesting that the shallow surrounding rock remains primarily in an elastic deformation state, without entering the plastic failure phase. The overall rock mass integrity remains intact. Figure 7m–p reveal substantial variation in displacement among pillars at different levels. The displacement of pillars at the −20 m level is 6.19 mm, decreases to 4.14 mm at −50 m, and then sharply increases to 24.98 mm at −80 m. Two primary factors contribute to this phenomenon. (1) The deformation of deeper pillars: At the −80 m level, the rock mass is subjected to high in situ stress. As excavation progresses, confining pressure rapidly decreases, and the stress state shifts from triaxial to nearly uniaxial compression. This transition leads to plastic deformation characterized by the axial shortening and lateral bulging of the pillars, significantly increasing displacement. Moreover, deeper rock masses typically have fewer developed joints and fractures than shallow strata, which reduces the constraint on deformation and amplifies displacement magnitude. (2) Displacement suppression at shallower depths: At the −50 m level, the burial depth is moderate, and a dynamic equilibrium is achieved between the self-supporting capacity of the surrounding rock and the unloading rate, effectively inhibiting large deformations. Although the −20 m level is relatively shallow, the limited overburden thickness causes stress to concentrate around the pillars after goaf and open-pit excavation. This stress concentration leads to localized shear displacement and partial yield deformation at the pillar ends.
An integrated analysis of the displacement cloud diagrams across all profiles reveals that displacement is primarily concentrated above the goaf roof and along its lateral boundaries, exhibiting a distribution trend that converges toward the interior of the goaf. The central roof area displays the largest displacement, which gradually decreases outward. The displacement contour lines exhibit an arc-shaped pattern, reflecting a typical arch-like subsidence mode. Overall, the displacement characteristics indicate that the surrounding rock response induced by excavation is mainly governed by unloading stress release from the goaf and the overburden self-weight. In some localized areas, seepage effects appear to contribute to disturbance in the surrounding rock, but the overall stability remains within a controllable range.
3
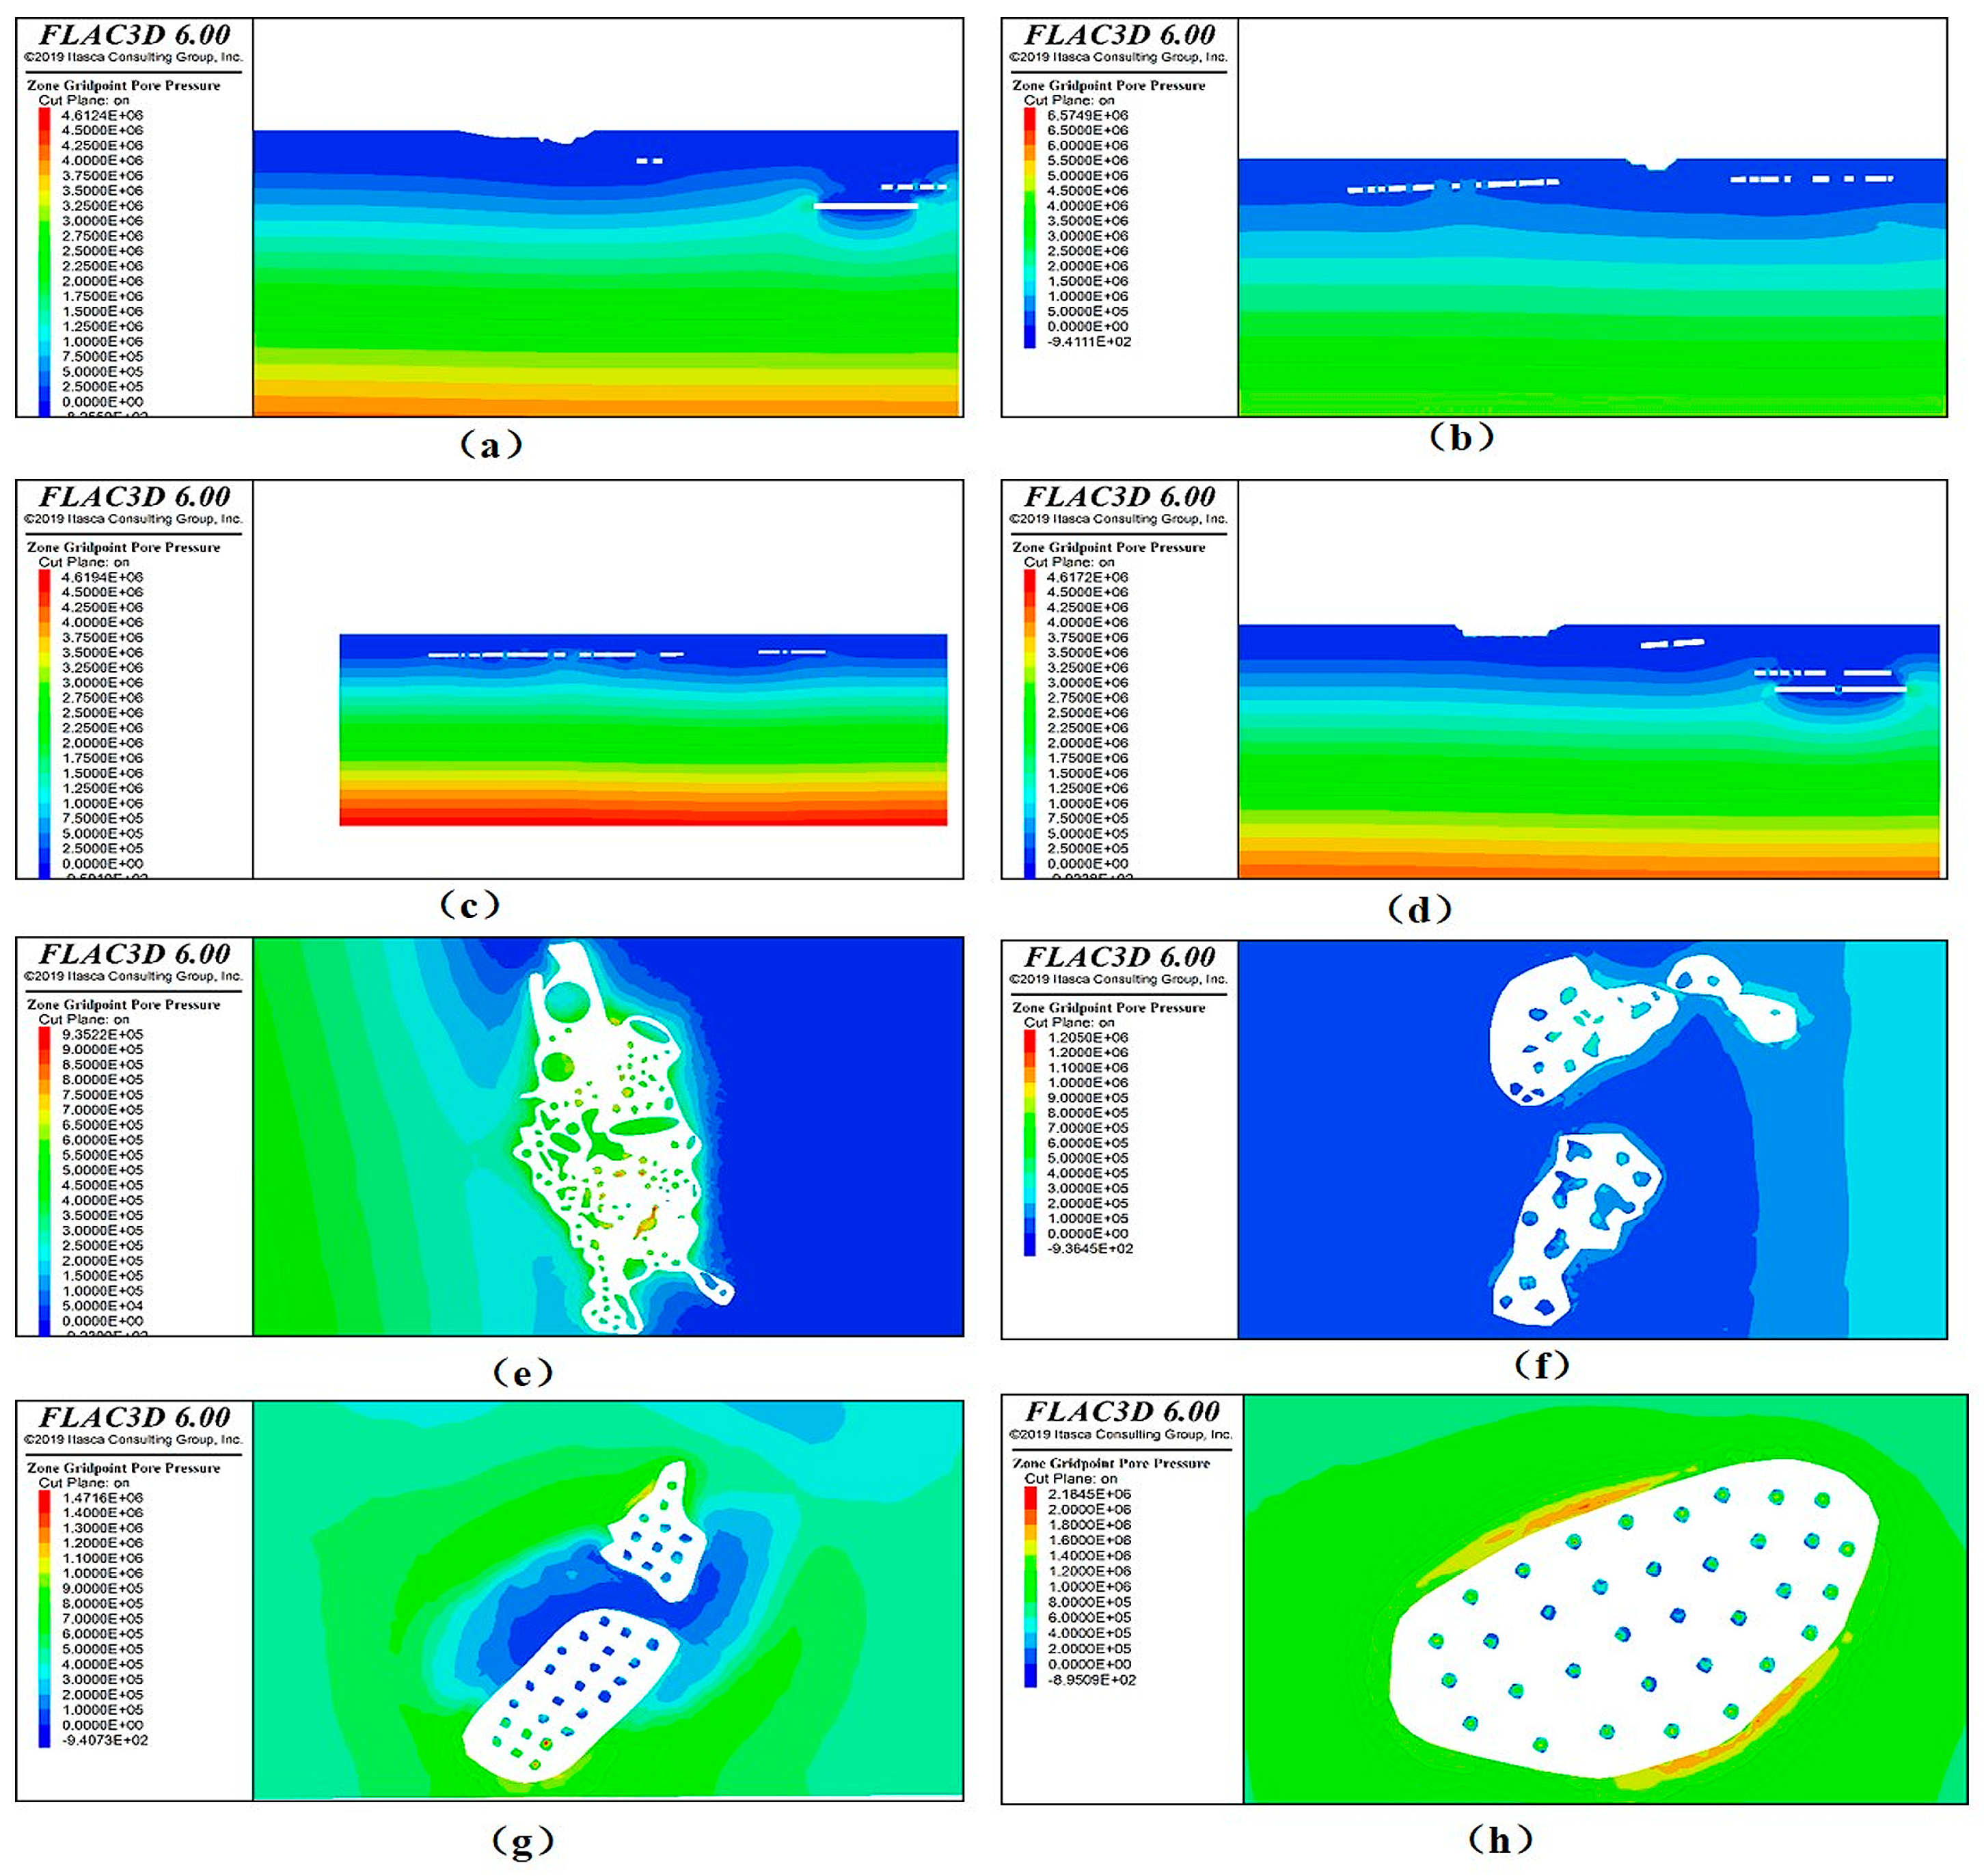
Pore Water Pressure Analysis
In FLAC3D 6.0, pore water pressure analysis is conducted based on fluid–solid coupling theory to simulate the dynamic interaction between the seepage field and stress field of the rock mass during the mining process. As ore is extracted, stress redistribution in the roof and floor of the goaf, as well as in the pillars and surrounding rock, not only induces deformation in the rock mass, but also alters the seepage pathways and the pore pressure field, thereby significantly affecting the effective stress state of the rock.
The cloud diagrams of the pore water pressure distribution in the roof, floor, pillars, and surrounding rock for each profile are shown in Figure 8.
According to the pore water pressure distribution characteristics of the goaf roof and floor shown in Figure 8a–d, the pressure exhibits a stratified pattern in the vertical direction. From the ground surface downward, pore pressure gradually increases with depth, forming a relatively regular horizontal stratification. At the −20 m and −50 m levels, the pore water pressure in the roof and floor of the goaf ranges from 0.1 to 0.3 MPa and from 0.4 to 0.6 MPa, respectively. In contrast, at the −80 m level, the pore pressure in the sidewall areas rises significantly, reaching 0.75–1.0 MPa. Analysis of the pore water pressure distribution in pillars at different levels, as shown in Figure 8e–h, indicates that pore pressure increases with depth. At the −20 m level, the pillars are subjected to pore water pressures ranging from 0.35 to 0.4 MPa; at the −50 m level, the range increases to 0.9–1.1 MPa; and at the −80 m level, pressures reach as high as 1.4–1.8 MPa. These results reveal that deeper pillars are subjected to significantly higher hydraulic loads. As burial depth increases, the self-weight stress of the overlying strata intensifies, driving groundwater migration into deeper zones and leading to pressure accumulation. Meanwhile, the increased confining stress reduces the permeability of the rock mass, inhibiting pore water flow and causing pressure concentration near the goaf sidewalls and pillar zones.
The distributions of the maximum compressive stress and maximum tensile stress from the goaf numerical simulation are shown in Figure 9, while the goaf stability classification map is presented in Figure 10.
Based on the stress distribution analysis from numerical simulation and theoretical calculations, the stability of the goafs is classified into the following three categories: good, general, and poor. The classification is determined by comparing the stress acting on the goaf with the ultimate compressive and tensile strength of the rock mass. Specifically, when the stress is significantly lower than the rock strength, the goaf is classified as “good”; when the stress approaches but does not exceed the strength limit, it is classified as “general”; and when the stress exceeds the strength limit, it is categorized as “poor”.
The results show that among the 49 evaluated goafs, 37 fall into the general category, 5 are rated as good, and 7 are classified as poor. The goafs with poor stability include EA4-4, EA7-4, WA5-1, A3-1, A6-1, A7-1, and A7-2. This classification reflects the overall correlation between the stress state and structural stability of the goafs, and provides a scientific basis for subsequent goaf remediation efforts.

3. Research on the Governance of Goaf

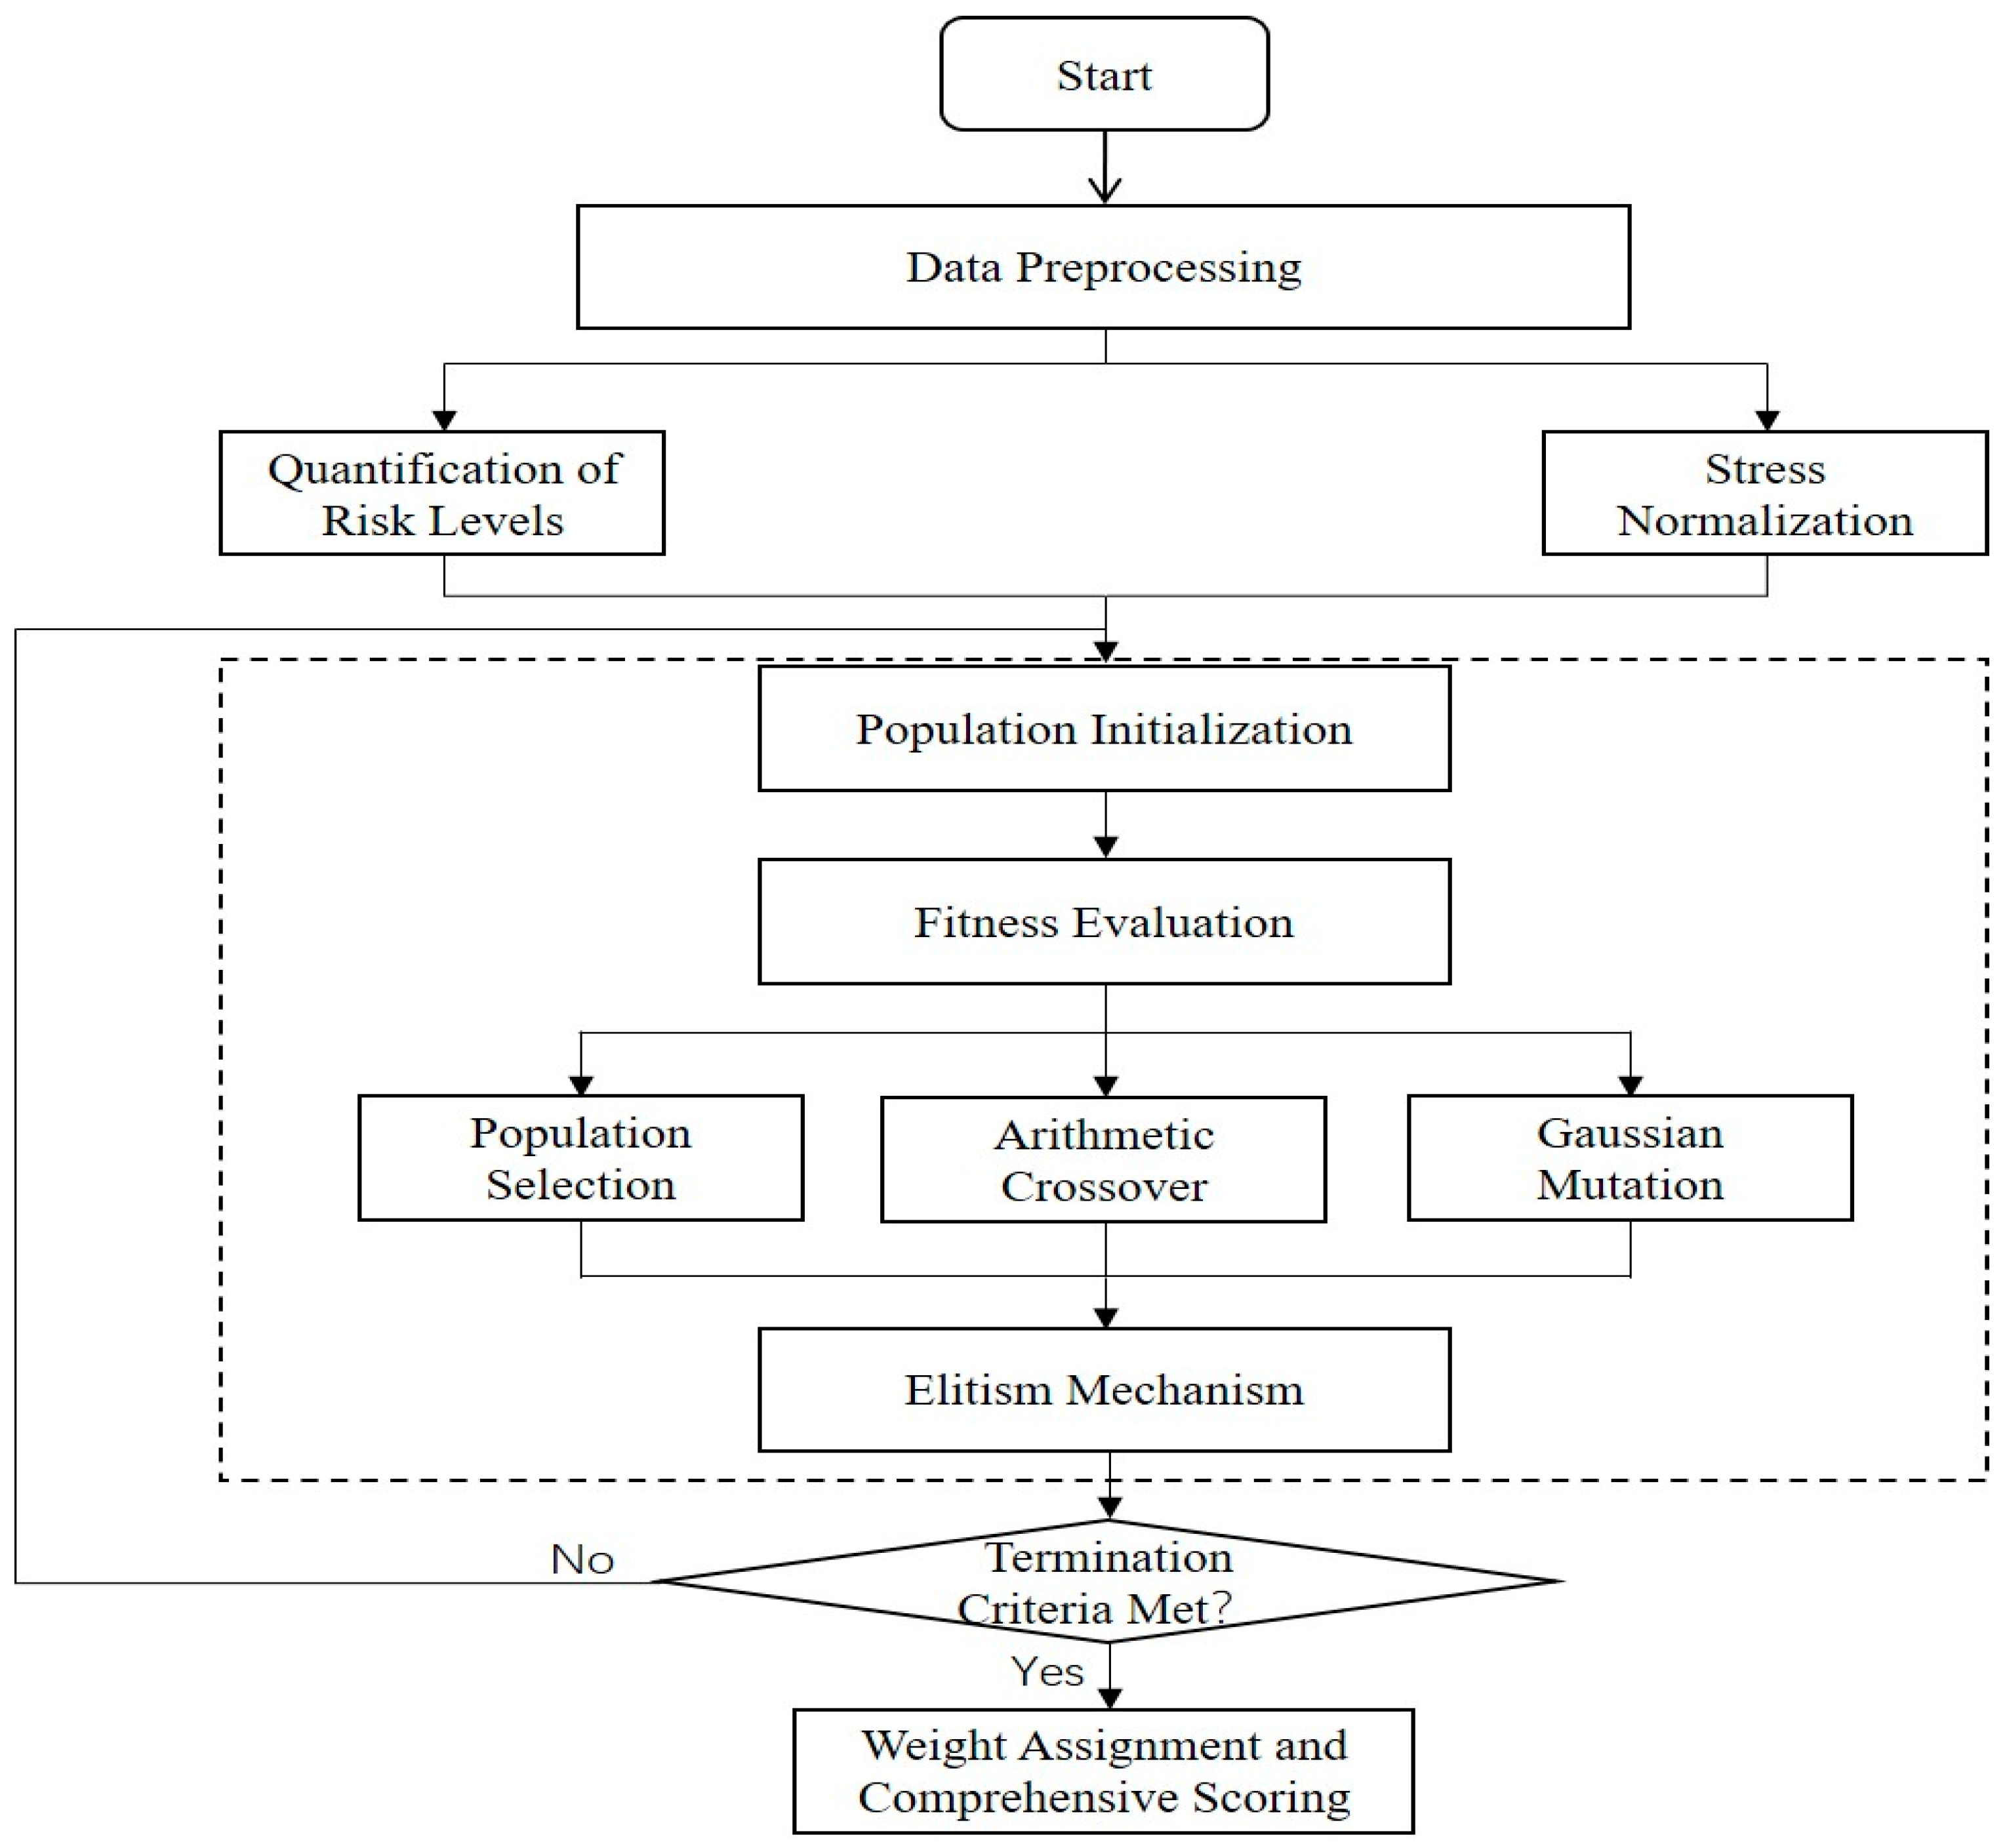
3.1. Optimization of Goaf Remediation Sequence Based on Genetic Algorithm

According to the results of the goaf stability analysis, different goafs exhibit significant differences in their stress field characteristics due to variations in geological structures, seepage field conditions, goaf morphology, and spatial distribution. Some areas are in a critically stable state, while others have already entered an unstable condition. A graded remediation strategy is proposed for the current goafs: those with poor stability should be prioritized for treatment, while goafs with general or good stability can be remediated at a later stage. Remediation measures should be implemented in a timely manner during subsequent mining operations at the −50 m and −80 m levels.
Genetic algorithm (GA) is a global optimization method inspired by the principles of biological evolution. Its core concept involves iteratively improving candidate solutions through operations such as selection, crossover, and mutation [29,30]. By integrating parameters such as risk level, maximum compressive stress, and maximum tensile stress, a normalized evaluation index system is constructed. A fitness function aimed at identifying high-risk samples is designed to enable weight optimization of the evaluation indices, thereby providing a basis for optimizing the backfilling sequence of goafs. Unlike conventional approaches where remediation order is based on stress magnitude alone, this study incorporates a multi-parameter risk indicator—derived from simulation-informed stress states, pore pressure, and classification levels—into the genetic algorithm. This facilitates a more targeted and engineering-relevant remediation sequencing process.
  • Mathematical Model Construction
We define the weight vector W = (w1, w2, w3), where w1 represents the weight of the risk level derived from theoretical calculations, w2 denotes the weight of maximum compressive stress, and w3 corresponds to the weight of maximum tensile stress. The comprehensive evaluation score for goaf i is calculated using the following formula:
S i = w 1 · R i + w 2 · P i + w 3 · T i
where Ri is the numerical value of the assigned risk level; Pi′ is the normalized maximum compressive stress; and Ti′ is the normalized maximum tensile stress.
The fitness function is designed to evaluate the number of Level III (high-risk) goafs appearing within the top 10 ranked goafs.
S i = k = 1 10 δ ( R k = 3 )
where δ is the indicator function.
2.
Implementation Method
(1)
Stress normalization: Min–max normalization is employed to eliminate dimensional differences;
P i = P i P m i n P m a x P m i n , P i = T i T m i n T m a x T m i n
(2)
Population initialization: 50 sets of weight vectors are randomly generated, with the constraint ∑w = 1;
(3)
Selection mechanism: Roulette wheel selection is used to retain individuals with higher fitness, giving those with better fitness a greater probability of being preserved in the next generation;
(4)
Arithmetic crossover: A linear combination of parent individuals is performed with a probability of 80%, as follows:
C h i l d = α · P a r e n t 1 + 1 α · P a r e n t 2 , α ~ ( 0 , 1 )
(5)
Gaussian mutation: A normally distributed perturbation is added with a probability of 10%:
w = max ( w + N ( 0 , 0.1 ) , 0 )
(6)
Termination condition: The maximum number of generations is set to 100, and the algorithm is terminated early if the optimal fitness shows no improvement for 20 consecutive generations.
The optimization process of goaf backfilling sequence using the genetic algorithm is illustrated in Figure 11.
3.
Optimization Results of Goaf Remediation Sequence
Based on the principle of multi-objective optimization, the remediation sequence of goafs was optimized using a multi-objective genetic algorithm implemented in MATLAB R2024a. After 100 iterations, the optimal remediation sequence was obtained. The optimization results indicate that the remediation priority of different goafs was significantly correlated with the development degree of caving zones, stress magnitude, and spatial position of the goafs. The three-dimensional risk distribution of the goafs is shown in Figure 12.
As shown in Figure 12, combined open-pit and underground mining leads to hydrogeological deterioration and stress redistribution. The goafs adjacent to the open-pit area are subjected to significant tensile stress, and their stability is negatively correlated with the vertical spacing from the surface. Priority remediation should be given to goafs A3-1, A6-1, WA5-1, EA7-4, EA4-4, A7-1, and A7-2, using cemented waste rock backfilling for control. For goafs with general or good stability, ordinary waste rock backfilling can be applied. This graded remediation strategy provides a theoretical basis for the backfilling and stabilization of goafs in the mine.

3.2. Numerical Simulation Analysis of Goaf Remediation

Based on the remediation sequence determined in the previous section, FLAC3D 6.0 was used to conduct numerical simulations of sequential goaf backfilling using cemented waste rock and ordinary waste rock. The simulation results are presented in Figure 13. The mechanical parameters of the backfill materials are listed in Table 2.
According to the simulation results shown in Figure 13a–l, the plastic zones before remediation exhibit a progressive failure state under sustained shear loading. After remediation, the plastic zones are limited to historical tensile failure zones that have closed due to load relaxation. The changes in stress and pore water pressure before and after goaf remediation, along with their respective variation rates, are summarized in Table 3.
The increase in pore water pressure observed in the typical goaf group (WA-5) is attributed to the lower permeability of the cemented waste rock backfill compared to the surrounding rock mass, which forms a local hydraulic barrier that inhibits the natural drainage of groundwater, leading to pressure accumulation along the goaf boundaries. Following systematic remediation, the stress field in the surrounding rock has been effectively improved. Stress concentration in the roof and pillars has been alleviated, and the remediation measures have successfully suppressed the propagation of rock mass damage. As a result, the overall stability of the mine has been enhanced, providing safer conditions for future mining operations.

4. Results

This study proposes a comprehensive framework for goaf stability assessment and remediation by integrating theoretical calculation, numerical simulation, and optimization-based decision making. It identifies the critical factors governing pillar stability and validates the effectiveness and engineering feasibility of the proposed remediation strategies. Statistical analysis of 243 pillar samples reveals that approximately 20–30% of the pillars face an immediate instability risk (FoS < 1.0), while another 58% fail to meet the long-term stability threshold (FoS < 1.5), highlighting the urgent need for reinforcement. The results further indicate that pillar geometry plays a decisive role in structural performance, with a clear positive correlation between the width-to-height ratio (W/H) and the factor of safety; when W/H exceeds 1.5, the pillars demonstrate a significantly improved stability. In addition, the absolute cross-sectional area also enhances load-bearing capacity, with this effect being particularly evident in regions where the stress concentration exceeds 10 MPa.
Three-dimensional fluid–solid coupled simulations based on FLAC3D 6.0 reveal significant spatial heterogeneity within the goafs. Shallow goafs are primarily characterized by elastic deformation and exhibit a good structural stability, whereas deeper zones are more prone to the development of tensile failure zones and accelerated plastic expansion driven by a high pore water pressure, resulting in structurally unstable regions [31]. This phenomenon validates the stress redistribution mechanism dominated by pore pressure, as described in Biot’s consolidation theory, and underscores the importance of incorporating fluid–solid coupling models for stability evaluation in water-rich mining areas. Building on this foundation, the study establishes a goaf stability classification framework, categorizing 49 goafs into the following three levels: poor, general, and good. High-risk zones—represented by goafs A3-1 and WA5-1—are identified, with their instability closely associated with the superimposed loading effects of open-pit mining [32]. This trend is highly consistent with typical instability cases in international mining engineering, such as the Ordzhonikidze mine accident in Ukraine [10]. To achieve scientifically optimized remediation, this study introduces a multi-objective backfilling sequence optimization model based on a genetic algorithm, incorporating parameters such as risk level, principal stress, and pore water pressure into the objective function. The results indicate that prioritizing the remediation of high-risk goafs can significantly reduce the maximum principal stress (with a peak reduction of 43.65%) and pore water pressure (by 28.6%), while effectively limiting the expansion of plastic zones. Regions filled with cemented waste rock exhibit a superior remediation performance, with the area of plastic zones reduced by up to 60.96%.
Ultimately, the proposed “Assessment–Optimization–Remediation” integrated technical framework significantly enhances the systematization and accuracy of goaf stability analysis. By incorporating spatial heterogeneity characterization and fluid–solid coupling mechanisms, the results demonstrate that this framework can effectively reduce collapse risk by 30–40%, indicating strong potential for engineering application and wider implementation. Future work may further explore the use of discrete fracture network (DFN) models [33,34,35], multi-objective optimization methods under economic constraints (e.g., NSGA-II), and the integration of multi-source monitoring data [36,37,38], aiming to develop more comprehensive, refined, and economically feasible stability remediation strategies.

5. Conclusions

This study presents an integrated framework for evaluating and remediating goaf stability in underground metal mines, combining fluid–solid coupling simulation with genetic algorithm-based backfill optimization. The main conclusions are as follows:
  • The pillar width-to-height ratio and the cross-sectional area of the goaf are the most critical geometric factors influencing stability. Coupled groundwater pressure significantly affects the extent and distribution of plastic failure zones, particularly in deeper or water-bearing areas.
  • The genetic algorithm effectively optimizes the sequence of backfilling operations, achieving a maximum reduction of 60.96% in principal stress and 28.6% in pore pressure, thereby demonstrating strong practical applicability.
  • The proposed “assessment–optimization–governance” framework improves the rationality and efficiency of goaf remediation planning and can be extended to other mining sites facing similar goaf-related stability issues.
Overall, this framework provides valuable technical guidance for safe mine production planning and ecological rehabilitation in underground metal mining operations.

Author Contributions

Conceptualization, X.Y., X.L. (Xuefeng Li) and X.L. (Xiaoquan Li); methodology, X.Y.; software, X.Y., H.D.; validation, X.Y., H.D., D.Z., and T.S.; formal analysis, X.Y., T.S.; investigation, X.Y.; data curation, X.Y., H.D., and T.S.; writing—original draft preparation, X.Y.; writing—review and editing, X.Y.; funding acquisition, X.L. (Xuefeng Li) and X.L. (Xiaoquan Li). All authors have read and agreed to the published version of the manuscript.

Funding

This research received no external funding.

Data Availability Statement

The original contributions presented in this study are included in the article. Further inquiries can be directed to the corresponding authors.

Acknowledgments

The author of this article primarily thanks the Xijikeng lead zinc mine mine for providing relevant data and the Civil Engineering Laboratory at Guangxi University for offering the rock mechanics.

Conflicts of Interest

The authors declare no conflicts of interest.

Abbreviations

The following abbreviations are used in this manuscript:
FoSSafety Factor
GAGenetic Algorithm
NSGA-IINon-dominated Sorting Genetic Algorithm II
MDPIMultidisciplinary Digital Publishing Institute
DOAJDirectory of open-access journals
TLAThree-letter acronym
LDLinear dichroism

References

  1. Lai, X.; Ren, F.; Wu, Y.; Cai, M. Comprehensive Assessment on Dynamic Roof Instability under Fractured Rock Mass Conditions in the Excavation Disturbed Zone. Int. J. Miner. Metall. Mater. 2009, 16, 12–18. [Google Scholar] [CrossRef]
  2. Ma, H.; Wang, Y.; Fu, S. Present Situation Analysis of Non-Coal Mine Goaf Hazards in China. J. North-East. Univ. 2009, 30, 91–95. [Google Scholar]
  3. Linjun, P.; Xiaojie, Y.; Xiaoming, S. Analysis and Control on Anomaly Water Inrush in Roof of Fully-Mechanized Mining Field. Min. Sci. Technol. China 2011, 21, 89–92. [Google Scholar] [CrossRef]
  4. Tesarik, D.R.; Seymour, J.B.; Yanske, T.R. Post-Failure Behavior of Two Mine Pillars Confined with Backfill. Int. J. Rock. Mech. Min. Sci. 2003, 40, 221–232. [Google Scholar] [CrossRef]
  5. Elmo, D.; Stead, D. An Integrated Numerical Modelling–Discrete Fracture Network Approach Applied to the Characterisation of Rock Mass Strength of Naturally Fractured Pillars. Rock. Mech. Rock. Eng. 2010, 43, 3–19. [Google Scholar] [CrossRef]
  6. He, M.-C.; Xie, H.-P.; Peng, S.-P.; Jiang, Y.-D. Study on Rock Mechanics in Deep Mining Engineering. Chin. J. Rock. Mech. Eng. 2005, 24, 2803–2813. [Google Scholar]
  7. Wu, Y.; Hu, J.; Xie, C.; Shi, D. Case Study on the Stability Control of Broken Surrounding Rock in Roadway Excavation on the Edge of a Collapsed Stope Area. Adv. Civ. Eng. 2021, 2021, 8658847. [Google Scholar] [CrossRef]
  8. Wu, M.; Hu, N.; Ye, Y.; Wang, Q.; Wang, X. Multi-Hazard Risk Characterization and Collaborative Control Oriented to Space in Non-Coal Underground Mines. Sci. Rep. 2022, 12, 16452. [Google Scholar] [CrossRef]
  9. Feng, X.-T.; Liu, J.; Chen, B.; Xiao, Y.; Feng, G.; Zhang, F. Monitoring, Warning, and Control of Rockburst in Deep Metal Mines. Engineering 2017, 3, 538–545. [Google Scholar] [CrossRef]
  10. Lapshyn, O.Y.; Lapshyn, O.O.; Khudyk, M. The Tragic Consequences of the Collapse of the Earth’s Surface within the Mining Allotment of Ordzhonikidze Mine. E3S Web Conf. 2020, 166, 03003. [Google Scholar] [CrossRef]
  11. Yu, D.; Yi, X.; Liang, Z.; Lou, J.; Zhu, W. Research on Strong Ground Pressure of Multiple-Seam Caused by Remnant Room Pillars Undermining in Shallow Seams. Energies 2021, 14, 5221. [Google Scholar] [CrossRef]
  12. Zhaoyuan, L.; Feng, C.; Jianwei, L.; Xingping, L.; Ruiqiang, Y. Dynamic Evolution Law and Width Determination of Section Coal Pillars in Deep Mining Height Working Face. Res. Sq. 2021. [Google Scholar] [CrossRef]
  13. Tian, Y.; Gong, P.; Zhao, T.; Yi, K.; Wen, G. Instability Prediction Model of Remaining Coal Pillars under Remining Disturbance. Energy Sci. Eng. 2023, 11, 1842–1857. [Google Scholar] [CrossRef]
  14. Su, R.; Shen, H. Physical Characteristics of Section Coal and Rock Pillars Under Roof Shock Disturbances from Goaf. Front. Phys. 2020, 8, 223. [Google Scholar] [CrossRef]
  15. Yi, S.; Zhang, Y.; Yi, H.; Li, X.; Wang, X.; Wang, Y.; Chu, T. Study on the Instability Activation Mechanism and Deformation Law of Surrounding Rock Affected by Water Immersion in Goafs. Water 2022, 14, 3250. [Google Scholar] [CrossRef]
  16. Wang, X.; Liu, W.; Jiang, X.; Zhang, Q.; Wei, Y. Evolution Characteristics of Overburden Instability and Failure under Deep Complex Mining Conditions. Geofluids 2022, 2022, 6418082. [Google Scholar] [CrossRef]
  17. Poulsen, B.A. Coal Pillar Load Calculation by Pressure Arch Theory and near Field Extraction Ratio. Int. J. Rock. Mech. Min. Sci. 2010, 47, 1158–1165. [Google Scholar] [CrossRef]
  18. Zhao, Q.; Yang, Z.; Jiang, Y.; Liu, X.; Cui, F.; Li, B. Discrete Element Analysis of Deformation Features of Slope Controlled by Karst Fissures under the Mining Effect: A Case Study of Pusa Landslide, China. Geomat. Nat. Hazards Risk 2023, 14, 1–35. [Google Scholar] [CrossRef]
  19. Lunder, P.; Pakalnis, R.C. Determination of the Strength of Hard-Rock Mine Pillars. CIM Bull. 1997, 90, 51–55. [Google Scholar]
  20. Esterhuizen, G.S.; Dolinar, D.R.; Ellenberger, J.L. Pillar Strength in Underground Stone Mines in the United States. Int. J. Rock. Mech. Min. Sci. 2011, 48, 42–50. [Google Scholar] [CrossRef]
  21. Fang, Z.; Harrison, J.P. Numerical Analysis of Progressive Fracture and Associated Behaviour of Mine Pillars by Use of a Local Degradation Model. Min. Technol. 2002, 111, 59–72. [Google Scholar] [CrossRef]
  22. Xie, X.-B.; Deng, R.-N. Stability of Goaf Group System Based on Catastrophe Theory and Rheological Theory. Rock. Soil. Mech. 2018, 39, 1963–1972. [Google Scholar]
  23. Zhao, Y.; Wu, Q. Strength Reduction Method to Study Stability of Goaf Overlapping Roof Based on Catastrophe Theory. Chin. J. Rock. Mech. Eng. 2010, 29, 11. [Google Scholar]
  24. Xu, Z.; Xu, W.; Zhu, Z.; Zhao, J. Research on Monitoring and Stability Evaluation of Ground Subsidence in Gypsum Mine Goaf. Front. Environ. Sci. 2023, 10, 1097874. [Google Scholar] [CrossRef]
  25. Jia, H.; Yan, B.; Guan, K.; Liu, H.; Wu, Q.; Yin, Y.; Liu, H. Stability Analysis of Shallow Goaf Based on Field Monitoring and Numerical Simulation: A Case Study at an Open-Pit Iron Mine, China. Front. Earth Sci. 2022, 10, 897779. [Google Scholar] [CrossRef]
  26. Hoek, E.; Carranza-Torres, C.; Corkum, B. Hoek-Brown Failure Criterion—2002 Edition. In Proceedings of the 5th North American Rock Mechanics Symposium and 17th Tunnelling Association of Canada Conference: NARMS-TAC 2002, Toronto, ON, Canada, 7–10 July 2002. [Google Scholar]
  27. Ren, Q.; Wang, F.; Chen, B.; Zhao, M.; Peng, Z.; Yang, M. Study on Stability Prediction of Pillars Based on Bieniawski Pillar Strength Formula: A Case of a Phosphate Mine. Geotech. Geol. Eng. 2020, 38, 4033–4044. [Google Scholar] [CrossRef]
  28. Biot, M.A. General Theory of Three-Dimensional Consolidation. J. Appl. Phys. 1941, 12, 155–164. [Google Scholar] [CrossRef]
  29. Katoch, S.; Chauhan, S.S.; Kumar, V. A Review on Genetic Algorithm: Past, Present, and Future. Multimed. Tools Appl. 2021, 80, 8091–8126. [Google Scholar] [CrossRef]
  30. Janiesch, C.; Zschech, P.; Heinrich, K. Machine Learning and Deep Learning. Electron. Mark. 2021, 31, 685–695. [Google Scholar] [CrossRef]
  31. Cheng, F.; Chen, A.; Wu, D.; Tang, X.; Su, C. Numerical Simulation of Cracking Failure and Weakening Law of Roadway Surrounding Rock under High Stress. Shock. Vib. 2021, 2021, 7236077. [Google Scholar] [CrossRef]
  32. Kravchuk, I.L.; Pikalov, V.A.; Nevolina, E.M.; Yutyaev, E.P.; Ivanov, Y.M. Specific Features of Mining Enterprises Safety Control Systems Formation and Functioning in Complicated Conditions of Deposits Development. Ugol’ 2017, 53, 60–67. [Google Scholar] [CrossRef]
  33. Xu, X.; Fu, L.-Y.; Liu, N.; Han, T. On the Determination of Coordination Numbers of Coupled DEM-DFN Model for Modeling Fractured Rocks. Front. Earth Sci. 2021, 9, 665275. [Google Scholar] [CrossRef]
  34. Hosseini, E.; Sarmadivaleh, M.; Chen, Z. Developing a New Algorithm for Numerical Modeling of Discrete Fracture Network (DFN) for Anisotropic Rock and Percolation Properties. J. Pet. Explor. Prod. Technol. 2021, 11, 839–856. [Google Scholar] [CrossRef]
  35. Cundall, P.A.; Hart, R.D. Numerical Modeling of Discontinua. Eng. Comput. 1992, 9, 101–113. [Google Scholar] [CrossRef]
  36. Deb, K.; Pratap, A.; Agarwal, S.; Meyarivan, T. A Fast and Elitist Multiobjective Genetic Algorithm: NSGA-II. IEEE Trans. Evol. Comput. 2002, 6, 182–197. [Google Scholar] [CrossRef]
  37. Ou, D.; Tan, K.; Du, Q.; Chen, Y.; Ding, J. Decision Fusion of D-InSAR and Pixel Offset Tracking for Coal Mining Deformation Monitoring. Remote Sens. 2018, 10, 1055. [Google Scholar] [CrossRef]
  38. Jia, H.; Yan, B.; Yang, Z.; Yilmaz, E. Identification of Goaf Instability under Blasting Disturbance Using Microseismic Monitoring Technology. Geomech. Geophys. Geo-Energy Geo-Resour. 2023, 9, 142. [Google Scholar] [CrossRef]
Figure 1. Division of gob numbers.
Symmetry 17 01024 g001
Figure 2. Calculation results of safety factor for mining pillars: (a) is the histogram and kernel density distribution of the factor of safety (FOS); (b) shows the relationship between FOS and the width-to-height (W/H) ratio; (c) is a 3D scatter plot of pillar failure modes; and (d) is the heatmap of regional stability classification.
Symmetry 17 01024 g002
Figure 3. Three-dimensional model of mining area.
Symmetry 17 01024 g003
Figure 4. Initial stress field of numerical simulation analysis model. (a) maximum principal stress; (b) minimum principal stress.
Symmetry 17 01024 g004
Figure 5. Typical profile selection. (a) Shows Profile I–I; (b) shows Profile II–II; (c) shows Profile III–III; and (d) shows Profile IV–IV.
Symmetry 17 01024 g005
Figure 6. Cloud diagrams of maximum and minimum principal stress of goaf roof and surrounding rock. (a) Illustrates the distribution of maximum principal stress along Profile I–I; (b) presents the maximum principal stress cloud diagram for Profile II–II; (c) depicts the maximum principal stress distribution for Profile III–III; (d) displays the cloud diagram of maximum principal stress along Profile IV–IV; (e) shows the maximum principal stress field of the west-wing pillars at the −20 m level; (f) provides the maximum principal stress distribution for the east-wing pillars at the −20 m level; (g) visualizes the maximum principal stress within the pillars at the −50 m level; (h) outlines the maximum principal stress distribution for the pillars at the −80 m level; (i) illustrates the distribution of minimum principal stress along Profile I–I; (j) presents the minimum principal stress cloud diagram for Profile II–II; (k) depicts the distribution of minimum principal stress for Profile III–III; (l) displays the minimum principal stress distribution along Profile IV–IV; (m) shows the minimum principal stress field of the west-wing pillars at the −20 m level; (n) provides the distribution of minimum principal stress for the east-wing pillars at the −20 m level; (o) visualizes the minimum principal stress within the pillars at the −50 m level; and (p) outlines the distribution of minimum principal stress for the pillars at the −80 m level.
Symmetry 17 01024 g006
Figure 7. Cloud diagrams of plastic zone distribution and maximum displacement in the roof and floor of the goaf. (a) Illustrates the distribution of plastic zones along Profile I–I; (b) presents the plastic zone cloud diagram for Profile II–II; (c) depicts the plastic zone distribution along Profile III–III; (d) displays the plastic zone development in Profile IV–IV; (e) shows the plastic zone distribution in the west-wing pillars at the −20 m level; (f) provides the plastic zone cloud diagram for the east-wing pillars at the −20 m level; (g) visualizes the plastic zone extent in the pillars at the −50 m level; (h) outlines the plastic zone distribution in the pillars at the −80 m level; (i) illustrates the maximum displacement distribution along Profile I–I; (j) presents the cloud diagram of maximum displacement for Profile II–II; (k) depicts the maximum displacement field in Profile III–III; (l) displays the maximum displacement distribution in Profile IV–IV; (m) shows the maximum displacement cloud diagram for the west-wing pillars at the −20 m level; (n) provides the distribution of maximum displacement for the east-wing pillars at the −20 m level; (o) visualizes the maximum displacement pattern within the pillars at the −50 m level; and (p) outlines the maximum displacement field in the pillars at the −80 m level.
Symmetry 17 01024 g007
Figure 8. Pore water pressure cloud map of goaf top and bottom floor and surrounding rock. (a) Illustrates the pore water pressure distribution along Profile I–I; (b) presents the cloud diagram of pore pressure for Profile II–II; (c) depicts the pore water pressure field in Profile III–III; (d) displays the pore pressure distribution in Profile IV–IV; (e) shows the pore water pressure distribution in the west-wing pillars at the −20 m level; (f) provides the cloud diagram of pore pressure for the east-wing pillars at the −20 m level; (g) visualizes the pore water pressure distribution in the pillars at the −50 m level; and (h) outlines the pore pressure field for the pillars at the −80 m level.
Symmetry 17 01024 g008
Figure 9. Numerical simulation calculation results of the maximum principal stress and compressive stress in the goaf.
Symmetry 17 01024 g009
Figure 10. Goaf stability classification diagram.
Symmetry 17 01024 g010
Figure 11. Flowchart of genetic algorithm optimization. Rectangles represent process steps, while the diamond denotes a decision node. Solid arrows indicate the flow direction, and the dashed-line box highlights the iterative loop of the genetic algorithm.
Symmetry 17 01024 g011
Figure 12. Three-dimensional risk distribution diagram of goaf.
Symmetry 17 01024 g012
Figure 13. Numerical simulation diagram of goaf treatment. (a) Shows the maximum principal stress distribution cloud diagram of the west-wing goaf; (b) presents the minimum principal stress distribution in the west-wing goaf; (c) illustrates the pore water pressure distribution in the west-wing goaf; (d) displays the plastic zone distribution of the west-wing goaf; (e) shows the maximum principal stress distribution in the east-wing goaf; (f) presents the minimum principal stress distribution in the east-wing goaf; (g) illustrates the pore water pressure field in the east-wing goaf; (h) displays the plastic zone development in the east-wing goaf; (i) shows the maximum principal stress distribution in goaf WA-5; (j) presents the minimum principal stress distribution in goaf WA-5; (k) illustrates the pore water pressure distribution in goaf WA-5; and (l) displays the plastic zone distribution in goaf WA-5.
Symmetry 17 01024 g013
Table 1. Parameters of surrounding rock and ore body rock mass.
Rock SamplePhaseCompressive Strength (MPa)Elastic Modulus (GPa)Tensile Strength (MPa)Cohesion (MPa)Friction
Angle (°)
Surrounding RockSaturated15.12413.8760.4441.33751.06
Ore BodySaturated8.9317.0880.2010.78046.48
Table 2. Mechanical parameters of filling.
Backfill BodyTensile Strength (MPa)Compressive Strength (MPa)Elastic Modulus (MPa)Poisson’s RatioCohesion (MPa)Friction Angle
(°)
Unit Weight
(KN/m3)
Cemented Rockfill0.394.51.480.280.353022
Uncemented Rockfill0.010.50.30.30.303613.4
Table 3. Comparison of stress and pore pressure before and after goaf remediation.
GoafsMax. Principal Stress Before (MPa)Max. Principal Stress After (MPa)Change Rate of Max. Stress (%)Min. Principal Stress Before (MPa)Min. Principal Stress After (MPa)Change Rate of Min. Stress (%)Pore Water Pressure Before (MPa)Pore Water Pressure After (MPa)Change Rate of Pore Water Pressure (%)
West-wing goaf group1.4320.807−43.650.2810.230−18.150.80.75−6.25
East-wing goaf group1.7980.702−60.960.6690.290−56.650.3500.250−28.6
WA-5 goaf group0.8560.807−5.70.2920.281−3.80.2500.450+80.0
Disclaimer/Publisher’s Note: The statements, opinions and data contained in all publications are solely those of the individual author(s) and contributor(s) and not of MDPI and/or the editor(s). MDPI and/or the editor(s) disclaim responsibility for any injury to people or property resulting from any ideas, methods, instructions or products referred to in the content.

