1. Introduction
Graphite, as an indispensable strategic resource in modern industry, has been widely utilized in traditional industrial sectors, including refractory materials, electrode brushes, pencil manufacturing, foundry operations, sealing components, and lubrication systems, due to its unique layered structure and exceptional physicochemical properties. Concurrently, it demonstrates significant application potential in high-tech industries, such as new energy vehicles, electronic information technology, and nuclear engineering [
1,
2]. With continuous technological advancement and the rapid expansion of the new energy vehicle market, there is an escalating demand for high-quality graphite in premium applications, establishing it as a critical raw material for ensuring supply chain stability and enhancing core competitiveness within the new energy vehicle industry [
3]. According to projections by the International Energy Agency (IEA), the global graphite demand is anticipated to surge by 20–25 fold by 2040 to meet net-zero emission targets, requiring mineral production to increase by 300% compared to 2020 levels [
4]. In this context, the efficient development and utilization of graphite mineral resources are not only crucial for the sustainable development of the industry but have also become a key issue in national resource security strategies.
Traditional graphite ore grade detection primarily relies on physicochemical analysis methods, including manual visual inspection and instrumental techniques, such as X-ray diffraction (XRD) and scanning electron microscopy with energy-dispersive spectroscopy (SEM-EDS) [
5,
6]. For example, Cui et al. [
7] conducted physicochemical analyses of a flake graphite ore using XRD and electron microscopy, assessing its beneficiation potential and its impact on the mineral processing workflow. Zhu et al. [
8] proposed a novel electrode-based method for determining the fixed carbon and fluorine content in graphite ore, investigating its decomposition efficiency and feasibility. While these methods provide precise elemental analysis, they suffer from inherent limitations such as destructive sampling, long detection cycles, and high operational costs. Additionally, manual visual identification heavily relies on experienced professionals for measurement, leading to high subjectivity and inconsistency [
9].
With the rapid advancement of machine vision and machine learning technologies, mineral-image-based machine learning algorithms have emerged as a novel solution in the field of ore sorting [
10]. For instance, Borges et al. [
11] extracted mineralogical information from digital images using k-nearest neighbors and decision trees, enabling the classification of rock thin-section minerals. Hou et al. [
12] analyzed trace element data of chlorite using algorithms such as random forests, validating the critical role of elements like Ni, Cr, and Co in mineral deposit classification, thereby improving the efficiency of deposit type identification. However, traditional machine learning methods typically rely on manually designed feature extraction, which is not only highly dependent on prior domain knowledge and susceptible to subjectivity but also vulnerable to environmental variations, ultimately limiting the model’s generalization capability.
As a cutting-edge technology in intelligent mineral detection, deep learning algorithms can automatically extract complex correlations between the optical characteristics of minerals and their grade, overcoming the limitations of manual feature engineering and significantly reducing the impact of nonlinear factors, thereby enhancing the classification accuracy [
13]. However, existing graphite ore detection techniques still exhibit certain limitations. For example, Xiang et al. [
14] proposed an improved Faster R-CNN-based graphite ore detection method, integrating data augmentation, multi-scale feature fusion, and an RGA attention mechanism, achieving an mAP of 80.21%. Nevertheless, further improvements in accuracy remain necessary. Huang et al. [
15] introduced a graphite-ore-grade-identification method based on an enhanced Inception-ResNet-v2 model, which achieved an accuracy exceeding 90%. However, due to its large parameter size (37M), this model may still face challenges in real-time processing and deployment efficiency in practical applications. Furthermore, existing models generally lack sufficient robustness against certain anomalies encountered in real-world applications, such as the motion blur caused by equipment vibrations, dust occlusion, and uneven lighting conditions.
Based on recent work, it can be summarized that computer vision technology has made significant progress in mineral identification and grade-sorting tasks, partially addressing the limitations of traditional methods, such as destructive sampling, long detection cycles, and high operational costs [
16,
17]. However, its application in graphite ore detection still faces numerous challenges, including the complex surface textures of ores, background interference, and morphological differences among ores of varying grades, all of which significantly complicate graphite ore quality assessments [
18]. Moreover, to enhance the classification accuracy, deep learning models often rely on deeper network architectures, leading to an increased number of model parameters. This not only exacerbates computational burdens but also significantly increases real-time detection delays in industrial applications and poses challenges for model deployment on edge devices [
19].
Therefore, to effectively meet the practical demands of graphite ore production, there is an urgent need for a detection model that integrates high-precision recognition capabilities with a lightweight architectural design. Such a model should not only achieve state-of-the-art classification accuracy but also maintain a balanced trade-off between computational efficiency and resource consumption. Ensuring efficient deployment on edge devices is essential to enhance the model’s applicability in industrial scenarios, particularly in real-time and resource-constrained environments.
To achieve the above goals, this study proposes an enhanced YOLO11-based network for graphite ore grade detection. The model incorporates a lightweight asymmetrical backbone along with an improved feature extraction module and detection head, aiming to achieve fast and accurate grade identification. Furthermore, it is designed to optimize computational efficiency and resource utilization, ensuring effective deployment on edge devices. These enhancements significantly improve the practicality of industrial applications and strengthen the real-time detection capabilities.
The principal contributions and methods adopted in this study include the following:
Through systematic preparation procedures encompassing field sampling, imaging acquisition, and data processing, we independently constructed a graphite ore image dataset containing two morphological types and three grade categories.
We implemented architectural optimization by replacing the original YOLOv11 backbone with StarNet, a lightweight backbone network that achieves efficient feature representation. This substitution reduces network complexity through the nonlinear mapping of low-dimensional ore images into high-dimensional feature spaces.
A novel C3k2-CAS feature extraction module was developed in the neck section by integrating convolutional operations with an additive self-attention mechanism in the proposed CAS Block. This design enhances mineral discrimination without substantially increasing the computational overhead.
The detection head was reconfigured as Detect-SEAM through incorporation of the SEAM module, which employs depthwise separable convolutions and channel information fusion mechanisms to improve feature capture capability under suboptimal imaging conditions.
The remainder of this paper is structured as follows:
Section 2 introduces the proposed improved graphite ore grade detection model and details the specific enhancements.
Section 3 describes the dataset, experimental environment, and parameter settings, while also outlining the evaluation criteria used in the experiments.
Section 4 presents an analysis of the experimental results, along with data and conclusions from various comparative experiments. Finally,
Section 5 summarizes the findings of this study and discusses potential directions for future research.
2. Methods
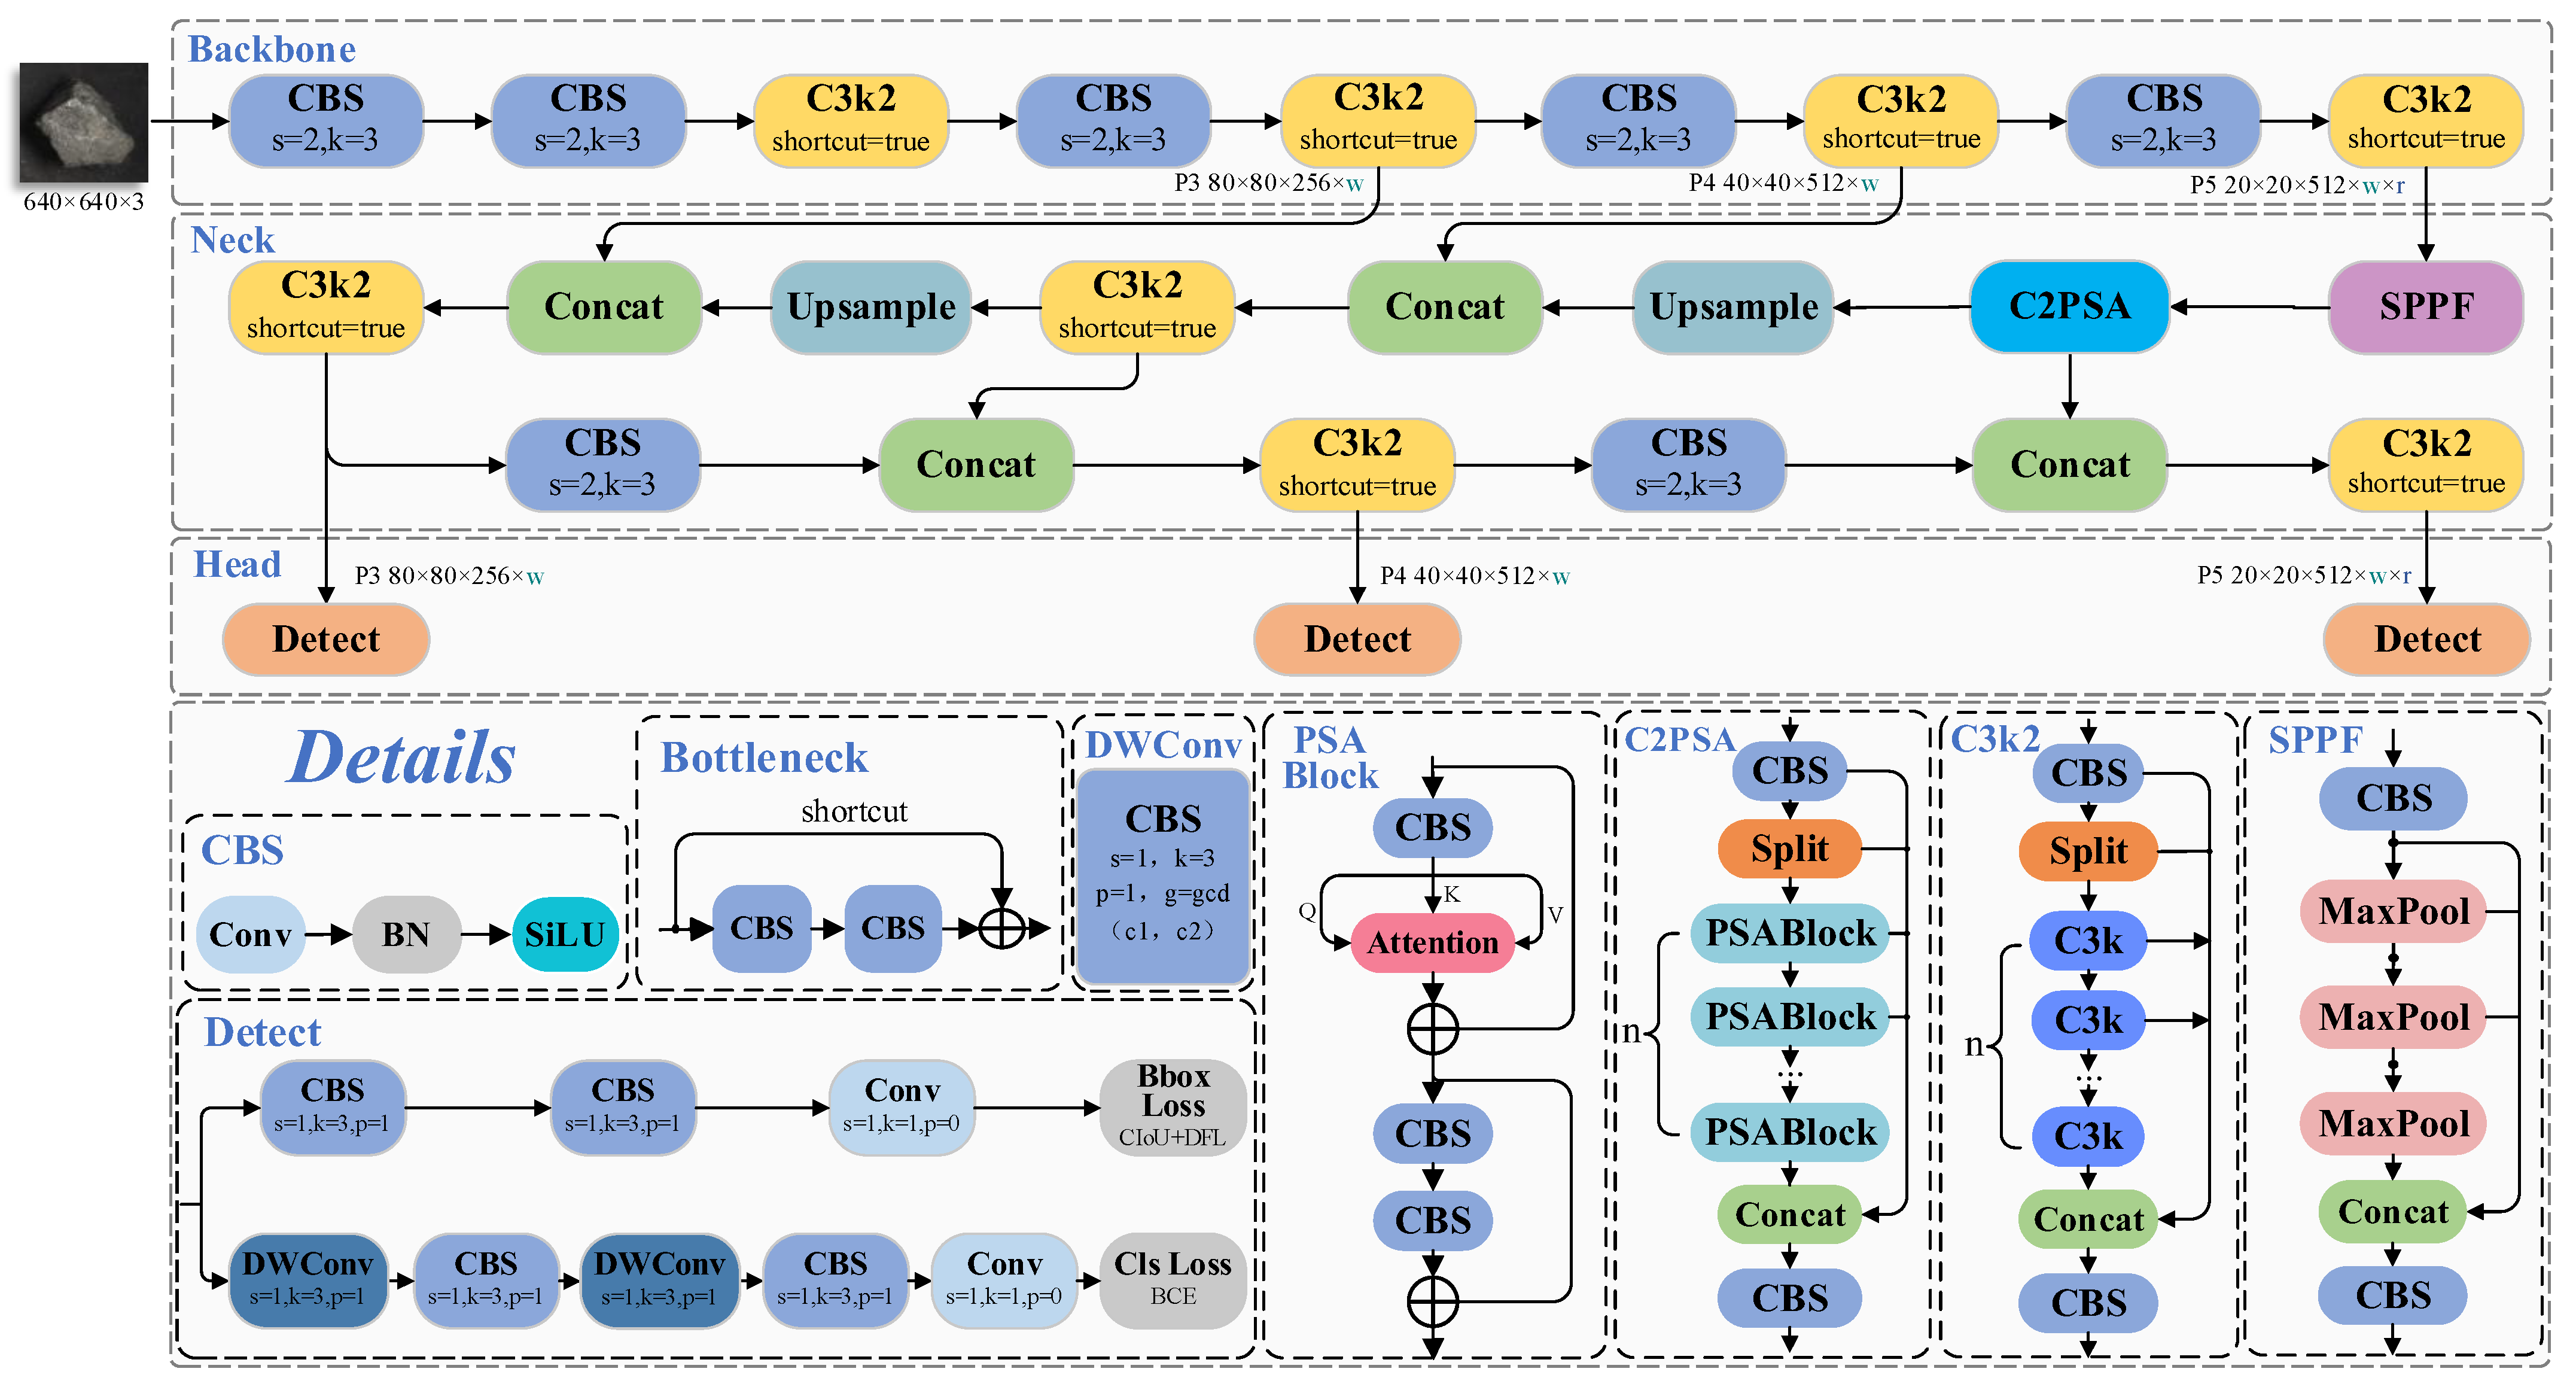
2.1. The Original YOLO11 Network
YOLO11 [
20] is the latest iteration developed by the Ultralytics team; building upon the Programmable Gradient Information (PGI) framework from its predecessors, it is one of the most advanced object detection algorithms currently available. The improvements in YOLO11 compared to previous versions can be summarized as follows: (i) Feature Extraction Module Upgrade: the original C2f module is upgraded to the C3k2 module, which merges the advantages of C2f and C3. This optimizes both the feature extraction path and gradient propagation mechanisms, effectively reducing the number of parameters and improving computational efficiency. (ii) Enhanced Multi-Scale Feature Adaptability: the C2PSA module is introduced after the SPPF module to improve the model’s adaptability to occluded targets and multi-scale features, thereby enhancing detection robustness. (iii) Detection Head Optimization: depthwise separable convolution [
21] is employed in the detection head to reduce redundant computations, further boosting the model’s inference efficiency. The overall network structure and relevant details are illustrated in
Figure 1.
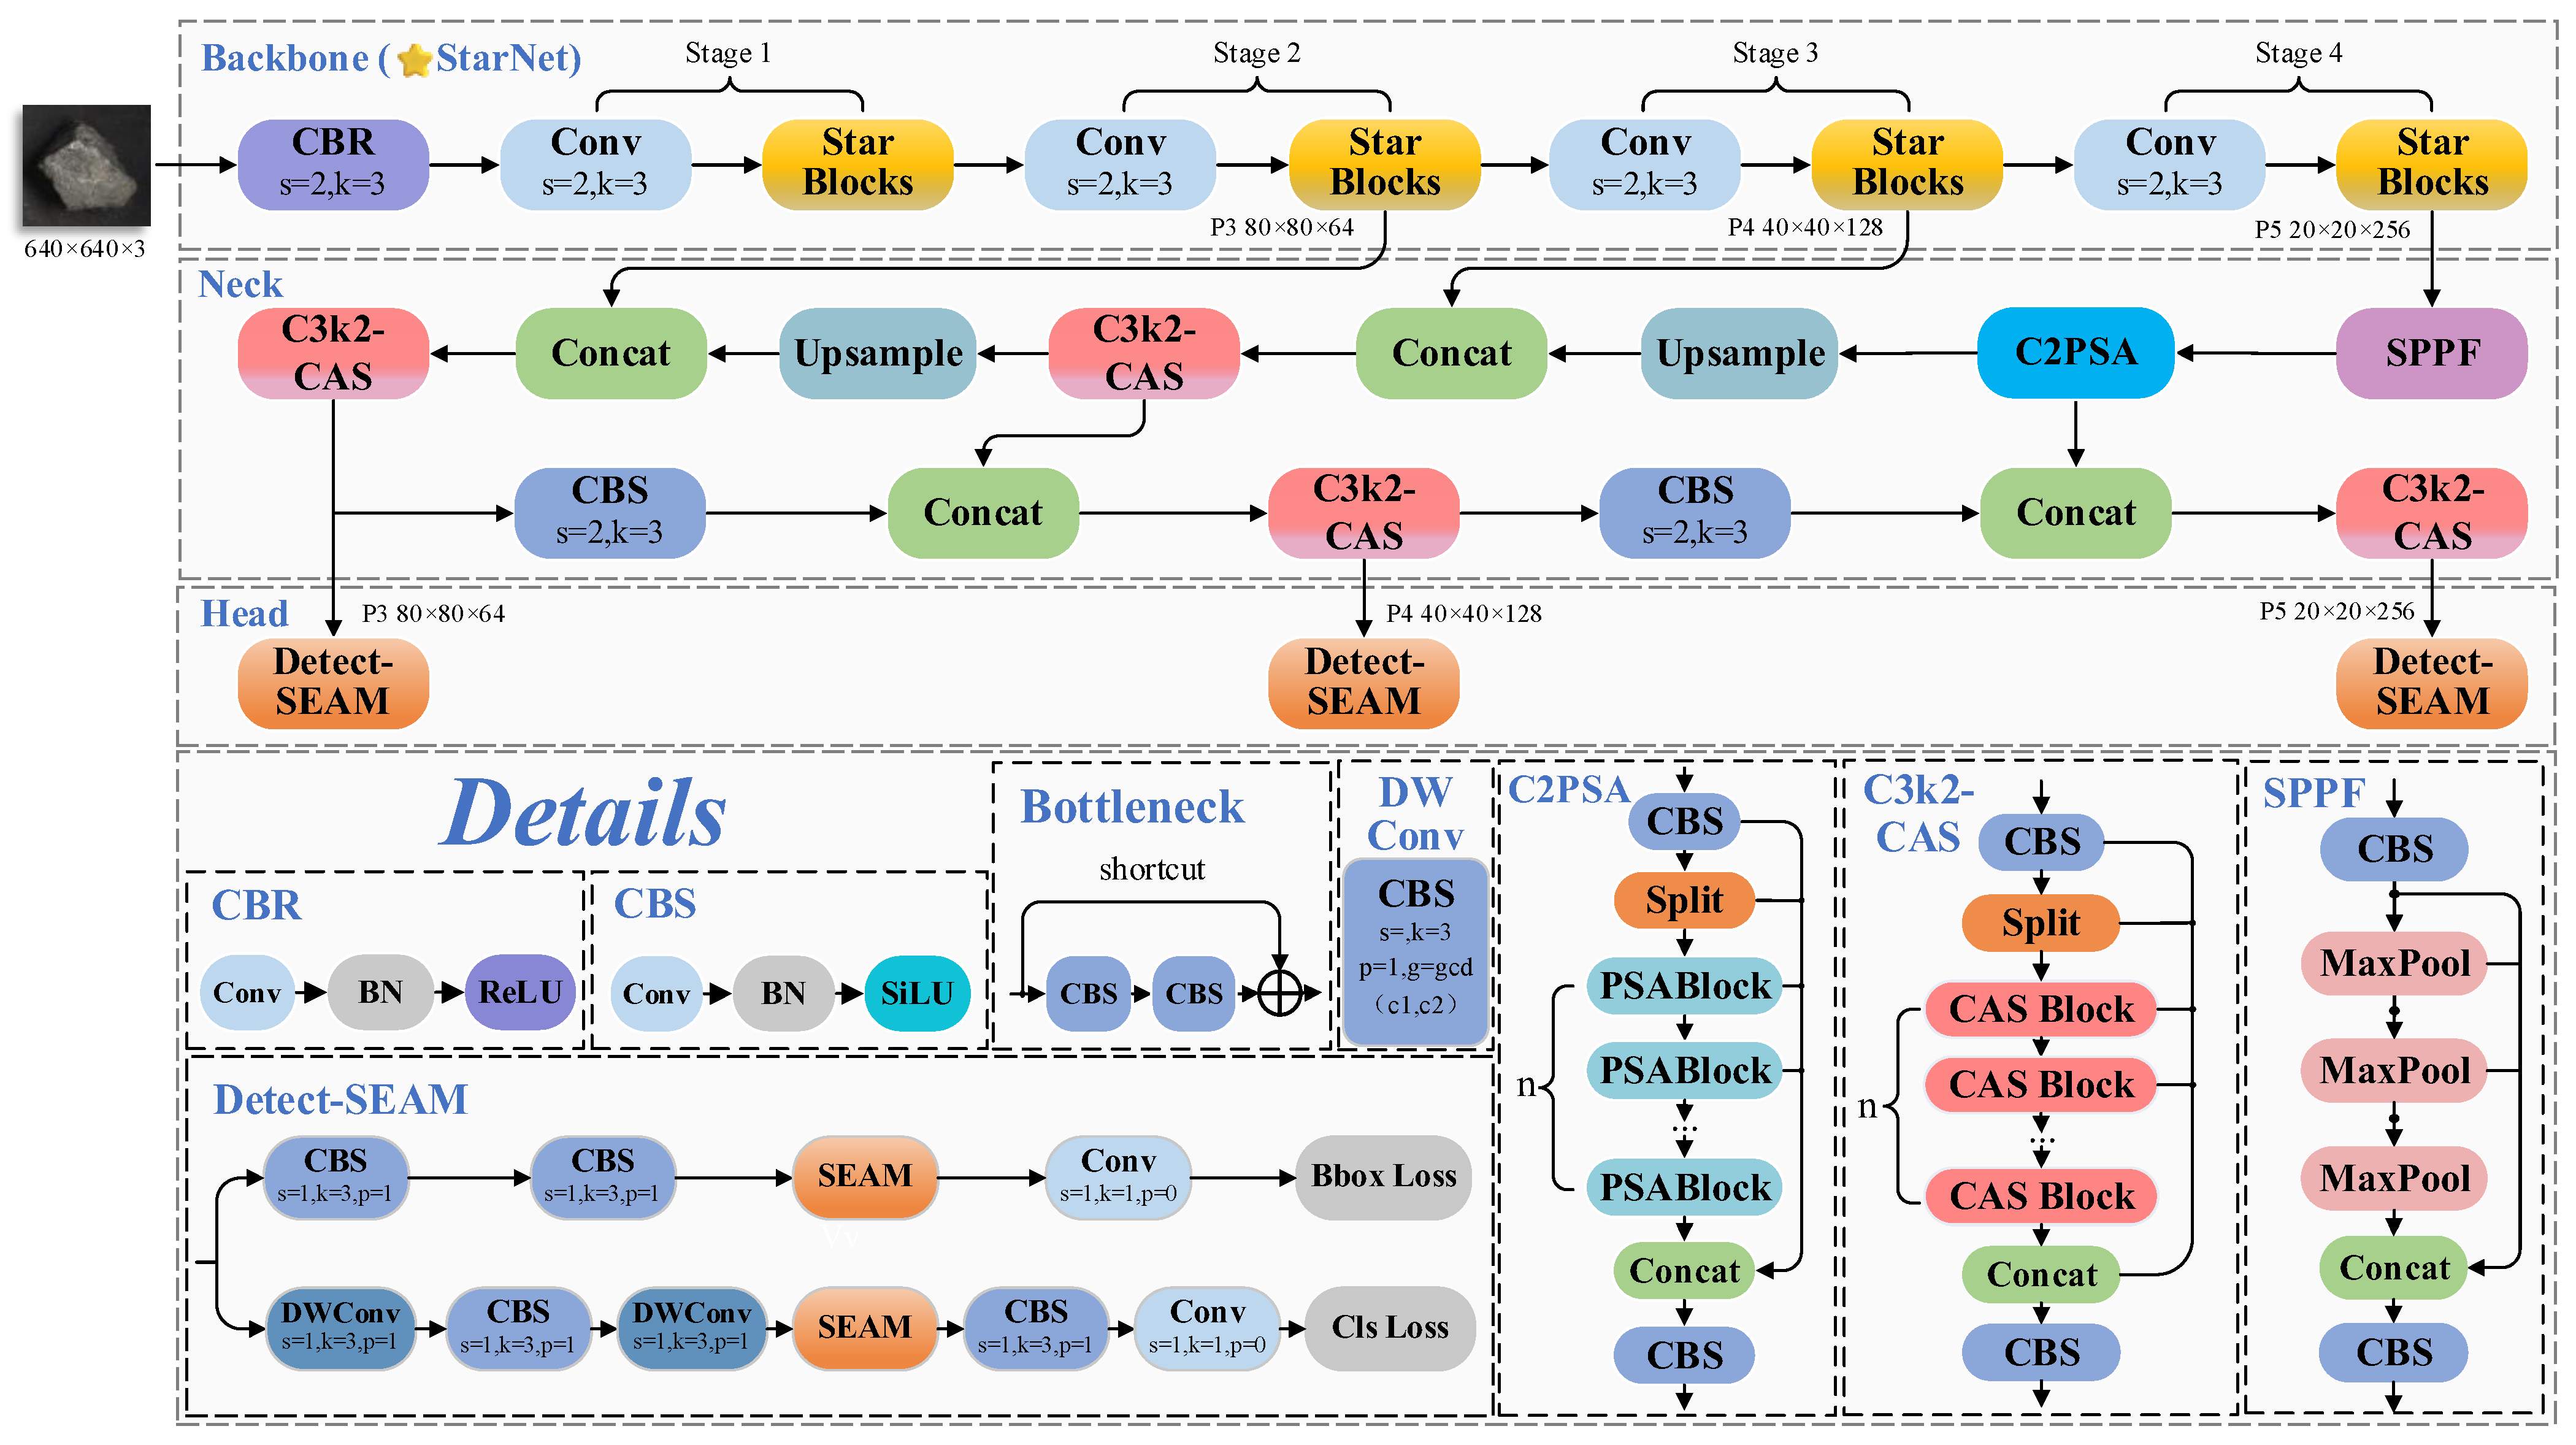
2.2. The Improved Stellar-YOLO Network
Considering the accuracy requirements in practical applications and the constraints on computational resources, a high-precision yet lightweight graphite ore grade asymmetric detection framework was developed based on YOLO11. The proposed architecture consists of three functionally specialized components: backbone, neck, and head.
The backbone network integrates the lightweight StarNet [
22] to enhance the feature extraction efficiency. By incorporating Star Block, which employs depthwise separable convolutions and multi-scale feature aggregation, the computational complexity is reduced while improving sensitivity to the fine-grained details in ore images. For the neck, the CAS attention mechanism from CAS-ViT [
23] was incorporated into the feature extraction module, leading to the redesigned C3k2-CAS module. This module combines convolutional operations with an additive self-attention mechanism, adaptively optimizing channel weights to enhance the extraction of mineral features while maintaining the computational efficiency. In the detection head, the SEAM module [
24] was introduced, and a new Detect-SEAM structure was designed. By leveraging depthwise separable convolutions and cross-channel information fusion, the feature representation capability is strengthened, allowing the model to accurately capture fine details in ore images even under suboptimal detection conditions. The architecture of the improved model is illustrated in
Figure 2. The following subsections of this section describe the working principles and related technologies of each module.
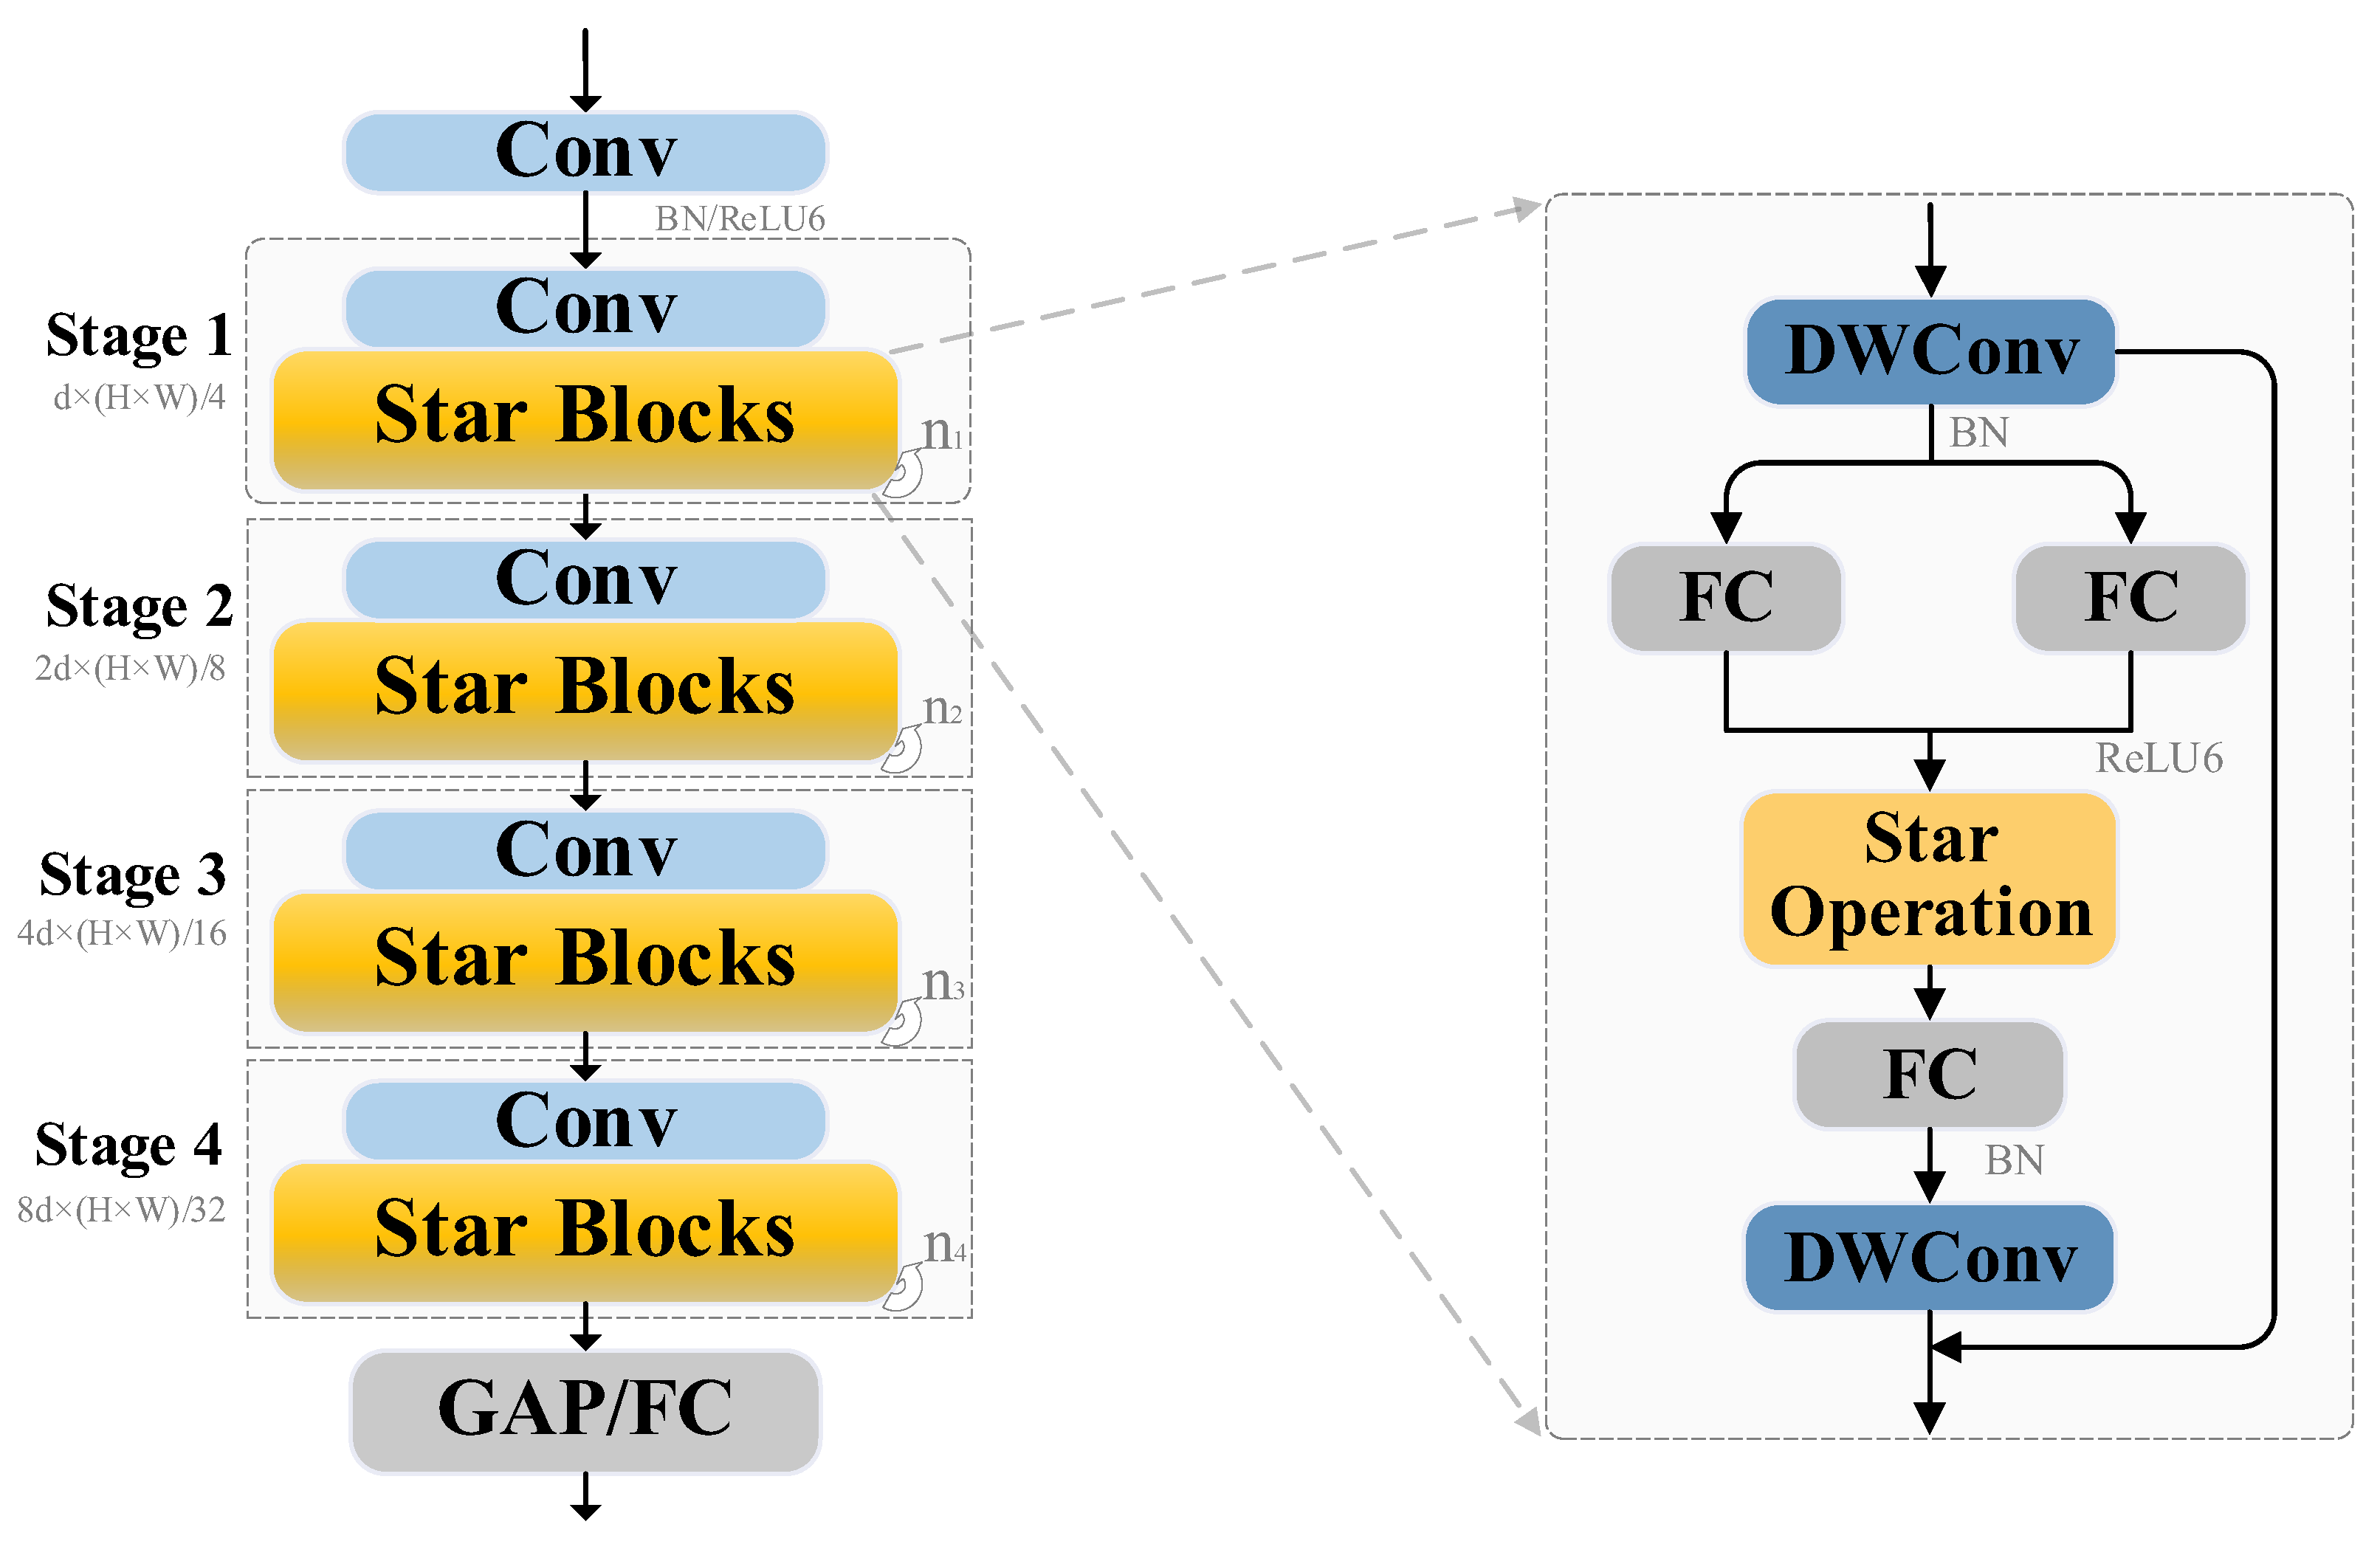
2.3. StarNet
StarNet is a novel lightweight neural network backbone architecture, with structural details illustrated in
Figure 3. It adopts a four-stage hierarchical design, where each stage comprises multiple Star Blocks to progressively enhance the network’s feature representation capability. Following an initial 3 × 3 convolutional downsampling layer, the number of feature channels increases stage by stage, enabling more expressive representations.
To improve the computational efficiency, StarNet replaces Layer Normalization (LN) with Batch Normalization (BN), which is more suitable for convolutional operations in lightweight settings. Additionally, it incorporates a second-order interaction modeling mechanism with linear computational complexity, effectively capturing intricate feature dependencies while maintaining low overhead. This design not only reduces the overall computational burden but also enhances both the representational capacity and inference speed. At the final stage, StarNet employs Global Average Pooling (GAP) followed by a Fully Connected (FC) layer for classification, ensuring efficient multi-scale feature aggregation. Overall, the architecture strikes a balance between model compactness and performance, making it well-suited for resource-constrained applications in real-world deployment scenarios.
2.3.1. Star Operation
The Star Operation is the core mechanism of StarNet, designed to efficiently model the nonlinear interactions of input features through a Star-shaped Transformation. Specifically, the Star Operation establishes complex feature representations by leveraging the element-wise Hadamard product between input features and learnable weights. This approach enables high-dimensional feature modeling within a low-dimensional space, significantly reducing the computational overhead.
Assume the input feature is given as
, where
represents the number of input samples and
denotes the number of input channels. The input vector is extended as
. Under the output channel setting, the weight matrices are denoted as
and
, respectively. The weighted sum operations for the input feature
with the two weight vectors can be formulated as follows:
where
and
represent the i-th element in the corresponding weight matrix and feature vector, respectively, indicating an individual weight value. Subsequently, by performing an element-wise Hadamard product between these two weighted sum vectors, the output of the Star Operation can be expressed as follows:
where the symbol “⊙” denotes the element-wise Hadamard product. From a mathematical perspective, this formulation effectively constructs a hierarchical feature mapping in a
dimensional space, demonstrating StarNet’s capacity for complex pattern representation while circumventing the additional computational cost associated with explicitly constructing such second-order feature mappings.
2.3.2. Star Block
Star Block serves as the fundamental building unit of StarNet, enabling efficient feature modeling through depthwise separable convolution and parallel nonlinear transformation combined with feature interaction. Initially, given an input feature
, an intermediate feature
is extracted through depthwise separable convolution, which is formulated as follows:
Subsequently, the convolution result F′ is fed into two parallel fully connected branches for processing, aiming to model multi-perspective nonlinear mappings. The distinction between these branches lies in their specific operations: the first branch applies batch normalization (BN) before fully connected transformation, denoted as
fB(F′), while the second branch undergoes fully connected transformation followed by the ReLU activation function, denoted as
fR(F′). The outputs from these two branches are then fused via the Star Operation, followed by an additional depthwise separable convolution for refinement. The final output of the Star Block, denoted as Y, is obtained by incorporating a residual connection with the input feature F, and this process is expressed as follows:
This computational scheme enhances the feature interaction capability of the Star Block without introducing excessive computational overhead. The incorporation of residual connections ensures effective information propagation while improving training stability. Overall, the Star Block relies solely on twice depthwise separable convolution and a single Star Operation, endowing StarNet with the potential to serve as a lightweight backbone for feature extraction networks.
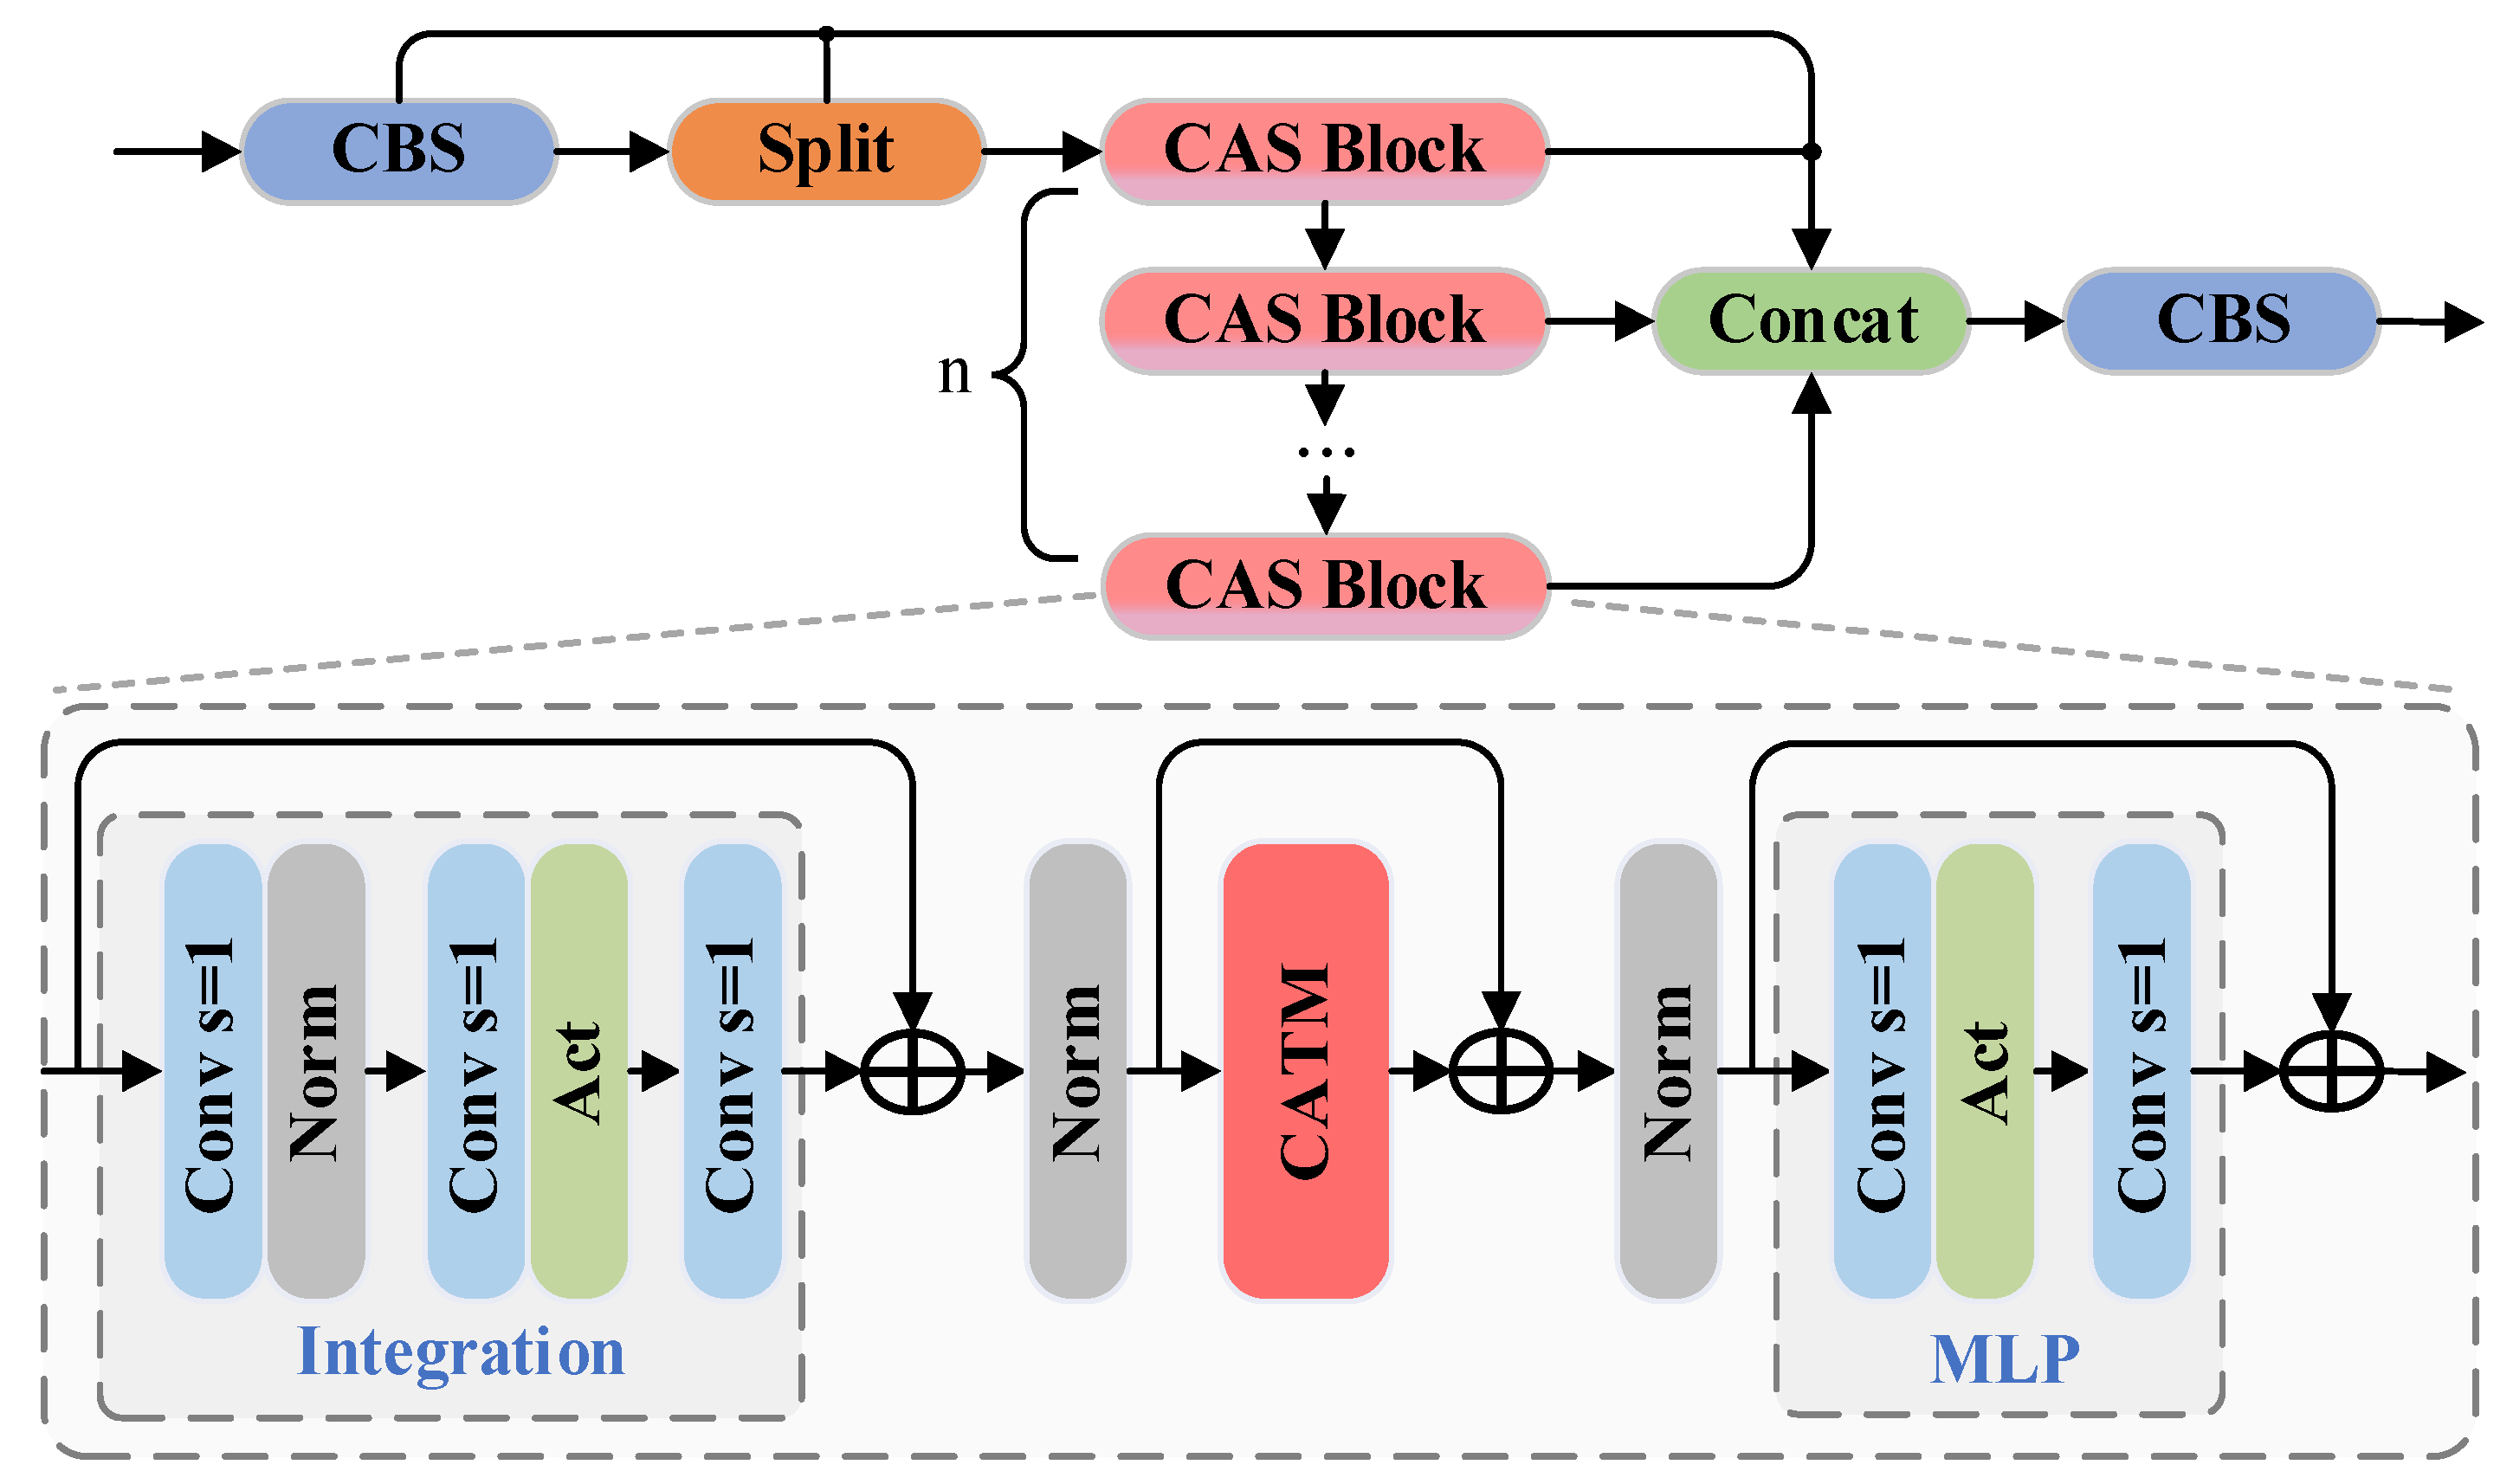
2.4. C3k2-CAS
Compared to the feature extraction modules in previous versions (C3 and C2f), C3k2 provides a more flexible feature propagation path, thereby enhancing feature representation to a certain extent. However, its feature aggregation mechanism and inference efficiency still have room for improvement. To address this issue, the CAS Block has been introduced into the C3k2 structure of YOLO11, resulting in the development of a novel C3k2-CAS module tailored for graphite ore detection tasks. The structural details are shown in
Figure 4.
The C3k2-CAS module adopts a branched structure to enhance the diversity of feature extraction. After the input features are processed by the CBS module, they are divided into multiple subspaces through the Split operation and then fed into multiple CAS Blocks for feature transformation in parallel. The CAS Block combines convolution with additive self-attention mechanisms, which not only enhances local feature modeling but also improves the ability to capture global information. Subsequently, the features from all sub-branches are aggregated through Concat and optimized again by the CBS module to improve the feature consistency and representational power. The C3k2-CAS module leverages multi-branch parallel computation and cross-scale feature interaction to achieve more efficient feature representation, improving the detection accuracy and computational efficiency, thus providing a better feature extraction solution for the YOLO11 framework.
2.5. CAS Block
The structure of the Convolutional Additive Self-attention Block (CAS Block) consists of the Integration module, CATM (a module incorporating the additive attention mechanism), and the MLP transformation unit. As shown in
Figure 4, the feature X after the Split operation of C3k2-CAS first passes through the Integration module, which enhances local feature interactions using a stack of three 1 × 1 convolutional layers interleaved with a normalization and activation function. The computation can be expressed as follows:
where X is the input tensor and Act(·) denotes a nonlinear activation function (e.g., GELU). This formulation enables nonlinear local transformation while maintaining computational efficiency. A residual connection adds the input X back to
, and the sum is normalized to produce the input to the CATM module.
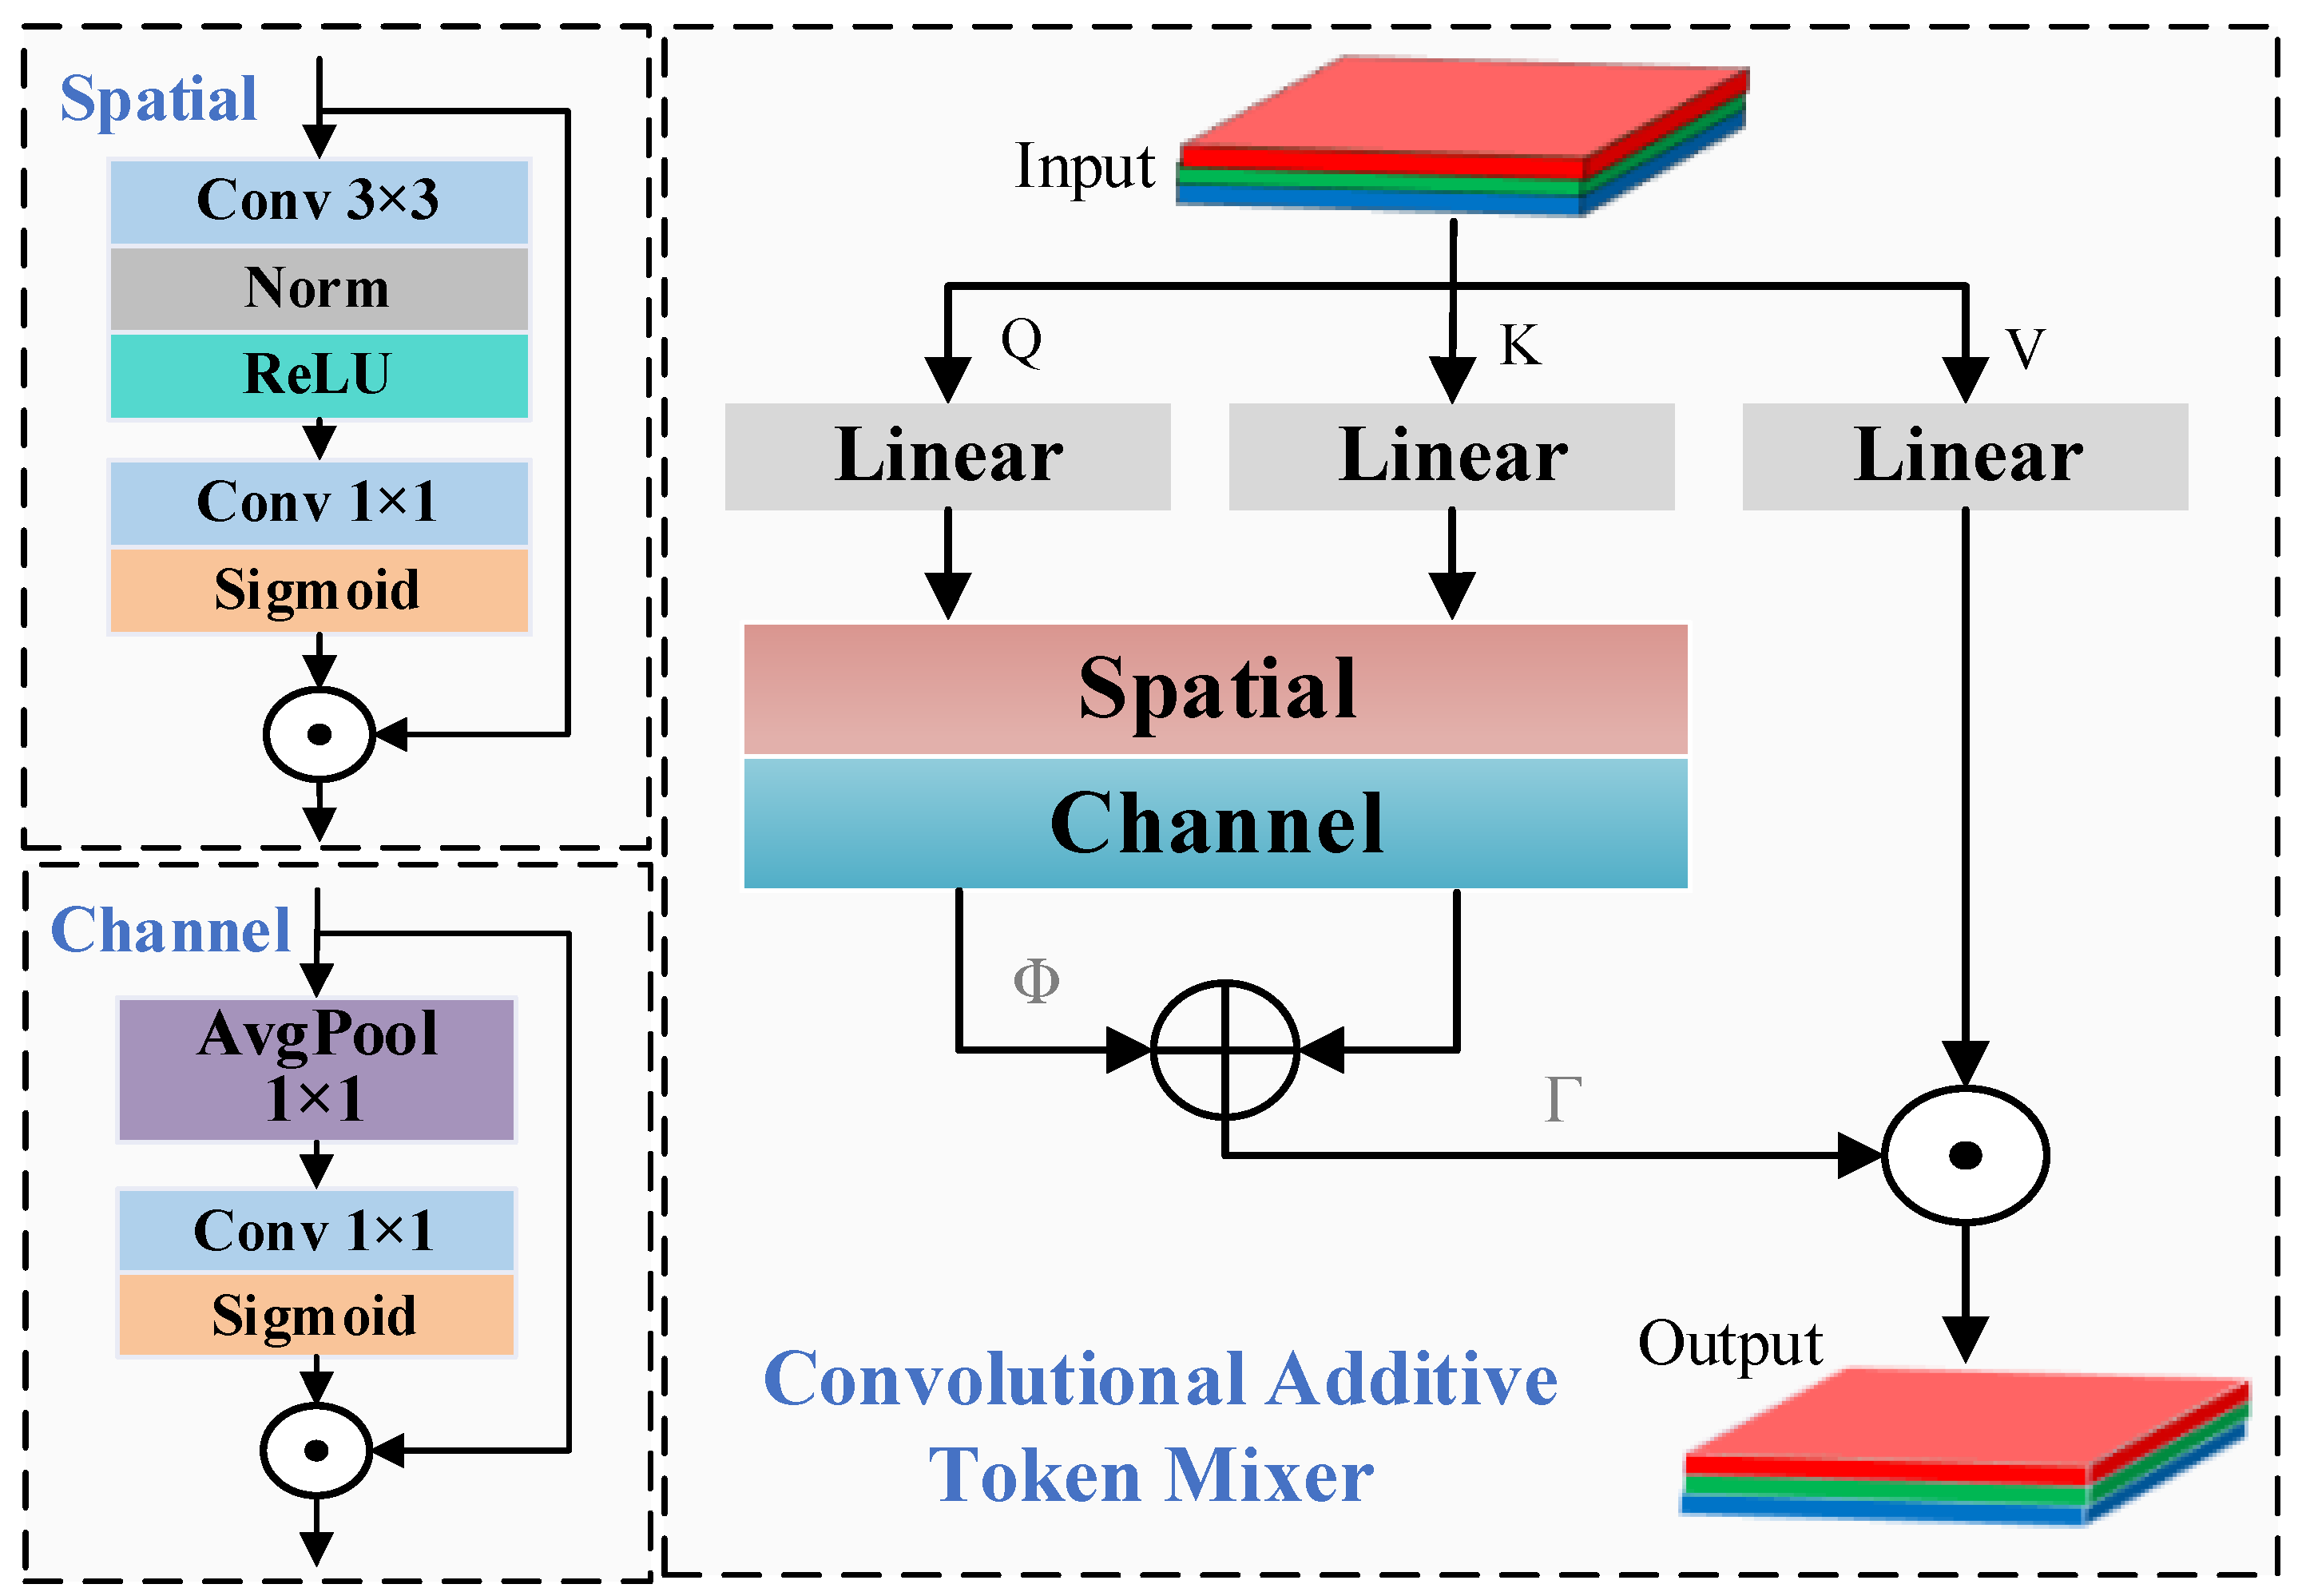
Within the CATM (Convolutional Additive Token Mixer), the features are projected to generate query Q, key K, and value V matrices, where Q and K undergo spatial and channel mixing to adaptively model the importance of each position and feature channel. The detailed process flow is illustrated in
Figure 5. This is compared to traditional self-attention, which computes similarity through the dot product of Q and K, as in the multi-head self-attention mechanism of Transformer [
25]. And it also different from the existing CBAM [
26] and the attention mechanism of ECA-Net [
27] that focus on convolution and pooling based weighting mechanisms; the key distinction of CAS introduces an additive similarity function Φ(Q,K), allowing flexibility in attention fusion. The resulting similarity map is modulated by a learnable transformation Γ(·) and combined with V through the Hadamard product (⊙) to yield the attention-enhanced output:
The “+” symbol denotes element-wise addition. The output Λ is then added to the input of CATM (via residual connection) and normalized again before entering the final MLP module.
In the MLP transformation module, the data are projected through two 1 × 1 convolutions with a nonlinear activation between them:
Again, a residual connection is applied before outputting the final feature. Each stage in the CAS Block is thus wrapped with normalization and residual links, ensuring gradient stability and semantic continuity across layers. By integrating multiple 1 × 1 convolutions, a lightweight yet expressive additive attention mechanism, and MLP-based transformation, the CAS Block effectively captures both fine-grained local features and global dependencies, it not only eliminates the need for excessive matrix multiplications and Softmax operations but also efficiently captures key features across spatial and channel dimensions, enhancing the model’s inference efficiency in resource-constrained environments. This makes it highly suitable for visual recognition tasks where efficiency and accuracy must be balanced under computational constraints.
2.6. Detect-SEAM
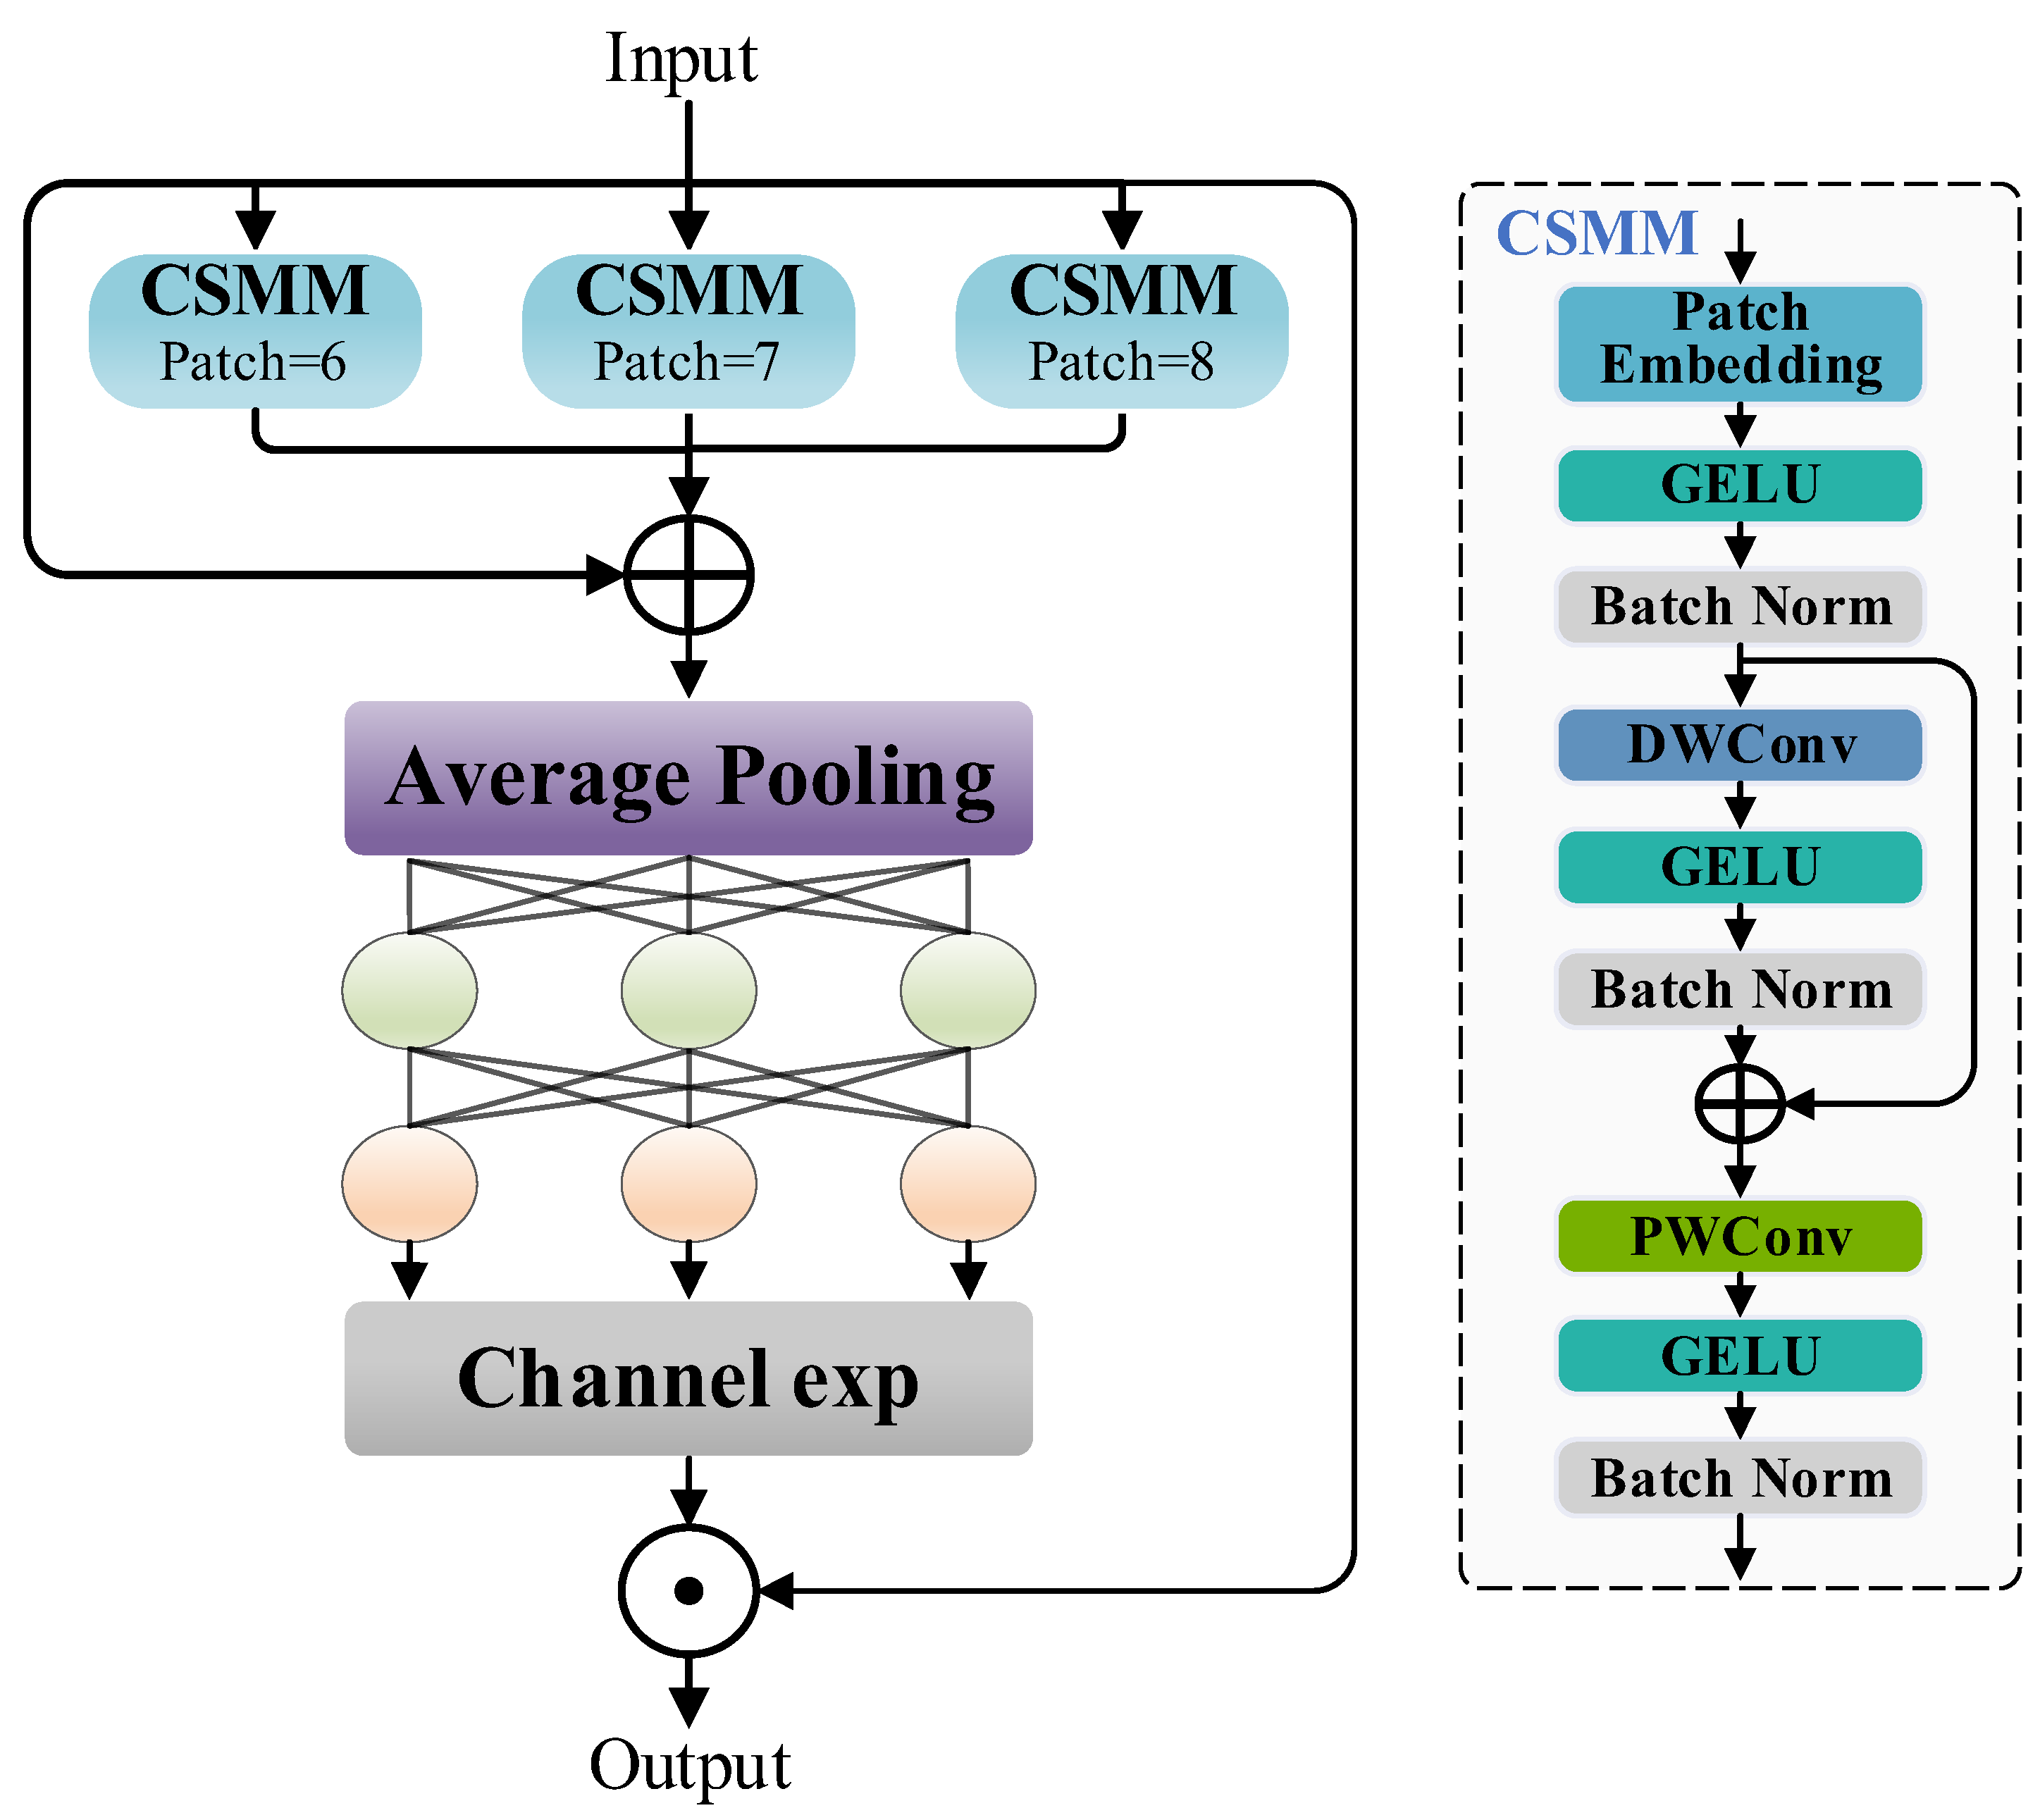
The Separated and Enhancement Attention Module (SEAM) was originally designed to address feature loss and localization inaccuracies in object detection, such as occlusion, noise, and motion blur. By leveraging depthwise separable convolutions and cross-channel information fusion mechanisms, SEAM enhances the model’s ability to capture image details in such challenging environments.
To be specific, the input features are first processed by multiple Channel and Spatial Mixing Modules (CSMMs), each of which employs patches of different sizes for feature extraction to capture multi-scale information. Within each CSMM, patch embedding maps the input into a high-dimensional feature space, followed by sequential operations including GELU activation, batch normalization (Batch Norm), depthwise separable convolution (DWConv), and pointwise convolution (PWConv) to enhance feature representation and learn channel-spatial interactions. A residual connection is applied after DWConv to preserve the original information and improve the gradient propagation stability. The multi-scale features from multiple CSMMs are then aggregated with adaptive weighting and fed into a global average pooling (Average Pooling) layer, which further compresses the spatial dimensions of the feature maps, allowing the model to focus more on global information. Subsequently, the pooled features pass through a two-layer fully connected network to learn channel attention weights, followed by channel expansion to amplify the response to key features. Finally, the expanded feature maps are element-wise multiplied with the original feature maps, reinforcing the model’s focus on critical regions of the mineral surface while suppressing background noise, thereby improving the detection accuracy. Its overall structure is illustrated in
Figure 6.
In real-world industrial scenarios, capturing subtle features of ore blocks is crucial for accurate grade identification. Given SEAM’s strong ability to focus on target details, we integrate it into the Detect head of YOLO11 and propose an efficient detection head, Detect-SEAM, to enhance detection accuracy and robustness. This improvement enables the model to effectively capture mineral details even in complex environments.
3. Data and Experimental Preparation
3.1. Data Collection
The image data used in this experiment were collected in Hegang City, China. In July 2024, a total of 1259 real-world ore images were captured at the mining site of China Minmetals Corporation (Heilongjiang) Graphite Industry Co., Ltd. (Heilongjiang, China), using a Canon EOS 5D Mark II DSLR camera (Canon Corporation, Oita City, Japan). The resolution was set to 2784 × 1856, and multiple angles were photographed.
Mineralogical testing revealed that the samples include both primary graphite ores and oxidized graphite ores. Primary graphite ores mainly consist of graphite, quartz (SiO
2), and silicates minerals, while oxidized graphite ores often contain additional minerals such as hematite (Fe
2O
3) and pyrite (FeS
2), leading to more complex surface colors. Based on the measured carbon content, samples were classified into three grades: low grade (0–10%), medium grade (10–20%), and high grade (above 20%). Generally, higher-grade ores appear darker and more uniform due to higher graphite content, whereas lower-grade ores contain more light-colored minerals (e.g., quartz, silicates), leading to brighter or mottled appearances. Oxidized types may show reddish or yellowish tones due to weathering and associated iron-bearing minerals [
28]. Some example images are shown in
Figure 7.
3.2. Data Processing
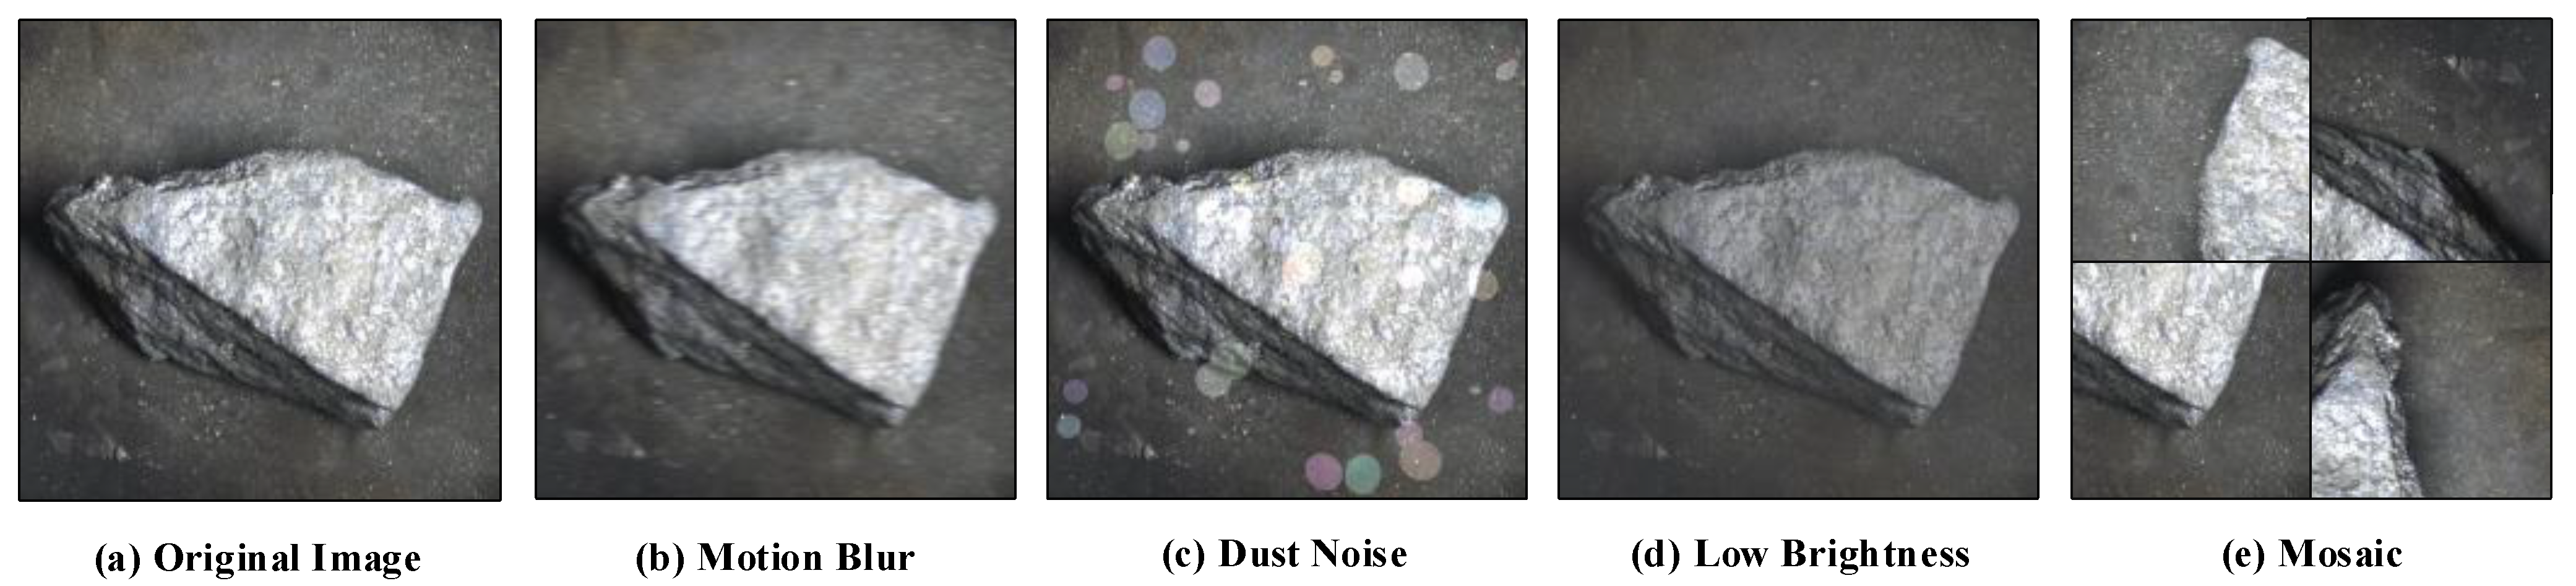
To enhance the model’s robustness in suboptimal environments and simulate real mining site detection conditions and industrial detection anomalies, while ensuring the richness of the image data, this study extensively utilizes the limited mineral images for the following data augmentation and expansion techniques: (i) Motion Blur: simulates the blurring effects caused by vibrations from conveyors, mining equipment, or other dynamic factors (such as motion changes in signal processing) in the mining environment. This type of blur effect is implemented using OpenCV’s filter2D function. (ii) Dust Noise: random irregular elliptical spots are added at random positions in the image to simulate lens spots caused by dust particles in industrial settings. This type of noise is created by generating a spot mask using a random function. (iii) Low Brightness: reduces overall brightness and enhances shadow areas to simulate uneven lighting conditions in mining environments. This process is achieved using a brightness adjustment factor in the convertTo function [
29]. (iv) Mosaic Data Augmentation [
30]: randomly crops and reassembles parts of the same training sample to achieve spatial transformation and enrichment. This method can present multiple objects within the same training image, improving the model’s adaptability to varying scales and background transformations, thereby enhancing feature learning.
Figure 8 presents a visual reference of the applied augmentations to intuitively demonstrate their effects on mineral images.
The dataset annotations were performed using LabelImg software [
31]. Based on the characteristic differences in ore grades, the annotations were made in txt format as follows: “0–10%”, “10–20%”, and “20%+”. Subsequently, the dataset, including images and their corresponding annotations, was split into training, validation, and test sets in a ratio of 8:1:1. The dataset processed using the aforementioned data augmentation and expansion techniques was used as the final input for model training, comprising a total of 3777 ore instances: 1593 low-grade, 1509 medium-grade, and 675 high-grade samples. The proportion of category samples matches the availability and task priority in the real world, reflecting the actual distribution and operational needs of graphite mining, where distinguishing between low-grade and medium-grade ores has greater practical significance for industry. Detailed dataset partitioning information is provided in
Table 1.
3.3. Experimental Environment
This experiment was conducted on a standardized hardware platform. The central processing unit (CPU) used was a 12th-generation Intel Core i5-12490F (3.00 GHz, Intel Corporation, Ho Chi Minh City, Vietnam), and the graphics processing unit (GPU) was an NVIDIA GeForce RTX 4060 (8GB VRAM, NVIDIA Corporation, Santa Clara, CA, USA). The operating system was Windows 11 Professional, and the programming environment was based on Python 3.8.19. Deep learning experiments were implemented using the PyTorch 1.12 framework with GPU acceleration enabled via CUDA 11.3.
All experiments in this study followed a consistent training parameter configuration: a total of 200 training epochs with a batch size of 8. This setting was based on common practices in detection tasks of a similar scale or domain, where the number of epochs and batch size are determined according to the dataset size and task complexity. The optimizer used was stochastic gradient descent (SGD) with a momentum coefficient of 0.937, an initial learning rate of 0.01, and a weight decay factor of . An early stopping mechanism, based on the performance based on the detection validation set, was applied with a patience threshold of 50 epochs. Additionally, the Mosaic data augmentation strategy was disabled during the last 10 training epochs to enhance model convergence stability. This early stopping strategy was consistently applied across all comparative experiments to ensure training fairness and reproducibility.
3.4. Evaluation Criteria
This study systematically evaluates the model’s accuracy performance and lightweight features using seven core metrics, based on practical application requirements. Model accuracy is represented by four metrics: the precision (P), recall (R), mean average precision (mAP), and F1 score, which reflect the detection task’s localization accuracy and classification reliability. Lightweight features are comprehensively assessed through three dimensions: floating point operations (FLOPs), network parameter count (Params), and model storage size (Size), quantifying the model’s computational efficiency and deployment feasibility.
Precision (P) quantifies the model’s confidence in predicting positive classes, representing the proportion of true positive samples among all samples predicted as positive. Recall (R) reflects the model’s ability to cover true positive samples, representing the proportion of actual positive samples that are correctly identified. The mathematical definitions are given by the following formulas:
In the formulas, TP represents the number of correctly predicted positive samples, FP represents the number of incorrectly predicted positive samples, and FN represents the number of actual positive samples that were not identified.
The F1 score is the harmonic mean of the precision and recall. For the imbalanced class distribution in the graphite ore dataset used in this study, the F1 score provides a more robust evaluation benchmark by mitigating the dominance effect of the majority class and assessing the model’s ability to recognize the minority class. The F1 score is calculated using the following formula:
The mean average precision (mAP) serves as the core evaluation metric in multi-class object detection systems. It is obtained by computing the arithmetic mean of the average precision (AP) values across all classes, where the AP for each individual class is derived from the area under the precision–recall (P-R) curve. The fundamental mathematical formulation can be expressed as follows:
where
denotes the interpolated precision value at recall rate
for the
i-th class and
represents the total number of classes, which in this study corresponds to three distinct grades of graphite ore (N = 3).
The FLOPs, Params, and Size are key metrics for lightweight model quantification. FLOPs measure computational complexity in a single inference, reflecting the real-time processing capability of edge devices. Params influence memory usage and generalization ability, with fewer parameters reducing hardware demands. Size affects model deployment in industrial settings. Optimizing these factors can effectively deploy graphite ore grade detection models in resource-limited environments, balancing real-time analysis, accuracy, and equipment availability in industrial intelligent detection.
4. Results and Discussion
4.1. Model Training
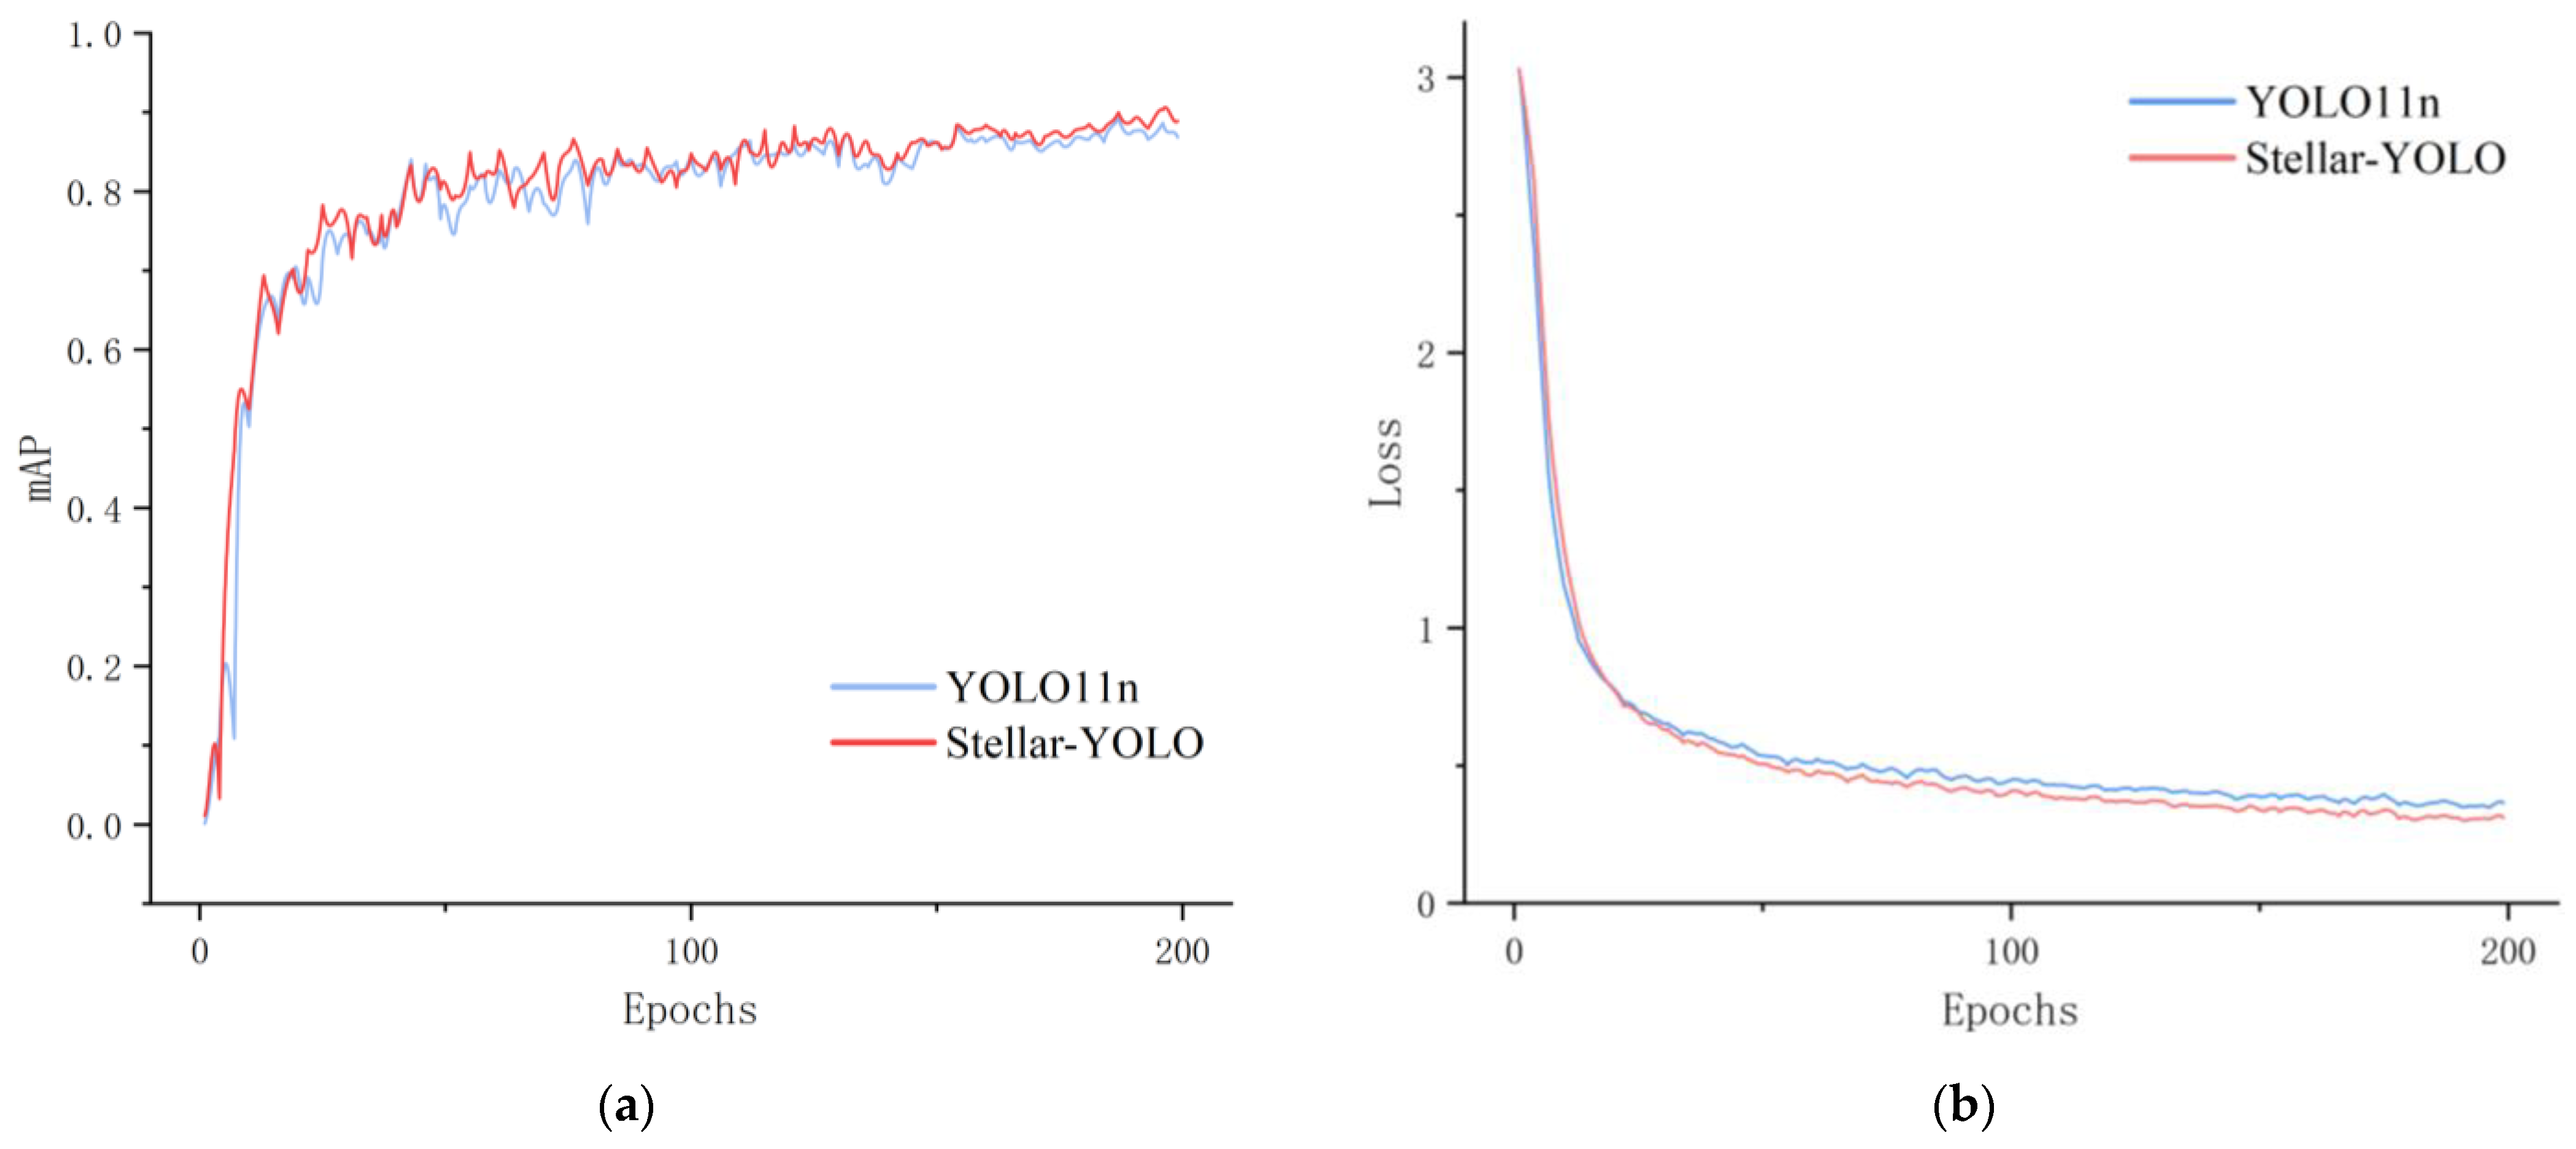
Stellar-YOLO was trained on the self-constructed graphite ore dataset using predefined parameter configurations, with the baseline model YOLO11n as a comparison. The training process is shown in
Figure 9. In the early stages, both models quickly adapted to the dataset, and loss values dropped rapidly. Stellar-YOLO demonstrated a slight advantage in mAP. During the mid-training phase, both models showed a steady improvement with minor fluctuations, and their loss curves gradually converged, with Stellar-YOLO maintaining its lead. In the later stages, the improved model exhibited slightly better mAP and lower loss than YOLO11n, suggesting superior feature extraction and data adaptation capabilities. In addition, the loss trend on the validation set shows that the validation loss of Stellar YOLO continues to decrease and stabilize throughout the training process, indicating that the model effectively suppresses overfitting to some extent under the current training configuration and approaches its optimal performance in this task.
4.2. Ablation Experiments
To analyze the contribution of each module to overall model performance and further validate the effectiveness of the proposed improvements, this study adopts YOLO11n as the baseline model and incrementally integrates the proposed enhancement modules through a staged implementation strategy. Following the controlled variable principle, all experiments use consistent parameter settings, and multiple ablation studies are designed based on mathematical combinations to comprehensively evaluate the effectiveness of different improvements. The proposed modifications include the following:
A: Replacing the entire Backbone with StarNet as the initial feature extractor;
B: Using the improved C3k2-CAS as the feature extraction module in the neck.
C: Using the improved Detect-SEAM as the detection module in the head.
The results of the ablation experiments are summarized in
Table 2. First, adopting the lightweight StarNet backbone significantly reduced model complexity. Compared to YOLO11n, the number of FLOPs, parameters, and model size decreased by 30%, 28%, and 27%, respectively, demonstrating the effectiveness of StarNet’s lightweight design, though with a slight drop in accuracy. Second, independently implementing C3k2-CAS and Detect-SEAM both led to accuracy improvements, indicating that the convolutional and additive attention mechanisms in the CAS Block and the channel-spatial mixed strategy in SEAM enhanced the model’s ability to capture mineral details. Next, integrating these improvements into a transitional model with StarNet as the backbone (A + B and A + C) further optimized lightweight metrics while maintaining stable accuracy gains. Finally, the fully integrated Stellar-YOLO achieved a 4.5% and 2.6 increase in the mAP50 and F1 score, respectively, compared to YOLO11n, while reducing FLOPs, parameters, and model size by 27%, 26%, and 23%. These results validate the synergistic effectiveness of the proposed modules in enhancing both the accuracy and model efficiency.
4.3. Comparison Experiments
To rigorously validate the superiority of Stellar-YOLO, a comprehensive comparative analysis was conducted against other lightweight YOLO models in terms of accuracy and lightweight performance metrics. To ensure fairness, all models were evaluated without pre-trained weights and under their respective default hyperparameter settings, with no additional optimizations or adjustments. Detailed comparison results are presented in
Table 3. The values reflecting accuracy in the table are the average of three experiments.
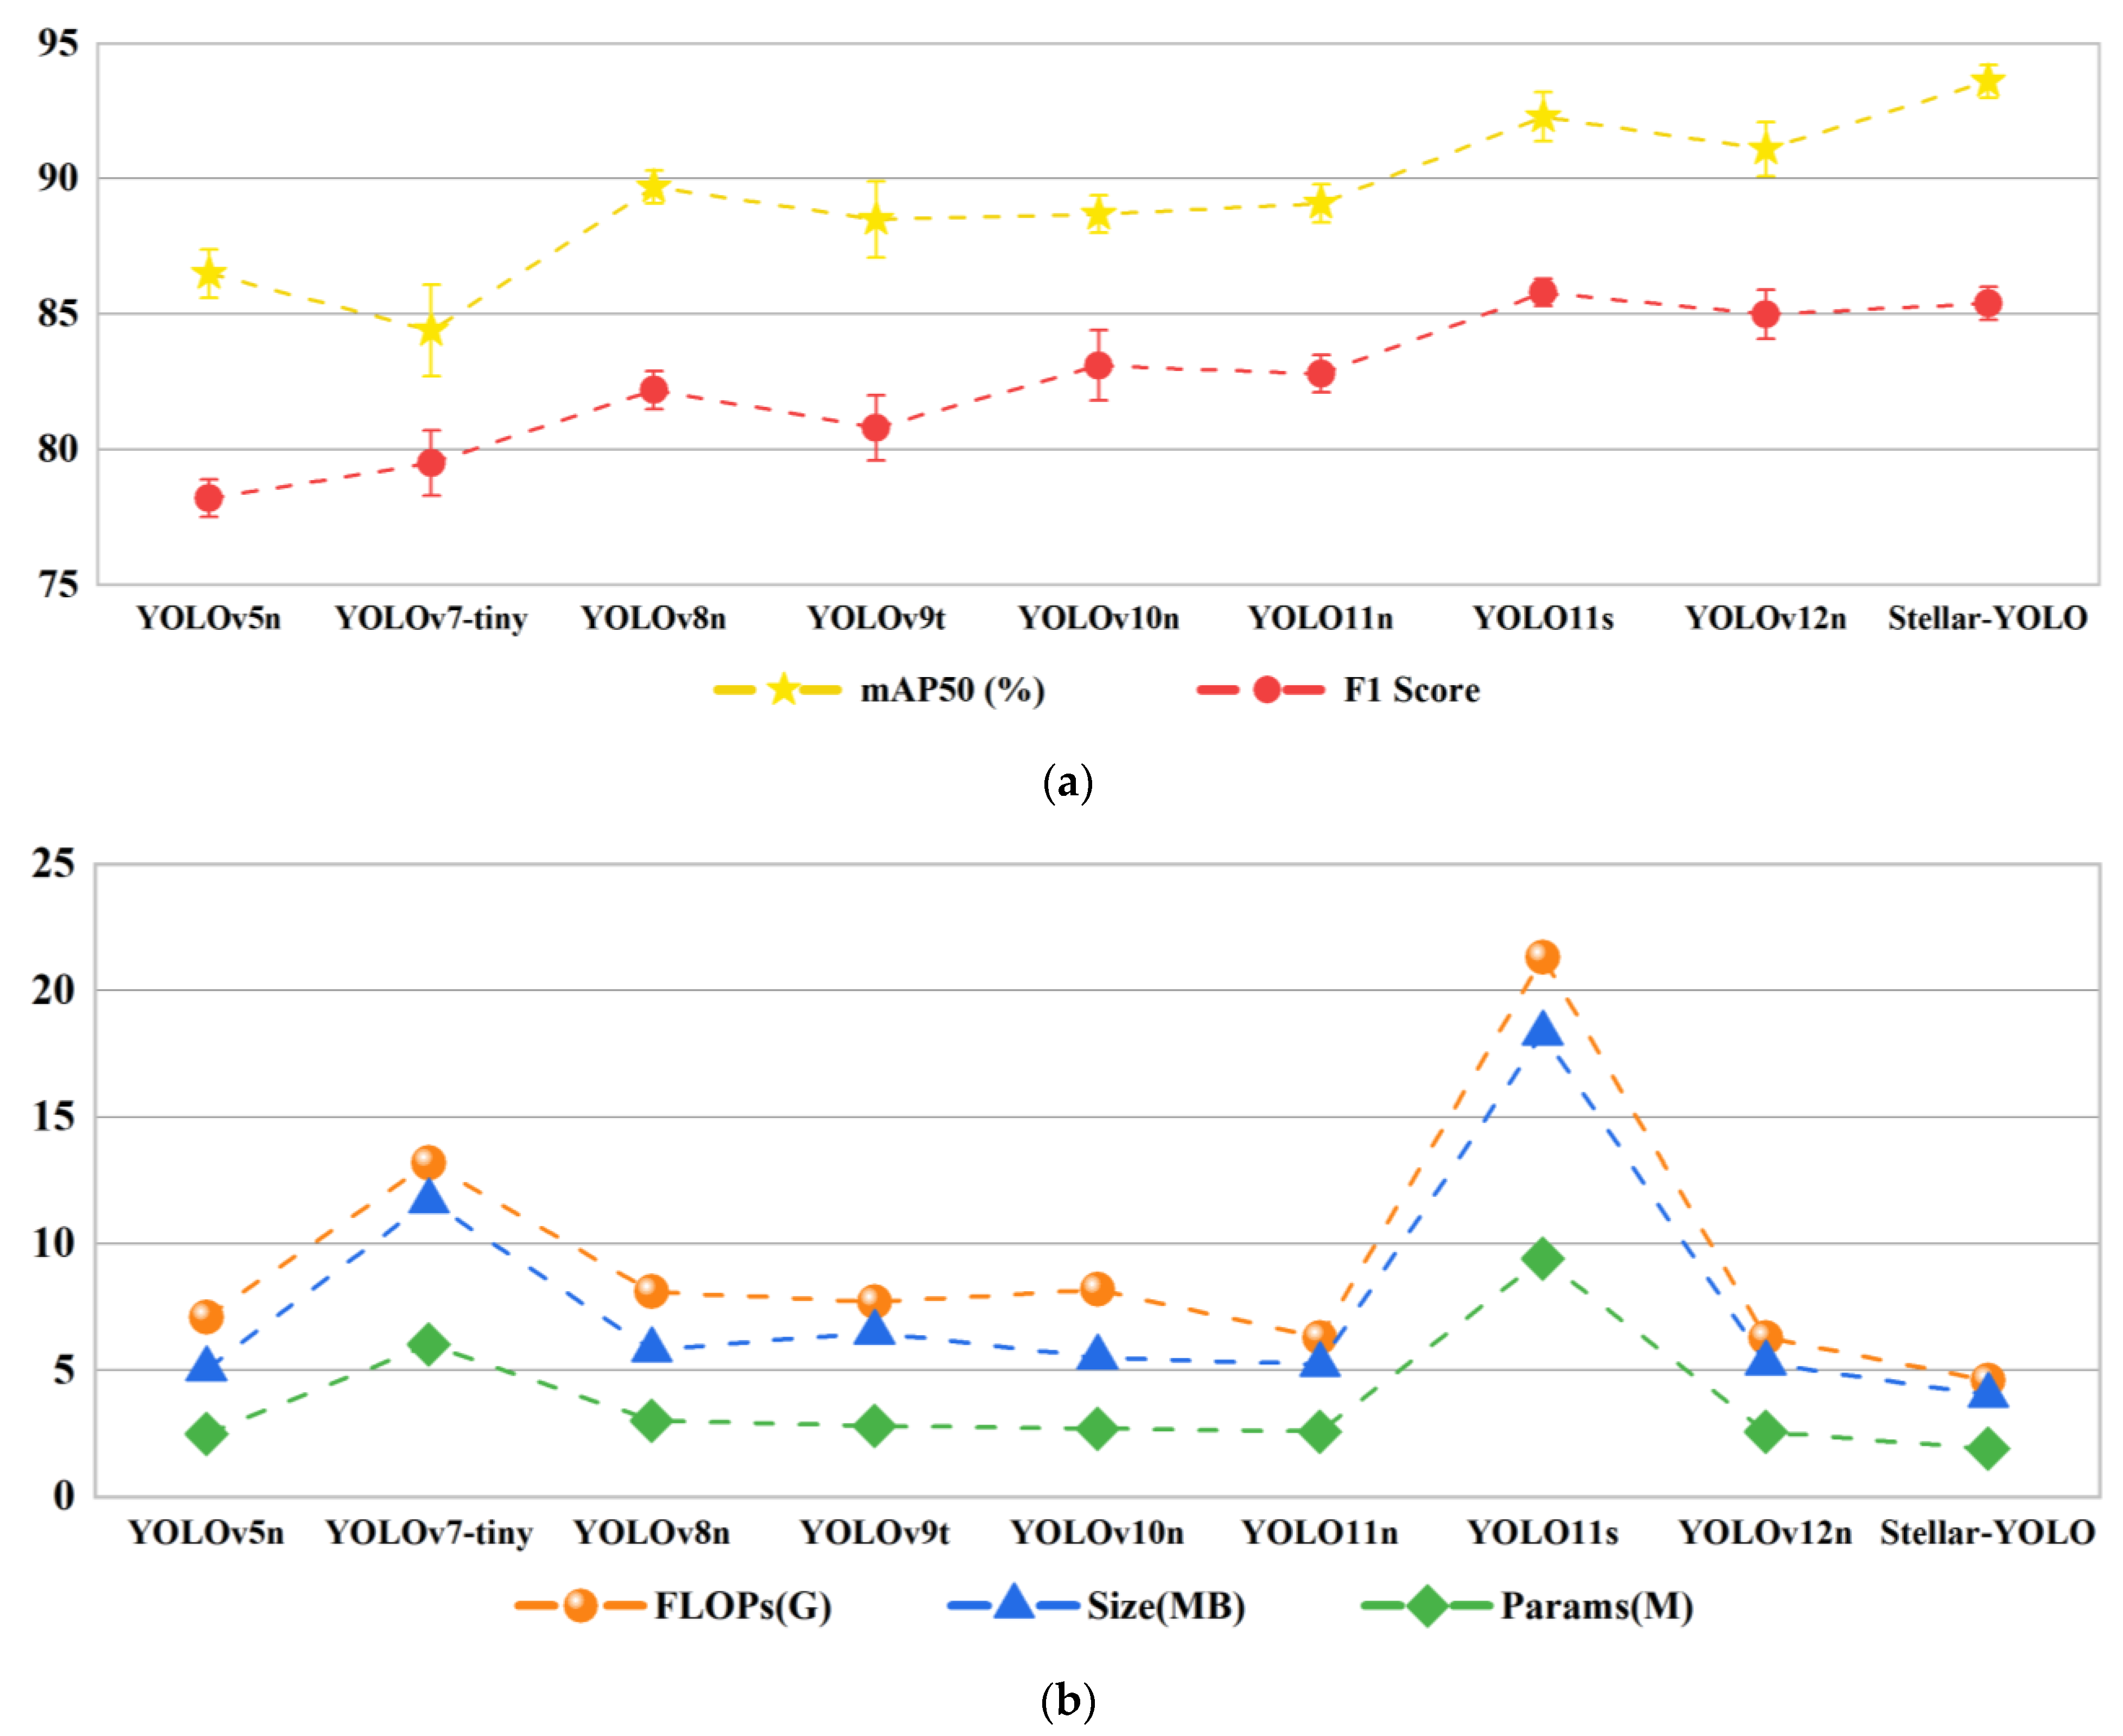
As shown in
Figure 10a, Stellar YOLO performs the best in accuracy-related metrics among various lightweight YOLO models within the error range. Compared to previous models such as YOLOv5n, YOLOv7-tiny, YOLOv8n, YOLOv9t, and YOLOv10n, Stellar-YOLO improves the mAP50 and F1 Score by approximately 4–10% and 3–8%, respectively. These two indicators, which comprehensively reflect the average precision, precision, and recall, highlight the superior accuracy of Stellar-YOLO in mineral grade detection. Even when compared with advanced models such as YOLO11s, which employs a deeper network architecture, and YOLO12n, which incorporates attention mechanism enhancements, Stellar-YOLO still demonstrates a clear performance advantage due to the integration of the CAS Block and SEAM module.
As shown in
Figure 10b, Stellar-YOLO outperforms other models in terms of lightweight metrics, achieving 4.6 G FLOPs, 1.90 M parameters, and a model size of 4.02 MB. Compared with YOLOv5n, YOLOv7-tiny, YOLOv8n, YOLOv9t, YOLOv10n, YOLO11n, and YOLO12n, Stellar-YOLO reduces FLOPs by 27–65%, the number of parameters by 26–68%, and the model size by 20–66%, demonstrating its efficiency in lightweight design. Notably, relative to YOLO11s, which adopts a deeper network architecture, Stellar-YOLO achieves a reduction of 78% in FLOPs and model size, as well as an 80% decrease in the parameter count, with only a minor F1 Score drop of 0.4. This highlights its significant advantage in terms of the compact and efficient architecture.
The analysis of the results among models with similar complexity indicates that the proposed improvements not only significantly enhance the detection performance but also substantially reduce the number of parameters and improve the computational efficiency. These advantages render Stellar-YOLO more suitable for the efficient and accurate grade classification of graphite ores, demonstrating greater potential for practical deployment.
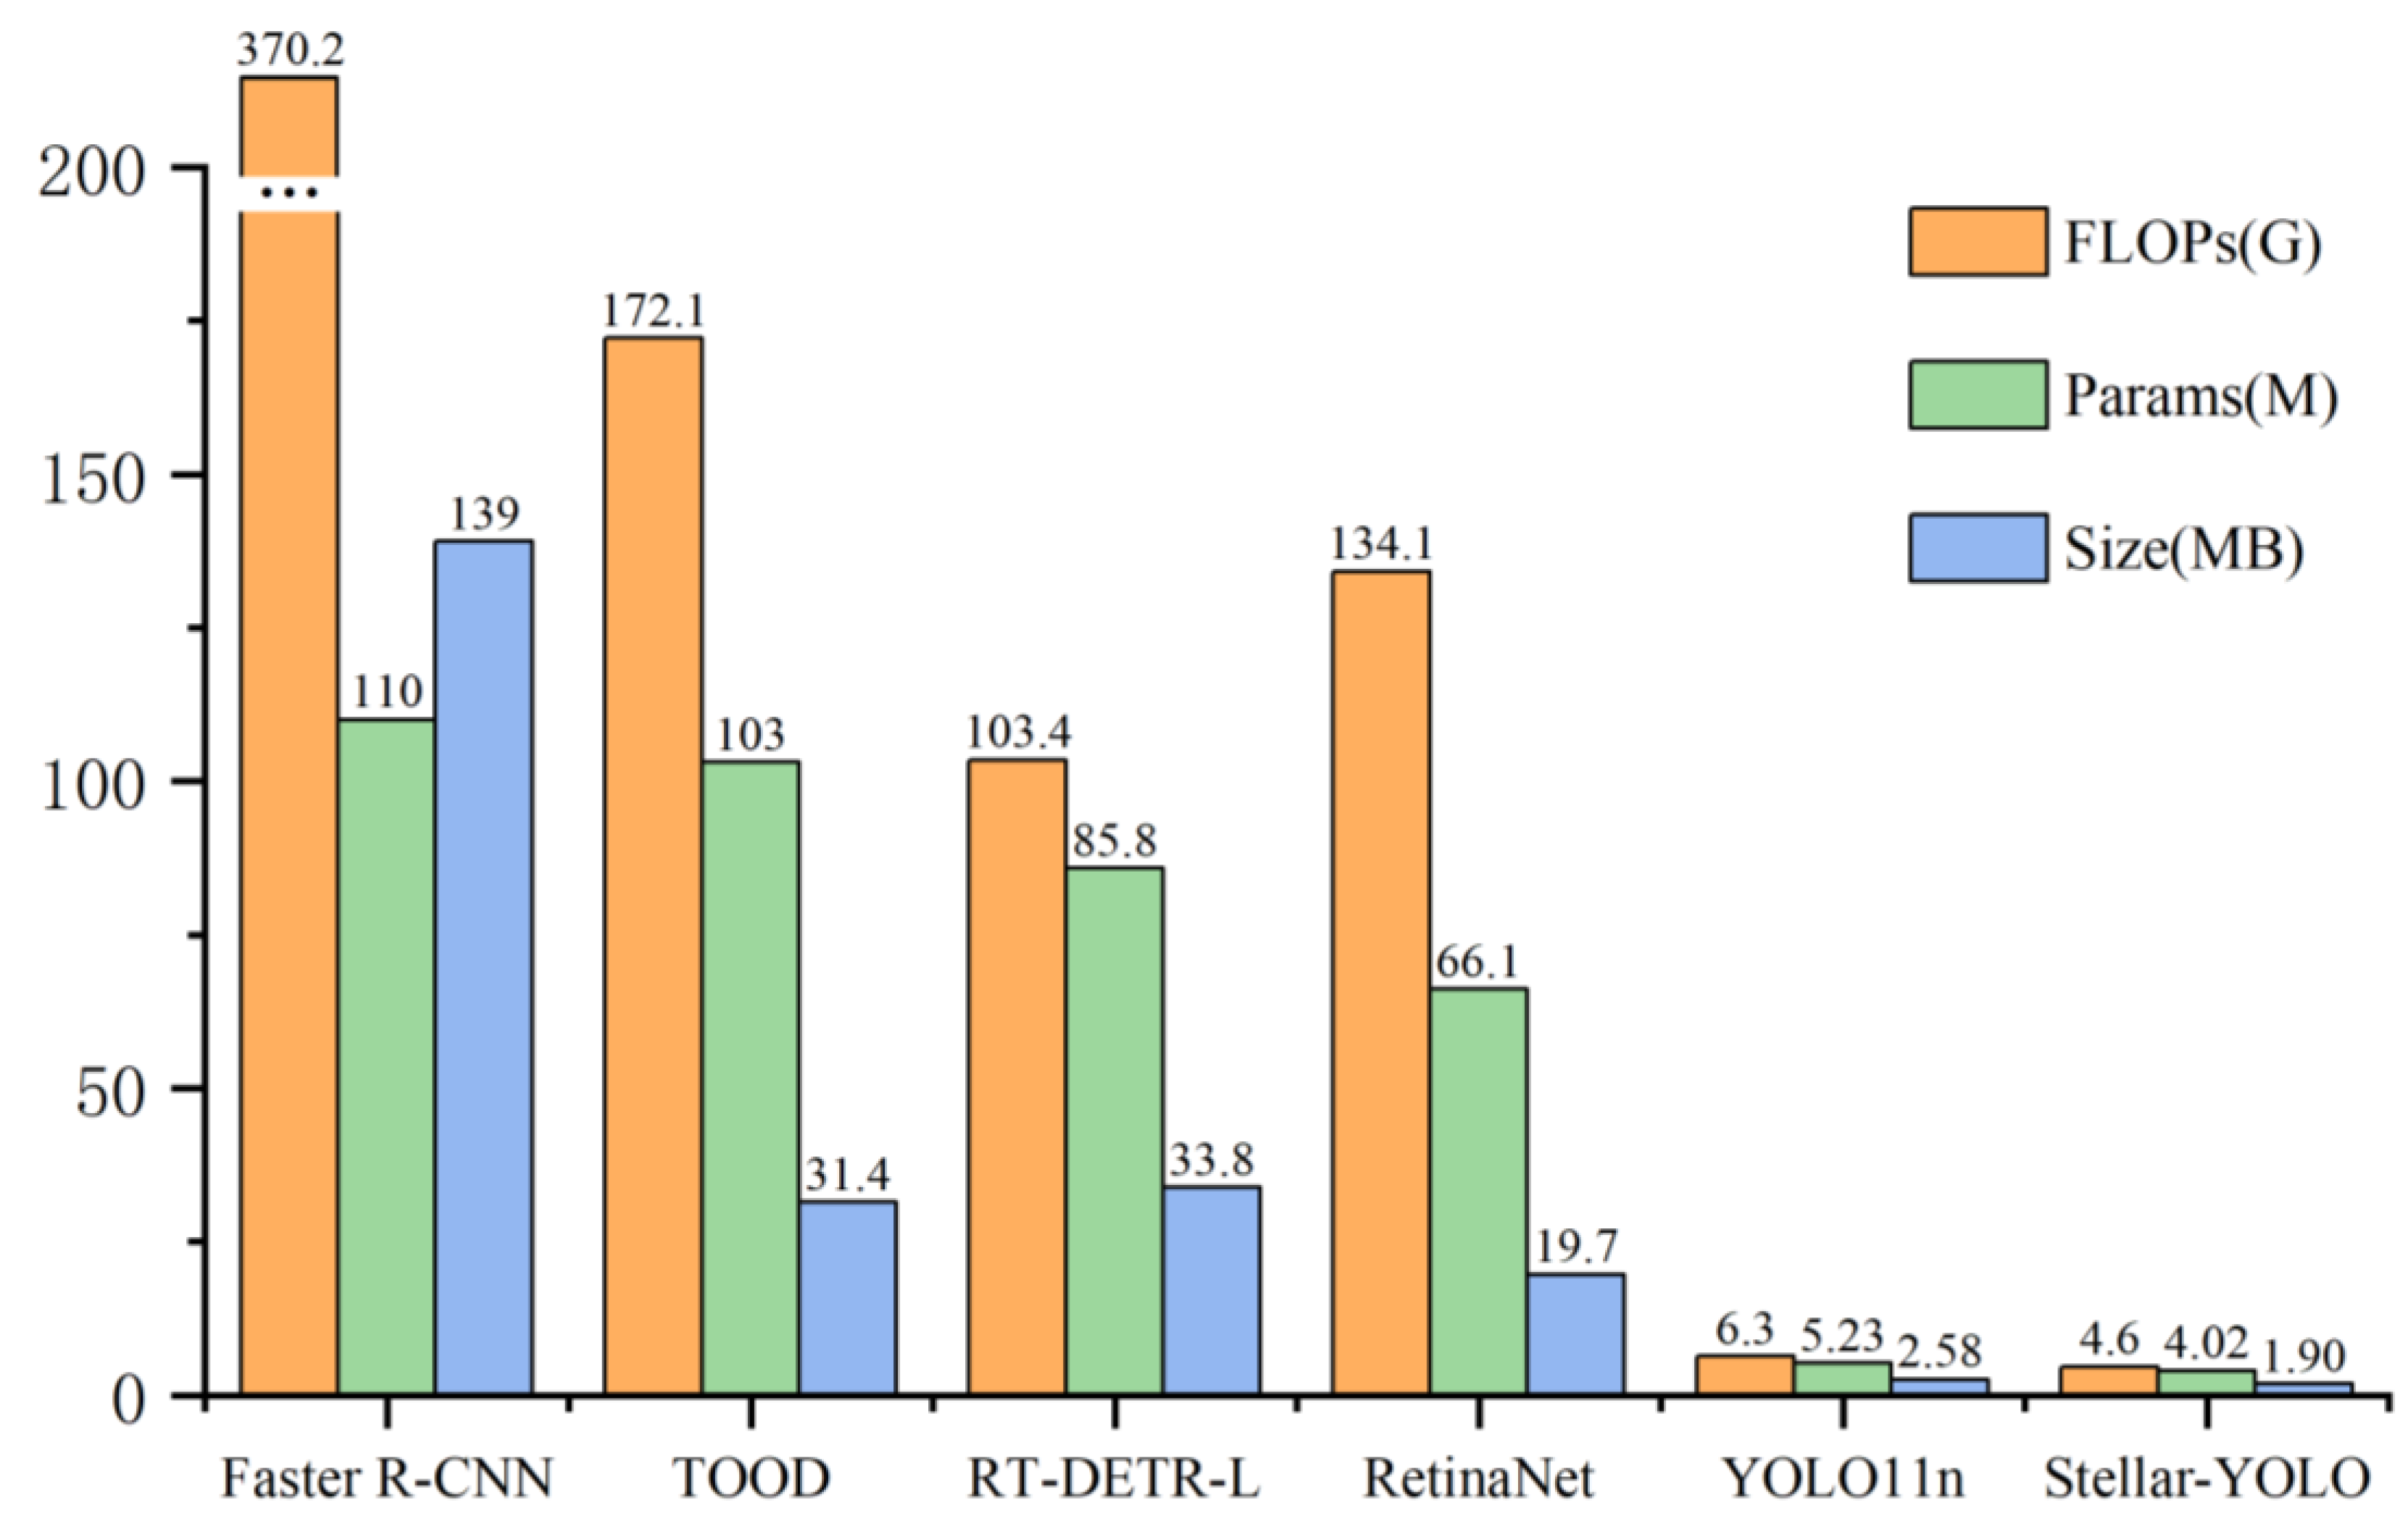
Furthermore, to broaden the comparison, Stellar-YOLO was evaluated against several mainstream object detection architectures. Specifically, RT-DETR-L adopts ConvNeXt-Large as its backbone network, while the other models utilize the more commonly used ResNet-50 [
38]. All models employ the FPN architecture for the neck, and during training, each model uses its default input resolution to comply with its architectural specifications, and the default pretrained configurations of these models were preserved to align with their typical usage and standard settings. Detailed comparison results are presented in
Table 4.
In terms of accuracy, TOOD achieved the highest mAP50 of 93.6%, followed by Stellar-YOLO and RetinaNet with competitive performance. RT-DETR-L and YOLO11n were slightly behind, while Faster R-CNN performed the weakest. Although TOOD offers superior accuracy, its computational demands are considerable, with 172.1 G FLOPs, 31.4 M parameters, and a 103 MB model size—significantly larger than Stellar-YOLO. These characteristics limit its practicality in resource-constrained settings. In contrast, Stellar-YOLO combines competitive accuracy with superior efficiency, owing to its optimized lightweight backbone and attention mechanisms.
Figure 11 illustrates the performance gap in lightweight metrics.
4.4. Visualization Experiments
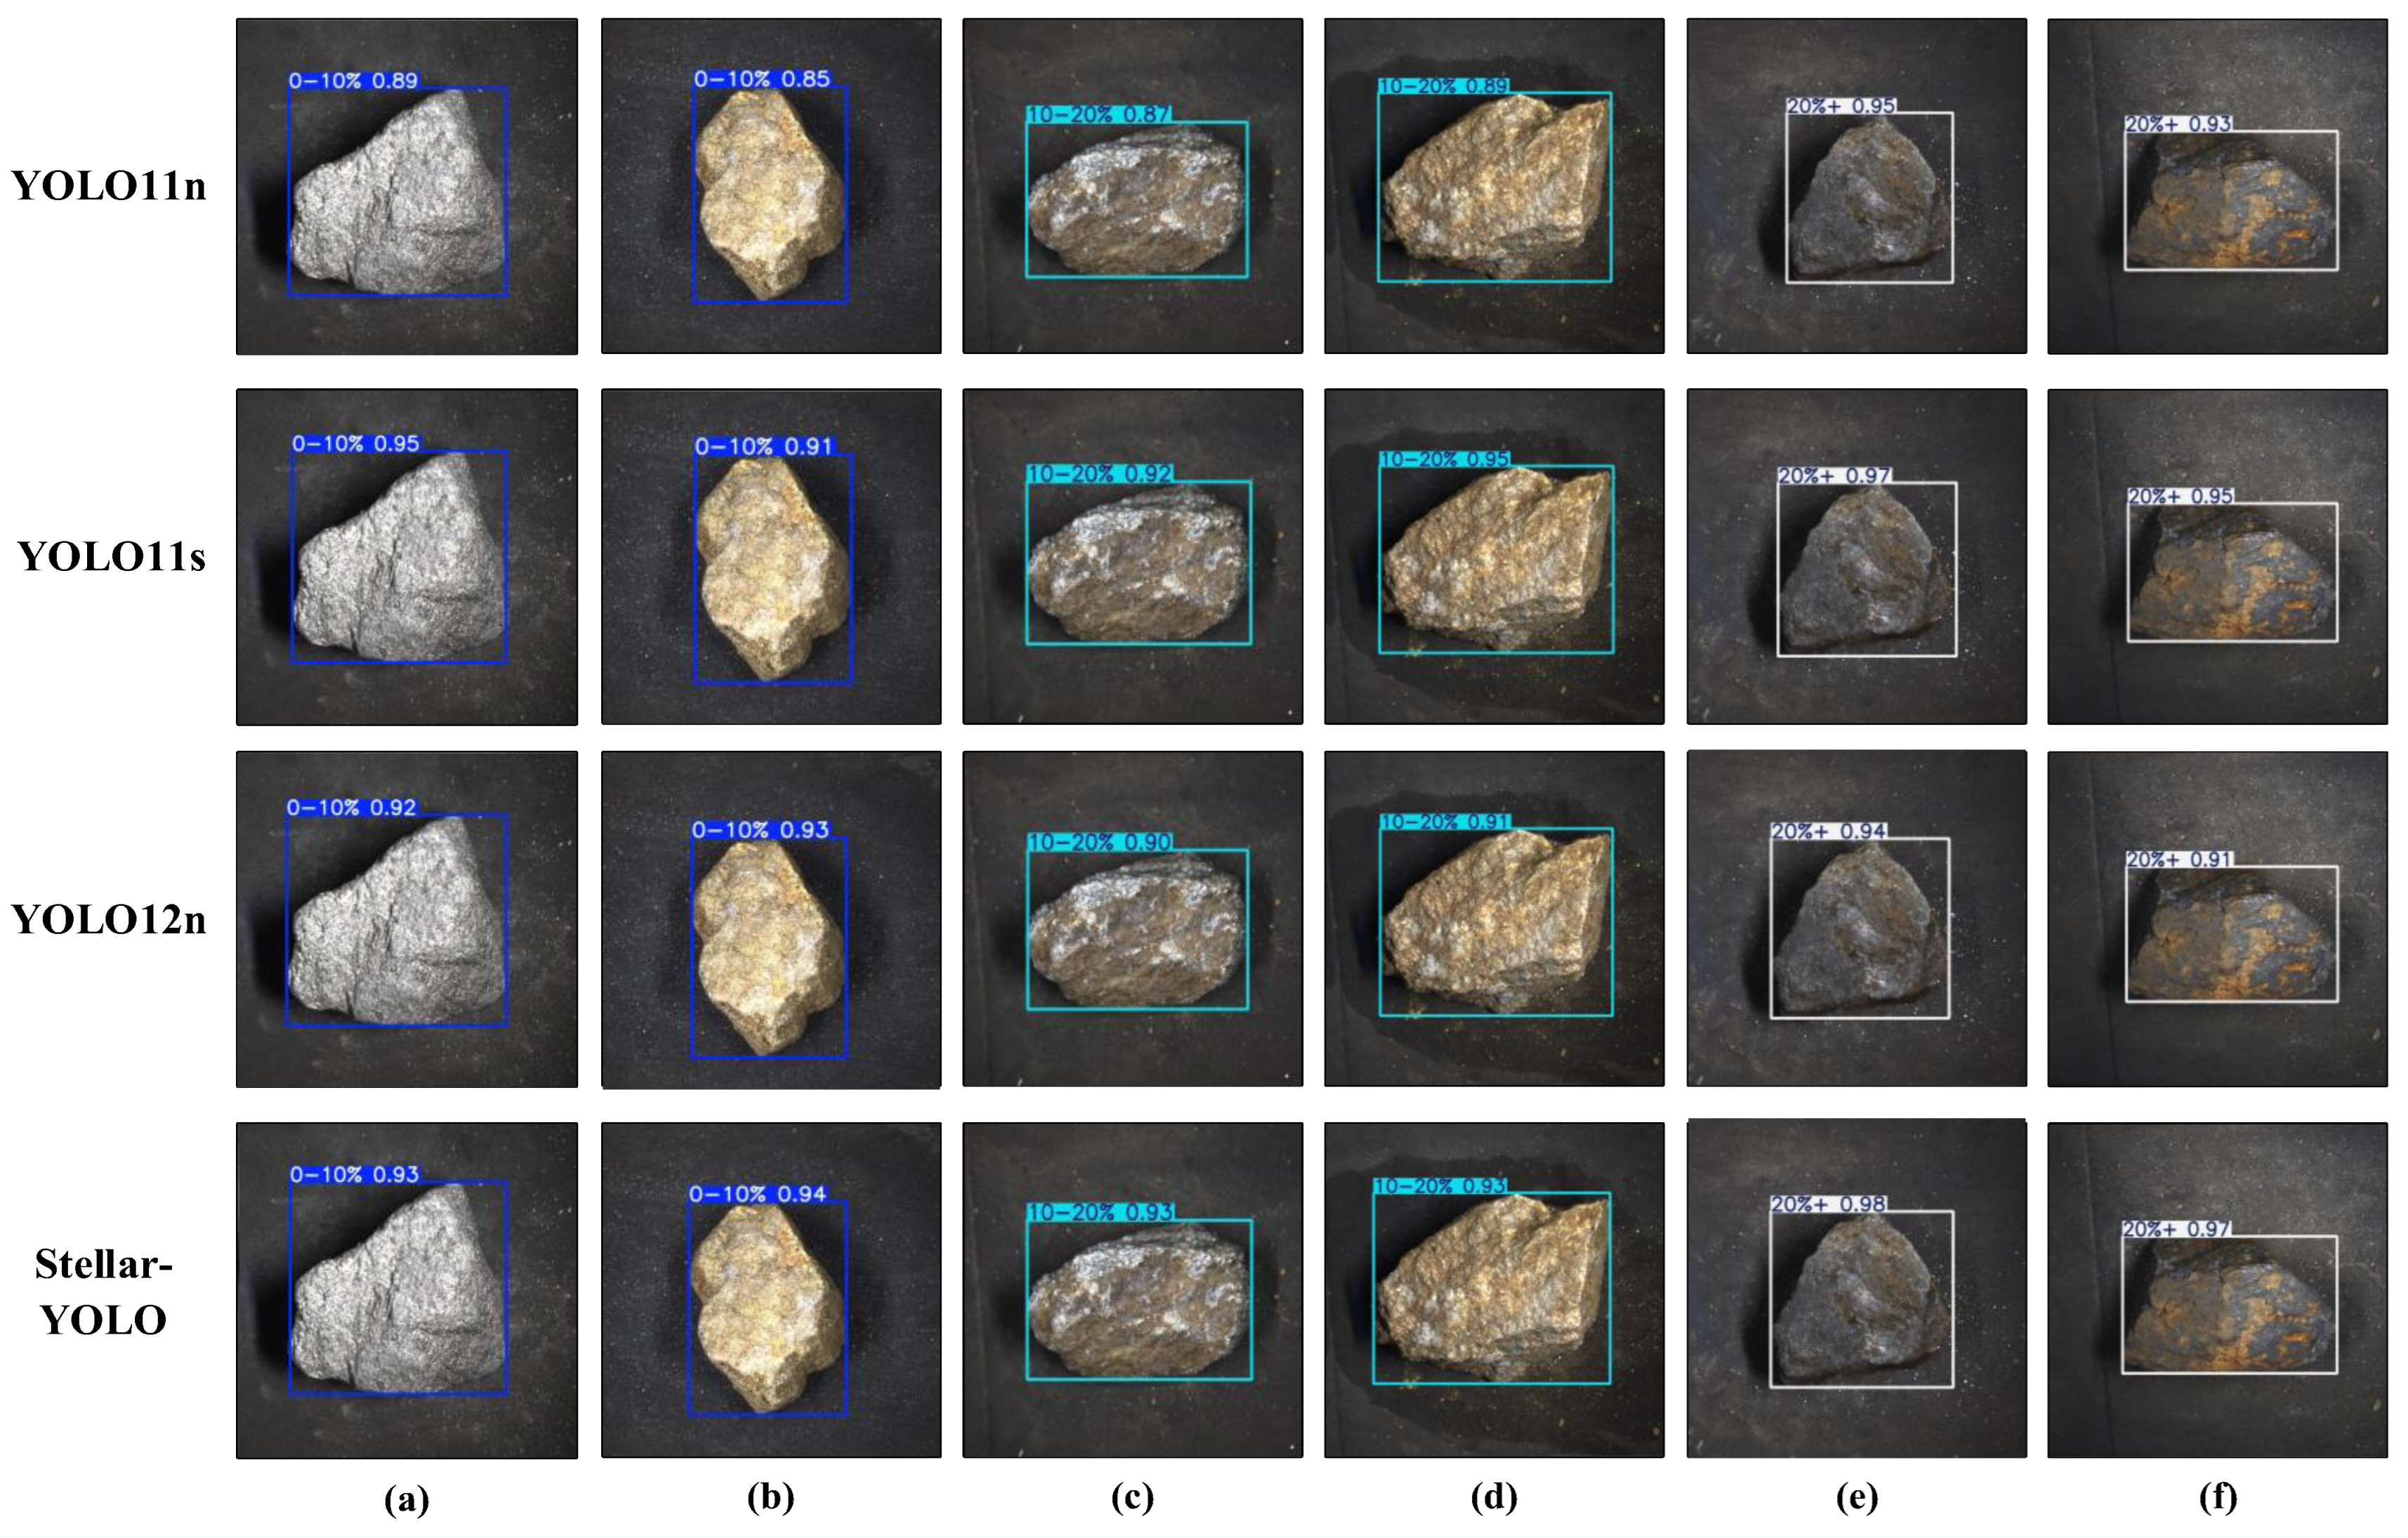
To better illustrate the performance improvements of the enhanced model,
Figure 12 presents a visual comparison of detection results between Stellar-YOLO and other models. The comparison samples were randomly selected from the test set and include both primary and oxidized graphite ores across different grade levels. For clarity, the detection results of ore grades are marked with different colors: blue for low grade, cyan for medium grade, and white for high grade. The confidence scores in the results (ranging from 0 to 1) quantify the reliability of the detection results, indicating the model’s estimated probability of identifying a specific ore grade within a given region.
The results show that all models are able to correctly identify the graphite ore grade categories in the samples, but there are still differences in performance among the models. For low-grade and high-grade ore samples in columns a, b, e, and f, where the surface color distribution and grade characteristics are clear, the detection results across models show minimal variation. However, for medium-grade ores in columns c and d, which exhibit features that overlap between low- and high-grade ores, detection is more challenging due to the typical confusion between categories. Stellar-YOLO and YOLO11s perform the best, with highly consistent results, followed by YOLO12n. YOLO11n, however, shows slight feature confusion in detecting low-grade oxidized ores in column b and medium-grade primary ores in column c, resulting in a certain performance gap compared to the other models.
In summary, Stellar-YOLO leverages its multi-module enhanced feature extraction capability to effectively suppress interference caused by surface oxidation to some extent. It demonstrates superior detail retention compared to YOLO11s with its deep network structure and YOLO12n with its attention mechanism optimization. Importantly, it significantly outperforms the baseline model YOLO11n, fully showcasing its competitive advantage in graphite ore grade identification.
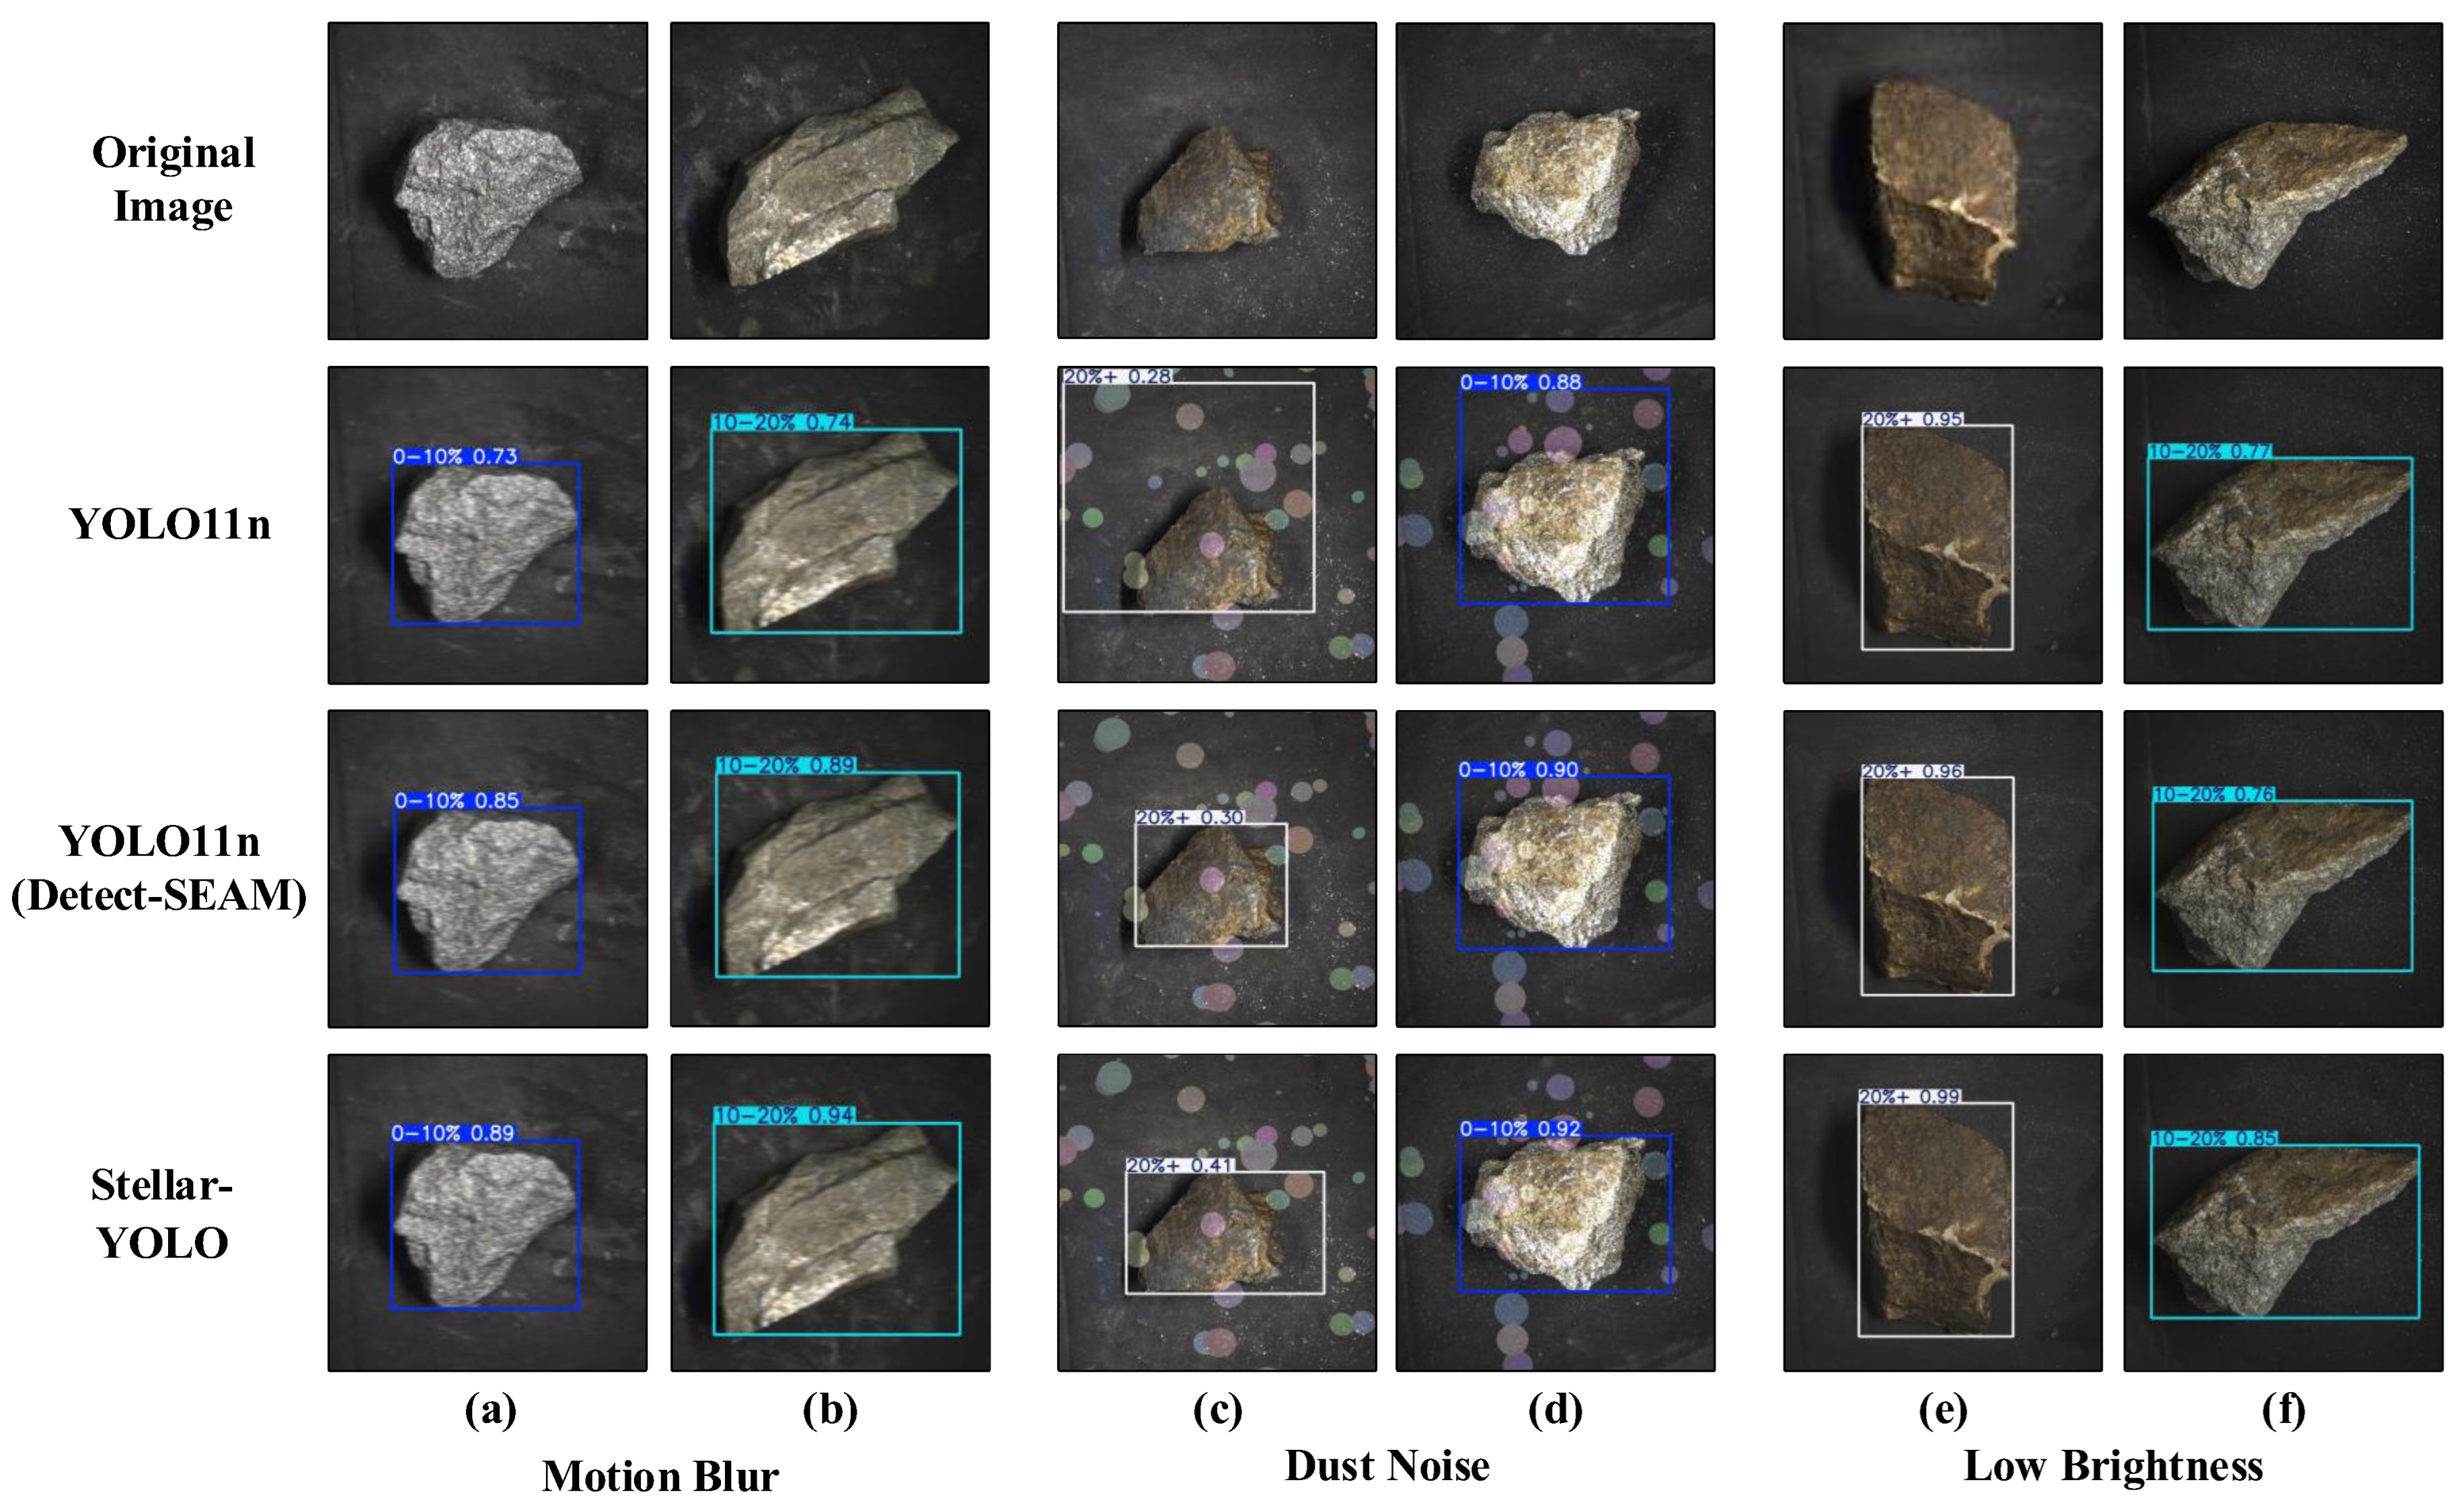
To further evaluate the model’s robustness in abnormal environments, a series of experiments focusing on interference resistance were specifically designed to demonstrate the model’s performance in real mining field conditions. The types of interference in the experiments include motion blur (columns a and b), dust noise (columns c and d), and low brightness (columns e and f). For each type of interference, two representative ore samples were randomly selected, covering different types and grades, and the results were compared with the baseline model’s visualization results. The specific results are shown in
Figure 13.
In particular, for motion blur and low light conditions (columns a, b, e, and f), Stellar-YOLO shows a significant increase in confidence compared to YOLO11n, indicating that Stellar-YOLO, benefiting from the attention mechanism in the C3k2-CAS module, can effectively handle mineral grade classification under blurry and low-light conditions, maintaining strong feature extraction capability even in shaky and low-light environments. For dust noise interference (columns c and b), although both models can correctly identify the specific grade of the ore, the impact of this anomaly remains considerable. More specifically, in the ore in column c, YOLO11n’s confidence is only 0.28, and the detection box is significantly too large. The subjective analysis suggests that the dust noise interferes with the model, causing it to mistakenly identify the noise surrounding the mineral as part of the high-grade oxidized ore surface, thereby detecting both the dust and the background as high-grade ore. In contrast, Stellar-YOLO, benefiting from the improved Detect-SEAM detection head, optimizes for feature loss in obstructed environments, with confidence increasing to 0.41. Although its detection box is not the smallest (with excess background on the right), it largely avoids dust interference and closely fits the mineral’s contour. A similar situation occurs in column d, where Stellar-YOLO’s confidence is higher than the baseline model, and its detection box is more closely aligned with the ore under dust interference.
Overall, compared to YOLO11n, the improved Stellar-YOLO demonstrates stronger anti-interference capabilities. It can more effectively handle blur caused by vibrations, lens occlusion due to dust, and insufficient brightness in real mining environments, making it more suitable for practical applications.
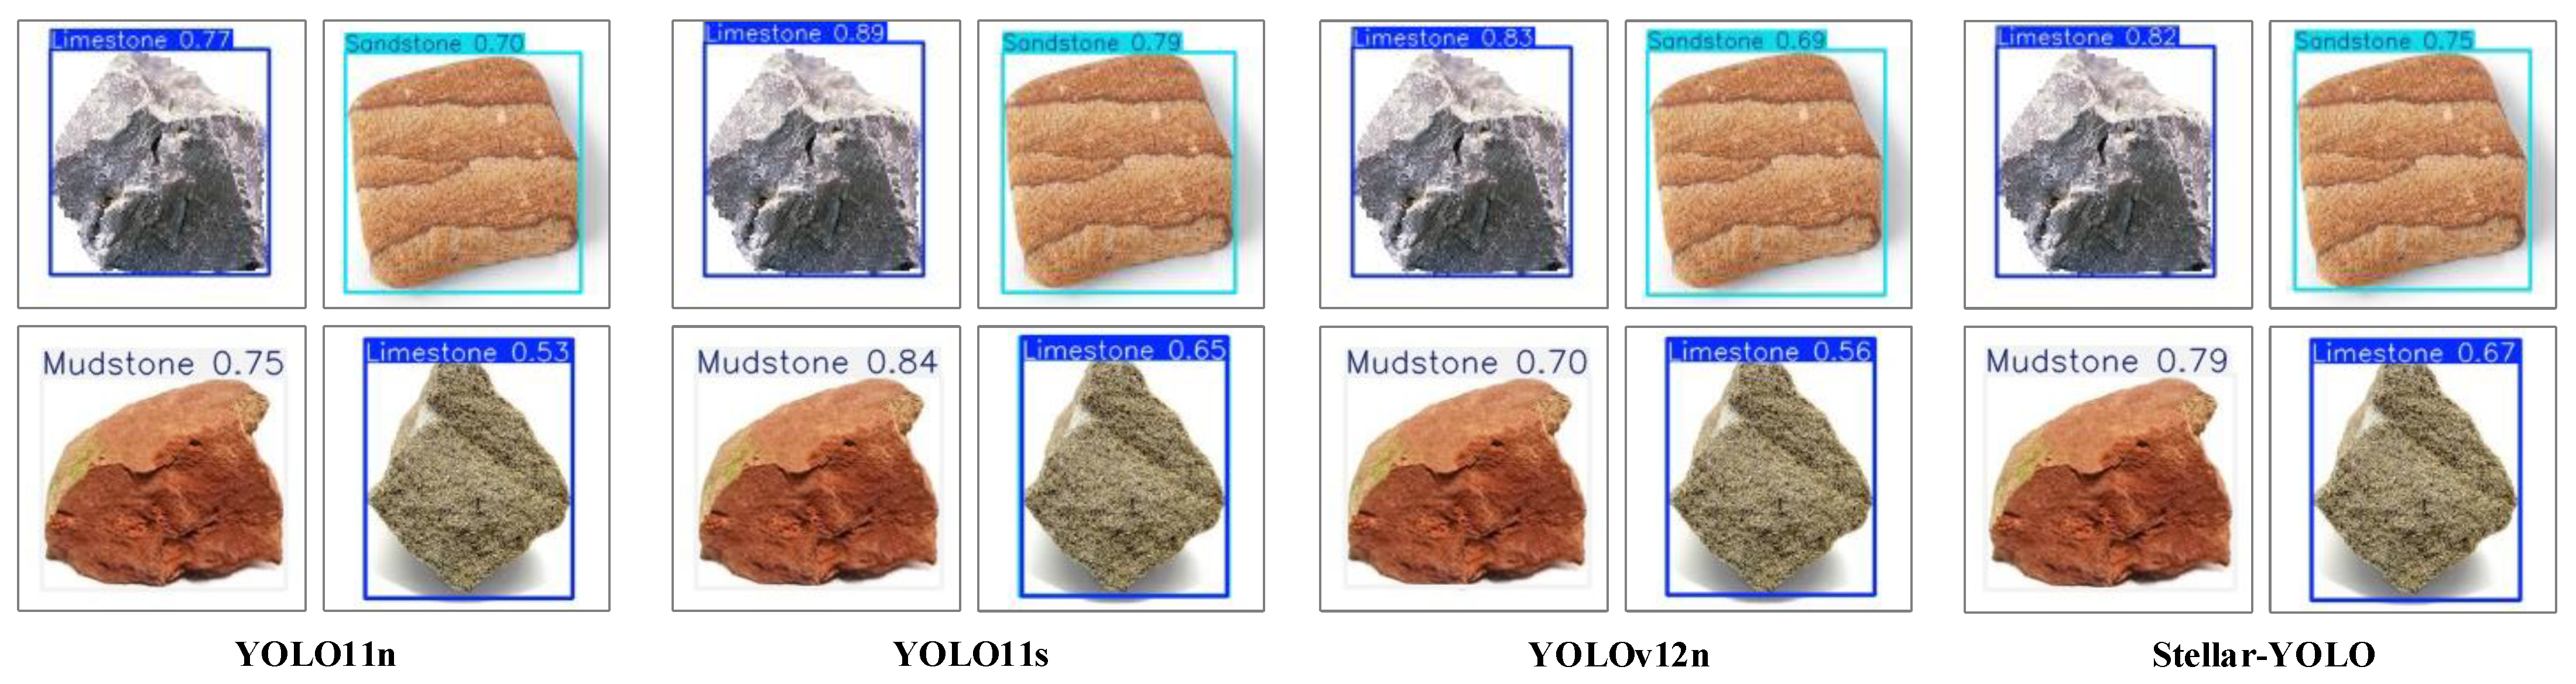
4.5. Generalization Experiments
To further validate the advantages of the proposed model in lightweight design and cross-domain generalization, Stellar-YOLO was evaluated based on a publicly available rock image dataset [
43] containing 1,180 images across common rock types, including limestone, sandstone, and mudstone. As presented in
Table 5, Stellar-YOLO achieved a 2.5% improvement in mAP50 compared to the baseline YOLO11n and performed similarly to the deeper YOLO11s (mAP50 difference less than 1.1%), while offering notable reductions in model complexity. Specifically, FLOPs decreased by 26.9% (from 6.3 G to 4.6 G), the number of parameters was reduced by 26.3% (from 2.58 M to 1.90 M), and the model size shrank by 23% (from 5.24 MB to 4.02 MB). With a comparable model scale, Stellar-YOLO consistently outperformed in lightweight evaluation metrics, demonstrating strong potential for deployment on resource-constrained edge devices. The visualization results presented in
Figure 14 further demonstrate that Stellar-YOLO comes close to the performance of YOLO11s in rock-identification tasks, highlighting its strong feature transfer capability and promising potential for cross-domain mineral detection.
4.6. Limitations
While Stellar-YOLO demonstrates promising performance in graphite ore grade detection, several limitations of the current study should be acknowledged to guide future research directions: (1) the dataset and augmentation method used in this work are limited in scale and diversity, as they primarily consist of images captured under specific industrial conditions. This may restrict the generalization capability of the model to other ore types or environments; (2) although the model is trained from scratch to adapt to the domain-specific data, we did not conduct systematic ablation studies on the effect of pretraining, which could offer insights into potential performance gains in scenarios with limited data; (3) while the SEAM module was proposed to enhance robustness under sub-optimal conditions such as low lighting and dust interference, the quantitative evaluation of model robustness across varying noise intensities remains insufficiently explored. In addition, although the lightweight design is emphasized, the model’s inference speed and deployment performance based on real-world edge devices have not been fully validated; (4) the current framework focuses solely on visual data, whereas integrating additional modalities such as hyperspectral or X-ray imaging may provide richer cues for ore classification, especially in ambiguous cases.
Future work will focus on addressing these limitations through dataset expansion, multi-modal fusion, and real-world deployment validation.
5. Conclusions
Efficient grade recognition technology enables mining enterprises to obtain timely and accurate information about the ore quality, optimize production strategies, minimize material waste and economic loss during processing, and improve operational efficiency. Moreover, it mitigates critical risks such as resource misallocation and environmental pollution resulting from the misjudgment of ore grade, serving as a foundational component for the sustainable and efficient utilization of graphite ore resources.
Conventional graphite ore grade detection relies heavily on manual sampling and laboratory analysis, which are inherently inefficient, lack real-time responsiveness, and are vulnerable to subjective biases. Furthermore, existing automated approaches often struggle with limited detection accuracy, poor adaptability to edge computing devices, and insufficient robustness in complex environments. To overcome these challenges, we propose Stellar-YOLO, a high-accuracy and lightweight detection algorithm tailored for graphite ore grade assessment. The main contributions of this work are as follows:
Through a systematic preparation process, including on-site sampling, multi-angle imaging, and various data augmentation techniques, we independently constructed a high-quality graphite ore image dataset covering two ore morphology types and three grade levels. This dataset comprehensively reflects the diverse characteristics of graphite ore, ensuring data diversity and representativeness, and provides a solid foundation for subsequent ore grade detection and model training.
By first replacing the backbone with the lightweight StarNet, the network architecture was optimized. Next, the C3k2-CAS module, integrating convolution and additive attention mechanisms, was introduced into the neck to enhance feature extraction. Finally, the SEAM module was incorporated into the head, forming Detect-SEAM, which improved the recognition of mineral details under complex environmental conditions. These innovative improvements collectively enhance Stellar-YOLO’s accuracy, lightweight design, and robustness against interference.
We conducted a series of ablation studies to verify the effectiveness of the proposed enhancements to our improved model. Then, we performed comprehensive comparisons with similar lightweight and mainstream detection models, including a set of anti-interference experiments to evaluate their performance under various real-world conditions. Finally, through visual comparison experiments and generalization tests, we demonstrated the superior recognition performance, lightweight design advantages, and strong robustness of our improved model in practical applications.
Compared to the baseline YOLO11n, the improved Stellar-YOLO model shows a significant accuracy boost, with an mAP of 93.6% (up by 4.5%) and an F1 score of 85.4 (up by 2.6). In terms of the lightweight design, it reduces the FLOPs, parameter count, and model size to 4.6 G, 1.90 M, and 4.02 MB, respectively, with reductions of 27%, 26%, and 23%. These improvements enable Stellar-YOLO to deliver high accuracy and a lightweight design, making it ideal for deployment on edge devices for real-time graphite ore grade detection.
Our next plan is to further improve the method, optimize the technical implementation plan, and thoroughly explore its potential industrial applications to address the limitations. The goal is to deploy the technology as soon as possible, verifying its accuracy and lightweight effect, ensuring it can quickly assess the grade of graphite ores and provide scientific technical guidance to mining enterprises. This will aid in precise resource development and promote the realization of a green, low-carbon production model.


