Article

Symmetrical Traditional Patterns and User Perception: A Study on Innovation in Home Textile Design

School of Fashion Design, Zhejiang Sci-Tech University, Hangzhou 311103, China
*
Author to whom correspondence should be addressed.
Symmetry 2025, 17(6), 960; https://doi.org/10.3390/sym17060960
Submission received: 23 March 2025 / Revised: 15 May 2025 / Accepted: 20 May 2025 / Published: 17 June 2025
(This article belongs to the Special Issue Symmetry/Asymmetry in Computer-Aided Industrial Design)

Abstract

With the increasing diversification of modern home textile design (HTD), the integration of traditional cultural elements has become an important trend. This study investigates the impact of symmetry in traditional patterns on the optimization of home textile product design and examines its role in consumer acceptance. First, the affinity diagram method was employed to collect core affective vocabularies. Based on a selection of home textile products incorporating traditional patterns available in the market, a questionnaire was developed to solicit consumers’ evaluations of these affective descriptors. Principal component analysis (PCA) was conducted to extract key perceptual dimensions, with particular emphasis on the influence of pattern symmetry on consumer perception. Subsequently, the Fuzzy Analytic Hierarchy Process (FAHP) was applied to determine the relative weights of the affective terms. Incorporating expert input, five representative traditional patterns from the Homespun Fabric of Jiangnan (HFoJ) were selected and reinterpreted with a focus on symmetrical design. Through the Quality Function Deployment (QFD) method, the effective vocabularies were mapped to the redesigned patterns, leading to the identification of the scheme that most effectively embodied the symmetrical principle for integration into HTD. Finally, the Grey Relation Analysis (GRA) was used to conduct a comprehensive evaluation of multiple design alternatives. The optimal design was selected and subsequently validated through consumer feedback to assess its market feasibility. This study contributes a symmetric approach to the application of symmetry in traditional pattern design, offering both traditional insights and practical guidance for the modernization and innovative transformation of cultural elements in HTD.

1. Introduction

Traditional patterns (TPs) not only carry rich cultural connotations but also endow products with distinctive visual characteristics and emotional values, thereby enhancing their appeal in a competitive market. In contemporary home textile design (HTD), a central challenge lies in accurately interpreting traditional cultural symbols while fostering emotional resonance and improving consumer acceptance [1]. This study aims to investigate the interplay between the symmetry of TPs and user perception, with the goal of optimizing their application pathways in HTD.
In recent years, increasing academic attention has been directed toward the integration of traditional cultural elements into modern design. Several studies have emphasized the application of cultural motifs in home textiles, arguing that traditional elements not only enrich product aesthetics but also strengthen emotional and cultural identification. For instance, Jowers et al. [2] analyzed fixed structural forms using shape grammars theory, revealing limitations in their variation capabilities and demonstrating how structural formalization can enhance user acceptance. Similarly, Zou et al. [3] employed the Analytic Hierarchy Process (AHP) to explore cross-cultural design strategies involving Chinese dragon and Thai Naga motifs, concluding that cultural meaning can be effectively communicated through a structured four-stage design model. However, while these studies highlight the symbolic and aesthetic functions of TPs, they often overlook the perceptual and emotional needs of users.
In parallel, Kansei Engineering (KE) has been widely adopted to bridge product features with user perception across design fields, such as furniture, apparel, and home textiles. KE enables the quantification of emotional responses, thereby optimizing both visual and tactile product experiences. Miao et al. [4] applied traditional Chinese auspicious motifs to modern wedding bedding design, reconstructing pattern forms using contemporary aesthetics to enhance cultural resonance and market potential. Yang et al. [5] combined the AHP and Grey Relational Analysis (GRA) to reduce subjectivity in evaluating campus cultural and creative products and to identify an optimal design scheme. Despite the effectiveness of such approaches, most prior studies rely on a single-dimensional KE evaluation, lacking a multi-faceted cognitive framework. Moreover, the specific impact of symmetry in TPs on user perception remains underexplored.
To address these limitations, this study proposes a comprehensive and data-driven design framework, recognizing that optimizing traditional pattern design requires a complete logical chain from quantifying user perception and extracting key factors to assigning scientific weights and evaluating design schemes. The key contributions of this study are threefold: (i) it conducts an in-depth analysis of how symmetry of TPs influences user perception and develops a multi-dimensional cognitive evaluation system; (ii) it proposes an integrated optimization approach combining KE with quantitative analysis to improve alignment with user preferences and enhance market acceptance; (iii) it presents a practical framework for the innovative transformation and sustainable modernization of traditional cultural elements in contemporary HTD.
Subsequent sections of this paper are structured as follows: Section 2 reviews the interdisciplinary literature on TP symbolism, user cognitive preference, and design strategies; Section 3 introduces the research methodology and proposes an optimization model for reinterpreting the HFoJ; Section 4 analyzes the morphological evolution and cultural background of the HFoJ pattern, integrating these insights with the user perception data, to inform innovative design iterations; Section 5 identifies the optimal HFoJ-based HTD through sensitivity analysis and validates the feasibility via consumer feedback; Section 6 concludes this study by summarizing key findings, addressing limitations, and outlining future research directions.

2. Literature Review

2.1. Traditional Pattern and Textile Design

TPs hold profound cultural significance and occupy a unique position in Chinese visual heritage. For instance, Chen et al. [6] employed KE to explore how consumers of different age groups emotionally perceive the lotus motif from the Tang Dynasty’s Mogao Grottoes. By constructing a predictive model of user emotion, their research enabled designers to reconfigure traditional motifs to align with contemporary user preferences. Similarly, Chen et al. [7] addressed the gap between consumers’ individualized aesthetic demands and pattern design by analyzing perceptual adjectives and developing a regression model linking visual design elements with emotional responses. This model provided actionable insights into tailoring designs for targeted emotional effects. An et al. [8] used semantic differential analysis and Quantification Theory I to identify the modern aesthetic potential embedded in the linear structures of traditional screen designs. Their results revealed that specific linear features, such as carved bases, contributed significantly to a sense of modernity and lightness, offering practical guidance for updating traditional aesthetics. In a related study, Song et al. [9] applied factor analysis to investigate how geometric patterns and dress silhouettes influenced users’ sensory impressions. They identified three key perceptual dimensions that interact differently depending on pattern-silhouette combinations, providing refined design strategies for summer dresses using KE.
While existing studies have successfully linked traditional motifs to perceptual evaluation and aesthetic innovation, they often overlook individual variance and group diversity in sample selection. Additionally, traditional analytical methods may fail to uncover deeper latent patterns or adapt well to complex real-world contexts. This study responds to these gaps by integrating perceptual vocabularies analysis, expert scoring, and design optimization techniques to systematically examine the role of symmetry in TP-based HTD and its acceptance in the market. The proposed framework aims to enhance the cultural inheritance and innovation of traditional patterns while improving the practical efficacy of design outcomes.

2.2. User Perception and Innovation in Home Textile Design

In textile design, the application of TPs is not a matter of mere recreation but a complex process of reinterpretation and cultural replication. Quan et al. [10] proposed a hybrid method combining deep learning and KE to derive user preferences and generate novel design schemes through a style transfer model. Their method was validated using a women’s coat design as an example, though they acknowledged persisting subjectivity in style image evaluations. Gao et al. [11] findings underscored the significant influence of elements such as color and lines on users’ visual impressions, offering valuable insights for applying traditional motifs in contemporary product design. Cui et al. [12] used shape grammar to systematize the design rules for Zhuang embroidery, generating outputs at two levels of abstraction. By combining algorithmic modeling and design exploration, they demonstrated the method’s capacity to inspire innovation, validating its potential for wider design applications. Fu et al. [13] integrated KE and a genetic algorithm to correlate consumer emotions with design parameters. Through a multiphase modeling approach applied to a mini digital camera design, they optimized emotional responses while identifying methodological limitations and areas for further research.
While current studies have explored the visual transformation of cultural elements and design methodologies, many fall short in analyzing the internal mechanisms that trigger users’ emotional resonance. These works often neglect dynamic emotional shifts across contexts and lack systematic user feedback collection and analysis. To address these limitations, the present study focuses on HFoJ traditional patterns and employs QFD in combination with user perception research. This integrated approach preliminarily quantifies user perceptions and offers a methodological framework for enhancing cultural integration and emotional engagement in HTD.

2.3. Design Decision—Making and Scheme Verification

To ensure that HTD effectively balances functionality, user emotion, and cultural meaning, systematic design evaluation and decision-making methods are essential. Wang et al. [14] introduced a product identity form design method that integrates various technologies. They employed the QFD method to map consumer requirements to engineering characteristics. In a subsequent study, Wang et al. [15] addressed the design of rattan-woven lamps by integrating GRA with Fuzzy QFD. The experimental results validated the feasibility and effectiveness of this combined method. In the context of sustainable residential design, Lee et al. [16] utilized the Kano model to identify the design preferences of a broad sample of homebuyers. Their analysis revealed generational differences in user demands and proposed 31 grouped strategies prioritized by importance, along with implementation challenges, offering valuable guidance for future sustainable designs. Similarly, Wang et al. [17] applied the three-level theory of emotional design and the Kano model in the design of urban furniture on Yangzhou Sanwan Street.
However, existing research still exhibits notable limitations. Many studies insufficiently differentiate user needs, resulting in engineering parameters that fail to fully align with market expectations. Moreover, in specialized fields, such as traditional pattern design and cultural and creative products, current approaches often lack robust mechanisms to match users’ emotional needs with the deeper cultural significance intended by the designs.
To address these challenges, this study adopts a hybrid PCA–FAHP–GRA framework. PCA is used to extract key pattern features while the FAHP assesses the relative importance of user needs. Combined with GRA for scheme selection, this system not only optimizes product design to meet functional demands but also enhances emotional engagement and facilitates the transmission of cultural values. It provides a novel methodology and practical pathway for improving the cultural and emotional dimensions of product design in the home textile field.

3. Methodology

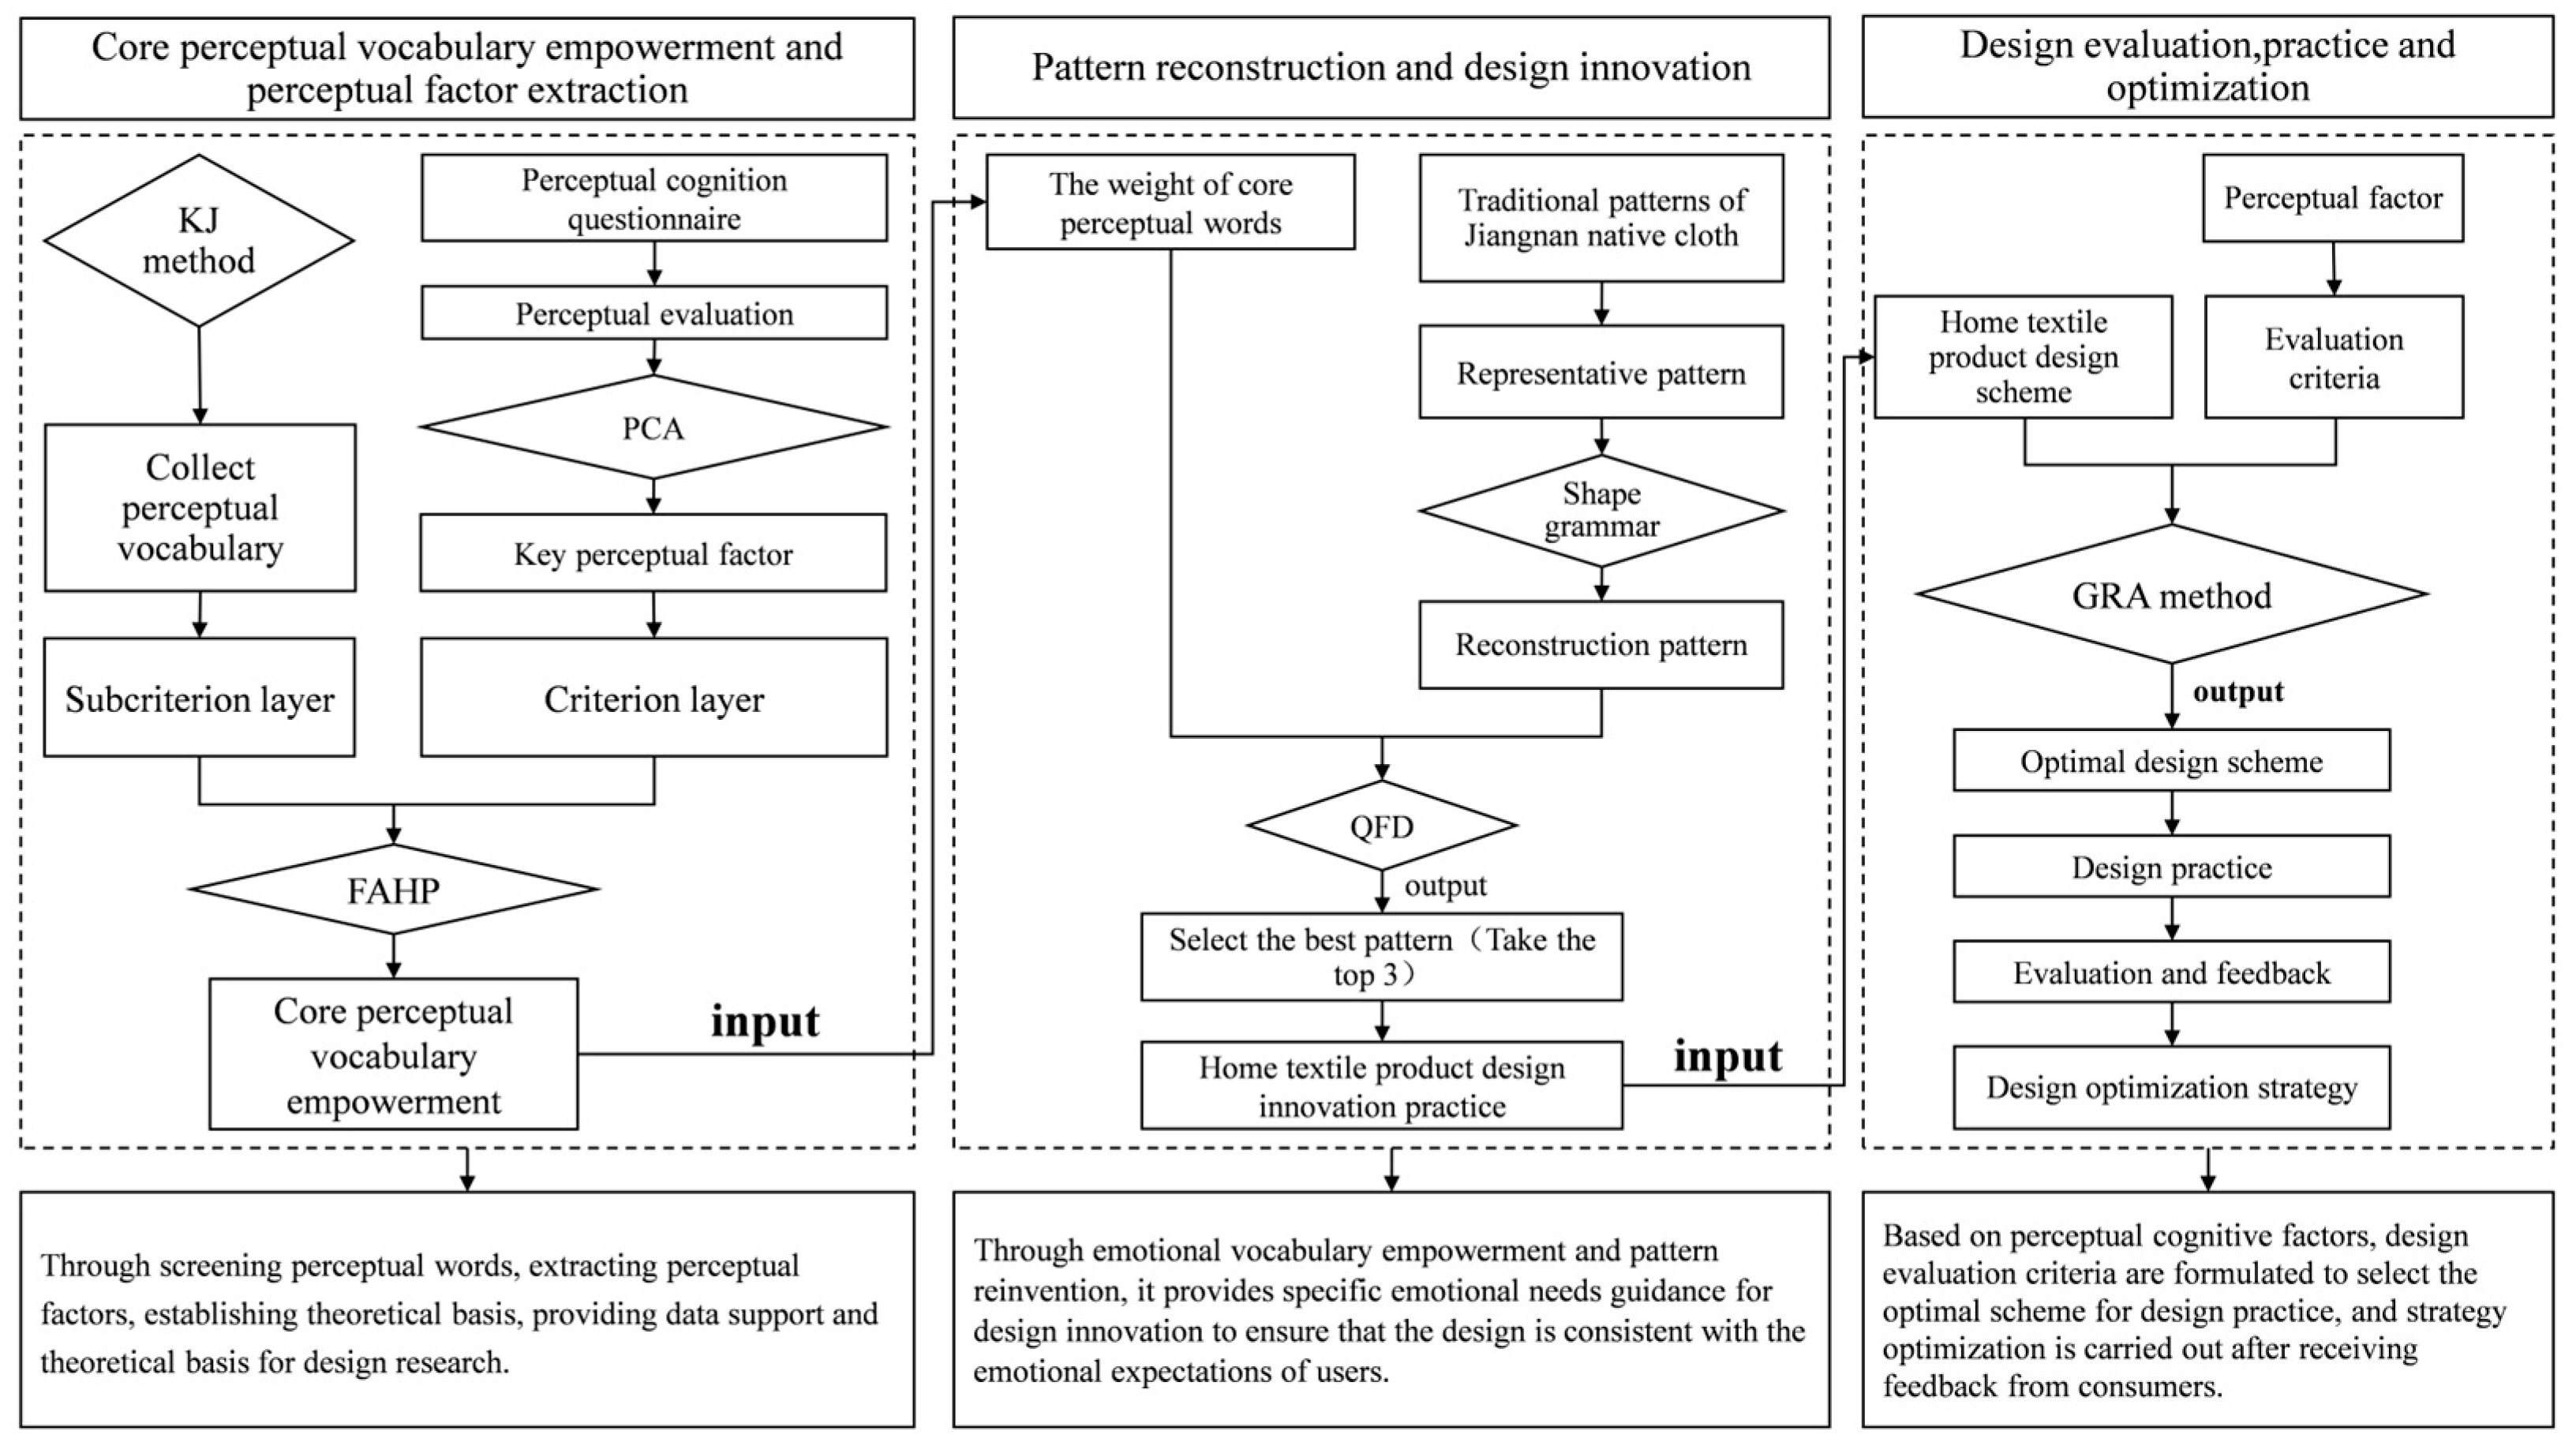
3.1. Proposed Framework

This study aims to integrate TPs into the home textile product design and optimize the design process by employing the Affinity Diagram, PCA, FAHP, and QFD. The goal is to enhance both emotional resonance and market feasibility. The proposed research framework involves a sequence of analytical, creative, and evaluative steps, including data analysis, identification of emotional needs, TP innovation, scheme screening, and validation based on consumer feedback. Specifically, as illustrated in Figure 1, the framework consists of the following stages:
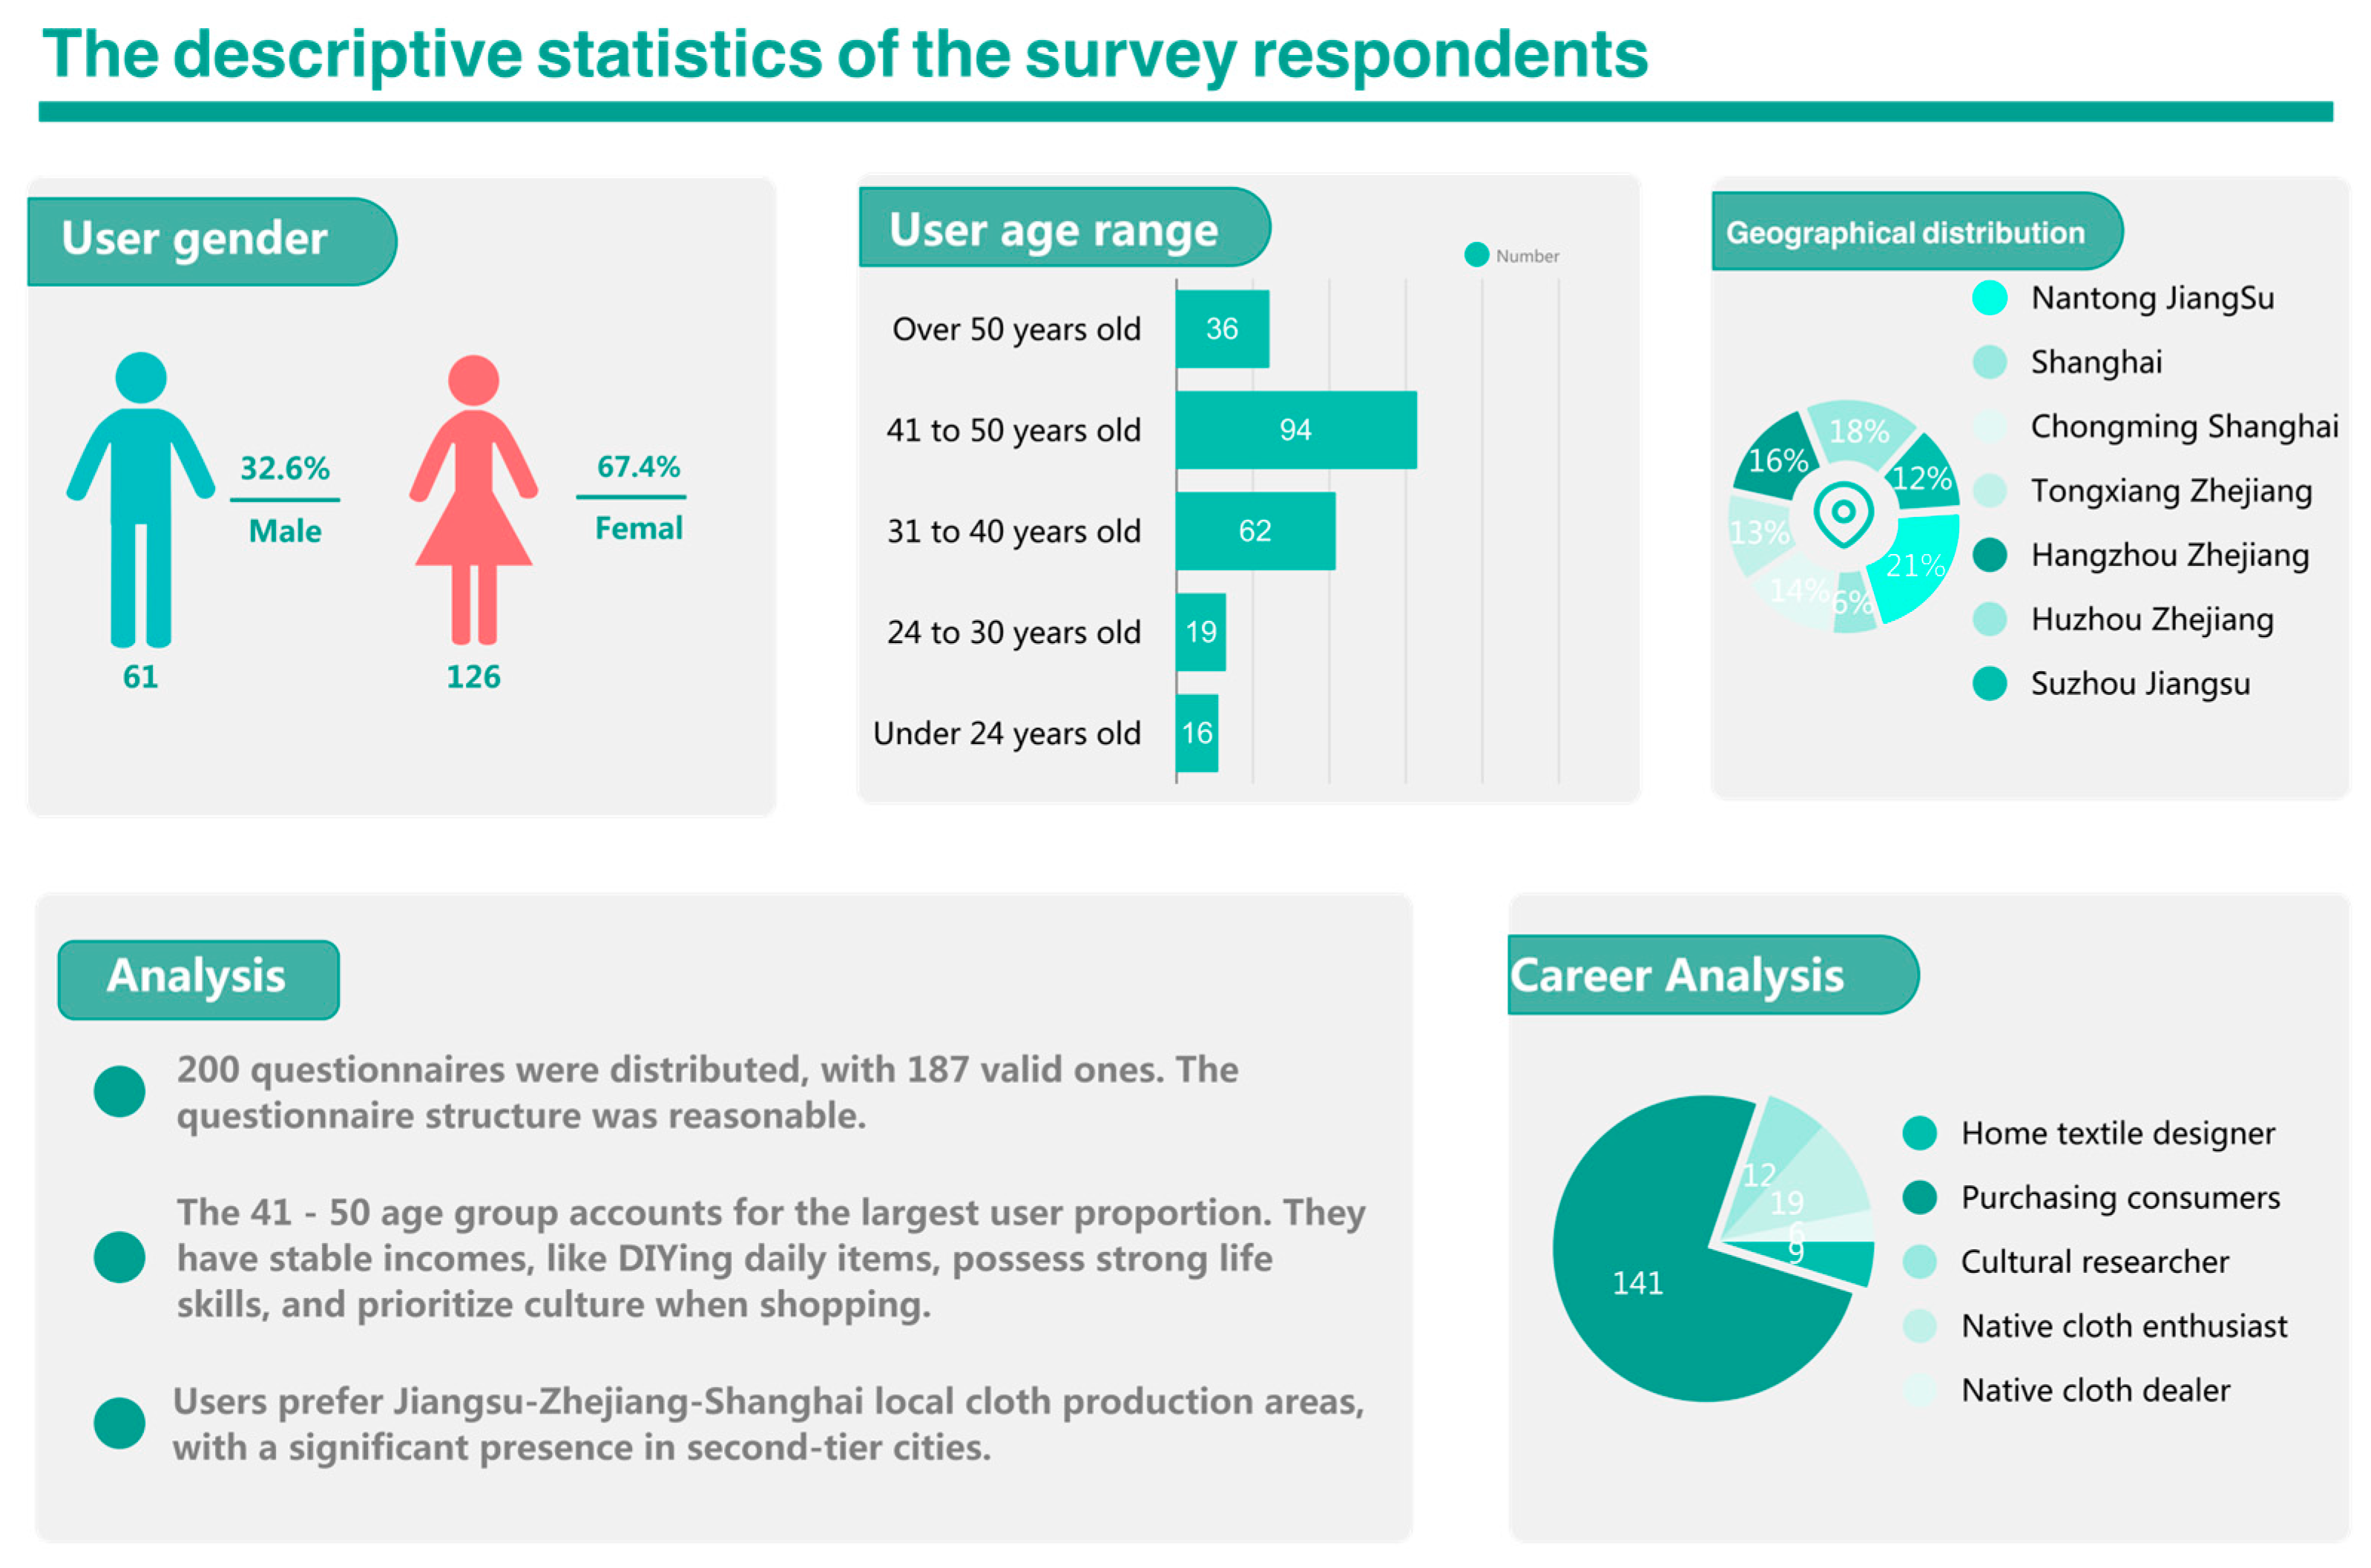
  • The Affinity Diagram is used to collect and organize 10 core affective vocabularies related to HTD. A perceptual cognition questionnaire is then constructed to collect consumer evaluations of home textile products featuring TPs, ensuring that the data reflect intuitive user perceptions of emotional and visual qualities;
  • PCA is applied to the questionnaire data to extract key perceptual factors, which represent users’ cognitive-emotional responses;
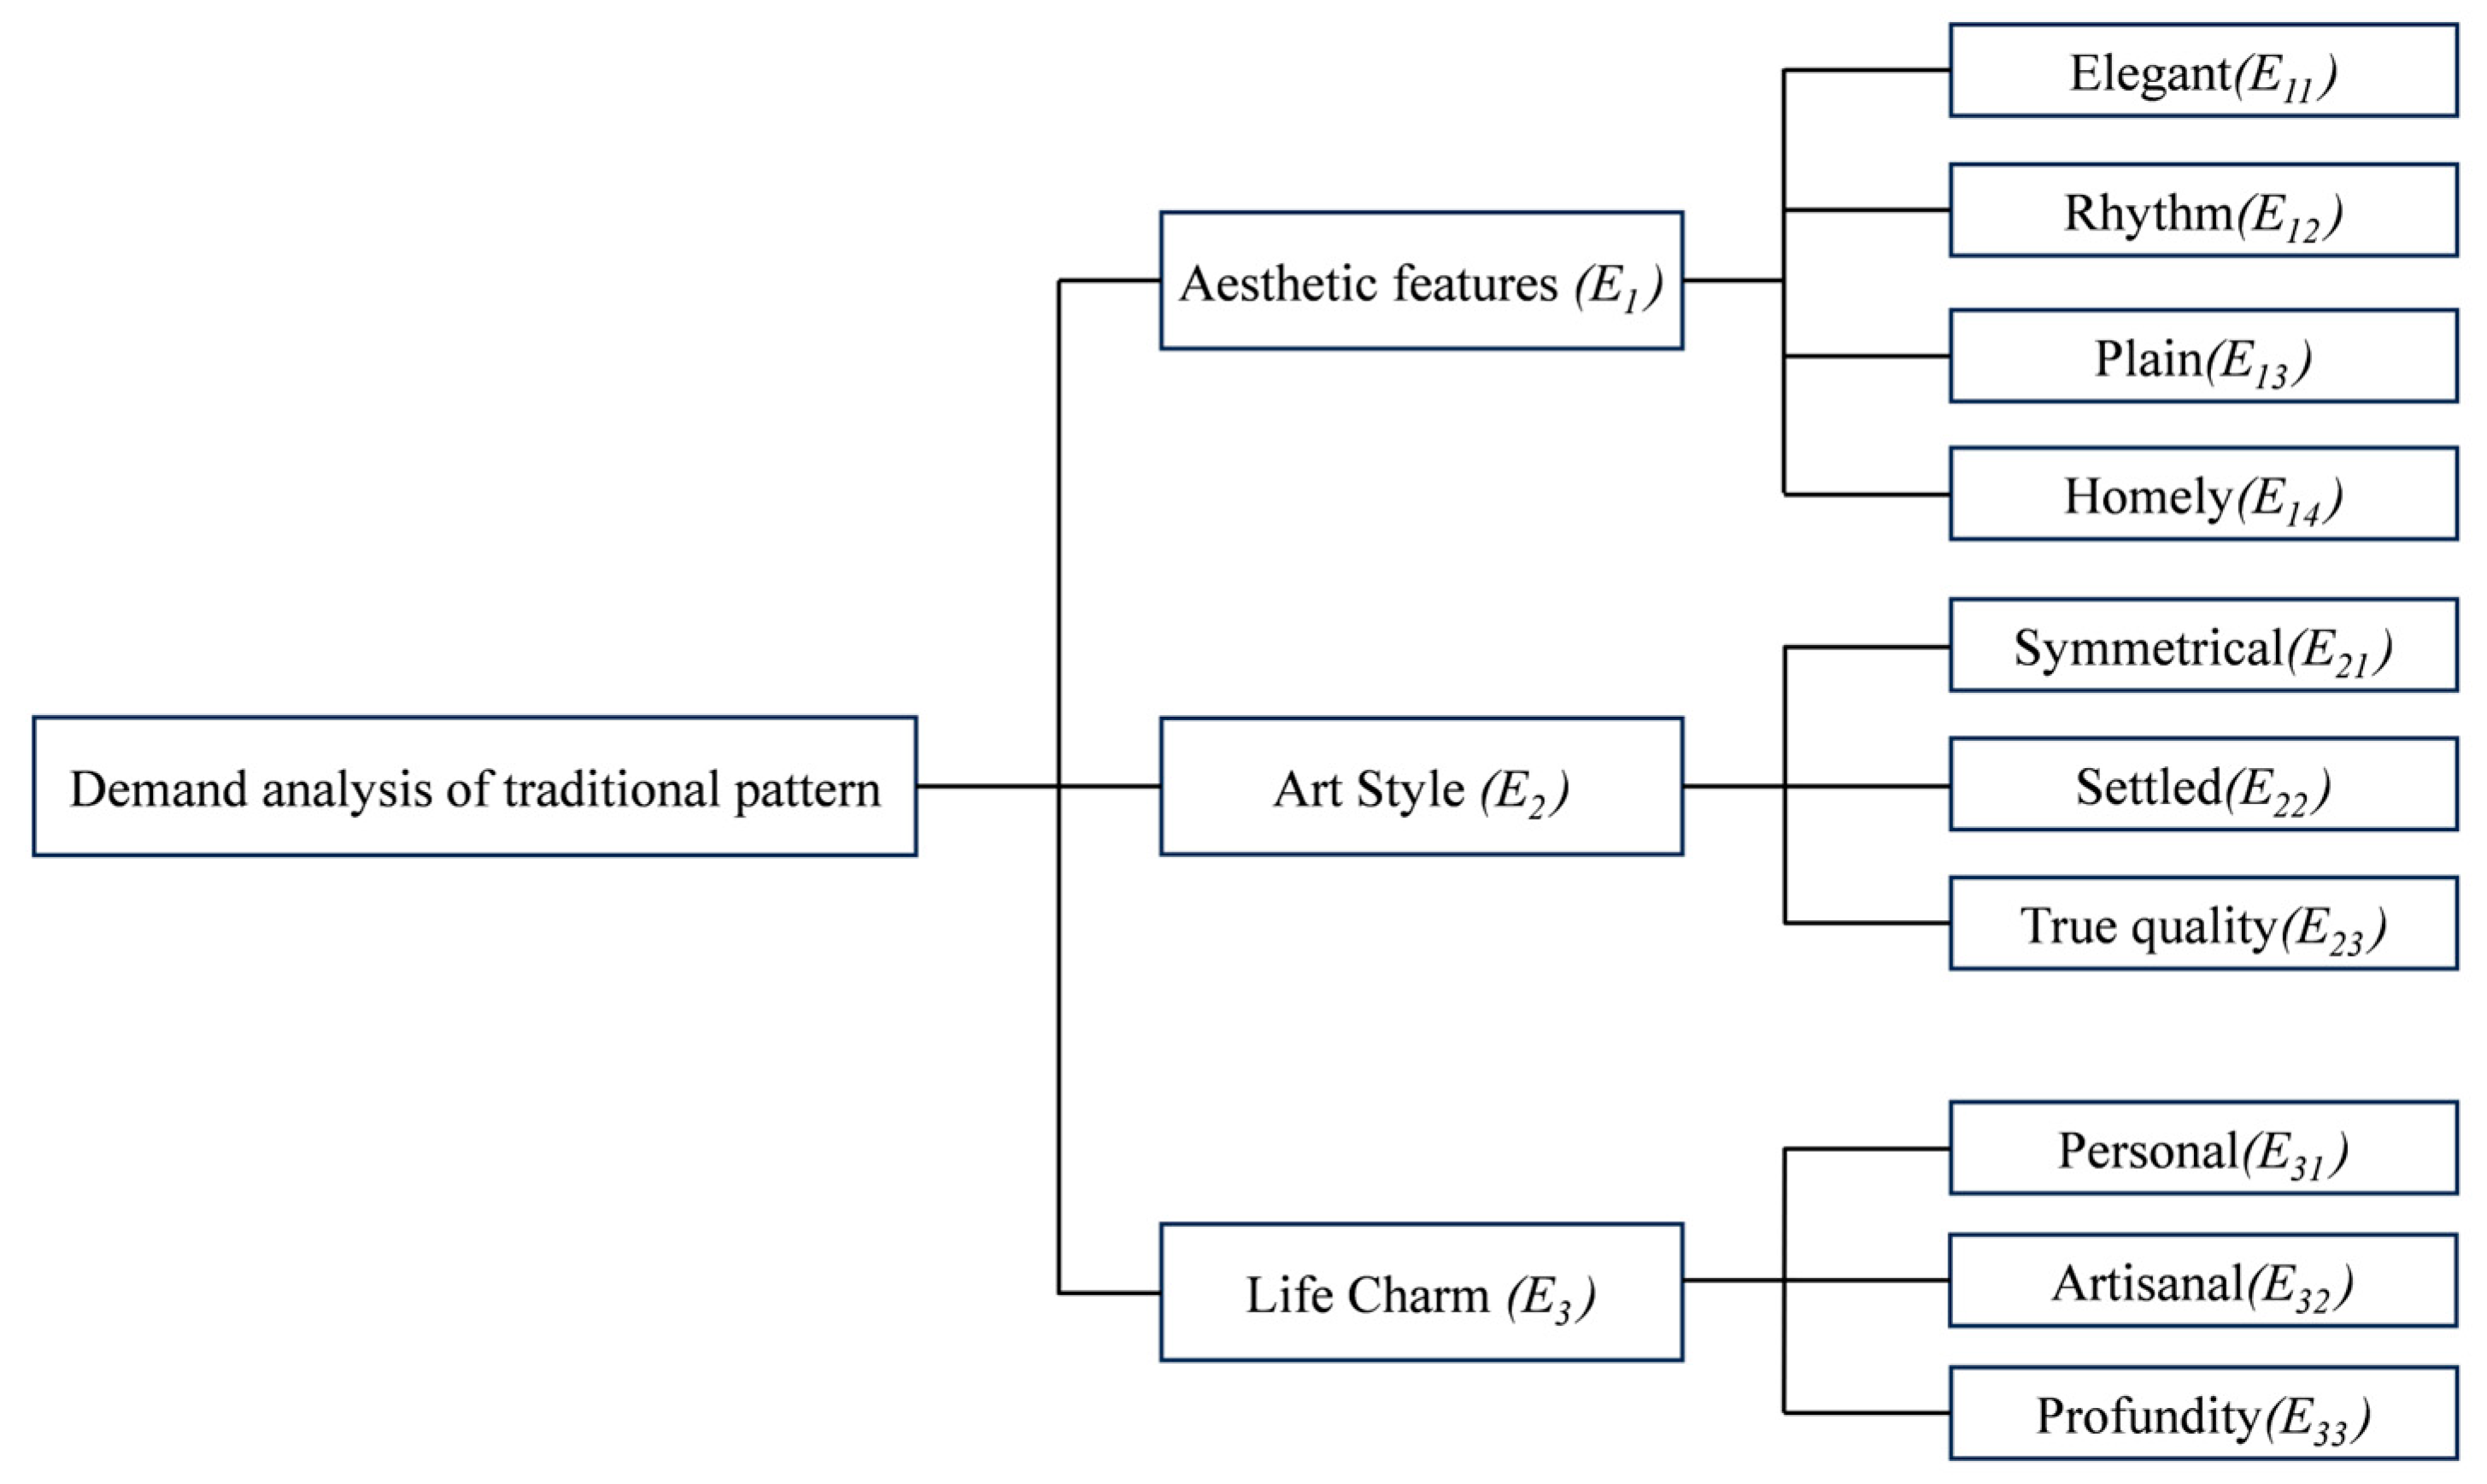
  • The perceptual cognition factors are divided in the criterion layer, with the core affective vocabularies forming the sub-criterion layer. Design experts assign weights to the 10 affective vocabularies using the FAHP method, allowing for the calculation of the relative importance of each perceptual factor in HTD;
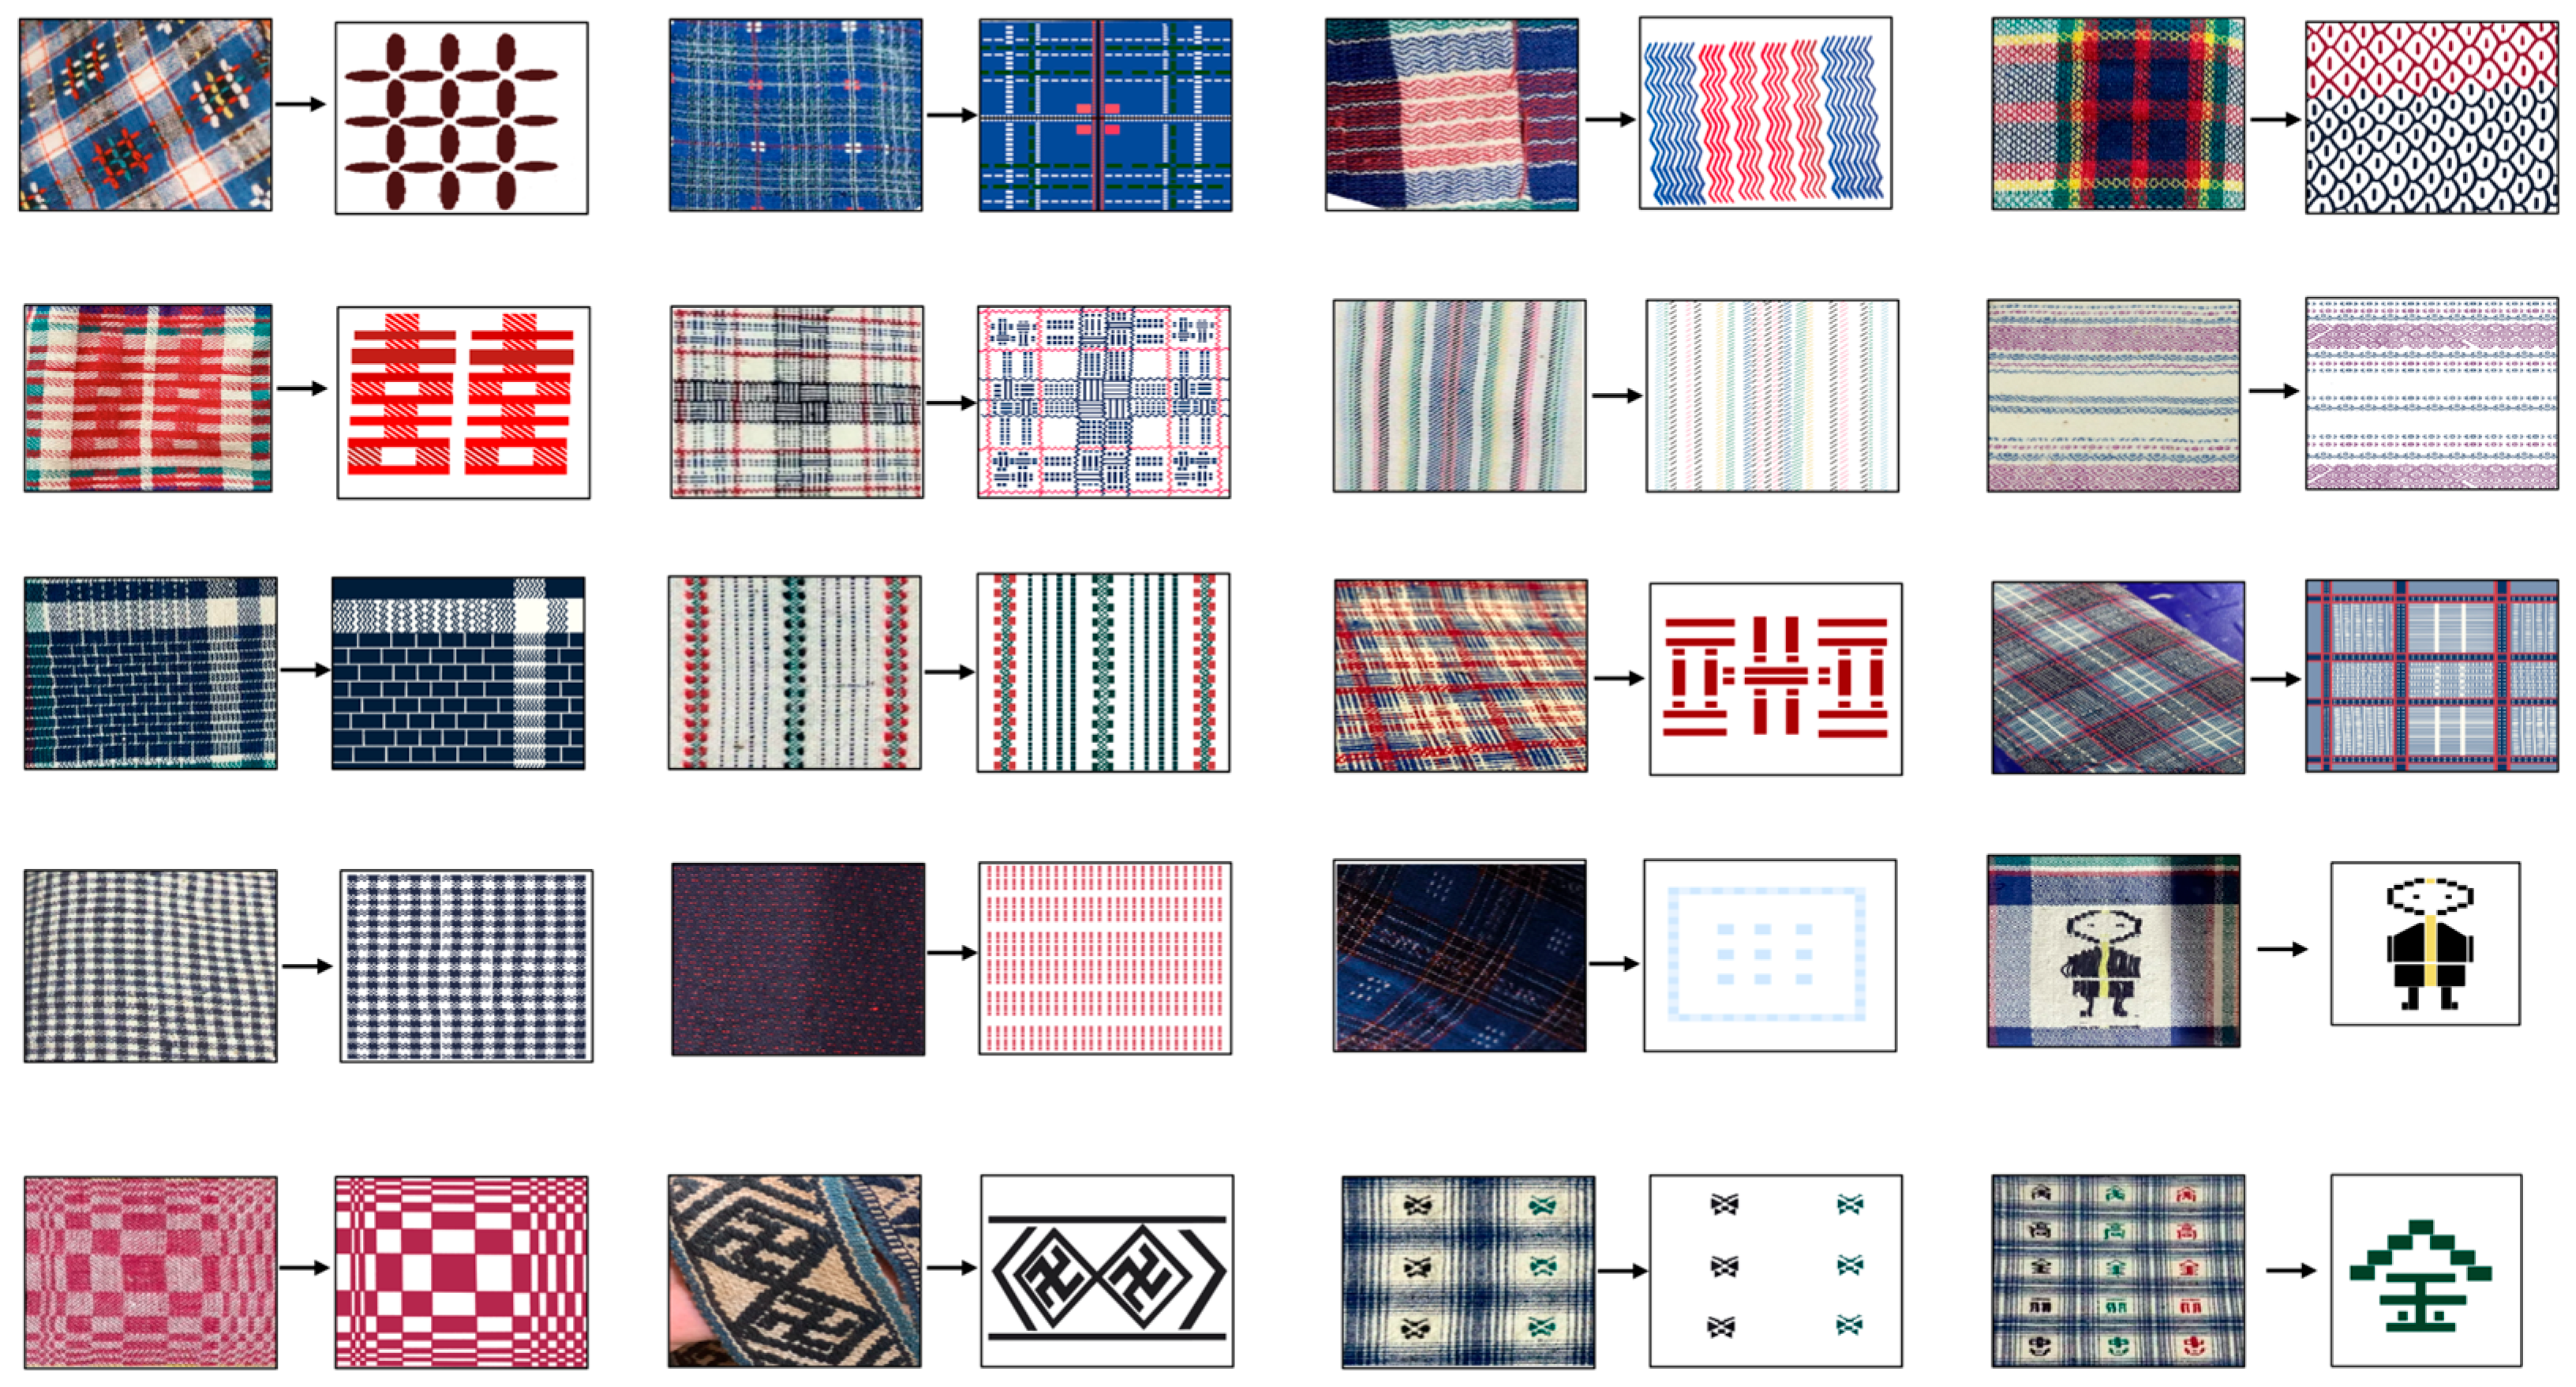
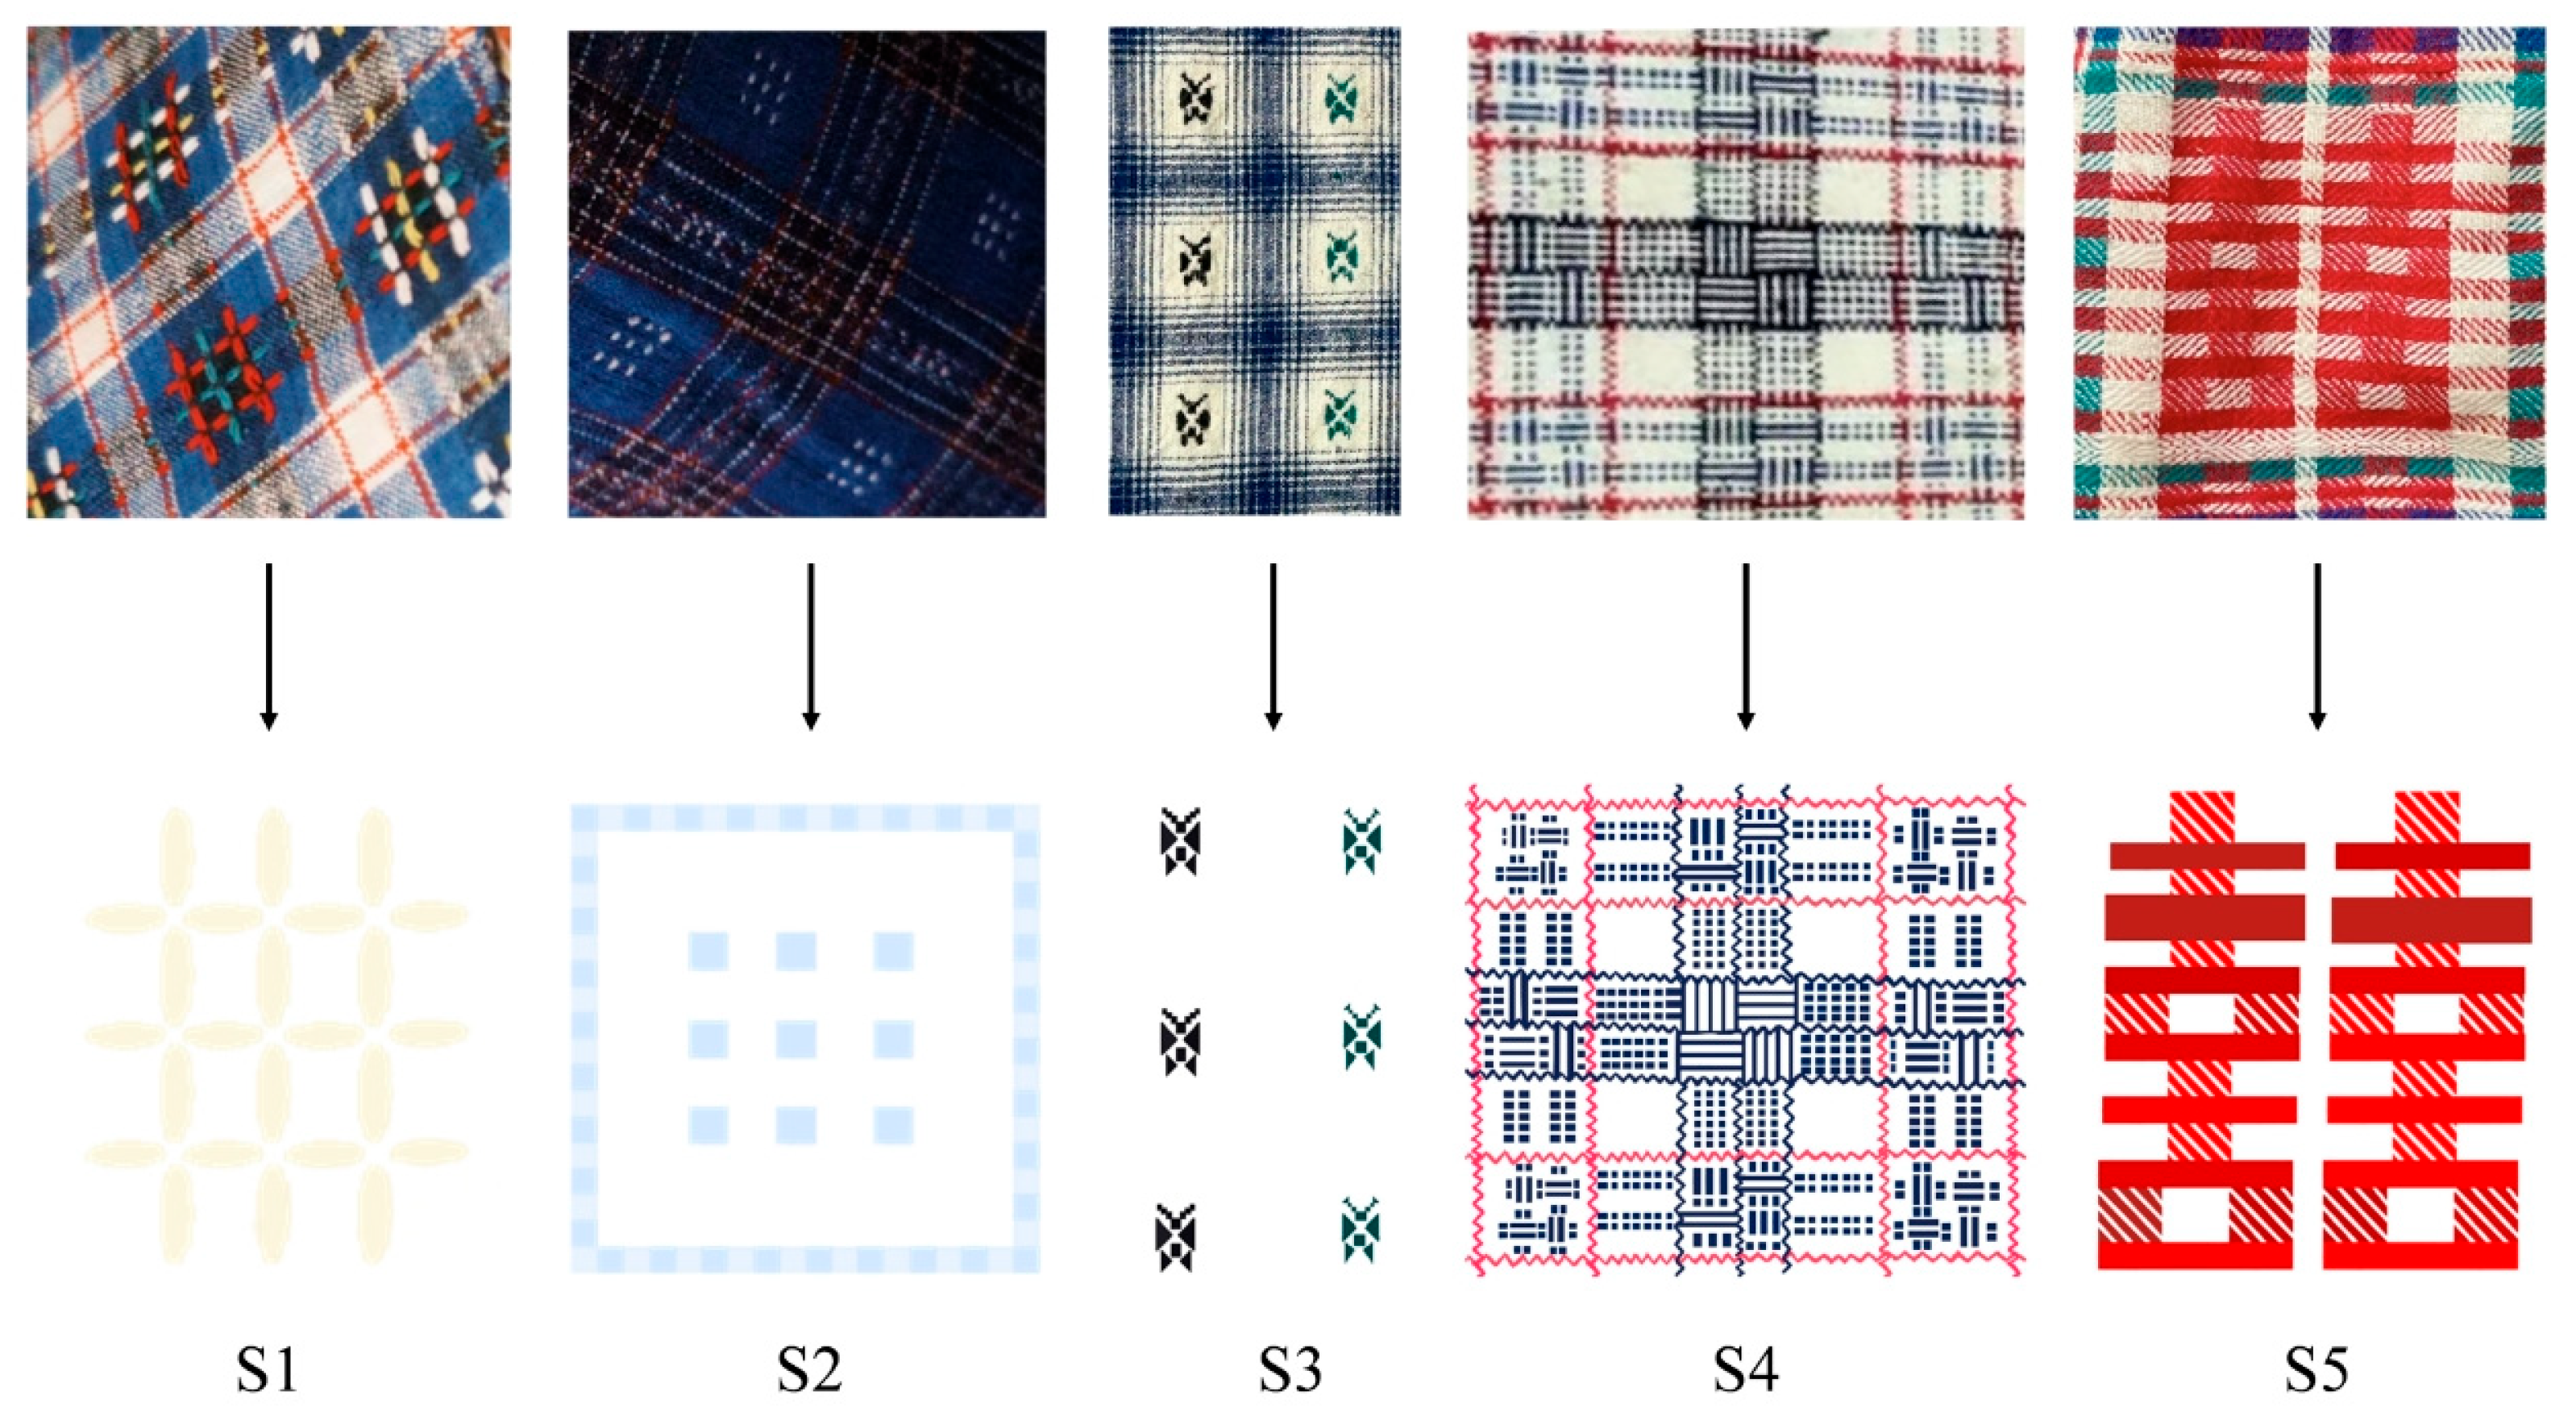
  • A selection of 5 representative HFoJ TPs is analyzed to uncover their cultural meanings and design potential. Shape grammar is employed to reinterpret and innovate these patterns while preserving their cultural characteristics;
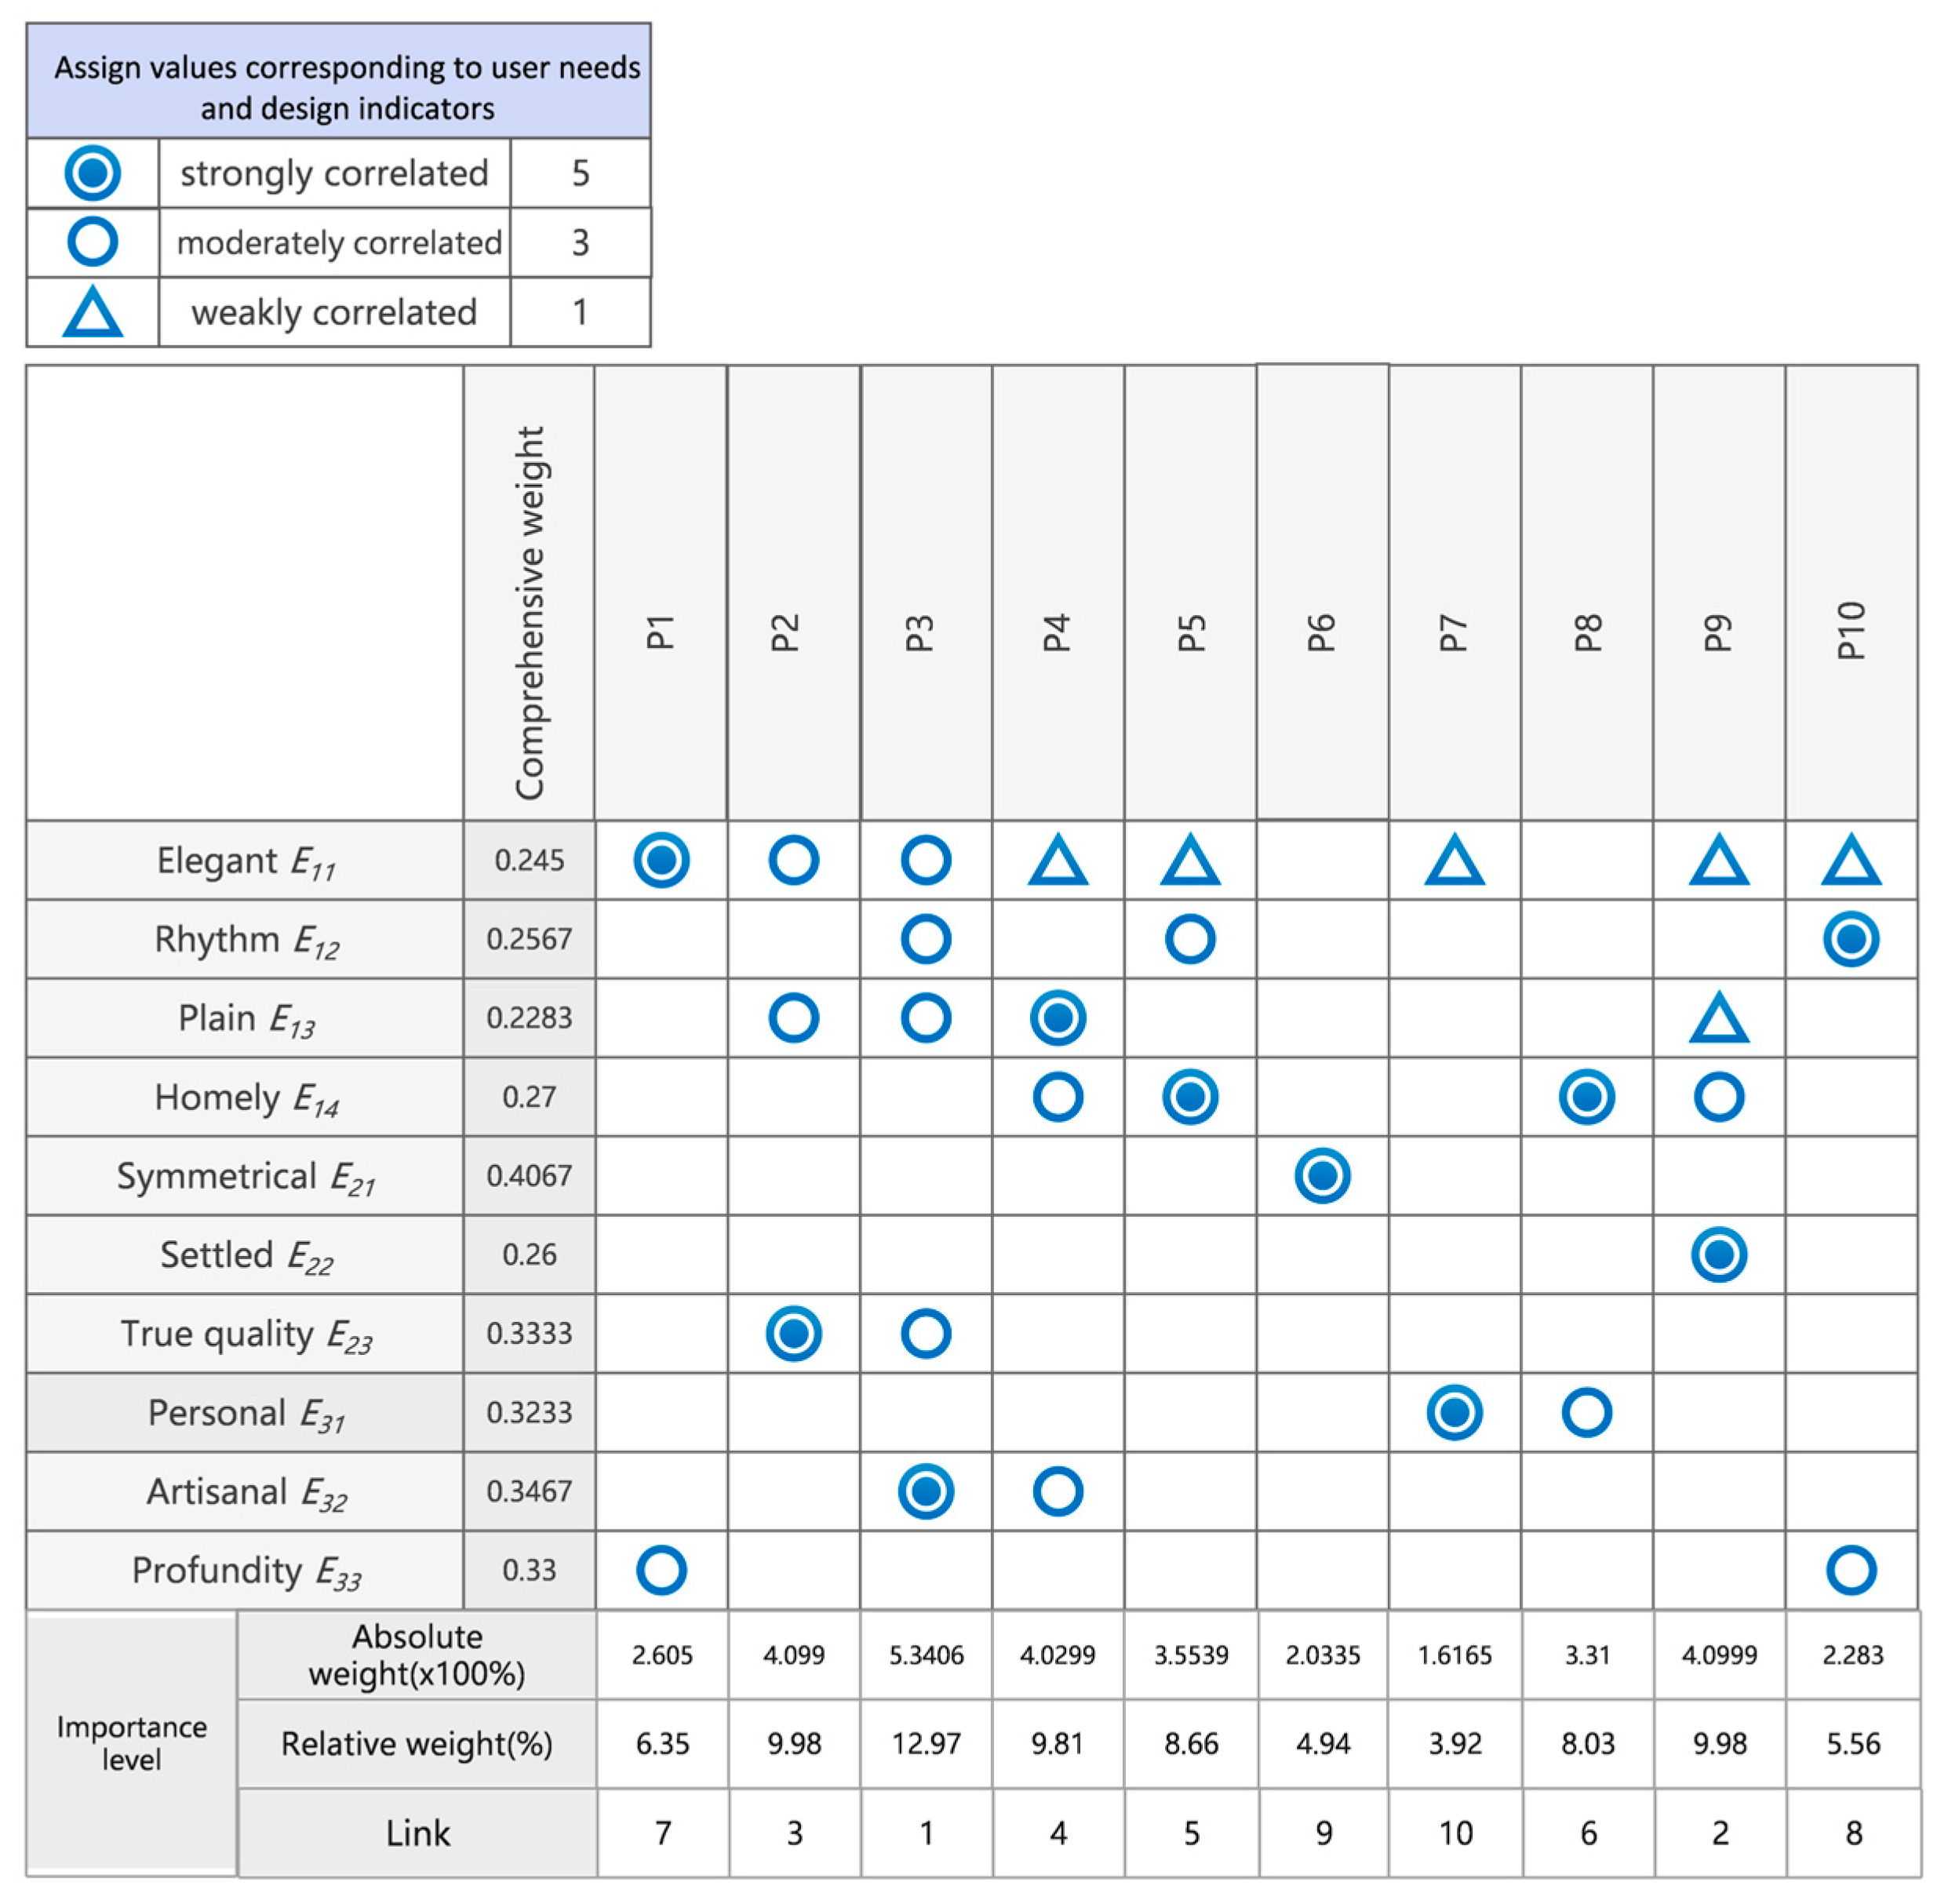
  • Based on the weighed affective vocabularies and 10 reinterpreted TP variants, a QFD mapping model is constructed to link perceptual needs with design attributes. The model is then used to identify the optimal patterns for home textile product development;
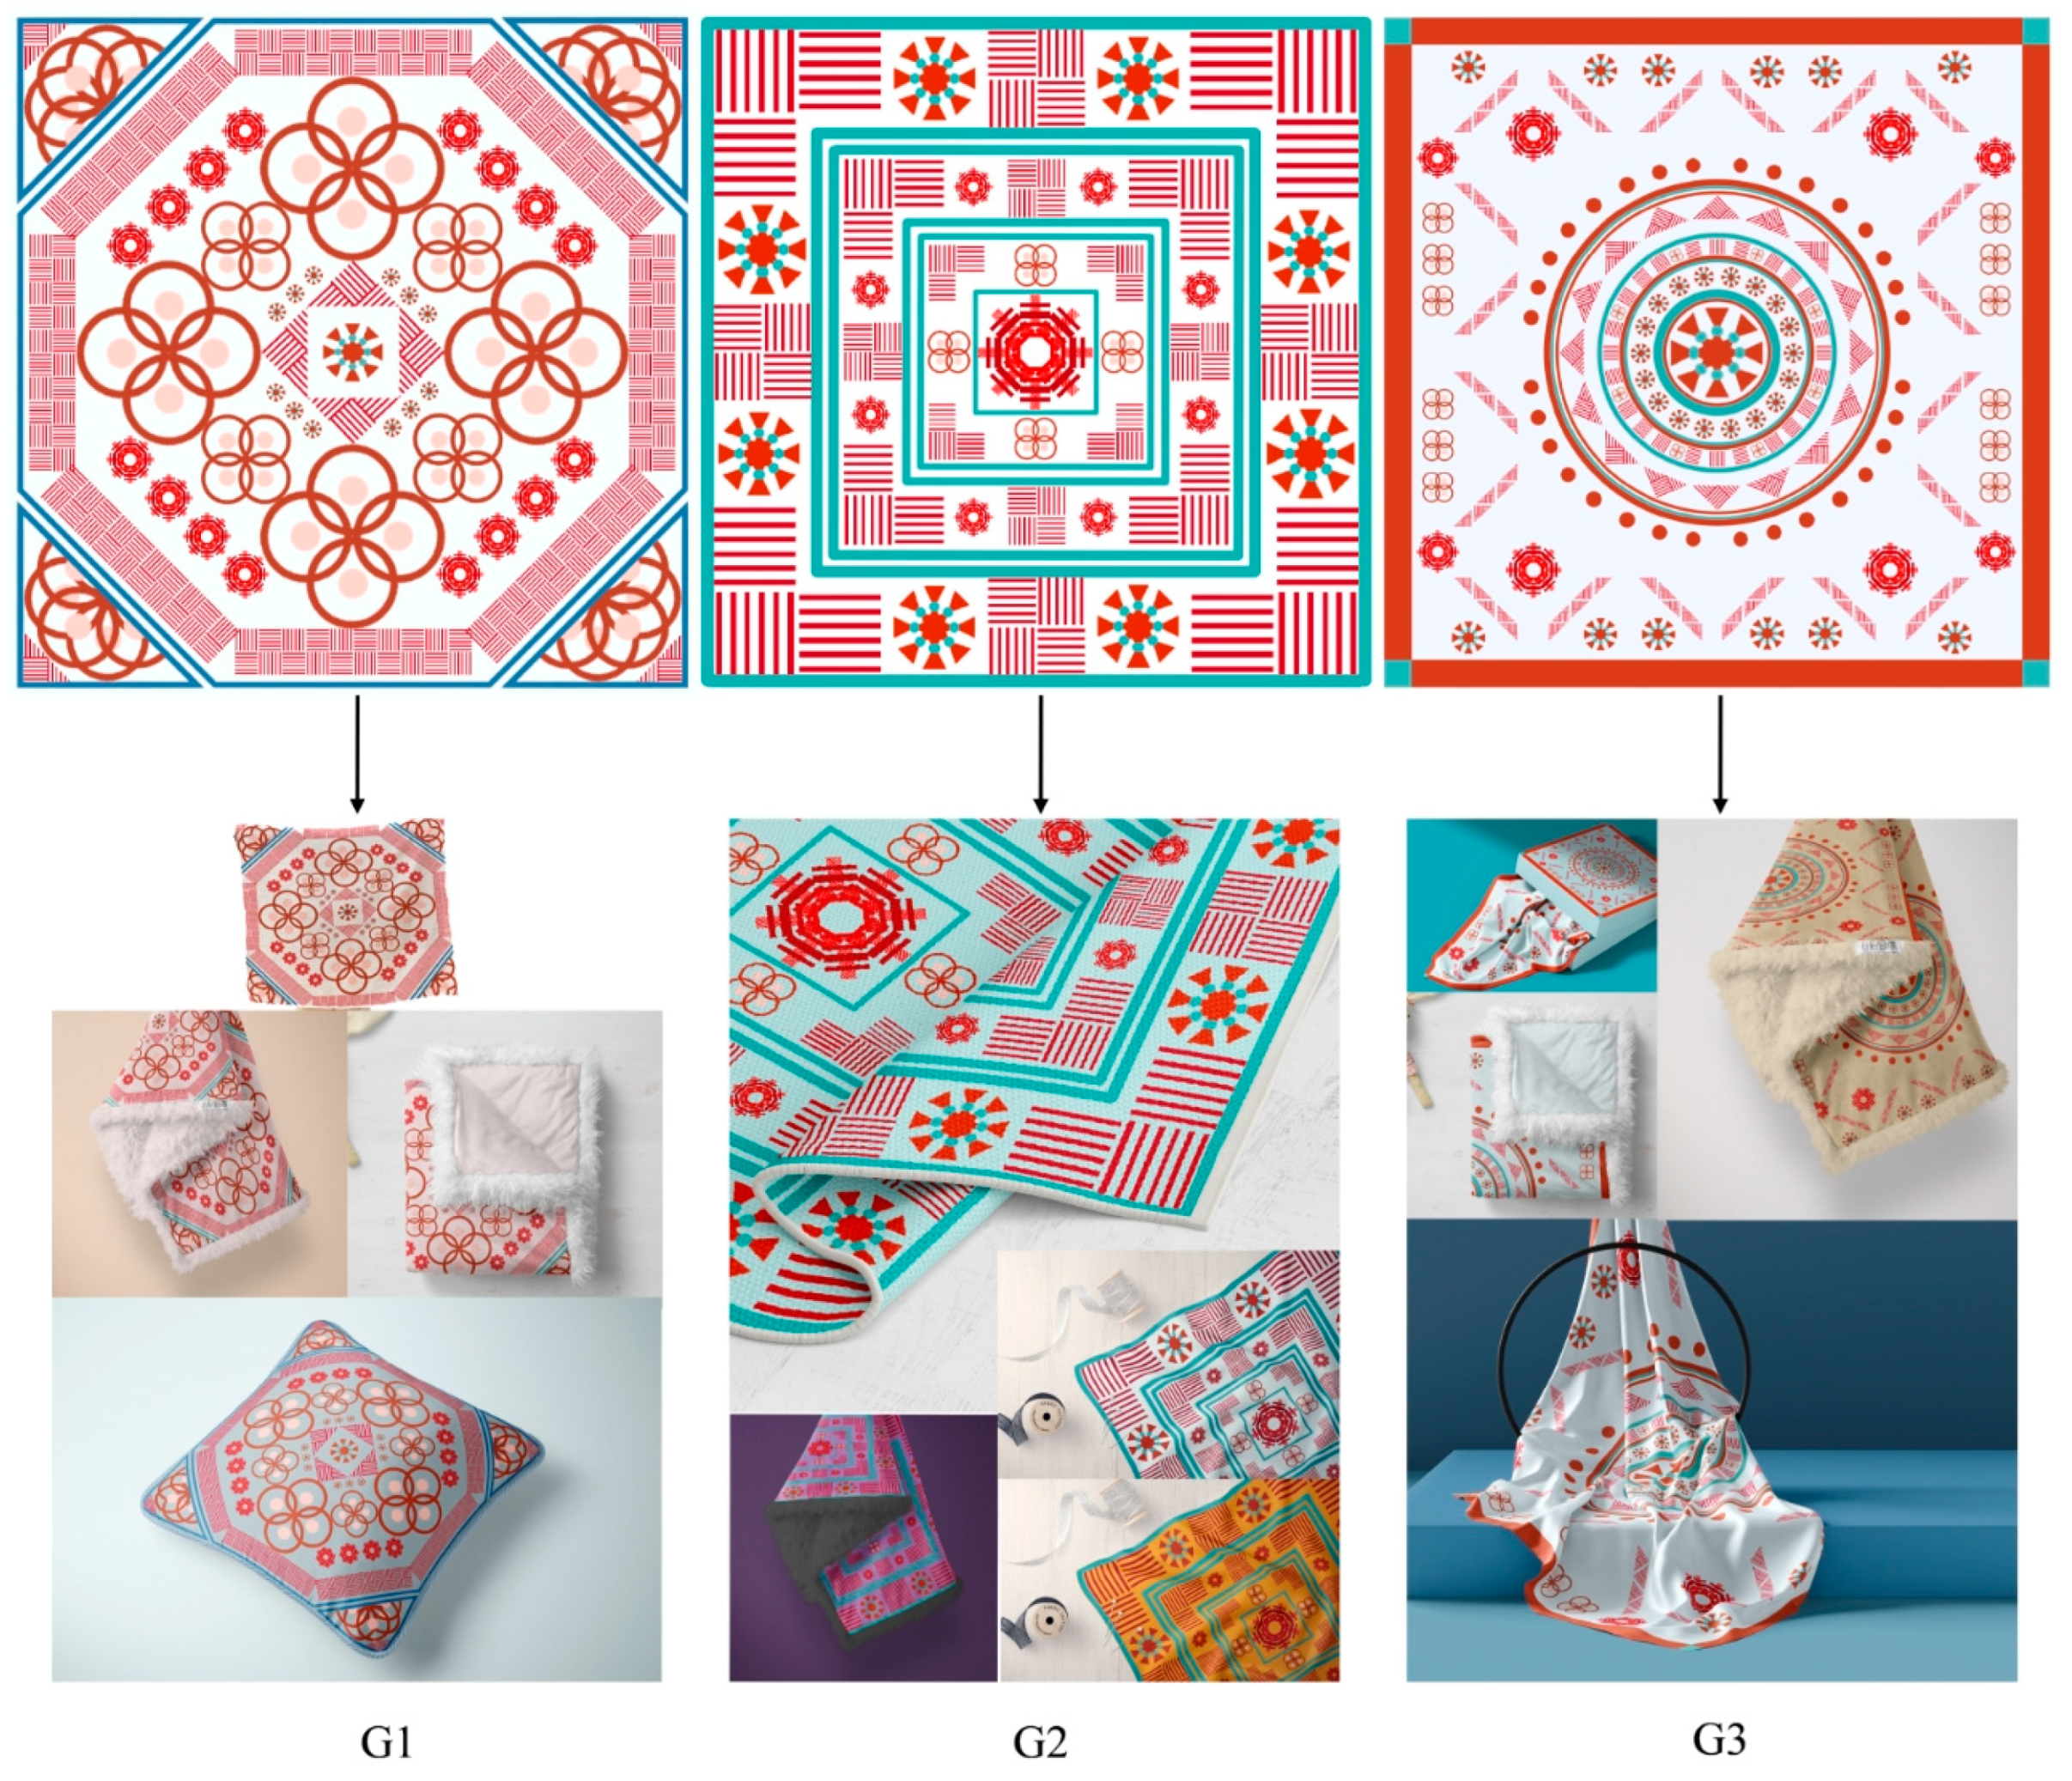
  • Using the top 3 ranked patterns, 3 home textile product design schemes are created. These schemes are refined by integrating different design elements and materials to ensure functionality and aesthetic appeal;
  • Experts assess the 3 design schemes using the GRA method to determine the most effective design from an emotional and cultural standpoint;
  • The selected optimal pattern is applied in actual HTD practice. Consumers are invited to evaluate the final design scheme to assess its market feasibility and emotional resonance.

3.2. Affinity Diagram

The Affinity Diagram is a widely used qualitative research tool for organizing, classifying, and structuring complex or disordered information. It aims to help researchers identify the internal relationships and potential patterns among the information through a systematic process [18]. The Affinity Diagram was employed to organize users’ emotional responses to HFoJ TPs collected via questionnaires. Affective vocabularies were grouped by emotional similarity and key terms were statistically analyzed to form structured data. These results informed the redesign of TPs, providing emotional grounding and guiding innovation in HTD.

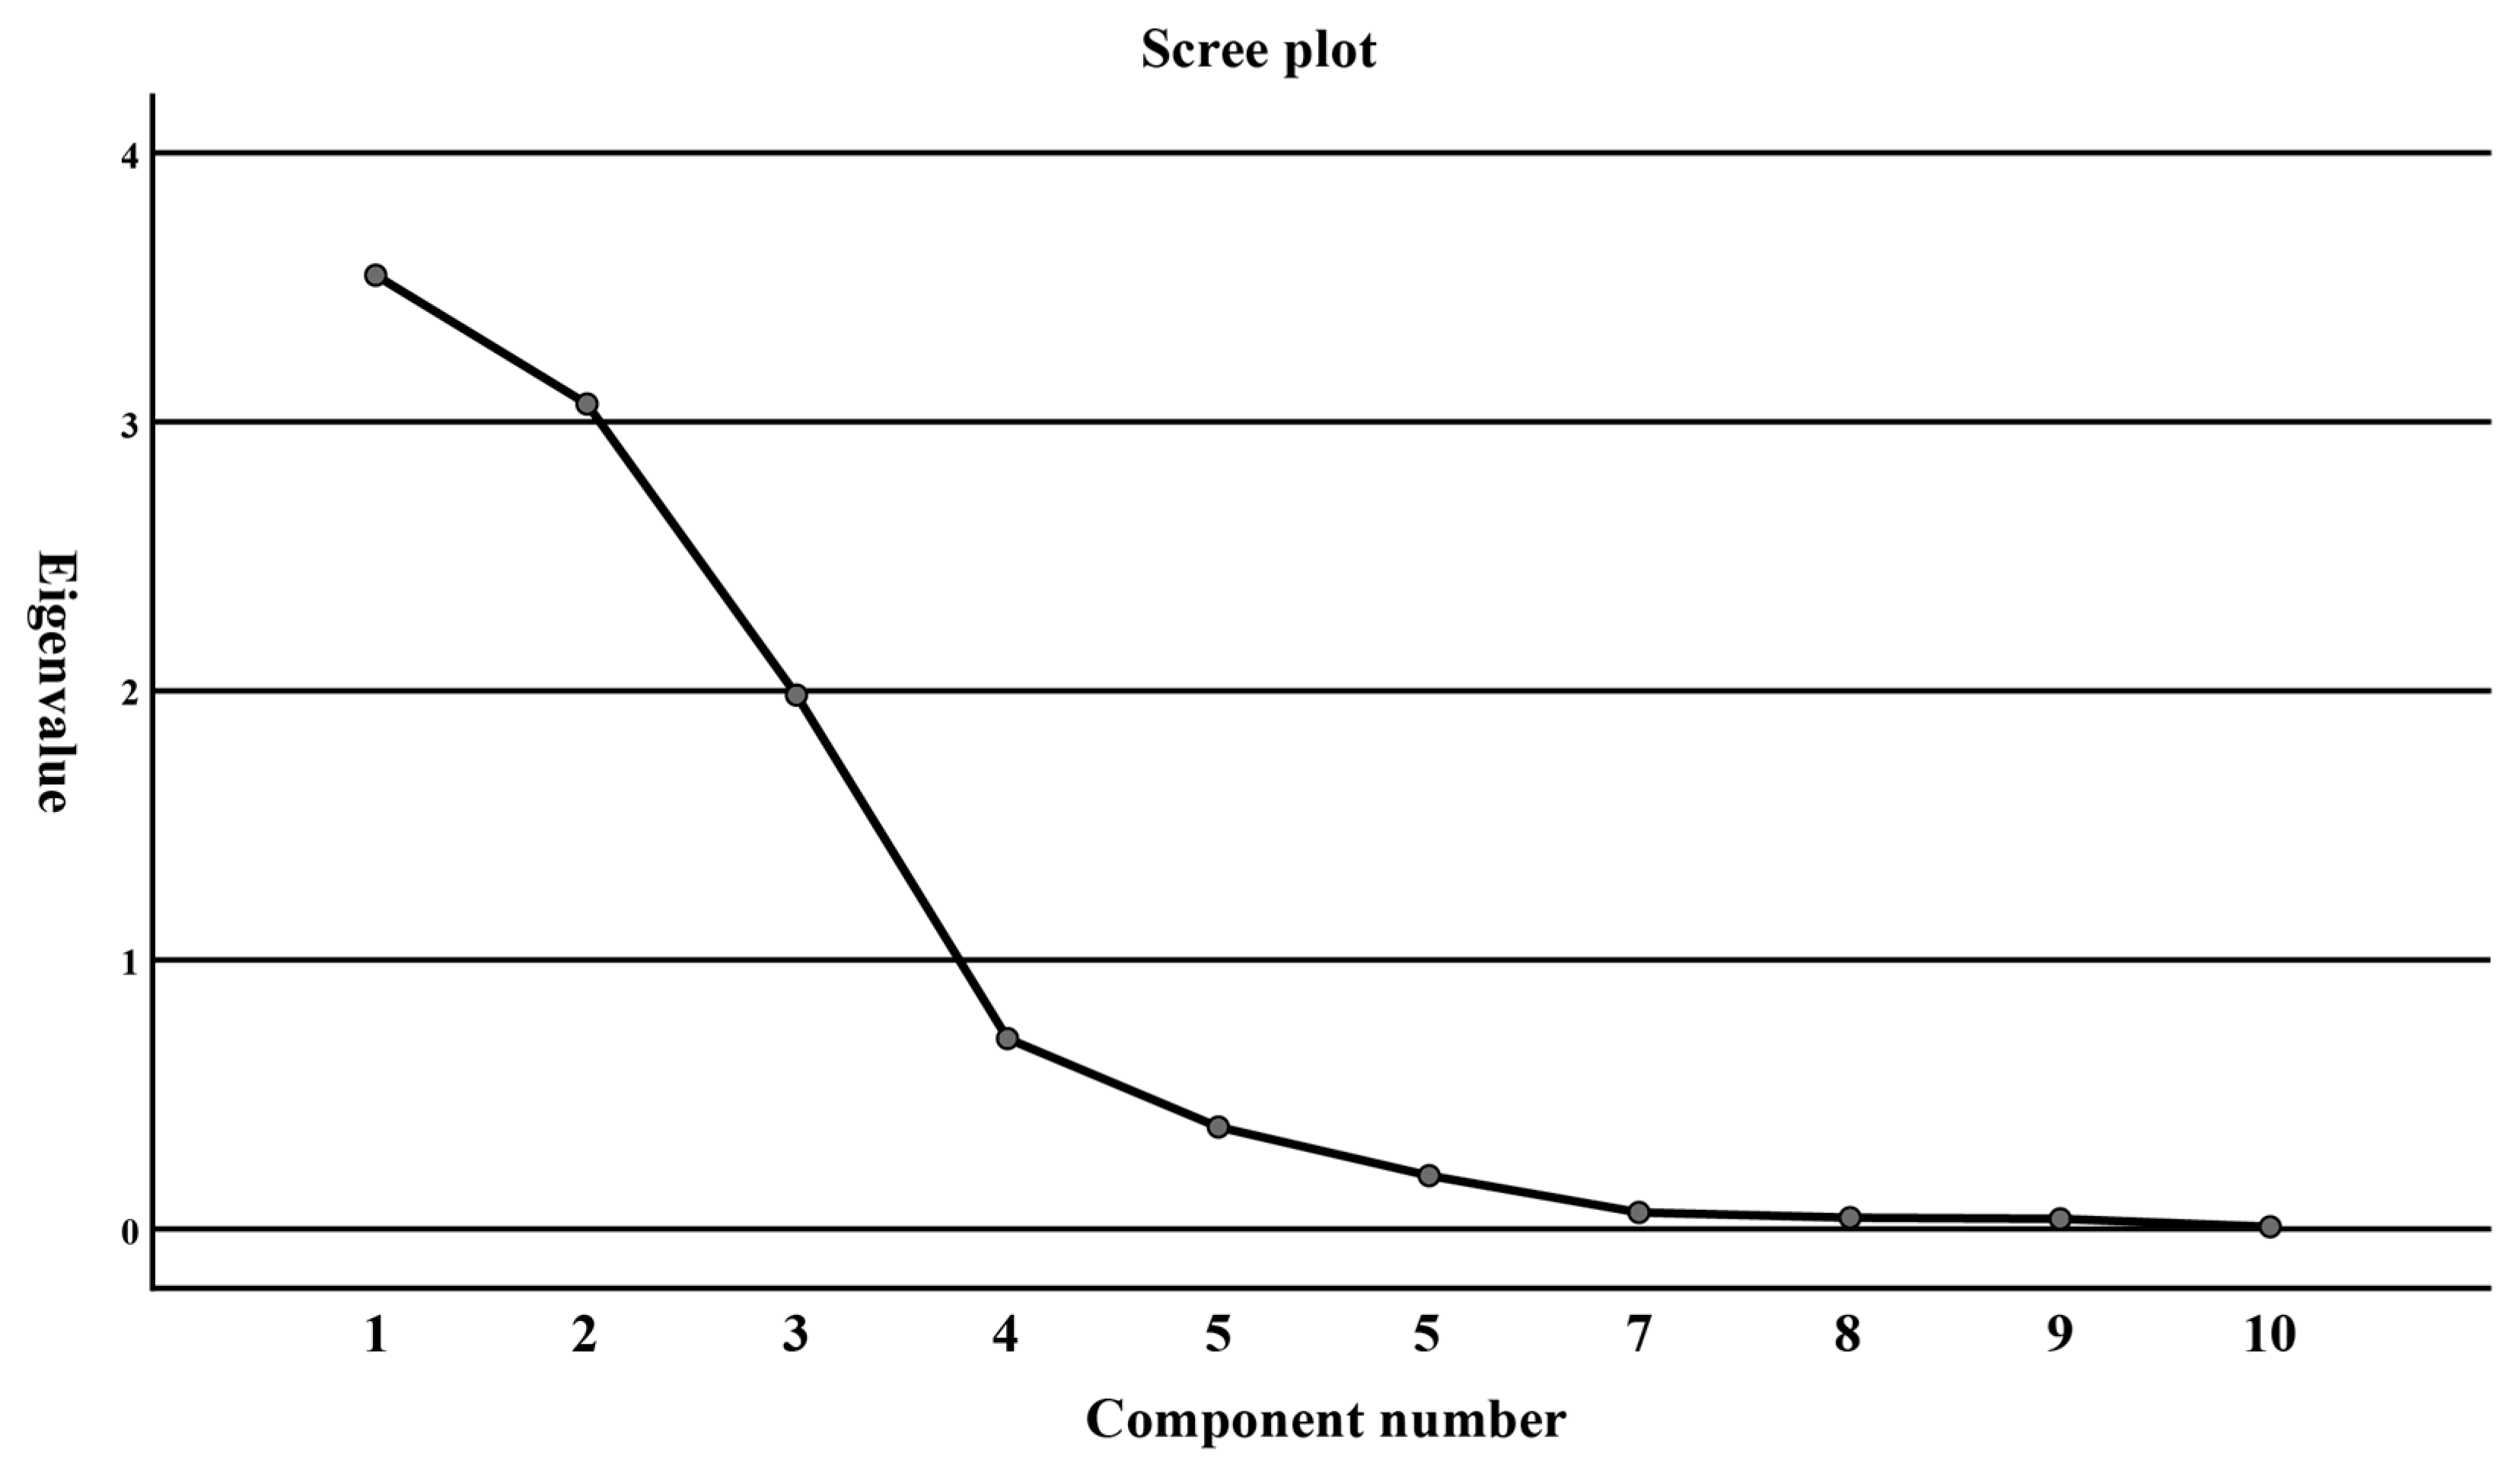
3.3. Principal Component Analysis
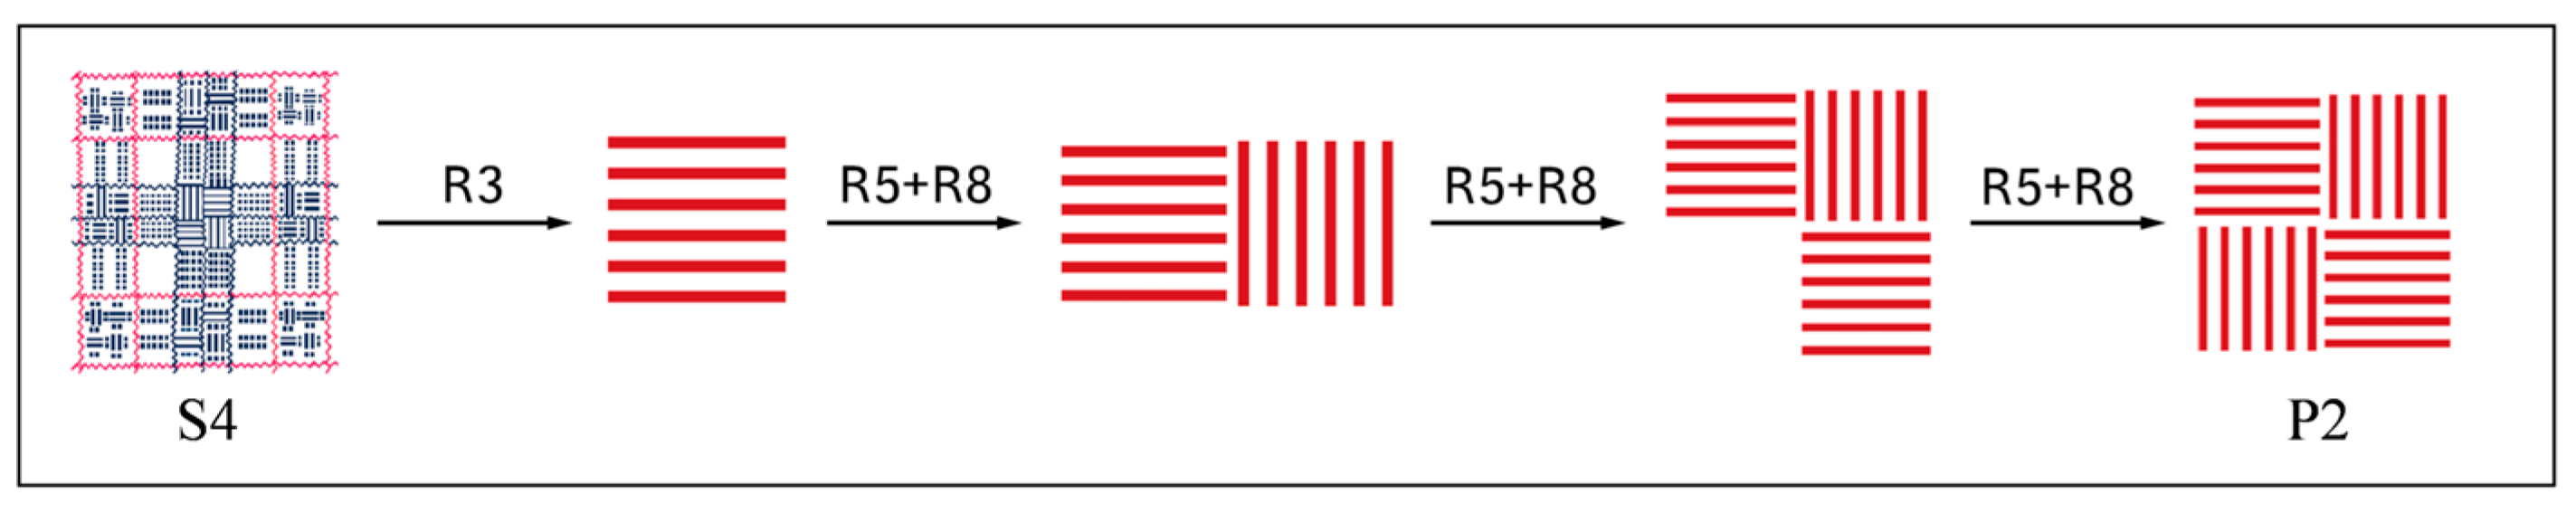
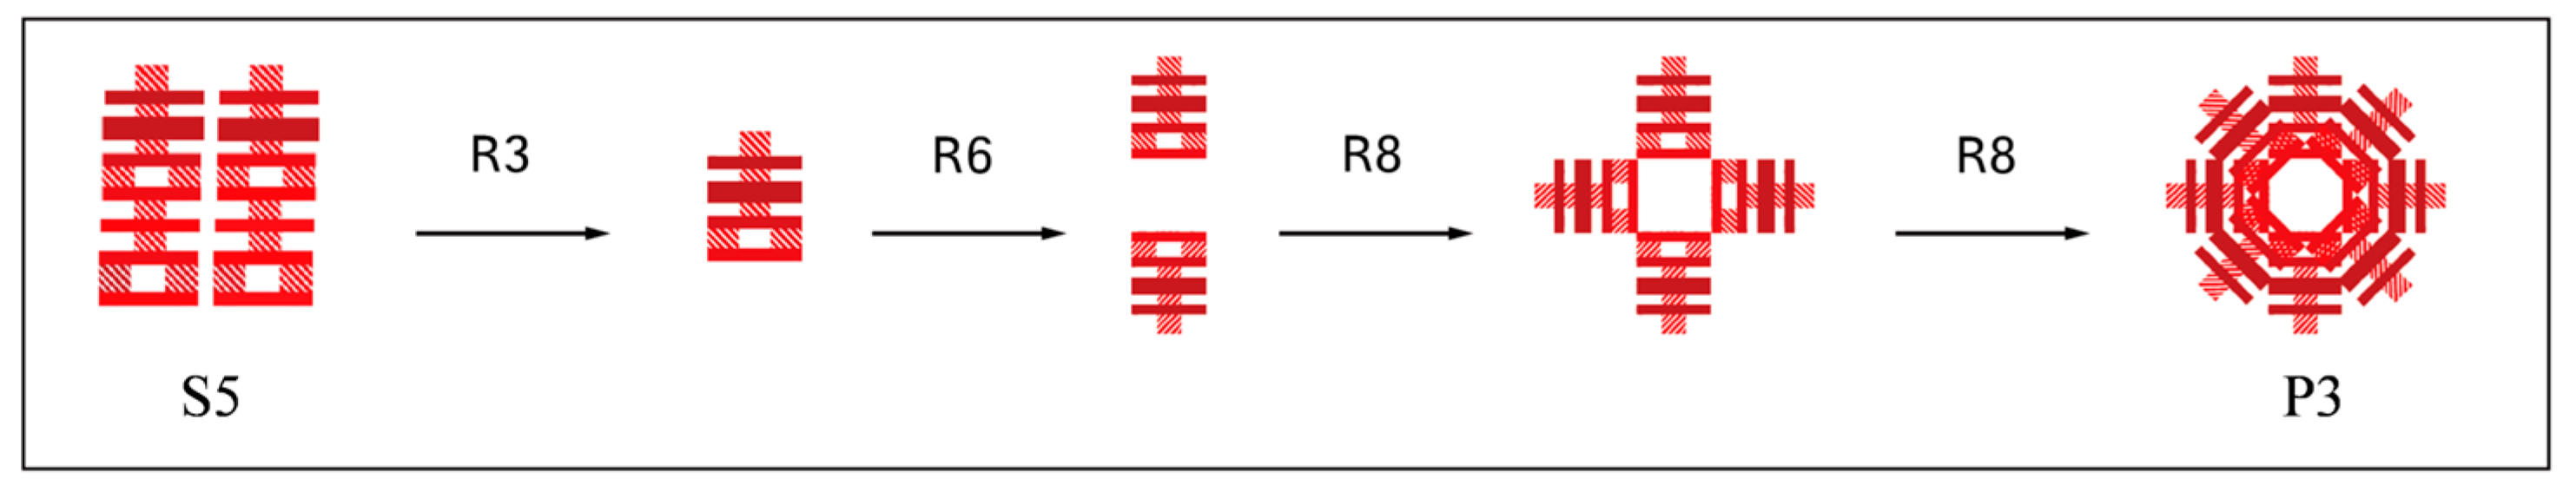
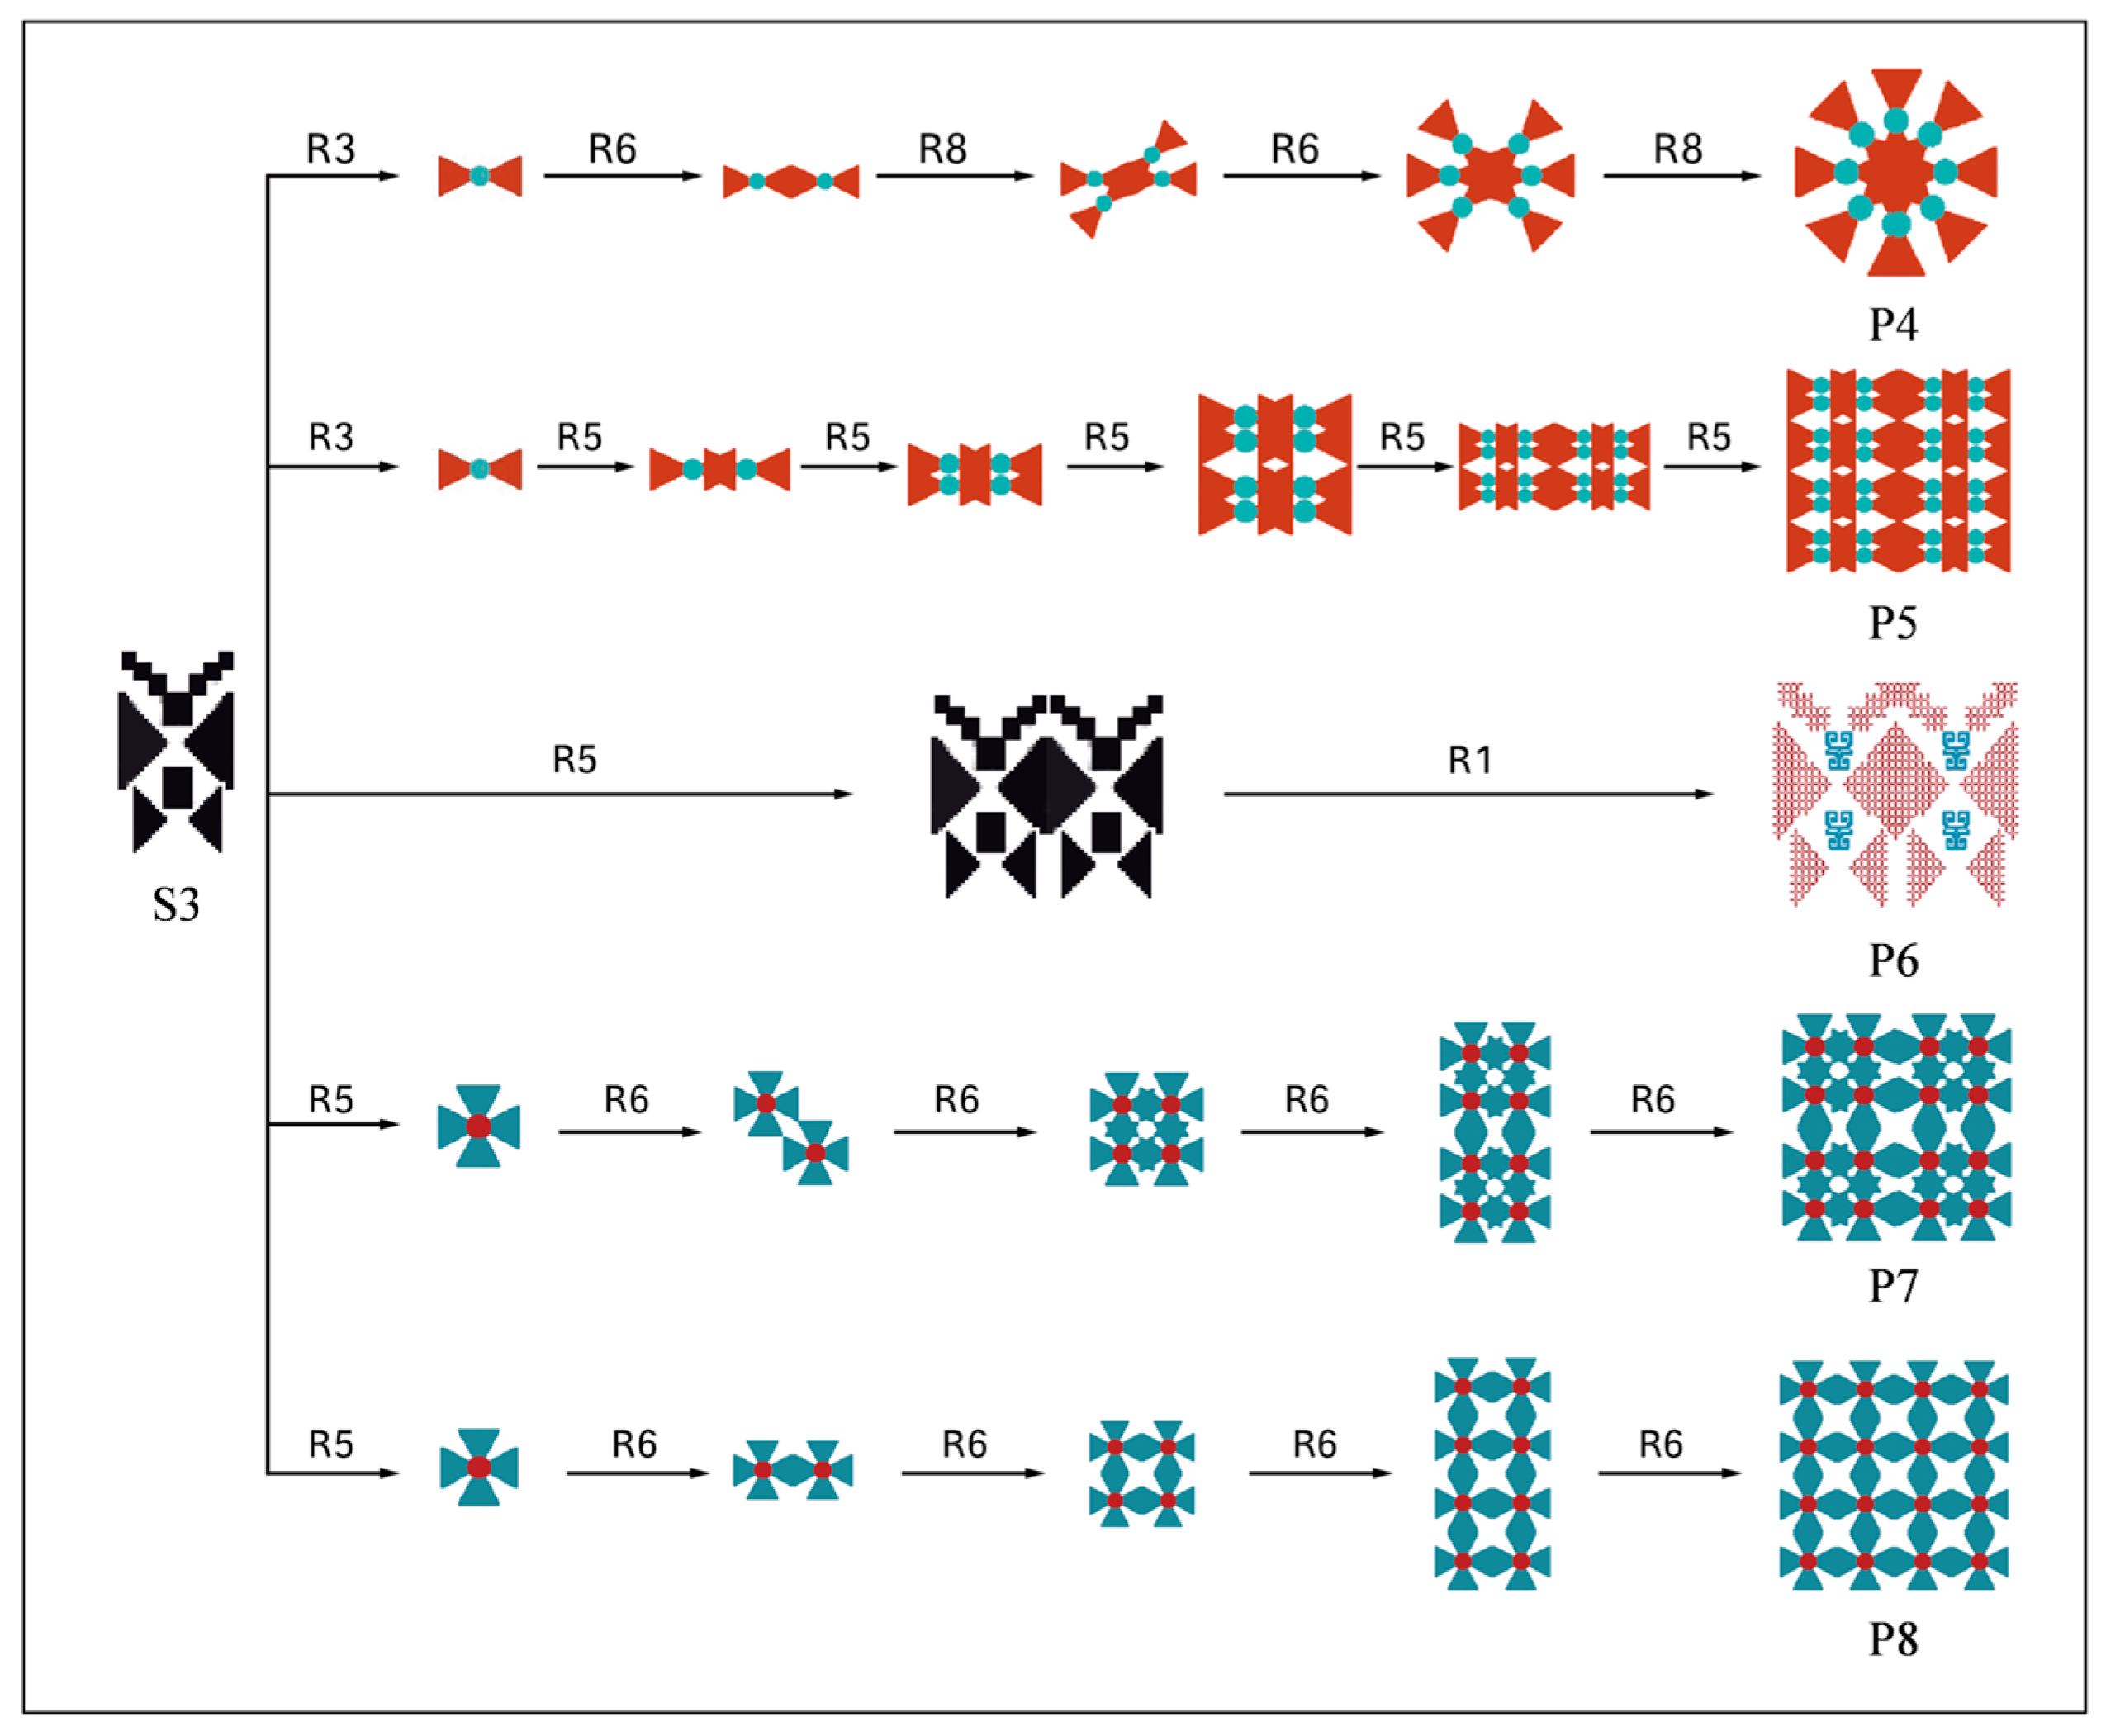
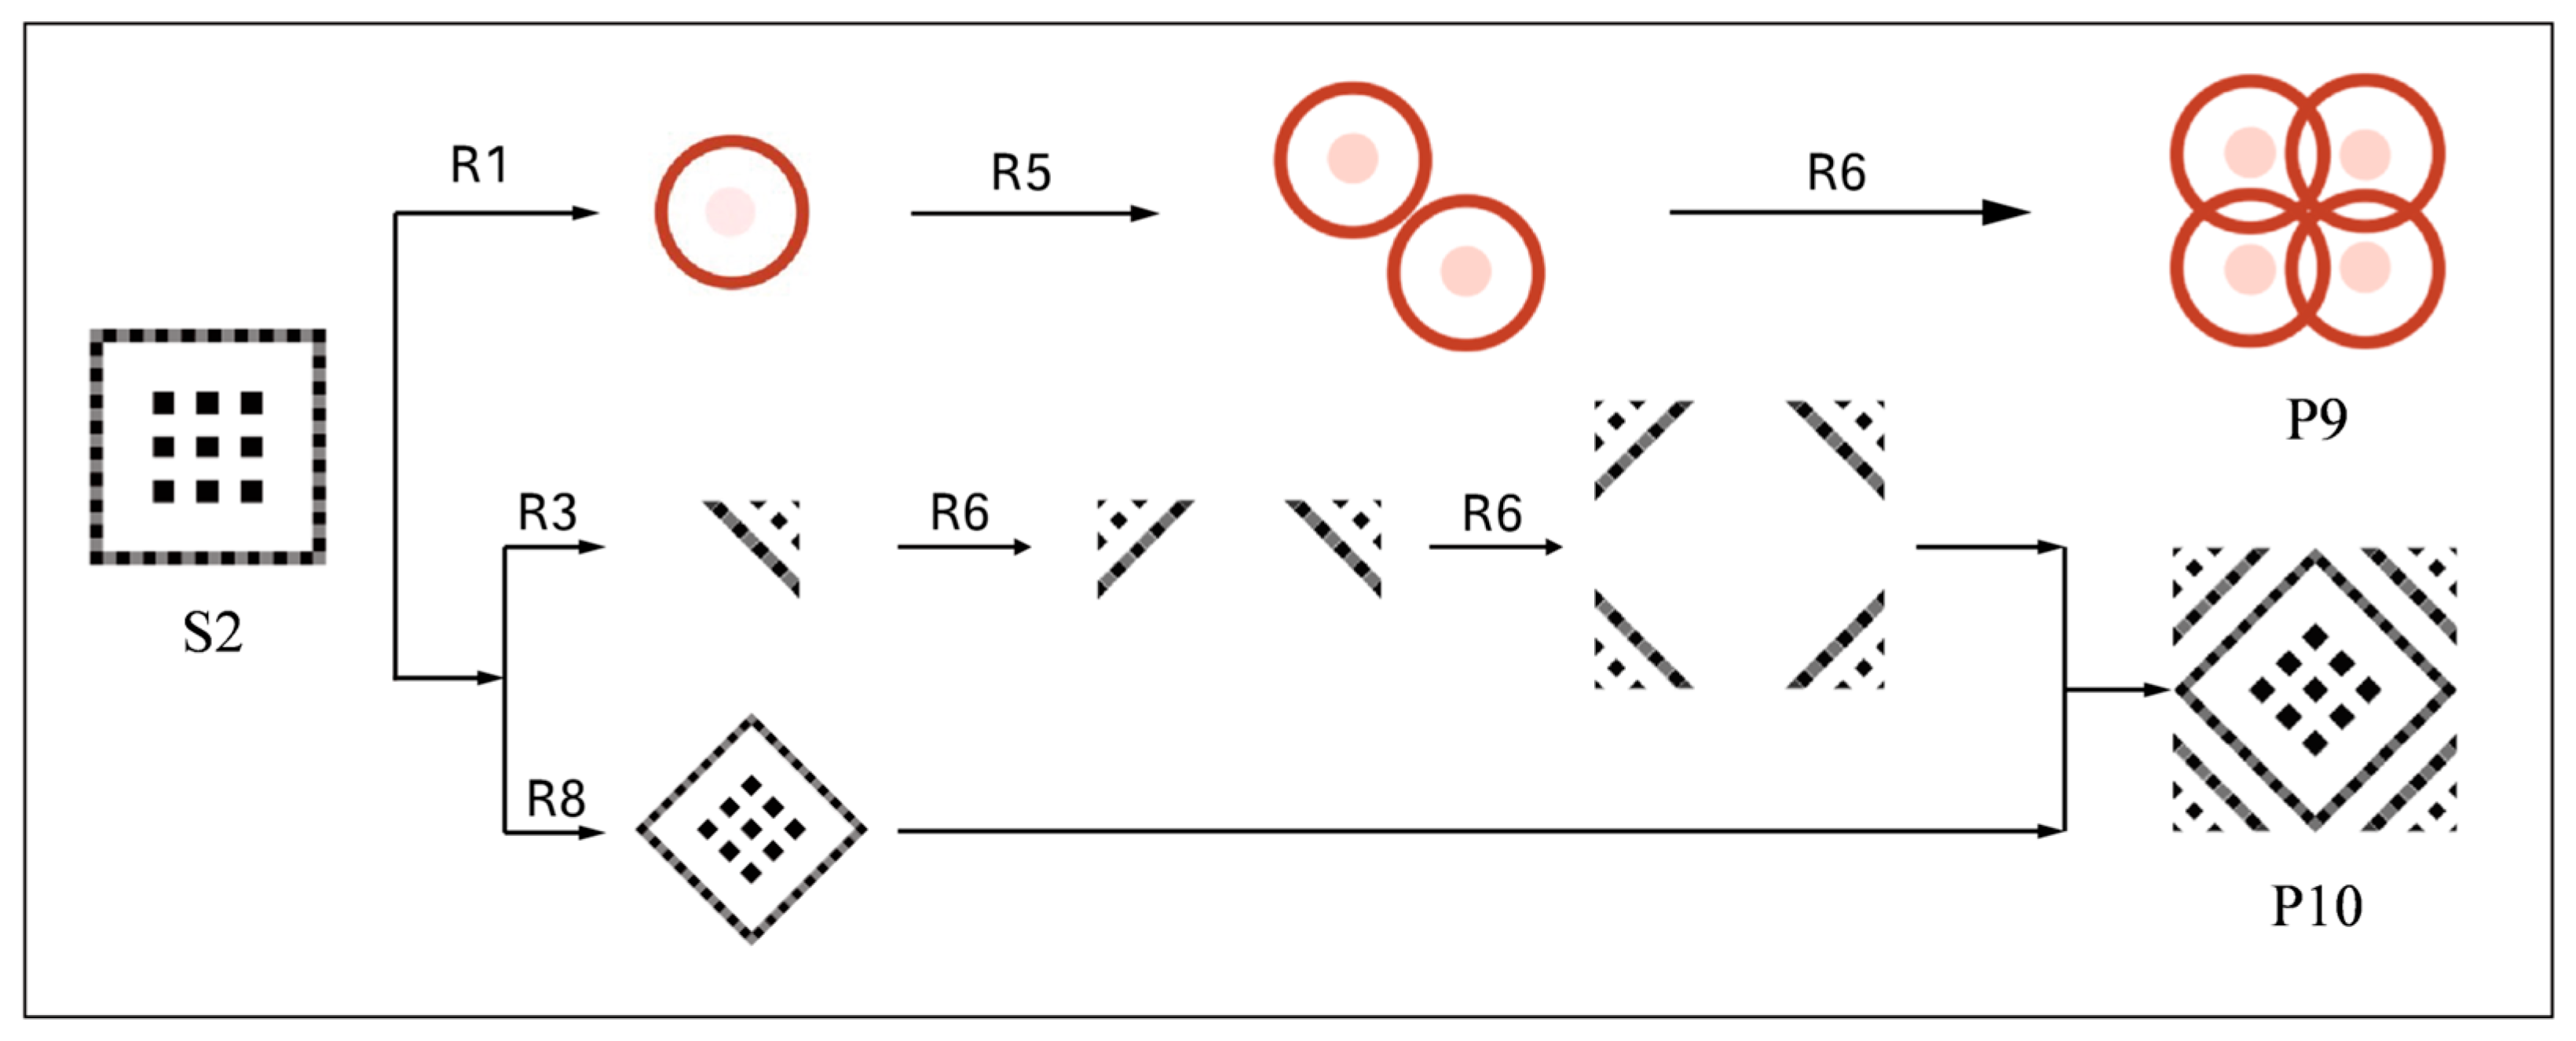
PCA, as a commonly used dimensionality reduction technique in the design field, can effectively refine the key information of design elements, simplify the high-dimensional data structure, and help design decisions [19]. This method linearly transforms original variables into a new set, reducing data dimensionality while preserving maximum information. In this study, PCA analyzes consumers’ emotional feedback on various HFoJ TPs to extract key emotional factors influencing design innovation. By simplifying data complexity, PCA provides a scientific basis for TP redesign. It enables designers to identify elements that most strongly evoke emotional resonance, ensuring design schemes meet modern consumers’ emotional needs.

3.4. Shape Grammar

SG is a rule-based method used to generate and modify geometric forms, capturing a product’s visual language and guiding its design logic [20]. As a structured design approach, SG enables designers to trace design evolution, organize creative ideas, and make informed decisions through clearly defined transformational rules [21]. SG generates new shapes through a series of deductive rules, which include proportional changes, mirror transformations, rotations, etc. The basic framework of SG can be expressed as:
S G = S , L , R , I
Among them, S is the set of shapes, L is the set of symbols, R is the set of deductive rules, and I is the initial shape. According to the differences in deductive rules, SG is divided into generation rules and modification rules. By combining the principal components extracted by PCA, forms that meet the design requirements can be generated through the application of deductive rules. Table 1 shows the 11 basic deductive rules of SG.
SG includes 11 basic deductive rules: (1) Replacement: Replace all or part of the original shape with other shape curves. (2) Addition: Add new shape components to the original. (3) Deletion: Delete all or part of the original shape curves. (4) Scaling: Adjust the size of a shape; if P > 1 , it enlarges; if 0 < P < 1 , it is reduced; when P x P y , it performs non-uniform scaling. (5) Duplication: Duplicate a shape C times and translate it by a displacement D. (6) Mirror: Reflect the shape across a specified axis; if k x = 1   and   k y = 1 , the shape is mirrored along the Y -axis. (7) Shearing: Alter shape coordinates based on share values h x   and   h y on the x and y axes. (8) Rotation: Rotate the shape around the origin by angle θ . (9) Fine-tuning: Fine-tune the position using Δx and Δy shifts. (10) Merging: Combine two or more shapes into one. (11) Translation: Move the shape along the x and y axes by Δ x and Δ y .

3.5. Fuzzy Hierarchical Analysis

The FAHP is a multi-criterion decision-making method that combines fuzzy set theory and the AHP. It is widely used in complex decision-making problems, especially when there is uncertainty and ambiguity in the decision-making process [22]. The FAHP decomposes the decision-making process into three levels: the objective layer (overall goal), the criterion layer (evaluation dimensions), and the sub-criterion layer (specific evaluation indicators):
(1) In this study, the decision problem is structured into a hierarchical model consisting of three layers. This structured model provides a clear and scientific foundation for prioritizing design elements;
(2) To evaluate the relative importance of indicators, experts perform pairwise comparisons using a 0.1–0.9 fuzzy scale (Table 2). This results in a fuzzy complementary matrix:
A = a 11 a 12 a 1 j a i 1 a i 2 a i j
where 0 <   a i j < 1 ,   a i j + a j i = 1 ,   a i j = 0.5 , ( i = j ) .
Next, the matrix A is summed by rows:
a i = k = 1 n   a i k , i , k = 1,2 n
(3) Calculating Fuzzy Weights: Based on fuzzy theory, process the constructed judgment matrix to obtain the weight values of each index. Specifically, calculate the consistency index (CI) and the consistency ratio (CR) to evaluate the consistency level of the judgment matrix. When the consistency ratio of the judgment matrix meets the established criteria, the calculated weight values can be considered valid and then used for subsequent in-depth analysis and decision-making support.
Find the weight vector WI for each factor:
w i = 1 n 1 2 α + a i n α
W I = [ w 1 , w 2 w n ] T
α = n 1 2 in the formula.
Constructing the weighting matrix.
w i j = α w i w j + 0.5
(4) Consistency check: The consistency check is an important step to ensure the consistency of expert judgments:
C I A , W = i = 1 n   j = 1 n   w i j a i j n 2
Then, calculate the consistency ratio CR and its formula is:
C R = C I R I
Among them, RI is the random consistency index (it is an average consistency index calculated through a large number of random judgment matrices, serving as a benchmark value for measuring the consistency of judgment matrices), which depends on the number of criteria n . If the consistency ratio C R 0.1 , the judgment matrix is considered to have acceptable consistency. Otherwise, the expert’s judgment needs to be re-evaluated [23].

3.6. QFD

QFD ensures the product design aligns with customer requirements (CRs) by converting emotional needs into engineering characteristics (ECs) [19]. This study integrates PCA-extracted emotional factors as CRs and evaluates ten design schemes (P1P10) via the House of Quality. The relationship matrix quantifies how well each scheme satisfies CRs. Weighted calculations, based on expert-assessed CR importance and scheme relevance scores, derive design priorities [24]:
A j = W i × R i j i = 1 n   W i × R i j
QFD thus offers a structured basis for optimizing HFoJ TPs, enhancing emotional appeal and cultural value.

3.7. Grey Relation Analysis

GRA is a multi-factor evaluation method suitable for incomplete or uncertain data, particularly aligning with the small sample size and limited historical data of HFoJ patterns [25]. This study applies GRA to evaluate ten application schemes of TPs in home textiles. After data preprocessing, values are normalized:
y i j = x i j min x j max x j min x j
Then, the grey correlation coefficients ε i j + are calculated to assess closeness to the optimal solution:
ε i j + = m i n i   m i n j   G i   y i j + ξ m a x i   m a x j   G i   y i j G i   y i j + ξ m a x i   m a x j   G i   y i j
Among them, ξ is the distinguishing coefficient, ξ 0,1 , and is generally set to 0.5 and y i j is the weighted normalized decision-making matrix.
Further, compute the relational degrees Z j + ,   Z j and relative relational degree Z j to rank design schemes. GRA thus provides a reliable basis for optimizing HFoJ pattern application in line with user expectations:
Z j + = 1 m i = 1 m   ε i j +
z j = Z j + Z j + + Z j

4. Case Study

4.1. Collection and Classification of Affective Vocabularies

To collect the affective vocabularies of the HFoJ, this study employs the Affinity Diagram method. Participants from diverse backgrounds are invited to list the vocabulary related to the patterns of homespun cloth based on their personal, intuitive feelings and associations. Subsequently, the collected vocabulary is presented in the form of group discussions to ensure the diversity and comprehensiveness of the information. Finally, all the vocabulary is summarized and presented, providing data support for subsequent research and creative work.
To extract the key perceptual factors, this study uses PCA to conduct a further analysis of the collected emotional vocabulary. This study selects 20 representative sample pictures of the TPs of HFoJ, providing materials for the subsequent PCA. The specific samples are shown in Figure 2. To ensure the reliability and effectiveness of the analysis results, this study sets up a seven-level semantic scale for these 20 samples and forms a questionnaire. A total of 200 questionnaires were distributed in this survey (Figure 3) and 187 valid questionnaires were retrieved, with an effective recovery rate of 93.5%. Finally, statistical software is used for random calculations. After obtaining the mean value of each emotional vocabulary, the PCA is carried out.
First, analyze whether the research data are suitable for PCA. As can be seen from Table 3, the KMO value is 0.605, which is greater than 0.6 and meets the prerequisite requirements for PCA, indicating that the data can be used for PCA research. In addition, the data have passed Bartlett’s sphericity test (p < 0.05), suggesting that the research data are suitable for PCA.
According to the total variance explanation in Table 4 and the scree plot in Figure 4, the eigenvalues of the first three principal components are all greater than 1 and the cumulative variance contribution rate reaches 85.822%. Meanwhile, the slope change trend of the scree plot further supports the selection of extracting three principal components. Finally, three principal components are extracted for further analysis.
As shown in Table 5, the factor loading matrix after rotation reveals that the loading coefficients of the three principal components all exceed 0.7, including their significant explanatory effect on the data. In Principal Component 1, words like “elegant”, “rhythmic”, “plain”, and “homely” have high loadings so it is named “Aesthetic Features”. Principal Component 2, composed of “Symmetrical”, “Settled”, and “True quality”, is named “Art Style”. In Principal Component 3, words such as “Personal”, “Artisanal”, and “Profound” have high loadings and it is named “Life Charm”. The specific classification results are summarized in Table 6.

4.2. Pattern Sorting and Reconstruction

To select five core sample patterns from twenty HFoJ samples, the research team conducted an in-depth analysis of the patterns of the HFoJ. In addition, the team also organized experts in related fields for discussions. After discussions and analyses, five representative core sample images were finally determined. As shown in Figure 5, the codes are extracted as S, S = { S 1 , S 2 , S 3 , S 4 , S 5 } . Through meticulous extraction and collation of the key elements, such as the shapes and lines of these patterns, an initial pattern set is constructed.
After extracting the representative patterns of HFoJ and the characteristics of regional cultural symbols, it is necessary to formulate design restriction rules for home textile products to ensure their practicality and aesthetics. The rules mainly cover size limitations, the distribution of patterns on different fabrics, and their coordination between patterns and product shapes. Based on the above rules, SG operations are carried out through design software and, ultimately, pattern elements suitable for HTD schemes are obtained.
Scheme P1 is the variation process of the grid pattern, as shown in Figure 6. Firstly, according to Rule R3, partial deletion operations are carried out on the original grid pattern to remove redundant parts. Then, by applying Rules R5 and R8, the elements of the pattern after deletion are combined and transformed to construct a new basic element. Rule R8 is continuously applied and two rotation operations are carried out to make the outline and structure of the pattern complete and harmonious. Subsequently, Rule R5 is applied twice to copy and arrange the formed elements, enhancing the visual effect. Finally, with the help of Rule R4, the pattern is reduced in size according to the principle of equal proportion and the elements of each part are combined to finally form a new pattern.
The derivation process of Scheme P2 is shown in detail in Figure 7. Firstly, according to Rule R3, a part of the original element is intercepted. Subsequently, Rule R5 and Rule R6 are applied three times to perform rotation and mirroring operations on the intercepted part, resulting in new sub-elements.
The derivation process of the “Double Happiness” cloth (S5) in Scheme P3 is shown in detail in Figure 8. Firstly, according to Rule R3, a deletion operation is carried out on the original pattern, removing one-third of it. Then, Rule R6 is applied to create an axially symmetric pattern, breaking the limitation of the original pattern. Subsequently, Rule R8 is applied twice, making the deformed pattern more visually appealing and design oriented.
Schemes P4–P8 are designed and derived around the butterfly pattern (S3) (Figure 9). Firstly, according to Rule R3, the original butterfly pattern is deleted and only the middle part is retained. Then, Rule R6 is applied to copy the retained part, making it slightly overlap with the original pattern to add a sense of hierarchy. Finally, Rules R6 and R8 are comprehensively used to perfect the pattern, creating a new element with a fuller shape (P4).
Scheme P5 presents the second innovative variation of the butterfly pattern. According to Rule R3, the original butterfly pattern is screened and the middle core part is retained. Subsequently, Rule R5 is applied five times to copy and arrange the retained part, constructing a new grid-like pattern. Compared with the original pattern, the new pattern has a more compact shape and a more regular structural layout.
Scheme P6 demonstrates the third variation path of the butterfly pattern. Copy the original butterfly pattern according to Rule R5. After obtaining the copy, use Rule R1 to replace the internal structure and elements of the copy and embed new elements that conform to the design concept, enriching the content and form of the butterfly pattern.
Scheme P7 presents the fourth evolution. In the design process, according to Rule R5, the wing parts of the butterfly pattern are combined to construct the basic shape. Then, the mirror transformation operation of Rule R6 is carried out continuously three times. The combined wing patterns are mirror-copied at different angles and positions to form a new combined pattern, which improves the adaptability of the pattern and can better meet the design requirements.
The variation of Scheme P8 is similar to that of P7. At the beginning of the design, according to Rule R5, the wing parts of the original pattern are extracted and combined to construct the basic shape. Then, the transformation of Rule R6 is carried out to make all the transformed patterns closely connected without overlapping, forming a regular folding area. Through this process, the new pattern has simpler lines, a more regular layout, and a clean and neat overall visual effect.
The derivation processes of Schemes P9 and P10 are shown in detail in Figure 10. Firstly, using Rule R1, the original square outer frame is replaced with a circular one, making the pattern more concise. Subsequently, Rule R5 is applied to copy the elements. Finally, with the help of Rule R6, the elements are mirrored to create intersections between them, further adding details.
Scheme P10 presents the second innovative variation path of the cat’s paw pattern (S2). According to Rule R3, a deletion operation is carried out on the original pattern to remove some redundant structures. Then, Rule R6 is applied twice to mirror-copy the elements of the pattern after deletion to enrich the visual hierarchy. Meanwhile, Rule R8 is used to rotate the original elements. A framework for the new pattern is built, shaping the base form.

4.3. Assign Weights to Affective Vocabularies

After collecting and classifying the affective vocabularies, this study uses the FAHP to assign weights to the affective vocabularies to comprehensively analyze consumers’ emotional demands and preference tendencies towards the TPs of the HFoJ in HTD.
When assigning weights to affective vocabularies using the FAHP, the categories of affective vocabularies (Aesthetic Features E1, Art Style E2, Life Charm E3) are defined as the criterion layer, the perceptual factors (ten affective vocabularies, such as Elegant E11, Rhythm E12, Plain E13, etc.) are defined as the sub-criterion layer, and a model is established, as shown in Figure 11.
Thirteen experts (three textile history scholars, five home textile designers, and five folk culture researchers) scored aspects such as the color, pattern, and cultural connotations of the patterns. To quantify the judgment matrix, a ratio scale method ranging from 0.1 to 0.9 was adopted for assignment and numerical values were used to represent the different degrees of importance between every two elements. Through discussion and analysis, the evaluation results of the experts tended to be consistent. Calculations were carried out according to Formulas (1)–(7) and, finally, the weights of the criterion layer, the sub-criterion layer, and each evaluation index were obtained. Subsequently, a consistency test was conducted on the calculation results and the specific data are shown in Table 7 and Table 8.

4.4. Pattern Scheme Ranking and Design Practice

The previous section utilized SG to generate ten design element schemes. To accurately match user needs with pattern design, this study adopts the QFD quality house method to construct a mapping model of “users’ core affective vocabularies—symbols of HFoJ patterns”. To associate users’ perceptual cognition of home textile products with the symbolic features of HFoJ patterns, the potential needs of users are deeply explored, providing a scientific basis for the subsequent screening of pattern designs that best meet users’ expectations and optimizing the design schemes of home textile products.
In the basement part of the quality house, with the help of Formula 8, the weights of cultural symbols and the rankings of the schemes are obtained. Finally, based on the QFD method, a HOQ, as shown in Figure 12, is constructed. The research results show that the weights of cultural symbols of Schemes P3, P9, P2, and P4 are 5.3406, 4.0999, 4.099, and 4.0299, respectively, ranking among the top four in all the schemes. Therefore, Schemes P3, P9, P2, and P4 are selected as the design elements for HFoJ home textile products.

4.5. Decision Making for Home Textile Scheme Design

Based on the four types of design elements (P3, P9, P2, P4) extracted by the QFD method, the design work of home textile products is carried out. The unit patterns are organically connected in series, enhancing the visual unity and harmony of the home textile products. Through a series of design practices and adjustments, three design schemes for home textile products are finally designed, and the specific scheme display is shown in Figure 13.
In the research on the innovative design of HFoJ home textile products, three design schemes (G1–G3) were evaluated across five dimensions: Pattern Innovation (N1), Home Textile Applicability (N2), Market Acceptance (N3), Degree of Cultural Inheritance (N4), and Personalization Potential (N5). Home textile applicability ensures that patterns match product functions and styles, optimizing both practicality and aesthetics. Market acceptance directly reflects product viability in the market, impacting commercial value. The personalization potential caters to the trend of personalized consumption, meets diverse aesthetic needs, expands market coverage, and boosts brand competitiveness.
Ten design experts were invited to score each scheme, with the final score for each scheme calculated as the average of the expert evaluations. The expert scoring scale ranged from 0.1 to 0.9, where 0.1 indicated extreme inappropriateness and 0.9 signified extreme appropriateness. The detailed scoring results are presented in Table 9. Using Formulas (9)–(12), the relevant connection numbers for each indicator and the correlation degree rankings were calculated, as shown in Table 10.
The relative correlation degree reflects the closeness of each scheme to the ideal state. The higher the value, the better the scheme. According to the calculation results, the ranking of the relative correlation degrees of each scheme is: G1 > G2 > G3. Therefore, among the schemes for applying TPs of the HfoJ to modern HTD, Scheme G1 is the best choice.

5. Discussions

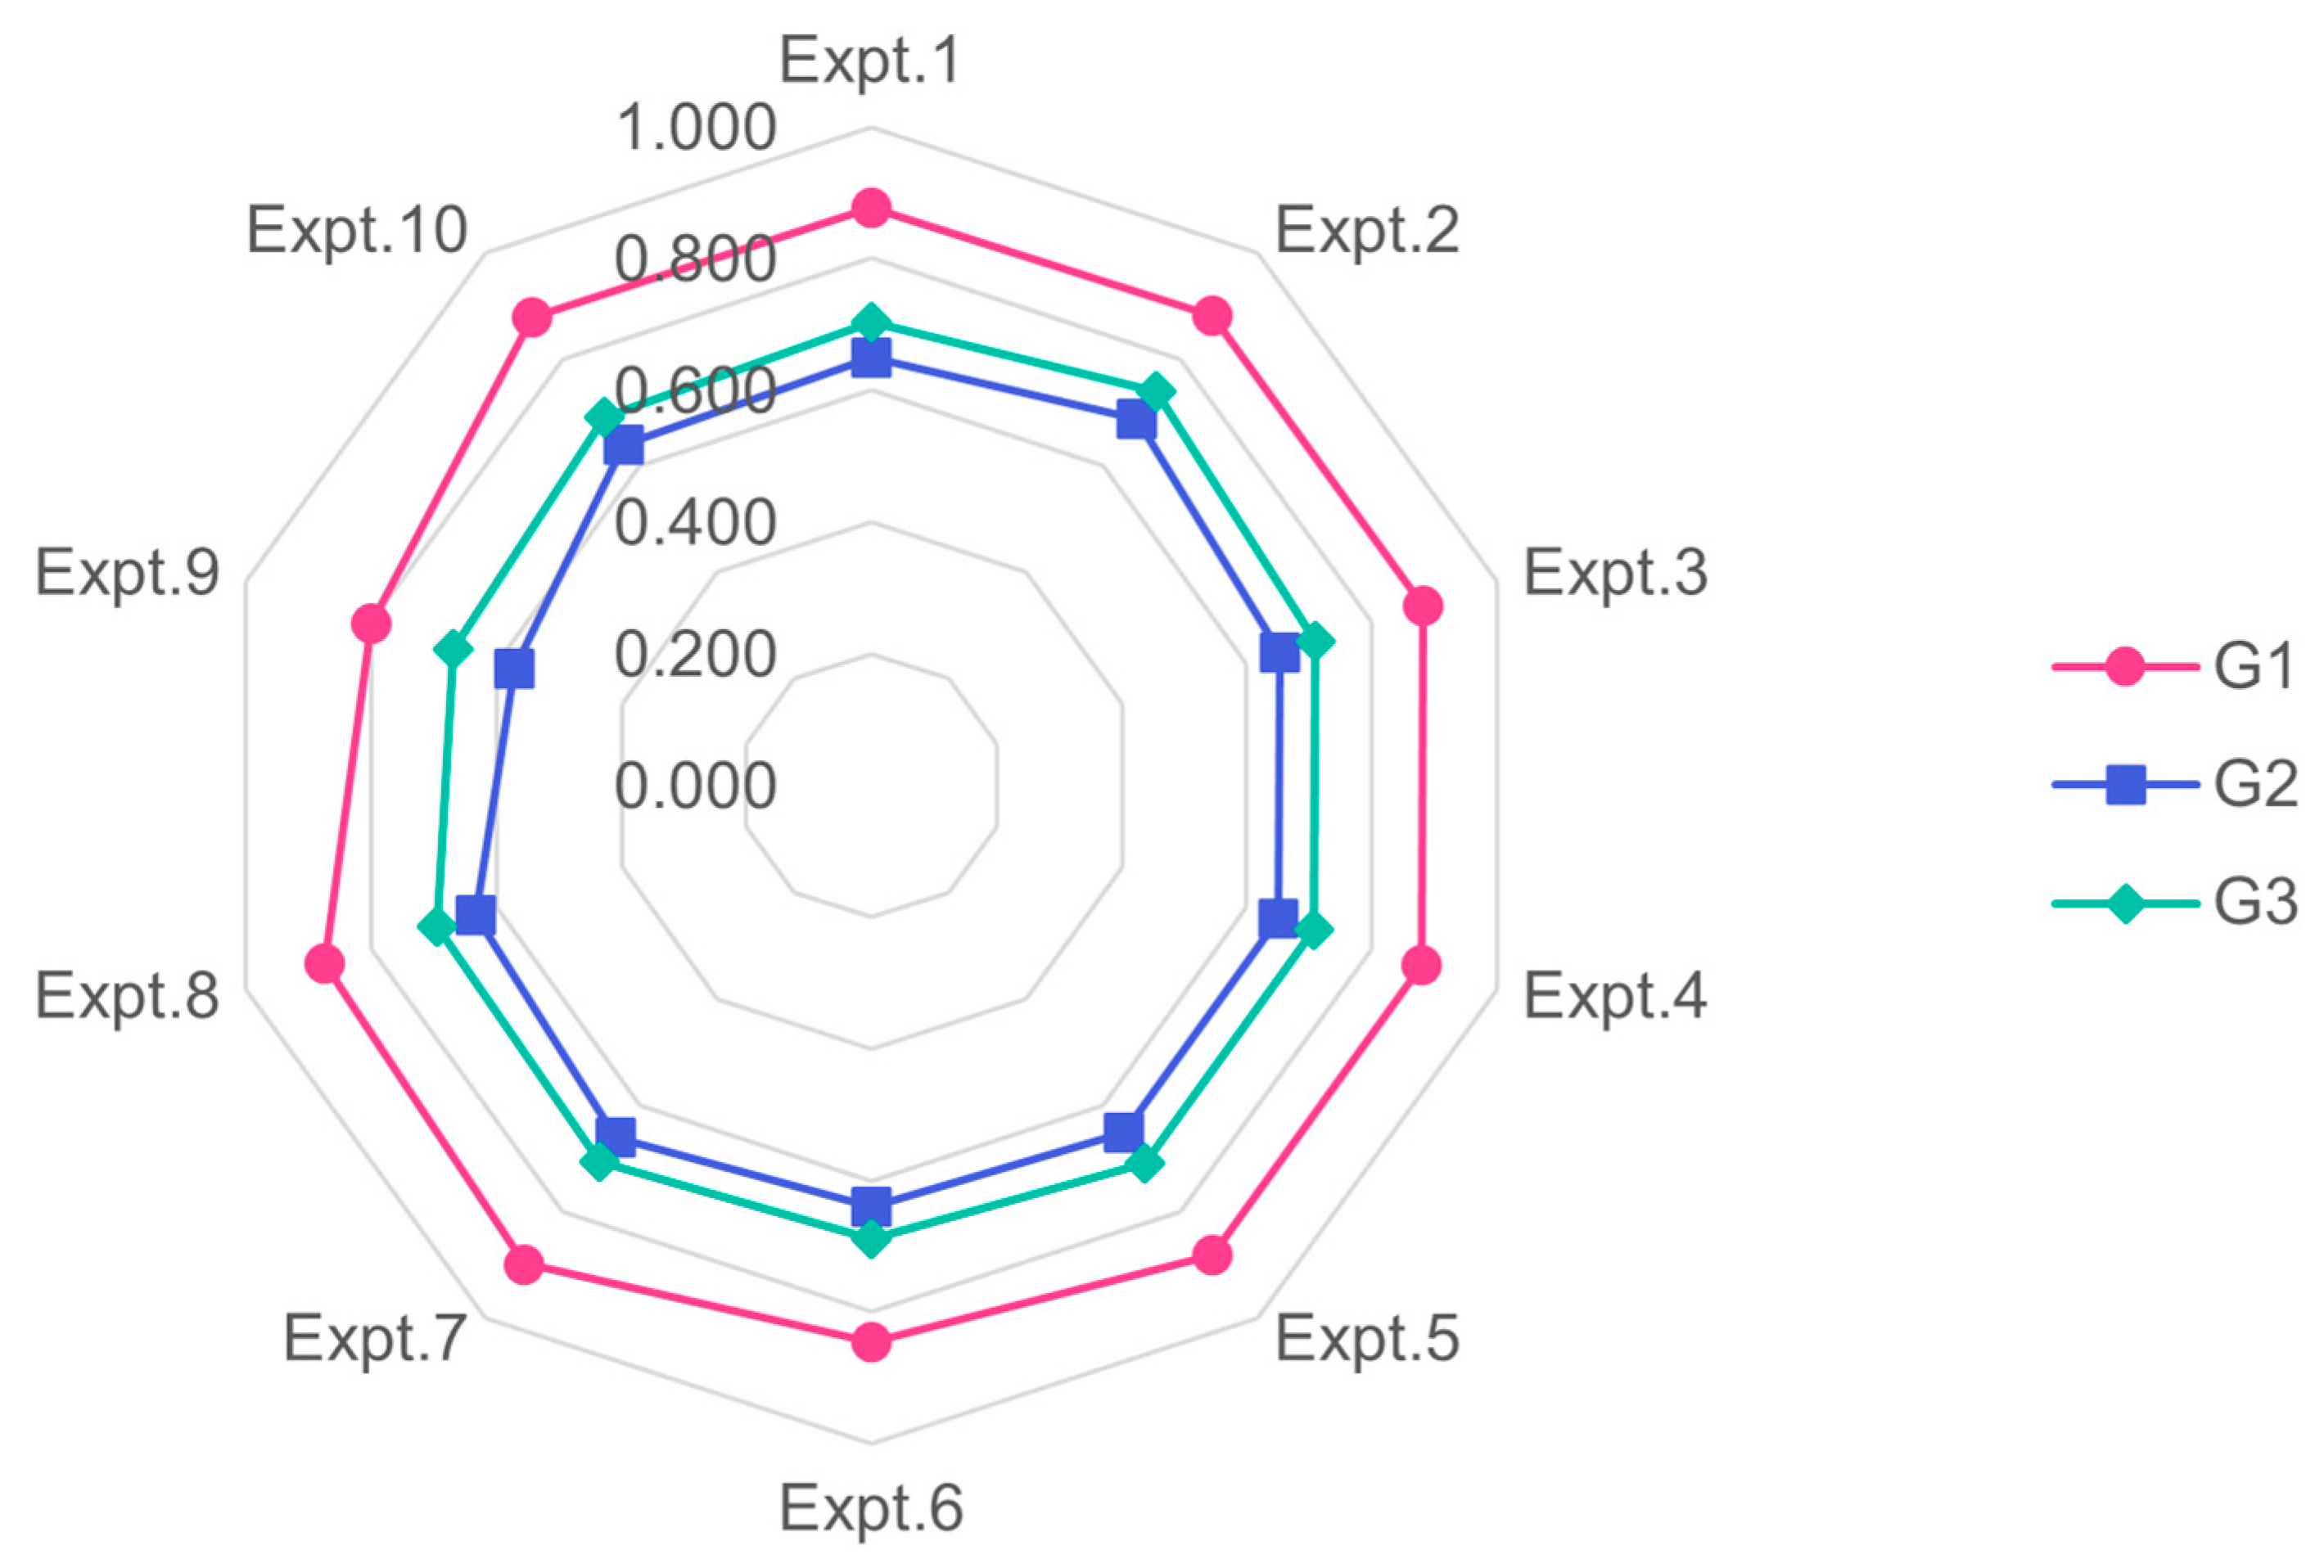
5.1. Sensitivity Analysis

To assess the sensitivity of various indicators in the decision-making process and explore the impact of these changes on the final decision, this paper carried out a series of sensitivity analysis experiments. The research shows that sensitivity analysis is extremely effective in determining the weights of indicators and screening the design schemes of traditional HFoJ patterns [26]. In the experiments, adjust the weight values to test their impact on the final decision. In the case of uncertainty, sensitivity analysis is extremely effective for determining the weights of indicators and screening the optimal scheme for the traditional HTD of the HFoJ.
A total of 10 experiments were conducted and the detailed records are shown in Appendix A. In the first five experiments, we set the weights of all indicators to the same values, specifically 1, 3, 5, 7, and 9. The subsequent experiments (Experiments 6 to 10) involved setting the weight of one indicator to the highest value (9) while gradually setting the weights of the other indicators to the lowest value (1), revealing the potential impact of slight changes in each indicator. The results of the sensitivity analysis are shown in Figure 14. In the 10 experiments, Scheme G1 consistently received the highest score, clearly indicating that Scheme G1 is the best choice among all the design alternatives.

5.2. Comparison with Previous Studies

Compared with previous studies, this research demonstrates significant innovation in both methodological integration and research depth (see Table 11). Zou et al. [3] focused on outlining strategies for cross-cultural fashion design, primarily employing field investigations and the AHP, but lacked a systematic quantitative design process. Miao [4] concentrated on the application of traditional patterns in apparel, emphasizing element integration and market orientation, yet did not establish a comprehensive evaluation framework. Although Shen [5] combined the AHP and GRA to construct an evaluation system, the scope was limited to campus cultural and creative products, with insufficient depth in design innovation. In contrast, this study integrates the Affinity Diagram, FAHP, SG, QFD, and GRA to develop a user emotion–oriented systematic design process, balancing both design innovation and cultural heritage. The research not only promotes the modern transformation of traditional patterns but also expands their application in the field of HTD, demonstrating a stronger theoretical contribution and practical guidance value.

5.3. Home Textile Design Strategies

In the context of cultural preservation and quality-of-life enhancement, the integration of HFoJ patterns into modern home textiles presents both challenges and opportunities. Based on research on cultural symbols, KE, and form perception, the following strategies are proposed:
(1) Emotional Symbolism: HFoJ patterns serve not only functional but also cultural roles. By linking affective vocabularies with traditional symbols (e.g., wedding cloth, reed fence flowers), designers can enhance emotional resonance. Studies show that integrating elements like bamboo weaving lines and colors into modern design effectively triggers consumer identification, especially among younger users;
(2) User Experience via KE: KE helps translate consumers’ emotional and sensory needs into design parameters. Emphasis should be placed on combining functionality with aesthetics while preserving the cultural essence of HFoJ patterns;
(3) Symbolic Innovation: Traditional motifs should be restructured using tools like SG to enhance modern relevance. This approach enables the cultural evolution of HFoJ patterns without losing their symbolic value;
(4) Balance of Tradition and Modernity: Symmetry and pattern rhythm play vital roles in visual stability and psychological comfort. Drawing from examples like the Republic of China cheongsam, incorporating symmetrical innovations allows HFoJ patterns to blend into minimalist modern interiors while retaining cultural depth.

6. Conclusions

This study explores the integration of TPs from the HFoJ into contemporary HTD, focusing on the interplay between pattern symmetry, user perception, and design innovation. By incorporating the Affinity Diagram, PCA, FAHP, SG, QFD, and GRA, this study constructs a comprehensive methodology to translate subjective emotional needs into quantifiable design parameters. The findings demonstrate that SG can effectively generate pattern variations with cultural depth while QFD and GRA provide robust frameworks for linking user emotions with design elements and optimizing alternatives. The optimal scheme (G1) confirms that symmetrical pattern layouts enhance visual order, promote emotional resonance, and improve user experience in home settings.
However, this study is subject to certain limitations. Due to practical constraints, the sample size for emotional and perceptual evaluation was relatively limited, potentially affecting the representativeness of the results. Furthermore, the emotional responses collected may vary across individuals due to cultural or personal cognitive differences, which introduces subjectivity into the analysis. Additionally, while emotional and sensory parameters were addressed through established methodologies, the quantification process for some emotional vocabularies remains generalized, possibly limiting the precision of design guidance.
Future research should aim to expand the sample base to include consumers with diverse cultural, demographic, and aesthetic backgrounds, thereby improving the generalizability and cultural adaptability of design outcomes. It is also essential to refine quantitative tools for emotional and sensory data analysis, particularly in the context of affective vocabulary extraction and parameter modeling. By enhancing the precision and inclusivity of emotional mapping, future studies can further advance the integration of traditional patterns into emotionally resonant, market-relevant home textile products.

Author Contributions

Conceptualization, M.Q.; Formal analysis, M.Q. and X.D.; Methodology, M.Q.; Software, M.Q.; Supervision, X.D.; Visualization, X.D.; Writing—original draft, M.Q.; Writing—review and editing, X.D., J.W. and H.Z. All authors have read and agreed to the published version of the manuscript.

Funding

This research received no external funding.

Data Availability Statement

The original contributions presented in this study are included in the article. Further inquiries can be directed to the corresponding author.

Conflicts of Interest

The authors declare no conflicts of interest.

Abbreviations

The following abbreviations are used in this manuscript:
HFoJHomespun Fabric of Jiangnan
TPTraditional Patterns
CRsCustomer requirements
HTDHome Textile Design
KEKansei Engineering
CIConsistency Index
CRConsistency Ratio
ECsEngineering Characteristics
QFDQuality Function Deployment
PCAPrincipal Component Analysis
FAHPFuzzy Analytic Hierarchy Process

Appendix A

Table A1. Sensitivity analysis experiments.
NODefinitionSample Serial NumberRanking
G1G2G3
Expt. 1ωN1–5 = 10.8790.5540.400G1> G3 > G2
Expt. 2ωN1–5 = 30.8790.5540.400G1> G3> G2
Expt. 3ωN1–5 = 50.8790.5540.400G1> G3> G2
Expt. 4ωN1–5 = 70.8790.5540.400G1> G3> G2
Expt. 5ωN1–5 = 90.8790.5540.400G1> G3> G2
Expt. 6ωN1 = 1, ωN2–5 = 90.8790.6430.491G1> G3> G2
Expt. 7ωN2 = 1, ωN1,N3–5 = 90.8790.6390.485G1> G3> G2
Expt. 8ωN3 = 1, ωN1–2,N4–5 = 90.8790.6310.491G1> G3> G2
Expt. 9ωN4 = 1, ωN1–3,N5 = 90.9590.5260.472G1> G3> G2
Expt. 10ωN5 = 1, ωN1–4 = 90.8790.6490.492G1> G3> G2

References

  1. Lee, S.K.; Koo, S. Development of three-dimensional printed cultural fashion products using symbols of longevity. Text. Res. J. 2022, 92, 4484–4500. [Google Scholar] [CrossRef]
  2. Jowers, I.; Earl, C.; Stiny, G. Shapes, structures and shape grammar implementation. Comput. Aided Design 2019, 111, 80–92. [Google Scholar] [CrossRef]
  3. Zou, Y.; Zhao, C.; Childs, P.; Luh, D. Cross-cultural design in costume: Case study on totemic symbols of China and Thailand. Hum. Soc. Sci. Commun. 2024, 11, 1263. [Google Scholar] [CrossRef]
  4. Miao, H.; Wen, R. Wedding Bed Textiles Design Based on Chinese Traditional Auspicious Patterns. In Proceedings of the 7th International Conference on Arts, Design and Contemporary Education (ICADCE 2021), Moscow, Russia, 25–26 May 2021. [Google Scholar] [CrossRef]
  5. Shen, Y. Evaluation and Selection of Cultural and Creative Design Solutions Based on Grey Correlation Multicriteria Decision Analysis. Math. Probl. Eng. 2022, 2022, 1–9. [Google Scholar] [CrossRef]
  6. Chen, D.; Cheng, P.; Simatrang, S.; Joneurairatana, E. Kansei engineering as a tool for the design of traditional pattern. Autex Res. J. 2021, 21, 125–134. [Google Scholar] [CrossRef]
  7. Chen, D.; Cheng, P. Research on the image design of clothing patterns. Fibres Text. East. Eur. 2024, 32, 17–24. [Google Scholar] [CrossRef]
  8. An, S.; Guo, Z.; Fang, H. Study on the Kansei Image of Linear Elements of Wooden Screens on the Basis of Modern Aesthetics. Forest Prod. J. 2022, 72, 258–264. [Google Scholar] [CrossRef]
  9. Song, Y.; Zhang, N.; Wu, T. Image evaluation and analysis of fabric with a geometric motif in dress style design. Ind. Textila 2024, 75, 591–598. [Google Scholar] [CrossRef]
  10. Quan, H.; Li, S.; Hu, J. Product Innovation Design Based on Deep Learning and Kansei Engineering. Appl. Sci. 2018, 8, 2397. [Google Scholar] [CrossRef]
  11. Gao, M.; Cao, X.; Qian, L. Cultural Echoes in Modern Design: Assessing Young Consumers’ Perceptions of Traditional Bamboo Weaving Patterns. Complexity 2024, 2024, 5524490. [Google Scholar] [CrossRef]
  12. Cui, J.; Tang, M. Integrating shape grammars into a generative system for Zhuang ethnic embroidery design exploration. Comput. Aided Design 2013, 45, 591–604. [Google Scholar] [CrossRef]
  13. Guo, F.; Liu, W.; Liu, F.; Wang, H.; Wang, T. Emotional design method of product presented in multi-dimensional variables based on Kansei Engineering. J. Eng. Design 2014, 25, 194–212. [Google Scholar] [CrossRef]
  14. Wang, C.; Zhang, J.; Liu, D.; Cai, Y.; Gu, Q. An AI-Powered Product Identity Form Design Method Based on Shape Grammar and Kansei Engineering: Integrating Midjourney and Grey-AHP-QFD. Appl. Sci. 2024, 14, 7444. [Google Scholar] [CrossRef]
  15. Wang, T.; Yang, L. Combining GRA with a Fuzzy QFD Model for the New Product Design and Development of Wickerwork Lamps. Sustainability 2023, 15, 4208. [Google Scholar] [CrossRef]
  16. Lee, P.; Han, Q. User-centric sustainable design in mass-customized housing using Kano model and quality function deployment. Archit. Eng. Des. Manag. 2025, 1–17. [Google Scholar] [CrossRef]
  17. Wang, Z.; Han, C.; Yu, B.; Wei, K.; Li, Y.; Jin, S.; Bai, P. The Emotional Design of Street Furniture Based on Kano Modeling. Buildings 2024, 14, 3896. [Google Scholar] [CrossRef]
  18. Xu, H.; Song, H. Key Factors Influencing Chinese Consumers’ Demand for Naturally Dyed Garments: Data Analysis through KJ Method and KANO Model. Sustainability 2024, 16, 1189. [Google Scholar] [CrossRef]
  19. Apichonbancha, P.; Lin, R.; Chuang, C. Integration of Principal Component Analysis with AHP-QFD for Improved Product Design Decision-Making. Appl. Sci. 2024, 14, 5976. [Google Scholar] [CrossRef]
  20. Oster, A.; McCormack, J. A Methodology for Creating Shape Rules During Product Design. J. Mech. Design 2011, 133, 61007. [Google Scholar] [CrossRef]
  21. McKay, A.; Stiny, G.; de Pennington, A. Principles for the definition of design structures. Int. J. Comput. Integ M. 2016, 29, 237–250. [Google Scholar] [CrossRef]
  22. Tošović-Stevanović, A.; Ristanović, V.; Ćalović, D.; Lalić, G.; Žuža, M.; Cvijanović, G. Small Farm Business Analysis Using the AHP Model for Efficient Assessment of Distribution Channels. Sustainability 2020, 12, 10479. [Google Scholar] [CrossRef]
  23. Yu, S.; Liu, M.; Chen, L.; Chen, Y.; Yao, L. Emotional Design and Evaluation of Children’s Furniture Based on AHP-TOPSIS. Bioresources 2024, 19, 7418–7433. [Google Scholar] [CrossRef]
  24. Zheng, H.; Liu, L.; Zhang, Q.; Wang, Y.; Wei, Y. Children’s Hospital Environment Design Based on AHP/QFD and Other Theoretical Models. Buildings 2024, 14, 1499. [Google Scholar] [CrossRef]
  25. Wang, T.; Zhang, Q.; Chong, H.; Wang, X. Integrated Supplier Selection Framework in a Resilient Construction Supply Chain: An Approach via Analytic Hierarchy Process (AHP) and Grey Relational Analysis (GRA). Sustainability 2017, 9, 289. [Google Scholar] [CrossRef]
  26. Dai, Z.; Scott, M. Product platform design through sensitivity analysis and cluster analysis. J. Intell. Manuf. 2007, 18, 97–113. [Google Scholar] [CrossRef]
Figure 1. Proposed framework.
Symmetry 17 00960 g001
Figure 2. Pictures of TPs of HFoJ.
Symmetry 17 00960 g002
Figure 3. User infographic.
Symmetry 17 00960 g003
Figure 4. Scree plot.
Symmetry 17 00960 g004
Figure 5. Extraction of core sample patterns of HFoJ.
Symmetry 17 00960 g005
Figure 6. The deduction process of Shape Grammar for Scheme P1.
Symmetry 17 00960 g006
Figure 7. The deduction process of Shape Grammar for Scheme P2.
Symmetry 17 00960 g007
Figure 8. The deduction process of Shape Grammar for Scheme P3.
Symmetry 17 00960 g008
Figure 9. The deduction process of Shape Grammar for Schemes P4–P8.
Symmetry 17 00960 g009
Figure 10. The deduction process of Shape Grammar for Schemes P9 and P10.
Symmetry 17 00960 g010
Figure 11. The evaluation system of perceptual demands for the HFoJ.
Symmetry 17 00960 g011
Figure 12. The House of Quality of the mapping model between affective vocabularies and pattern schemes.
Symmetry 17 00960 g012
Figure 13. Three design schemes for home textile products.
Symmetry 17 00960 g013
Figure 14. Three design schemes for home textile products design.
Symmetry 17 00960 g014
Table 1. Deductive rules of SG.
TypeRuleFormulaDiagram
Build rulesR1 = Substitution T S = S i ;     S 1 = x , y , z ;   T S = { x , y , w } Symmetry 17 00960 i001
R2 = Addition T S = S S i ;   S = a , b , S i = c ;   T S = { a , b , c } Symmetry 17 00960 i002
R3 = Deletion T S = S S i ;   S = a , b , c , S i = c ;   T S = { a , b } Symmetry 17 00960 i003
Amend rulesR4 = Scaling T S = p S = x y p x 0 0 p y Symmetry 17 00960 i004
R5 = Duplication T S = C + D S = x y c + 1 0 d x 0 c + 1 d y 0 0 1 Symmetry 17 00960 i005
R6 = Mirroring T S = K S = x y k x 0 0 0 k y 0 0 0 1 Symmetry 17 00960 i006
R7 = Shearing T S = H S = x y h x 1 0 0 1 0 0 0 1 Symmetry 17 00960 i007
R8 = Rotation T S = x y cos θ sin θ 0 sin θ cos θ 0 0 0 1 Symmetry 17 00960 i008
R9 = Fine-Tuning T S = Δ S = x y 1 0 Δ x 0 1 Δ y 0 0 1 Symmetry 17 00960 i009
Derived rulesR10 = Merging T S = S 1 + S 2 Symmetry 17 00960 i010
R11 = Translation T S = S + ( Δ x , Δ y ) Symmetry 17 00960 i011
Table 2. Score of the fuzzy matrix.
ScoreDefinitionScoreDefinition
0.1Factor i is absolutely less important than factor j 0.6Factor i is slightly more important than factor j
0.2Factor i is extremely less important than factor j 0.7Factor i is relatively more important than factor j
0.3Factor i is relatively less important than factor j 0.8Factor i is extremely more important than factor j
0.4Factor i is slightly less important than factor j 0.9Factor i is absolutely more important than factor j
0.5Factor i is equally important as factor j
Table 3. Test of KMO and Bartlett.
KMO0.605
Bartlett Sphericity CheckApproximate Chi-square211.238
df45
p0.000
Table 4. Explanation of total variance.
Initial EigenvalueSum of Squared Loadings ExtractedSum of Squared Loadings After Rotation
ElementTotalPercentage of VarianceCumulative %TotalPercentage of VarianceCumulative %TotalPercentage of VarianceCumulative %
13.54135.40935.4093.54135.40935.4093.32033.20133.201
23.06530.65466.0623.06530.65466.0622.80728.06961.270
31.97619.76085.8221.97619.76085.8222.45524.55385.822
40.7087.07992.901
50.3753.75096.651
60.1971.97498.625
70.0580.57799.201
80.0390.39199.592
90.0330.32999.922
100.0080.078100.000
Table 5. Component matrix after rotation.
Component
Component 1Component 2Component 3
Elegant0.909−0.150−0.158
Rhythm0.898−0.289−0.255
Plain0.8330.3930.127
Homely0.8110.3920.031
Symmetrical−0.0650.921−0.173
Settled0.0760.9150.307
True quality0.1130.8290.082
Personal−0.1750.0730.962
Artisanal−0.1890.0090.914
Profundity0.4970.1160.675
Table 6. Affective vocabularies for HFoJ.
Criterion LevelSub-Criterion Level
Aesthetic Features (E1)Elegant (E11), Rhythm (E12), Plain (E13), Homely (E14)
Art Style (E2)Symmetrical (E21), Settled (E22), True quality (E23)
Life Charm (E3)Personal (E31), Artisanal (E32), Profundity (E33)
Table 7. Consistency test results.
Objective LayerCriterion Layer
E1E2E3
CI0.00670.0050.0220.0378
Table 8. Weights and rankings of affective vocabularies.
Criterion LevelSub-Criterion LevelSame-Level WeightsGlobal WeightsRanking
E1 (0.41)E110.24500.10055
E120.25670.10524
E130.22830.09366
E140.27000.11072
E2 (0.32)E210.40670.13011
E220.26000.083210
E230.33330.10673
E3 (0.27)E310.32330.08739
E320.34670.09367
E330.33000.08918
Table 9. The evaluation matrix of HFoJ home textile schemes.
Evaluation DimensionsReference SequenceG1G2G3
Pattern Innovation (N1)0.720.720.570.56
Home Textile Applicability (N2)0.710.710.580.58
Market Acceptance (N3)0.770.770.670.61
Degree of Cultural Inheritance (N4)0.810.640.810.59
Potential for Personalization (N5)0.760.760.570.59
Table 10. Correlation coefficient results.
Evaluation DimensionsG1G2G3
Pattern Innovation (N1)1.0000.4230.407
Home Textile Applicability (N2)1.0000.4580.458
Market Acceptance (N3)1.0000.5240.407
Degree of Cultural Inheritance (N4)0.3931.0000.333
Potential for Personalization (N5)1.0000.3670.393
Degree of correlation0.8790.5540.4
Ranking123
Table 11. Comparative analysis of this study and previous related works.
StudyMethodologies EmployedKey Contributions
This studyAffinity Diagram; FAHP; SG; QFD; GRA- User-centered emotional demand analysis
- Integration of qualitative and quantitative methods
- Construction of a comprehensive evaluation model
- Emphasis on cultural inheritance and innovation in home textile design
Zou, Y [3]Field Investigation; Participatory Research; AHP- Identified gaps in cross-cultural fashion design
- Addressed cultural understanding and strategy formation
- Lacked a systematic evaluation framework
Miao, H [4]Case Analysis; Market Research- Explored innovative uses of traditional patterns
- Emphasized integration of clothing elements
- Focused on practical design coordination rather than emotional evaluation
Shen, Y [5]AHP; GRA; TOPSIS- Tackled issues of product homogeneity and low innovation in campus cultural products
- Developed a GC-TOPSIS-based evaluation model
- Focused mainly on selection, not on creation
Disclaimer/Publisher’s Note: The statements, opinions and data contained in all publications are solely those of the individual author(s) and contributor(s) and not of MDPI and/or the editor(s). MDPI and/or the editor(s) disclaim responsibility for any injury to people or property resulting from any ideas, methods, instructions or products referred to in the content.

