Abstract
Airtight cabins with highly complex human–machine systems impose an excessive cognitive load on operators. However, the traditional cognitive load assessment methods often cannot fully extract physiological features such as electroencephalogram and electrocardiogram signals, relying heavily on artificial feature extraction. Therefore, this study proposes an evaluation method based on a one-dimensional convolutional neural network to evaluate the cognitive load of airtight cabin workers. This evaluation method preprocesses and intercepts raw physiological signals such as electroencephalogram and electrocardiogram signals and then inputs them into the model for evaluation. The experimental results demonstrate that the training accuracy rate of the one-dimensional convolutional neural network is 97.6%, and the test classification accuracy rate is 86.5%. Despite sample size limitations, the proposed method demonstrates valid effectiveness in this study. Finally, taking a manned submersible as an example, cognitive load in different difficult tasks is identified, evaluated, and classified.
1. Introduction
An airtight cabin represents a quintessential example of a specialized workspace and living environment. This workspace is typically confined and enclosed, with a unique working environment that limits the range of postures available to operators, thereby making it challenging to secure adequate rest. These conditions can negatively impact human physical and psychological factors. Moreover, this environment encompasses not only the traditional physical surroundings but also an information-rich environment replete with high-tech applications. In such a setting, the cognitive load on operators is likely to increase significantly, potentially compromising the safety of human–machine systems. Conducting research on the cognitive load of personnel operating within airtight cabins, as well as detecting and analyzing their cognitive states, is of paramount importance for protecting the health of these individuals, reducing human errors, and enhancing their work efficiency.
Cognitive load indicates pressure on working memory and task performance and has garnered increasing research attention in recent years. Previous studies have demonstrated that different levels of task difficulty are associated with various psychophysiological signals, such as respiration [1]; skin conductance response [2]; pupillary responses [3,4]; heart rate (HR); heart rate variability [5]; blink interval [6]; hormone levels; and measures of brain activity, particularly electroencephalography (EEG) [7,8].
There is a wealth of research cases in the study of cognitive load within airtight cabins, such as spacecraft, cockpits, and manned submersibles. Sun et al. constructed an evaluation index system and methodology for human–machine interface ergonomics, enhancing the work efficiency of astronauts and the performance of aerospace systems by addressing ergonomics evaluation issues related to spacecraft human–machine interfaces [9]. Zhang et al. analyzed the cognitive behavior of marine divers during deep-sea missions and calculated the probability of cognitive failure in these tasks [10]. Alfredson et al. studied cognitive ergonomics and applied their findings to the development of design principles for fighter aircraft cockpits [11]. Ye Cong et al. researched the design process of manned submersible cabin layouts, grounded in the principles of human–machine ergonomics and equipment layout design [12]. However, the outcomes of these evaluations are relatively subjective and susceptible to the influence of the participants’ subjective perceptions.
With advances in artificial intelligence technology, evaluating cognitive load using algorithms such as support vector machines (SVMs), multilayer perceptrons, K-nearest neighbors, and convolutional neural networks (CNNs) has become a popular research direction. Hemakom et al. proposed a multimodal machine learning framework that integrated EEG and electrocardiogram (ECG) biomarkers and incorporated six classifiers (multilayer perceptron, AdaBoost, K-nearest neighbors, logistic regression, naive Bayes, and SVM) to achieve 76.55% classification accuracy across cognitive load gradations [13]. Tjolleng et al. constructed an artificial neural network using feedforward networks and scaled conjugate gradients as backpropagation learning rules to classify drivers’ cognitive loads based on ECG data [14]. Tabar et al. used time–frequency transformations of EEG data based on convolutional neural networks to evaluate mental workload [15]. Jiao et al. proposed an improved convolutional neural network to classify cognitive load, not only reducing the number of parameters required for model training but also enhancing classification performance. These studies demonstrate the superiority of convolutional neural networks and classifier algorithms in assessing cognitive load.
Many studies have utilized features like root mean square and mean absolute value for physiological signals to assess cognitive load, a process that necessitates extensive experimental validation for its justification. The special nature of the airtight cabin environment makes it difficult to conduct extensive research in this area. Therefore, discovering and determining appropriate physiological features and classification methodologies from raw one-dimensional physiological signal data are crucial for evaluating operators’ cognitive load levels, which can significantly improve the human design factors of airtight cabins. Symmetry and asymmetry constitute fundamental dualities in ergonomic design paradigms. Managerial asymmetries in cognitive load assessment during operator evaluations have been shown to directly compromise workforce health outcomes and productivity metrics. This is also of great importance for the physical and mental health of maintenance personnel and enhancing work efficiency.
This study proposes a method of assessing operators’ cognitive load based on a one-dimensional convolutional neural network (1D-CNN). The physiological data—including EEG and ECG collected from operators within airtight cabins via wireless sensors—are directly used as inputs for the 1D-CNN to identify their cognitive loads during operations of varying difficulty levels. This approach addresses the issue of manual feature extraction encountered in traditional classification methods and simultaneously avoids interference caused by collecting wired data from operators. Compared with two-dimensional CNNs, this involves fewer training parameters, circumventing the problem of slow processing speeds due to a large number of parameters and preventing signal distortion issues that can arise from transforming one-dimensional raw signals into two dimensions.
The remainder of this study is organized as follows: Section 2 provides an overview of relevant research and background. Section 3 describes the materials and methods, including experimental design, data collection and processing, and model development. Section 4 analyzes the experimental results. Section 5 validates the method with a case study on a manned submersible. Section 6 discusses the findings. Section 7 outlines the main conclusions. Section 8 addresses the limitations of the study and discusses future work.
2. Literature Review
This subsection reviews the current state of research from three perspectives: human–machine ergonomics research in airtight cabins, worker cognitive load studies, and neural-network-based cognitive load assessment.
2.1. Human–Machine Ergonomics Research in Airtight Cabins
Human–machine ergonomics focuses on studying human–machine–environment systems, analyzing the interrelationship between the three, and exploring its mechanisms with the help of cross-field disciplines such as biomedicine and statistics. Typically, physiological indicators such as EEG and ECG are collected from operators at work, and human cognitive characteristics are used for cabin design. Using human–computer ergonomics as the basic theory, researchers have studied the layout design and human–machine interaction of airtight cabins to improve the performance and cognitive ability of operators.
Military fields such as aviation, aerospace, manned deep diving, and armored vehicles are hot areas of ergonomic research. Wang et al. studied musculoskeletal disorders and cognitive load caused by complex console layouts [16]. Shi et al. designed a shared human–machine ergonomics assessment system to solve the human–machine ergonomics assessment problem in cockpit system design, achieving real-time dynamic assessments of operators [17]. Andrews et al. developed a predictive workload model using an integrated tool with improved performance to maintain pilot cognitive load at a manageable level [18]. Lagomarsino et al. proposed a new method for evaluating cognitive load in manufacturing that can reduce the physical fatigue and discomfort of operators [19]. Wang et al. studied the comfort characteristics of the cabins of manned submersibles and proposed a JACK-based multi-source composite assessment model for comfort assessment of these spaces [20].
When operators in airtight cabins are under high cognitive loads, they are prone to fatigue, which can adversely affect their operational safety and work performance, potentially leading to safety incidents. The above studies show that ergonomics can not only guide cabin design and optimize the HMI process but also assess the operator’s cognitive load level and, more importantly, improve operational capability and personnel effectiveness.
2.2. Worker Cognitive Load Studies
Cognitive load mainly refers to the level of “mental energy” taken up by a person to receive, remember, and process a large amount of information in a short period. It mainly includes work requirements, time pressure, task complexity, and operator performance. This is reflected in the fact that operators receive a lot of information and experience-corresponding sensations through their visual and auditory senses.
Xiong et al. explored automatic cognitive load pattern recognition using physiological measurements to quantify autonomic and central nervous activity by extracting 33 commonly used physiological features from EEG and ECG signals. The algorithm was optimized using particle swarm optimization to construct a cognitive load pattern recognition model, achieving 97.2% accuracy in classifying cognitive load mismatches and matches [21]. Na et al. studied three factors of cognitive load: psychological demand, time demand, and frustrated effort. The results indicated that the dual-task approach and the National Aeronautics and Space Administration Task Load Index (NASA-TLX) scale assessment could be good indicators of cognitive load [22]. Haapalainen et al. used cognitive perception and cognitive speed as assessment factors in the Ubicomp application for cognitive abilities, collecting ECG data from multiple sensors. They found that ECG median absolute deviation and median heat flux measurements were the most accurate in differentiating cognitive load levels [23].
Blink frequency and duration are also commonly used to measure states of alertness, attention, and mental load in studies related to pilots and drivers. Many studies have shown that when alertness, task demands, and fatigue increase, blink frequency and duration appear to decrease [24]. Chen et al. conducted systematic investigations on physiological signal variations in fighter pilots during flight training and combat operations, identifying EEG and ECG as sensitive biomarkers for mental workload fluctuations [25]. Through controlled psychophysiological experiments, Weelden et al. established the clinical significance of EEG theta/beta power spectral density in aviation mental workload assessment, with multimodal data in evaluation precision [26]. Dussault et al. studied changes in the EEG and ECG signal indicators of pilots during real flights and found that the β- and γ-wave power of the EEG indicators increased while the α-wave decreased when the pilots flew on standard takeoff and landing routes [27].
These studies indicate that physiological indicators such as the EEG and ECG of operators in airtight cabin environments correlate with cognitive load levels. Therefore, determining how to utilize these physiological indicators to quantitatively assess operators’ cognitive load is a crucial issue, particularly for one-dimensional time series data like EEG and ECG indicators. Additionally, owing to noise in EEG and ECG signal data, preprocessing techniques such as filtering and transformation are necessary to extract more cognitive load information.
2.3. Neural-Network-Based Cognitive Load Assessment
Cognitive load assessment is an important research component in the field of ergonomics. When neural networks were not widely used, most researchers used a more traditional machine learning approach to assess cognitive load. Liang et al. developed a real-time workload classification method for car drivers based on SVMs to classify and identify the collected features, resulting in a correct classification rate of 81.1% [28]. Amin et al. proposed a discrete-wavelet-transform-based EEG signal feature extraction method that can be used for load feature classification using classifiers such as multilayer perceptrons and K-nearest neighbors [29].
In recent years, deep learning has made progress in classification tasks [30,31] and pattern recognition tasks [32]. There are many applications in the field of physiological signal processing. Han et al. architected a deep learning framework leveraging multimodal neurophysiological monitoring (EEG-ECG co-registration) for aviation human factor engineering applications [33]. Baldwin et al. used an artificial neural network for task difficulty and kind identification for three cognitive tasks using an EEG dataset as a sample, finding high accuracy in classifying task difficulty and low accuracy in classifying task kind [34]. Tjolleng et al. developed a driver cognitive load detection system based on ECG signals using multilayer artificial neural networks [35].
In addition, one of the most typical and widely used network structures in deep learning, a CNN, is also used for cognitive load classification [36,37]. Jiao et al. proposed an improved CNN for classifying cognitive load that reduced the model training parameters while also improving the classification results [38].
Existing research shows that machine learning algorithms and deep learning networks are effective in quantifying and assessing cognitive load. These studies typically involve manual feature extraction from EEG and ECG data, followed by using classification algorithms for cognitive load evaluation. This approach introduces a degree of subjectivity into the assessment of operators’ cognitive load, as manual feature extraction relies on the researchers’ experience and can be cumbersome. Utilizing CNNs can effectively address these issues by directly evaluating operators’ cognitive load levels from one-dimensional time series data like EEG and ECG through operations such as convolution and pooling.
3. Materials and Methods
This section presents an experimental study collecting physiological signals from operators in airtight cabins. It outlines the experimental design and data-processing methods employed in this research and introduces a cognitive load assessment approach based on a 1D-CNN. The overall framework of this study is shown in Figure 1, including the cognitive load assessment experiment for airtight cabin operators, experimental data processing and analysis, the construction and training of the cognitive load assessment model, and the model application.
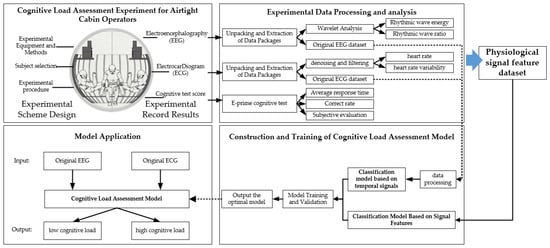
Figure 1.
Research framework.
3.1. Experimental Scheme Design
This subsection details the experimental setup, equipment, participant selection, and task design for cognitive load assessment.
3.1.1. Experimental Equipment and Methods
Experiments were conducted in the airtight cabin laboratory of the Department of Industrial Design, Northwestern Polytechnic University, to study changes in the cognitive loads of operators in a confined chamber environment with different task levels. The laboratory environment fully simulates the cabin of the “Jiaolong” manned submersible. The pre-experimental preparation included a closed experimental platform, equipment for measuring physiological data such as EEG and ECG, the NASA-TLX subjective scale, and a computer.
The EEG signals were measured using the TGAM single-conductor EEG device (Shen Nian Technologies, Inc., San Jose, CA, USA). Firstly, we wiped off any grease on the subject’s skin and electrodes with alcohol paper, applied an Ag/AgCl disk electrode to the left forehead, and fixed the reference electrode and ground electrode at the left and right earlobes, respectively. A matching Bluetooth adapter was plugged into the computer. After all the above operations were completed, the power switch was turned on, and the Bluetooth adapter’s blinking light was on, indicating a good connection between the EEG device and the computer. Finally, the TGAM module’s MindViewer (Shen Nian Technologies, Inc., San Jose, CA, USA, https://blog.jackeylea.com/qt/mindviewer-tgam-module-graphic-application/#%E8%BD%AF%E4%BB%B6 (accessed on 5 June 2025)) software was opened, and the corresponding serial port and baud rate were selected to observe the EEG waveform.
The ECG signal was collected using a low-power ECG sensor device (ADS8881 SAR ADC, Texas Instruments, Inc., Dallas, TX, USA). The electrode pads were attached to the subject’s left chest and connected to the computer’s Bluetooth serial port. When the indicator light flashed and the data were output from the computational display, the real-time ECG waveform could be observed by opening the supporting software. After the subject put on the experimental equipment and prepared, the experiment was carried out according to the requirements of the main subject.
Owing to the characteristics of airtight cabins and to ensure the feasibility and convenience of subsequent on-site experiments while minimizing interference to the operator, this study selected a TGAM single-conductor EEG device and a low-power ECG sensor device. To further elucidate the interaction mechanism between EEG and ECG physiological signals and operator cognitive load, devices such as ring electrodes or integrated electrode caps should be used to collect multi-channel data.
The NASA-TLX subjective scale was used after subjects completed the experiment to rate their subjective feelings after completing each main experiment. The six dimensions of the scale include mental demand, physical demand, time demand, effort level, performance level, and frustration level. Table 1 presents detailed descriptions of each dimension of the scale.

Table 1.
NASA-TLX subjective scale dimensions explained.
3.1.2. Subject Selection
Five subjects (aged between 22 and 26 years old) were selected for this experiment, all of whom were graduate students at the Department of Industrial Design at Northwestern Polytechnical University. They needed to be in good health, without any history of brain, heart, or chronic drug use. Furthermore, they needed to have normal vision (or corrected vision of 1.0 or higher) and normal hearing. All of the subjects were right-handed and positive-minded, without any depressive manifestations. The day before the experiment, they were asked to refrain from stimulating behaviors such as drinking, smoking, and coffee while ensuring adequate sleep and rest. Most importantly, from a professional standpoint, the five subjects had considerable research experience and operational expertise in human factor engineering within the fields of manned submersibles and sealed compartments. Furthermore, they had participated in designing the “Jiaolong” manned submersible, making them well acquainted with the environments of sealed compartments and the related operational processes. Due to the particularity of this research field, the selection of subjects is quite unique [16,39].
3.1.3. Experimental Procedure
To ensure the validity and accuracy of the experimental data, the temperature and humidity of the experimental environment were suitable, and the experimental time was controlled at about 10:00 am or 4:00 pm.
- (1)
- Pre-experimental preparation
The experimental equipment was checked before the experiment to ensure proper communication between the EEG and ECG data testing equipment and the computer. The subjects were given some time to adjust to the cabin’s environment so that their heart rates and EEGs were maintained in normal conditions. Subjects were asked to ensure they had adequate sleep and rest before the trial, maintain a regular schedule, and refrain from taking any stimulants. To reduce experimental errors related to the participants’ adaptation to the experimental equipment, data from the first two minutes of the experiment were discarded during data processing.
- (2)
- First experiment
The experimental flow is depicted in Figure 2. In the first experiment, subjects were initially asked to complete a primary task. After completing the primary task, their cognitive abilities, such as memory, reaction time, and attention, were assessed using E-prime 3.0 software. Lastly, they filled out the NASA-TLX subjective rating scale to subjectively evaluate the primary task.
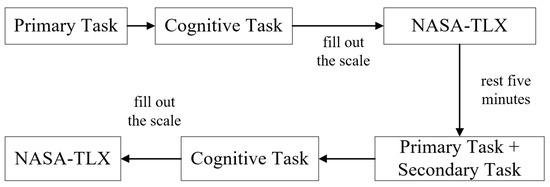
Figure 2.
Experimental flow.
The primary duty of operators in an airtight cabin is to observe the external environment and the status of various instruments, providing feedback accordingly. Therefore, the primary task in this study was an observation-based work task. Participants were first assigned a specific keyword. They were then required to read information for five minutes on a computer, during which time they had to identify the number of occurrences of the assigned keyword. This was to be completed immediately after the primary task. The information read during the primary task and the assigned keyword were randomized for each trial.
- (3)
- Second experiment
After the first experiment, we only gave the subjects five minutes of rest time for preparation before the second experiment, because tasks are continuous during operations in an airtight cabin.
In the second experiment, participants were asked to complete one main task and one secondary task. Then, as in the first experiment, E-prime was used to test their cognitive abilities after completing the task, and the NASA-TLX subjective scale was filled out.
The main task of the second experiment was consistent with the first experiment. However, the information and keywords read were random and were not exactly the same as the first experiment.
The secondary task of the airtight cabin operators was to record and calculate relevant data based on their observation results and operate relevant buttons based on calculation results. All observations, recordings, and operational procedures, as well as the principles behind these actions, were clearly explained to the participants so that they could be fully understood. Therefore, the task setting for this study was primarily focused on mental arithmetic. When the subjects completed the main task, they were asked to answer the result of an equation, that is, whether the sum of two digits can be divided by three.
Both the EEG and ECG acquisition devices were in contact with human skin through silver–silver chloride electrodes. The EEG signal was in single-channel lead mode with a sampling frequency of 512 Hz; the ECG signal was acquired through a low-power ECG device module; and data such as RR interval, heart rate, heart rate variability (HRV), and body temperature were automatically analyzed through the software.
At the end of the experiment, the subjects filled out the NASA-TLX subjective scale and scored six indicators, each with a score of 0 to 100, with higher scores representing a corresponding higher cognitive workload. In addition, the subjects were asked to rank the weighting of the six indicators, assigning different weighting values (1, 2, 3, 4, 5, and 6). Finally, a weighted average based on the scores and weights of the six indicators was used to obtain the comprehensive subjective evaluation value.
3.2. Experimental Data Collection and Processing
This subsection covers preprocessing steps for EEG, ECG, and cognitive test data, including wavelet decomposition and normalization.
3.2.1. EEG Data Processing Flow
The collected EEG packets were unpacked to obtain the raw EEG signal. The TGAM EEG module sent approximately 513 packets per second during operation, including 1 large packet and 512 small packets of data. Each large packet contained information such as signal strength, eSense focus, and relaxation; each small packet contained a set of raw signals. The raw EEG signals in all sachets needed to be acquired and extracted as follows:
The data format of each packet is AA AA 04 80 02 xxHigh xxLow xxCheckSum, where the first five bytes (AA AA 04 08 02) are always the same, indicating the type of the packet. The last three bytes (xxHigh xxLow xxCheckSum) are variable. xxHigh xxLow represents the raw EEG data in hexadecimal, and the raw EEG signal can be calculated with Equations (1) and (2).
xCheckSum indicates the checksum, which is used to check whether the packet is correct. The checksum needs to be judged before the original data are extracted. The value of the checksum is determined by adding the four bytes after byte 04, inverting it, and then taking the lower eight bits.
Then, the sum is compared with the value of xxCheckSum; if the two are equal, this is the correct packet, and the raw data value can continue to be calculated. Otherwise, this packet is skipped, and the next packet is calculated. A packet loss rate below 10% will not affect the final result.
The raw EEG signals were extracted in the above way, and the raw EEG waveforms were plotted using MATLAB R2016a, as shown in Figure 3.
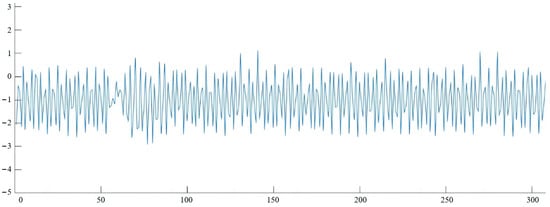
Figure 3.
Original EEG waveform.
After the original EEG signal was obtained, the four rhythmic waves (α-wave, β-wave, θ-wave, and δ-wave) in the EEG signal were extracted using the wavelet packet decomposition method through a program prepared by MATLAB. Their features are shown in Table 2.

Table 2.
Characteristics of the four EEG waveforms.
The sampling frequency of the EEG signal in this study is 512 Hz, and the MATLAB program algorithm reduces the sampling frequency to 200 Hz to make the spectral features of the four decomposed rhythmic waves more obvious. We designed a wavelet packet 7-layer decomposition tree, as shown in Figure 4, and used daubechies4 wavelet basis functions for decomposition reconstruction. The frequency resolution of each layer can be expressed as Equation (4), and the frequency resolution of the 7th layer is calculated as 0.78 Hz after downsampling.
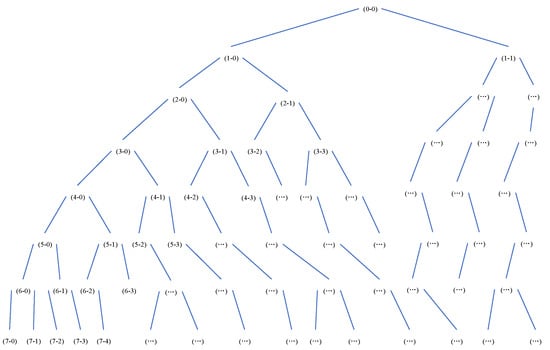
Figure 4.
Wavelet packet 7-layer decomposition tree.
Based on the wavelet packet decomposition frequency band characteristics, the minimum number of wavelet packet decomposition nodes contained in each spectral signal can be calculated. The nodes of the bottom layer are used as much as possible to contain the detailed data of each rhythmic wave. After wavelet packet decomposition, the 0~4 Hz frequency band in layers 6 and 7 corresponds to the δ-wave frequency range in the EEG signal. The 4~8 Hz band in layers 6 and 7 corresponds to the θ-wave frequency range in the EEG signal. The 8~12 Hz band in layers 5 and 6 combined with the 12~13 Hz band in layer 7 corresponds to the α-wave frequency range. The 18~25 Hz frequency bands in layer 4, the 15~18 Hz and 25~28 Hz bands in layer 5, the 14~15.6 Hz and 28~29.68 Hz bands in layer 6, and the 29.68~30.46 Hz band in layer 7 are combined to correspond to the β-wave frequency range. Let the j-th node of the i-th layer be the wavelet packet decomposition of the EEG signal; the decomposition nodes contained in the four rhythmic wave signals are as follows: δ: (6, 1), (7, 1), and (7, 4). θ: (6, 3), (6, 4), and (7, 5). α: (5, 3), (6, 5), and (7, 16). β: (4, 3), (5, 8), (5, 5), (6, 9), (6, 18), (7, 18), and (7, 38).
A MATLAB program was developed to implement the wavelet packet 7-layer decomposition of the EEG data. The wavelet packet coefficients of the four EEG rhythm waves were reconstructed and superimposed according to the frequency ranges where the four rhythm waves were located. The waveforms of the four rhythmic wave signals were calculated and are shown in Figure 5. The distribution of and variation in wavelet packet coefficients for the four rhythmic waves can be observed in the waveform diagram.
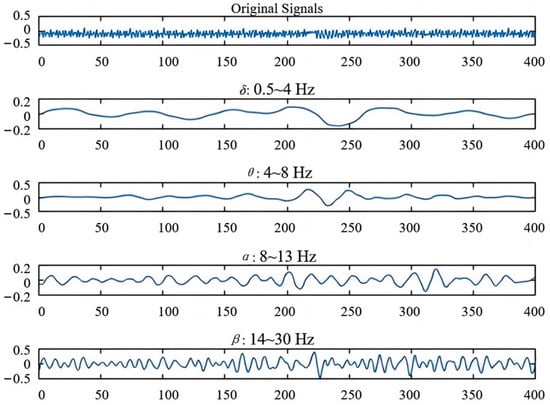
Figure 5.
Four EEG rhythm waveforms.
3.2.2. ECG Data Processing Flow
Low-power ECG sensors can transmit ECG signals. Two sets of 8-bit ECG data with flag bits were received continuously through the serial port of the Bluetooth connection. The first two 01 bits were the high four bits of the AFE data, and the first two 11 bits were the low six bits of the AFE data. We removed the two sets of data flag bits and sign bits and then spliced the data into 10-bit unsigned numbers to form the ECG signal. The ECG data, heart rate data, etc., were displayed in real time after the ECG signal was received, and the table files (excel, txt, CSV, etc.) were generated. The ECG signal table files were further analyzed using MATLAB to determine the health status or workload of the subjects.
Data such as ECG and heart rate were analyzed as described above, and physiological data features were obtained after denoising and filtering. The ECG data included heart rate, heart rate variability, RR heart rate interval, and other indicators, and the data were then processed and analyzed using MATLAB.
3.2.3. Cognitive Test Score Processing and Analysis
After the subjects completed the cognitive experiment on E-prime, the software automatically recorded data indicators such as reaction time and task correctness.
Perceptual speed test: The correct rate and average time taken by the subjects to complete this test were measured, where the longer the average time, the slower the perceptual speed.
N-back test: The average time taken and number of errors when all subjects completed the N-back task twice were selected to indicate the subjects’ memory abilities.
Graphical numerical coding: The performance indicators are mean reaction time and correctness, and the parameter values indicate the subject’s level of comprehension and memory.
Visual search: The average reaction time and task correctness of the subjects under the selected two tasks were compared and analyzed before and after. If the second reaction time was longer than the first, it indicated that the subjects had poor attention and were at a high cognitive load level.
3.2.4. Extraction and Normalization of Physiological Signal Data
Based on the frequency relationship between EEG signals and ECG signals, EEG signal data with a fixed length of 400 and EEG signal data with a fixed length of 3 were extracted. EEG and ECG signals were concatenated along the channel dimension, forming a single 1D input vector with a length of 403 (200 Hz). This combined input preserves temporal synchronization between signals. Data expansion was achieved by using a sliding window sample interception method. This method can expand the training data by dividing it into a series of short subsequences, allowing machine learning algorithms to learn and predict separately on each subsequence, thereby improving the performance of the model [6,7]. The sliding window slides over the input physiological signal in certain steps and extracts the physiological signal into multiple samples of equal length to the window. The schematic diagram is shown in Figure 6. Assuming that the length of the original physiological signal is L, the length of the sliding window is H, and the step size is S, the number of samples, M, obtained after this segment of the signal is divided and can be expressed by the following equation:
where is the downward rounding function.

Figure 6.
Sliding window for intercepting data.
If S < H, there is signal overlap between the samples intercepted by the two adjacent sliding windows; otherwise, if S > H, there is no overlap. For example, if a physiological data signal length of 1000 is collected, the training sample requires a sliding window length of 200 data with a step size of 100. This segment of the signal was calculated using Equation (5) to obtain 9 samples. In this way, the samples can be enriched to obtain the large number of data needed for subsequent algorithm model training. It is also possible to concatenate the beginning and end of the intercept data to expand the amount of information contained in a single input datum.
To reduce data complexity and speed up neural network training, a normalization operation is applied to all data with the following mathematical formula:
where is the normalized data, is the original data, is the maximum value of the original data, and is the minimum value of the original data.
3.3. Cognitive Load Assessment Method Based on a One-Dimensional Convolutional Neural Network
This subsection describes the architecture, parameter settings, and training protocol of the proposed 1D-CNN model.
3.3.1. Model Structure
The 1D-CNN model primarily processes one-dimensional time series data, with both the input data and convolutional kernels in a one-dimensional format. This design can reduce the number of training parameters, lower the computational complexity of the neural network, and thereby improve training efficiency. Figure 7 illustrates the structural principles of the 1D-CNN model, which consists of the input layer, convolutional layer, pooling layer, fully connected layer, and softmax layer, allowing for the direct output of cognitive load experienced by operators in a closed environment from one-dimensional EEG and ECG data.
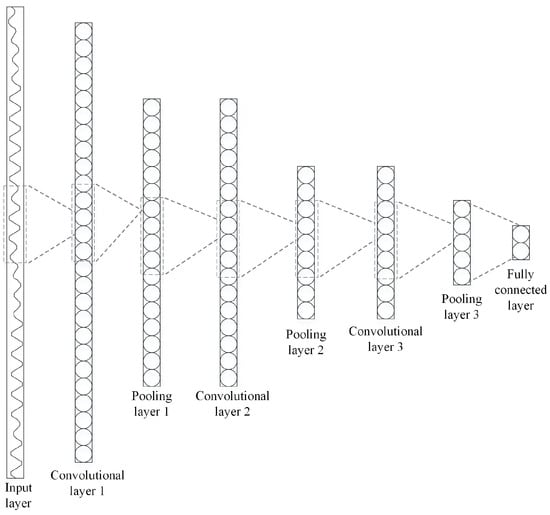
Figure 7.
The structural principles of the 1D-CNN model.
The convolutional layer of the 1D-CNN model is mainly used for feature extraction from the input physiological signal data. It employs convolutional kernels that slide along one direction to perform local convolution operations. The features of physiological signals are typically distributed across different spectra. The convolutional layer of the 1D-CNN model utilizes multiple feature extraction channels to extract the corresponding physiological features, classifying the cognitive load based on this extraction. The mathematical model of the convolution process is represented in Equation (7)
In the formula, represents the th value in the output physiological signal feature vector, denotes the -th weight in the 1D-CNN convolutional kernel, corresponds to the one-dimensional convolution operation, refers to the -th value in the input physiological signal sequence, represents the bias parameter, and stands for the activation function, which uses the ReLU function.
The pooling layer primarily performs subsampling on the feature vectors obtained from the convolutional layers, reducing the feature dimensionality, expanding the receptive field, and extracting more prominent physiological signal features. The fully connected layer further classifies these features based on the physiological signal characteristics extracted from multiple convolutional and pooling layers. In this study, the fully connected layer employs the dropout technique, temporarily dropping out neural network units from the network with a certain probability to reduce model complexity and prevent overfitting. The softmax layer calculates the probability distribution of the samples being classified into different categories, with the softmax function chosen for the softmax layer in this research. Batch normalization and residual connections were incorporated to address vanishing gradients, as suggested by Abuqaddom et al. [40].
3.3.2. Model Parameter Setting
After preprocessing, the data were input into a one-dimensional convolutional neural network, and the features were extracted after three convolution and pooling operations. Max-pooling (kernel size = 2) was chosen to retain salient features and reduce dimensionality while mitigating information loss. To reduce overfitting in the neural network, the dropout layer loss rate was set to 0.3, allowing the neural network to complete training quickly and accurately. The cross-entropy function was used for the loss function. Finally, the fully connected layer was introduced, and a softmax classifier was used to output the classification results of the physiological signals, i.e., low cognitive load or high cognitive load. The network structure parameters are shown in Table 3.

Table 3.
Parameter settings of 1D-CNN.
4. Analysis of Results
To explore the mapping relationship between cognitive load and physiological signals such as EEG and ECG, this study utilized a 1D-CNN approach. This method enables automatic learning and feature extraction from the input one-dimensional EEG and ECG signal data, predicting the level of cognitive load. The 1D-CNN algorithm is particularly well suited for processing time series one-dimensional physiological signals, as it facilitates the retrieval of more subtle and useful information. Additionally, it mitigates the risk of signal distortion that may occur during the conversion of physiological signals across multiple dimensions.
4.1. Results of Experimental Data Analysis
The EEG and ECG data, the response time of the E-prime program, etc., were analyzed as follows:
- (1)
- EEG indicators
Following wavelet decomposition processing via the protocol detailed in Section 3.2.1, EEG signals underwent rhythm-specific energy distribution analysis across four canonical frequency bands, with the normalized power spectral density allocations visualized in Figure 8. Figure 8 shows the results of the energy-sharing analysis for the four EEG rhythm waves from the first and second experiments. The proportion of delta-wave energy is relatively high, indicating that the body is in a sleep state. The proportions of theta- and alpha-wave energies are relatively low, but beta-wave energy occupies a certain proportion, suggesting slight emotional excitement. Based on this, the first experiment can also be judged to be a state of low cognitive load. During the second experiment, the participants exhibited a decrease in the percentage of delta-wave energy and an increase in the percentages of theta- and beta-wave energies. Thus, during the second experiment, the participants were in a state of high cognitive load.
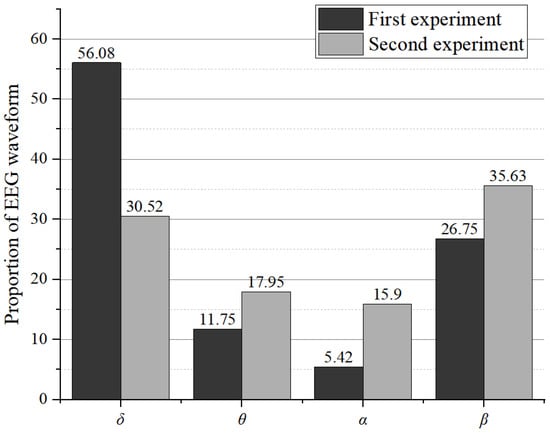
Figure 8.
Results of the energy share analysis for each rhythm of the EEG signal.
- (2)
- Electrocardiographic indicators
The variations in heart rate (HR) and heart rate variability (HRV) demonstrated by the participants in both experiments are illustrated in Figure 9. Our results suggest that the HR and HRV indices are associated with variations in task difficulty, with HR showing an upward trend as task difficulty increases and HRV exhibiting a converse pattern. However, this relationship was not distinctly observed in participants 3 and 4.
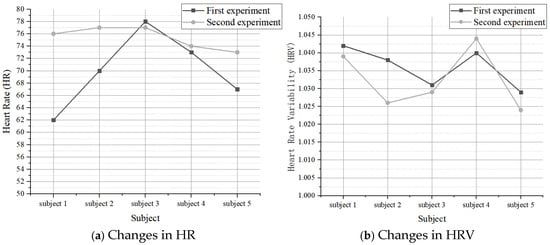
Figure 9.
Subjects’ HR and HRV data from the two experiments.
- (3)
- Average response time and correct rate of cognitive experiments
After the subjects completed two cognitive experiments with E-prime, the software recorded their keystroke response times and correct rate for each question. The average response time and average correct rate obtained from the statistical analysis are shown in Figure 10.
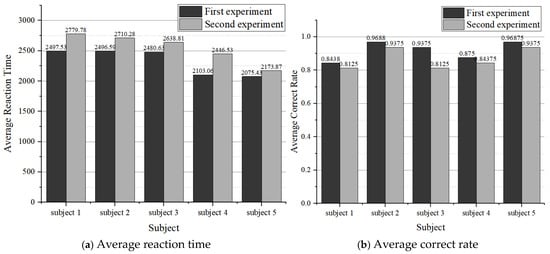
Figure 10.
Average reaction time and correct rate for cognitive experiments.
Figure 10 shows that the participants’ average reaction time in the second cognitive experiment was generally higher than that in the first cognitive experiment. This suggests that participants engaging in the second experiment experienced greater cognitive load, leading to slower reaction times and reduced attention while completing the cognitive tasks. This may also contribute to the decreased accuracy observed in the cognitive experiments. Overall, compared with the first experiment, the two tasks arranged in the second experiment (primary task + secondary task) likely imposed a higher load on the participants, resulting in diminished reactivity.
- (4)
- Subjective evaluation
The calculated subjective ratings and weights of the participants are presented in Figure 11. This figure illustrates the changes in subjective ratings across the two experiments. Compared with the outcomes under the low-cognitive-load state in the first experiment, the subjective ratings of participants significantly increased in the second. This indicates that the second experiment imposed a higher cognitive load on the participants than the first. Although different subjects showed differences in scoring values, the comparison between the two experiments was robust and statistically significant (p < 0.05). NASA-TLX scores correlated strongly with physiological classifications.
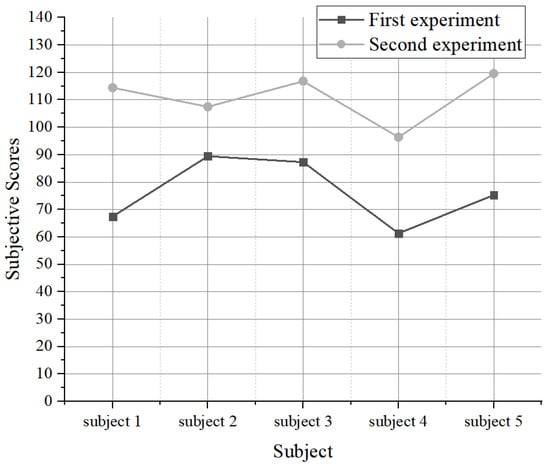
Figure 11.
Subjective evaluation results of the subjects.
4.2. Model Evaluation Analysis Results
Experiments were conducted on a 64-bit Win10 system computer equipped with a 3.0 GHz CPU and 8 GB RAM to implement the 1D-CNN model via Python 3.7 on the TensorFlow platform.
After processing the EEG and ECG data, the length of each sample was chosen to be 403. The EEG and ECG data information was included in the sample, and the dimensionality of the physiological dataset was 1160 × 403. The dividing ratio of the training and test sets is 3:1.
The model was run in the TensorFlow environment on the Visual Studio platform. The experiments were run three times and averaged to reduce the randomness and chance associated with experimental results. The constructed 1D-CNN model was trained using the above dataset to test the model performance. The training process is shown in Figure 12. The model gradually converged in accuracy and loss function at the 100th iteration. The accuracy of the training set was 97.6% at this time, and the loss function was 0.1276, proving that the model has a good ability to extract physiological features.
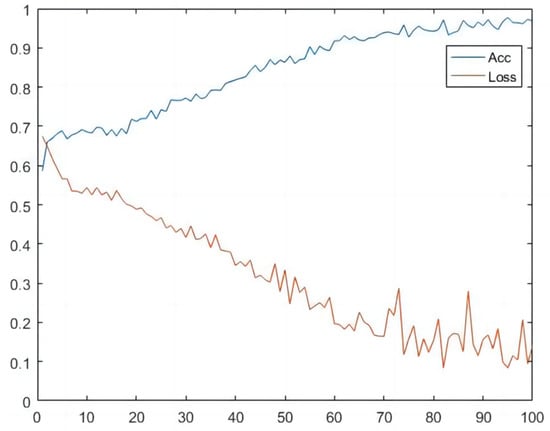
Figure 12.
The training process of 1D-CNN model.
The confusion matrix obtained while testing the 1D-CNN model is shown in Figure 13. The model had a TP value of 0.91—that is, it had a 0.91 probability of predicting an actual low cognitive load as a low cognitive load. An FP value of 0.09 indicated a 0.09 probability of predicting an actual low cognitive load as a high cognitive load. An FN value of 0.17 indicated a 0.17 probability of predicting an actual high cognitive load as a low cognitive load. A TN value of 0.83 indicated a 0.83 probability of predicting an actual low cognitive load as a low cognitive load.
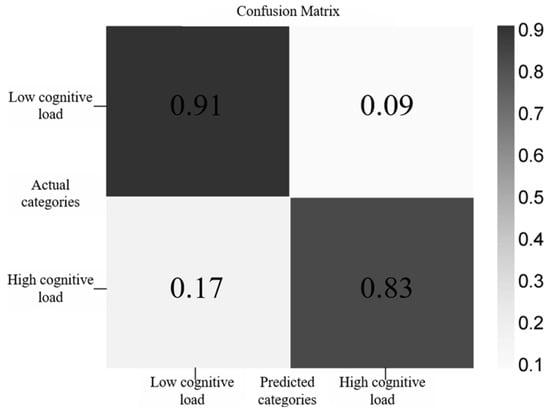
Figure 13.
The 1D-CNN confusion matrix.
The values of the model’s four evaluation indicators were calculated from Equation (A1), as shown in Table 4. The 1D-CNN model prediction specificity and sensitivity were 90% and 84%, respectively, with high predictive power. The overall accuracy reached 86.5%, with good classification performance. Our 1D-CNN model addresses the classification problem of cognitive load assessment based on physiological signals, and it has been experimentally demonstrated to achieve good classification results. A 1D-CNN evaluation method based on EEG and ECG signals was designed for one-dimensional signals with time series such as EEG and ECG signals. Physiological signal characteristics can be automatically and efficiently extracted from the input signal data. Compared with two-dimensional convolutional neural networks, fewer training parameters are involved, the problem of slow processing due to a large number of parameters is avoided, and classification is faster. We have also demonstrated that EEG and ECG signals can effectively characterize cognitive load.

Table 4.
Prediction results of 1D-CNN.
SVM and BP neural network algorithms, Long Short-Term Memory (LSTM), and Gated Recurrent Unit (GRU) were compared with the 1D-CNN to obtain classification results. All computational models underwent a rigorous 10-fold cross-validation protocol, as shown in Table 5. The total accuracy and classification accuracy in the low and high cognitive load conditions of the three network models were obtained, as shown in Figure 14. The average classification accuracy of the BP neural network was 74.5%, while the average classification accuracy of the SVM algorithm was 66.3%. By contrast, the average classification accuracy of the 1D-CNN was 86.5%. Overall, the 1D-CNN demonstrated better classification performance than the BP neural network and SVM models, particularly excelling in low-load recognition tasks. In a comparison of the 1D-CNN with LSTM and GRU (test accuracy: 79.2% and 81.5%, respectively), the 1D-CNN’s localized feature extraction outperforms recurrent architectures for short-term physiological patterns.

Table 5.
The accuracy of the 10-fold cross-validation method for five types of models.
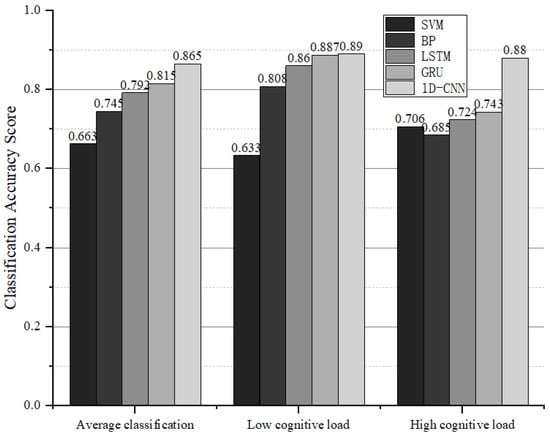
Figure 14.
Comparison of prediction results of the three network models.
5. Manned Submersible Case Validation
The internal structure of the manned submersible cannot be publicly displayed, so during the validation phase, experiments were conducted only in the laboratory.
PVC panels and aluminum frames were used to build the manned submersible platform. The console buttons were positioned with different colored circular stickers to demonstrate the controls, simulating the main display device, control buttons, and display layout of the manned submersible. A schematic diagram of the platform is shown in Figure 15. The subjects were positioned in the middle of the console to complete two different tasks under different conditions. The first operation required the subject to operate the manned submersible normally according to the requirements of the main test and to press the corresponding button to complete the main task. The second involved a dual-task experiment. The subjects recorded data such as the orientation, dive depth, heading angle, and distance of the downloaded human submersible from the mother ship while performing the main task of maneuvering.
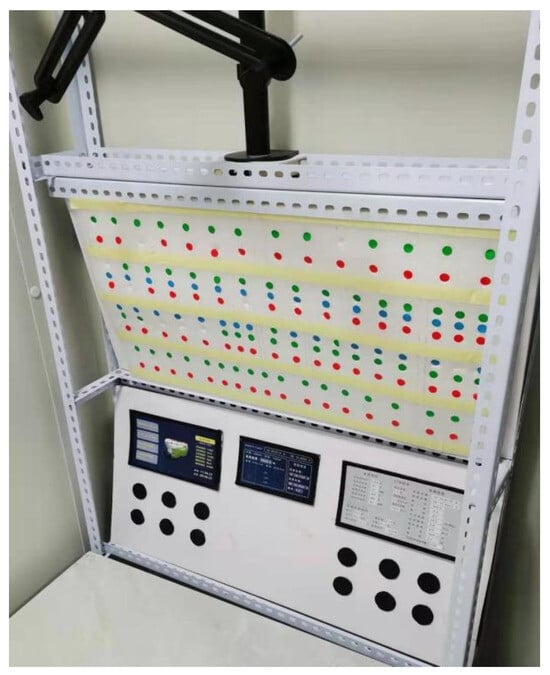
Figure 15.
Manned submersible experimental platform.
5.1. Data Acquisition
Data on physiological signals such as EEG and ECG were collected from the subjects through a single-lead EEG device and a low-power ECG sensor device. The subjects were allowed to wear the device for a significant period to reduce discomfort before the experiment began. The subjects were kept awake and completely physically relaxed to avoid affecting the level of cognitive load in subsequent experiments. The physiological data were recorded continuously during the experiment as the subjects performed the manipulation task. They completed the NASA-TLX subjective scale at the end of each task and then took a 5 min break before proceeding to the next.
5.2. Data Processing
The experimentally obtained EEG physiological data were processed and analyzed as described in Section 3.
5.3. Analysis of Validation Results
The EEG and ECG data were combined to form a physiological signal dataset. The 1D-CNN model assessed the cognitive load, and an overall classification accuracy of 85.37% was obtained. The accuracy of the low cognitive load classification was 90.91%, and the high cognitive load classification accuracy was 78.95%. The values of the evaluation metrics obtained through the 1D-CNN model’s validation are shown in Table 6. The results show that the model can assess the operator’s cognitive load and achieve a good classification effect. It can also be used to improve cabin layout designs and optimize the ergonomics.

Table 6.
Validation results of 1D-CNN model.
6. Results and Discussion
This study proposes a 1D-CNN model that directly identifies an operator’s cognitive load from EEG and ECG physiological signal data. The model effectively and comprehensively extracts features from the operator’s physiological signals while avoiding signal distortion issues that may arise during data processing and transformation.
Through experiments, the 1D-CNN model’s performance was validated, achieving an accuracy of 86.5% in cognitive load assessment. Compared with the BP neural network algorithm (74.5%) and the SVM algorithm (66.3%) proposed in previous studies, the 1D-CNN model converges more quickly and demonstrates better performance in cognitive load classification.
Compared with the BP neural network and SVM algorithms, the recognition rates of the 1D-CNN model improved by at least 8.2% and 19.5% for the low cognitive load and high cognitive load labels, respectively. One possible reason for this improvement is that the BP neural network and SVM algorithms are focused on global feature extraction, whereas the 1D-CNN model emphasizes local feature extraction. This allows it to effectively avoid interference noise distributed across specific frequency bands and automatically extract valid data features without manual intervention. Additionally, the modeling approach of the BP neural network is relatively simple, consisting only of hidden layers between the input and output layers with straightforward nonlinear relationships. The SVM algorithm, on the other hand, classifies data solely through hyperplanes. Compared with the 1D-CNN, these algorithms have too few parameters to extract effective features.
This study designed a six-layer convolutional pooling structure to capture features in layers. Layers 1–2 can better capture local temporal features in physiological signals, such as EEG spike detection. Layers 3–4 can effectively capture the mid-term dependence of physiological signals, such as HRV fluctuations. Layers 5–6 can capture global characteristic trends, such as sustained beta-wave elevation.
In order to rigorously demonstrate the rationality of the proposed 1D-CNN architecture, we conducted systematic ablation experiments and hyperparameter sensitivity analysis, and the results are shown in Table 7. Removing pooling degraded accuracy by 8.3%, as Model 1 failed to downsample noise-dominated features. Omitting dropout caused mild overfitting (training accuracy: 99.1%, test accuracy: 81.9%). The shallower Model 3 captured insufficient temporal features, especially for high-frequency EEG components. The optimal kernel size was 8 (accuracy: 86.5%), balancing local/global feature extraction. Smaller kernels (4) overfitted high-frequency noise, while larger kernels (16) blurred critical transient patterns. Doubling filters marginally improved accuracy (87.1%) but doubled training time. Halving filters reduced accuracy to 80.3%. Stride = 2 outperformed stride = 4 (accuracy: 86.5%, 82.6%), as aggressive pooling lost task-relevant HRV dynamics.

Table 7.
The 1D-CNN ablation experiment results.
In this study, experiments were conducted using the airtight cabin laboratory of the Department of Industrial Design, Northwestern Polytechnic University. The subjects performed information reading and keyword searches, and physiological data such as EEG and ECG were collected and analyzed in both low and high cognitive load states. The subjective perceptions of the subjects were measured in combination with the NASA-TLX subjective scale. Through screening, the data were compiled and analyzed to obtain the correlation characteristics of the EEG and ECG data with cognitive load.
The article’s primary contributions are evident in the following areas: (1) It introduces a 1D-CNN algorithm designed for the automatic extraction of features from raw EEG/ECG signals. (2) The feasibility of wireless signal acquisition in a sealed cabin environment has been confirmed, offering a novel testing approach for physiological signal collection in subsequent research involving individuals in such environments, thereby reducing participant interference. (3) Through data analysis, the study investigates the correlation between cognitive load and EEG and ECG signals, establishing a dataset of physiological characteristics for individuals in confined spaces. This dataset is intended to be scalable, laying the foundation for future research into cognitive load assessment methodologies. (4) The algorithm demonstrates superior accuracy (86.5%) compared to SVM and BP neural networks.
7. Conclusions
This study aimed to solve the problems of low classification accuracy and tedious manual feature extraction with machine learning algorithms. The main conclusions are as follows:
- (1)
- This study proposes a cognitive load assessment method based on a 1D-CNN model. It combines the one-dimensional nature of physiological data such as EEG and ECG with the advantages of convolutional neural networks for automatic feature extraction.
- (2)
- In the experiments, the 1D-CNN model achieved 86.5% accuracy in cognitive load recognition, effectively and automatically extracting more features from physiological parameters. Additionally, in a simulated environment for manned submersibles, the cognitive load recognition accuracy achieved by the 1D-CNN model reached 85.4%.
- (3)
- This study validated the feasibility of wireless collection methods for EEG and ECG signal data in assessing the cognitive load of operators in confined spaces, providing a new approach for subsequent research on collecting physiological signals from operators in enclosed environments.
- (4)
- Through data analysis, this study examined the correlation features between cognitive load and EEG and ECG signals, establishing a physiological characteristic dataset for individuals in confined spaces.
8. Limitations and Future Developments
Airtight cabins contain highly complex human–machine relationships involving multiple factors, such as humidity, noise, temperature, and radiation. In addition, humans are extremely complex and difficult to study. Both physiological and psychological factors can impact cognitive load. In this study, we explored the cognitive load assessment methods for confined chamber operators from the perspectives of EEG and ECG. However, many issues require deeper research.
Owing to the characteristics of airtight cabins and considering the feasibility of subsequent field experiments, this study employed portable single-channel sensors to capture physiological data to minimize interference with the operators. However, this represents a significant limitation of our work, as reliance on single-channel EEG and ECG sensors may hinder a comprehensive assessment of an operator’s cognitive load. More complex multi-channel data, such as those obtained from ring electrodes or integrated electrode caps, could provide deeper insights. Additionally, owing to the unique conditions faced by operators in airtight cabins, there were a limited number of suitable subjects for this experiment, resulting in a restricted dataset. But the subjects selected for this study were all relatively professional, and the 1D-CNN dataset was enhanced through the sliding window method, improving the performance of the model.
Therefore, in future research, efforts should first focus on collecting more comprehensive EEG data from multiple channels. This will better reveal how EEG signals from various regions of the brain reflect the cognitive load of operators and facilitate analyses of synchronization differences in multi-channel EEG signal data. Second, when considering a range of real-world confined space environments and more complex operational tasks, it is important to expand the sample size to enhance the performance of the proposed 1D-CNN cognitive load assessment model. This will also facilitate evaluations of the proposed methodology’s effectiveness in practical applications. Third, it would be beneficial to design adaptive strategies to optimize the model parameters for the algorithms used in this study. Lastly, physiological data such as skin conductance and respiratory rate, which are one-dimensional time series data, could be trained using the proposed 1D-CNN network. Integrating more comprehensive physiological data might enhance the model strategy, making cognitive load recognition methods more broadly applicable.
This study is mainly based on the special environment of a closed cabin, and the universality of the research results is limited by the number of subjects. It is a preliminary research result, and future work will include different participants and environments.
Supplementary Materials
The following supporting information can be downloaded at: https://www.mdpi.com/article/10.3390/sym17060915/s1.
Author Contributions
Conceptualization, L.W. and J.W.; methodology, L.W. and D.C.; software, J.W.; validation, L.W. and J.S.; writing—original draft preparation, L.W.; writing—review and editing, J.W. and D.C.; visualization, J.S.; supervision, D.C. and J.W.; project administration, D.C.; funding acquisition, D.C. and J.W. All authors have read and agreed to the published version of the manuscript.
Funding
This research was funded by the National Key R&D Program of China, grant number 2021YFC2800600; the Province Key R&D Program of Shaanxi, grant number 2022GY-311; and the Innovation Foundation for Doctor Dissertation of Northwestern Polytechnical University, grant number, CX2023049.
Data Availability Statement
The original contributions presented in this study are included in the article/Supplementary Material. Further inquiries can be directed to the corresponding author.
Conflicts of Interest
The authors declare no conflicts of interest.
Abbreviations
The following abbreviations are used in this manuscript:
| List of Symbols | |
| Symbols | Explanation of Symbols |
| α | Alpha wave, one of the four types of brain waves; the physiological significance is awake, quiet, or resting with eyes closed. |
| θ | Theta wave, one of the four types of brain waves; the physiological significance is fatigue, depressed mood. |
| β | Beta wave, one of the four types of brain waves; the physiological significance is concentration and wakefulness. |
| δ | Delta wave, one of the four types of brain waves; the physiological significance is sleeping. |
| The sampling frequency of the EEG signal. | |
| Normalized data. | |
| Original data. | |
| The maximum value of the original data. | |
| The minimum value of the original data. | |
| Represents the -th value in the output physiological signal feature vector. | |
| denotes the -th weight in the 1D-CNN convolutional kernel. | |
| Corresponds to the one-dimensional convolution operation. | |
| refers to the -th value in the input physiological signal sequence. | |
| TP | The real category is the positive samples, and the model predicts the number of positives. |
| FP | The real category is the negative samples, and the model predicts the number of positives. |
| FN | The real category is the positive samples, and the model predicts the number of negatives. |
| TN | The real category is the negative samples, and the model predicts the number of negatives. |
| Specificity (Spe) | The ability of the model to predict negative samples, that is, the number of negative samples predicted to be negative among all negative samples. |
| Sensitivity (Sen) | The ability of the model to predict positive samples, that is, similar to specificity, the number of positive samples predicted as positive among all positive samples. |
| Positive Predictive Value (PPV) | The correct rate of the model predicting positive samples, that is, the number of positive samples that are predicted correctly. |
| Accuracy (Acc) | The total correct rate of model predictions, that is, the number of completely correct classifications in all samples. |
| List of Abbreviations | |
| Abbreviations | The Full Name of the Abbreviation |
| 1D-CNN | One-Dimensional Convolutional Neural Network |
| EEG | Electroencephalography |
| ECG | Electrocardiogram |
| HR | Heart Rate |
| HRV | Heart Rate Variability |
| CNN | Convolutional Neural Network |
| SVM | Support Vector Machine |
| LSTM | Long Short-Term Memory |
| GRU | Gated Recurrent Unit |
| NASA-TLX | National Aeronautics and Space Administration Task Load Index |
Appendix A
The content of the cognitive test compiled by the E-prime software is as follows:
Perceptual speed test: Perceptual speed mainly refers to the time it takes for people to respond to objective things acting on the brain. If the reaction time is short, the perception speed is fast; otherwise, the perception speed is slow. In this experiment, digital positioning was used to examine the immediate response and discrimination ability of the subjects. A table with eight numeric intervals appears on the screen, and subjects quickly answer the correct interval based on the assigned numbers given.
N-back task: N-back, as the name suggests, means to go back n times, a cognitive task that requires memory. In this experiment, many numbers are displayed on the computer screen, and these numbers appear one after the other. The subject needs to compare the number they see now with the previous number, n, to see if they are the same. If different, they press the “F” key; otherwise, they press the “J” key. In the experiment, subjects were required to complete a two-back task, that is, to compare the number displayed on the screen with the second number back to see if they were the same.
Graphic digital coding: Graphical digital coding is a task that requires responsiveness and understanding. Three figures appear on the screen, namely, a triangle, square, and circle, corresponding to different numbers: 1, 2, and 3, respectively. The subjects need to write down the numbers corresponding to all the figures and then display a certain figure in the middle of the computer screen. They need to press the corresponding figure immediately and make sure that the time does not exceed 5 s; the experiment needs to be completed in 6. When performing the experiment for the second time, the rules of the question change; that is, the number corresponding to each figure changes, and the subject needs to write it down in a short time in order to quickly touch the figure corresponding to the next one displayed.
Visual search: Visual search is a target-specific search-aware task that requires attention. In this experiment, a picture appears in the middle of the screen. The subject searches among many triangles with tails (distractors) in the picture to find out whether there is a different triangle (target). The subjects searched for the target in the presence of interference items; if there was a target, they pressed the “J” key; otherwise, they pressed the “F” key.
Appendix B
In addition, several model evaluation indicators were derived from the above four statistics, including specificity (Spe), sensitivity (Sen), positive predictive value (PPV), and accuracy (Acc). The accuracy rate evaluates the overall performance of the model’s method. The calculation formula is
References
- Hidalgo-Muñoz, A.R.; Béquet, A.J.; Astier-Juvenon, M.; Pépin, G.; Fort, A.; Jallais, C.; Tattegrain, H.; Gabaude, C. Respiration and Heart Rate Modulation Due to Competing Cognitive Tasks While Driving. Front. Human. Neurosci. 2019, 12, 525. [Google Scholar] [CrossRef] [PubMed]
- Cisnal, A.; Antolínez, D.; Turiel, J.P.; Fraile, J.C.; De La Fuente, E. A Versatile Embedded Platform for Implementation of Biocooperative Control in Upper-Limb Neuromotor Rehabilitation Scenarios. IEEE Access 2023, 11, 35726–35736. [Google Scholar] [CrossRef]
- Zagermann, J.; Pfeil, U.; Reiterer, H. Measuring Cognitive Load using Eye Tracking Technology in Visual Computing. In Proceedings of the Beyond Time and Errors on Novel Evaluation Methods for Visualization, BELIV ’16, Baltimore, MD, USA, 24 October 2016; ACM Press: Baltimore, MD, USA, 2016; pp. 78–85. [Google Scholar]
- Iskander, J.; Hanoun, S.; Hettiarachchi, I.; Hossny, M.; Saleh, K.; Zhou, H.; Nahavandi, S.; Bhatti, A. Eye Behaviour as a Hazard Perception Measure. In Proceedings of the 12th Annual IEEE International Systems Conference, Vancouver, BC, Canada, 23–26 April 2018; pp. 1–6. [Google Scholar]
- Solhjoo, S.; Haigney, M.C.; McBee, E.; van Merrienboer, J.J.G.; Schuwirth, L.; Artino, A.R.; Battista, A.; Ratcliffe, T.A.; Lee, H.D.; Durning, S.J. Heart Rate and Heart Rate Variability Correlate with Clinical Reasoning Performance and Self-Reported Measures of Cognitive Load. Sci. Rep. 2019, 9, 14668. [Google Scholar] [CrossRef]
- Lv, Z.; Zhang, J.; Oma, E. A Novel Method of Emotion Recognition from Multi-Band EEG Topology Maps Based on ERENet. Appl. Sci. 2022, 12, 10273. [Google Scholar] [CrossRef]
- Zhou, Y.; Liu, X.; Wen, D.; Xu, S.; Wan, X.; Lu, H. Spatial Cognitive Electroencephalogram Network Topological Features Extraction Based on Cross Fuzzy Entropy Network Graph. Symmetry 2025, 17, 243. [Google Scholar] [CrossRef]
- Cheng, E.J.; Young, K.Y.; Lin, C.T. Temporal EEG Imaging for Drowsy Driving Prediction. Appl. Sci. 2019, 9, 5078. [Google Scholar] [CrossRef]
- Sun, J.; Jiang, T.; Wang, C.; Liu, W.; Jiang, C.; Sun, H.; Song, L.; Cui, Y.; Yang, Y.; Zhang, X. Research on Ergonomic Evaluation Indicator and Methodology for Interactive Interface of Spacecraft Software. Manned Spacefl. 2020, 26, 208–213. [Google Scholar]
- Zhang, S.; He, W.; Chen, D.; Chu, J.; Fan, H. A dynamic human reliability assessment approach for manned submersibles using PMV-CREAM. Int. J. Nav. Archit. Ocean. Eng. 2019, 11, 782–795. [Google Scholar] [CrossRef]
- Alfredson, J.; Holmberg, J.; Andersson, R.; Wikforss, M. Applied Cognitive Ergonomics Design Principles for Fighter Aircraft. Lect. Notes Comput. Sci. 2011, 6781, 473–483. [Google Scholar]
- Ye, C.; Xu, W.; Liu, S. Application of ergonomics to layout design of manned submersible. J. Northwestern Polytech. Univ. 2021, 39, 233–240. [Google Scholar] [CrossRef]
- Hemakom, A.; Atiwiwat, D.; Israsena, P. ECG and EEG based machine learning models for the classification of mental workload and stress levels for women in different menstrual phases, men, and mixed sexes. Biomed. Signal Process. Control 2024, 95, 106379. [Google Scholar] [CrossRef]
- Tjolleng, A.; Jung, K.; Hong, W.; Lee, W.; Lee, B.; You, H.; Son, J.; Park, S. Classification of a Driver’s Cognitive Workload Levels Using Artificial Neural Network on ECG Signals. Appl. Ergon. 2017, 59, 326–332. [Google Scholar] [CrossRef] [PubMed]
- Tabar, Y.R.; Halici, U. A Novel Deep Learning Approach for Classification of EEG Motor Imagery Signals. J. Neural Eng. 2017, 14, 16003. [Google Scholar] [CrossRef] [PubMed]
- Wang, J.; Chen, D.; Zhang, X.; Zhu, M. Real-time anthropometric data-driven evaluation method for complex console layout design. Comput. Ind. Eng. 2023, 183, 109463. [Google Scholar] [CrossRef]
- Shi, G.; Song, Y.; Li, L.; Hu, L.; Jia, H.; Gui, C.; Zang, L.; Duan, Y.; Yu, F.; Wang, C.; et al. Design of Cockpit Ergonomic Evaluation Simulation System Based on Augmented Reality. In Proceedings of the 11th International Conference on Intelligent Human-Machine Systems and Cybernetics (IHMSC), Hangzhou, China, 24–25 August 2019; pp. 33–36. [Google Scholar]
- Andrews, J.M.; Rusnock, C.F.; Miller, M.E.; Meador, D.P. Simulation-Based Evaluation of the Effects of Varying Degrees of Control Abstraction for Manned-Unmanned Teaming on Mental Workload of Pilots. In Proceedings of the IEEE International Conference on Systems, Man and Cybernetics, Toronto, ON, Canada, 11–14 October 2020; pp. 2680–2686. [Google Scholar]
- Lagomarsino, M.; Lorenzini, M.; De Momi, E.; Ajoudani, A. An Online Framework for Cognitive Load Assessment in Industrial Tasks. Robot. Comput. -Integr. Manuf. 2022, 78, 102380. [Google Scholar] [CrossRef]
- Wang, J.; Chen, D.; Zhu, M.; Wang, H.; Sun, Y. Recognition method of submarine operation posture based on convolutional pose machines. J. Zhejiang Univ. (Eng. Sci.) 2022, 56, 26–35. [Google Scholar]
- Xiong, R.; Kong, F.; Yang, X.; Liu, G.; Wen, W. Pattern Recognition of Cognitive Load Using EEG and ECG Signals. Sensors 2020, 20, 5122. [Google Scholar] [CrossRef]
- Na, K. The Effects of Cognitive Load on Query Reformulation: Mental Demand, Temporal Demand and Frustration. Aslib J. Inf. Manag. 2021, 73, 436–453. [Google Scholar] [CrossRef]
- Haapalainen, E.; Kim, S.; Forlizzi, J.F.; Dey, A.K. Psycho-Physiological Measures for Assessing Cognitive Load. In Proceedings of the 2010 ACM Conference on Ubiquitous Computing, New York, NY, USA, 26–29 September 2010; pp. 301–310. [Google Scholar]
- Baranov, V.V.; Shelupanov, A.A. Cognitive Model for Assessing the Security of Information Systems for Various Purposes. Symmetry 2022, 14, 2631. [Google Scholar] [CrossRef]
- Chen, B.; Yu, Y.; Ding, L. Correlation analysis of physiological parameters of pilot mental workload based on flight simulation. Biomed. Signal Process. Control 2025, 109, 108024. [Google Scholar] [CrossRef]
- van Weelden, E.; Alimardani, M.; Wiltshire, T.J.; Louwerse, M.M. Aviation and neurophysiology: A systematic review. Appl. Ergon. 2022, 105, 103838. [Google Scholar] [CrossRef] [PubMed]
- Dussault, C.; Jouanin, J.-C.; Guezennec, C.-Y. EEG and ECG changes during selected flight sequences. Aviat. Space Environ. Med. 2004, 75, 889–897. [Google Scholar] [PubMed]
- Liang, Y.; Reyes, M.L.; Lee, J.D. Real-Time Detection of Driver Cognitive Distraction Using Support Vector Machines. IEEE Trans. Intell. Transp. Syst. 2007, 8, 340–350. [Google Scholar] [CrossRef]
- Amin, H.U.; Malik, A.S.; Ahmad, R.F.; Badruddin, N.; Kamel, N.; Hussain, M.; Chooi, W.-T. Feature Extraction and Classification for EEG Signals Using Wavelet Transform and Machine Learning Techniques. Australas. Phys. Eng. Sci. Med. 2015, 38, 139–149. [Google Scholar] [CrossRef]
- Zhang, Y.; Gao, J.; Zhou, H. Breeds Classification with Deep Convolutional Neural Network. In Proceedings of the ACM International Conference Proceeding Series, Shenzhen, China, 15–17 February 2020; pp. 145–151. [Google Scholar]
- Wang, J.; Chen, D.; Zhu, M.; Sun, Y. Risk assessment for musculoskeletal disorders based on the characteristics of work posture. Autom. Constr. 2021, 131, 103921. [Google Scholar] [CrossRef]
- Montenegro, L.; Abreu, M.; Fred, A.; Machado, J.M. Human-Assisted vs. Deep Learning Feature Extraction: An Evaluation of ECG Features Extraction Methods for Arrhythmia Classification Using Machine Learning. Appl. Sci. 2022, 12, 7404. [Google Scholar] [CrossRef]
- Han, S.-Y.; Kwak, N.-S.; Oh, T.; Lee, S.-W. Classification of pilots’ mental states using a multimodal deep learning network. Biocybern. Biomed. Eng. 2020, 40, 324–336. [Google Scholar] [CrossRef]
- Baldwin, C.L.; Penaranda, B. Adaptive Training Using an Artificial Neural Network and EEG Metrics for Within- and Cross-Task Workload Classification. NeuroImage 2012, 59, 48–56. [Google Scholar] [CrossRef]
- Tjolleng, A.; Jung, K. Development of a Real-Time System for Detecting Driver’s Cognitive Load Using Multi-Layer Artificial Neural Network on ECG Signals. J. Ergon. Soc. Korea 2020, 39, 625–636. [Google Scholar] [CrossRef]
- Kim, D.; Ruy, W. CNN-based fire detection method on autonomous ships using composite channels composed of RGB and IR data. Int. J. Nav. Archit. Ocean Eng. 2022, 14, 100489. [Google Scholar] [CrossRef]
- Wan, X.; Sun, Y.; Wu, Z.; Wen, D. Characterization of Spatial Cognitive EEG Signals Using Normalized Adjusted Permutation Conditional Mutual Information. Symmetry 2025, 17, 130. [Google Scholar] [CrossRef]
- Jiao, Z.; Gao, X.; Wang, Y.; Li, J.; Xu, H. Deep Convolutional Neural Networks for Mental Load Classification Based on EEG Data. Pattern Recognit. 2018, 76, 582–595. [Google Scholar] [CrossRef]
- Zhu, M.; Chen, D.; Wang, J.; Sun, Y. Analysis of oceanaut operating performance using an integrated Bayesian network aided by the fuzzy logic theory. Int. J. Ind. Ergon. 2021, 83, 103129. [Google Scholar] [CrossRef]
- Abuqaddom, I.; Mahafzah, B.A.; Faris, H. Oriented Stochastic Loss Descent Algorithm to Train Very Deep Multi-Layer Neural Networks Without Vanishing Gradients. Knowl. -Based Syst. 2021, 230, 107391. [Google Scholar] [CrossRef]
Disclaimer/Publisher’s Note: The statements, opinions and data contained in all publications are solely those of the individual author(s) and contributor(s) and not of MDPI and/or the editor(s). MDPI and/or the editor(s) disclaim responsibility for any injury to people or property resulting from any ideas, methods, instructions or products referred to in the content. |
© 2025 by the authors. Licensee MDPI, Basel, Switzerland. This article is an open access article distributed under the terms and conditions of the Creative Commons Attribution (CC BY) license (https://creativecommons.org/licenses/by/4.0/).