1. Introduction
With the continuous progress of urbanization, the public travel demand is growing, and road traffic congestion has become the norm. The metro has emerged as a mainstream mode of travel in large cities due to its punctuality, convenience, and independent right-of-way. As of December 2024, 58 cities in mainland China have opened 361 metro lines for operation, with an operating mileage of 9306.09 km and a cumulative total of 32.257 billion passenger trips for the year. The rapid growth of passenger traffic, along with the imbalance of spatial and temporal distributions, has caused the carrying capacity of the backbone lines in the network to exceed the load. Some lines are near or even oversaturated during peak hours. Trains and passengers, as two vital components of the subway system, determine the supply and demand of its capacity. The delay of passengers at the station during peak hours has greatly increased the safety risk. Meanwhile, shorter intervals between train departures have also put tremendous pressure on the train operation equipment. Asymmetries between supply and demand can result in a less resilient system, making it challenging for transportation tasks to operate efficiently and safely. Therefore, there is an urgent need to implement reasonable and effective operation adjustment strategies to ensure the safety and stability of the metro system.
Existing studies on operational adjustment strategies for subway systems have focused on two main aspects: train operation strategies and passenger flow control strategies. However, traditional train scheduling optimization, even with the shortest possible headway intervals, cannot match the peak-hour passenger demand [
1]. At the same time, it is difficult to come up with a precise set of passenger flow control programs based on the experience of frontline staff alone, and blind restrictions cannot effectively divert the backlog of passengers in the system.
Therefore, some scholars consider both passenger flow control strategies and train scheduling optimization. Reducing passenger wait times through directional train scheduling and flow control on oversaturated metro lines to alleviate the supply–demand conflict in the metro system [
2]. As a key node where passengers interact with the train, the arrival time and stopping status of the train determine the carrying pressure on the platform during peak hours. Therefore, this study aims to model the interaction between trains and platform passengers in different stopping states. By considering the symmetrical positions of trains and passengers, the system resilience of the metro system is enhanced when facing a peak passenger flow and sudden passenger flow pressure, which effectively addresses the challenges of risk and efficiency in oversaturated metro lines.
To the best of our knowledge, existing studies have hardly considered the effect of stopping states on cooperative control strategies in oversaturated lines when trains pass through stations that have reached their capacity limits. This tends to overestimate the transportation efficiency of the system and underestimate its security risks. In light of this, the contributions of this study can be summarized as follows:
- (1)
The first synergistic control framework of the stopping state: Based on the cooperative theory, it reveals the role of the train-stopping state as a system order parameter in regulating the symmetry of the train–passenger flow. We solve the problem of supply–demand granularity asymmetry in the traditional cooperative framework. An optimization model was developed to minimize the passenger delay and total boarding time. The interplay between passenger delays and train crowding is effectively considered to enhance the effectiveness of the metro system.
- (2)
Proposing a co-evolutionary optimization algorithm: An improved artificial bee colony algorithm is proposed to address the cooperative passenger flow control optimization problem. To enhance the algorithm’s search capability, evolutionary operators and an improved tabu search were employed to generate new food sources for the employed bee. This ensures population diversity during the scout bee stage, while enhancing the localized search ability of bees in the employed stage.
- (3)
Constructing a quantitative risk-efficiency assessment system: The performance and effectiveness of the proposed method are verified through a real case study of Shanghai Metro operation data. Experimental results show that the proposed optimization model and algorithm can efficiently generate cooperative control strategies. By optimizing the train stopping status, the platform congestion was significantly reduced, and the total passenger delay time was decreased by 36.26%. We posit a reusable cooperative control paradigm for high-density metro networks.
The remainder of this paper is organized as follows.
Section 2 summarizes the past contributions of passenger flow control strategies.
Section 3 describes the metro system business process in the context of defining the train-stopping state.
Section 4 develops a Collaborative passenger flow control optimization model.
Section 5 proposes an improved artificial bee colony algorithm.
Section 6 presents a case study based on the Shanghai Metro.
Section 7 presents the conclusions of this study.
2. Literature Review
In this section, we conduct a literature review from three aspects: train schedule research, passenger flow control research, and collaborative control research.
Table 1 describes the main research contents and methods of the passenger flow control problem.
2.1. Train Schedule Research
Reasonable train schedule designs can effectively improve transportation efficiency. In recent years, researchers have conducted extensive studies on train schedule optimization. Sparing and Goverde [
11] describe an optimization method to find a feasible periodic timetable that also ensures maximum stability for heterogeneous railway networks. The model is capable of handling flexible train orders, running and dwell times, and overtaking locations. Li et al. [
12] proposed a mixed-integer nonlinear programming model, developed to collaboratively adjust train stopping patterns and schedules to minimize passenger travel times in the express/local mode. To obtain a high-quality timetable while simultaneously considering more realistic conditions, Dong et al. [
13] proposed an integrated combination optimization model for both train stop plans and timetables under a time-dependent passenger demand. Huang et al. [
14] incorporated multimodal coordination into the timetabling optimization of the last trains in an urban railway network and progressively discussed three models to optimize the last train timetable while incorporating multimodal coordination. Similarly, to extend the energy-efficient timetabling from one single line to multiple interlinked lines, Huang et al. [
4] proposed a bi-level model that incorporates the operator’s decision on a regular timetable and passengers’ path choice in a URT network. Huang et al. [
15] created a double-layer public transport network consisting of subway and bus lines and stations. Furthermore, Huang et al. [
3] proposed a general model framework of the timetabling and passenger path choice in a URT network to minimize the energy consumption under passenger travel time constraints. Considering an overcrowded and time-dependent passenger flow, Gao et al. [
16] proposed an optimization model to reschedule a metro line.
2.2. Passenger Flow Control Research
In recent years, to alleviate the delays and safety hazards caused by the gathering of passengers inside and outside the station, optimizing metro passenger flow control has become a popular focus for researchers. Xu et al. [
5] constructed a bridge between the station capacity and LOS to aid in selecting the appropriate LOS value in the passenger flow control, balancing both passenger satisfaction and station managers’ achievements. Jiang et al. [
17] proposed a new reinforcement learning-based method developed to optimize the inflow volume during specific periods at each station with the aim of minimizing safety risks to passengers at metro stations. Yoo et al. [
18] presented a cost-effective strategy to reduce train delays by managing the passenger flow at the station entry. Meng et al. [
7] proposed an effective method for formulating a robust passenger flow control strategy across a metro line, specifically considering stochastic and dynamic passenger flows. Liang et al. [
10] focused on designing an online passenger flow control policy to manage passenger flow in each origin–destination (OD) pair to minimize the total passenger waiting time during the research horizon. Zhang et al. [
19] investigated the passenger flow control issue to increase the number of boarding passengers.
It is important to note that most of the above studies assume the already established train schedules as a precondition. The synergistic relationship between train scheduling and passenger flow control has not been explored in depth. Additionally, the efficiency, safety, and equity of transportation systems are often challenging to consider in an integrated manner. Therefore, a more comprehensive approach to optimization is essential.
2.3. Collaborative Control Research
However, in oversaturated lines, it is often difficult to resolve the conflict between the system capacity and passenger demand using only a single optimization strategy. The researchers considered co-optimizing train schedules with the passenger flow control to alleviate station congestion and reduce passenger wait times. For instance, Li et al. [
20] proposed a coupled state–space model for the evolution of the departure time and the passenger load of each train at each station. Jiang et al. [
21] constructed a utility theory-based model by setting station hopping policies as decision variables. Jiang et al. [
22] proposed a novel Q-learning-based approach to this combination optimization problem, aiming to minimize the penalty value of passengers stranded along the whole line. Liu et al. [
6] presented a collaborative optimization method for metro train scheduling and train connections combined with a passenger control strategy on a bi-directional metro line. Gong et al. [
23] considered train regulation constraints and passenger loading dynamics, formulating a mixed-integer linear programming model. Zhou et al. [
23] proposed a joint optimization method for train scheduling and rolling stock circulation planning, taking into account passenger flow control strategies on a tidal oversaturated metro line, where different types of rolling stocks with various loading capacities are put into operation to meet the uneven passenger demand during different periods. Zhang et al. [
24] proposed a new collaborative optimization model for the train timetable, passenger control, and rolling stock schedule on a bi-directional metro line experiencing an unbalanced passenger demand.
Despite the significant contributions of these studies, several limitations still need to be addressed. Existing studies have focused on system-level optimization, often neglecting the impact of the train stopping status on the effectiveness of the passenger flow control. Furthermore, the selected indicators do not intuitively reflect the level of train service, which may result in the failure to obtain the optimal control scheme. To tackle these limitations, this study proposes a Collaborative passenger flow control method that considers the stopping state of the train, aiming to minimize passenger travel delays and maximize the total number of boardings.
3. Problem Statement
Metro operation and management units, along with passengers, have common needs to achieve travel objectives and for enterprises to fulfill passenger transportation tasks; however, inevitable contradictions arise. From the operator’s perspective, the goal is to organize the traffic and passenger transportation as efficiently as possible while ensuring safety. Passengers, on the other hand, seek a comfortable service and timely arrivals at their destinations. The existing passenger flow control measures primarily focus on ensuring operational safety [
25,
26]. Therefore, when developing an optimization strategy, it is crucial to meet the passenger demand as much as possible while maintaining operational safety.
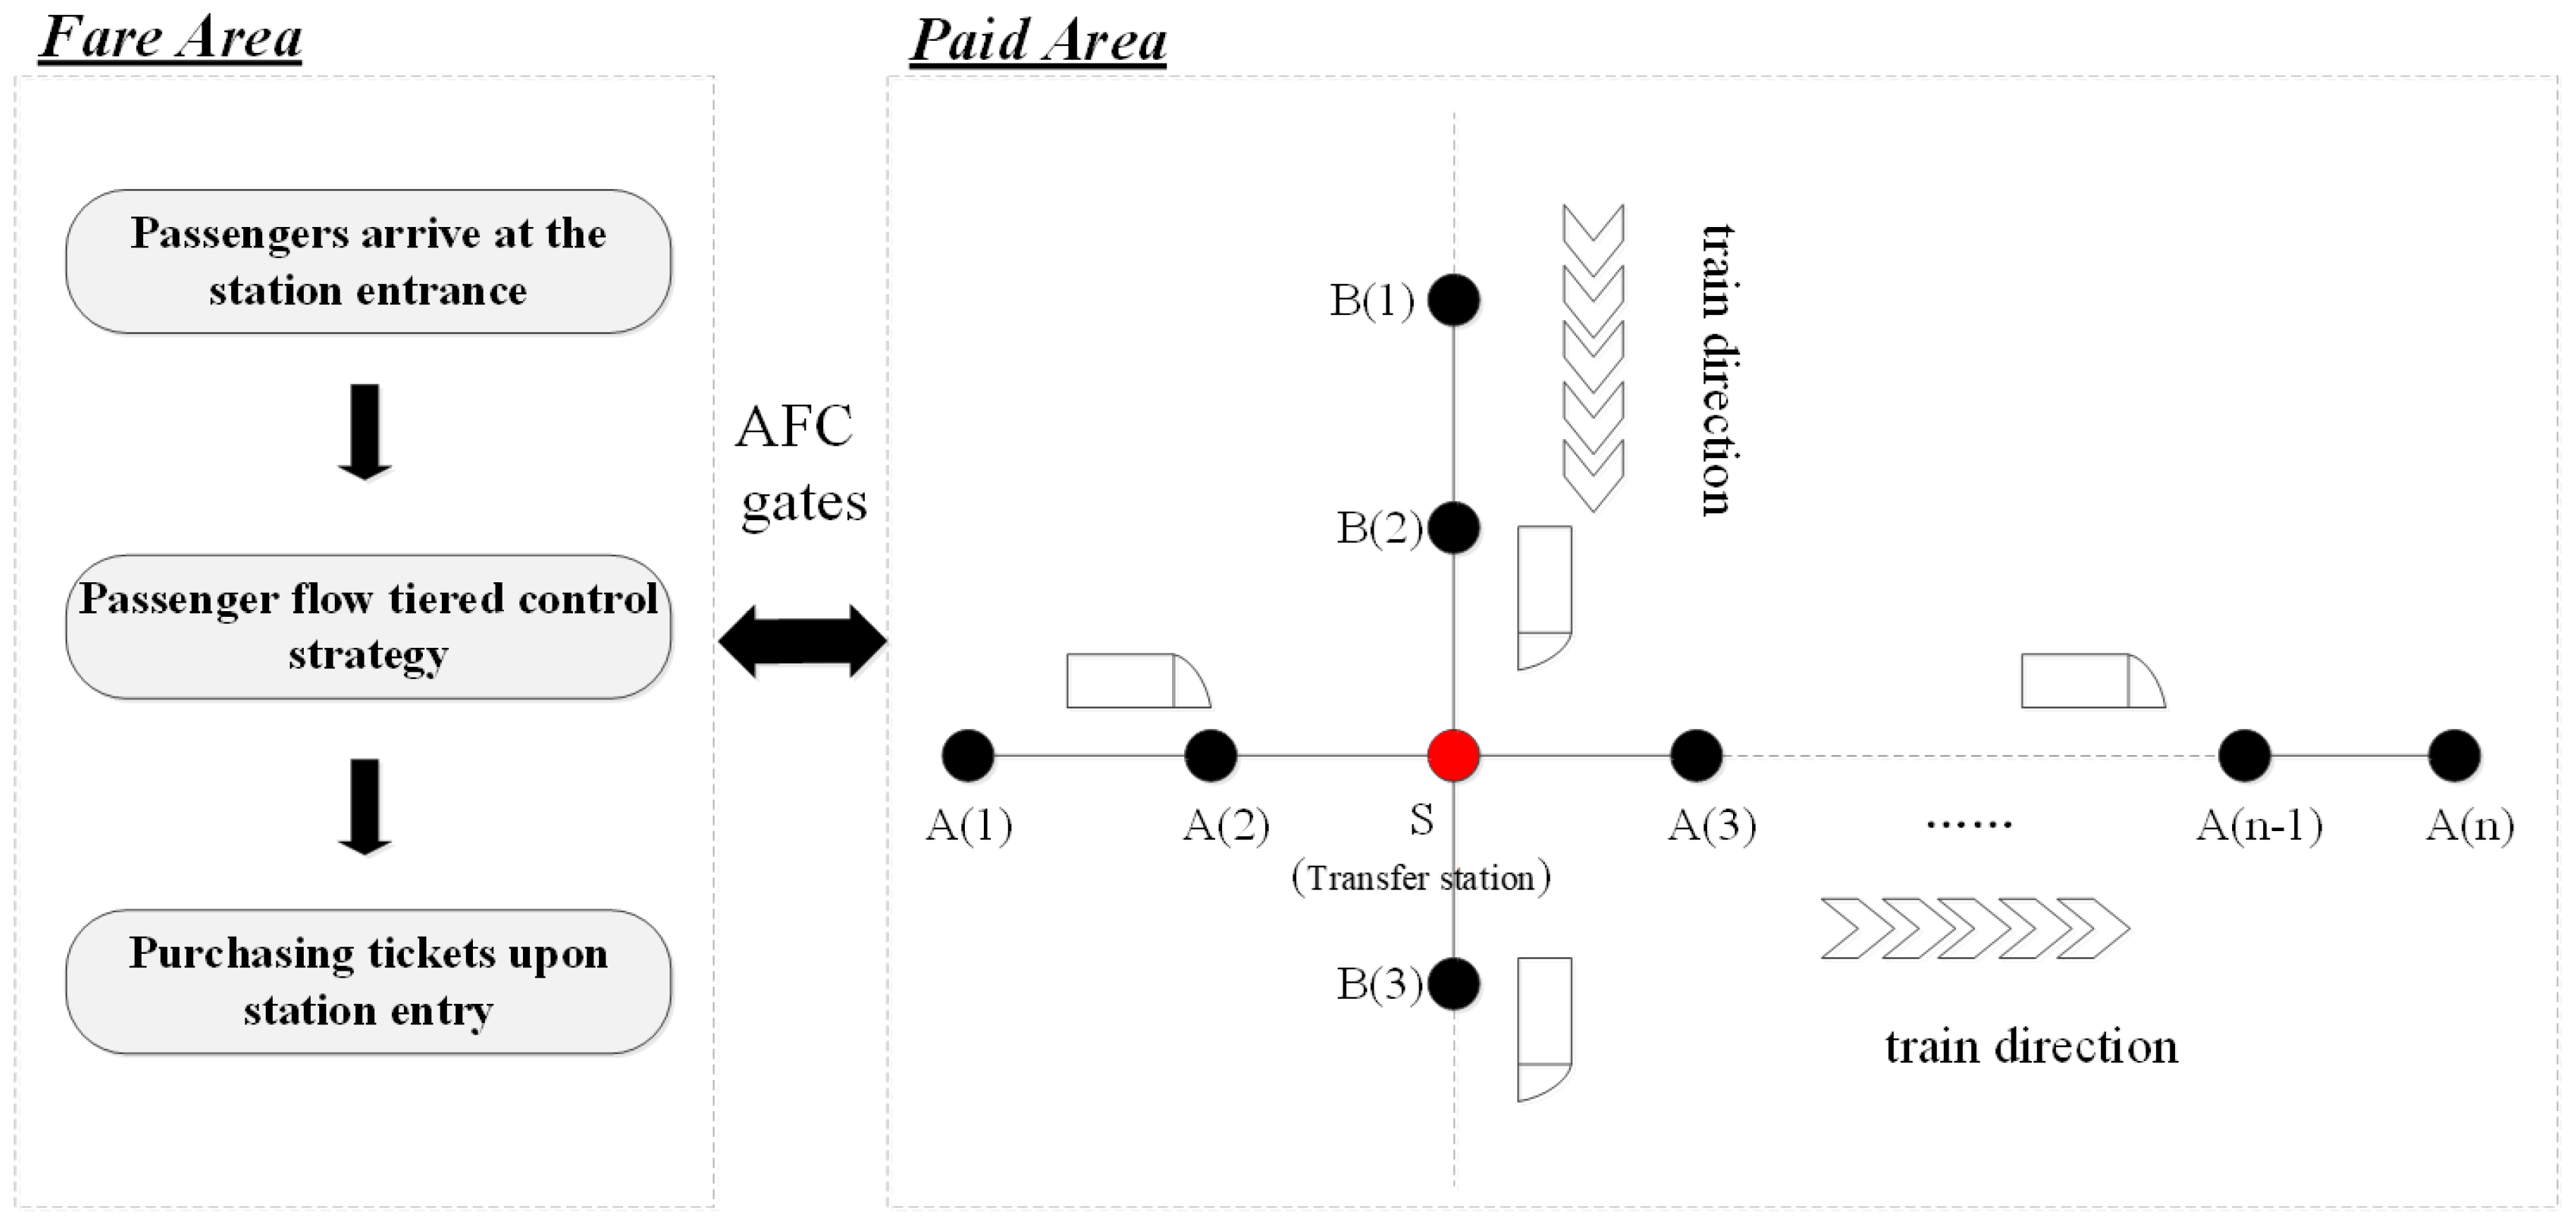
The metro network consists of lines connected by stations and rail facilities. Trains run on the lines according to the timetable, stopping at each station and facilitating passenger movement.
Figure 1 depicts the transportation business process through the interactions occurring between passengers, trains, and stations. Passengers passing through the gates represent their transition from the fare area to the paid area, which also indicates their official entry into the subway system [
9].
In daily operation and management, if the train adopts the station stop mode and does not implement multi-station coordinated passenger flow control, all trains will prioritize serving upstream stations. This will result in a gradual decrease in the train’s remaining capacity and is likely to cause a significant backup of passengers at downstream stations. Therefore, it is necessary to optimize the passenger flow control mode of the metro by adjusting the organizational operation mode to enhance the match between the capacity supply and passenger flow demand.
Passenger flow control in the metro system is essentially the realization of a system equilibrium by dynamically regulating the symmetrical relationship between the train operation and passenger flow. This symmetry is not a simple geometric symmetry but is embodied in deeper dimensions, such as the spatio-temporal resource allocation, matching of supply and demand, and system stability. The essence of metro passenger flow control is to find a dynamic balance between maintaining safety and efficiency. The ultimate goal is to maintain the system in a stable ordered state far from equilibrium in dissipative structure theory through precise symmetry manipulation.
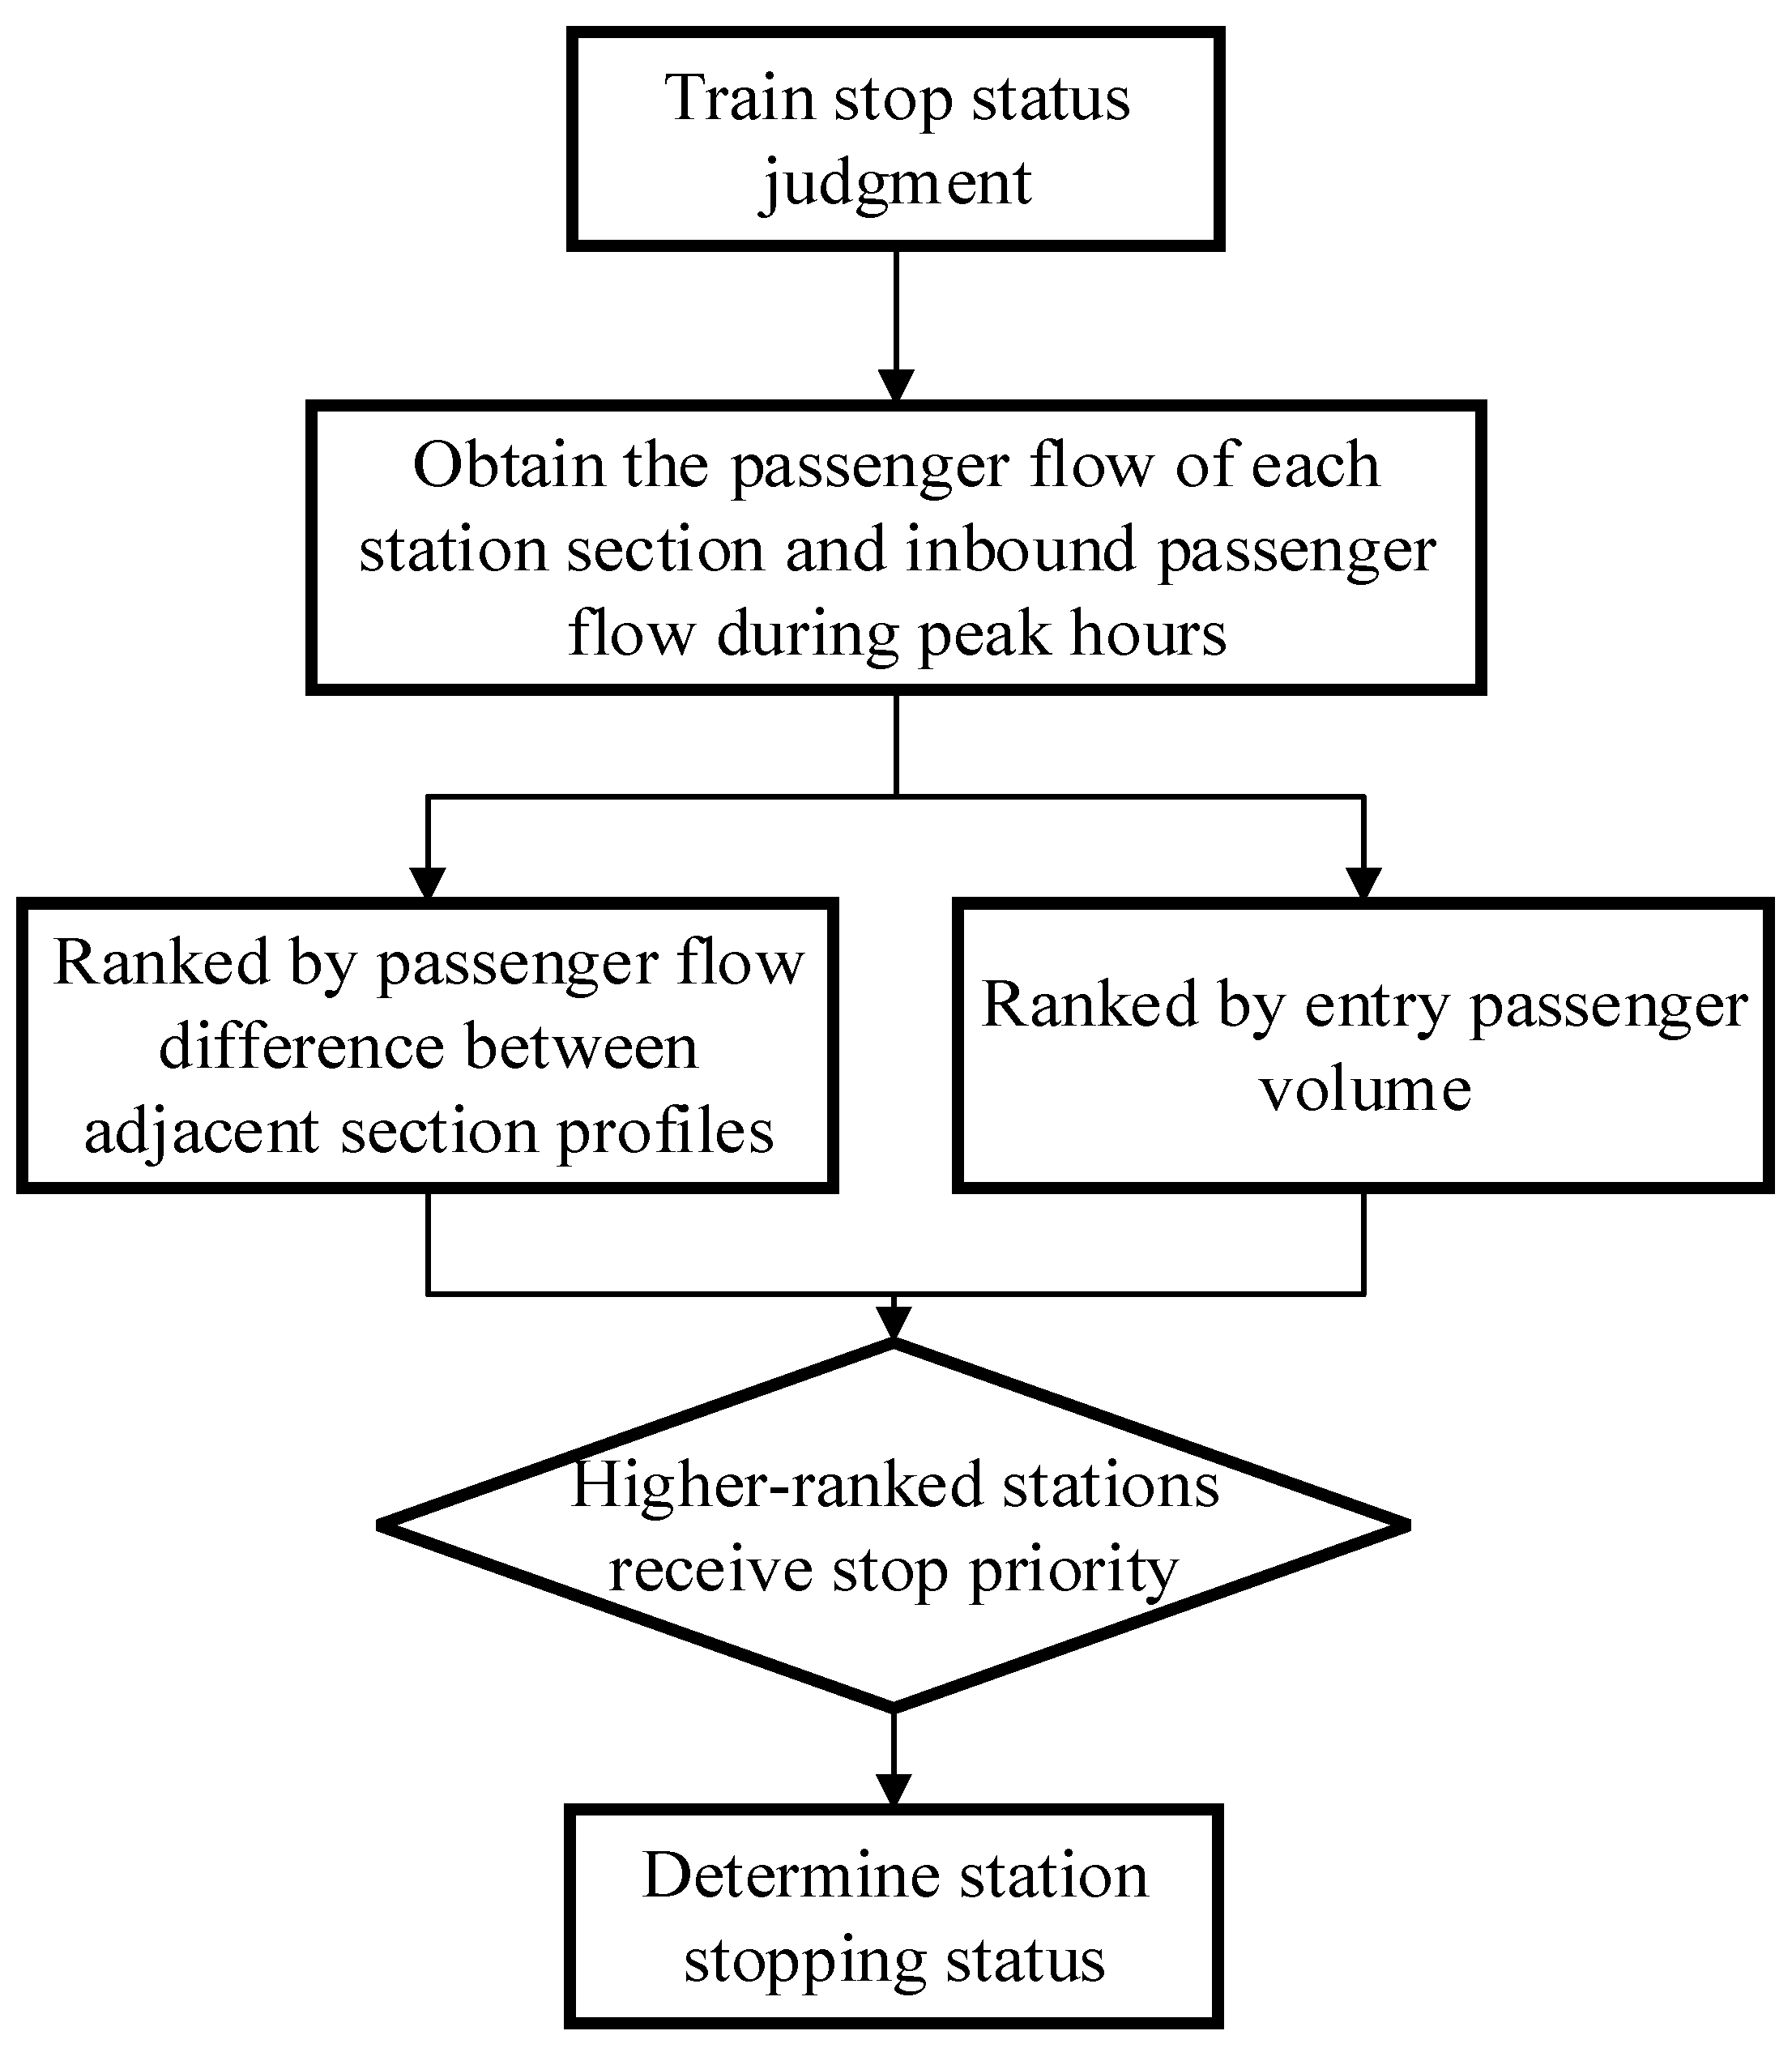
There are differences in the intensity of passenger tasks undertaken by various types of stations during peak traffic hours. Thus, in formulating passenger flow control strategies, the carrying capacity of each station should be fully considered, and adjustments to train operations during peak hours should align with the train stop parameters. The judgment steps of the stopping parameter are illustrated in
Figure 2.
In this paper, we use
to denote the stopping parameter of a train, and a reasonable train program during the coordinated passenger flow control period should be in sync with the stations along the entire line. Typically, it can be formed by several combinations of regular stop programs, skip-stop, and major, full-length, and short-turn routings.
can indicate whether the train
is located at a station
and whether it stops for loading and unloading operations, represented as a 0–1 variable. When
takes a value of 0, it means that the train
does not stop at the station
for loading and unloading, and waiting passengers have to wait for the next incoming train on the platform. The stopping parameter is shown in Equation (1).
Based on the problems mentioned above, this paper focuses on the metro line under the optimization mode of the train-stopping state as the research object, analyzing the process of the train operation and passengers entering the station, waiting for trains, and boarding. It aims to determine the optimal passenger flow control scheme to reduce delays in the passenger entry and exit at the station while increasing the maximum number of people transported by the system.
To facilitate the construction of the mathematical model, the following assumptions are made:
Assumption 1:
This paper studies line-level collaborative flow control, excluding the additional waiting time caused by factors such as the installation of bypass fences in the station, closing of ticketing equipment, and reduced walking speeds after passengers enter the station interior from the passenger travel delay time during entry;
Assumption 2:
The pattern of passenger attainment at each station follows a uniform distribution;
Assumption 3:
Trains operate according to the schedule, with no subjective or objective reasons for delays;
Assumption 4:
No trip abandonment occurs among passengers entering the metro system, and the arrival and disembarkation characteristics align with the OD statistical patterns.
5. The Improved Artificial Bee Colony Algorithm
The ABC algorithm is a renowned algorithm for solving optimization problems with a strong robustness, a strong search capability, and fast convergence speeds [
28].
5.1. The Fundamental ABC Algorithm
The ABC algorithm was first proposed in 2005 and is modeled after the natural food-search behavior of honey bees. Its three main phases are the employed bee phase, observation bee phase, and scout bee phase [
29]. The ABC algorithm’s particular steps are as follows:
Step 1: Create food sources at random to serve as the starting population. Assume that is the total number of dimensions and that represents the nth food source.
Step 2: Determine each food source’s fitness value, and note which is the best.
Step 3: Upon meeting the stopping requirement, output the optimal individual; if not, proceed with Steps 4 through 8.
Step 4: Employed bee stage. Select for employed bees using the greedy method, and new sources
are created as Equations (24) and (25).
where
,
is an actual number chosen at random,
.
Step 5: Choose the honey sources. Determine each new food source’s fitness value by the selection probability
, which is defined as Equation (26):
Step 6: Onlooker bee stage. Disrupt the chosen food sources according to Equation (27)
Step 7: Proceed to Step 8 if a food source is abandoned; if not, go back to Step 3.
Step 8: Scout bee stage. The employed bee turns into a scout bee and then generates the food source at random if the fitness value of the food source does not increase within predetermined iterations.
5.2. Employed Bee Stage
The fundamental artificial bee colony algorithm relies on employed bees to discover new food sources only associated with the initial honey supply, and many heuristics, including the ABC algorithm, exhibit a propensity to become ensnared in local optima, particularly when addressing intricate optimization challenges. Numerous heuristics, including evolutionary algorithms and the tabu search, are employed in scheduling domains to address this problem [
30]. To locate an adjacent solution from the existing food source, evolutionary operators are used to create the new individuals.
5.2.1. The Single-Point Crossover
We develop a new single-point crossover operator to direct the population to a more effective search region. The steps are listed in detail below:
First, create a real number at random, then compare it to the crossover probability . Following the selection process, two chromosomes, and , are randomly selected from the population if . Then, choose a crossover position at random. The genes of columns through in the are positioned with the columns after A in the other parent, whereas the inherits the columns 1 through of the two parent chromosomes. Next, verify if and contain any duplicate numbers. If so, identify the number in the two chromosomes that merge frequently. Finally, genes and in the and columns should be swapped for and , respectively. After that, two new offspring chromosomes are produced.
The train dispatching objective includes allocating trains to the corresponding stations. Therefore, the optimization scheme
of this study consists of two parts: the train sequence and train stop status.
, where
represents the train sequence and
is the stop parameter. An example of the Crossover operator is shown in
Figure 3.
5.2.2. Two-Opt Invert Mutation
To ensure population diversity, we present a new two-opt invert mutation operator in this section. Prematurity is easier to prevent using the mutation operator, although certain individuals returned by the crossover operator are more disturbed. A real number is randomly generated from the interval . If , two train positions, and , are chosen at random from an individual.
5.3. Onlooker Bee Stage and Scout Bee Stage
The onlooker bee stage employs the same roulette wheel rules to select the food sources returned by the employed bee. Subsequently, an MTS is introduced for the selected food sources to further enhance the quality of individuals.
A food supply is dropped from the artificial bee colony algorithm if it does not improve after a certain number of iterations. The scout bee takes the position of the hired bee and uses chemical reaction optimization (CRO) to find a new food source. We define two reaction operators, synthesis and re-generation, to transition between permissible food sources. By improving the molecules’ capacity to explore new areas, the synthetic process makes it possible for them to successfully avoid local optima. Below is a description of the specific steps involved in CRO:
Step 1: Pick two distinct chromosomes, and , and then take out the and sequences. Locate the gene from and that has the same number and location.
Step 2: Make a fresh chromosome . If no train is identically, set ; otherwise, the genes corresponding to the above same train are placed to the new chromosome .
Step 3: A viable chromosome is created when all the genes for the same train number in as in are eliminated, and the genes in the remaining locations in are filled by the removed . In the meantime, the remaining chromosomes are randomly created to maintain the population size since the synthesis process decreases the number of individuals.
5.4. The Improved ABC Algorithm
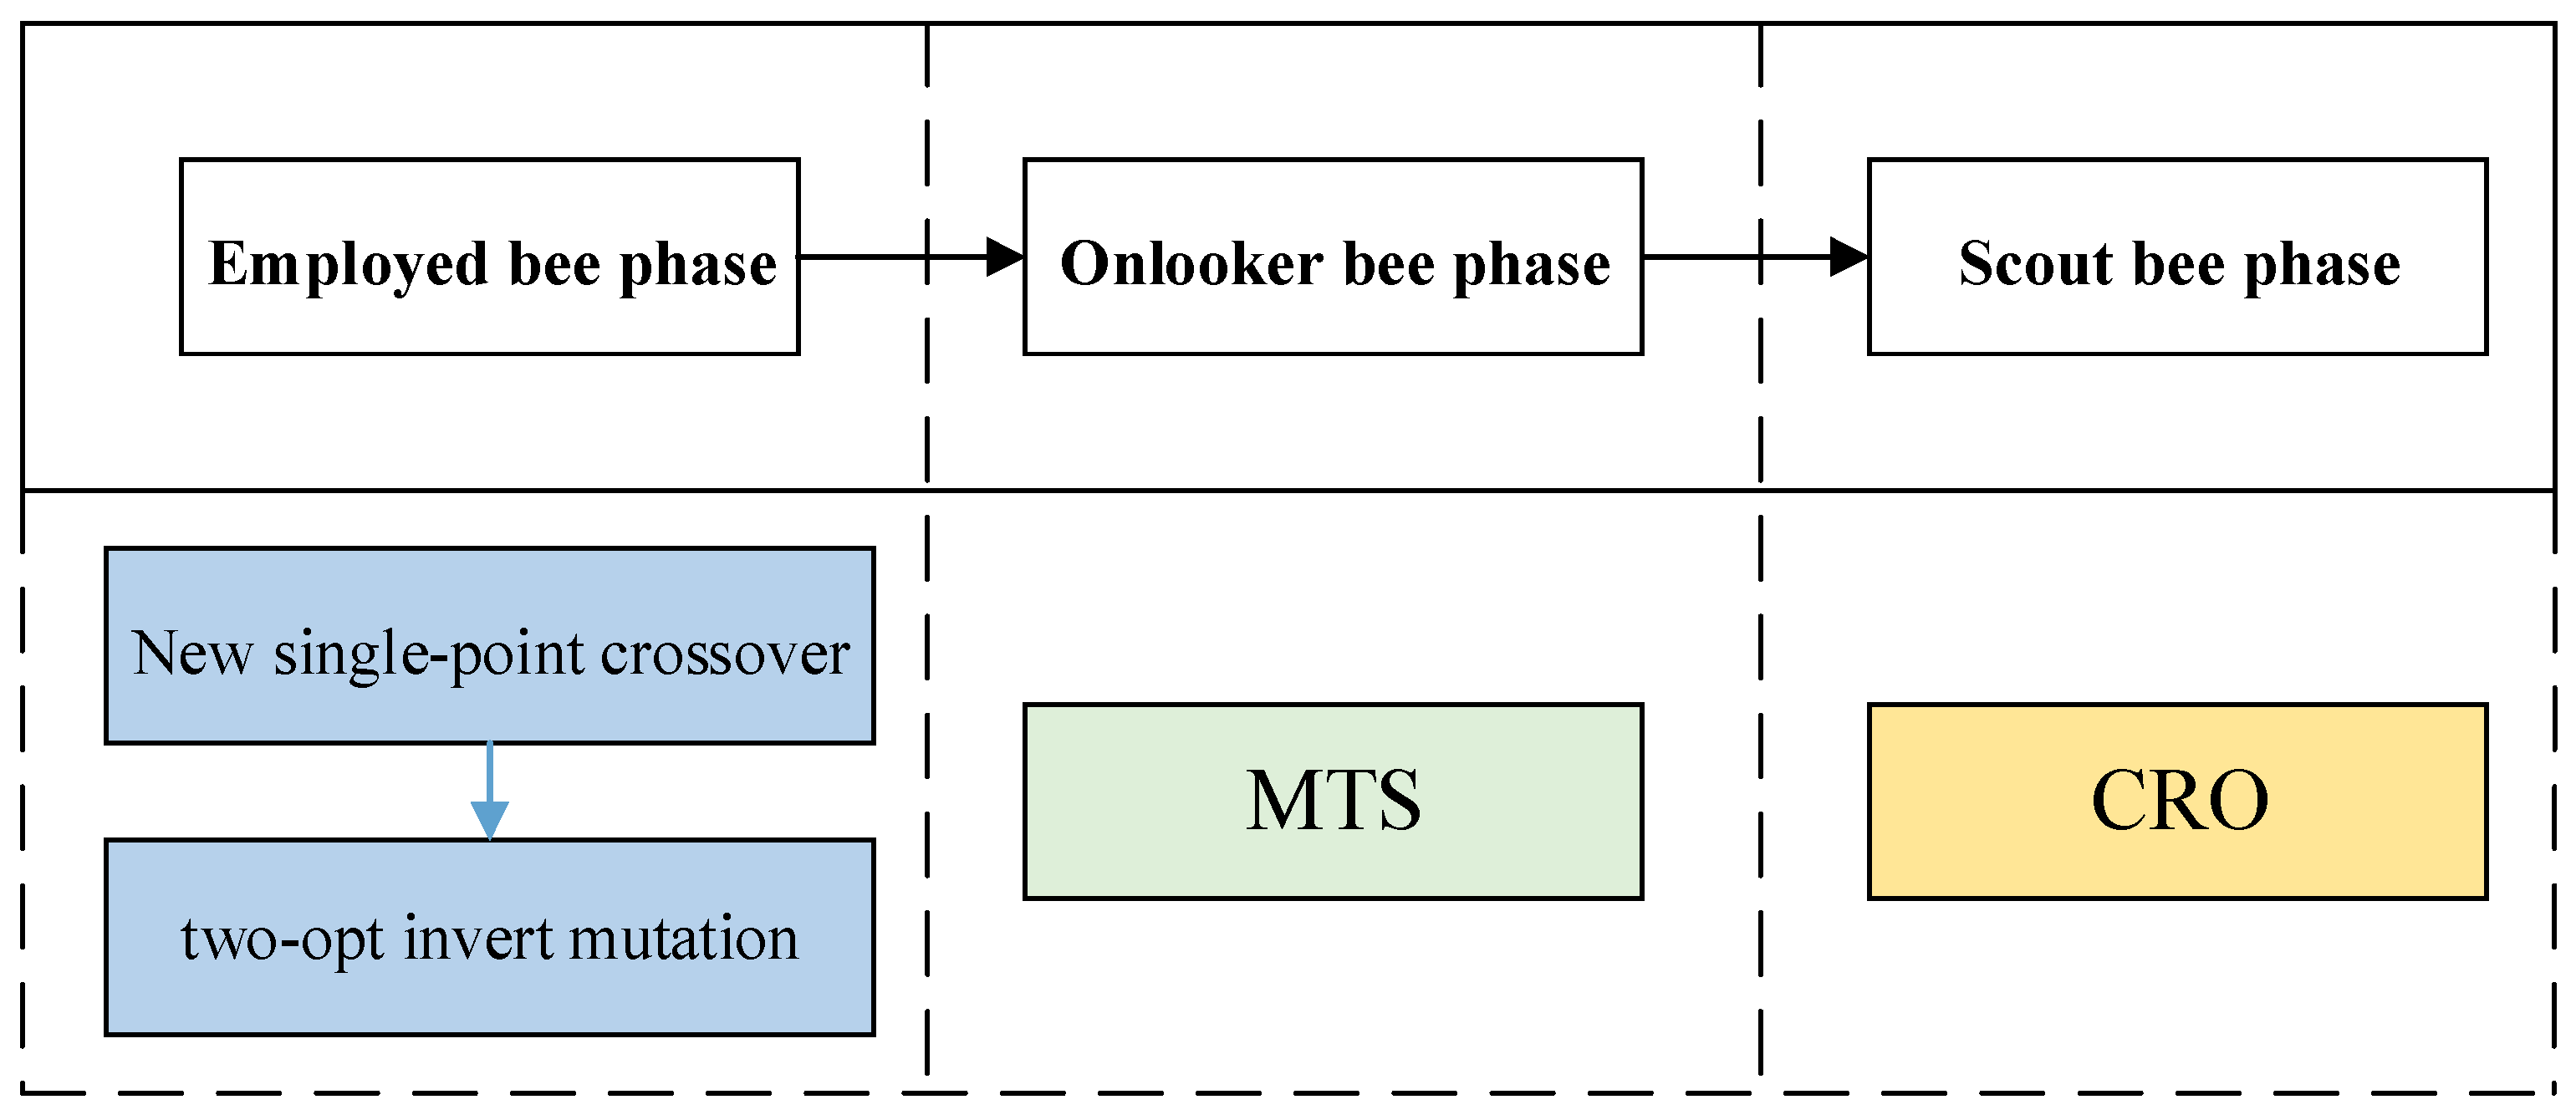
Some heuristics are employed in our Improved ABC to balance the capabilities of the local and global search. These techniques include the CRO method, the modified tabu search (MTS), and new evolutionary operators. In particular, we create new food sources using the roulette wheel rules, the new single-point crossover, and the two-opt invert mutation (evolutionary operators) to enhance the employed bee phase’s capacity for the local search. To increase the global search efficiency in the observer bee phase, we implement the modified TS (MTS) algorithm and use the same roulette wheel strategy to choose food sources. In order to ensure population diversity during the scout bee phase, we introduce the CRO approach to disturb food sources if they cannot be improved during the limit iterations. The flowchart of the improved artificial bee colony algorithm is illustrated in
Figure 4. The process of the algorithm is as follows. The pseudocode of The Improved ABC Algorithm is shown as Algorithm 1.
| Algorithm 1: The Improved ABC algorithm |
Step 1. Input the initial food source , tabu length , neighborhood information , solutions
Step 2. Output the new food source
Step 3. Select neighborhood structures to generate a new set
Step 4. Find the most suitable value and corresponding source
Step 5. If
Step 6. Update the tabu list
Step 7. Or else select the food source corresponding to the most suitable value , and update the tabu list |
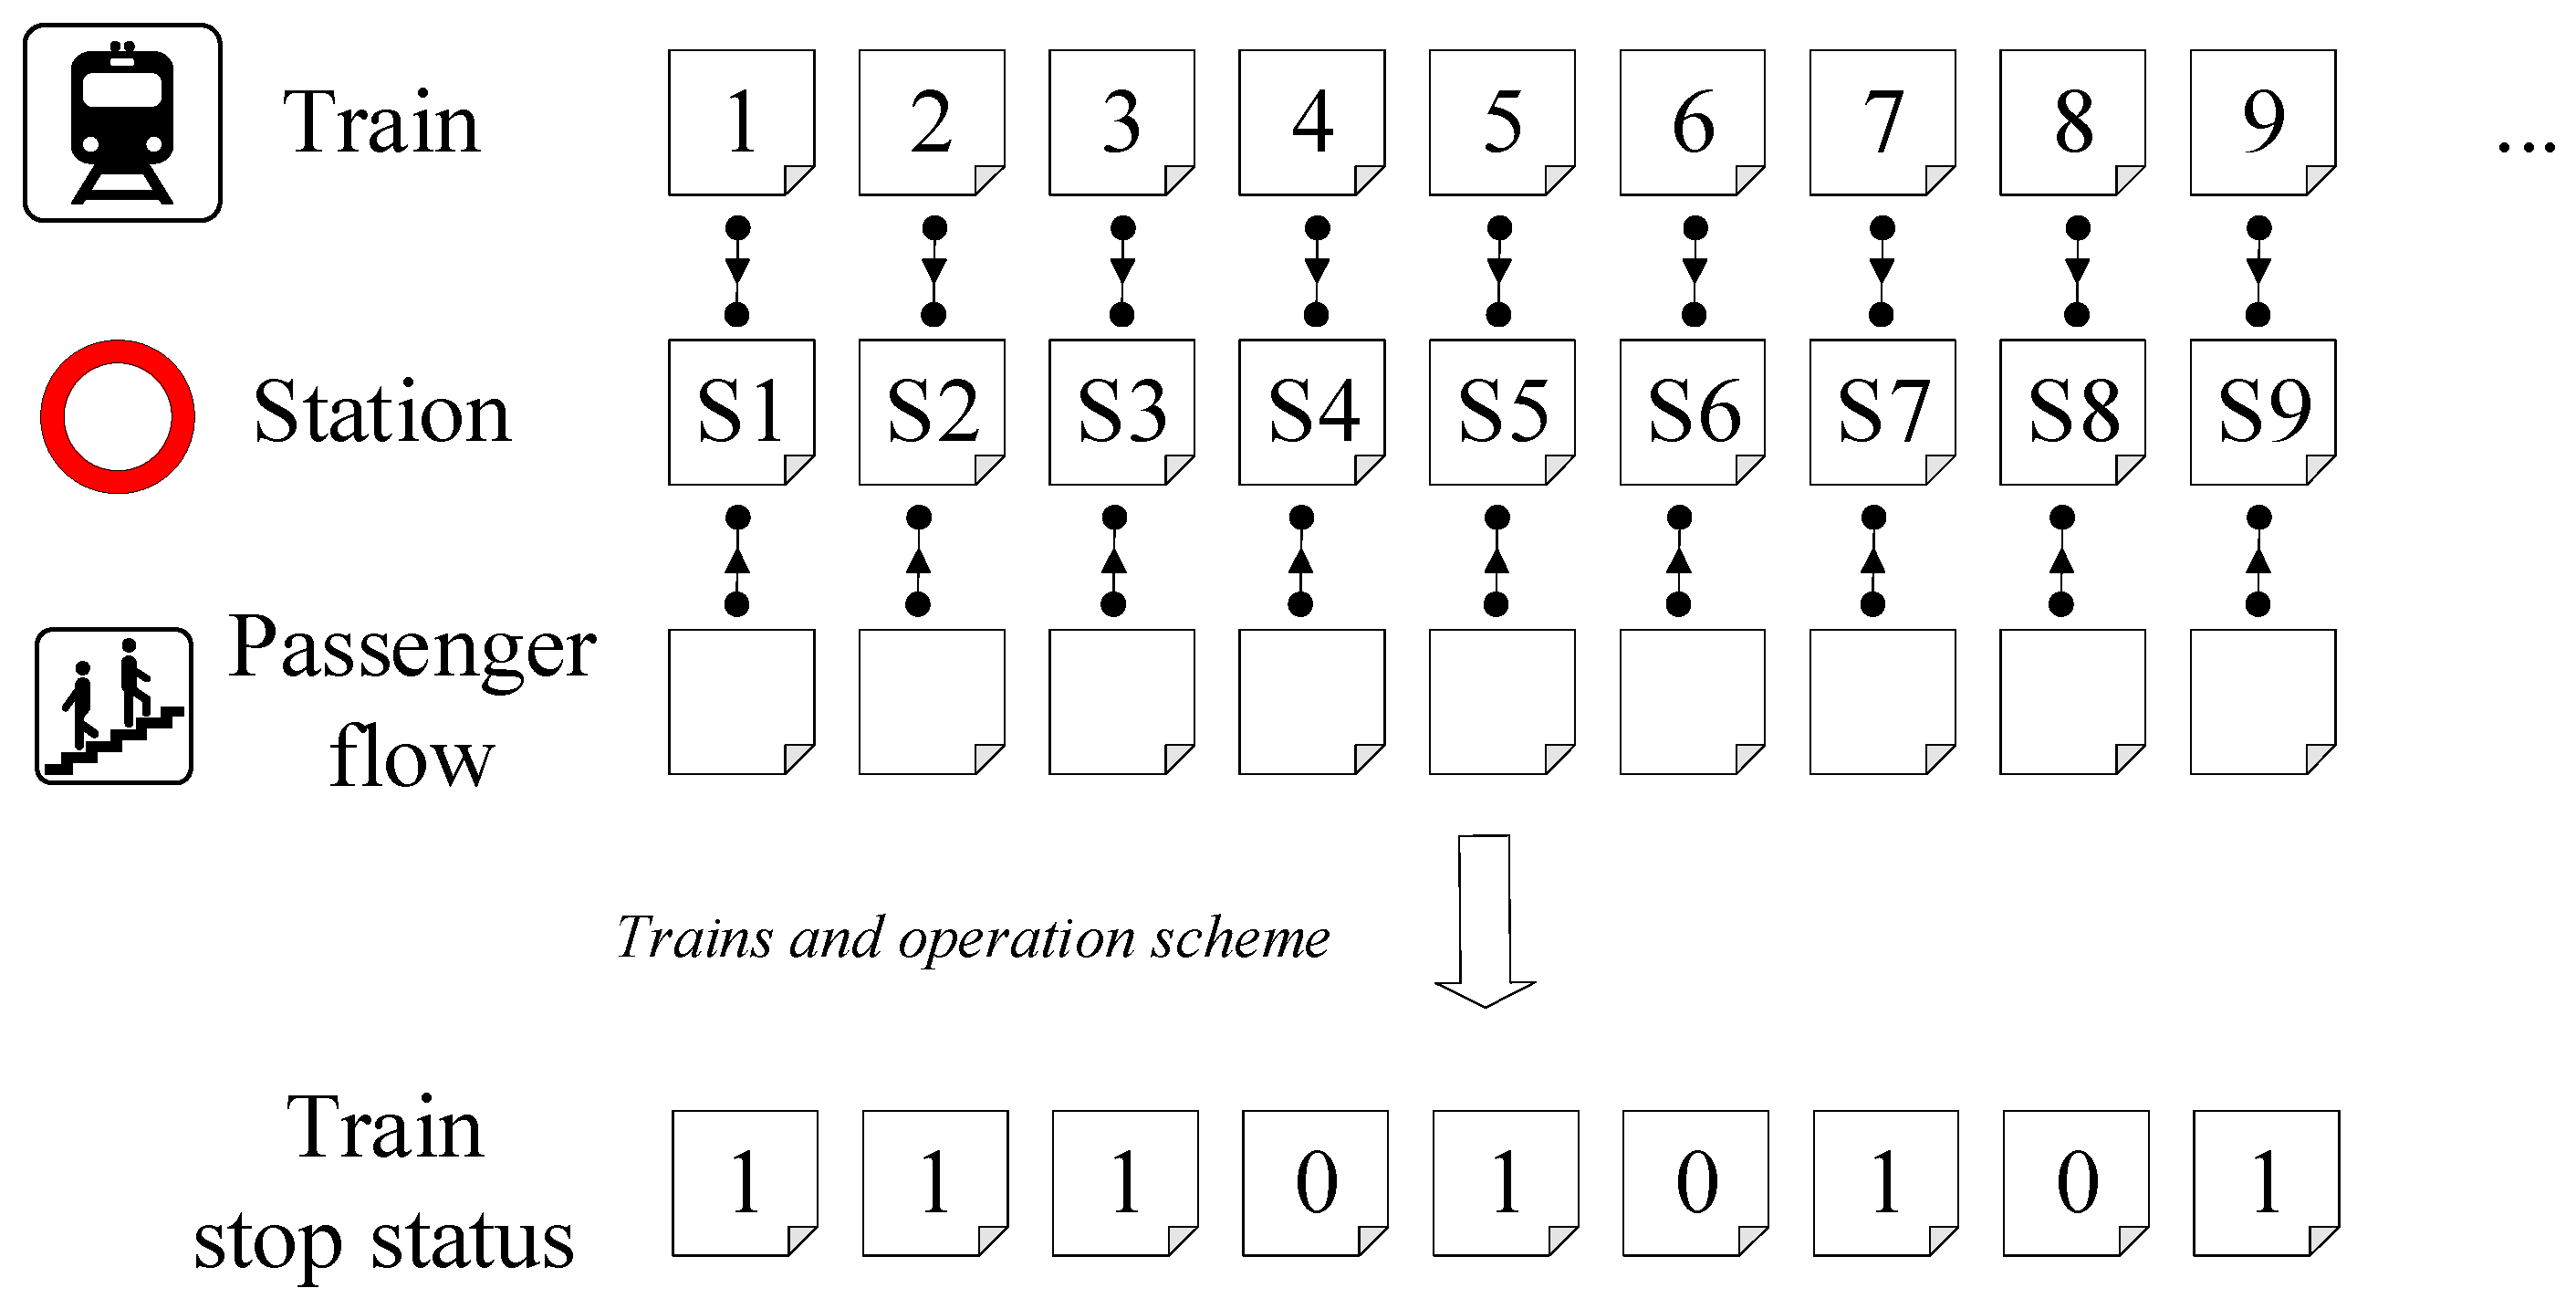
To better understand the optimization scheme of the algorithm,
Figure 5 presents examples of trains and passengers entering nine metro stations. The updated train stop status can be obtained, thereby determining the train operation diagram and passenger input.
6. Experiment and Result Analysis
6.1. Case Description
The case is selected from Shanghai Metro Line 9, which is the sixth completed and operating metro line in Shanghai, China. As of January 2025, Shanghai Metro Line 9 is approximately 65 km long. There are a total of 35 stations, including 31 underground stations and 4 elevated stations, and the trains are six-car A trains.
Line 9 is an important line connecting the east and west of Shanghai, where passenger traffic shows a significant “tidal phenomenon,” mainly during the morning and evening commuter peaks. The information on the passenger flow control on Line 9 is shown in
Table 3.
In this study, the interval between Qibao and Xujiahui on Line 9 is taken as an example for the analysis. There is a high demand for passenger traffic in this sector, which has three regular passenger control stations. The Caohejing Hi-Tech Rd., approved by the State Council as a national economic and technological development zone in 1988, is the section of Line 9 with the largest passenger flow. This area serves as an interchange station within the line network, linking Yishan Rd. Station and Xujiahui. The interval train load rate is excessively high, and the station’s storage capacity has reached its limit. If the passenger flow is not effectively controlled, it may lead to safety accidents, resulting in adverse social impacts.
6.2. Parameterization
6.2.1. Inbound Passenger Flow
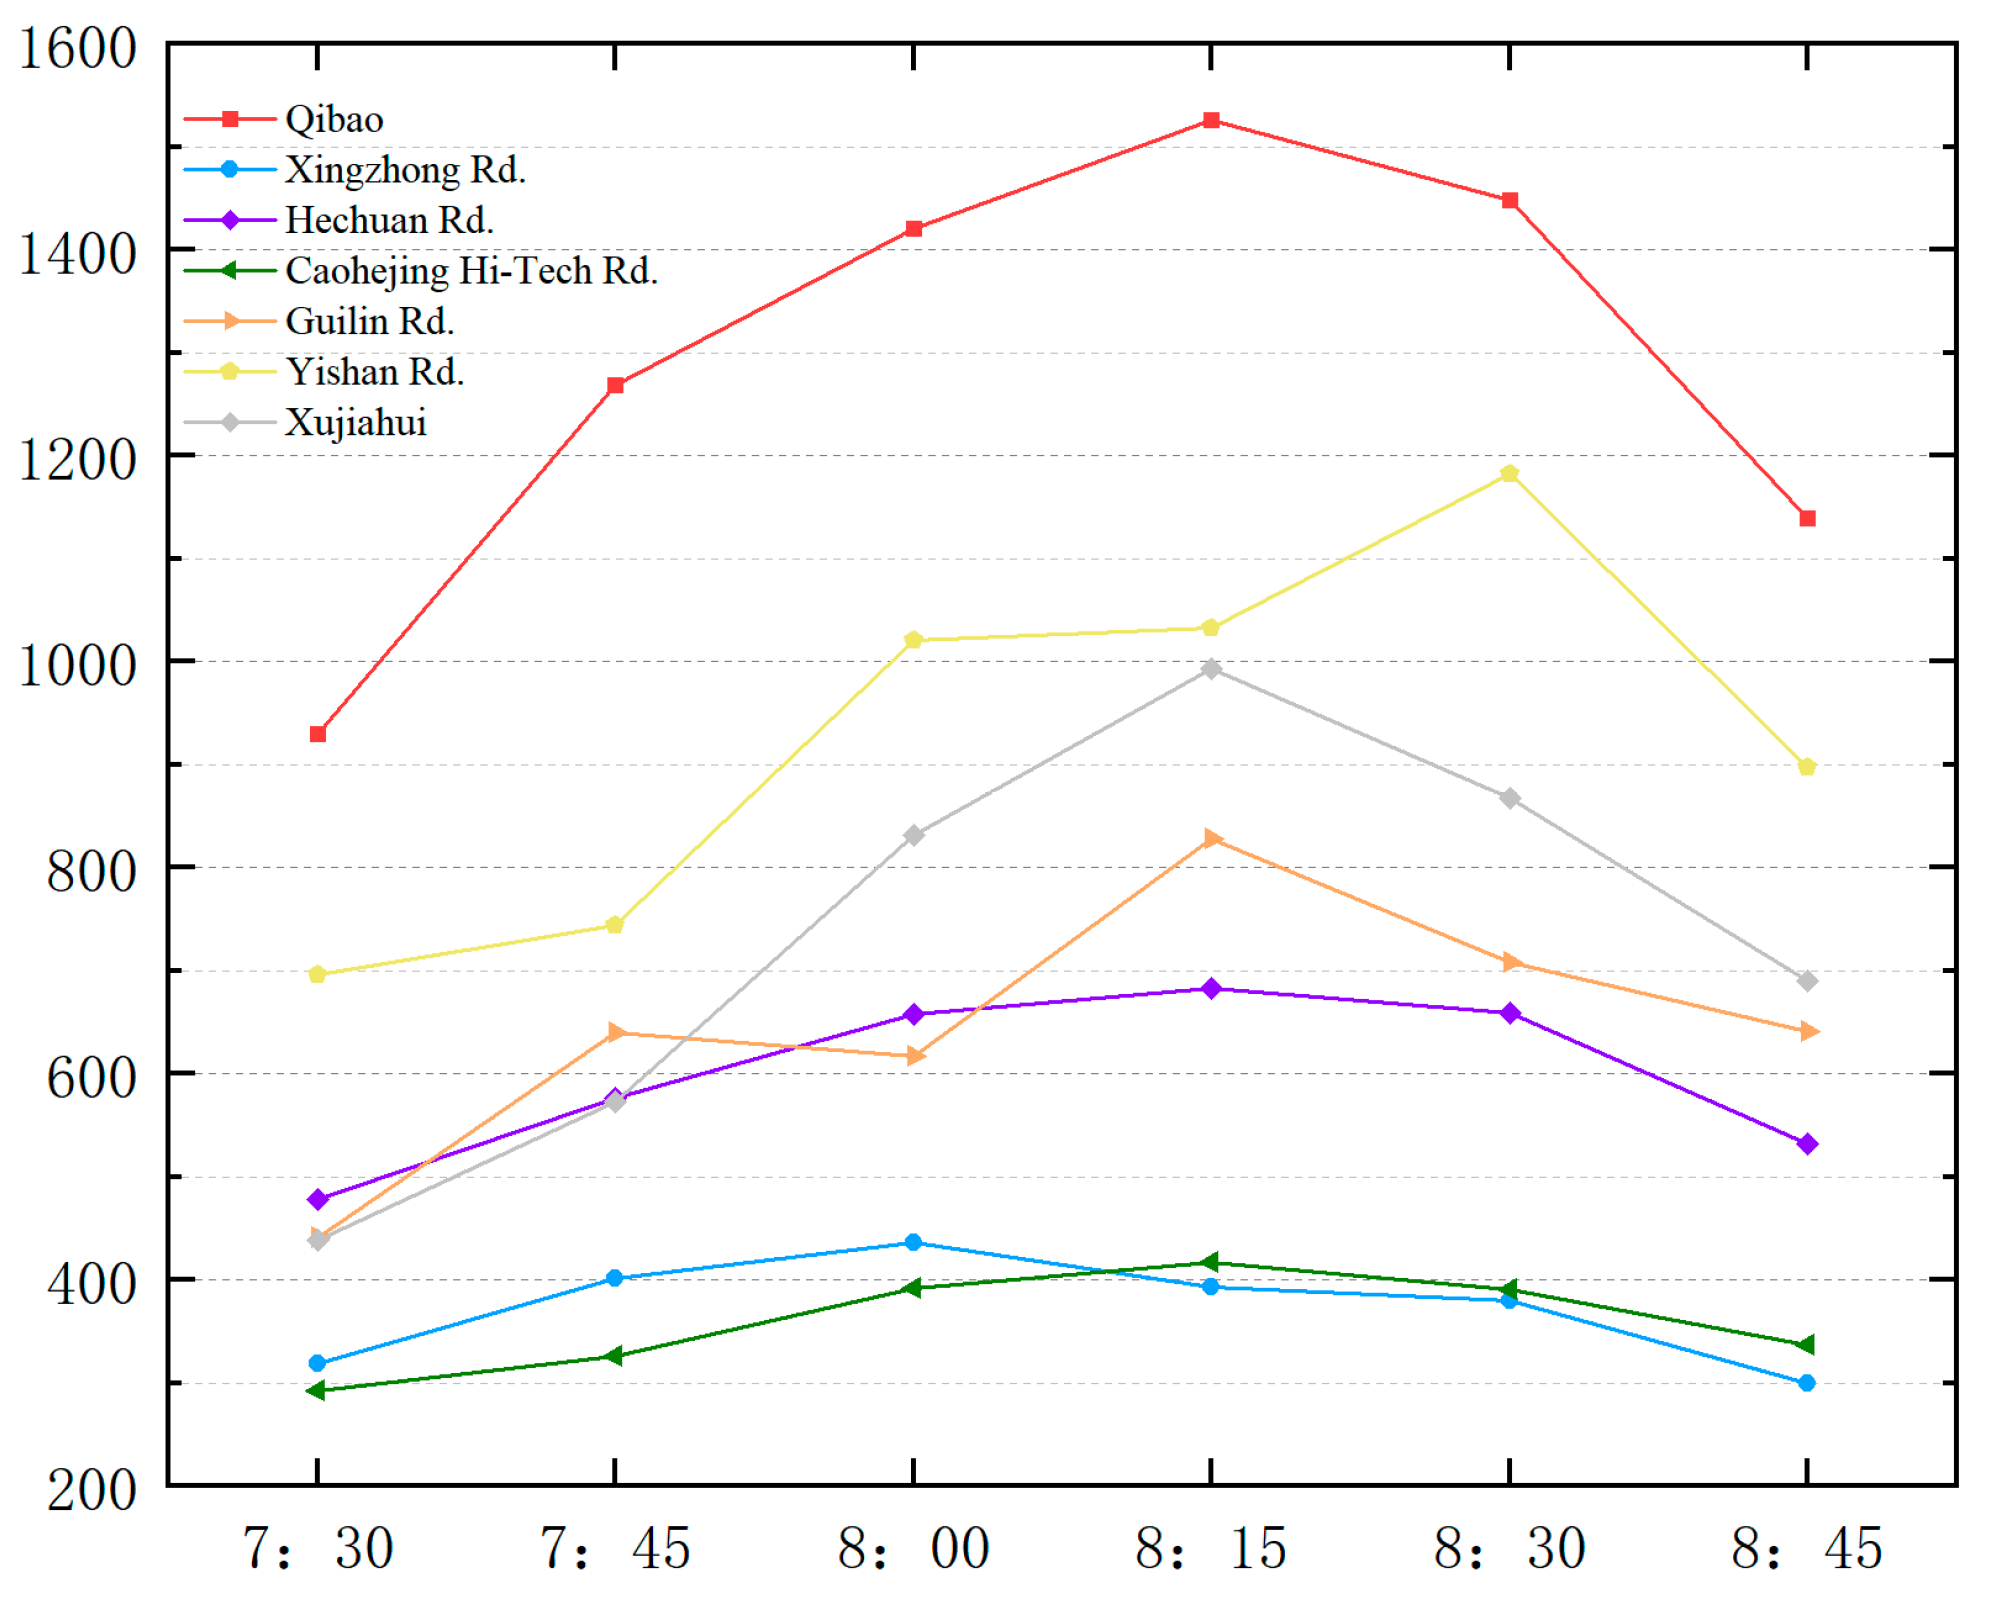
This case is based on the actual passenger flow data of Shanghai Metro Line 9 on a specific day in 2024, and this study’s time range is from 7:30 to 9:00 h during the morning peak. A statistical analysis of the actual AFC data of Line 9 can use a 15 min time granularity for the upward direction of the line, transforming the entire station traffic data, as shown in
Figure 6.
As shown in
Figure 4, the top three stations in terms of inbound traffic are, in order, Qibao, Yishan Rd., and Xujiahui, with inbound passenger numbers twice that of the other stations. The maximum inbound passenger flow is 1526 at Qibao Station between 8:15 and 8:30, while the minimum is 292 at Caohejing Hi-Tech Rd. between 7:30 and 7:45. Most stations have an approach flow exceeding 400 passengers, with some reaching their passenger capacity limit. Train capacity utilization greatly impacts the passenger flow control strategy of subsequent stations.
6.2.2. Platform Capacity
Platforms are the main areas in the metro system where the passenger interaction with trains occurs, and the number of people on the platform is a critical indicator of the station’s capacity. If the distance between passengers is less than the psychologically recognized safe distance limit, it can easily cause discomfort, nervousness, or even panic, along with other emotions, and there is a potential risk to operational safety. Equations (28)–(31) are published for calculating the effective usable area of the station platform.
is the area of the platform,
is the length of the platform,
is the width of the side platforms,
is the number of transverse columns, and
is the width of the longitudinal beams.
is the design capacity per train per over-peak hour on one side of the train during the passenger flow control period.
is the sum of the widths of each set of stairs and escalators.
is the density of people on the platform,
is the width of the platform security belt.
Table 4 shows the platform area and maximum capacity of each station.
6.2.3. Passenger Travel OD Probability
The passenger trip OD probability indicates the proportion of passengers traveling to each destination station after entering the station, reflecting the flow structure of incoming passengers at each station. Based on the inbound volume data for each station, the OD probability matrix of passengers in the upward direction in the Qibao–Xujiahui section is obtained, as illustrated in
Table 5.
6.2.4. Trains and Operation Scheme
The type of train determines the inter-area transportation capacity of the subway. Line 9 adopts the subway standard A-type train, consisting of six sections in the grouping scheme. The parameters related to the rolling stock necessary for this study primarily include the basic train parameters and passenger capacity, as shown in
Table 6.
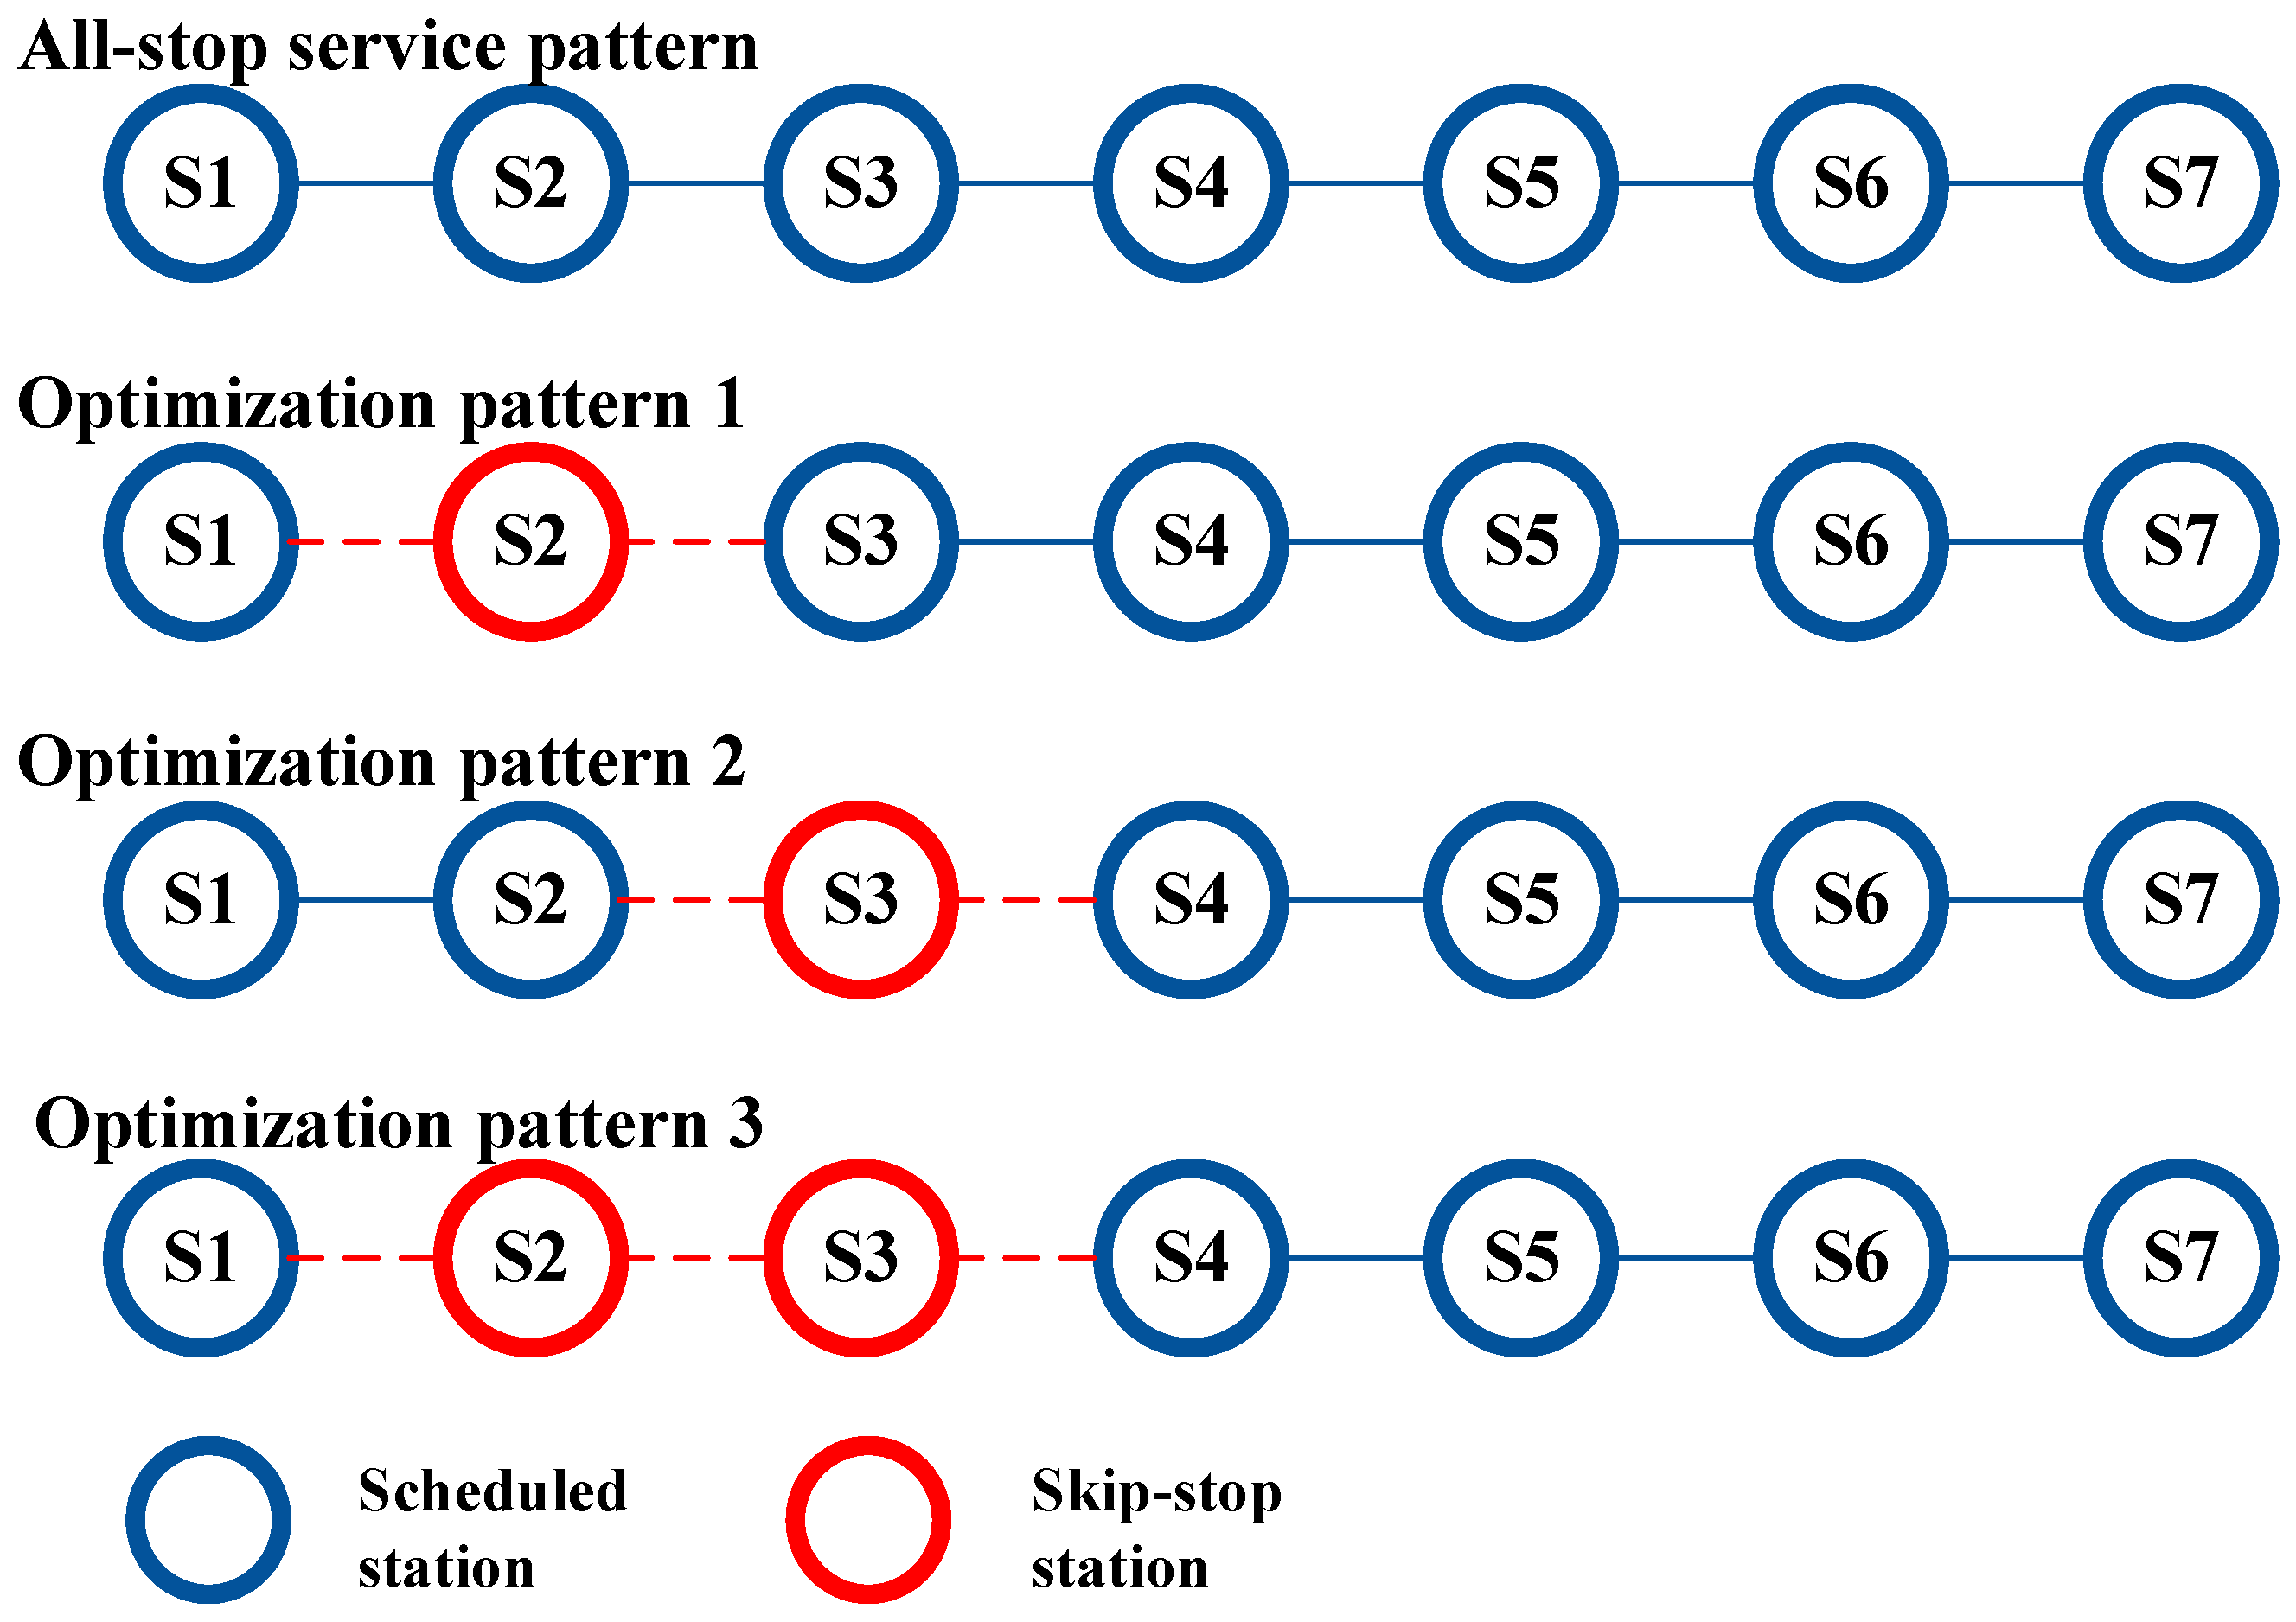
Based on the analysis of the passenger demand and train schedule data, it is evident that the stations in the Qibao–Xujiahui section are defined by the Guilin Rd.–Yishan Rd. cross-section. All five stations in the Qibao–Guilin Rd. section serve as input stations with very few alighting passengers, leading to an insufficient capacity at Yishan Rd. Therefore, it is worth considering the implementation of a train skip-stop system in this area to free up space for passengers boarding at the subsequent stations.
This study proposes three types of train operation adjustment programs based on the actual circumstances of Line 9: (1) a skip-stop Xingzhong Rd. operation program, (2) skip-stop Hechuan Rd. operation program, and (3) skip-stop Xingzhong Rd. and Hechuan Rd. operation program. The stopping schemes for these three train operation adjustments are illustrated in
Figure 7, compared to the conventional stop-and-go train operation scheme.
6.3. Analysis of Calculation Results
In this study, MATLAB is employed to address the optimization strategy for the passenger flow control in the Qibao–Xujiahui section of Shanghai Metro Line 9, allowing for a comparison of the results between the optimized passenger flow control scheme and the conventional passenger flow control scheme. The experimental tests are coded in MATLAB R2022b and run on a PC with an Intel Core i5-13600KF with 3.50 GHz and 32.00 G of RAM.
6.3.1. Optimization Results of Train Operation Scheme
The basic data for Shanghai Metro Line 9 are input into the model for parameter initialization calculations, allowing the optimal combination of 32 trains’ running schemes on the Qibao–Xujiahui section during morning peak hours to be obtained, as shown in
Table 7. The optimized departure scheme can help alleviate, to varying degrees, the congestion at upstream stations of Caohejing Hi-Tech Rd., preventing the system’s capacity from being tied up.
6.3.2. Passenger Delay Time
To verify the effectiveness of the multi-station cooperative passenger flow control model, after our optimization of 2281 (s), this paper compares the optimized passenger stranded delay time with the non-cooperative passenger flow control case, with the calculation results presented in
Table 8. The three stations utilized for the passenger flow control in the non-coordinated scenario are Qibao, Caohejing Hi-Tech Rd., and Xujiahui, based on the actual situation.
From
Table 7, it is evident that the optimized passenger flow control strategy restricts more passengers outside the station while reserving the train capacity for downstream stations with high passenger demands. As a result, the total passenger delay time is reduced by 36.26% compared to the pre-optimization period. The synergistic nature of the strategy allows for the rational allocation of the remaining train capacity, leading to a 55.64% reduction in platform delays. The computational results demonstrate that the model is highly effective in optimizing passenger delay times.
6.3.3. Train Load Rate
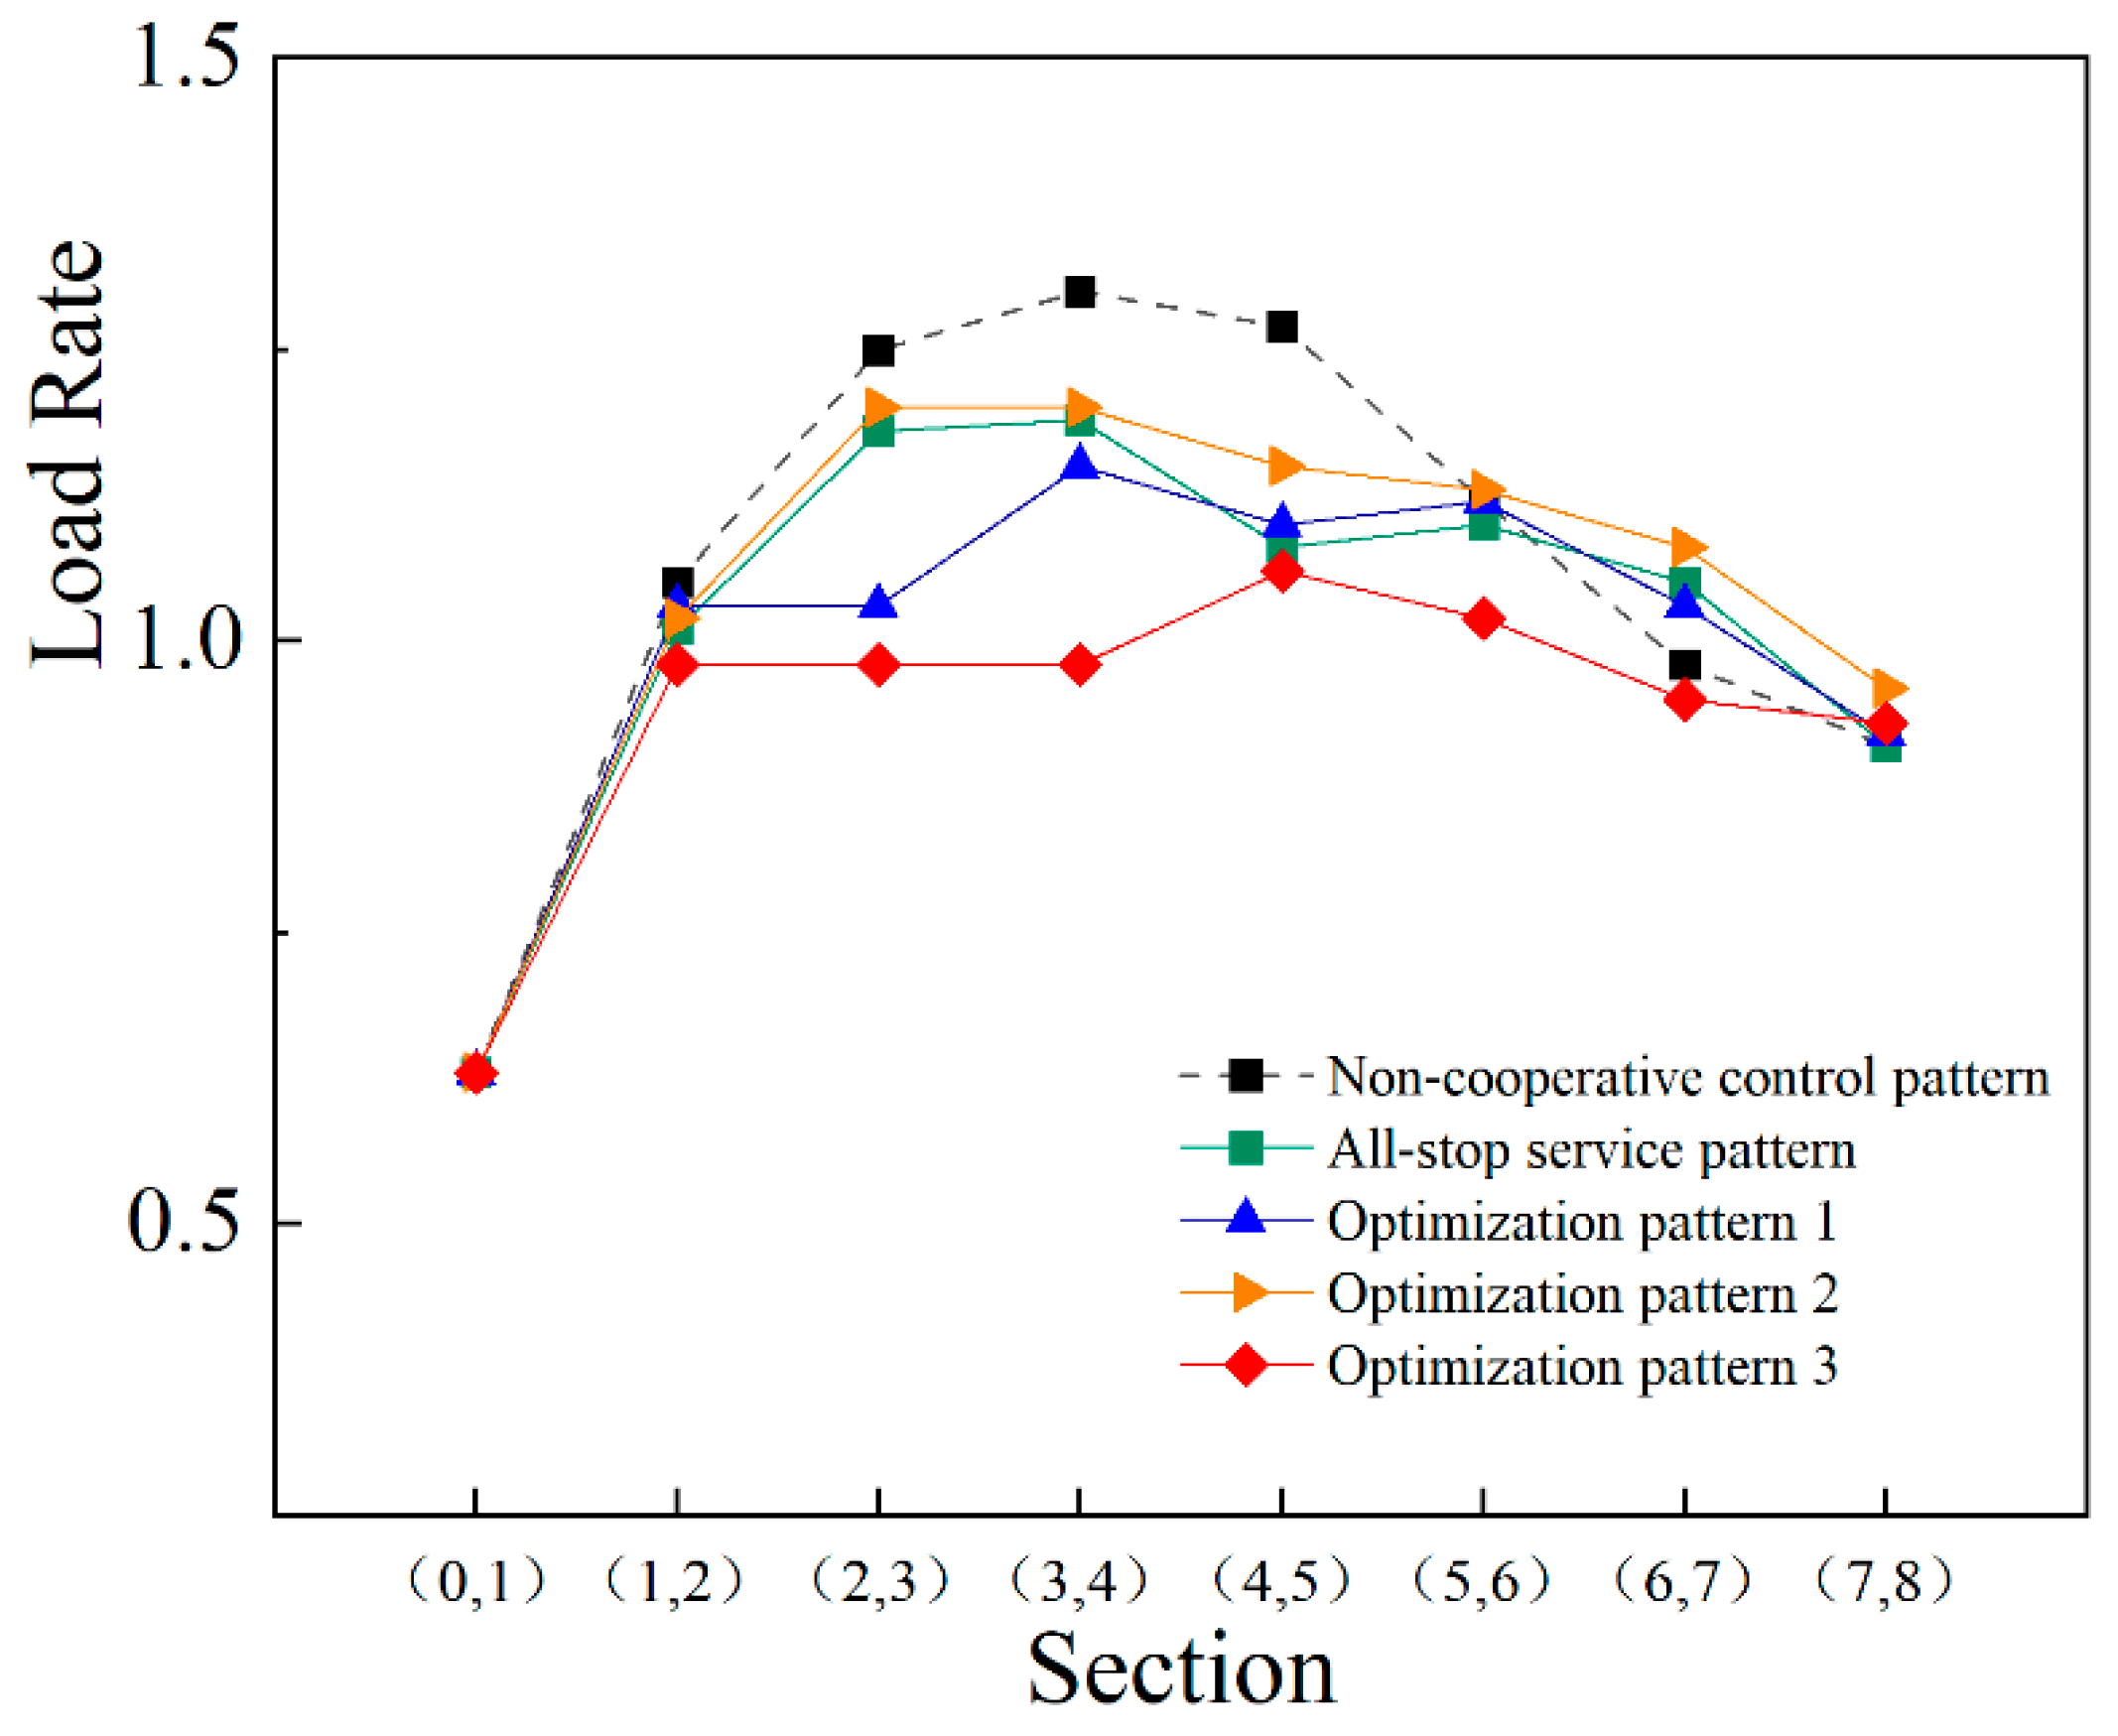
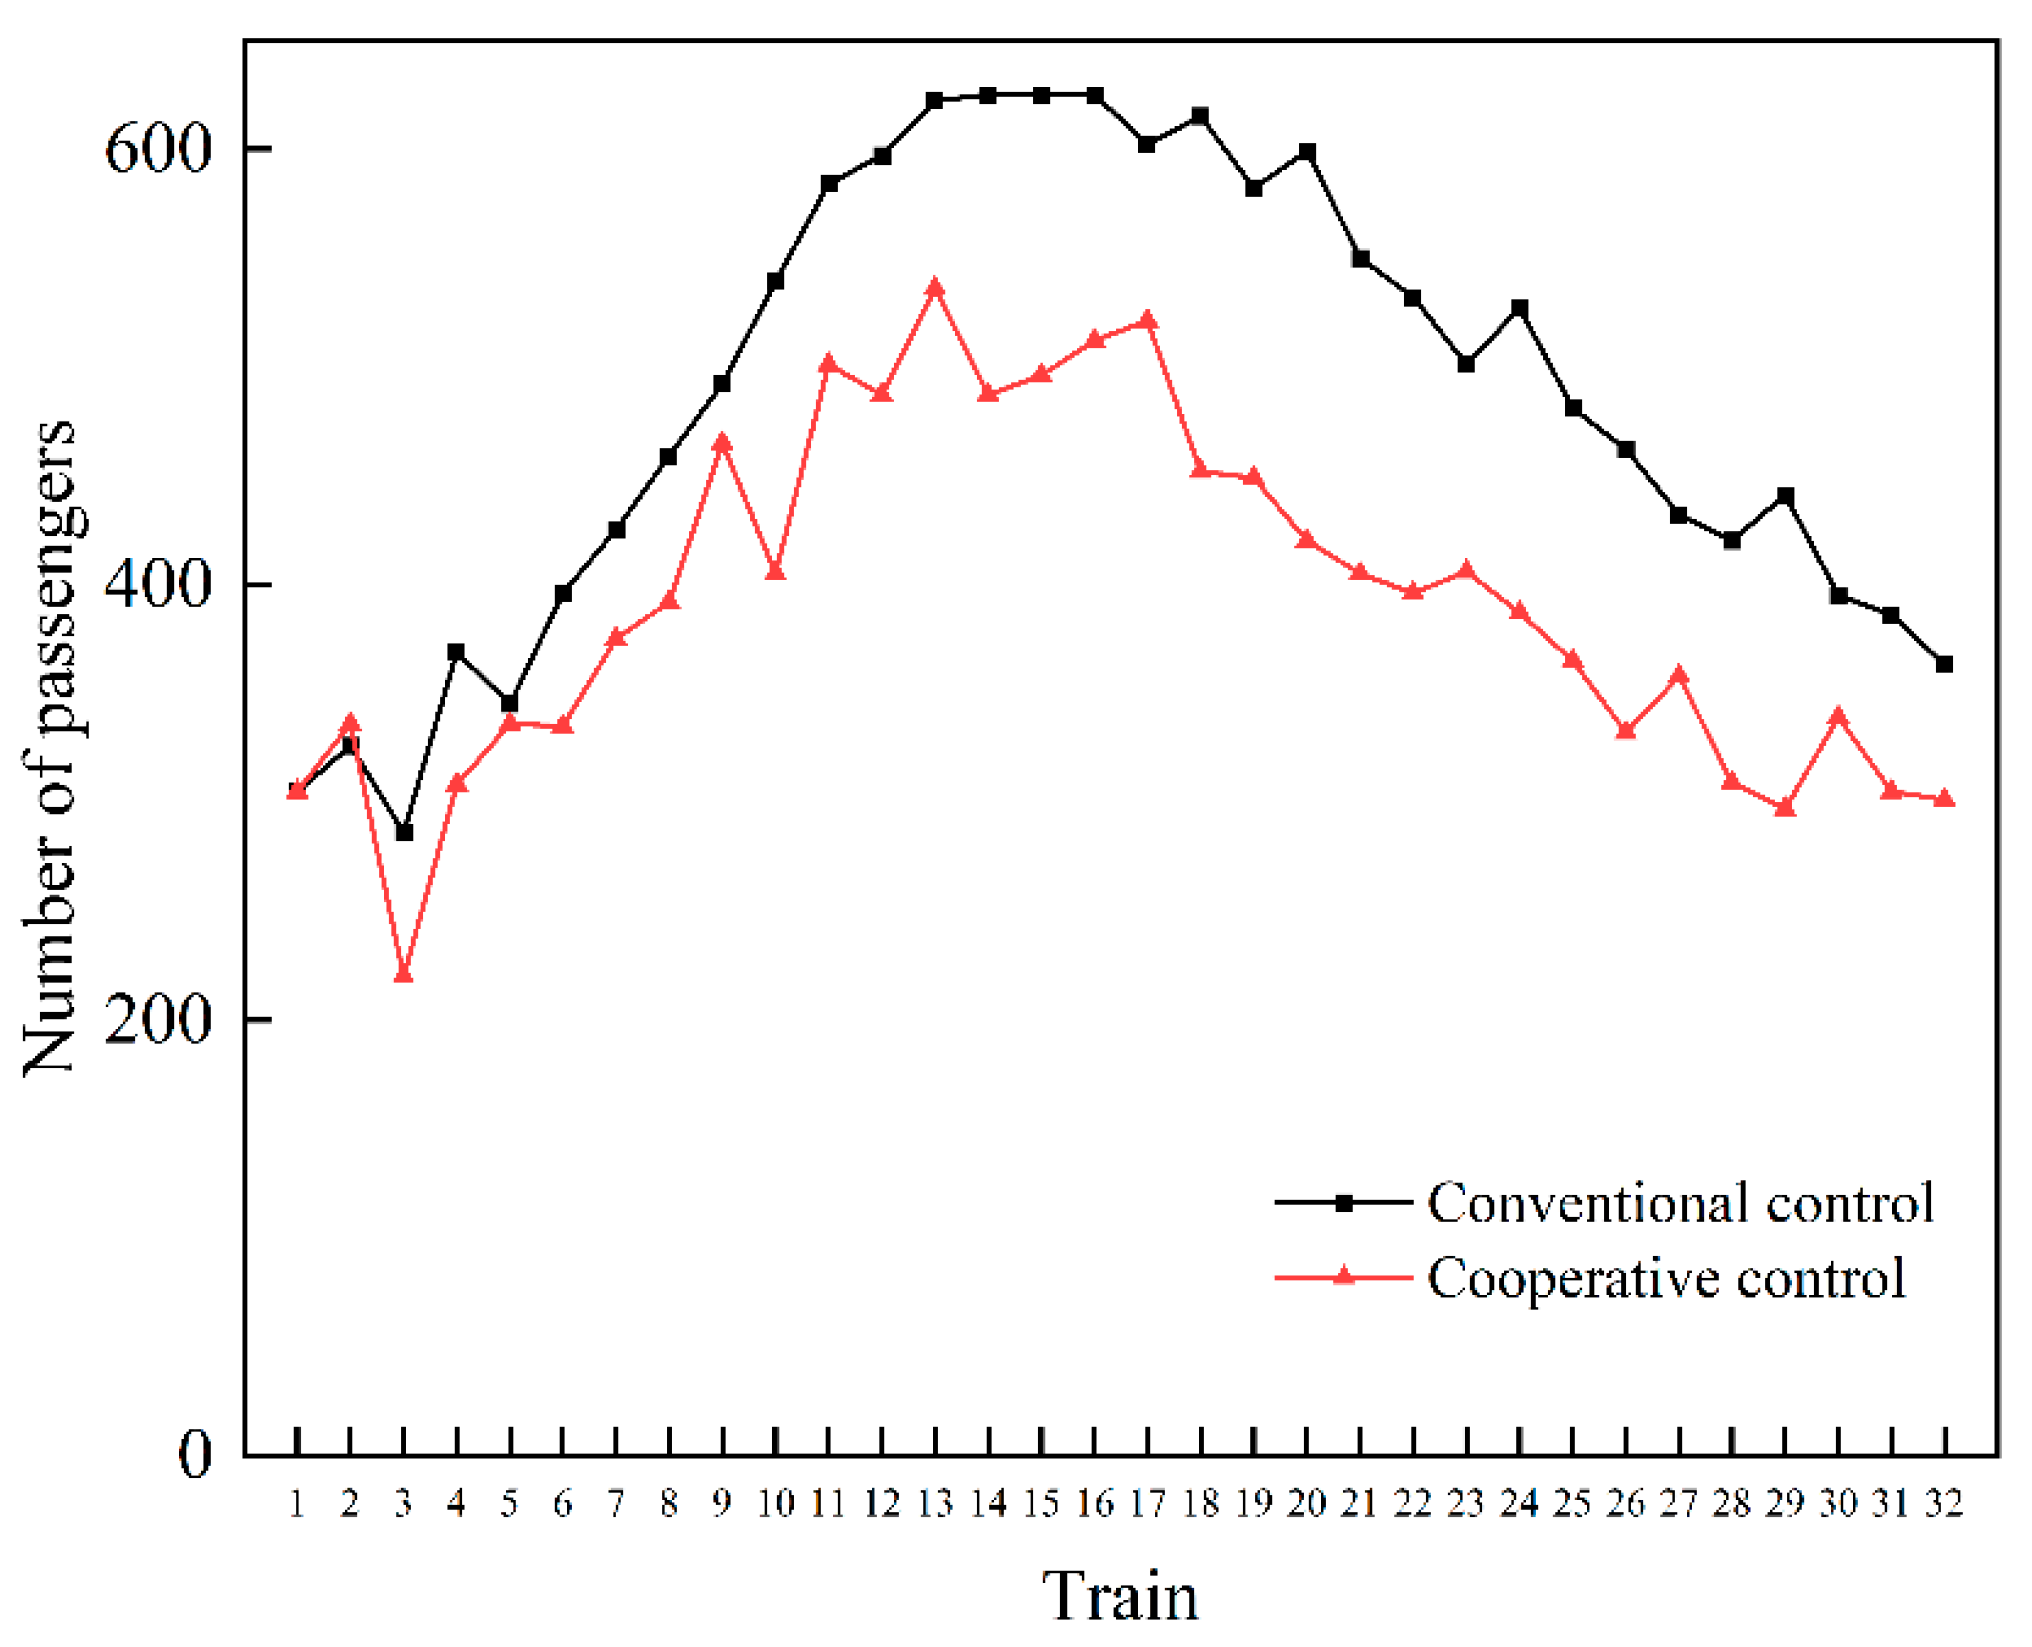
The total number of boardings on a subway line during peak hours is usually limited by the train capacity, so the second optimization objective of this study, the total number of boardings, is analyzed using the train load rate. The train load rate reflects how crowded the train is and is also related to passenger comfort. To compare the distribution of train load rates between the optimized Collaborative passenger flow control and the conventional passenger flow control scenarios, the train load rate scenarios of trains 10–13, which cover the four stopping scenarios of Collaborative passenger flow control, are selected as examples for the data analysis in this study.
As can be seen in
Figure 8, the optimized solution with a Collaborative passenger flow control solution has a significant decrease in the train load rate between the passenger flow control station intervals. The reason is that after the implementation of passenger flow control measures at Xingzhong Rd. and He Chuan Rd., passengers who could previously board the train were restricted to the outside of the station, which reserved the boarding space for waiting passengers at the downstream stations and alleviated the congestion on the platforms. The cooperative passenger flow control strategy relieves the train transport load to a certain extent, ensures the operational safety of stations with high passenger demands, and optimizes the effectiveness of the transport system.
6.3.4. Maximum Number of People Gathered at the Station
The number of people gathered on the platform is a visual reflection of the level of crowding in the station. In this study, the maximum number of people gathered on the platform of each station during the peak hours will be compared under the conventional passenger flow control solution as well as the optimized Collaborative passenger flow control solution.
As can be seen from
Figure 9, after the adoption of the multi-station Collaborative passenger flow control solution, the maximum number of people gathered at the skip-stop stations, Xingzhong Rd. and Hechuan Rd., increases, the maximum number of people gathered at the platforms of the downstream stations decreases, and the maximum number of people gathered at the platforms of the various stations generally stays below the capacity of the platforms. In particular, Caohejing Hi-Tech Rd. saw a 19.04% drop in the maximum number of people gathered.
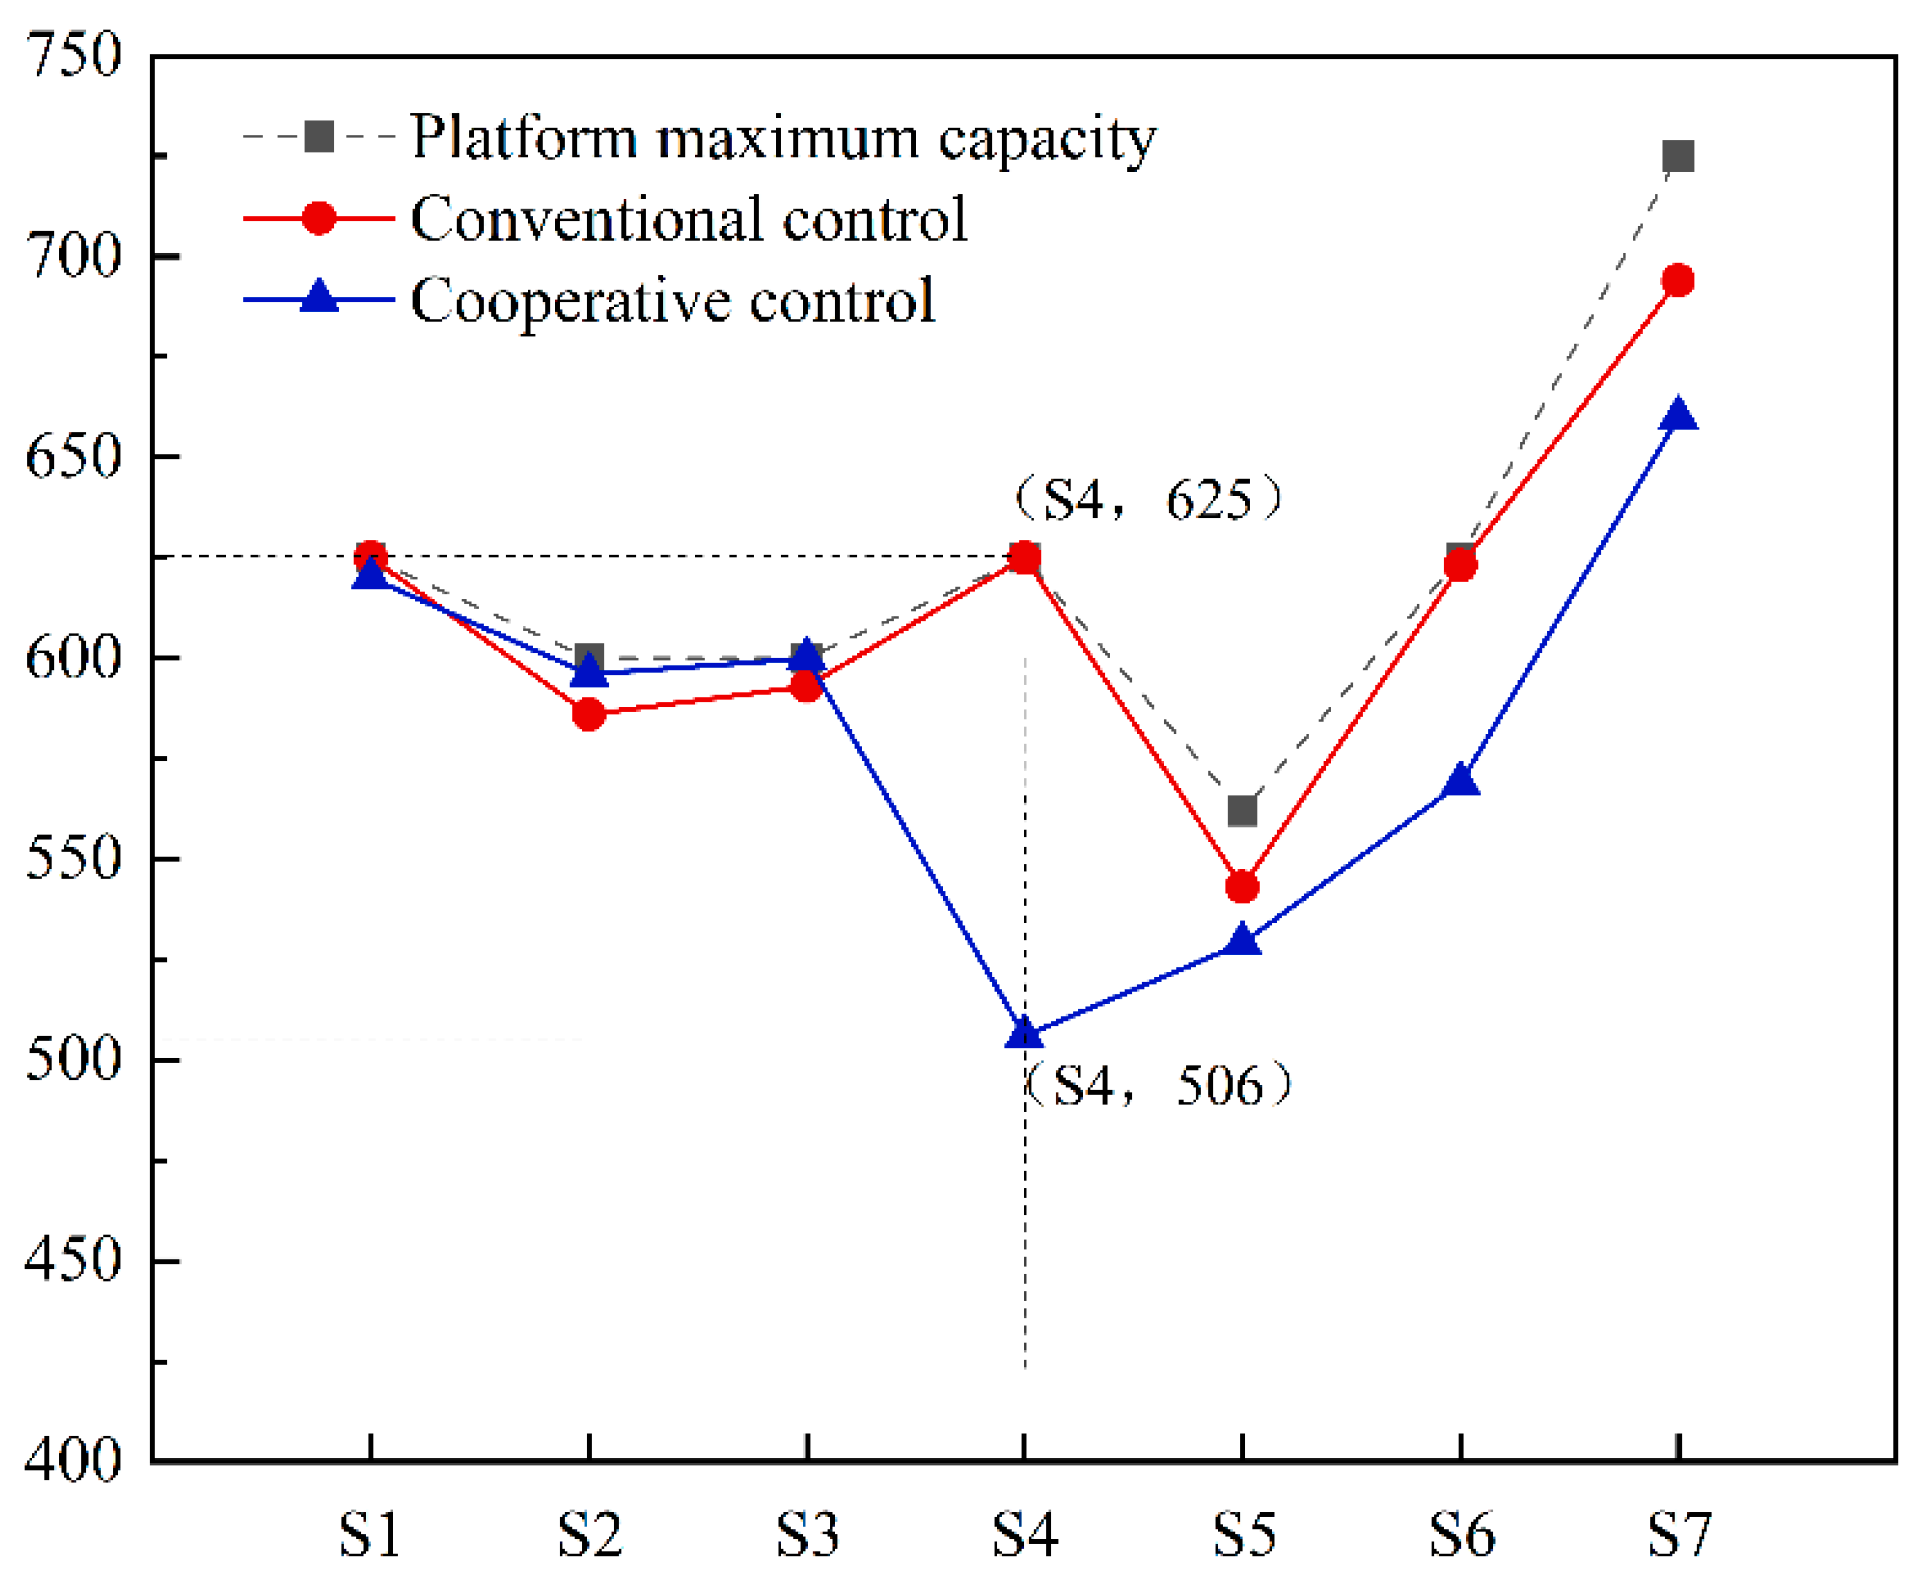
Figure 10 depicts the variation in the platform occupancy at Caohejing Hi-Tech Rd. during each departure interval. When using the conventional control scheme, the passenger flow accumulates until it reaches the upper limit of the platform carrying capacity. Under the Collaborative passenger flow control solution, Caohejing Hi-Tech Rd. is the downstream station of Xingzhong Rd. and Hechuan Rd., and the reserved capacity of the upstream station significantly reduces the number of people gathering at this station, which effectively relieves the congestion of passengers and improves the transportation efficiency and operational safety of the station.
7. Conclusions and Future Work
In this study, based on the theory of station–vehicle synergy, the objective is to minimize the total passenger delay time and maximize the total number of boardings. Considering four constraints—namely, the train operation process, passenger entry process, passenger–train interaction process, and system constraints—a Collaborative passenger flow control optimization model is constructed for oversaturated metro lines and is combined with an improved artificial bee colony algorithm to solve the model. The employed bee and onlooker bee take advantage of the evolutionary algorithm’s fast convergence feature and strong global search ability. Finally, Shanghai Metro Line 9 is used as an example to demonstrate the performance and effectiveness of the proposed cooperative control. According to the results of numerical experiments, it can be seen that the model proposed in this paper can improve the matching between the transportation capacity and passenger demand. The train load rate and the maximum number of people gathered on the platform are both reduced to a safe and manageable level compared to the conventional flow control mode. Passenger delays on the platform were reduced by 55.64%, and total delays in and out of the station were reduced by 36.26%. It is shown that the model helps to alleviate the pressure of the passenger flow on oversaturated lines, optimize the capacity structure of routes, and improve transport efficiency while ensuring operational safety.
The current model is applicable to single-line independent operation scenarios and has not yet considered the networked passenger flow interactions or micro-node congestion conduction. In the future, we will develop lightweight real-time control algorithms and embed the station multi-flow line interaction mechanism in the model to further enhance the robustness of the decision-making in complex environments.


