Abstract
To address the challenges of detecting spray code defects caused by complex morphological variations and the discrete characterization of dot-matrix spray codes, an improved YOLOv7-tiny algorithm named DASS-YOLO is proposed. Firstly, the DySnakeConv module is employed in Backbone–Neck cross-layer connections. With a dynamic structure and adaptive learning, it can capture the complex morphological features of spray codes. Secondly, we proposed an Attention-guided Shape Enhancement Module with CAA (ASEM-CAA), which adopts a symmetrical dual-branch structure to facilitate bidirectional interaction between local and global features, enabling precise prediction of the overall spray code shape. It also reduces feature discontinuity in dot-matrix codes, ensuring a more coherent representation. Furthermore, Slim-neck, which is famous for its more lightweight structure, is adopted in the Neck to reduce model complexity while maintaining accuracy. Finally, Shape-IoU is applied to improve the accuracy of the bounding box regression. Experiments show that DASS-YOLO improves the detection accuracy by 1.9%. Additionally, for small defects such as incomplete code and code spot, the method achieves better accuracy improvements of 8.7% and 2.1%, respectively.
1. Introduction
In the manufacturing industry, the spray code defect detection is crucial for products across various sectors such as food, pharmaceuticals, and daily chemicals. The spray code defects include multi-color interference, high-complexity defects, and various printing defects caused by improper printing parameter settings, equipment precision limitations, and environmental factors [1]. These defects have the potential to compromise product safety, disrupt market order, and tarnish brand reputations. Moreover, they can significantly influence consumer purchasing decisions negatively. Some common spray code defects are shown in Figure 1. These defects are referred to as code blank (missed spray code), code drift, code incomplete, code duplication, code offset and code spot contamination, respectively. Spray code defect detection can automatically and quickly identify issues, promptly send alerts, and notify operators to take corrective actions. This process reduces the number of defective products, decreases the reliance on manual inspections, and enhances production line efficiency. As a result, spray code defect detection plays an important role in achieving industrial automation.
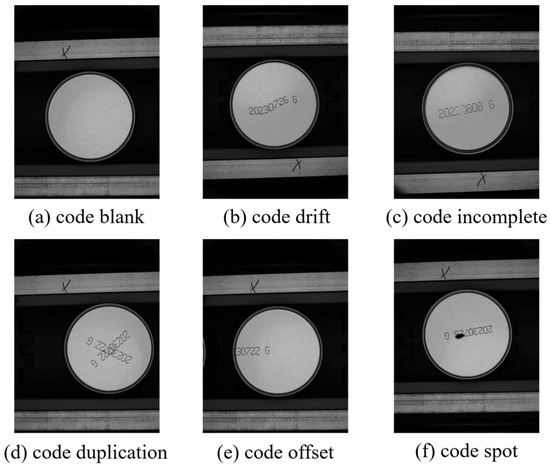
Figure 1.
Images of spray code defects.
In recent years, the evolution of deep learning-driven object detection has yielded remarkable breakthroughs in both accuracy and efficiency. Liang et al. [2] used ShuffleNet V2 framework strategies to inspect inkjet codes on complex backgrounds. Peng et al. [3] integrated U-Net with EfficientNet for code defect detection in plastic containers. The landscape of deep learning-driven object detection is dominated by two main paradigms: the one-stage detection network of the You Only Look Once (YOLO) series [4,5,6,7,8,9,10,11,12,13], and the two-stage detection methods typified by Region-Based Convolutional Neural Networks (R-CNNs) [14], Fast R-CNN [15], Faster R-CNN [16], etc. Compared to the two-stage detection methods, the YOLO algorithms eliminate the necessity of generating region proposals, allowing the entire object detection pipeline to be executed through a single neural network forward pass, thereby achieving significant improvements in computational efficiency and real-time inference speed. To strike a better balance between speed and accuracy, numerous enhancements to the YOLO framework have been proposed. Focusing on key aspects like feature extraction, feature fusion, and regression loss, these improvements have significantly boosted the performance of surface defect detection tasks [17]. Luo et al. [18] introduced the high-resolution P2 layer from the Backbone to enhance small defect recognition in steel bridge inspections. You et al. [19] enhanced shape representation for insulator defect detection. Yao et al. [20] optimized the feature fusion and attention mechanism to improve the accuracy of steel defect detection. Guo et al. [21] used deformable convolution and dual attention to improve small defect detection and suppress background noise. Wang et al. [22] enhanced the attention and feature fusion modules, achieving high accuracy and efficiency in small defect detection on PCB circuits. As a continuously evolving framework with strong adaptability, the YOLO series not only remains a vibrant research topic, but its variants also consistently advance the frontiers of real-time object detection across diverse application domains.
In summary, the YOLO series demonstrates immense potential in the field of defect detection. However, spray code defects present unique challenges due to their small size, complex shapes, and dot-matrix structures, which lead to reduced feature distinguishability and reduced accuracy. To address these challenges, an improved YOLOv7-tiny algorithm, termed DASS-YOLO, with four key enhancements, is proposed.
First, to more effectively capture defects of varying scales, shapes, and orientations, Dynamic Snake Convolution (DySnakeConv) is integrated into the Backbone–Neck cross-layer connections, replacing standard convolution (SC) operations. This deformable convolution mechanism can dynamically adjust the shape of the convolution kernels based on the changes in the feature map, thereby improving the accuracy and robustness of object detection. Second, to mitigate the influence of the discontinuous dot patterns in the spray codes and enhance the feature extraction, we proposed the Attention-guided Shape Enhancement Module with Context Anchor Attention (ASEM-CAA). Within this architecture, dual symmetrical branches are designed to facilitate synergistic interactions between local detailed features and global contextual representations. In concert with DySnakeConv, the model improves the detection accuracy of small defects and defects with complex shapes. Furthermore, the Slim-neck is adopted as the Neck structure, which reduces the model parameters through a streamlined design while maintaining the effectiveness of feature fusion. Finally, the shape intersection over union (Shape-IoU) loss is utilized to assist in model training. It enhances the precision of bounding box regression by concentrating on the dimensions and proportions of the bounding boxes.
2. Related Works
In this section, we first review the baseline architecture and key components of YOLOv7-tiny, highlighting its lightweight design and efficiency-oriented optimizations. We then introduce the targeted improvements to address specific limitations of the original model in spray code defect detection.
2.1. YOLOv7-Tiny Network Architecture
YOLOv7-tiny is a lightweight version of the YOLOv7 series [9]. It significantly reduces computational complexity while maintaining high detection accuracy. As shown in Figure 2, the overall architecture includes three main components: Backbone, Neck, and Head. The Backbone is composed of a series of T-ELAN (Tiny Efficient Layer Aggregation Network) modules, CBL modules, and Maxpooling layers, which progressively extract multi-level features from the input image. In the Neck, YOLOv7-tiny retains the Path Aggregation Feature Pyramid Network (PAFPN) structure from the previous YOLO. This architecture combines bottom-up and top-down pathways to enhance multi-scale feature fusion, thereby improving the model’s ability to detect objects of varying sizes. Finally, the Head comprises three detection branches responsible for detecting targets of different sizes and obtaining the corresponding location and category information. Both YOLOv7 and YOLOv7-tiny adopt the Complete Intersection over Union (CIoU) loss function for bounding box regression. In addition, compared with the E-ELAN (Extended-ELAN) used in YOLOv7, T-ELAN is specifically designed for lightweight models by controlling the longest and shortest gradient paths, which effectively accelerates inference processes and improves overall efficiency.
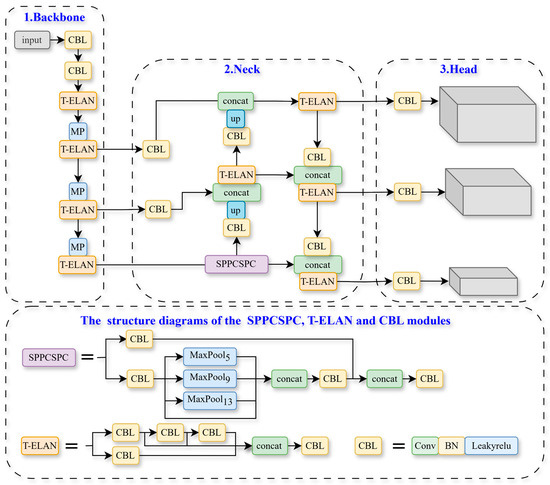
Figure 2.
The structure of YOLOv7-tiny.
2.2. The General Structure of DASS-YOLO
The proposed improved model is based on YOLOv7-tiny [9], as illustrated in Figure 3. Compared to the original YOLOv7-tiny, the SC modules in the cross-layer connections between the Backbone and Neck are replaced with DySnakeConv modules, enhancing the extraction of slender structures and dot-matrix features. Based on Selective Boundary Attention (SBA), we designed a symmetrical ASEM-CAA module to enhance both the local and global information interaction, which is integrated between P3‘ and N4. In addition, we adopted Slim-neck in the Neck to reduce the number of parameters while maintaining effective feature fusion. Finally, we employed the Shape-IoU loss function to achieve more precise bounding box regression. In the next sections, we will explain these improvements in detail.
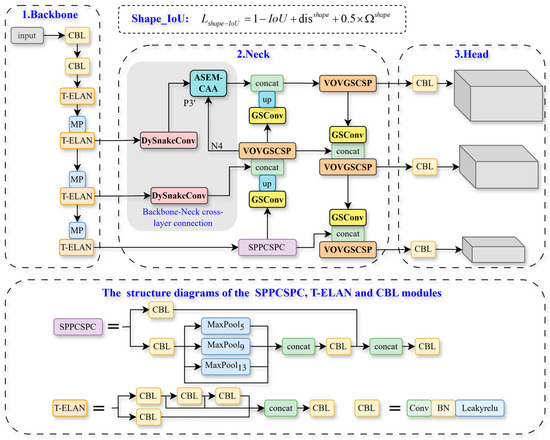
Figure 3.
The network structure of DASS-YOLO. The framework integrates the DySnakeConv module and the proposed ASEM-CAA module into the Backbone–Neck cross-layer connections, and utilizes the Slim-neck structures comprising the GSConv and VOVGSCSP modules.
3. Methodology
This section introduces the key components of the improved method DASS-YOLO for spray code defect detection. To address challenges such as capturing slender elongated structures, dot-matrix features, representing fragmented and discontinuous features, we propose four key innovations: (1) DySnakeConv for slender and dot-matrix feature extraction; (2) ASEM-CAA for fragmented and discontinuous feature representations; (3) Slim-neck for parameter reduction; and (4) Shape-IoU for precise regression. The following subsections detail each component’s design, integration, and role in enhancing detection performance.
3.1. DySnakeConv
In the original YOLOv7-tiny algorithm, the Backbone–Neck cross-layer connections use SC to capture local features. However, spray code defects often consist of dot-matrix characters, where spray dots follow the shapes of fine strokes, forming slender and sparse structures. In many cases, missing dots caused by uneven spraying or nozzle issues lead to incomplete spray codes, further increasing the difficulty of feature extraction, especially under background noise and after successive down-sampling operations in the Backbone.
To address these challenges, we substitute SC with DySnakeConv to enhance the model’s ability to capture the slender elongated structures and dot-matrix features. As presented in Figure 4 [23], DySnakeConv outperforms SC by dynamically adapting the shape and position of its convolutional kernels to better fit complex and irregular structures. Additionally, it employs an iterative strategy to constrain kernel movement, ensuring that the model focuses more precisely on stroke-aligned shapes, even when parts of the structure are missing or blurred. These capabilities make DySnakeConv particularly well-suited to handling the subtle, incomplete, and sparse features typical of spray code defects. Thus, we replace the two CBL modules between the Backbone and Neck in Figure 2 with DySnakeConv in Figure 3.
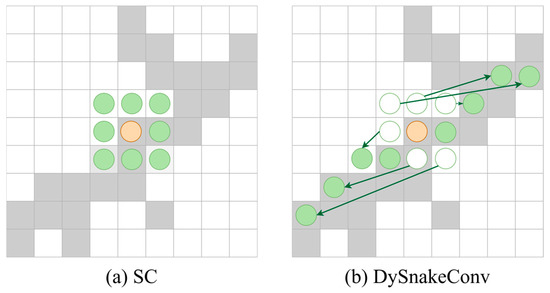
Figure 4.
Comparison of DySnakeConv with SC. The shaded area represents the target shape, the orange points indicate the convolution kernel positions, and the green points and arrows demonstrate the adaptive deformations of convolution kernels.
3.2. Attention-Guided Shape Enhancement Module with CAA
Although the DySnakeConv module performs well in representing the local geometric structure of spray code characters, it primarily focuses on capturing the contours of individual characters. This limitation leads to fragmented and discontinuous global feature representations, making it difficult for the model to accurately capture the full structure of the spray code.
To address this, based on Selective Boundary Aggregation (SBA) [24], we propose the ASEM-CAA module (shown in Figure 5). This module is designed to enhance the global continuity and consistency of the overall spray code geometric shape and to help the model form more continuous and complete defect representations during the feature fusion stage.
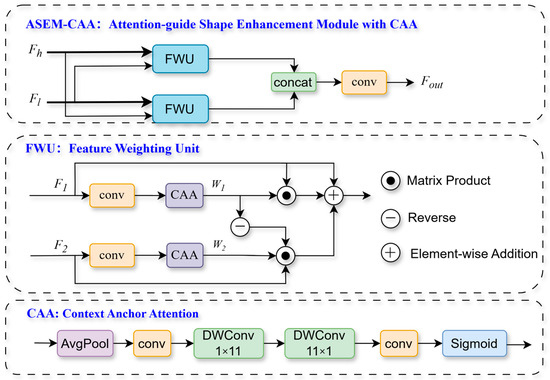
Figure 5.
The symmetrical structure of the ASEM-CAA module. It consists mainly of two FWU modules, each employing the CAA mechanism to perform feature weighting.
Specifically, the Sigmoid function in the original Re-calibration Attention Unit (RAU) [24] is replaced with the CAA module [25], and then we obtain a new module, named the Feature Weighting Unit (FWU). Compared to solely using the Sigmoid function, the CAA module introduces horizontal and vertical depth-wise strip convolutions, enabling FWU to capture the structural relationships of characters in both row and column directions effectively, further enhancing the extraction of the overall spray code structures. The operator FWU can be expressed as:
where and are the input features, and the operation symbol denotes element-wise multiplication. The two weights and are produced by firstly applying a convolution and CAA right behind.
We replaced the two RAU modules in SBA with two FWU modules to form the ASEM-CAA module. This symmetrical structure plays a crucial role in balancing the processing of multi-level features. As shown in Figure 6b, ASEM-CAA is integrated into the YOLOv7-tiny, taking P3′ (P3 after DySnakeConv processing) and N4 (features fused from P4 and P5) as inputs. This process can be formulated as
where and represent N4 and P3′, respectively. P3′ contains rich details that represent fine character strokes, while N4 includes global semantic information, reflecting the overall character shape. These two complementary features are symmetrically processed by the dual FWU branches. compensates for the lack of detailed individual character information in global semantic features. complements the absence of overall spray code shape information in local features. These symmetrical branches enable the model to simultaneously focus on detailed local structures and maintain the continuity of global shape patterns. Finally, the outputs of these two FWU modules are fused through a 3 × 3 convolution to effectively integrate local and global representations.

Figure 6.
Comparison of Neck structures. In the Neck of DASS-YOLO, DySnakeConv replaces the CBL modules in the Backbone-–Neck cross-layer connections. Additionally, the ASEM-CAA module is inserted between P3′ and N4, and GSConv with VoVGSCSP modules is integrated into the Neck.
3.3. Using Slim-Neck to Lightweight the Model
For spray code defect detection, achieving faster detection speeds without compromising accuracy is essential. However, integrating DySnakeConv and ASEM-CAA modules introduces additional parameters. To address this issue, the Slim-neck structure [26] is integrated into the Neck of YOLOv7-tiny, which consists of Grouped Shuffle Convolution (GSConv) and Vovnet GSConv Cross Stage Partial (VoVGSCSP). GSConv optimizes the performance of the model by combining SC with Depth-wise Separable Convolution (DSC). GSConv employs a shuffle operation to merge features from both convolutions. This shuffle operation ensures that the information from the SC is fully integrated into the DSC outputs, making the output of GSConv more closely resemble that of SC. As shown in Figure 6b, we replace the four CBL modules in the original YOLOv7-tiny Neck (Figure 6a) with GSConv. The VoVGSCSP module is composed based on GSConv and employs a one-shot aggregation strategy to reduce computational complexity while maintaining accuracy. Its structure is illustrated in Figure 7. As depicted in Figure 6, we also replace the four ELAN modules in the original Neck with VoVGSCSP modules. Consequently, the slim neck is incorporated into DASS-YOLO. This integration effectively minimizes redundant information and computational complexity, enhancing efficiency while preserving feature extraction accuracy.

Figure 7.
The structure of VoVGSCSP [26].
3.4. Shape-IoU
The original YOLOv7-tiny model uses the Complete Intersection over Union (CIoU) loss [27], which measures the similarity between the predicted box and Ground Truth (GT) box by incorporating center distance, aspect ratio, and overlap area. These factors are crucial for measuring bounding box regression in object detection. The CIoU loss is calculated in the following manner [27]:
where and represent the predicted box and GT box, respectively. and are the center points of and , respectively. is the Euclidean distance, and refers to the diagonal distance of the minimum enclosing bounding box between and . and denote the width and height of , and and denote the width and height of .
Spray code defects, such as code incomplete and code spot, are typically small. The CIoU loss lacks sufficient sensitivity to subtle positional variations and size differences, which can result in poor detection performance for these small targets. In contrast, Shape-IoU [28] considers not only the relative position between and shape of the predicted boxes and GT boxes, but also the inherent properties of the bounding boxes themselves. Thus, we employ Shape-IoU loss to calculate loss, aiming to improve the accuracy of detecting small targets. The formulas for Shape-IoU are defined as follows [28]:
where is the scale factor, which corresponds to the scale of the target in the dataset. and refer to the weights in the horizontal and vertical directions, respectively, and the values of these weights are closely related to the shape characteristics of the GT box. is the shape cost and is the distance cost.
4. Experiments
To validate the effectiveness of DASS-YOLO for spray code defect detection, this section systematically conducts experimental evaluations. First, the experimental configurations and dataset specifications are introduced, followed by detailed descriptions of evaluation metrics. Subsequently, comparative analyses with state-of-the-art methods are presented alongside visual analyses of detection results. Furthermore, comprehensive ablation studies are performed to quantitatively evaluate the contributions of key components, complemented by generalization experiments on the NEU-DET benchmark. Finally, we objectively summarize the algorithm’s performance characteristics and discuss potential limitations.
4.1. Experimental Setup
All experiments were conducted using the PyTorch 2.1.0 framework, with Graphics Processing Unit (GPU) acceleration. The detailed experimental environment configuration is listed in Table 1.

Table 1.
Experimental environment.
The key training parameters were configured as follows: the input image size was set to 640 × 640 pixels, with a batch size of 16 and a total of 300 training epochs. The Adam optimizer was used to update the network parameters, with a learning rate of 0.01, momentum set to 0.937, and weight decay set to 0.0005.
4.2. Dataset
The dataset was captured directly on the production line using a 1.6-megapixel industrial matrix camera, initially consisting of 700 images. These images reflect authentic production conditions, including background noise and common defects. However, since the target industrial environment inherently exhibits moderate noise levels, the original dataset was insufficient to simulate high-noise scenarios that may occur under harsher operating conditions.
To address the limited dataset, both annotation refinement and image augmentation were applied to improve its diversity and quality. As illustrated in Figure 8, various augmentation techniques such as flipping, noise addition (simulating SNR levels between 10 dB and 20 dB), and random brightness adjustment were used to expand the dataset. Such enhancements aim to simulate a wide range of realistic challenges, especially under high-noise conditions. As a result, the total number of images increased to 2105. These augmentation strategies not only increased the volume of training data, but also improved dataset variability. Exposure to diversified training data enables the model to learn broader feature representations and patterns, thereby enhancing generalization capability. By preventing over-reliance on specific samples or features, this approach mitigates overfitting risks during training.
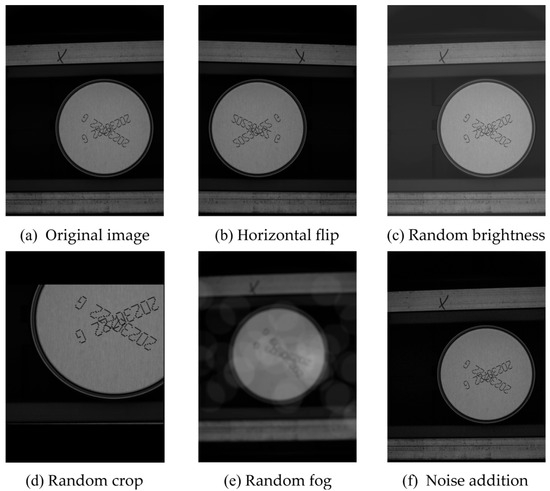
Figure 8.
Various augmentation operations for the code duplication defect.
4.3. Evaluation Metrics
The evaluation metrics used in this paper include mean Average Precision (mAP), number of parameters, floating point operations (FLOPs), and inference time (Speed). The detailed calculations for these metrics are as follows:
where represents the number of defective samples successfully identified, represents the number of samples that were not defective but were misclassified as defective, and represents the number of samples that were actually defective but not detected.
4.4. Comparison with Other Methods
To demonstrate the superiority of the proposed method in spray code defect detection, we compare its performance with twelve existing methods. The quantitative results are summarized in Table 2 and Table 3, which highlight the performance advantages of our approach over conventional object detection methods.

Table 2.
Experimental results of different models.

Table 3.
Experimental results comparing the accuracy of different models across various defects.
As shown in Table 2, the proposed model achieves the highest mAP@0.5 of 97.3%. The two-stage algorithms, Faster R-CNN and Swin Mask R-CNN [29], achieve mAP@0.5s of 94.3% and 93.3%, respectively, but they are associated with higher model complexity. The real-time detection transformer (RT-DETR) algorithms, RT-DETR-R50 and RT-DETR-R101 [30], exhibit poor performance in our task. We conducted several experiments to test the one-stage YOLO series methods. Here, we present only the results with a comparable number of parameters, focusing on achieving a better balance between parameter numbers and detection accuracy with DASS-YOLO. As we can see, YOLOv8s and YOLOv5m have more parameters than DASS-YOLO, yet the detection accuracy of YOLOv8n and YOLOv5 is lower than that of DASS-YOLO. The FLOPs of YOLOv9s, YOLOv10s, and YOLOv11s are higher than DASS-YOLO.
As shown in Table 3, the proposed model also outperforms other detectors across multiple defect categories, especially in more challenging cases such as the code incomplete and code spot categories, achieving detection accuracies of 91.8% and 97.1%, respectively, which surpass the best-performing counterparts by at least 1.8% and 2.8%.
In summary, DASS-YOLO achieves the best overall balance between detection performance and model complexity, with the highest mAP@0.5, fewer parameters, and lower FLOPs.
Some of the detection results are visualized in Figure 9. The first row shows the original images, while the second and third rows present the detection results of YOLOv7-tiny and our method on three defect types—the code incomplete, code spot, and code drift defects, respectively. As shown in Figure 9a,c, the YOLOv7-tiny model failed to detect incomplete codes and incorrectly recognized code drift as code spot. In contrast, our improved algorithm detected these defects correctly. Although the detection capabilities of the two algorithms for code spot defects (Figure 9b) are similar, DASS-YOLO still maintains high detection performance.
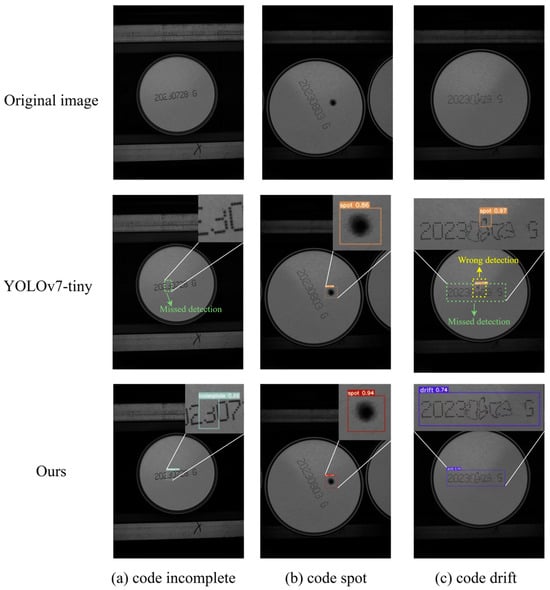
Figure 9.
Visual results on spray code defect dataset. Green boxes indicate missed detections, while yellow boxes represent wrong detection.
We further validate the effectiveness of DASS-YOLO using target detection heatmaps. Heatmaps can display the potential locations of targets in an image through intuitive color mapping, making the detection process more intuitive and efficient. To better demonstrate DASS-YOLO’s attention mechanism, we selected the duplication defect as a visualization example. Due to its interleaved and irregular structure, this defect poses challenges for precise localization and thus demands high shape-awareness. As shown in Figure 10b, the heatmaps produced by the original YOLOv7-tiny model exhibit dispersed color distribution, with significant activation in non-target areas. This indicates that the attention of the model is scattered across irrelevant regions, reducing its ability to accurately localize spray code defects. In contrast, the heatmaps generated by the DASS-YOLO (Figure 10c) exhibit more concentrated and localized activation patterns around the actual defects. This concentrated attention suggests that the improvements help the model better identify and consistently attend to relevant defect regions, thus improving detection accuracy and robustness.
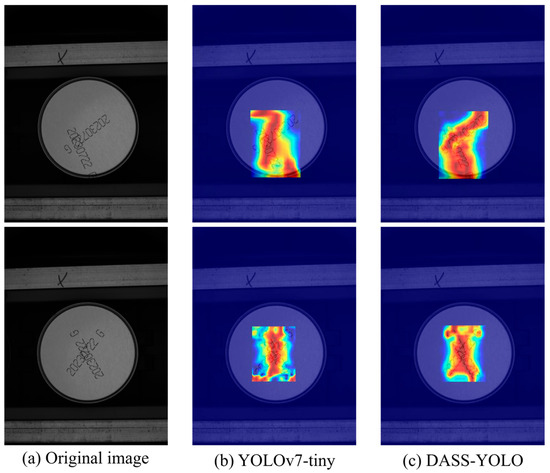
Figure 10.
Heatmap Comparisons. In (b,c), regions with hues closer to red indicate higher activation intensity, denoting greater model focus on defect-relevant features.
4.5. Comparison of Evaluation Metrics During Training and Validation
To intuitively analyze training dynamics and model performance, Figure 11a–c,f–h visualize the training and validation loss curves over 300 epochs for the original YOLOv7-tiny and DASS-YOLO. DASS-YOLO not only attains a lower terminal loss, but also demonstrates accelerated and smoother convergence. These results confirm that DASS-YOLO facilitates faster convergence, enhanced training stability, and more precise object localization. Furthermore, DASS-YOLO achieves higher precision, recall, and mAP, with significant improvements in mAP@0.5 (Figure 11i) and mAP@0.5:0.95 (Figure 11j). As shown in Figure 11d,e, DASS-YOLO also achieves a superior precision–recall balance, indicating enhanced detection capability. Collectively, these results validate the proposed enhancements and underscore DASS-YOLO’s accuracy and robustness in spray code defect detection tasks.
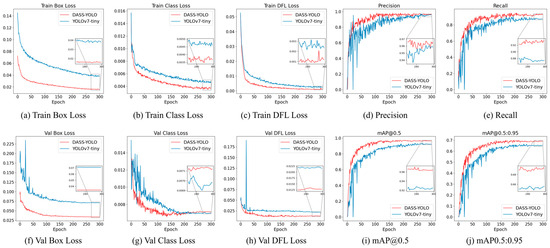
Figure 11.
Model performance during the training and validation of the original YOLOv7-tiny and DASS-YOLO.
4.6. Ablation Study
To validate the effectiveness of DySnakeConv, Slim-neck, and Shape-IoU in DASS-YOLO, we conducted the ablation experiments. The results are presented in Table 4 and Table 5, where A, B, C, and D denote the DySnakeConv, ASEM-CAA, Slim-neck, and Shape-IoU modules, respectively.

Table 4.
The results of ablation experiments.

Table 5.
The ablation experiment results of accuracy across various defects.
As shown in Table 4, the baseline YOLOv7-tiny model achieves an mAP@0.5 of 95.4%. By incorporating the DySnakeConv module, the algorithm achieves a 1% improvement. According to Table 5, this improvement is particularly notable in the code incomplete category, achieving a gain of 6.8%, consistent with the analysis in the previous sections. When the ASEM-CAA module is incorporated individually, the mAP@0.5 reaches 96.3%. Although there is a slight increase in parameters and FLOPs, it is controllable. As can be seen in Table 5, this module yields a 1.8% improvement in detecting code drift defects. Furthermore, when combining DySnakeConv and ASEM-CAA, the model exhibits enhanced performance across multiple defect types, particularly for incomplete codes and code drift defects, demonstrating the complementary nature of these two modules.
The heatmaps from the ablation experiments incorporating DySnakeConv and ASEM-CAA are presented in Figure 12. Figure 12a (first column) shows the original images, while Figure 12b–e (columns 2–5), respectively, present the heatmap visualizations of the baseline YOLOv7-tiny, the model incorporating only the DySnakeConv module, the model incorporating only the ASEM-CAA module, and the model incorporating both modules. As shown in Figure 12b, the heatmaps generated by the original CBL module exhibit dispersed attention regions with background noise, indicating weak focus on the spray code structures. After integrating DySnakeConv (Figure 12c), the attention regions align more precisely with the individual code patterns, demonstrating that enhanced localization of code regions and more accurate capture of fine-grained dot details. Further, in Figure 12d, after introducing the ASEM-CAA module, they reveal sharper target regions and a significant reduction in background attention, which suppresses inference and improves continuity in spray code shapes. Finally, the heatmaps in Figure 12e demonstrate that the combination of DySnakeConv and ASEM-CAA further optimizes attention distribution, intensifying focus on code regions while minimizing background distractions. The synergistic interaction between DySnakeConv and ASEM-CAA demonstrates their capability to simultaneously refine feature representation and achieve higher detection accuracy.
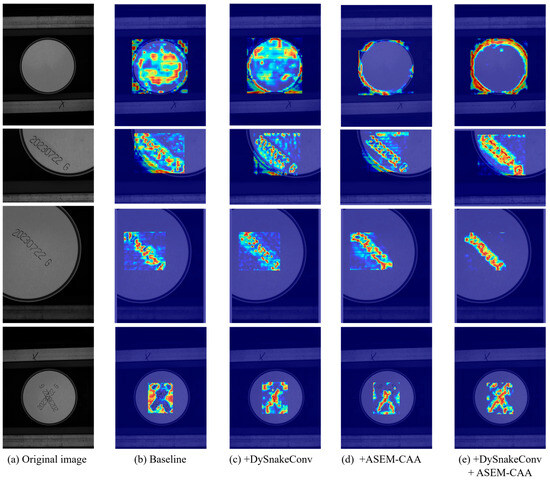
Figure 12.
The heatmaps from the ablation experiments. In (b–e), regions with hues closer to red indicate higher activation intensity, denoting greater model focus on defect-relevant features.
Since the DySnakeConv module and the ASEM-CAA module introduce additional parameters, the lightweight Slim-neck structure is adopted to address this issue. Integrating only the Slim-neck structure results in an mAP@0.5 of 95.8%, with 5.57 M parameters and 12.0 G FLOPs, demonstrating its effectiveness in reducing model complexity while maintaining accuracy. Furthermore, when DySnakeConv, ASEM-CAA, and Slim-neck are integrated, the model achieves both reduced complexity and enhanced performance.
Subsequently, as shown in Table 4, incorporating Shape-IoU for auxiliary training improves the mAP@0.5 by 0.3%, contributing to the better localization of small targets. Ultimately, the combination of DySnakeConv, ASEM-CAA, Slim-neck, and Shape-IoU leads to the best overall performance, achieving an mAP@0.5 of 97.3%. The detection speed is 7.5 ms, which is allowed for real-time detection.
4.7. Ablation Analysis of Key Modules and Design Strategies
To further evaluate the effectiveness and contribution of each module, we conducted a comprehensive ablation analysis focusing on both module integration and parameter design strategies. Specifically, we examined (1) the effect of placing DySnakeConv at different positions, (2) the impact of DySnakeConv under highly noisy conditions, (3) the performance of ASEM-CAA, and (4) the influence of the scale parameter in Shape-IoU and the performance impact of combining Shape-IoU with other regression loss strategies. The ablation results provide deeper insights into how each design choice contributes to the overall detection performance.
4.7.1. Experiments on Positional Ablation of DySnakeConv
To validate the effectiveness of the DySnakeConv placement, we conducted experiments comparing two different integration strategies. The results are shown in Table 6. Location 1 refers to replacing SC with DySnakeConv in the Backbone–Neck cross-layer connections, while Location 2 refers to replacing SC with DySnakeConv in the Head.

Table 6.
Comparison of two strategies for integrating the DySnakeConv module.
As we can see, both Location 1 and Location 2 improve accuracy compared to the baseline. However, Location 2 leads to an increase in the number of parameters and FLOPs by about 52.4% and 30.3%, respectively, while Location 1 increases them by only about 4.0% and 6.8%. This means that Location 1 achieves a better performance, confirming the effectiveness of this integration strategy.
4.7.2. Experiments on Noise Robustness of DySnakeConv
To further explore the practical applicability of DySnakeConv in real-world industrial scenarios, we conducted experiments to evaluate its noise robustness. Industrial environments often involve complex background noise, which poses significant challenges for accurate object detection. This is particularly true for spray code defect detection, where defects are often subtle, incomplete, and easily interfered with by noise.
In our experiments, we added Gaussian white noise with SNRs of 25 dB, 20 dB, 15 dB, 10 dB, and an extreme case of 5 dB to the validation set. The choice of Gaussian white noise is based on its widespread use as a standard noise model in signal processing and computer vision, which allows for a controlled and systematic evaluation of noise robustness.
Figure 13 compares the noise robustness performance of three models—baseline YOLOv7-tiny, YOLOv7-tiny enhanced with DySnakeConv, and our DASS-YOLO model. As the noise intensity increases, the DySnakeConv-enhanced model consistently outperforms the baseline YOLOv7-tiny, demonstrating that DySnakeConv effectively improves the model’s ability to handle noise. Furthermore, our DASS-YOLO model achieves the best detection performance across all noise levels, significantly outperforming both the baseline and the DySnakeConv-only model under the extreme 5 dB condition.
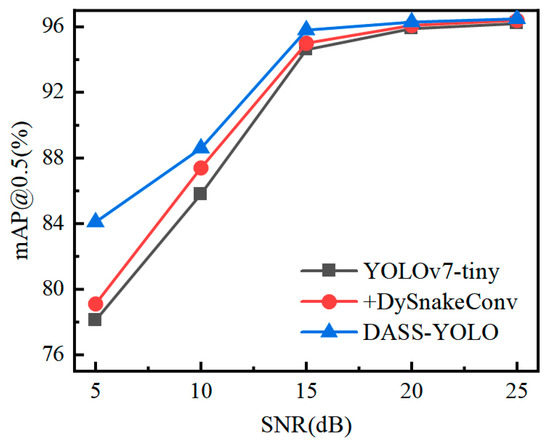
Figure 13.
Noise robustness (mAP@0.5) comparison: baseline vs. DySnakeConv-enhanced vs. DASS-YOLO under Gaussian noise (25–5 dB SNR).
These results highlight the effectiveness of DySnakeConv in improving noise robustness and validate the overall superiority of our proposed model. While our experiments focus on Gaussian white noise, the observed improvements suggest that DySnakeConv has the potential to enhance robustness against other types of noise commonly encountered in industrial settings. Future work could extend these experiments to include a broader range of noise types to further validate the generalizability of our approach.
4.7.3. Experiments on Attention Ablation of ASEM-CAA
To demonstrate the effectiveness of the attention mechanisms of CAA in the FWU module, we compared three different approaches—CA [31], ELA [32], and SBA [24]—as shown in Table 7. The results indicate that DASS-YOLO achieves the highest overall detection performance, with an mAP@0.5 of 97.3%, outperforming CA, ELA, and SBA by 0.5%, 0.3%, and 0.9%, respectively. These results demonstrate the validity of CAA.

Table 7.
Experimental results of different attention.
4.7.4. Ablation Analysis of the Scale Parameter in Shape-IoU and Its Combination with Other Regression Loss Strategies
The performance of Shape-IoU is influenced by the scale parameter. Figure 14 illustrates how AP@0.5 varies with different scale factor (scale) values across various defect categories. When the scale is set to 1.0, the model achieves the highest detection accuracy, demonstrating optimal performance across most categories.
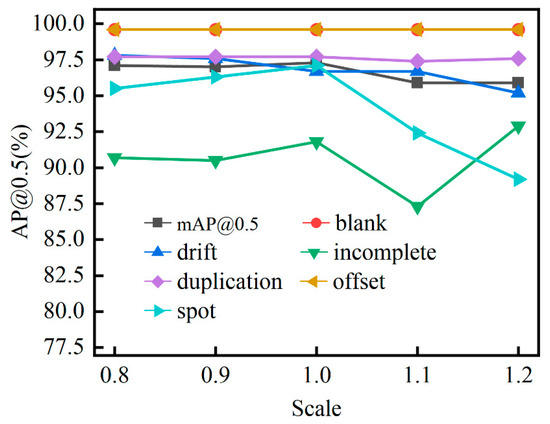
Figure 14.
The effect of scale factor on the AP@0.5.
Building on these findings, we explored the potential benefits of combining Shape-IoU with other IoU-based regression methods. The motivation for this exploration stems from the desire to further enhance detection performance by leveraging the complementary strengths of different loss functions. We chose a linear weighted formulation as our combination method due to its simplicity and effectiveness in balancing contributions from multiple loss components. The formulation is
where represents one of EIoU, SIoU, GIoU, or CIoU, and represents the weight ratio which balances the contribution of Shape_IoU.
As presented in Table 8, when the contribution of Shape-IoU increases (with an of 0.7, 0.8, and 0.9), all BaseLoss functions combined with Shape-IoU achieve significant improvements in mAP@0.5. These results highlight that Shape-IoU not only enhances shape awareness during bounding box regression but also effectively complements other IoU-based regression strategies, leading to better detection performance.

Table 8.
The mAP@0.5 performance of different IoU-based loss functions combined with Shape-IoU at various weight ratios ( = 0.7, 0.8, 0.9).
Interestingly, our results also indicate that Shape-IoU alone already offers superior performance in many cases. However, the combination approach still holds potential for specific scenarios and could provide additional improvements in certain aspects of detection performance. This suggests that further exploration of combination strategies might be valuable for addressing particular challenges in object detection tasks.
4.8. Comparative Experiments on the NEU-DET Dataset
To comprehensively evaluate the generalization ability of our proposed DASS-YOLO framework, we conducted comparative experiments on the NEU-DET dataset. We first benchmarked our model against other methods across six common defect categories. Then, to further examine the adaptability of the proposed ASEM-CAA module in handling diverse industrial defects, an ablation study was provided.
4.8.1. Comparison with Other Methods for Defect Detection in NEU-DET Dataset
To validate the generalization capability of DASS-YOLO, we conducted experiments on the NEU-DET [36] dataset (Figure 15) and compared the results with several existing methods. Table 9 summarizes the performance comparison across six defect categories defined in the NEU-DET dataset, including Crazing (Cr), Inclusion (In), Patches (Pa), Pitted Surface (Ps), Rolled-in Scale (Rs), and Scratches (Sc). Overall, DASS-YOLO achieved the highest mAP@0.5 of 77.4%, demonstrating better detection performance and generalization in defect detection tasks.
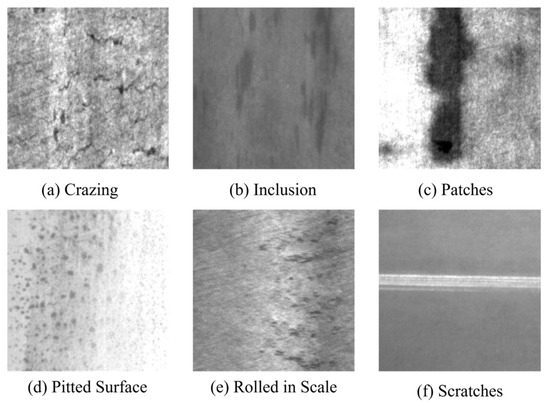
Figure 15.
Example images from the NEU-DET dataset, illustrating various types of industrial defects including Crazing (Cr), Inclusion (In), Patches (Pa), Pitted Surface (Ps), Rolled-in Scale (Rs), and Scratches (Sc).

Table 9.
NEU-DET comparison experiment.
Specifically, for the Cr and In defect categories, our method achieved detection mAP@0.5s of 55.4% and 82.8%, significantly outperforming other methods. Notably, for the Cr category, our method surpassed YOLOv7-BA, MFFA-YOLOv5, and YOLOv7-tiny by 19.1%, 25.0%, and 20.5%, respectively, proving its superior feature extraction ability in handling fine crack defects.
For the Pa and Sc categories, our method achieved 92.7% and 91.7%, closely approaching the best-performing methods, DF-YOLOv7 (93.5%) and MFFA-YOLOv5 (91.6%). These results indicate that our method maintains high accuracy in detecting linear defects.
However, for the Ps and Rs categories, our method exhibited lower performance, suggesting that its ability to detect defects with dispersed features and low contrast still requires improvement. Addressing these challenges will be a critical direction for future work.
4.8.2. The Ablation Study of ASEM-CAA on the NEU-DET Dataset
To validate the generalizability of our proposed ASEM-CAA module, we conducted an ablation experiment on the NEU-DET dataset, with the results summarized in Table 10. The integration of ASEM-CAA achieved an mAP@0.5 of 75.6%, representing a 2.7% improvement over the baseline YOLOv7-tiny model. Notably, detection accuracy improved across multiple defect categories, with the most significant enhancement observed for cracks (Cr), which exhibits discontinuous features. Accuracy for Cr increased by 10.7%, demonstrating that the ASEM-CAA module effectively enhances the representation of discontinuous and complex defect morphologies. These findings suggest the module’s strong cross-domain adaptability for industrial defect detection applications.

Table 10.
Ablation study of ASEM-CAA module on NEU-DET Dataset.
4.9. Algorithm Performance and Limitation
This section provides a comprehensive conclusion of the overall performance and limitations of the proposed DASS-YOLO model.
4.9.1. Overall Performance of DASS-YOLO
Compared to the YOLOv7-tiny baseline, our DASS-YOLO model achieves notable improvements. We conducted comprehensive comparative experiments, and the results show that DASS-YOLO achieves a model size of 5.85 MB, FLOPs of 13.4 G, while attaining an mAP@0.5 that exceeds the baseline by 1.9%. During training, our model consistently outperformed the baseline on both the training and validation sets. In terms of category performance, DASS-YOLO achieves higher detection accuracy in four defect categories and maintains comparable results in the remaining two. Heatmap visualizations further demonstrate that our model focuses more precisely on defect regions, explaining the improvement in detection accuracy. Ablation studies confirm that each module contributes to either detection precision or computational efficiency, thereby affirming the effectiveness of our overall design.
Additionally, when evaluated on the NEU-DET dataset, DASS-YOLO demonstrates robust generalization capability, achieving a 4.5% improvement in accuracy compared to the baseline.
4.9.2. Failure Cases Analysis and Limitation
Compared with state-of-the-art methods, DASS-YOLO demonstrates competitive detection performance in spray code defect detection and steel surface defect inspection. However, the model faces challenges in distinguishing certain subtle defect types, such as code drift defects characterized by variations in character width, as well as detecting minimal dot absence (e.g., ≤5 missing dots). These distinctions often demand pixel-level discrimination and can be challenging even for the human eye. As shown in Figure 16a, the character width difference between “20230” and “722 G” results in reduced localization accuracy and confidence scores. In Figure 16b, the character “2” exhibits approximately five missing dots; fewer missing elements would further increase detection difficulty. These limitations underscore the model’s difficulty in recognizing fine-grained visual patterns, emphasizing the need for future research on more discriminative feature representations and context-aware detection mechanisms.
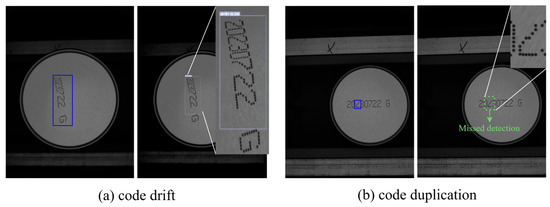
Figure 16.
Some cases of failed detection. The images with blue bounding boxes are GT boxes and green boxes indicate missed detections. The rest are detection results of our model.
5. Conclusions
In this study, we propose the DASS-YOLO model for spray code defect detection, with improvements in the Backbone–Neck connections, Neck, and loss function. Specifically, DySnakeConv is integrated into the Backbone–Neck cross-layer connections to better capture complex defect structures. An ASEM-CAA module with a symmetrical dual-branch structure is designed to enhance feature expressing, improving the interaction between the global and local features. Additionally, the Slim-neck structure reduces model complexity while maintaining detection accuracy, and Shape-IoU optimizes bounding box regression. The experimental results show that DASS-YOLO achieves an mAP@0.5 of 97.3%, which is 1.9% higher than that of the original YOLOv7-tiny. For code incomplete and code spot defects, the accuracy is improved by 8.0% and 2.9%, respectively. The detection speed is 7.5 ms, which is allowed for real-time detection. Additionally, experiments on the NEU-DET dataset demonstrate that DASS-YOLO generalizes effectively to complex, noisy industrial images and performs well in detecting fine and discontinuous defects. These results further confirm the effectiveness of our proposed improvements in handling complex scenarios. Our experiments also highlight the noise robustness of DySnakeConv, suggesting potential for enhanced performance in varied industrial noise conditions. Furthermore, the combination of Shape-IoU with other loss functions shows promise for specific detection challenges, indicating valuable directions for future research.
To further enhance detection performance, especially for subtle defect types, it is essential to introduce refined attention mechanisms that strengthen feature discrimination. In addition, since this work focuses on six common types of spray code defects, we plan to collect more diverse and representative defect samples to expand and enrich the dataset. In addition to data collection, we will explore advanced image generation techniques, such as diffusion models and AIGC, to augment the training data and improve the model’s generalization capabilities. Moreover, multi-view imaging will be investigated to provide complementary spatial information, thereby enhancing detection accuracy for ambiguous or partially occluded defects. Finally, by incorporating feedback-driven learning mechanisms, the model will be able to adapt dynamically based on real-time inspection outcomes, ultimately contributing to greater robustness and reliability in complex industrial environments.
Author Contributions
Conceptualization, Y.S. and S.Z.; data curation, M.B.; formal analysis, M.B.; funding acquisition, S.Z., X.Z. and L.Y.; investigation, Y.S. and S.Z.; methodology, Y.S. and S.Z.; resources, S.Z.; supervision, S.Z., X.Z. and L.Y.; validation, Y.S.; writing—original draft, Y.S.; writing—review and editing, S.Z. All authors have read and agreed to the published version of the manuscript.
Funding
This research was funded in part by the National Natural Science Foundation of China, grant number 62101229, the Shandong Provincial Natural Science Foundation, grant number ZR2022MF284, the Innovation Fund of Liaocheng University under Grant number 318050062, and the Experimental technology project of Liaocheng University under Grant number 26322170244.
Data Availability Statement
Example data and code will be made available upon request to the corresponding author.
Conflicts of Interest
The authors declare no conflicts of interest.
References
- Najafabadi, S.A.N.; Huang, C.; Betlem, K.; van Voorthuizen, T.A.; de Smet, L.C.P.M.; Ghatkesar, M.K.; van Dongen, M.; van der Veen, M.A. Advancements in Inkjet Printing of Metal-and Covalent-Organic Frameworks: Process Design and Ink Optimization. ACS Appl. Mater. Interfaces 2025, 17, 11469–11494. [Google Scholar] [CrossRef] [PubMed]
- Liang, Q.; Zhu, W.; Sun, W.; Yu, Z.; Wang, Y.; Zhang, D. In-line inspection solution for codes on complex backgrounds for the plastic container industry. Measurement 2019, 148, 106965. [Google Scholar] [CrossRef]
- Peng, J.; Zhu, W.; Liang, Q.; Li, Z.; Lu, M.; Sun, W.; Wang, Y. Defect detection in code characters with complex backgrounds based on BBE. Math. Biosci. Eng. 2021, 18, 3755–3780. [Google Scholar] [CrossRef]
- Redmon, J.; Divvala, S.; Girshick, R.; Farhadi, A. You only look once: Unified, real-time object detection. In Proceedings of the IEEE Conference on Computer Vision and Pattern Recognition, Las Vegas, NE, USA, 27–30 June 2016; pp. 779–788. [Google Scholar]
- Redmon, J.; Farhadi, A. YOLO9000: Better, faster, stronger. In Proceedings of the IEEE Conference on Computer Vision and Pattern Recognition, Honolulu, HI, USA, 21–26 July 2017; pp. 7263–7271. [Google Scholar]
- Farhadi, A.; Redmon, J. Yolov3: An incremental improvement. In Proceedings of the Computer Vision and Pattern Recognition, Salt Lake City, UT, USA, 18–23 June 2018; Springer: Berlin/Heidelberg, Germany, 2018; Volume 1804, pp. 1–6. [Google Scholar]
- Bochkovskiy, A.; Wang, C.Y.; Liao, H.Y.M. Yolov4: Optimal speed and accuracy of object detection. arXiv 2020, arXiv:2004.10934. [Google Scholar]
- Li, C.; Li, L.; Jiang, H.; Weng, K.; Geng, Y.; Li, L.; Ke, Z.; Li, Q.; Cheng, M.; Wei, X.; et al. YOLOv6: A single-stage object detection framework for industrial applications. arXiv 2022, arXiv:2209.02976. [Google Scholar]
- Wang, C.Y.; Bochkovskiy, A.; Liao HY, M. YOLOv7: Trainable bag-of-freebies sets new state-of-the-art for real-time object detectors. In Proceedings of the IEEE/CVF Conference on Computer Vision and Pattern Recognition, Vancouver, BC, Canada, 17–24 June 2023; pp. 7464–7475. [Google Scholar]
- Wang, C.Y.; Yeh, I.H.; Mark Liao, H.Y. Yolov9: Learning what you want to learn using programmable gradient information. In Proceedings of the European Conference on Computer Vision, Milan, Italy, 29 September–4 October 2024; Springer Nature: Cham, Switzerland, 2024; pp. 1–21. [Google Scholar]
- Wang, A.; Chen, H.; Liu, L.; Chen, K.; Lin, Z.; Han, J.; Ding, G. Yolov10: Real-time end-to-end object detection. arXiv 2024, arXiv:2405.14458. [Google Scholar]
- Wu, L.; Hao, H.Y.; Song, Y. A review of metal surface defect detection based on computer vision. Acta Autom. Sin. 2024, 50, 1261–1283. [Google Scholar]
- Zhuang, J.; Chen, W.; Huang, X.; Yan, Y. Band Selection Algorithm Based on Multi-Feature and Affinity Propagation Clustering. Remote Sens. 2025, 17, 193. [Google Scholar] [CrossRef]
- Girshick, R.; Donahue, J.; Darrell, T.; Malik, J. Rich feature hierarchies for accurate object detection and semantic segmentation. In Proceedings of the IEEE Conference on Computer Vision and Pattern Recognition, Columbus, OH, USA, 23–28 June 2014; pp. 580–587. [Google Scholar]
- Girshick, R. Fast r-cnn. In Proceedings of the IEEE International Conference on Computer Vision, Santiago, Chile, 7–13 December 2015; pp. 1440–1448. [Google Scholar]
- Ren, S.; He, K.; Girshick, R.; Sun, J. Faster R-CNN: Towards real-time object detection with region proposal networks. Adv. Neural Inf. Process. Syst. 2015, 28, 1–9. [Google Scholar] [CrossRef]
- Kang, S.; Hu, Z.; Liu, L.; Zhang, K.; Cao, Z. Object Detection YOLO Algorithms and Their Industrial Applications: Overview and Comparative Analysis. Electronics 2025, 14, 1104. [Google Scholar] [CrossRef]
- Luo, Y.; Ling, J.; Wang, J.; Zhang, H.; Chen, F.; Xiao, X.; Lu, N. SFW-YOLO: A lightweight multi-scale dynamic attention network for weld defect detection in steel bridge inspection. Measurement 2025, 253, 117608. [Google Scholar] [CrossRef]
- You, X.; Zhao, X. A insulator defect detection network based on improved YOLOv7 for UAV aerial images. Measurement 2025, 253, 117410. [Google Scholar] [CrossRef]
- Yao, R.Y.; Zheng, S.L.; Shi, Y.X.; Zhang, S.Q.; Zhang, X.F.; Gao, F.L.; Zhang, X. Steel surface defect detection algorithm based on improved YOLOv8n. J. Liaocheng Univ. Nat. Sci. Ed. 2025, 2, 177–189. [Google Scholar]
- Guo, B.; Li, H.; Ding, S.; Xu, L.; Qu, M.; Zhang, D.; Wen, Y.; Huang, C. YOLO-L: A High-Precision Model for Defect Detection in Lattice Structures. Addit. Manuf. Front. 2025, 4, 200205. [Google Scholar] [CrossRef]
- Wang, J.; Xie, X.; Liu, G.; Wu, L. A Lightweight PCB Defect Detection Algorithm Based on Improved YOLOv8-PCB. Symmetry 2025, 17, 309. [Google Scholar] [CrossRef]
- Qi, Y.; He, Y.; Qi, X.; Zhang, Y.; Yang, G. Dynamic snake convolution based on topological geometric constraints for tubular structure segmentation. In Proceedings of the IEEE/CVF International Conference on Computer Vision, Paris, France, 1–6 October 2023; pp. 6070–6079. [Google Scholar]
- Tang, F.; Huang, Q.; Wang, J.; Hou, X.; Su, J.; Liu, J. DuAT: Dual-aggregation transformer network for medical image segmentation. In Proceedings of the Chinese Conference on Pattern Recognition and Computer Vision (PRCV), Xiamen, China, 13–15 October 2023; Springer Nature: Singapore, 2023; pp. 343–356. [Google Scholar]
- Cai, X.; Lai, Q.; Wang, Y.; Wang, W.; Sun, Z.; Yao, Y. Poly kernel inception network for remote sensing detection. In Proceedings of the IEEE/CVF Conference on Computer Vision and Pattern Recognition, Seattle, WA, USA, 16–22 June 2024; pp. 27706–27716. [Google Scholar]
- Li, H.; Li, J.; Wei, H.; Liu, Z.; Zhan, Z.; Ren, Q. Slim-neck by GSConv: A lightweight-design for real-time detector architectures. J. Real-Time Image Process. 2024, 21, 62. [Google Scholar] [CrossRef]
- Zheng, Z.; Wang, P.; Ren, D.; Liu, W.; Ye, R.; Hu, Q.; Zuo, W. Enhancing geometric factors in model learning and inference for object detection and instance segmentation. IEEE Trans. Cybern. 2021, 52, 8574–8586. [Google Scholar] [CrossRef]
- Zhang, H.; Zhang, S. Shape-iou: More accurate metric considering bounding box shape and scale. arXiv 2023, arXiv:2312.17663. [Google Scholar]
- Gao, S.; Ren, W.; Hu, K. Swin Transformer and Mask R-CNN Based Person Detection Model for Firefighting Aid System. In Proceedings of the International Conference of Artificial Intelligence, Medical Engineering, Education, Moscow, Russia, 1–3 October 2021; Springer International Publishing: Cham, Switzerland, 2021; pp. 41–50. [Google Scholar]
- Zhao, Y.; Lv, W.; Xu, S.; Wei, J.; Wang, G.; Dang, Q.; Liu, Y.; Chen, J. Detrs beat yolos on real-time object detection. In Proceedings of the IEEE/CVF Conference on Computer Vision and Pattern Recognition, Seattle, WA, USA, 16–22 June 2024; pp. 16965–16974. [Google Scholar]
- Hou, Q.; Zhou, D.; Feng, J. Coordinate attention for efficient mobile network design. In Proceedings of the IEEE/CVF Conference on Computer Vision and Pattern Recognition, Nashville, TN, USA, 20–25 June 2021; pp. 13713–13722. [Google Scholar]
- Xu, W.; Wan, Y. ELA: Efficient local attention for deep convolutional neural networks. arXiv 2024, arXiv:2403.01123. [Google Scholar]
- Zhang, Y.F.; Ren, W.; Zhang, Z.; Jia, Z.; Wang, L.; Tan, T. Focal and efficient IOU loss for accurate bounding box regression. arXiv 2021, arXiv:2101.08158. [Google Scholar] [CrossRef]
- Gevorgyan, Z. SIoU loss: More powerful learning for bounding box regression. arXiv 2022, arXiv:2205.12740. [Google Scholar]
- Rezatofighi, H.; Tsoi, N.; Gwak, J.Y.; Sadeghian, A.; Reid, I.; Savarese, S. Generalized intersection over union: A metric and a loss for bounding box regression. In Proceedings of the IEEE/CVF Conference on Computer Vision and Pattern Recognition, Long Beach, CA, USA, 15–20 June 2019; pp. 658–666. [Google Scholar]
- Bao, Y.; Song, K.; Liu, J.; Wang, Y.; Yan, Y.; Yu, H.; Li, X. Triplet-graph reasoning network for few-shot metal generic surface defect segmentation. IEEE Trans. Instrum. Meas. 2021, 70, 1–11. [Google Scholar] [CrossRef]
- Ma, X.; Deng, X.; Kuang, H.; Liu, X. YOLOv7-BA: A Metal Surface Defect Detection Model Based On Dynamic Sparse Sampling And Adaptive Spatial Feature Fusion. In Proceedings of the 2024 IEEE 6th Advanced Information Management, Communicates, Electronic and Automation Control Conference (IMCEC), Chongqing, China, 24–26 May 2024; IEEE: Piscataway, NJ, USA, 2024; Volume 6, pp. 292–296. [Google Scholar]
- Zhang, W.; Huang, T.; Xu, J.; Yu, Q.; He, Y.; Lai, S.; Xu, Y. DF-YOLOv7: Steel surface defect detection based on focal module and deformable convolution. Signal Image Video Process. 2025, 19, 1–10. [Google Scholar] [CrossRef]
- Chen, H.; Qiu, J.; Gao, D.; Qian, L.; Li, X. Research on surface defect detection model of steel strip based on MFFA-YOLOv5. IET Image Process. 2024, 18, 2105–2113. [Google Scholar] [CrossRef]
Disclaimer/Publisher’s Note: The statements, opinions and data contained in all publications are solely those of the individual author(s) and contributor(s) and not of MDPI and/or the editor(s). MDPI and/or the editor(s) disclaim responsibility for any injury to people or property resulting from any ideas, methods, instructions or products referred to in the content. |
© 2025 by the authors. Licensee MDPI, Basel, Switzerland. This article is an open access article distributed under the terms and conditions of the Creative Commons Attribution (CC BY) license (https://creativecommons.org/licenses/by/4.0/).