1. Introduction
Most mature oilfields in eastern China have entered high or ultra-high water-cut development stages. Long-term water flooding has significantly altered the properties of reservoir fluids, the pore structure of the formation, and the distribution of remaining oil [
1]. The original reservoir heterogeneity has further intensified, leading to pronounced differences in oil–water flow capacities within the reservoirs. The underground flow field distribution exhibits significant heterogeneity, with dominant flow channels easily developing in local high-permeability zones and strong flow regions, which exacerbates the uneven utilization of crude oil in the reservoir. The problem of inefficient and ineffective water injection circulation is evident, significantly impairing the effectiveness of reservoir development [
2,
3]. Therefore, it is of great guiding significance for improving the recovery rate to effectively identify the distribution of flow fields in ultra-high water-cut reservoirs and take targeted flow field adjustment measures [
4].
To reflect the changing law of underground fluids, Chen (1998) first introduced the concept of flow field into petroleum engineering [
5]. He described the state of fluid flow and proposed that the reservoir flow field not only serves as a storage space for reservoir fluids but also as the medium through which fluids move. Domestic and foreign scholars have carried out a large number of related studies on the identification and description of reservoir flow fields. Liu et al. (2010) proposed the concept of flow field intensity index by using the inter-well distribution factor and swept volume, and carried out the identification and evaluation of reservoir flow field based on the statistical analysis of the concept [
6]. Chen (2011), Ma (2019), and others selected three parameters, namely water flow rate, fluid velocity, and water saturation, and quantitatively describe the reservoir flow field by coupling the analytic hierarchy process and fuzzy comprehensive evaluation method to calculate flow field intensity [
7,
8]. Bai et al. (2017) used pore volume, permeability, water saturation, and water-oil mobility ratio as the four key factors for the formation of the dominant flow field as evaluation factors, and established the discrimination standard of the dominant flow field through fuzzy comprehensive evaluation and streamline numerical simulation technology [
4]. Zhang (2014) proposed to use the surface flux as the only parameter to characterize the flow field intensity and established the flow field intensity classification standard [
9]. Lu et al. (2020) further selected the four parameters of permeability, formation pressure gradient, oil saturation, and surface flux as the main characterization parameters of the reservoir flow field, and established a quantitative characterization method of the reservoir flow field by combining the analytic hierarchy process and fuzzy mathematics theory [
10]. The above flow field evaluation methods mostly use fuzzy comprehensive evaluation methods to evaluate the flow field intensity. This method has a lot of subjective factors and cannot objectively reflect the impact of each evaluation index on the reservoir flow field [
10].
During development, reservoirs with obvious seepage differences should belong to different flow fields, and the same flow field has similar characteristics on water flooding and residual oil distribution [
11]. Streamline numerical simulation is based on streamline theory, the most important features of which are high computational efficiency and flow field identification. Streamlines can more intuitively reflect the instantaneous flow field distribution and reservoir utilization conditions [
11,
12,
13]. In recent years, scholars have conducted extensive research on flow field identification and characterization in high water-cut reservoirs. By extracting spatial trajectories and attribute data from streamlined simulation results, multidimensional quantitative indicator systems for reservoir flow fields have been established. Combined with clustering, machine learning, and dimensionality reduction techniques, these approaches have achieved hierarchical identification and quantitative evaluation of complex reservoir flow fields. Jia and Deng [
14] constructed a streamlined feature database by extracting spatial positions and flow property parameters from streamlined simulation results. Using artificial intelligence methods based on streamlined clustering, they effectively identified and classified flow field types in high water-cut reservoirs, overcoming the subjectivity and boundary ambiguity of traditional methods. Building upon this, Guo et al. [
15] proposed a flow field optimization method based on artificial intelligence algorithms. By analyzing the hierarchical features of streamlined fields, they dynamically optimized and adjusted displacement effect partitions within reservoirs. Zhao et al. [
16] developed a vector flow field characterization and reconstruction method based on streamline simulation. By considering the complex seepage characteristics of high water-cut reservoirs and analyzing streamlined trajectories and attributes, they achieved dynamic description and visualized displacement processes, effectively revealing dominant flow channels and residual oil distribution patterns during late-stage water flooding. Li et al. [
17], using unsupervised machine learning techniques, integrated multiple parameters such as streamline density, flow velocity, and pressure fields to objectively classify and hierarchically evaluate complex reservoir flow field types. Liu et al. [
18] combined principal component analysis (PCA) with clustering algorithms to perform dimensionality reduction and feature extraction on high-dimensional, multi-variable flow field data, improving the computational efficiency for large-scale, high-dimensional reservoir flow field processing. Through clustering analysis, they completed flow field partitioning and identification, significantly enhancing the adaptability and computational efficiency of complex reservoir flow field characterization. The flow field evaluation method based on clustering algorithms comprehensively considers the dynamic percolation characteristics and the space physical characteristics of the reservoir, dividing the flow field with obvious differences in oil and water seepage well [
11]. However, the above methods cannot fully reflect the underground flow field distribution of the actual reservoir, especially for a region with potential flow space but no fluid flow at a certain moment, as they only use the extracted characteristic parameters to streamline clusters. In addition, these methods cannot finely distinguish different types of flow fields, because they treat each streamline as a single sample point. Regions with obviously different flow capacities in the same streamline will be classified as one type. How to comprehensively and accurately distinguish the flow field of high water-cut reservoirs is still a challenging problem.
To address the above issues, this study fully considers the complexity of reservoir flow fields during the high water-cut stage, which are jointly controlled by static geological characteristics and dynamic seepage patterns. Using actual reservoir geological model grids as characterization units, a comprehensive set of multidimensional feature parameters is systematically extracted for each spatial grid cell, covering aspects such as the material basis of the flow field, displacement efficiency, and water-flooding status. A grid-scale flow field characterization index system is then established to comprehensively reflect the current development status and flow field characteristics of the reservoir. On this basis, an unsupervised clustering algorithm is introduced to develop a flow field characterization and evaluation method suitable for reservoirs in the high water-cut stage. Unlike traditional clustering approaches based on streamlined clusters, this method treats all geological model grid cells as independent samples and establishes a data-driven flow field partitioning approach based on multidimensional feature data. This enables effective identification of potential flow pathways and regions with differences in seepage capacity, overcomes misjudgments caused by streamlined cross-regional flow in conventional methods, and significantly improves the accuracy and rationality of reservoir flow field partitioning.
2. Construction of Flow Field Characterization Indices
The flow field of a reservoir is a complex system in which multiple factors influence and interact with each other. During the water-flooding development, the flow field will undergo uneven changes. It is difficult to comprehensively characterize and evaluate the flow field of an ultra-high water-cut reservoir using a single attribute factor [
7]. The flow field characteristics of ultra-high water-cut reservoir are not only related to the static heterogeneity of the reservoir, but also to the dynamic heterogeneity of reservoir development [
10]. Therefore, a comprehensive and quantitative characterization of the flow field is performed by taking into full consideration the static and dynamic flow field factors of an ultra-high water-cut reservoir, combined with the characteristics of severe reservoir heterogeneity, and constructing an evaluation index system from three dimensions: flow field material basis, displacement degree, and water-flooding status.
2.1. Residual Oil Advantage Potential Abundance
Affected by multiple geological and development factors, the underground seepage field of the ultra-high water-cut reservoir has become more uneven, and the reservoir heterogeneity and the dispersion of remaining oil have become more prominent. The uneven distribution of the flow field is the main reason for the dispersion of remaining oil and low injection-production efficiency. Saturation used to be the only indicator for flow field characterization, which can only reflect the flow field distribution or water-flooding state in the reservoir, but cannot quantify its potential.
Taking full account of the oil-water distribution and flow characteristics of the reservoir in the ultra-high water-cut period, the movable oil advantage potential abundance is introduced as one of the flow field potential evaluation indicators. The calculation formula is as follows:
where, VOI is the movable oil advantage potential abundance, mPa·s;
μw is the formation water viscosity, mPa·s;
μo is the formation oil viscosity, mPa·s;
Kro is the oil relative permeability;
Krw is the water relative permeability;
So is the oil saturation;
Sor is the residual oil saturation;
φ is the porosity;
h is the reservoir thickness, m;
NTG is the net-to-gross ratio.
After long-term water injection and flushing, the reservoir physical properties, pore structure, fluid properties, and seepage characteristics of the ultra-high water-cut reservoir have undergone significant changes. The static and dynamic heterogeneity of the reservoir has further increased, resulting in a sharp increase in the difference in capacity in oil-water diversion [
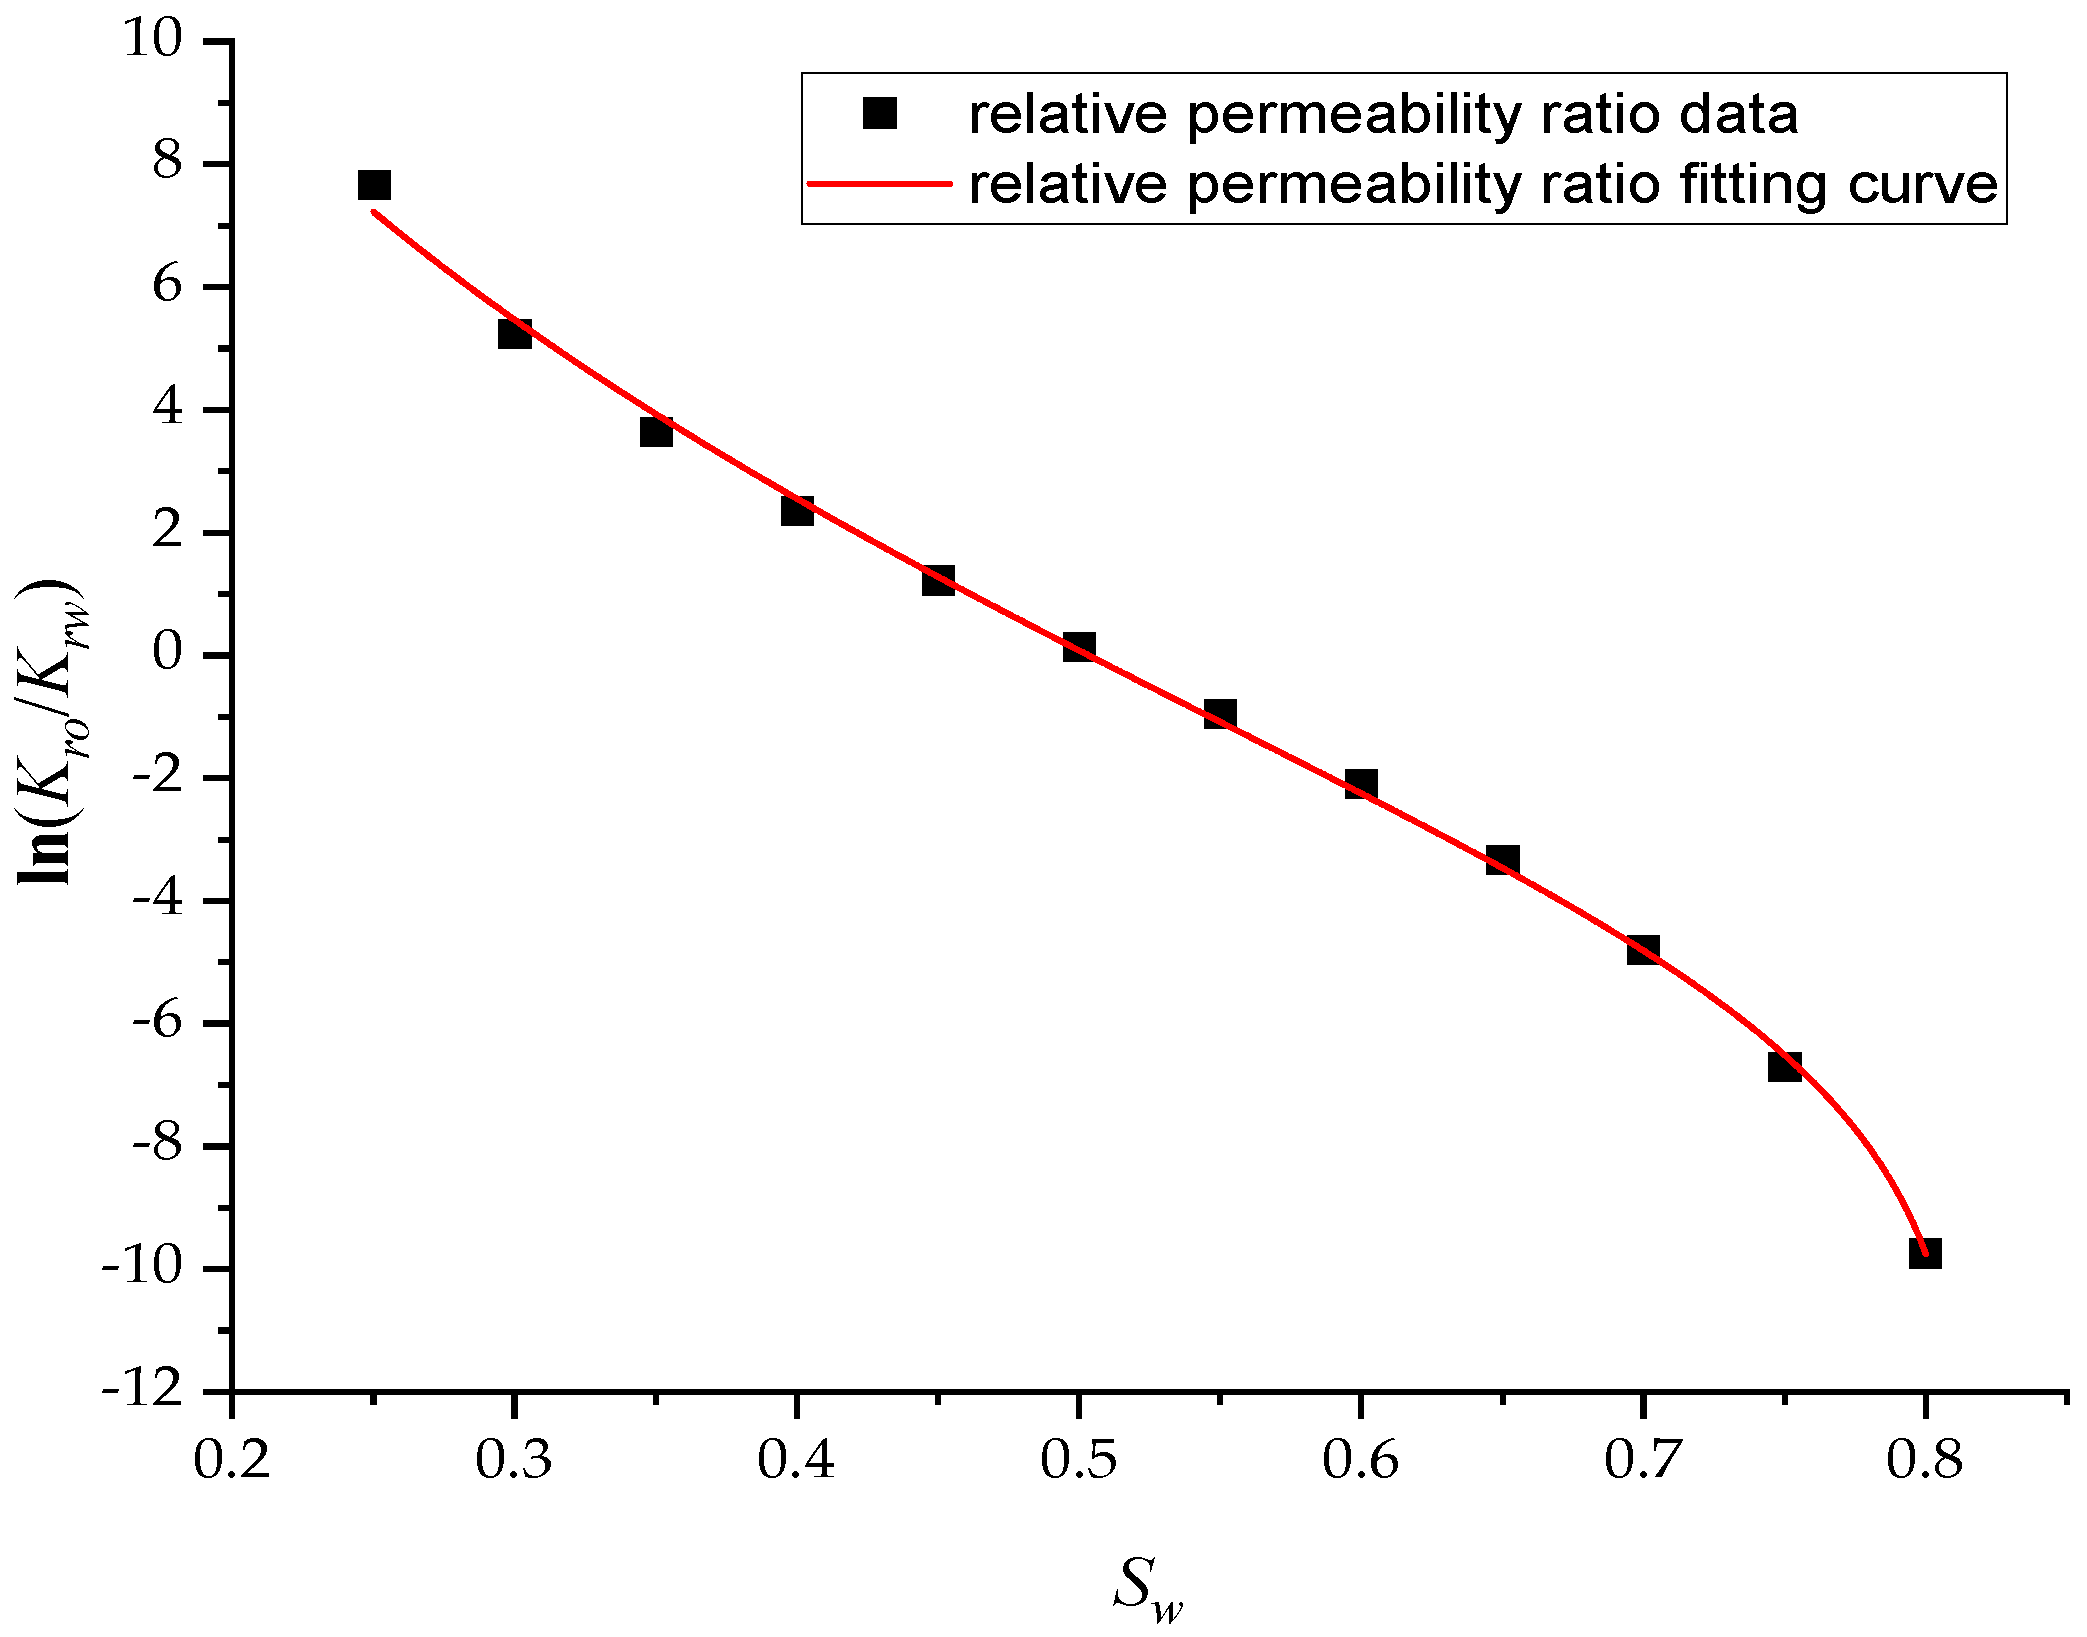
19]. A different water-flooding degree means a huge difference in oil-water diversion capacity. The semi-logarithmic relationship curve between the oil-water relative permeability ratio and water saturation no longer shows a completely linear relationship, but shows a downward bend [
20,
21]. In order to characterize the downward bend phenomenon of the oil-water relative permeability ratio curve in the ultra-high water-cut period, based on previous research [
22], a new relative permeability curve characterization relationship is proposed:
where,
Sw is water saturation;
a,
b, and
c are fitting parameters, and
c = 1 −
Sor when the residual oil saturation
Sor is known.
Four-phase permeability curve data of a block in the literature [
21,
23] were selected and fitted using the new characterization relationship (2). As shown in
Figure 1, the four-phase permeability curves have an obvious downward bending. The new phase permeability characterization relationship (2) achieves high-precision fitting of the four-phase permeability curve data throughout the process, and the correlation coefficients R
2 reach 0.9989, 0.9997, 0.9983, and 0.9982, respectively, which verifies the accuracy of the new phase permeability characterization formula.
Substituting the new phase permeability curve characterization relationship (2) into Equation (1), we can get the following:
The movable oil advantage potential abundance can not only characterize the size of the movable remaining oil reserves underground, but also reflect the different oil-water diversion capacities in ultra-high water-cut reservoirs. The higher the movable oil advantage potential abundance index value, the greater the potential for reservoir flow field adjustment.
2.2. Water-Flooding Ratio
The water-flooding ratio is an important cumulative indicator reflecting the evolution of the flow field. It is defined as the volume ratio of accumulating injected water to unit pore volume. It is a concentrated reflection of the water drive intensity and the flushing volume of the injected water in the flow field [
7]. After entering the high water-cut state, as the water-flooding ratio increases, the reservoir properties such as porosity, permeability, and mud content change, resulting in changes in the flow field [
24]. Therefore, the water-flooding ratio is selected as an important indicator for flow field evaluation. The expression is
where
Nw is the water-flooding ratio;
Wi is accumulated water injection, m
3;
Vφis the pore volume flowing through the cell, m
3;
Vi is the volume flowing through the cell, m
3.
Assuming that the flow of oil-water phases in the process of water-flooding oil complies with Darcy’s law, and the effects of gravity and capillary force are not considered. The oil and water phase flow equation can be obtained:
where,
qo is the oil flow rate, m
3/d;
qw is the water flow rate, m
3/d.
Substituting Equation (1) into the above equation, we can get
Integrating Equation (6) with respect to production time, we can get the cumulative water production of the stage:
where,
Wp is the cumulative water production of the stage, m
3.
The cumulative oil production of the stage can be expressed as
where,
Np is the cumulative oil production of the stage, m
3;
Swi is the initial water saturation;
N is the reserves of crude oil, m
3.
Taking the derivative of both ends of Formula (8) with respect to time
t, the relationship between oil phase flow rate and cumulative oil production of the stage is:
Substituting Formula (9) into Formula (6), we can get
Further integration and sorting can get the relationship between cumulative water production of the stage:
According to the material balance principle, when the injection-production balance is maintained, the cumulative water injection volume of a stage is equal to the sum of the cumulative oil production and the cumulative water production of the stage. Therefore, the cumulative water injection volume of a stage can be expressed as
where,
Wi is the cumulative water injection volume of the stage, m
3;
Bo is the oil formation volume factor.
Substituting Equations (8) and (12) into Equation (13), we can get
Substituting Equation (14) into Equation (4), we can get the following expression for calculating the water flow ratio:
According to Equation (15), the water flow ratio is closely related to water saturation, and water saturation reflects the water-flooding effect. When the initial water saturation is constant, the water-flooding intensity is high in the area with high flow field intensity. The larger the water flow ratio, the smaller the residual oil saturation.
2.3. Water Influx
Water influx can be used to assess the relative water-oil flow capacity and sweep status in the reservoir. By analyzing the changes in water influx, the dynamic evolution characteristics of the reservoir flow field distribution can be captured. Without considering the effects of capillary force and gravity, the calculation formula for water influx (i.e., water content) is as follows:
where,
fw is the water influx.
Substituting Equation (2) into Equation (16), we can get
The increasing water influx represents the improvement of the flow capacity of injected water. The water phase occupies an increasingly higher proportion in the flow process and gradually becomes the dominant mobile phase in the underground flow field, further indicating the degree of water washing of the reservoir and the formation of a dominant flow field.
3. Establishment of Flow Field Evaluation Method
Taking the actual reservoir geological model grid as the characterization unit, the characteristic parameters of each grid are extracted according to the reservoir numerical simulation results. Including areas with potential flow space but no fluid flow, three evaluation indicators are calculated to comprehensively characterize the reservoir flow field distribution, such as the remaining oil potential abundance, water flow ratio, and water influx. The flow field characteristics of any spatial grid unit can be portrayed by these three indicators. The data need to be normalized to eliminate the dimensional and numerical range difference, which can influence the evaluation results. The remaining oil potential abundance is a positive indicator, while the water flow ratio and water influx are negative indicators. The normalization formula is as follows:
where,
is the normalized residual oil advantage potential abundance;
is the normalized water-flooding ratio;
is the normalized water influx;
VOImax and
VOImin are the maximum and minimum values of residual oil advantage potential abundance, respectively;
Nwmax and
Nwmin are the maximum and minimum values of water-flooding ratio, respectively;
fwmax and
fwmin are the maximum and minimum values of water influx, respectively.
For the actual reservoir model with n grid units, there is a sample set D formed by n data samples of the flow field. Every sample is composed of an attribute set {, , } of normalized three evaluation indicators with the dimension of three.
Cluster analysis is a typical unsupervised learning technology that is used to divide data samples of unknown categories into several clusters according to the data’s internal relationships. It has been successfully applied to data clustering problems in different fields [
24]. Based on the flow field distribution represented by grid units, the clustering algorithm can identify different flow field areas with different characteristics, and classify them into different types. The flow field evaluation method for ultra-high water-cut reservoirs is established, providing effective guidance for the formulation of subsequent flow field adjustment measures. As the most popular clustering algorithm, the K-Means clustering algorithm has an efficient clustering effect for large data sets. Compared with other clustering algorithms, it has been widely used due to its simple principle, good clustering effect, and high clustering efficiency [
25,
26].
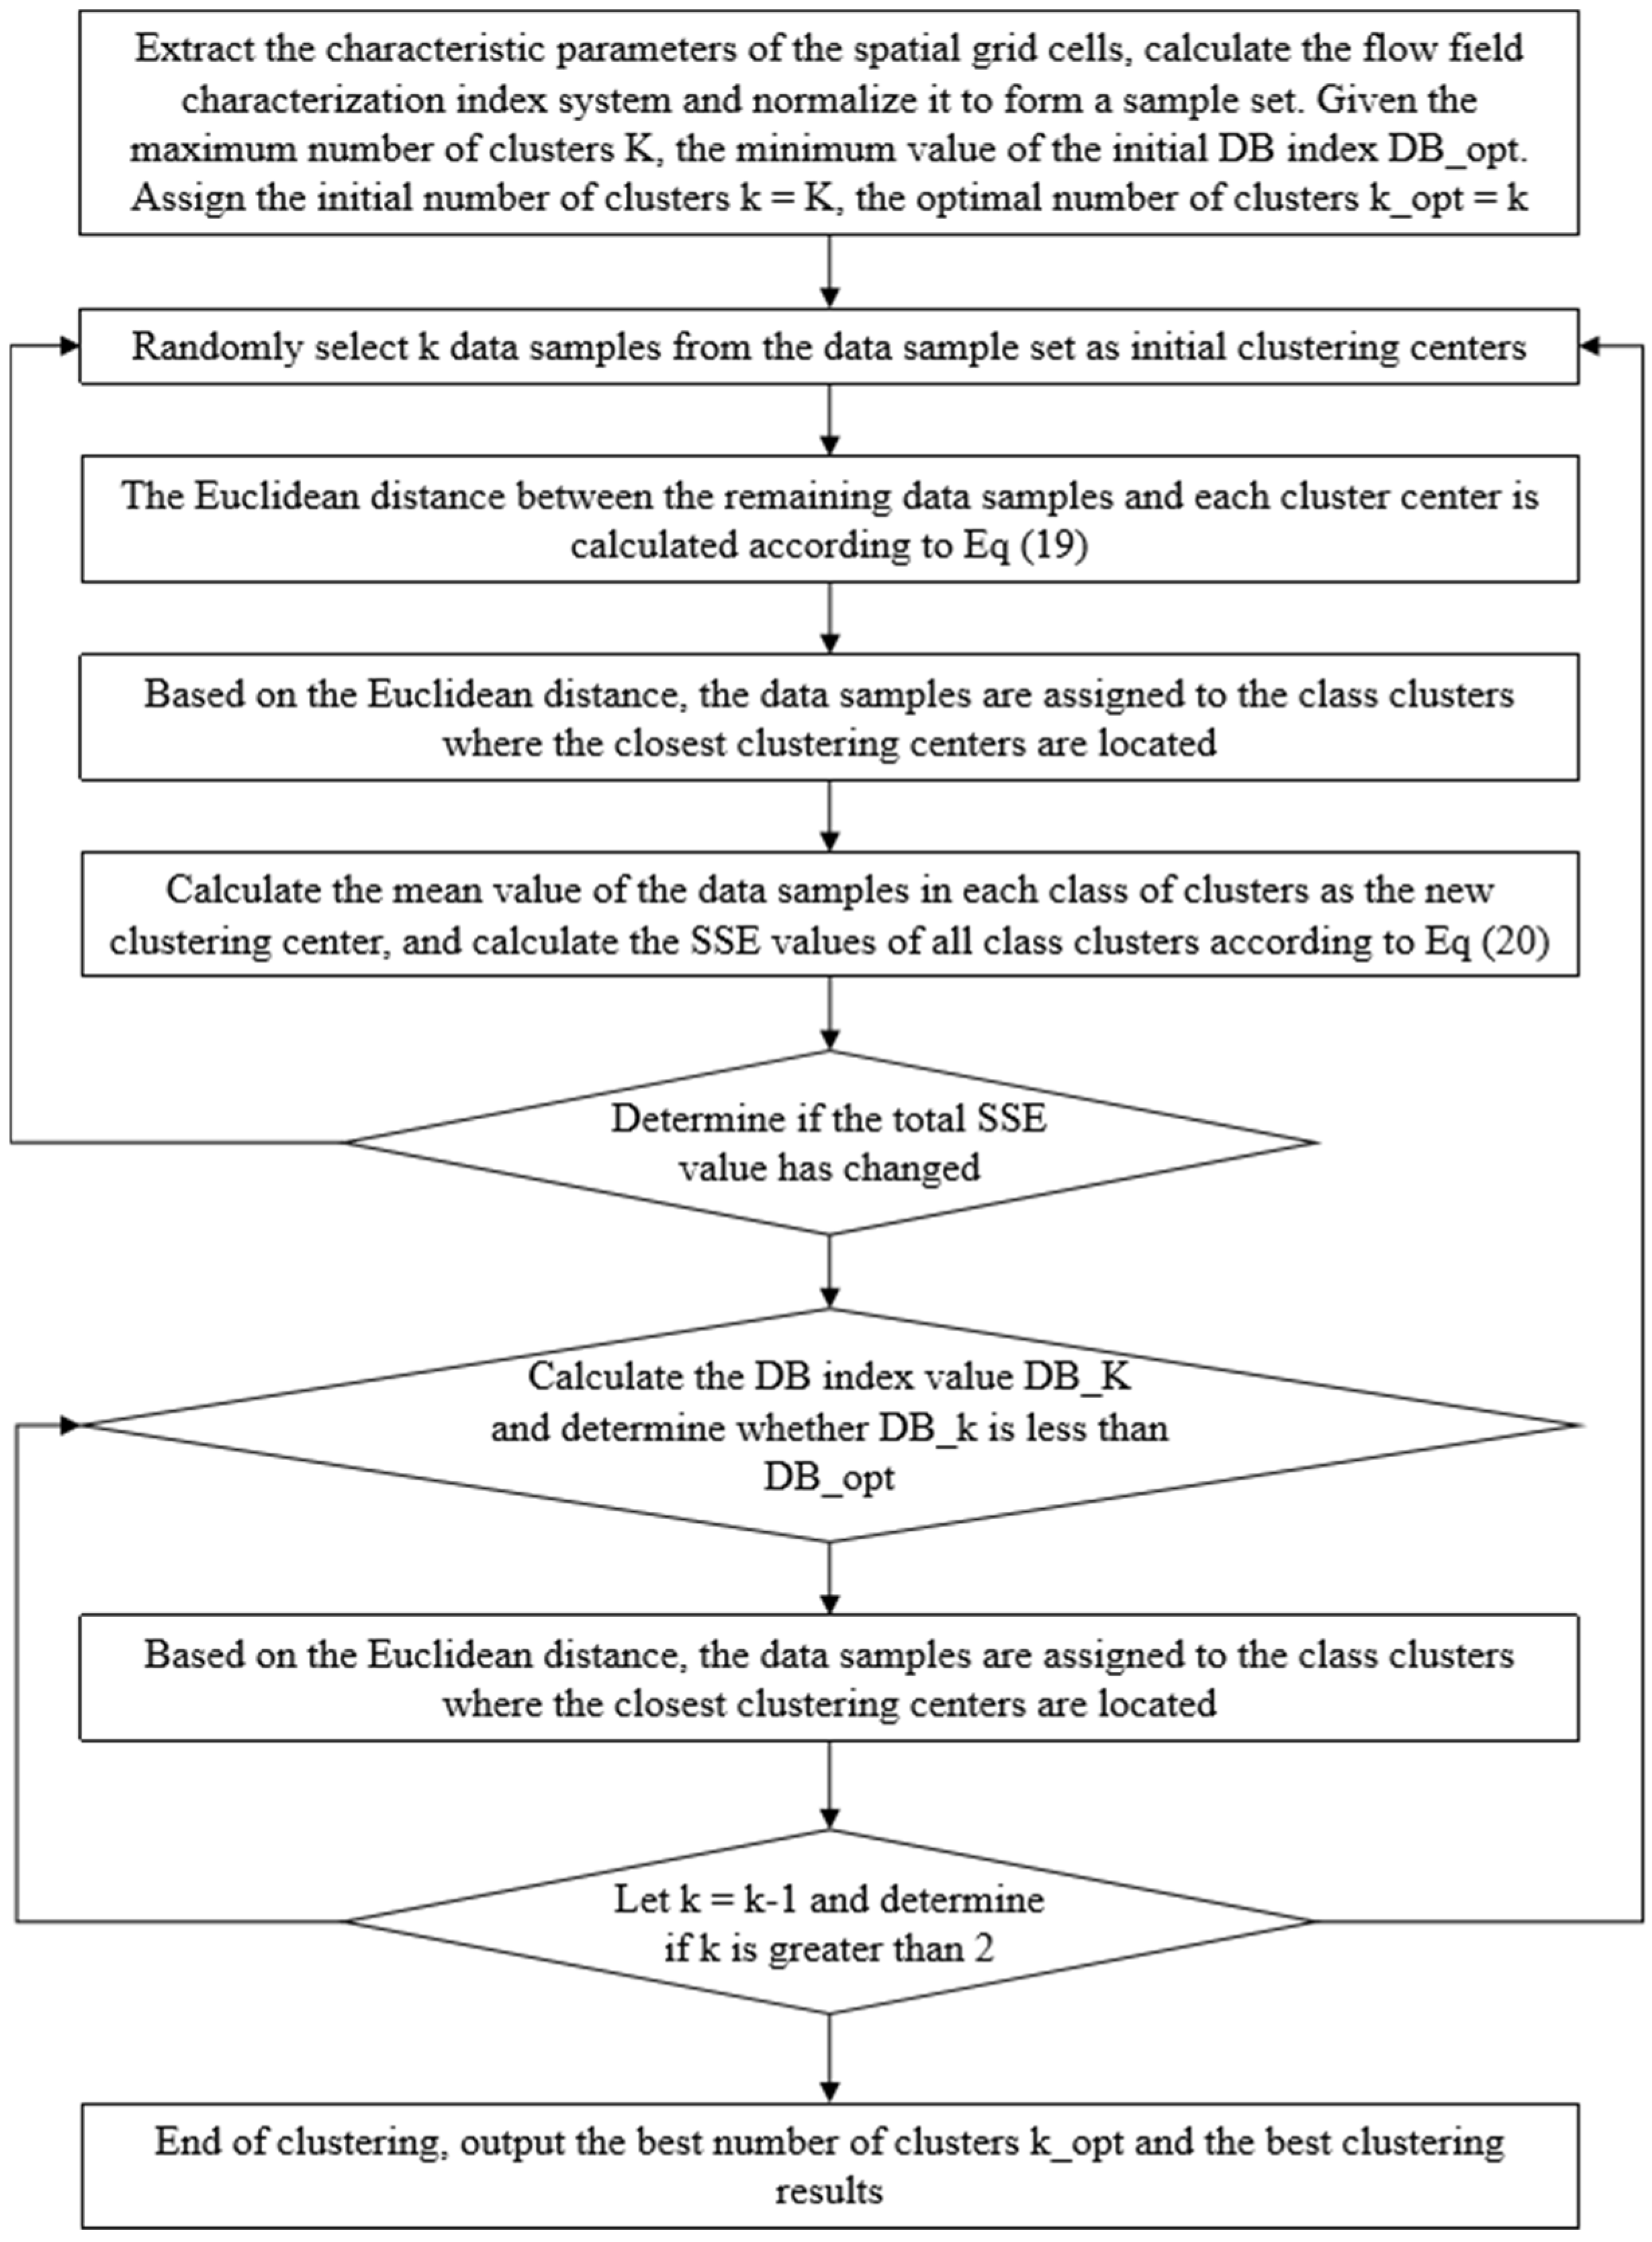
Generally, the K-Means clustering algorithm selects Euclidean distance to measure the similarity between data samples, and uses the sum of squared error (SSE) as the objective function [
27]. By minimizing the objective function, data samples are divided into k clusters according to their distance from the cluster center [
26]. The core idea [
25] is: (1) specify the initial number of clusters
k; (2) and randomly select
k data samples from the data sample set as the initial cluster centers and calculate the Euclidean distance between other data samples and each cluster center; (3) find the cluster center closest to the target data sample, and assign the data sample to the cluster corresponding to the cluster center; (4) calculate the average value of the data samples in each cluster as the new cluster center and perform the next iteration; and (5) the clustering ends when the clusters no longer change or the objective function converges.
The Euclidean distance calculation formula between the data sample and the cluster center is
where,
x is the data sample in the data sample set D,
;
ci is the
i-th cluster center, 1 ≤
i ≤
k;
xj and
cij are the
j-th attribute values of the data sample
x and the cluster center
ci, respectively.
SEE of an entire data set can be calculated by formulation:
where,
Ciis the
i-th data sample cluster;
k is the number of clusters.
The flowchart of the flow field evaluation method for high water-cut reservoirs based on the K-means clustering algorithm is shown in
Figure 2.
The number
k of clusters is used to be determined in advance. However, it is difficult to determine the
k value due to excessive data volume and lack of experience in practical applications. If the
k value is too small, the data samples within the same cluster will be very different, making it difficult to capture the effective feature information hidden in the cluster data samples; if the
k value is too large, the data samples between different clusters will not have much differences, increasing the difficulty of data analysis. Therefore, many scholars have proposed clustering effectiveness evaluation functions as a criterion for determining the optimal number of clusters [
14,
28]. This paper selects the Davies–Bouldin (DB) index [
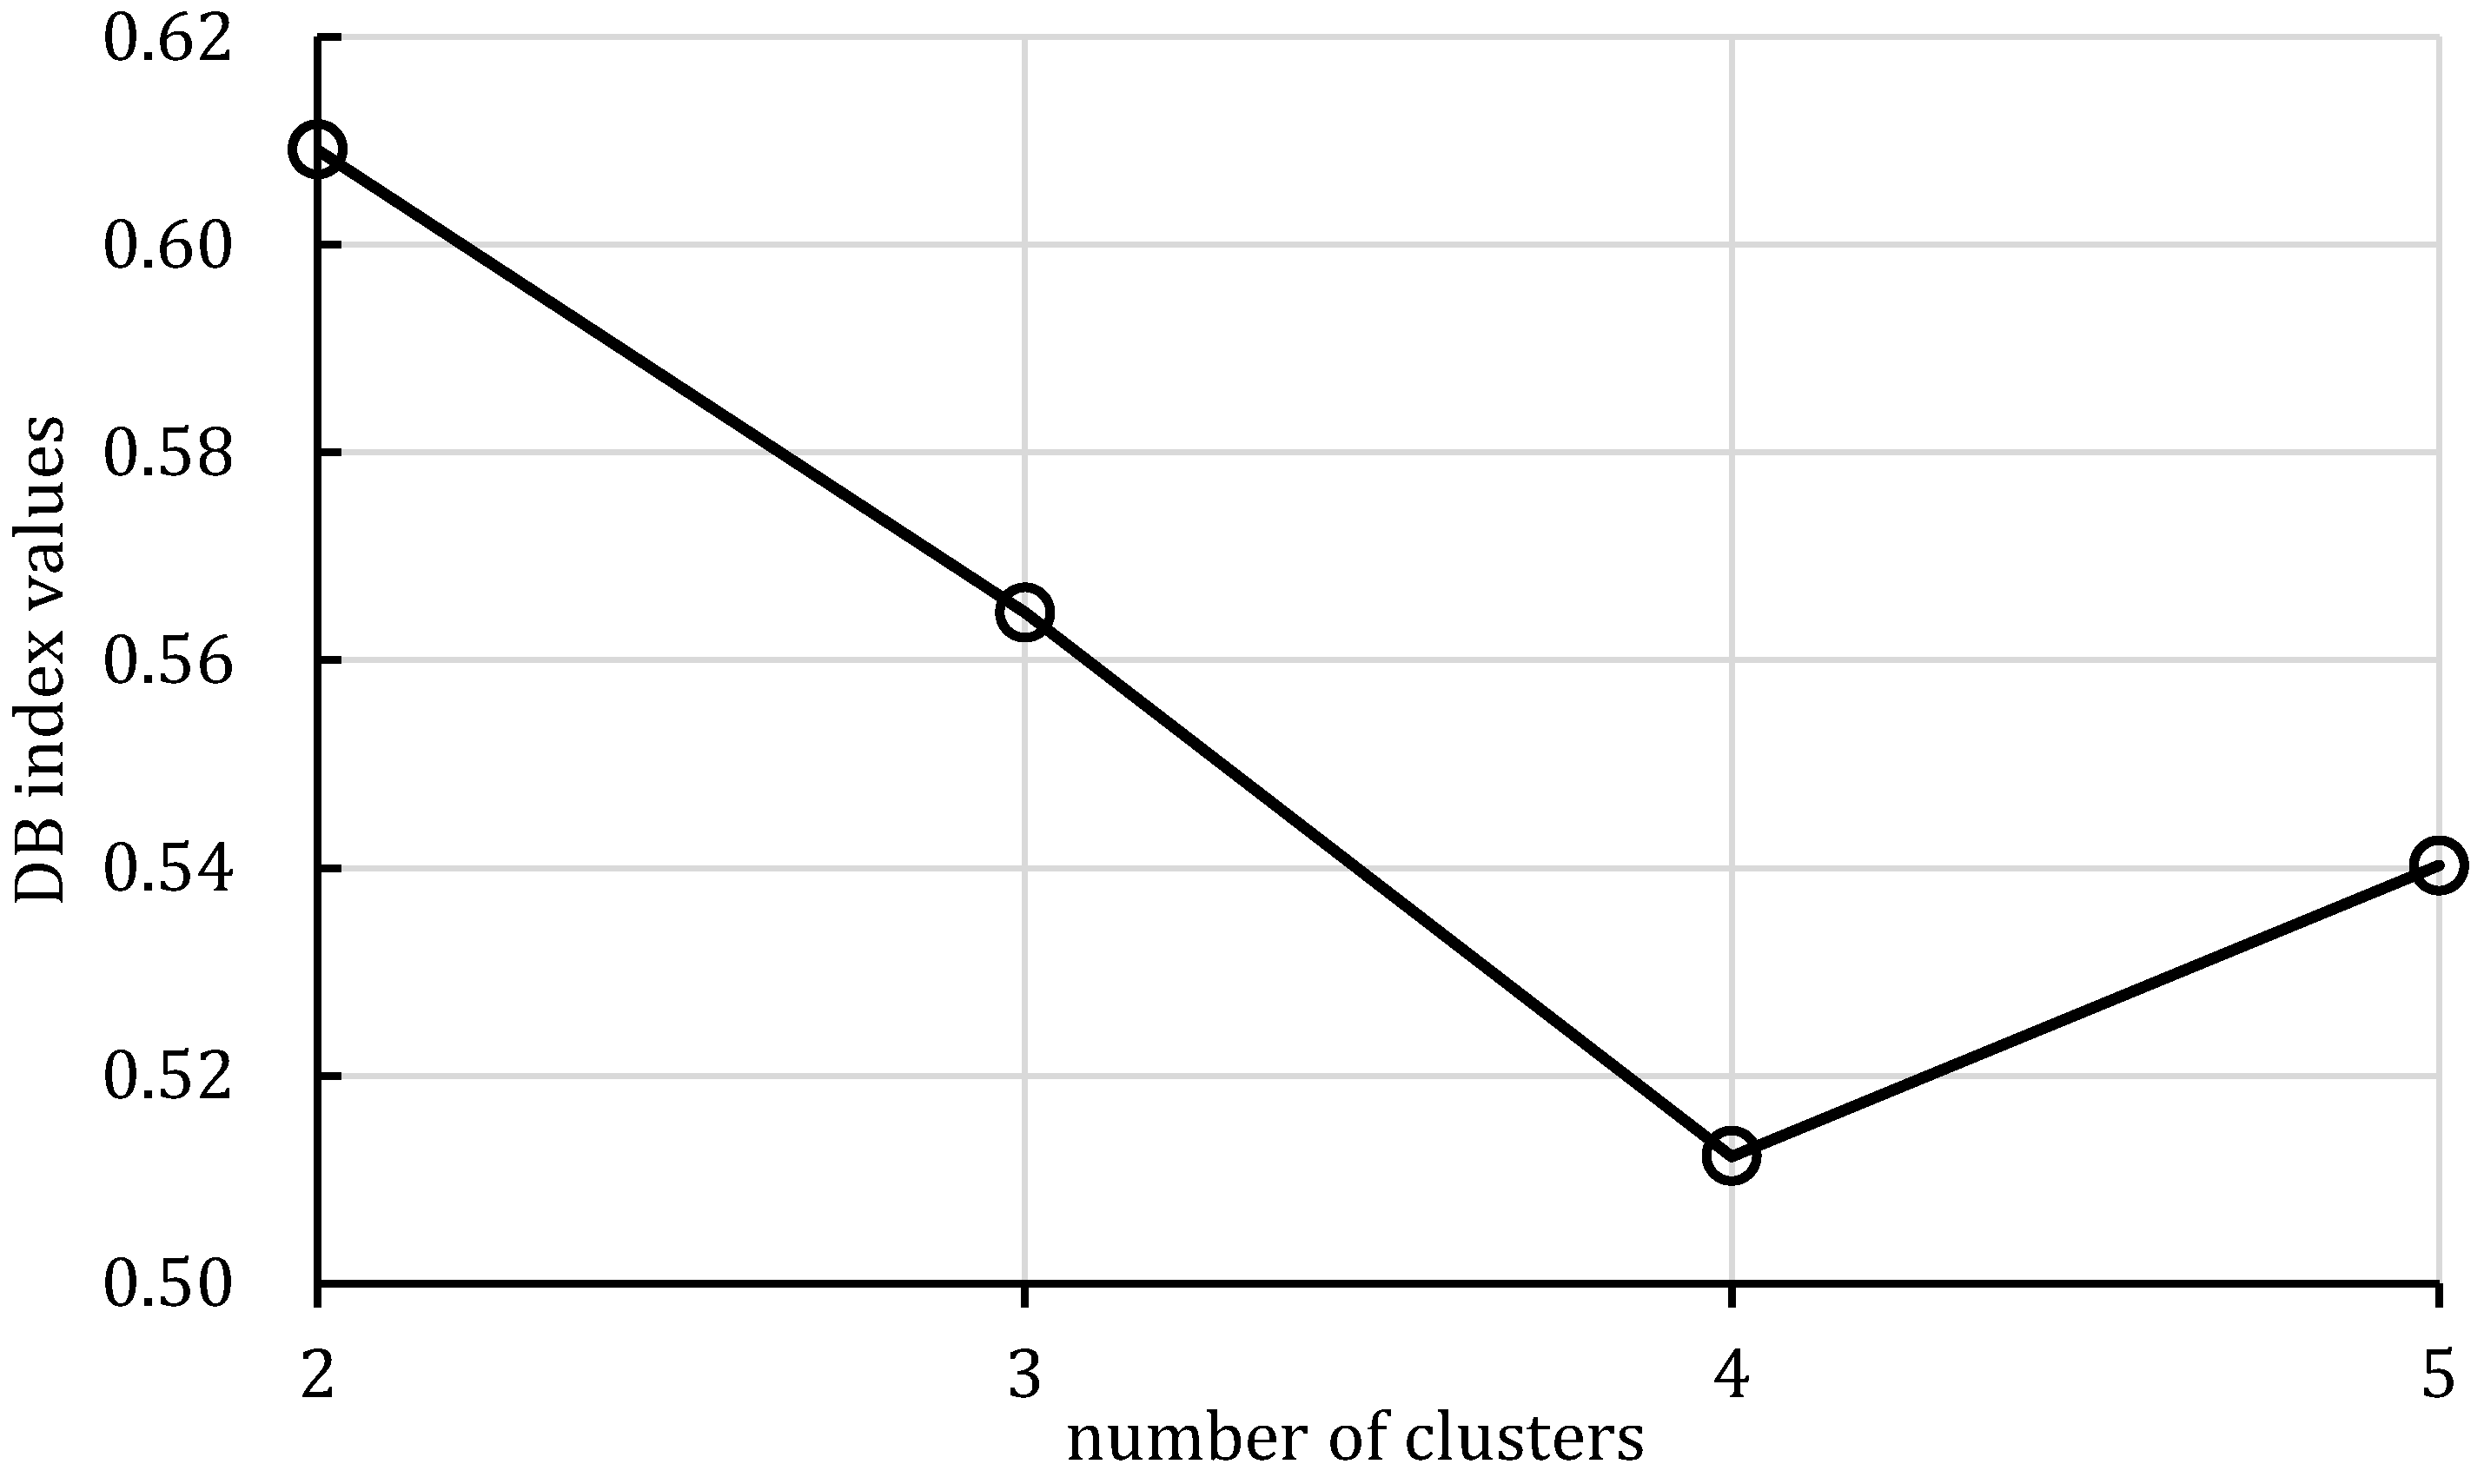
29] as the clustering effectiveness evaluation function. The
k value corresponding to the minimum DB index is automatically searched as the optimal number of clusters within the possible range. The DB index is an indicator that evaluates clustering quality by the average distance ratio of clusters and the density within the cluster. It comprehensively considers the similarities inside each cluster and the differences among clusters. The smaller the value is, the better the clustering result reaches. Compared with the Silhouette coefficient and Calinski–Harabasz index [
28], the Davies–Bouldin (DB) index exhibits lower sensitivity to outliers and isolated points under high-dimensional and multi-cluster conditions, effectively reducing the interference of extreme samples on clustering evaluation results and ensuring the stability and reliability of clustering outcomes. In particular, when dealing with large-scale, high-dimensional, strongly heterogeneous, and complex-flow reservoir grid flow field feature datasets, the DB index can objectively and accurately measure the compactness and separation of clustering partitions. It provides a robust criterion for assessing the objectivity, rationality, and scientific validity of flow field partitioning results in highly heterogeneous reservoirs during the high water-cut stage.
4. Case Study
The flow field evaluation method was used for testing and analysis on the Egg model [
30,
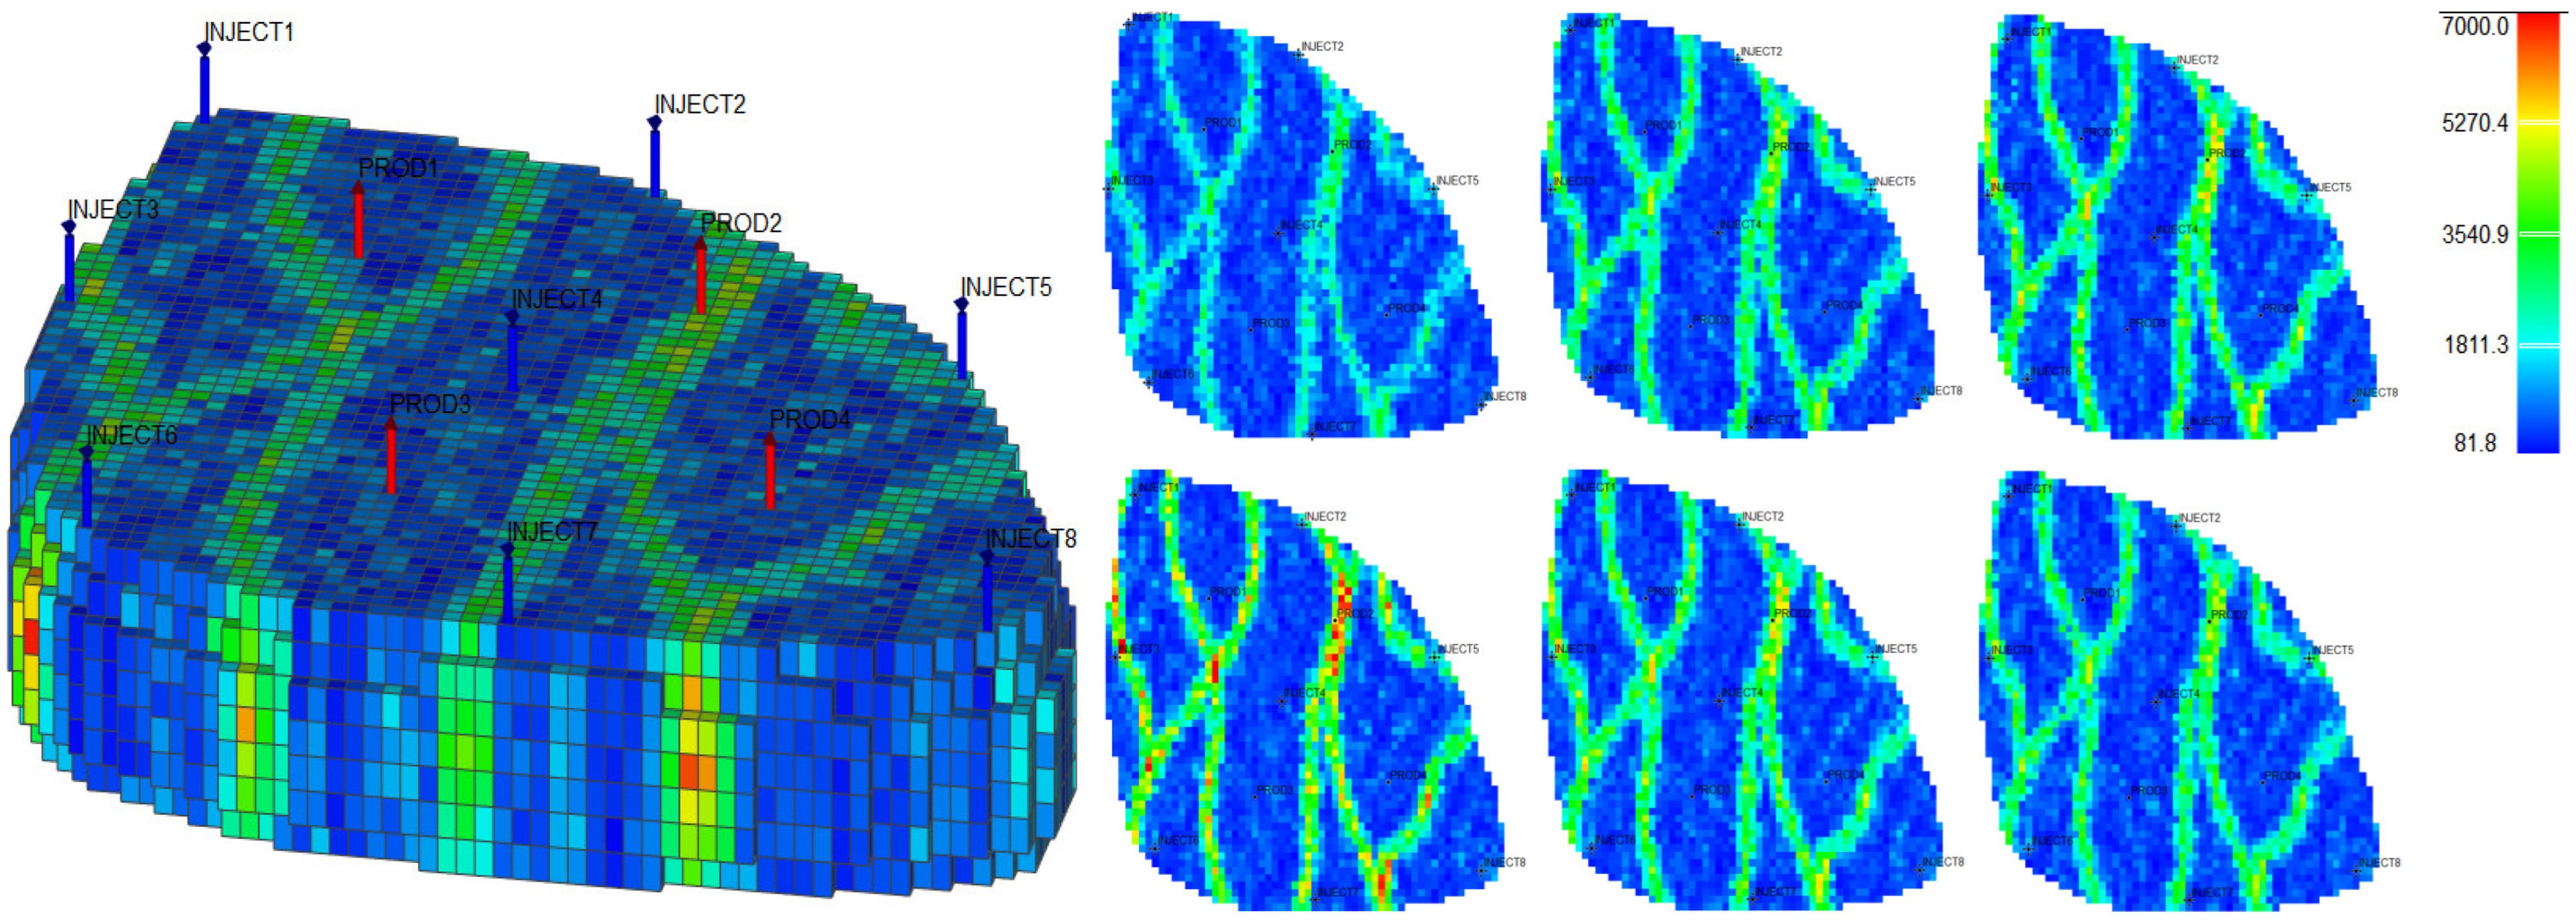
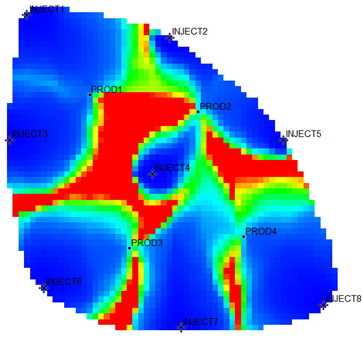
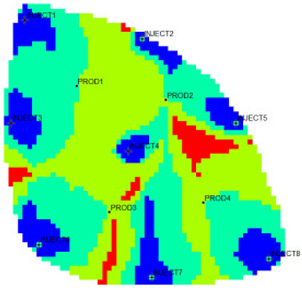
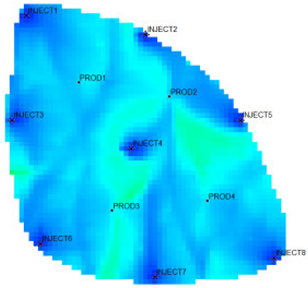
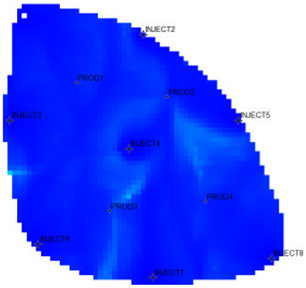
31] as the actual case. The Egg model is a small heterogeneous synthetic reservoir model. The model is an oil-water two-phase model without associated gas or dissolved gas. The grid dimension of the Egg model is 60 × 60 × 7, with a total of 25,200 grids. The edge of the model is a dead grid, and there is a total of 18,553 valid grids. The permeability and well-location distribution of the Egg model are shown in
Figure 3. The high-permeability area is distributed in a river channel shape. The relative permeability ratio curve of the Egg model is shown in
Figure 4. The curve has an obvious downward bend. The curve fitting correlation coefficient R
2 reaches 0.9983, using the new relative permeability characterization relationship (2), which achieves high-precision fitting of the entire process. The fitting coefficients are a = −3.61, b = −8.6366, and c = 0.8177. The Egg model has a total of four production wells and eight water injection wells. After 10 years of simulated water injection development, the recovery rate of the model reached 58.1%, and the comprehensive water content reached 97.5%, entering the ultra-high water-cut state.
4.1. Result
The 18,553 effective grids of the Egg model were used as characterization units, and the characteristic parameters of each grid were extracted. After 10 years of production and injection. Three flow field characterization indices, the residual oil advantage potential abundance, water-flooding ratio, and water influx, were calculated according to the numerical simulation results. To ensure that the clustering results possess good representativeness and interpretability, and to avoid excessive clustering leading to overly fine partitioning of flow field categories, which would weaken the practical value of flow field analysis, the number of clusters in this study is limited to no more than five. This constraint keeps the number of flow field partitions within a reasonable range, thereby facilitating subsequent flow field feature extraction and dominant zone identification. The relationship between the DB index values and the number of clusters is presented in
Figure 5.
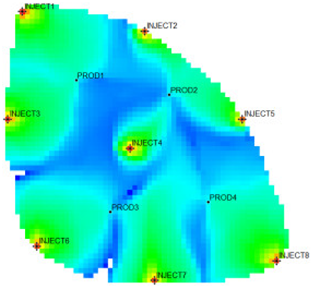
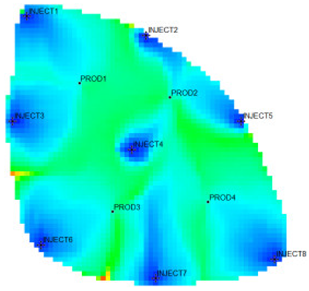
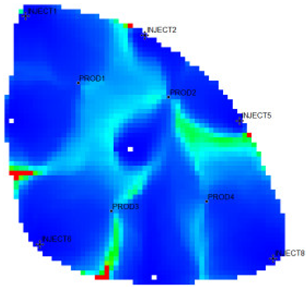
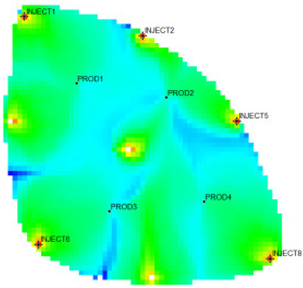
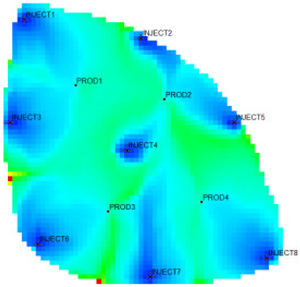
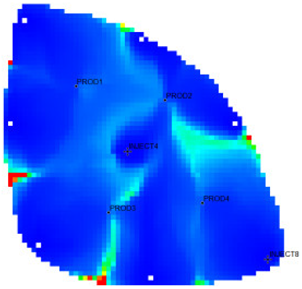
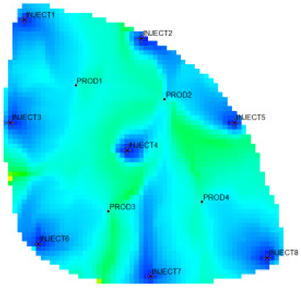
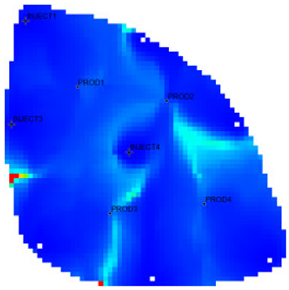
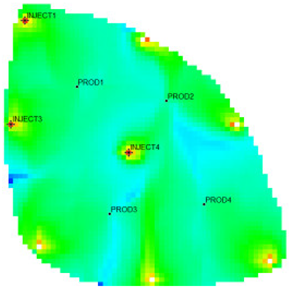
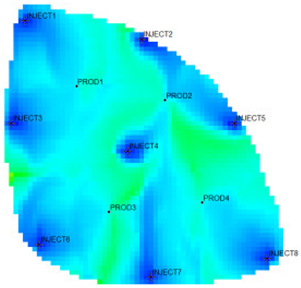
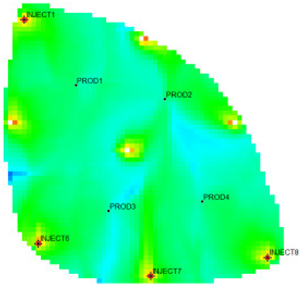
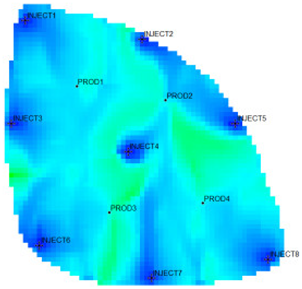
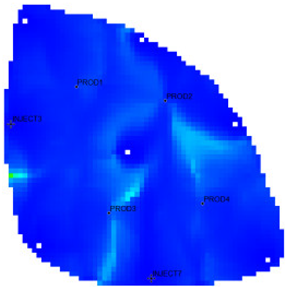
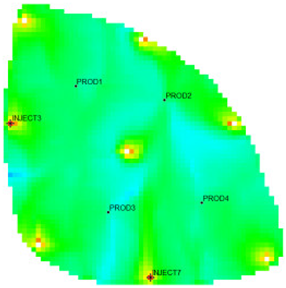
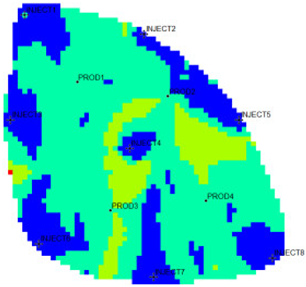
Table 1 shows the flow field characterization and classification evaluation result of the ultra-high water-cut Egg model, using the novel flow field evaluation method. After entering the ultra-high water-cut stage, from the distribution of oil saturation and the abundance of remaining oil advantage potential shown in
Table 1, the remaining oil retained underground still has great development potential. There are still some unaffected areas inside the oil layer, especially the top layer with richer remaining oil and higher potential abundance, which is also the material basis for future flow field adjustment. The distribution of the water-flooding ratio shows that the water-flooding ratio is extremely large near the water injection well, as the driving intensity is large, while it is small when far away from the water injection well with a small water-flooding ratio. The displacement within and between layers is extremely unbalanced, and the water-flooding development can be affected by various geological and development factors. A single factor can only qualitatively analyze the displacement status and roughly judge the local potential area. It is hard to accurately identify and finely distinguish flow field areas with different characteristics through a single factor.
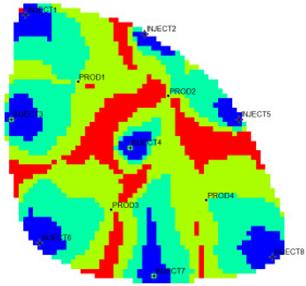
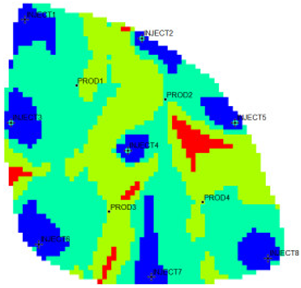
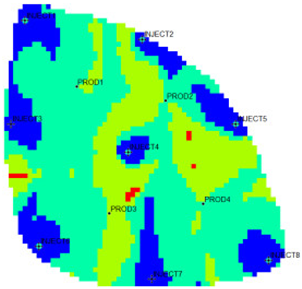
The new flow field evaluation method automatically identifies the flow field of the ultra-high water-cut Egg model into four types.
Table 2 shows the four types of flow field clustering by cell attribute with its proportions. The flow field classified results of the Egg model simulated water injection development for 10 years show that the evaluation indices of different flow field types, like the regional remaining oil advantage potential abundance, water flow multiples, and water flow, have obvious differences. The new method captures the attribute characteristics of different flow field types accurately, and distinguishes the flow fields effectively, which is conducive to identifying flow field areas with development potential. According to the attribute characteristics with development potential, the flow field is divided into four types: inefficient field (type I), effective field (type II), dominant field (type III), and extreme field (type IV). Based on this, further analysis of different categories of flow fields was conducted using symmetry theory. Under ideal conditions of balanced displacement, the water-flooding flow field between injection and production wells exhibits a radially symmetrical distribution. However, under certain extreme heterogeneity conditions, effective displacement zones or inefficient displacement zones may disappear. Taking the flow field classification results of Sub-layer 1 in
Table 1 as an example, the different types of flow field zones between injection well INJECT4 and production well PROD2 show a concentric ring-like symmetrical distribution, which, from the core to the periphery, are arranged sequentially as extreme displacement zone, dominant displacement zone, effective displacement zone, and inefficient displacement zone, indicating an overall balanced displacement process. Between injection well INJECT1 and production well PROD1, the inefficient displacement zone disappears, while the other types of flow field zones display an approximately axisymmetric distribution, with a relatively balanced displacement. In contrast, under certain extreme heterogeneity conditions, such as between injection well INJECT7 and production well PROD3, the distribution of different types of flow field zones significantly deviates from the principal axis of the injection-production well pair. This is manifested as an abnormal deviation in the distribution structure of displacement capability zones or an attenuation of symmetry. Such zoning characteristics are closely related to reservoir heterogeneity features and the injection-production configuration, and the analysis results can provide theoretical support and technical guidance for water-flooding development adjustment and remaining oil potential tapping.
From the identification and classification results of different types of flow fields in
Table 1 and
Table 2, the flow field distribution of the reservoir is extremely complex after entering the ultra-high water-cut state, with the dominant field and the extreme field accounting for 59%, the effective field accounting for 31%, and the extreme field accounting for 10%. The extreme field is mainly developed in the area near the injection wells and the local high-permeability zone between wells. For instance, the extreme fields existing between INJECT2, INJECT5, and production Wells PROD2, are formed due to long-term water flooding in high-permeability zones. The residual oil saturation in this type of flow field is extremely low, the mean water influx reaches 77.1%, the mean residual oil advantage potential abundance is only 2.09, and the development adjustment potential is low. Compared with the dominant field, the effective field has a lower regional average permeability, leading to a lower mean water-flooding ratio and mean water influx. However, the effective field has higher residual oil saturation and mean residual oil advantage potential abundance, contributing to higher development adjustment potential. The inefficient field is more complex in distribution, mainly near the diversion line area between injection and production wells, the local low permeability areas, or the top small layers. Injected water can be harder to spread but the residual oil is enriched, with mean residual oil advantage potential abundance reaching 229.56. It is the main area for potential exploitation of late flow field adjustment, as the abundance is much higher than the other three types. The high-potential areas are mainly distributed near the diversion line between the injection and production wells, and the flow field model is small. Although the dominant field and the effective field in the flow field model have a large area, there is little potential for well-infilling. As a result, the dominant field and extreme field are supposed to be restrained, while the inefficient field and effective field are supposed to be enhanced. Priority is given to adjusting the flow field through strategies like increasing injection, liquid lifting, injection and production optimization, profile control, and separate injection.
4.2. Discussion
According to the flow field distribution, the injection and production parameter optimization countermeasures are used to carry out the flow field adjustment study for the Egg model. The comparison of the working system of each well before and after the adjustment is shown in
Figure 6. The figure shows that the water injection wells adopted a unified working strategy before the adjustment. After the injection and production parameter optimization countermeasures were adopted, the water injection wells in the area with a large local flow field intensity were liquid controlled, and the water injection of wells in the area with a large local flow field potential was increased. The same goes for the oil production wells.
From the comparison table of clustering attributes of four types before and after flow field adjustment given in
Table 3, after adjustment, the dominant field and extreme field areas were suppressed, and the effective field and inefficient field areas were strengthened. The original dominant flow field area was relatively weakened, and the proportion of the dominant field and extreme field areas decreased from 68% to 48.24%, and the proportion of the effective field and inefficient field areas increased from 25.76% and 6.23% to 43.18% and 8.57%, respectively. By comparing the flow field clustering attribute parameters before and after the adjustment, the average remaining oil dominant potential abundance of different flow field area types decreased significantly, which was only about 50% of that before the adjustment, indicating that the flow field adjustment effectively released the potential of different flow field types.
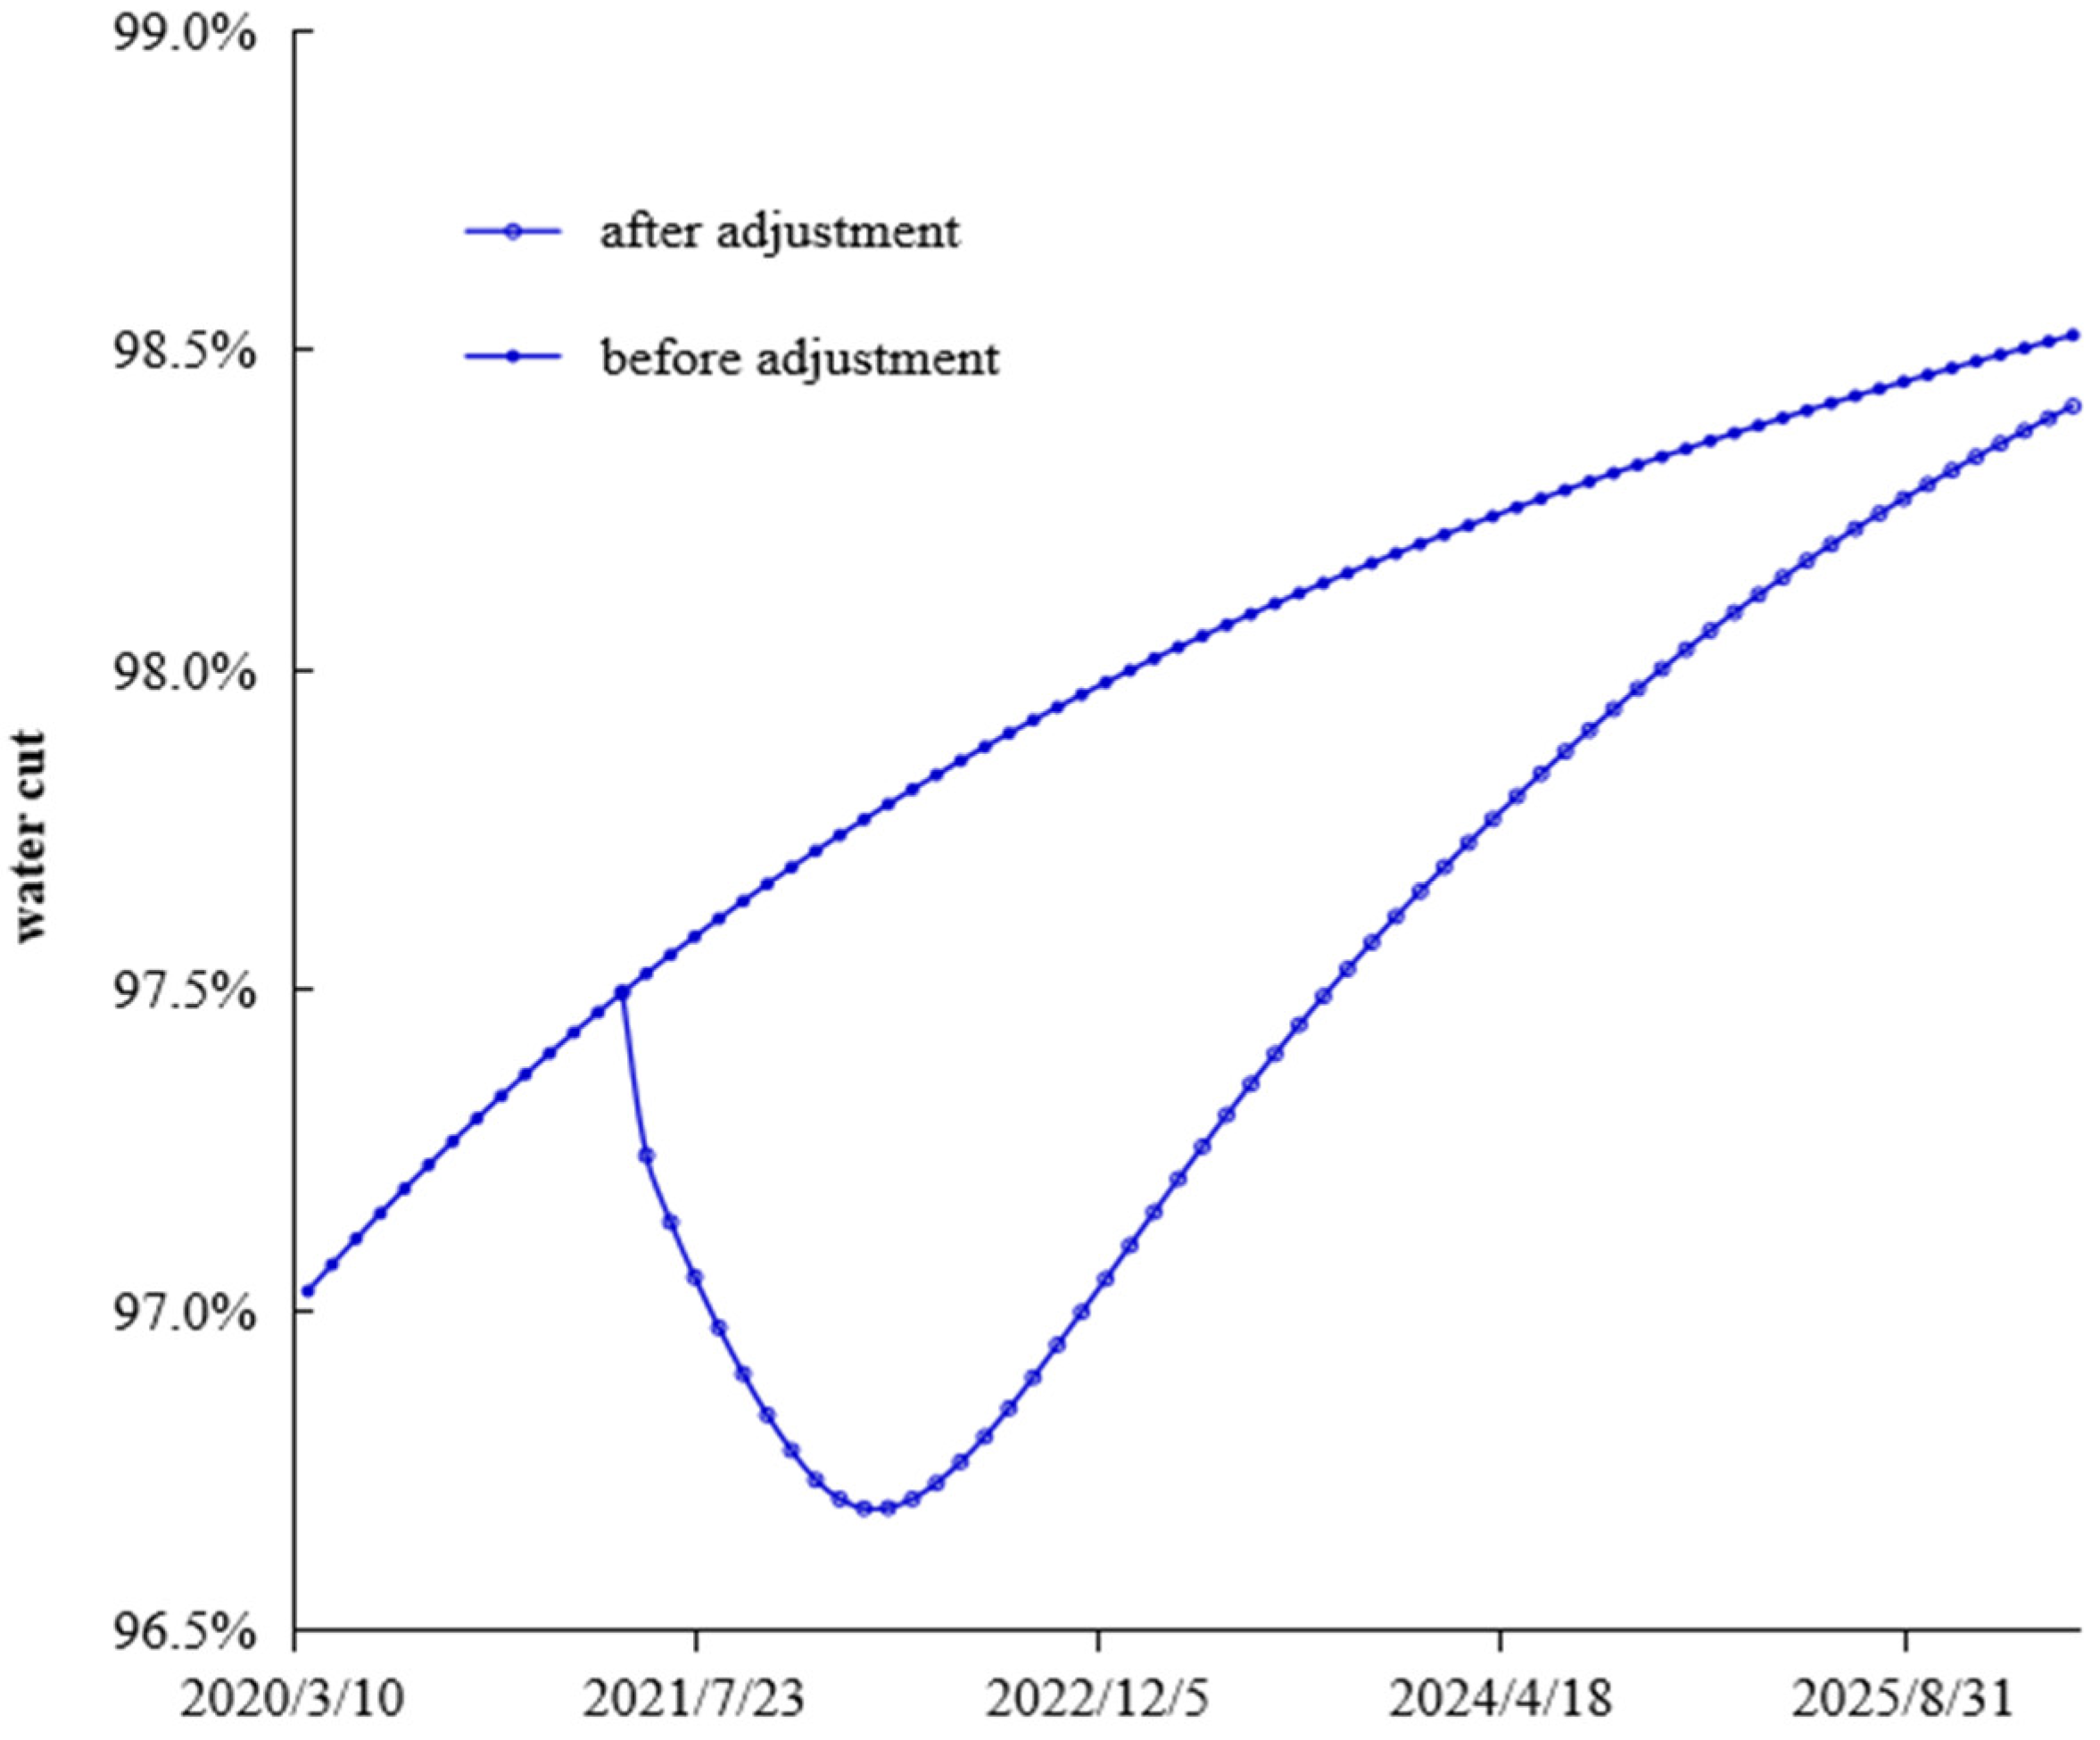
Figure 7 shows a comparison of the comprehensive water content of the model after simulating production for 5 years before and after the flow field adjustment. After the flow field of the reservoir was adjusted during the ultra-high water-cut period, the development effect was significantly improved, the comprehensive water content decreased significantly, and the recovery factor increased by 1.1 percentage points.
The validation based on the Egg model demonstrates that the proposed method exhibits good adaptability and stability under different heterogeneity conditions and complex-flow field states. It provides a novel technical approach for the fine characterization of flow fields in highly heterogeneous reservoirs during the high water-cut stage. The research outcomes can offer reliable technical support for well pattern adjustment and optimization, chemical flooding deployment, and the optimization of remaining oil recovery strategies during reservoir development, possessing significant theoretical guidance and engineering application value. In particular, the method shows promising applicability and broad prospects in addressing challenges such as complex-flow field characteristics, pronounced differences in seepage capacity, and difficulties in identifying potential flow zones in highly heterogeneous reservoirs during high water-cut stages.
5. Conclusions
In this study, a novel flow field partitioning and characterization method for high water-cut reservoirs was proposed, addressing the complexity of flow field evolution jointly controlled by static geological properties and dynamic seepage behavior. By systematically extracting multidimensional characteristic parameters that reflect the material foundation of the flow field, displacement efficiency, and water-flooding status, a grid-scale flow field characterization index system was constructed to comprehensively depict the current development status and flow field characteristics of the reservoir.
Distinct from conventional methods based on streamline clustering or fuzzy logic—which rely heavily on subjective thresholds and are prone to misclassification due to streamlines crossing multiple regions—the proposed method treats all geological grid cells as independent samples. It employs a K-Means clustering algorithm for objective flow field classification, with the Davies–Bouldin index used for cluster validity evaluation. This approach effectively overcomes limitations such as streamlining overlapping-induced misjudgment and clustering subjectivity, achieving fine-scale identification of different flow field types and accurate capture of flow field characteristics, thereby significantly improving the accuracy and rationality of flow field partitioning.
Validation using the benchmark Egg model demonstrated the method’s strong adaptability and stability under different heterogeneity conditions and complex-flow field scenarios. The approach successfully identified potential flow paths and regions with varying seepage capacities, classifying them into four flow field types: low-efficiency displacement, effective displacement, dominant displacement, and extreme displacement fields. Subsequent flow field adjustment based on these classifications led to a weakened dominant displacement region, enhanced effective and low-efficiency displacement zones, and an increase in overall oil recovery by 1.1 percentage points.
Compared with existing clustering-based flow field partitioning techniques, the proposed method leverages the advantages of multidimensional feature-driven analysis, avoiding the arbitrary threshold setting and subjectivity issues associated with fuzzy logic approaches, while also resolving the partitioning ambiguity and misclassification problems caused by streamline crossing in traditional streamline-based methods. This method is particularly suitable for high-dimensional, large-scale, and strongly heterogeneous reservoir grid flow field data analysis. It provides a robust, objective, and efficient technical tool for flow field identification and high water-cut reservoir development decision-making, offering significant theoretical value and practical application potential for well pattern adjustment, chemical flooding deployment, and remaining oil exploitation optimization in complex heterogeneous reservoirs.
While validated on synthetic models such as the Egg model, further testing on diverse real-field data sets is necessary to fully confirm its generalizability and practical utility. Future work will focus on addressing these limitations by exploring more advanced clustering algorithms, integrating multi-source reservoir data, and conducting extensive field validations.


 type I: inefficient field;
  type II: effective field;
  type III: dominant field;
  type IV: extreme field.