Abstract
Proactively hunting known attack behaviors within system logs, termed threat hunting, is gaining traction in cybersecurity. Existing methods typically rely on constructing a query graph representing known attack patterns and identifying it as a subgraph within a system-wide provenance graph. However, the large scale and redundancy of provenance data lead to poor matching efficiency and high false-positive rates. To address these issues, this paper introduces SGMNet, a supervised seeded graph-matching network designed for efficient and accurate threat hunting. By selecting indicators of compromise (IOCs) as initial seed nodes, SGMNet extracts compact subgraphs from large-scale provenance graphs, significantly reducing graph size and complexity. It then learns adaptive node-expansion strategies to capture relevant context while suppressing irrelevant noise. Experiments on four real-world system log datasets demonstrate that SGMNet achieves a runtime reduction of over 60% compared to baseline methods, while reducing false positives by 35.2% on average. These results validate that SGMNet not only improves computational efficiency but also enhances detection precision, making it well suited for real-time threat hunting in large-scale environments.
1. Introduction
Advanced persistent threats (APTs) refer to sophisticated, stealthy, and long-term cyberattacks often orchestrated by well-resourced adversaries with specific objectives such as espionage or sabotage. These threats pose serious risks to critical infrastructure, national security, and economic stability, as evidenced in recent high-profile incidents targeting government and industrial systems [1]. In response, security analysts actively monitor threat intelligence (TI) sources—such as public repositories, security blogs, and forums—to identify attack patterns and extract indicators of compromise (IOCs) [2,3]. Despite these efforts, detecting the presence of known attack behaviors within local systems remains difficult due to the complexity and volume of system logs. Accurately identifying the recurrence of known patterns is thus essential for uncovering latent threats and enhancing proactive defense capabilities.
Drawing inspiration from provenance graph analysis [4,5,6], the provenance graph, constructed from system logs, serves as a crucial tool for identifying threat behaviors. Extracting known attack characteristics into a query graph transforms threat hunting into a subgraph-matching problem. Figure 1 illustrates this concept using cyber threat intelligence (CTI) as an example. Security experts can generate a query graph based on CTI, and construct a large provenance graph from system audit logs. The objective is to search within the large-scale provenance graph for nodes that closely match the types and connections in the query graph .
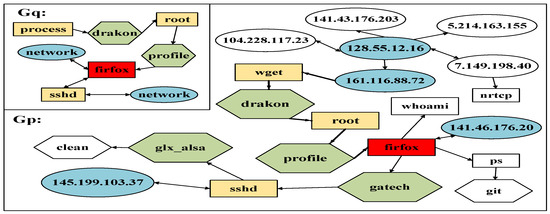
Figure 1.
An illustration of the query graph () and the provenance graph (), where different shapes represent various types of system entities.
Subgraph matching for threat hunting faces two key challenge:
- Large-Scale Graph: Every day, systems generate millions of events and activities, causing log volumes to increase exponentially [7]. Recent research findings [8] indicate that it takes an average of over 200 days to detect cyber attacks. As a result, provenance graphs built from these extensive system logs become large scale, adversely affecting the efficiency of threat hunting.
- High False-Positive Rate: The provenance graph generated from system logs typically contains substantial redundant information. This redundancy may negatively impact subgraph matching, leading to increased false positives during threat hunting.
Existing threat-hunting methods exhibit certain limitations despite their attempts to address specific challenges. For instance, DeepHunter [9] employs deep learning techniques for threat detection but suffers performance degradation when operating on large-scale provenance graphs, as longer hunting durations result in reduced accuracy. Similarly, ProvG-Searcher [10] mitigates inefficiencies caused by large-scale provenance graphs by extracting subgraphs centered on individual processes. Nevertheless, this approach is limited because not all processes effectively represent attack behaviors, potentially resulting in irrelevant subgraphs and reduced hunting precision.
Moreover, GH-Provenance [10] introduces a seeded graph-matching approach, leveraging known indicators of compromise (IOCs) from threat intelligence reports as seed nodes to identify relevant subgraphs within the provenance graph. Although this seeded graph-matching technique effectively narrows down the search space by expanding from known nodes, its reliance on fixed, predefined expansion rules restricts adaptability, especially against sophisticated, evolving cyber threats. Consequently, its effectiveness diminishes in dynamic environments characterized by rapid threat evolution.
To address these limitations, we introduce a novel method named seeded-graph-based threat hunter (SGMNet). Our approach leverages known indicators of compromise (IOCs)—such as suspicious IP addresses, processes, and files—as seed nodes to efficiently extract targeted subgraphs from large-scale provenance graphs. By prioritizing subgraphs centered around these IOCs, SGMNet significantly reduces irrelevant information, thereby enhancing efficiency in large-scale threat-hunting scenarios [10]. Unlike traditional modeling formalisms such as Petri nets and process algebra, which often assume fixed transition semantics and are better suited for modeling predefined concurrent system behaviors, graph-based methods provide greater flexibility for representing complex and heterogeneous system logs. Provenance graphs—especially when modeled as bigraphs—naturally capture both hierarchical (containment) and relational (interaction) structures, which are essential for reconstructing attack paths across multiple system entities. To achieve further improvements, SGMNet incorporates a seeded graph-matching mechanism inspired by recent advances in seeded graph alignment. Instead of relying on rigid rule-based expansion, SGMNet dynamically learns node-expansion strategies based on historical attack traces. This adaptive mechanism enables a more precise and flexible exploration of potential threat behaviors, improving the overall accuracy of threat hunting.
Finally, to validate the effectiveness of SGMNet, we conduct extensive experiments on four real-world datasets and compare its performance against state-of-the-art threat-hunting techniques. The experimental results show that our method achieves superior performance in both hunting accuracy and computational efficiency.
The main contributions of this paper are summarized as follows:
- We propose SGMNet, a novel threat-hunting framework tailored for large-scale provenance graphs. By leveraging indicators of compromise (IOCs) as anchor points, our method extracts compact and behavior-relevant subgraphs, significantly reducing the search space and improving runtime performance.
- We integrate two key mechanisms from seeded graph-matching theory—witness-based neighborhood consistency and percolation-based seed expansion—into a unified, learnable framework. Unlike prior works with static rule-based expansion (e.g., Poirot), our method learns adaptive expansion strategies from historical attack paths to enhance matching robustness and reduce false positives.
- We conduct comprehensive experiments on four benchmark datasets from the DARPA TC project. The results demonstrate that SGMNet improves accuracy by up to 3.1% and reduces false positives to 0.00% in several scenarios, outperforming baselines such as DeepHunter, SimGNN, ProvG-Searcher, and Poirot.
2. Related Work
In this section, we review prior research along three complementary directions: graph-based modeling for cyber systems, bigraph evolution and consistency frameworks, and seeded matching approaches for threat hunting.
2.1. Graph-Based Modeling for Cybersecurity
Graph representations have become predominant for modeling system behaviors in cybersecurity, especially viaprovenance graphs that record causal interactions among processes, files, and network events. Early works such as Poirot [11] employ rule-based alignment on audit logs to detect attack behaviors. More recent approaches integrate graph neural networks (GNNs) to learn expressive embeddings: DeepHunter leverages GNNs for robust threat hunting but struggles with scalability on large graphs [9], while PROVEXPLAINER focuses on explainability by extracting discriminant subgraphs from provenance traces [12]. A broad survey by Zhong et al. (2024) systematically categorizes GNN-based intrusion detection methods into graph construction, network design, and deployment, highlighting both performance gains and persistent challenges in interpretability and data volume [13].
2.2. Bigraph Evolution and Architectural Consistency
The Bigraphical Reactive Systems (BRS) framework introduced by Milner provides a formal dual-graph model—a place graph for containment and a link graph for connectivity—to describe dynamic systems [14]. Subsequent extensions apply bigraphs to software architecture evolution: Giese and Schaefer survey bigraph-based self-adaptive architectures, emphasizing rule-based transformations for consistency [15], while Marmsoler and Rydeheard formalize refinement checks in BRS to verify invariants during evolution [16]. More recently, an Extended Bigraph model was proposed for big data software evolution, introducing dynamic evolution rules and symmetric consistency analysis in banking systems [17]. Despite the strong formal guarantees, bigraph approaches often face performance bottlenecks when processing the volume and heterogeneity of system logs.
2.3. Seeded Matching and Threat-Hunting Models
Seeded graph matching leverages partial ground-truth correspondences (seeds) to guide efficient alignment. In cybersecurity, known IOCs serve naturally as seeds. Milajerdi et al. [11] and Altinisik et al. [10] use heuristic or embedding-based seeds to extract relevant subgraphs, but both apply static expansion strategies that limit adaptability. Recent advances in supervised seeded matching like SeedGNN demonstrate that learning expansion via witness and percolation theories can significantly enhance matching accuracy in general domains [18,19]. However, these methods have not yet been specialized for cyber threat hunting on provenance graphs—a gap that SGMNet fills by combining learnable seed expansion with security-specific contextual features.
Through this taxonomy, we see that while graph-based and bigraphical models offer rich formalism or learning-based expressiveness, none simultaneously address large-scale provenance data, adaptive seed-driven exploration, and security-aware context. Our SGMNet integrates the strengths of these lines—scalable GNN encoding, adaptive seeded matching, and provenance-specific modeling—to provide a novel, efficient, and accurate threat-hunting framework.
3. System Design and Methodologym
3.1. System Overview
As shown in Figure 2, our system consists of three major components: graph generation, seeded graph model training, and seeded graph model matching.
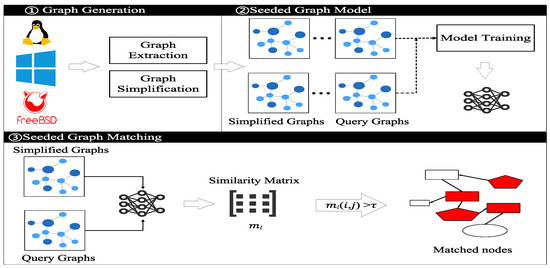
Figure 2.
System overview.
Firstly, provenance graphs are constructed from audit log streams collected from Linux, Windows, and FreeBSD environments. Each node represents a system entity (e.g., process, file, socket), while edges denote causal or temporal relations. Given a small set of known indicators of compromise (IOCs), we extract IOC-centered subgraphs and apply pruning strategies to reduce graph size while retaining behavioral context (see Section 4.1). Unlike global graph encoders, this focus enables sublinear processing time with respect to the full graph size.
Secondly, we introduce a novel training framework that extends SeedGNN by integrating two expansion mechanisms: witness-guided neighborhood propagation and percolation-based seed evolution. Although inspired by structural alignment patterns observed in bigraph transformations, our method differs significantly: expansion is not rule-based, but learned from training data. Specifically, we define the expansion probability between a node v in the query graph and candidate in the provenance graph as:
where is a learnable matching function (e.g., MLP), denotes current matched seed pairs, and captures the neighborhood embedding of node .
This mechanism dynamically controls the expansion frontier without relying on static bigraph rewrite rules. As a result, it can generalize to unseen structures and noisy logs. The complexity of expansion per step is , where k is the seed count and d is the average node degree—substantially faster than exhaustive pairwise matching ().
Finally, during inference, we compute the subgraph similarity score between the query and candidate graphs. If the score exceeds a learned threshold, we predict a match. This design makes the system robust to partial matches and missing nodes. Importantly, while our graph construction captures both hierarchical and relational semantics (similar to place/link separation in bigraphs), our system does not adopt the Bigraphical Reactive Systems (BRS) formalism. We use directed labeled graphs and neural matching to achieve high scalability and adaptivity. Our contributions lie in converting seed expansion from a rule-driven to a data-driven, learnable process—thereby improving both accuracy and efficiency in real-world cyber threat hunting.
3.2. Problem Formulation
Hypothesis-driven threat hunting is treated as a seed graph-matching problem. Let us assume a graph consists of n nodes, where represents the set of graph nodes and represents the adjacency matrix of the graph. We represent the structural links between nodes using a binary adjacency matrix A, where denotes that node i shares an edge with node j; otherwise, , indicating no direct connection. Additionally, suppose there is a query graph with nodes generated from CTI, and a provenance graph with nodes constructed from system audit logs, where . We assume an unknown injective mapping , representing the correspondence between nodes in and nodes in . When , corresponds to .
Let a candidate correspondence between graphs and be represented by a node pair , where and . The pair is considered a correct alignment if , where denotes the ground-truth node mapping. Otherwise, it is treated as an incorrect correspondence. Given a seed set composed of partial ground-truth matches, the goal of seeded graph matching is to learn a predictive function that estimates the matching likelihood between node pairs, leveraging both structural information and seed supervision. The model should demonstrate that when , there exists a similar attack behavior in and . Conversely, if , it indicates the absence of similar attack behaviors between and .
3.3. Key Concepts
We introduce two key concepts borrowed from seeded graph-matching theories and other concepts in this paper:
Witnesses: In measuring the relational consistency between nodes from distinct graphs, a commonly adopted structural signal involves tracking the co-occurrence of neighborhood patterns. Specifically, for a node and a node , the presence of node pairs , where u is an l-hop neighbor of v in and is an l-hop neighbor of w in , reflects a shared structural context. The greater the number of such aligned neighborhood pairs, the more likely v and w exhibit structural correspondence. This mechanism, often referred to as witness-based comparison [20,21], serves as a quantitative proxy for cross-graph node similarity.
Percolation: Percolation refers to the process by which some node pairs that are truly aligned are easier to match than others [19,20]. Algorithms can use these easily matched true alignments as new seeded nodes, which helps in matching the similarity of other node pairs. By infiltrating neighboring nodes when extending seeded nodes, a large number of aligned node pairs can be matched, enhancing the overall matching accuracy.
Subgraph Matching: Subgraph relation is a partial-order relation as it has the following three properties. Given three graphs , subgraph relationship satisfies the following three properties: (i) (reflexivity); (ii) if and , then (transitivity); and (iii) if and , then (antisymmetry).
4. System Components
4.1. Graph Generation
In this section, we detail the methods for generating and simplifying the provenance graph. The provenance graph represents interactions between processes, files, and network sockets.
Graph Extraction: SGMNet constructs its provenance graph by capturing critical system audit events, including process executions, file interactions, and network connections, collected from system logs [6]. For each entity and recorded event, key security-relevant attributes, such as filenames, IP addresses, operation types, start times, and end times, are documented. When provided with a Point of Interest (POI)—for example, a malicious file downloaded by the Firefox process—SGMNet initiates backward causal analysis to identify dependent preceding events. Through backward tracing from this POI event, the provenance graph is constructed by linking all causally related historical activities.
Due to the characteristic nature of cyber attacks, certain IOAs (like IP addresses or file identifiers) are employed to anchor the threat-hunting process. Notably, specific events preceding the POI form a focused provenance subgraph around the attack activity. Specifically, SGMNet leverages a seeded graph-matching approach: given a POI event, the algorithm identifies nodes whose attributes closely match substrings of the POI, adding these nodes into a detection list. Subsequently, for each node in this list, SGMNet inspects incoming edges to determine temporal relationships. If an incoming edge’s start time precedes a specified threshold, the corresponding start node and edge are integrated into the provenance subgraph. This iterative backward causal analysis effectively captures attack dependencies, resulting in a compact yet informative provenance graph suitable for precise and efficient threat hunting. Finally, the abstract origin graph is returned, as shown in Algorithm 1.
| Algorithm 1 POI-based graph abstract method |
|
Graph Simplification: In the provenance graph extracted based on POI events described previously, multiple redundant edges frequently appear between process nodes and file or network nodes due to repetitive read/write operations occurring within brief intervals. To address this redundancy, SGMNet implements an edge deduplication strategy. Specifically, when multiple edges exist between two nodes—such as a process node and a file or network node—due to repeated operations in a short time frame, SGMNet consolidates these redundant edges into a single representative edge. Furthermore, to manage duplicate nodes effectively, SGMNet selects a single representative node among duplicates by assigning it a unique identifier (UUID) and unified node name (unidname), ensuring clarity and consistency within the provenance graph.
4.2. Seeded Graph Model Design
To address the challenge of threat hunting, this study leverages the concept of seeded graph matching, inspired by SeedGNN. Specifically, SeedGNN encodes the information of known seeded node pairs and iteratively optimizes matching through integrated convolutional and penetration modules. Similarly, in our enhanced threat-hunting model, known attack behaviors are selected as seeded nodes. These nodes anchor the matching process, enabling SGMNet to iteratively propagate and refine matching information throughout the graph layers, thus improving threat-detection accuracy and efficiency.
Generalizable Encoding Method for Seeds: To represent the pre-identified correspondences between the two graphs, we define binary association matrices , each encoding initial node-level matches. For a given seed pair , where and , the entry at location in is assigned a value of 1, while all unmatched pairs retain a zero value. These matrices are flattened prior to being passed into the model to maintain consistency with the pairwise representation used in SGMNet.
We compare our approach with an alternative method that employs traditional one-hot or multi-dimensional encoding for seeded node pairs, such as the approach used in SeedGNN.In contrast to prior approaches that rely on size-dependent formatting—where the representation of node pairs may expand with the graph scale or the seed count—our design adopts a uniform scalar form for each potential match. This ensures that all pairwise match indicators are processed consistently, regardless of graph complexity. This design enables SGMNet to generalize effectively across graphs of arbitrary scales or varying numbers of seeded nodes, allowing it to identify suspicious activities even in new graphs derived from previously unknown attacks described in CTI.
Additionally, existing approaches, including SeedGNN, typically neglect the contextual information provided by node attributes. These methods primarily focus on structural matching, overlooking valuable semantic context that could enhance accuracy. Recognizing this limitation, we explicitly incorporate contextual features of nodes into our model to better capture potential threat behaviors. Specifically, for non-numeric attributes like file paths, we train a Word2Vec model on words extracted from all file paths. Each word is then transformed into a corresponding low-dimensional embedding vector, providing rich semantic information. Consequently, our model gains the ability to leverage meaningful contextual attributes—such as file paths—to accurately detect attack patterns.
The proposed encoding method yields node attribute vectors . We then apply cosine similarity to obtain the attribute similarity matrix between node pairs:
To integrate both the structural information and attribute information of node pairs, we enhance the adjacency matrix using matrix multiplication to obtain :
where ⊙ denotes the element-wise multiplication.
Convolution Module: To compute multi-hop consistency between candidate node pairs, we introduce a pairwise convolutional propagation framework. Unlike conventional node-level GNNs that operate independently on each graph, our approach learns embeddings for node pairs directly. This design enables the model to detect structural consistency, such as whether a candidate pair is supported by matching neighborhoods anchored by known seeds. Given two graphs and , we define a seed alignment matrix at layer l, where each row represents an embedding of a node pair . Pre-matched seed pairs serve as anchors to initiate inter-graph relational propagation. As illustrated in Figure 3, these anchors allow weak alignment signals to flow across graphs, facilitating robust subgraph matching. To propagate consistency signals, we define a structured expansion operator that aggregates messages over Kronecker-style neighborhood patterns. This yields:
where and are sparsified adjacency matrices.
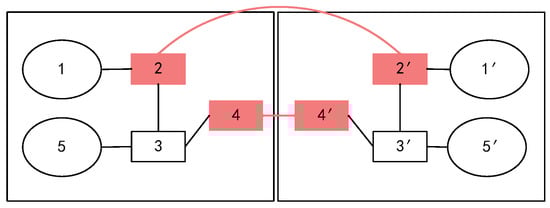
Figure 3.
An illustration of the node pair to be aligned, where the red node pairs represent the seeded nodes.
The individual update for a candidate pair can be expanded as:
To accelerate computation, we reshape the propagation into a tensor product form:
where and stores the updated pairwise context.
We summarize this process in Algorithm 2, including tensor propagation and feature refinement steps.
| Algorithm 2 Pairwise convolutional propagation and feature refinement |
|
Finally, we apply a stacked MLP to refine propagated features:
where the transformation is recursively defined as:
with ReLU activation and weights initialized via Gaussian priors. The final output is then passed to the confidence estimation module.The final model is shown in Figure 4.
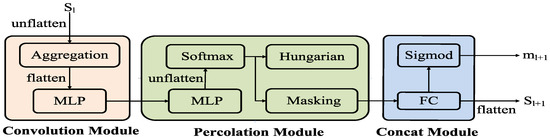
Figure 4.
An illustration of the core architecture of a single propagation unit in SGMNet [18].
Refinement Module: This module is responsible for isolating high-confidence correspondences within each iteration and relaying them as guidance for subsequent updates. Let denote the node-pair representations from the previous stage. We begin by projecting these into a scalar confidence vector via a transformation function , where is a dedicated multi-layer perceptron.
The resulting vector is reshaped into a confidence matrix . To normalize the confidence values, we apply symmetric softmax normalization as follows:
where the softmax function is applied row-wise. However, due to the inherent class imbalance in graph matching—where non-matching pairs vastly outnumber true pairs—this matrix typically contains a significant amount of spurious information.
To mitigate the risk of misleading updates, we apply a filtering mechanism that identifies the most promising node pairs. Instead of directly using computationally expensive injective assignment procedures such as the Hungarian algorithm, we adopt the Greedy Max-Weight Matching (GMWM) approach, which offers a significantly lower computational complexity of . Combined with sparse propagation operations, the total per-iteration complexity becomes , which is only marginally higher than existing state-of-the-art GNN-based methods.
Formally, the GMWM procedure produces a binary matrix , where indicates that node is provisionally aligned with node . We then refine the soft confidence matrix by applying an element-wise mask:
where ∘ denotes the Hadamard (element-wise) product. The resulting vector is propagated to the next iteration as refined alignment supervision.
This masking strategy effectively suppresses noisy matches while preserving high-confidence candidate pairs. As shown in Figure 5, the procedure focuses on reliable diagonal entries and filters out misleading off-diagonal noise. Our experiments confirm that this refinement stage not only improves match precision but also enables the model to recover from early-stage mismatches, leading to significantly reduced false-positive rates in downstream applications such as cyber threat detection [22].
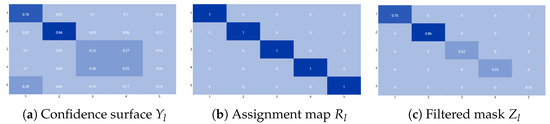
Figure 5.
The visualization of the alignment filtering module. Diagonal entries indicate confident correspondences, while off-diagonals represent uncertain or false matches.
Symmetric Consistency Property: To provide theoretical grounding for the structural reliability of our cross-graph propagation, we formalize a symmetric consistency condition that ensures bidirectional correspondence stability during seeded matching.
Given two graphs and with adjacency matrices and , a candidate node pair satisfies symmetric neighborhood consistency if:
where denotes the set of neighbor pairs with overlapping anchor support in the Kronecker-style joint product graph.
Assume that:
- (1)
- The propagation operator is constructed via a Kronecker-type product over symmetric sparsified graphs;
- (2)
- The seed set is symmetric, i.e., if , then for all , it holds that .
Then, for all iterations l, the propagated pairwise embedding tensor satisfies:
The propagation operator is bilinear and symmetric if the input adjacency matrices and are symmetric. Because propagation is performed as:
the symmetry of and , along with the symmetric seed initialization , ensures the resulting tensor is symmetric across dimensions and for all layers l. This property is preserved inductively across iterations.
The proof follows from the symmetry of the Kronecker-style propagation operator and the initialization symmetry of the seed map. At each layer l, propagation is computed as:
If , , and are symmetric across , then the resulting output tensor maintains symmetry. Inductive propagation preserves this property layer-wise.
Feature Fusion: SGMNet combines a convolution module and a percolation module to capture witness information across multiple hops and iteratively discover new seed nodes. However, directly propagating from all detected seeds may introduce noise—especially when low-confidence nodes are used—resulting in error accumulation and reduced accuracy. Furthermore, different attack patterns often yield diverse witness structures, making it necessary to dynamically adjust reliance on seed nodes. To address this, SGMNet adopts an adaptive fusion strategy. After initial pruning, it evaluates the confidence of seed nodes and integrates contextual attributes—such as node type, timestamps, and semantics—to selectively incorporate reliable seeds. High-confidence seed nodes are reused in the next iteration, allowing the model to adjust propagation based on reliability.
Instead of directly using the output from the percolation module, SGMNet concatenates it with the output from the convolution module to form the next-layer input:
This fused representation is fed into a neural network module, enabling the model to combine original seed information with newly generated candidates. Finally, the matching probability is computed as:
where FC is a fully connected layer and denotes the Sigmoid function. This design allows the model to adaptively refine the matching strategy under varying graph densities and node distributions.
The true node correspondences are used as the supervisory training information for end-to-end training. Specifically, for any training example , the cross-entropy loss is adopted to measure the discrepancy between the prediction and the true mapping .
4.3. Seeded Graph Mathcing
Seeded Nodes Selection: The initialization of node-embedding vectors is crucial for model performance. The initial embedding vectors are calculated using node attribute values. In seeded graph matching, selecting seeded node pairs is key. Seeded node pairs are selected based on known IOAs nodes from CTI. First, candidate seeded nodes in the provenance graph are searched for, which have the same attributes as the known IOA nodes. Next, the similarity between the embedding vectors of nodes in the query graph and the candidate seeded nodes is calculated using metrics like cosine similarity or Euclidean distance. Finally, the most similar node pairs are chosen as seeded node pairs. Additionally, the number of seeded nodes is set as , where is the number of nodes in the query graph and is a hyperparameter that determines the proportion of seeded nodes.
Training Sample Generation: We improve ProvG’s training data generation method to enhance subgraph recognition. Specifically, a node is selected from the provenance graph, and its l-hop neighborhood forms the provenance graph . To ensure appropriate complexity, the number of edges in the query graph is limited to between 40 and 50. The steps for generating positive and negative samples are as follows: For positive sample pair generation, all possible flows within the target provenance subgraph are enumerated through forward and backward depth-first searches. A random flow was selected and expanded to the required number of edges, creating a positive sample pair . Then, seeded node pairs are selected following the previously described method to obtain the final positive sample pair . For negative sample pair generation, a graph with the same anchor point as the target provenance subgraph is selected and its flow is expanded. If there were insufficient instances of the same process, the behavior of another process with the same abstraction is used. If that was also not feasible, a flow was randomly selected and expanded. Finally, seeded node pairs were chosen to obtain the final negative sample pair .
Seeded Graph-Matching Evaluation: After training, we utilize the trained model to predict seeded graph-matching results during the testing phase. The procedure is as follows: Firstly, a threshold is established to assess the confidence of the matches. For each layer l of the matching matrix , the elements are compared with the threshold . If , node i in the provenance graph is considered to be matched with node j in the query graph . Otherwise, they are considered unmatched. In the overall decision process, if a sufficient number of node pairs meet the condition across all layers, it is concluded that the provenance graph contains the threat behavior described by the query graph . Otherwise, it is concluded that it does not.
4.4. Computational Complexity Analysis
We now analyze the computational complexity of SGMNet in terms of graph size, seed cardinality, and embedding dimension. Let and denote the number of nodes in the query and provenance graphs, respectively. Let d denote the average node degree, k the number of seed pairs, and the embedding dimension at layer l. Then:
- Convolution Module: The pairwise propagation is implemented using Kronecker-like operations on adjacency matrices. Naively, this would incur complexity. However, we exploit the sparsity of and , and compute:which requires , assuming bounded degrees.
- Percolation Module: Seed expansion is guided by attention over seed-aligned pairs. At each step, expansion over k seed pairs with average degree d takes time.
- Fusion and MLP Layers: The fusion vector is processed by a fixed-depth MLP. Thus, each layer requires operations.
Overall, the per-layer complexity of SGMNet is:
which is linear in the number of node pairs and seed pairs under fixed degree bounds. In contrast, brute-force graph matching requires enumerating all node pairings, with time, making it infeasible on large datasets.
SGMNet avoids this by limiting propagation to seed-guided regions and leveraging sparsity in real-world provenance graphs. Empirically, we observe inference time scales near-linearly with graph size (see Section 5.4).
5. Evaluation
5.1. Overview
We conduct experiments using four real datasets from the DARPA Transparent Computing (TC) program, namely, Theia, Trace, Cadets, and FiveDirections, covering eight advanced persistent threat (APT) scenarios. These datasets consist of system-level audit logs collected from Linux and FreeBSD platforms, which include detailed records of system calls, file access, process creation, and network activity. We parse the raw logs into provenance graphs using an enhanced version of the Audit2Prov toolchain, where each node represents a system entity (e.g., process, file, or socket), and directed edges capture data and control flow (e.g., read, write, exec). Each resulting graph typically contains between 1000 to 6000 nodes and 3000 to 10,000 edges. We retain temporal and semantic attributes for all nodes and perform event-based slicing to extract candidate subgraphs. For each APT scenario, we use either third-party provided query graphs or manually construct queries by extracting sequences of attacker actions from public APT reports. This ensures that query graphs reflect realistic, context-rich threat behaviors rather than abstract subgraph templates. Table 1 provides a summary of the datasets and query graph properties used in our evaluation.

Table 1.
Descriptions of the APT attack scenarios.
All experiments are conducted on a CentOS Linux 7.9 system with a 64-core Intel(R) Xeon(R) Gold 5218 CPU @ 2.30 GHz, ten NVIDIA Tesla V100 GPUs (32 GB each), 752 GB of RAM, and 30 TB of solid-state storage.
We first assess the running efficiency of our graph generation strategy, then compare SGMNet with other threat-hunting methods in terms of performance and robustness. The last experiment evaluates the performance of the seeded graph-matching model under different parameters.
5.2. The Running Efficiency of the Graph Generation Strategy
We first construct the original dependency graph from the real-world datasets based on interactions among processes, files, and network sockets. Then, by focusing on the specified POI events, we extract an abstract graph from the original graph. Finally, we obtain the simplified provenance graph by further refining and filtering based on the extracted abstract graph. The experimental results clearly show that our method significantly reduces the scale of graphs generated from real-world datasets. For instance, in the Theia dataset, the original provenance graph contains approximately 588 K nodes and 86 M edges, while the simplified graph constructed by our approach averages only 186 nodes and 2564 edges. Such substantial reductions vary across datasets due to inherent differences in graph structure and node connectivity.
To evaluate the efficiency of our approach beyond graph size, we also measure end-to-end runtime across all datasets. Table 2 shows that SGMNet consistently outperforms Poirot in total execution time. On average, SGMNet achieves over 60% runtime reduction compared to Poirot. In addition, the standard deviation of runtime across 10 independent runs is significantly lower, indicating better runtime stability and deterministic behavior. This highlights SGMNet’s practical applicability in time-sensitive threat-hunting tasks.
Table 2.
Runtime comparison between SGMNet and Poirot on real-world datasets
Runtime Analysis: SGMNet achieves significant runtime efficiency through its POI-centered subgraph extraction and graph simplification strategy, which substantially reduces graph scale before matching. As shown in Table 3, the original provenance graphs—often comprising hundreds of thousands of nodes and millions of edges—are compressed to compact, task-relevant subgraphs (e.g., Theia reduced from 588 K nodes and 86 M edges to just 186 nodes and 2564 edges). This structural reduction leads to notable performance gains. Table 2 presents end-to-end runtime comparisons between SGMNet and Poirot across multiple datasets. SGMNet consistently outperforms Poirot, achieving over 60% reduction in total execution time, with significantly lower standard deviation across runs. For instance, on the Theia dataset, SGMNet completes the full process—including both simplification and matching—in 59.1 s, compared to Poirot’s 160 s for matching alone. These results demonstrate the scalability and practical suitability of SGMNet for efficient threat hunting in large-scale provenance environments.
Table 3.
Comparison of graph sizes at different stages.
5.3. Comparison with Other Graph-Matching Models
ProvG-Searcher [10]: ProvG-Searcher extracts subgraphs centered on each process. However, subgraphs centered on irrelevant processes introduce additional computation and redundant information, leading to a high false-positive rate. While ProvG-Searcher achieves accuracy comparable to SGMNet on Theia (0.03%), Trace (0.05%), and Cadets (0.05%), SGMNet outperforms ProvG-Searcher in terms of false-positive rates, with lower values on Theia (0.02%), Trace (0.01%), and Cadets (0.01%). The reason for this is that SGMNet focuses on reducing redundant nodes and edges by leveraging IOCs as seed nodes, which helps in extracting more relevant subgraphs and thus reduces the false-positive rate.
Poirot [11]: Poirot and SGMNet are similar in concept, both utilizing seeded node information for graph matching. The difference lies in the method of expanding neighboring nodes. Poirot uses a heuristic approach to expand neighboring nodes, which may not always capture the most relevant nodes, leading to a higher false-positive rate. In contrast, SGMNet employs a learning-based approach to expand neighboring nodes, which is more effective in capturing the relevant nodes and reducing the false-positive rate. SGMNet not only demonstrates slightly better accuracy compared to Poirot on the Theia (2.42%), Trace (0.94%), and Cadets (1.74%) datasets, but also significantly outperforms Poirot in terms of false-positive rates, achieving notably lower values.
DeepHunter [9] & SimGNN [23]: DeepHunter and SimGNN leverage different GNNs to learn subgraph relationships between graph embeddings without specifically processing provenance graphs. Therefore, we group them together for comparison with SGMNet. These methods do not focus on reducing the size of the provenance graph or leveraging IOCs as seed nodes, which results in higher false-positive rates. SGMNet demonstrates significantly better accuracy and lower false-positive rates compared to DeepHunter and SimGNN across the Theia (about 18% and 20%), Trace (about 24% and 36%), and Cadets (about 5% and 23%) datasets. The superior performance of SGMNet is attributed to its ability to effectively reduce the graph size and accurately expand neighboring nodes based on the learned patterns, leading to more precise subgraph matching.
In this experiment, the Graph Edit Distance (GED) is calculated to evaluate the similarity of graph structures. GED is used to measure the cost required to transform graph into graph . We employed a subgraph-matching toolkit [24,25] to compute the GED and, based on the reference[26], normalized the GED scores for graphs of different sizes. The results indicate that SGMNet consistently achieves lower GED values compared to existing approaches. For example, on the Theia dataset, the GED achieved by SGMNet is 0.103, notably lower than the 0.129 score obtained by ProvG-Searcher. This demonstrates that SGMNet more effectively retains structural consistency between the query graph and the matched provenance subgraph. The superior performance of SGMNet stems from its seeded graph-matching strategy, which accurately identifies and matches nodes and edges related to attack behavior. Even with large-scale provenance graphs, SGMNet remains capable of precisely extracting structurally similar subgraphs for accurate threat traceability analysis.
In summary, the specific quantitative indicators are shown in Table 4. SGMNet significantly improves the accuracy of threat detection and reduces the false alarm rate by effectively eliminating redundant nodes and edges and adaptively expanding neighbor nodes according to the learned attack patterns. Ultimately, SGMNet only matches highly relevant nodes and edges, ensuring efficient and accurate identification of threat activities.
Table 4.
Performance comparison on different datasets (bold is the final indicator).
Robustness: We compared SGMNet with other threat capture methods across all scenarios presented in Table 1. The matching scores calculated by SGMNet and other methods are shown in Figure 6. The horizontal axis represents the GED scores of the query graph and the provenance graph under different scenarios, that is, the degree of inconsistency in the structures of the two graphs. The vertical axis indicates the matching situation of and . It can be seen that all the matching scores calculated by SGMNet are higher than those of the rule-based Poirot method and are on par with those of the ProvG-Searcher method. This result demonstrates that under APT scenarios with varying degrees of inconsistency, the accuracy of SGMNet can be guaranteed. When capturing the provenance graph in Q5+FiveDirections, the attacker lurks for a long time, and Poirot fails to find the nodes in the subsequent extraction stage. However, when designing its patterns, SGMNet has taken into account the issue that a large number of hops in matching adjacent nodes may lead to a low confidence level of suspicious nodes, thus avoiding such a situation. By optimizing the seed node-expansion algorithm, SGMNet is able to more accurately identify potential threats in complex network environments, thereby improving the efficiency and accuracy of threat capture.
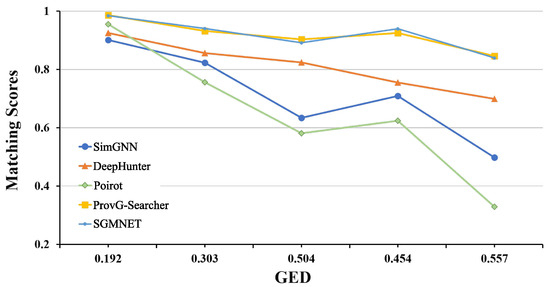
Figure 6.
Robustness of different threat hunting methods.
5.4. Parameter Selection
In the design phase of the model, the performance of the seeded graph-matching model on the FiveDirections dataset is evaluated to determine the optimal parameters. A total of 80% of the dataset is used for training and the remaining 20% for testing. The training process involved 1000 batches, each with a batch size of 512, containing an equal number of positive and negative sample pairs. After training, the model is evaluated over 20 batches. The impact of the number of layers on model performance is analyzed.
As shown in Figure 7a, although the performance differences were minor, models with four and five layers achieved the best results. Considering the computation time costs, we opt for a four-layer model. Additionally, the effect of the initial proportion of seeded node pairs on model performance was explored, particularly how different proportions of seeded node pairs influence the matching effectiveness between the query and provenance graphs.
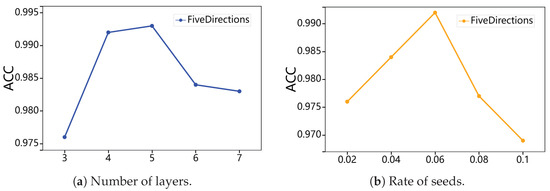
Figure 7.
Impact of various parameters on model performance.
As shown in Figure 7b, our findings indicate that the model performs best when the proportion of seeded pairs is 0.06. This suggests that the model achieves optimal matching precision and efficiency when 6% of the nodes in the query graph are designated as seeded nodes. Further experiments revealed that batch size, embedding size, and learning rate had no significant impact on performance. Due to space constraints, detailed results are not presented.
6. Conclusions and Future Work
SGMNet is a seeded graph-matching approach designed to effectively identify subgraph correspondences between query graphs and large-scale provenance graphs by leveraging limited seeded node information. It is particularly suitable for analyzing known threat behaviors within extensive log datasets. Utilizing a pairwise architecture combined with a penetration module, SGMNet selectively compares nodes from both graphs, allowing only highly relevant node pairs to participate in the matching process. Experimental evaluations confirm that SGMNet consistently outperforms existing methods, achieving superior matching accuracy and significantly lower false-positive rates. In future work, we hope that SGMNet can further enable the cross-system identification of system-agnostic entities and enhance its capability to detect previously unknown threat behaviors
Author Contributions
Conceptualization, C.Z. and L.S.; methodology, L.S.; software, L.S.; validation, L.S.; formal analysis, L.S.; investigation, L.S.; resources, C.Z.; data curation, L.S.; writing—original draft preparation, L.S. and C.Z.; writing—review and editing, C.Z.; visualization, L.S.; supervision, C.Z.; project administration, C.Z.; funding acquisition, C.Z. All authors have read and agreed to the published version of the manuscript.
Funding
This research was funded by the Guiyang University Multidisciplinary Team Construction Projects in 2025 (Grant No. Gyxk202502) and Guiyang University Industry-University-Research Project (Grant No. GYU-YJS-[2025]-17). The APC was funded by Guiyang University.
Data Availability Statement
Due to the nature of this research, the participants of this study did not agree for their data to be shared publicly, so supporting data are not available.
Acknowledgments
The authors would like to express sincere gratitude to Chenghong Zhang for his invaluable academic supervision and methodological guidance throughout this research. His expertise in bio-inspired robotics and cross-domain insights in artificial intelligence provided critical feedback that shaped the theoretical foundation and experimental design of SGMNet. We acknowledge his rigorous review of the manuscript and constructive suggestions for improving the technical depth and clarity of this work. Special thanks are extended to the School of Electronic Information Engineering at Guiyang University for fostering an interdisciplinary research environment that enabled the convergence of cybersecurity and graph neural network methodologies.
Conflicts of Interest
The authors declare no conflicts of interest.
References
- Bardin, J.S. Cyber Warfare. In Computer and Information Security Handbook; Elsevier: Amsterdam, The Netherlands, 2025; pp. 1345–1380. [Google Scholar]
- Ajmal, A.B.; Shah, M.A.; Maple, C.; Asghar, M.N.; Islam, S.U. Offensive security: Towards proactive threat hunting via adversary emulation. IEEE Access 2021, 9, 126023–126033. [Google Scholar] [CrossRef]
- Bui, H.T.; Aboutorab, H.; Mahboubi, A.; Gao, Y.; Sultan, N.H.; Chauhan, A.; Parvez, M.Z.; Bewong, M.; Islam, R.; Islam, Z.; et al. Agriculture 4.0 and beyond: Evaluating cyber threat intelligence sources and techniques in smart farming ecosystems. Comput. Secur. 2024, 140, 103754. [Google Scholar] [CrossRef]
- Gao, P.; Shao, F.; Liu, X.; Xiao, X.; Qin, Z.; Xu, F.; Mittal, P.; Kulkarni, S.R.; Song, D. Enabling efficient cyber threat hunting with cyber threat intelligence. In Proceedings of the 2021 IEEE 37th International Conference on Data Engineering (ICDE), Chania, Greece, 19–22 April 2021; pp. 193–204. [Google Scholar] [CrossRef]
- Milajerdi, S.M.; Gjomemo, R.; Eshete, B.; Sekar, R.; Venkatakrishnan, V. HOLMES: Real-Time APT Detection through Correlation of Suspicious Information Flows. In Proceedings of the 2019 IEEE Symposium on Security and Privacy (SP), San Francisco, CA, USA, 19–23 May 2019; pp. 1137–1152. [Google Scholar] [CrossRef]
- Xu, Z.; Fang, P.; Liu, C.; Xiao, X.; Wen, Y.; Meng, D. DEPCOMM: Graph Summarization on System Audit Logs for Attack Investigation. In Proceedings of the 2022 IEEE Symposium on Security and Privacy (SP), San Francisco, CA, USA, 23–25 May 2022; pp. 540–557. [Google Scholar] [CrossRef]
- Zhu, J.; He, S.; Liu, J.; He, P.; Xie, Q.; Zheng, Z.; Lyu, M.R. Tools and Benchmarks for Automated Log Parsing. In Proceedings of the 2019 IEEE/ACM 41st International Conference on Software Engineering: Software Engineering in Practice (ICSE-SEIP), Montreal, QC, Canada, 25–31 May 2019; pp. 121–130. [Google Scholar] [CrossRef]
- Saraswat, A.; Tiwari, G. United Nations and Beyond: Legal Strategies for Defending Critical Energy Infrastructure Against Cyber Attacks. In Cybercrime Unveiled: Technologies for Analysing Legal Complexity; Springer: Berlin/Heidelberg, Germany, 2025; pp. 291–307. [Google Scholar] [CrossRef]
- Wei, R.; Cai, L.; Zhao, L.; Yu, A.; Meng, D. Deephunter: A graph neural network based approach for robust cyber threat hunting. In Proceedings of the Security and Privacy in Communication Networks: 17th EAI International Conference, SecureComm 2021, Virtual Event, 6–9 September 2021; Proceedings, Part I 17; Springer: Berlin/Heidelberg, Germany, 2021; pp. 3–24. [Google Scholar] [CrossRef]
- Altinisik, E.; Deniz, F.; Sencar, H.T. Provg-searcher: A graph representation learning approach for efficient provenance graph search. In Proceedings of the 2023 ACM SIGSAC Conference on Computer and Communications Security, Copenhagen, Denmark, 26–30 November 2023; pp. 2247–2261. [Google Scholar] [CrossRef]
- Milajerdi, S.M.; Eshete, B.; Gjomemo, R.; Venkatakrishnan, V. Poirot: Aligning attack behavior with kernel audit records for cyber threat hunting. In Proceedings of the 2019 ACM SIGSAC Conference on Computer and Communications Security, London, UK, 11–15 November 2019; ACM: New York, NY, USA, 2019; pp. 1795–1812. [Google Scholar]
- Mukherjee, K.; Wiedemeier, J.; Wang, T.; Kim, M.; Chen, F.; Kantarcioglu, M.; Jee, K. PROVEXPLAINER: Interpretable Explanations for GNN-Based Security Models via Provenance Subgraphs. IEEE Trans. Inf. Forensics Secur. 2023. [Google Scholar]
- Zhong, M.H.; Lin, M.; Zhang, C.; Xu, Z. A Survey on Graph Neural Networks for Intrusion Detection Systems: Methods, Trends and Challenges. Comput. Secur. 2024, 141, 103821. [Google Scholar] [CrossRef]
- Milner, R. Space and Mobility in Computation: Bigraphs and Mobility; Cambridge University Press: Cambridge, UK, 2009. [Google Scholar]
- Giese, H.; Schaefer, I. Bigraphs in Modeling Self-Adaptive Software Architectures: A Survey. In Proceedings of the International Conference on Software Engineering, Seoul, Republic of Korea, 27 June–19 July 2020; pp. 45–62. [Google Scholar]
- Marmsoler, D.; Rydeheard, D. Refinement Checking for Bigraphical Reactive Systems. J. Log. Algebr. Methods Program. 2021, 120, 100640. [Google Scholar]
- Zhang, Y.; Li, X.; Wang, J. Dynamic Evolution Method and Symmetric Consistency Analysis for Big Data-Oriented Software Architecture Based on Extended Bigraph. Symmetry 2025, 17, 626. [Google Scholar] [CrossRef]
- Yu, L.; Xu, J.; Lin, X. SeedGNN: Graph Neural Networks for Supervised Seeded Graph Matching. arXiv 2023, arXiv:2205.13679. [Google Scholar]
- Shariatnasab, M.; Shirani, F.; Garg, S.; Erkip, E. On Graph Matching Using Generalized Seed Side-Information. In Proceedings of the IEEE International Symposium on Information Theory (ISIT), Melbourne, Australia, 12–20 July 2021; pp. 2726–2731. [Google Scholar]
- Chao, X.; Kou, G.; Peng, Y.; Herrera-Viedma, E.; Herrera, F. An efficient consensus reaching framework for large-scale social network group decision making and its application in urban resettlement. Inf. Sci. 2021, 575, 499–527. [Google Scholar] [CrossRef]
- Dadush, D.; Milanič, M.; Tamir, T. Introduction: ACM-SIAM Symposium on Discrete Algorithms (SODA) 2022 Special Issue. ACM Trans. Algorithms 2024, 20, 1–2. [Google Scholar] [CrossRef]
- Xu, Q.; Wang, S.; Wei, J.; Jiang, B.; Tao, Z.; Luo, B. Dynamic semantic-geometric guidance and structure transfer network for cross-scene hyperspectral image classification. Neural Netw. 2025, 187, 107374. [Google Scholar] [CrossRef] [PubMed]
- Bai, Y.; Ding, H.; Bian, S.; Chen, T.; Sun, Y.; Wang, W. SimGNN: A Neural Network Approach to Fast Graph Similarity Computation. In Proceedings of the Twelfth ACM International Conference on Web Search and Data Mining, Melbourne, Australia, 11–15 February 2019; ACM: New York, NY, USA, 2019; pp. 384–392. [Google Scholar] [CrossRef]
- Asudani, D.S.; Nagwani, N.K.; Singh, P. Impact of word embedding models on text analytics in deep learning environment: A review. Artif. Intell. Rev. 2023, 56, 10345–10425. [Google Scholar] [CrossRef] [PubMed]
- Guo, L.; Yan, F.; Li, T.; Yang, T.; Lu, Y. An automatic method for constructing machining process knowledge base from knowledge graph. Robot. Comput. Integr. Manuf. 2022, 73, 102222. [Google Scholar] [CrossRef]
- Qureshi, R.J.; Ramel, J.Y.; Cardot, H. Graph based shapes representation and recognition. In Proceedings of the International Workshop on Graph-Based Representations in Pattern Recognition, Anacapri, Italy, 16–18 May 2007; Springer: Berlin/Heidelberg, Germany, 2007; pp. 49–60. [Google Scholar] [CrossRef]
Disclaimer/Publisher’s Note: The statements, opinions and data contained in all publications are solely those of the individual author(s) and contributor(s) and not of MDPI and/or the editor(s). MDPI and/or the editor(s) disclaim responsibility for any injury to people or property resulting from any ideas, methods, instructions or products referred to in the content. |
© 2025 by the authors. Licensee MDPI, Basel, Switzerland. This article is an open access article distributed under the terms and conditions of the Creative Commons Attribution (CC BY) license (https://creativecommons.org/licenses/by/4.0/).