Article

Optimization and Design of Built-In U-Shaped Permanent Magnet and Salient-Pole Electromagnetic Hybrid Excitation Generator for Vehicles

1
School of Automobile and Transportation, Tianjin University of Technology and Education, Tianjin 300222, China
2
Tianjin Zhenghan Technology Co., Ltd., Tianjin 300222, China
3
Department of Automotive Engineering, Hebei Vocational University of Technology and Engineering, Xingtai 054000, China
*
Author to whom correspondence should be addressed.
Symmetry 2025, 17(6), 897; https://doi.org/10.3390/sym17060897
Submission received: 16 May 2025 / Revised: 30 May 2025 / Accepted: 3 June 2025 / Published: 6 June 2025
(This article belongs to the Section Engineering and Materials)

Abstract

In this paper, the concept of symmetry is utilized to optimize the structural parameters and output characteristics of the generator design—that is, the construction and solution of the equivalent magnetic circuit method for the hybrid excitation generator are symmetrical. To address the issues of high excitation loss and low power density in purely electrically excited generators, as well as the difficulty in adjusting the magnetic field in purely permanent magnet generators, a new topology for a built-in permanent magnet and salient-pole electromagnetic hybrid excitation generator is proposed. Firstly, an equivalent magnetic circuit model of the generator is established. Secondly, expressions are derived to describe the relationships between the dimensions of the salient-pole rotor and the permanent magnets and the generator’s no-load induced electromotive force, cogging torque, and air gap flux density. These expressions are then used to analyze the structural parameters that influence the generator’s performance. Thirdly, optimization targets are selected through sensitivity analysis, with the no-load induced electromotive force, cogging torque, and air gap flux density serving as the optimization objectives. A multi-objective genetic algorithm is employed to optimize these parameters and determine the optimal structural matching parameters for the generator. As a result, the optimized no-load induced electromotive force increased from 18.96 V to 20.14 V, representing a 6.22% improvement; the cogging torque decreased from 177.08 mN·m to 90.52 mN·m, a 48.88% reduction; the air gap flux density increased from 0.789 T to 0.829 T, a 5.07% improvement; and the air gap flux density waveform distortion rate decreased from 6.22% to 2.38%, a 39.3% reduction. Finally, a prototype is fabricated and experimentally tested, validating the accuracy of the simulation analysis, the feasibility of the optimization method, and the rationality of the generator design. Therefore, the proposed topology and optimization method can effectively enhance the output performance of the generator, providing a valuable theoretical reference for the design of hybrid excitation generators for vehicles.

1. Introduction

In recent years, the rapid development of the automotive industry has imposed higher standards and requirements on vehicle generators. Traditional silicon rectifier generators can no longer meet the demands of modern vehicle power systems. Although permanent magnet synchronous generators offer high efficiency and power density, they are limited in operating range and magnetic field regulation [1]. Hybrid excitation generators (HEGs), while retaining the low excitation loss and high power density of permanent magnet synchronous generators [2], incorporates an electro-excitation winding. This addresses the magnetic field regulation challenges of traditional permanent magnet synchronous generators and provides easy air gap magnetic field control, high power density, and a wide magnetic regulation range [3].
Based on the magnetic circuit relationships between the two excitation sources in existing HEGs, these generators can be categorized into three types of magnetic circuit structures: series-connected, parallel-connected, and hybrid-connected [4]. Among them, the parallel-type HEG exhibits strong magnetic field regulation capabilities. However, its topology and magnetic circuit design are more complex, which can lead to magnetic coupling issues between the two excitation sources [5]. Additionally, the introduction of additional air gaps can reduce the magnetic density in the generator’s air gaps and cause significant magnetic leakage [6,7]. In the parallel HEG, the permanent magnet field (PMF) and the electro excitation magnetic field (EEMF) are independent but interact in the air gap to form the main magnetic field. This structure requires separate designs for the permanent magnet and electro-excitation devices, which not only increases the size and weight of the generator but also complicates the manufacturing process [8]. In contrast, the series-connected HEG, which typically uses permanent magnets as the primary magnetic potential source and the electric excitation winding as the auxiliary source, achieves flexible adjustment of the air gap magnetic field by connecting these two sources in series to form a magnetic circuit [9]. The series-connected HEG retains the high power density of permanent magnet synchronous generators, allowing it to output higher power for the same volume and weight. Moreover, it features a simple structure, high space utilization, and operational efficiency, making it well-suited for applications in aerospace, electric vehicles, and ships [10,11].
Gu et al. [12,13] proposed an axially parallel hybrid excitation generator, which integrates a permanent magnet motor part, a magnetic field modulated motor part, and a diode rectifier. The permanent magnet motor part and magnetic field modulated motor part rotors are mounted on the same shaft, and their armature windings are connected in series. Although the axial shunt hybrid excitation generator can output higher power in a specific voltage boost region, the magnetic fields of the permanent magnet motor part and magnetic field modulated motor part are independent. Additionally, the large spacing between the two rotors increases the axial length and structural complexity of the generator, while also reducing the utilization of the stator silicon steel wafers. Hai et al. [14] investigated a parallel rotor hybrid excitation synchronous generator. This HEG structure comprises an AC exciter rotor, a Halbach permanent magnet rotor, a hidden-pole electro-excitation rotor, and a rotating rectifier bridge. In this configuration, the direct axes of the permanent magnet rotor and the electro-excitation rotor coincide and share a common stator winding. Yan and Geng’s team [15,16] investigated a new dual rotor hybrid excitation generator structure. This structure compactly arranges the permanent magnet rotor and the electro-excitation rotor on the same axis. The two excitation sources are connected in parallel to synthesize the magnetic field in the air gap. By sharing a common set of stator core and armature windings, the two rotors reduce the axial length requirement of the generator. Hu et al. [17] proposed a new parallel magnetic circuit hybrid excitation generator. This structure consists of two stator cores and two rotors. The magnetic potential under each pole of the permanent magnet rotor is supplied by a radial permanent magnet and two adjacent tangential permanent magnets. A claw-pole electro excitation rotor is mounted coaxially with the permanent magnet rotor. The radial permanent magnet and tangential permanent magnets provide the main air gap magnetic field, while the electro excitation rotor regulates the air gap magnetic field. Wang et al. [18] proposed a new type of hybrid excitation double salient pole motor. This motor features salient pole structures on both the stator and rotor, a simple rotor design, and the arrangement of excitation and armature windings on the stator, with permanent magnet (PM) built into the magnetic bridge. Although this design theoretically achieves higher power density, the overall size and weight of the machine are still large, and it lacks experimental validation. Wei et al. [19] introduced a parallel claw-pole hybrid excitation motor structure. In this design, the PMs are placed on the claw-pole rotor shaft, and an excitation support frame is added to the shaft to accommodate the excitation coils. While the excitation support frame fully utilizes the internal space of the claw-pole and improves the motor’s power density, it still suffers from uneven magnetic field distribution and low air gap magnetic density. Despite the parameter optimization, there is a lack of experimental evidence.
The existing salient pole HEG primarily relies on the EEMF, with the PMF as a supplementary source. This configuration results in high excitation losses and reduced generation efficiency, thereby diminishing the generator’s reliability [20,21,22]. Therefore, this paper proposes a new topology for an in-built permanent magnet and salient pole electromagnetic HEG. In this design, the PMF serves as the primary magnetic field, while the EEMF acts as an auxiliary source. The electric excitation winding and PM are integrated on the same rotor, which improves the spatial utilization of the HEG, reduces excitation losses, and lowers the risk of irreversible demagnetization under load conditions. By combining segmented PM with internal rotor slots [23] and deflecting the PM at both ends by a certain angle β, a U-shaped PM structure with strong magnetic concentration capabilities is formed. Based on this design, the structural parameters of the rotor and PM are optimized for multiple objectives to enhance the generator’s output characteristics. The rationality of the generator’s optimization design is verified through finite element simulations and prototype testing.

2. Structure and Working Principal Analysis of Hybrid Excitation Generator

2.1. Structure and Main Parameters of Hybrid Excitation Generator

To address the challenge of magnetic field adjustment in the salient pole built-in permanent magnet generator, excitation windings are installed on each salient pole. This design enhances space utilization within the generator. With the PMF as the primary source and the EEMF as the auxiliary source, it retains the high power density of the salient pole built-in permanent magnet generator while enabling flexible adjustment of the air gap magnetic field. In this paper, a 3-phase, 8-pole, 36-slot, double-layer fractional slot winding generator is designed. The structure is shown in Figure 1. According to the performance requirements of generators for vehicles, the main parameters of the built-in U-shaped permanent magnet and salient-pole electromagnetic hybrid excitation generator are determined using empirical formulas, as shown in Table 1.

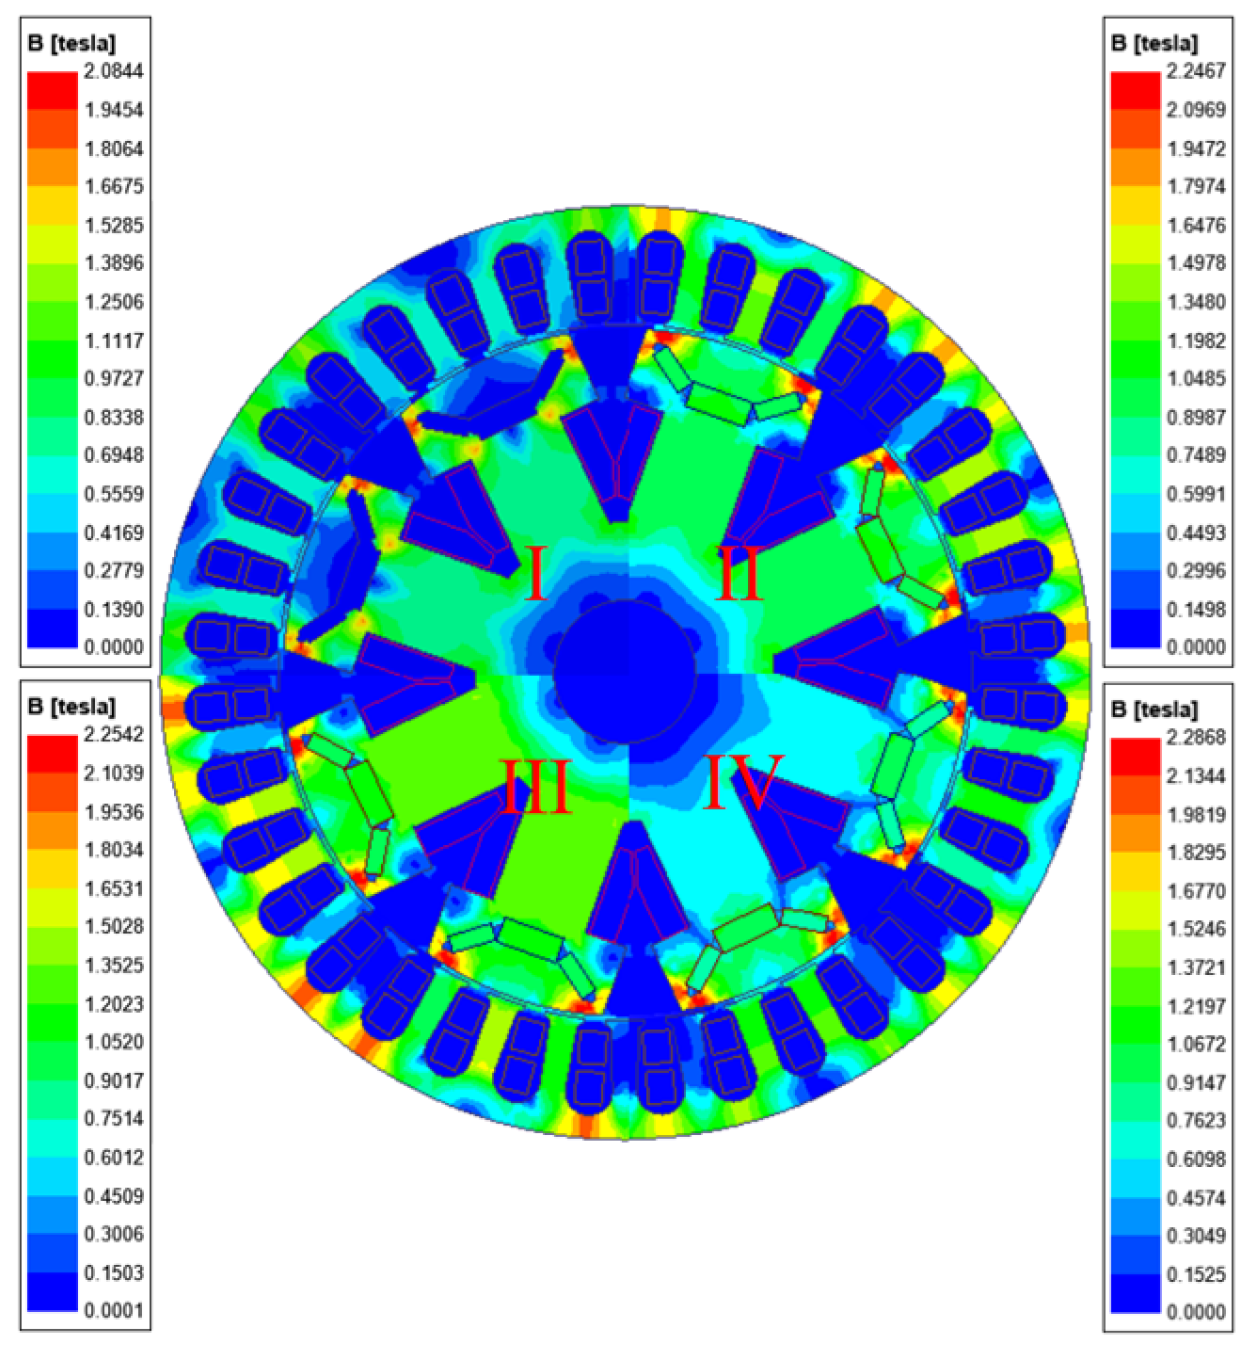
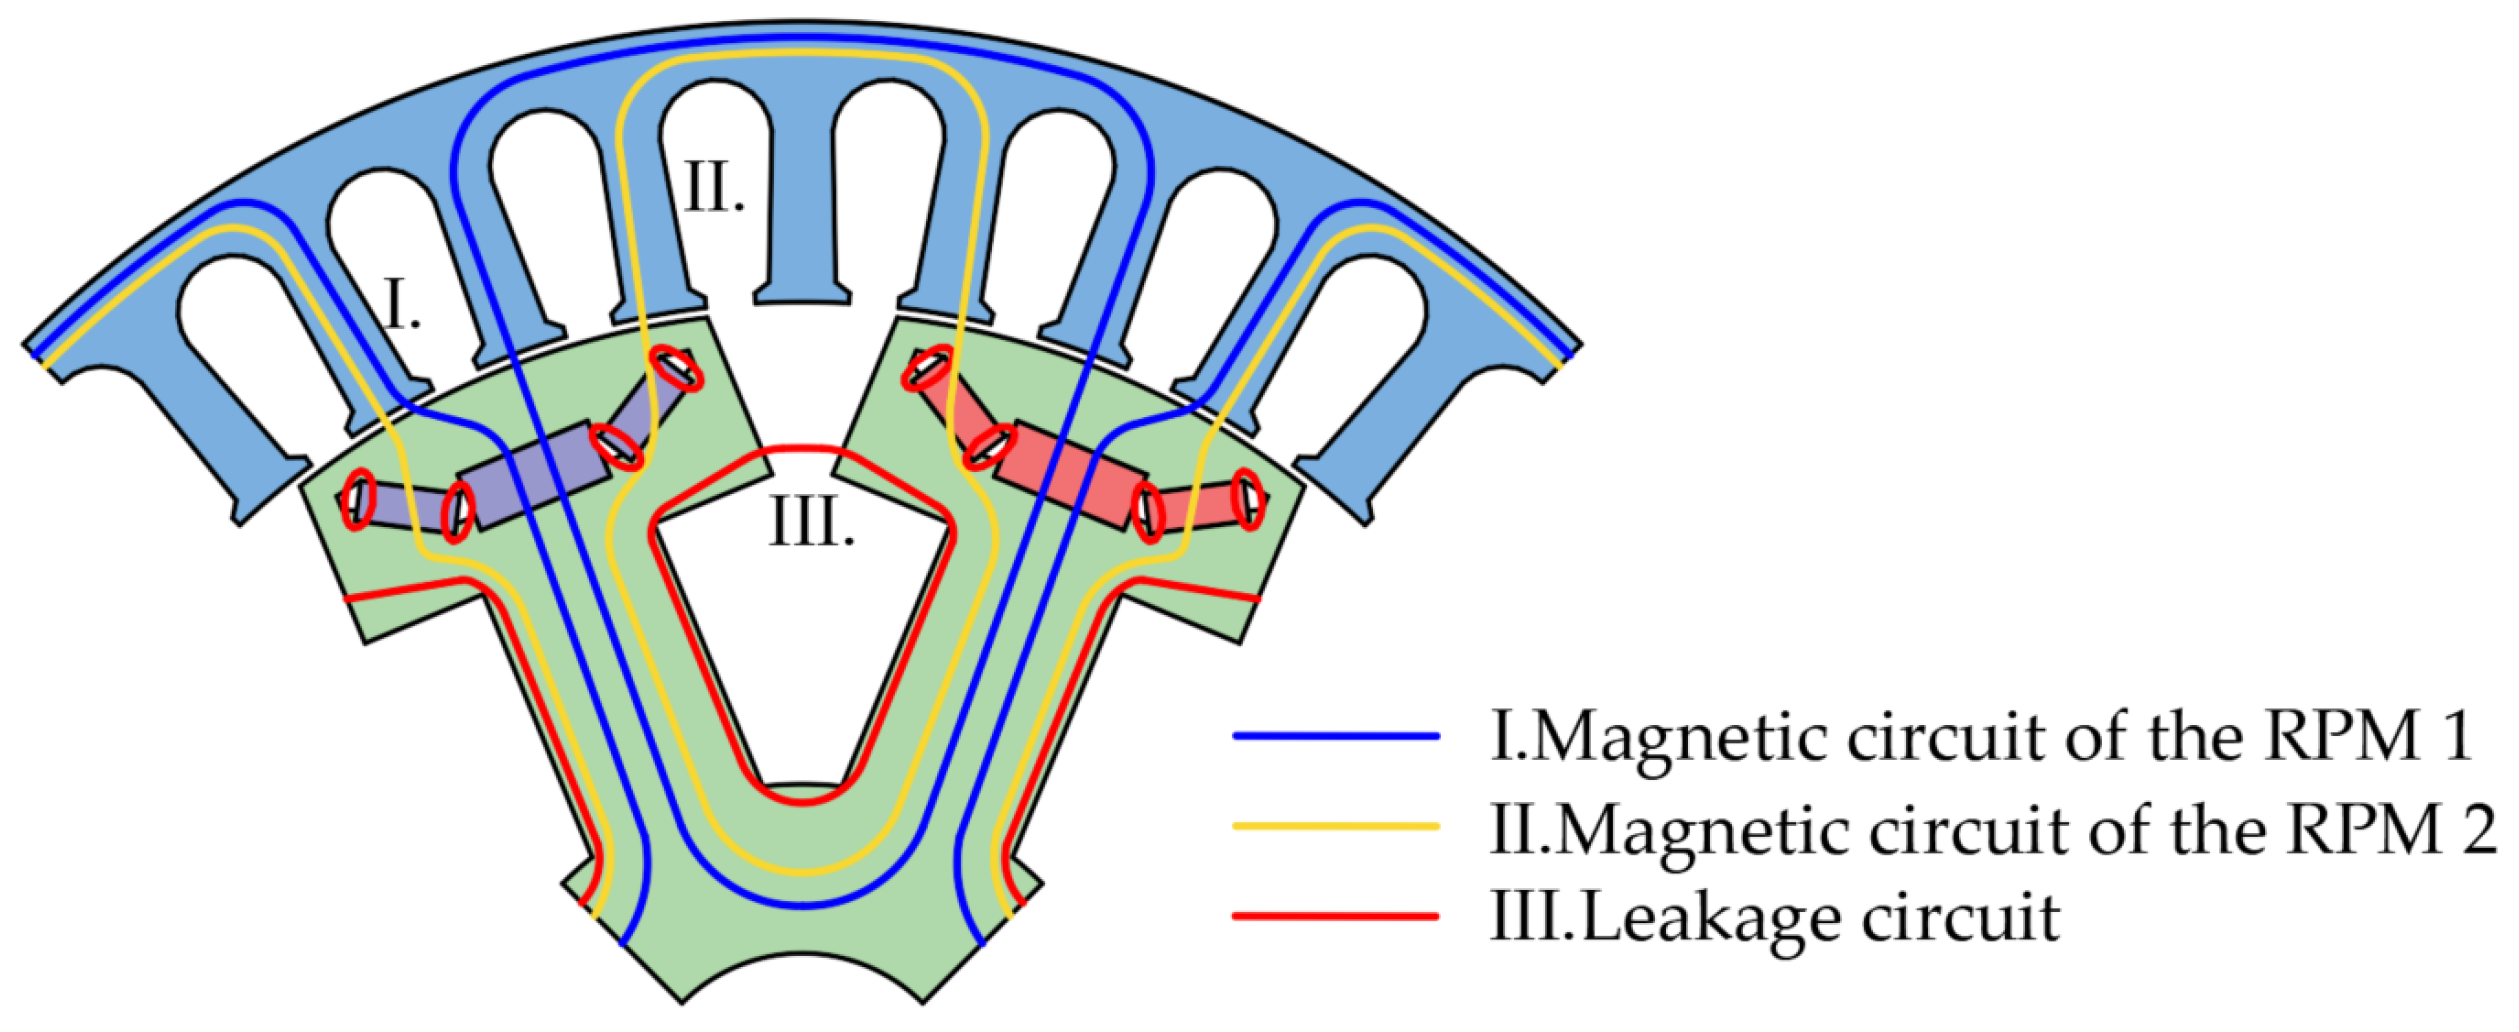
2.2. Magnetic Circuit Analysis of Hybrid Excitation Generator

A two-dimensional finite element model of the HEG is developed, and magnetic field simulations are conducted for the generator under various operating conditions, as illustrated in Figure 2. Region I shows the flux density distribution of the generator under pure electrical excitation with a 2 A current input. In this state, the flux density in the salient pole region ranges from 0.7 T to 0.83 T, indicating a relatively weak magnetic field. Region II presents the flux density distribution of the generator in the pure PM state. The flux density in the salient pole region is within the range of 0.9 to 1.05 T, which is higher than that in the pure electrical excitation state. Region III depicts the flux density distribution of the generator in the magnetically enhanced state with a 2 A current input. In this case, the direction of the PM field is aligned with that of the electrical excitation field, resulting in a stronger magnetic field. The flux density in the salient pole region ranges from 1.35 T to 1.5 T. Region IV illustrates the flux density distribution of the generator in the magnetically weakened state with a −2 A current input. Here, the direction of the PM field is opposite to that of the electrical excitation field, leading to a weaker magnetic field. The flux density in the salient pole region is between 0.6 T and 0.76 T. When a positive current is applied, the PM field and the electrically excited field add together, enhancing the overall magnetic field. Conversely, when a negative current is applied, the electrically excited field opposes the PM field, resulting in a weakened magnetic field. The above four situations indicate that this hybrid excitation generator has a relatively good magnetic field regulation capability.
The equivalent magnetic circuit method is employed to develop the mathematical model of the HEG. This model comprises two primary parallel magnetic circuits, as illustrated in Figure 3. Specifically, magnetic circuit I forms a closed loop from the S pole of rectangular permanent magnet 1 (RPM1) to the salient pole body, then to the N pole of RPM1, through the salient pole shoes, across the air gap, through the stator core, back across the air gap, through the salient pole shoes, and finally returns to the S pole of RPM1. Similarly, magnetic circuit II forms a closed loop from the S pole of rectangular permanent magnet 2 (RPM2) to the salient pole body, then to the N pole of RPM2, through the salient pole shoes, across the air gap, through the stator core, back across the air gap, through the salient pole shoes, and finally returns to the S pole of RPM2.

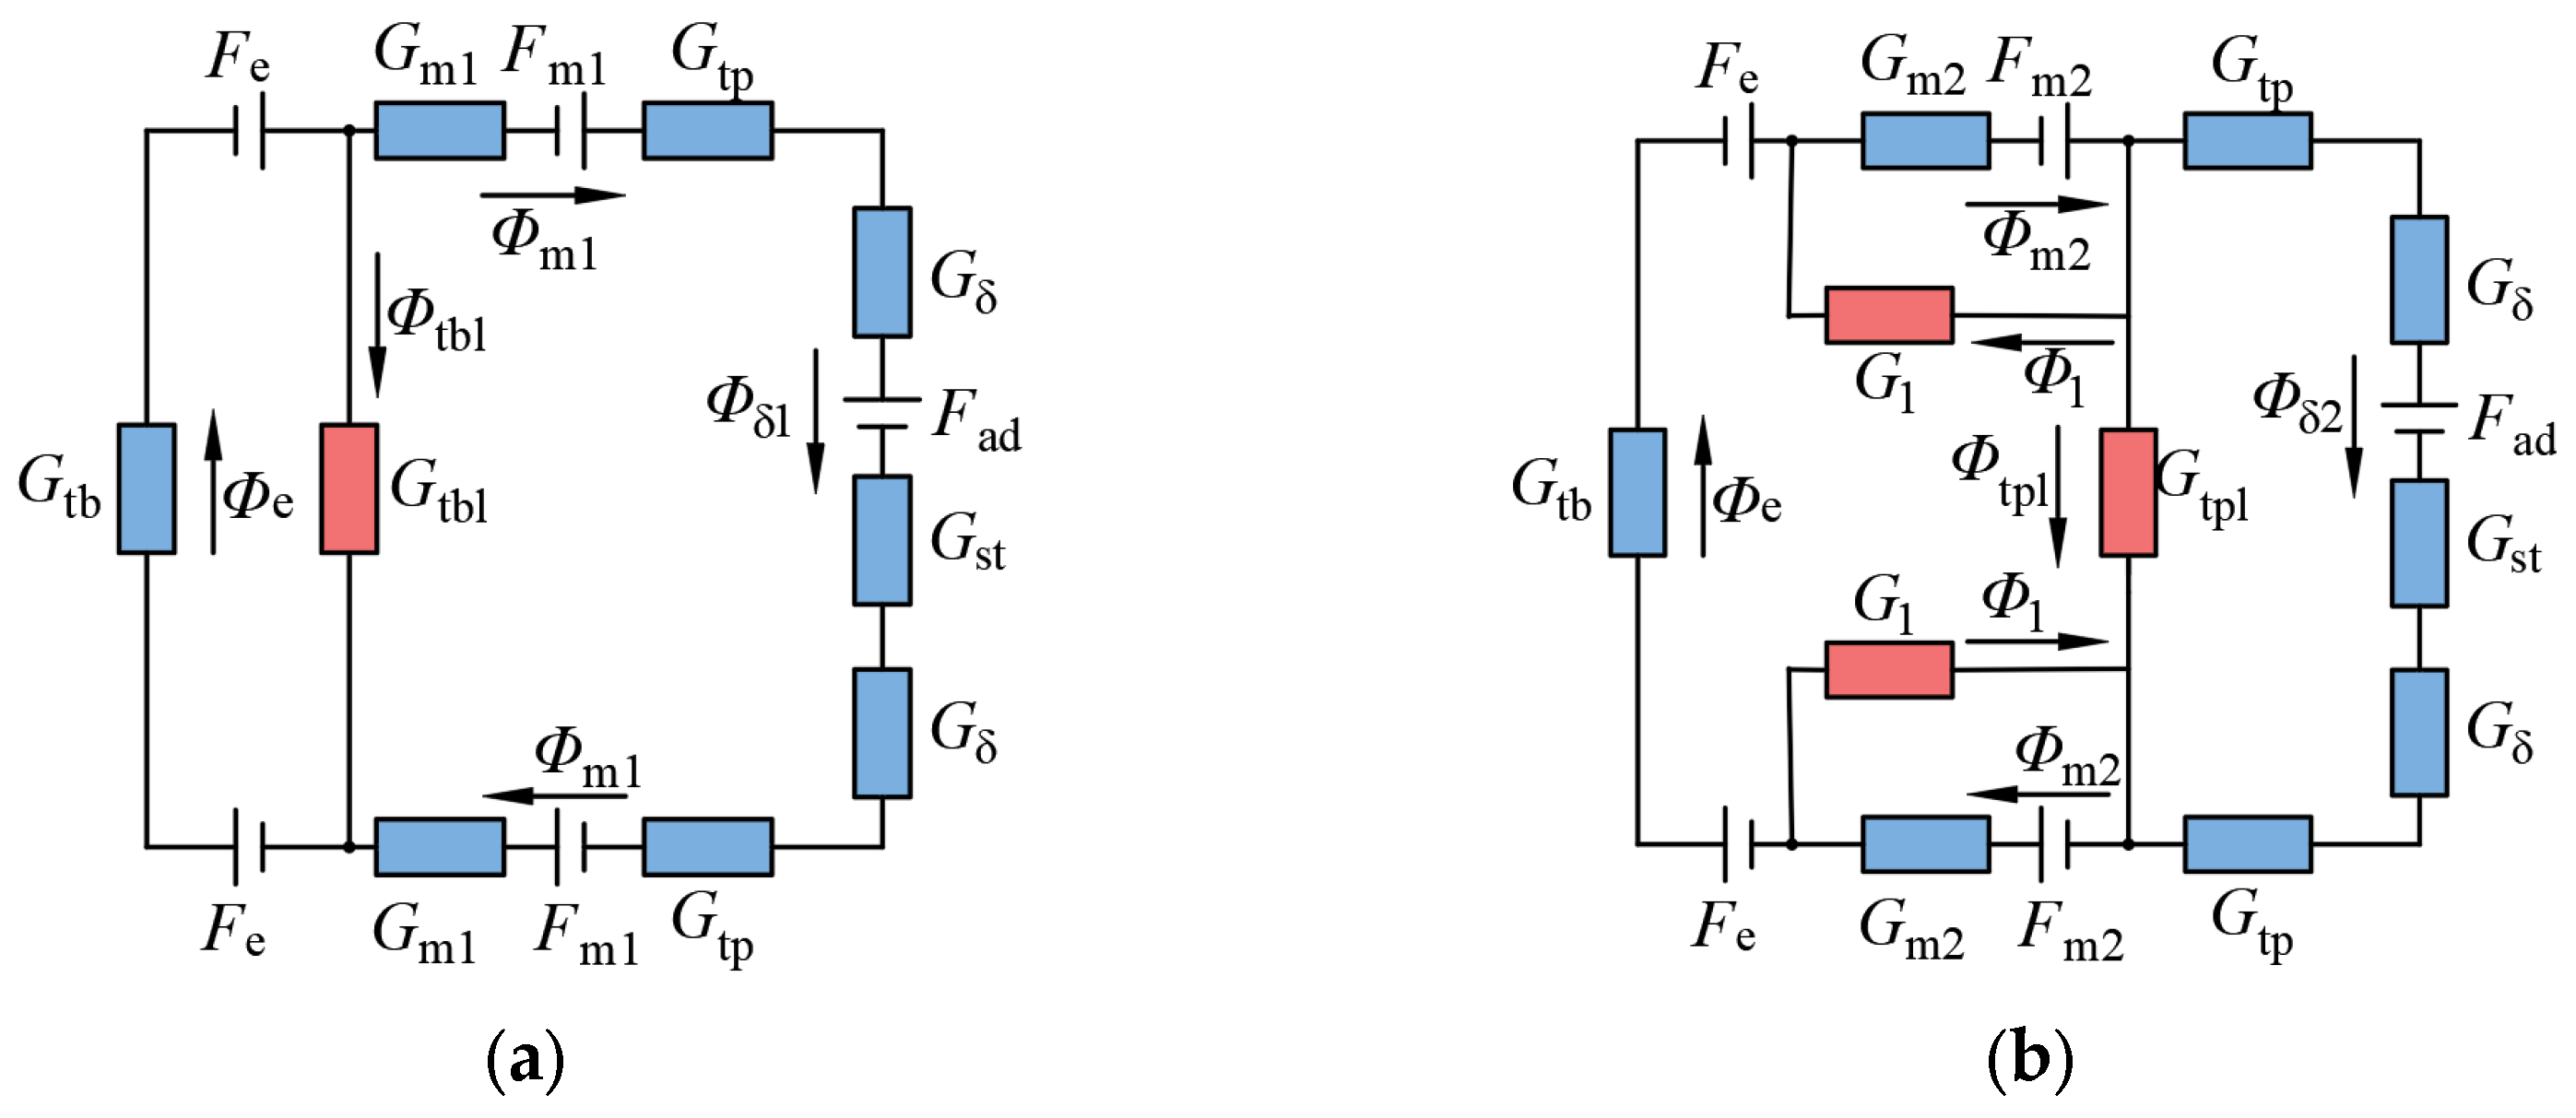
2.3. Analysis of Hybrid Excitation Generator Structural Parameters Based on the Equivalent Magnetic Circuit Method

From the magnetic circuit trend analysis in Figure 3, it can be observed that this generator is mainly composed of two main magnetic circuits. Thus, based on the magnetic circuit trend, the equivalent magnetic circuit models of RPM1 and RPM2 can be established respectively, as shown in Figure 4.
In Figure 4, Fad, Fm1, Fm2, and Fe represent the magnetomotive force of the armature windings, RPM1, RPM2, and the electro-excitation windings, respectively. Φδ1 and Φδ2 denote the effective fluxes across the air gap provided by each pair of poles, RPM1 and RPM2, respectively. Φm1 and Φm2 are the fluxes provided by each pair of poles, RPM1 and RPM2, respectively. Φe represents the flux provided by the electro-excitation windings. Φtbl and Φtpl are the leakage fluxes between the pole bodies and the pole boots of each pair of poles, respectively. Φ1 is the end leakage flux of RPM2. Gm1 and Gm2 are the equivalent permeabilities of RPM1 and RPM2, respectively. Gtp and Gtb are the equivalent permeabilities of the pole shoe and pole body of the salient poles, respectively. Gtpl and Gtbl are the leakage permeabilities of the pole shoe and pole body, respectively. Gδ is the equivalent permeability of the air gap. Gst is the equivalent permeability of the stator. G1 is the end leakage permeability of RPM2.
Based on Kirchhoff’s and Ohm’s laws, the following system of flux equations is established:
Φ e = Φ tbl + Φ ml Φ e 1 G tb + 2 F e Φ tbl 1 G tbl = 0 2 Φ ml 1 G ml + 1 G tp + 2 F ml + Φ δ 1 2 G δ + 1 G st F ad Φ tbl 1 G tbl = 0
Φ m 2 = Φ e + Φ tpl Φ m 2 = Φ tpl + Φ 1 + Φ δ 2 Φ e 1 G tb 2 Φ 1 1 G 1 + Φ tpl 1 G tpl + 2 F m 2 = 0 Φ δ 2 2 G tb + 2 G δ + 1 G st Φ tpl 1 G tpl F ad = 0 Φ m 2 1 G m 2 + Φ 1 1 G 1 + F m 2 = 0
The magnetomotive forces of RPM1 and RPM2 can be expressed as:
F m 1 = B m h 1 μ 0 μ m F m 2 = B m h 2 μ 0 μ m
where Bm is the residual magnetic induction of the PM, h1 and h2 are the thicknesses of RPM1 and RPM2, respectively, μ0 is the vacuum permeability, and μm is the permeability of the PM.
The magnetic permeability of the RPM1, RPM2, salient pole boots, and pole bodies can be expressed as:
G m 1 = μ 0 μ m b 1 l ef h 1 G m 2 = μ 0 μ m b 2 l ef h 2 G tp = μ r μ m w s l ef h s G tb = μ r μ m w b l ef h b
where b1 and b2 are the widths of RPM1 and RPM2, respectively, lef is the axial length of the rotor, ws is the width of the salient pole boot, hs is the height of the salient pole boot, wb is the width of the salient pole body, and hb is the height of the salient pole body.
The leakage permeability between the pole body and pole shoe of RPM2 and the two adjacent bumps can be expressed as:
G 1 = μ m μ 0 ( 2 π r m h 2 ) l ef h 2 G tpl = μ m μ 0 l s l ef h s G tbl = μ m μ 0 l b l ef h b
where rm is the radius of the leakage path of RPM2, ls is the length of the leakage path of the salient pole boot, and lb is the length of the leakage path of the salient pole body.
The effective total magnetic flux through the air gap can be expressed as:
Φ δ = Φ δ 1 + Φ δ 2 = ( F ad G tpl + Φ tpl ) ( 2 G st + G δ ) G tb G δ G st G tbl G ml G tp + F ad G tpl + Φ tbl G ml G tp 2 Φ ml G tbl ( G tp + G ml ) ( 2 G δ G st + 2 G tb G st + G tb G δ ) ( 2 G δ G st + 2 G tb G st + G tb G δ ) ( 2 G st + G δ ) G tpl G tbl G ml G tp
The no-load induced electromotive force of the generator can be expressed as:
E = 4.44   f N s K dp K Φ Φ δ
where f is the frequency, Ns is the number of armature winding turns, Kdp is the winding factor, and KΦ is the waveform factor of the air gap flux.
Substituting Formula (6) into Formula (7) gives:
E = 4.44   f N s K dp K Φ ( F ad G tpl + Φ tpl ) ( 2 G st + G δ ) G tb G δ G st G tbl G ml G tp + F ad G tpl + Φ tbl G ml G tp 2 Φ ml G tbl ( G tp + G ml ) ( 2 G δ G st + 2 G tb G st + G tb G δ ) ( 2 G δ G st + 2 G tb G st + G tb G δ ) ( 2 G st + G δ ) G tpl G tbl G ml G tp
The magnetic flux density in generator air gap can be expressed as:
B r = Φ δ × 10 4 α p τ l ef
where αp is the pole arc coefficient, taken as 0.87 in this paper, and τ is the pole pitch, taken as 31.8 mm.
Substituting Formula (6) into Formula (9) gives:
B r = ( F ad G tpl + Φ tpl ) ( 2 G st + G δ ) G tb G δ G st G tbl G ml G tp + F ad G tpl + Φ tbl G ml G tp 2 Φ ml G tbl ( G tp + G ml ) ( 2 G δ G st + 2 G tb G st + G tb G δ ) × 10 4 α p τ l ef ( 2 G δ G st + 2 G tb G st + G tb G δ ) ( 2 G st + G δ ) G tpl G tbl G ml G tp
Cogging torque is a critical factor that influences the performance of permanent magnet generators. The tangential component fluctuation of the interaction force between the built-in U-shaped permanent magnet and the salient pole electromagnetic hybrid excitation generator’s PM and armature core, when not energized, causes cogging torque. This leads to torque fluctuations that induce vibration and noise, affecting the comfort of the car during driving. Assuming that the magnetic permeability of the generator armature core is infinite and neglecting core magnetic saturation and leakage, the magnetic field energy storage can be approximated as the energy stored in the air gap. The cogging torque of the generator can be expressed as:
T cog = W α = 1 α V B r 2 2 μ 0 d V
where W is the internal energy stored in the magnetic field, and α is the relative position angle between the generator stator and rotor.
Substituting Formula (10) into Formula (11) gives:
T cog = 1 α V ( F ad G tpl + Φ tpl ) ( 2 G st + G δ ) G tb G δ G st G tbl G ml G tp + F ad G tpl + Φ tbl G ml G tp 2 Φ ml G tbl ( G tp + G ml ) ( 2 G δ G st + 2 G tb G st + G tb G δ ) 2 × 10 8 2 μ 0 α p τ l ef ( 2 G δ G st + 2 G tb G st + G tb G δ ) ( 2 G st + G δ ) G tpl G tbl G ml G tp 2 d V

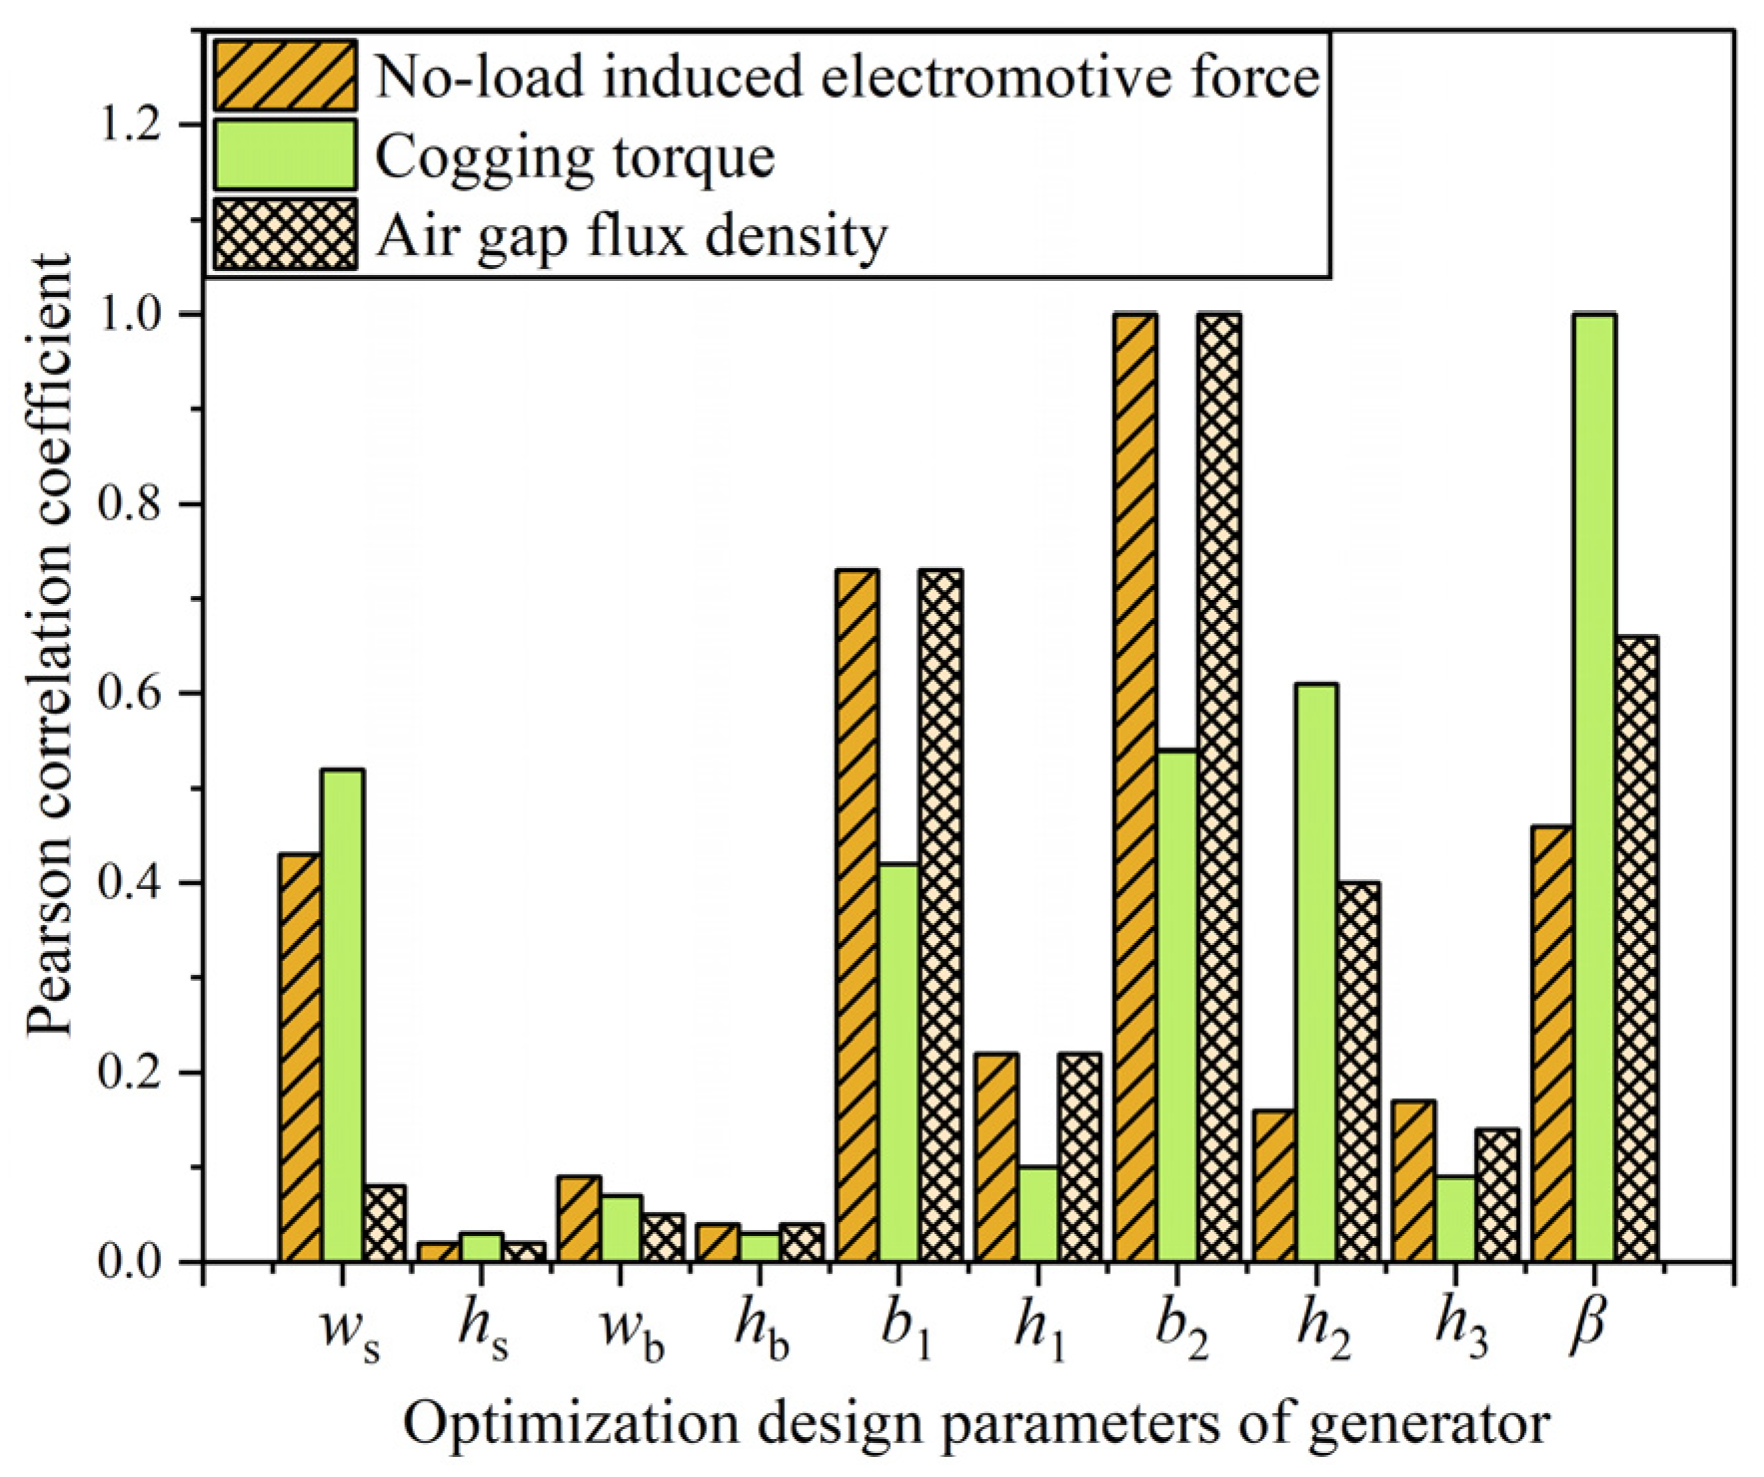
3. Optimization of Parameter Sensitivity Analysis

It can be derived from the above formula that the main factors affecting the no-load induced electromotive force, cogging torque, and air gap flux density are the thickness h1 and width b1 of RPM1, the thickness h2, width b2, and deflection angle β of RPM2, the width ws and height hs of the salient pole shoe, the width wb and height hb of the salient pole body, and the built-in depth h3 of the PM. For HEGs with built-in combination poles, the built-in depth h3 is also a key factor influencing the generator’s performance [24]. The design variable structure is depicted in Figure 5. To ensure that the manufacturing process of the generator meets the strength requirements and spatial constraints during operation, the range of variations for the generator’s salient pole rotor and permanent magnet parameters is determined, as shown in Table 2.
If an agent model is used directly to establish the relationship between variables and optimization objectives, there will be issues with insufficient fitting accuracy and the potential to overlook variables with low sensitivity [25,26]. The number of initial optimization parameters in this paper is as high as 10, which significantly increases the number of samples required for multi-objective optimization. To reduce the computational time and cost while ensuring the accuracy of the calculations, a sensitivity analysis of the 10 design parameters is conducted before the multi-objective optimization.
In order to simplify the design space, this paper combines the Latin hypercube sampling method with finite element simulation to generate a dataset comprising 149 sets of design variables and their corresponding optimization objectives. The Pearson correlation coefficient is introduced to assess the correlation between variables, thereby optimizing the design process. The mathematical expression for the Pearson correlation coefficient is as follows:
r x , y = n i = 1 n x i y i i = 1 n x i i = 1 n y i n i = 1 n x i 2 i = 1 n x i 2 n i = 1 n y i 2 i = 1 n y i 2
where xi is the design parameter, yi is the optimization objective, and n is the number of samples. Based on Equation (13) and a dataset comprising 149 sample points, the Pearson correlation coefficients between each design parameter and optimization objective are calculated, as illustrated in Figure 6. These coefficients serve as the basis for subsequent sensitivity analysis, facilitating the identification of high-impact design parameters.
As shown in Figure 6, the parameters with a significant impact on the no-load induced electromotive force include ws, b1, b2, and β; those influencing the cogging torque are ws, b2, h2, and β; and those affecting the air gap flux density are b1, b2, h2, and β. Since different design parameters have varying degrees of influence on each optimization objective, the sensitivity of each design parameter must be calculated to comprehensively consider each optimization objective. The formula is:
S ( x i ) = w EMF S EMF x i + w Tcog S Tcog x i + w Br S Br x i
w EMF + w Tcog + w Br = 1
where SEMF(xi), STcog(xi), and SBr(xi) are the Pearson correlation coefficients of the no-load induced electromotive force, cogging torque, and air gap flux density, respectively. wEMF, wTcog, and wBr are the weighting coefficients corresponding to the three optimization objectives, respectively.
In the HEG, the air gap flux density has the most significant effect on the generator’s performance. Therefore, the weighting coefficients wEMF, wTcog, and wBr are set to 0.25, 0.25, and 0.5, respectively. The integrated sensitivity index is calculated based on Formulas (14) and (15), using the Pearson correlation coefficients of the design parameters listed in Table 3. The results are presented in Table 3.
Based on the analysis of the comprehensive sensitivity index shown in Table 3, the optimization parameters that have a greater impact on the optimization objective are selected. The optimization parameters with a sensitivity greater than 0.5 are defined as important factors, specifically the width b1 of RPM1, the width b2 of RPM2, and the deflection angle β of RPM2, are selected for further analysis, and those with a sensitivity less than 0.5 are defined as secondary factors. According to the sensitivity of the parameters, the optimal solution of the important factors is determined by the response surface method in the following text. The secondary factors determine the optimal solution through the finite element method in the following text.

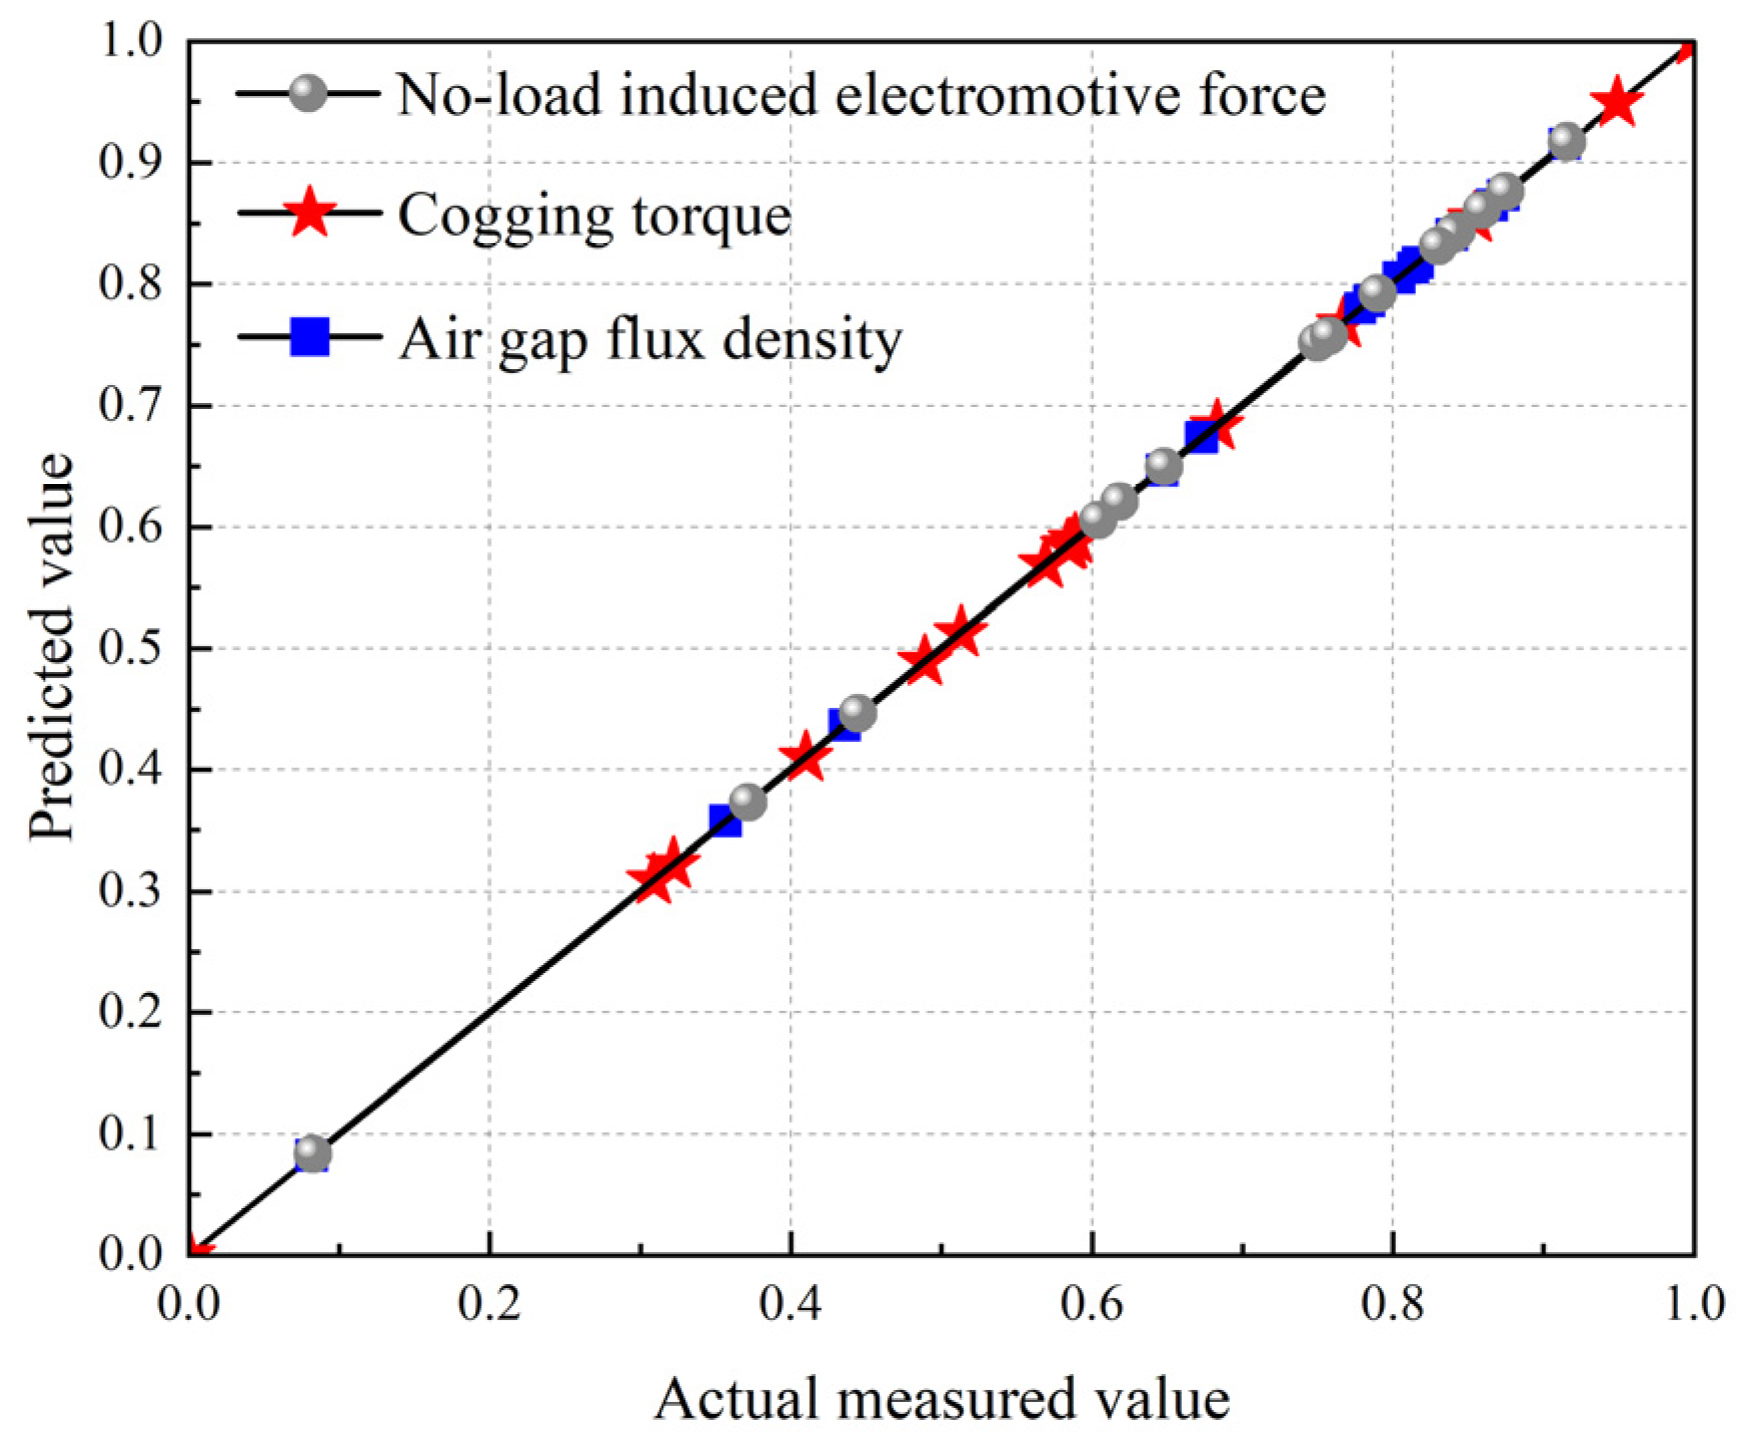
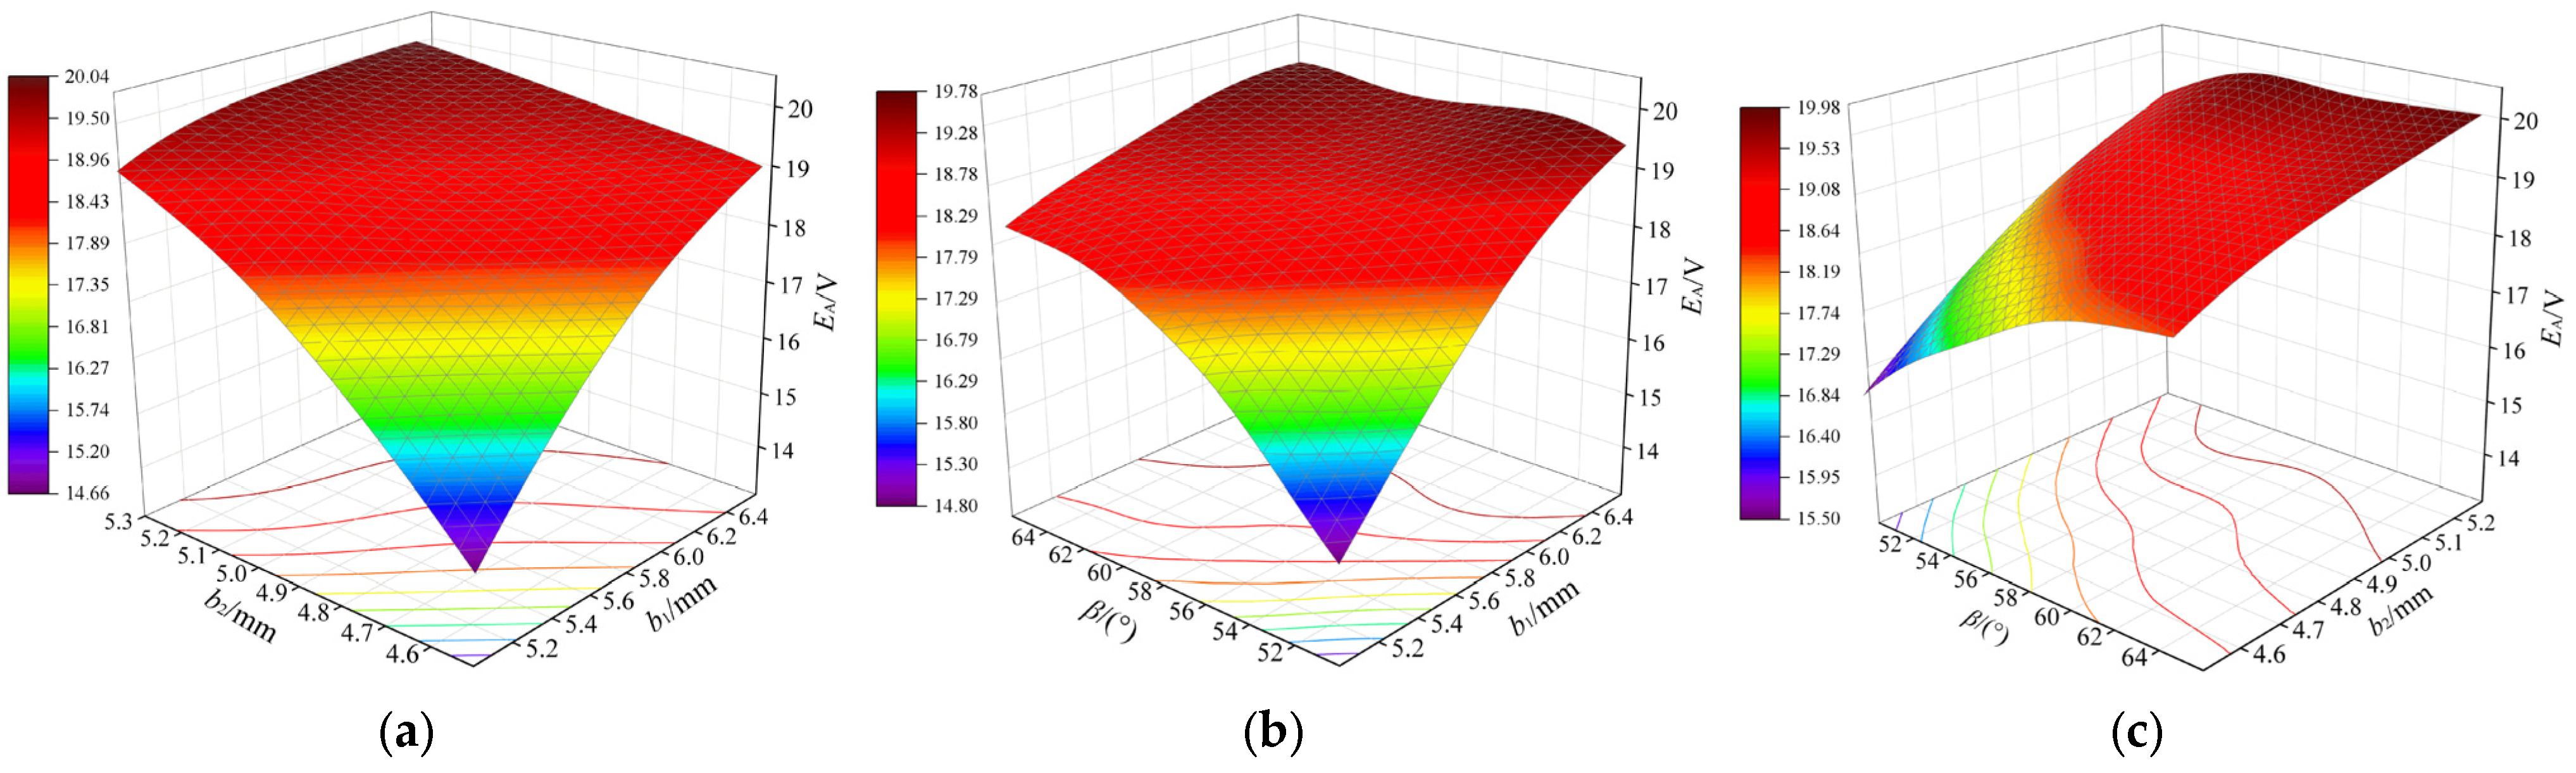
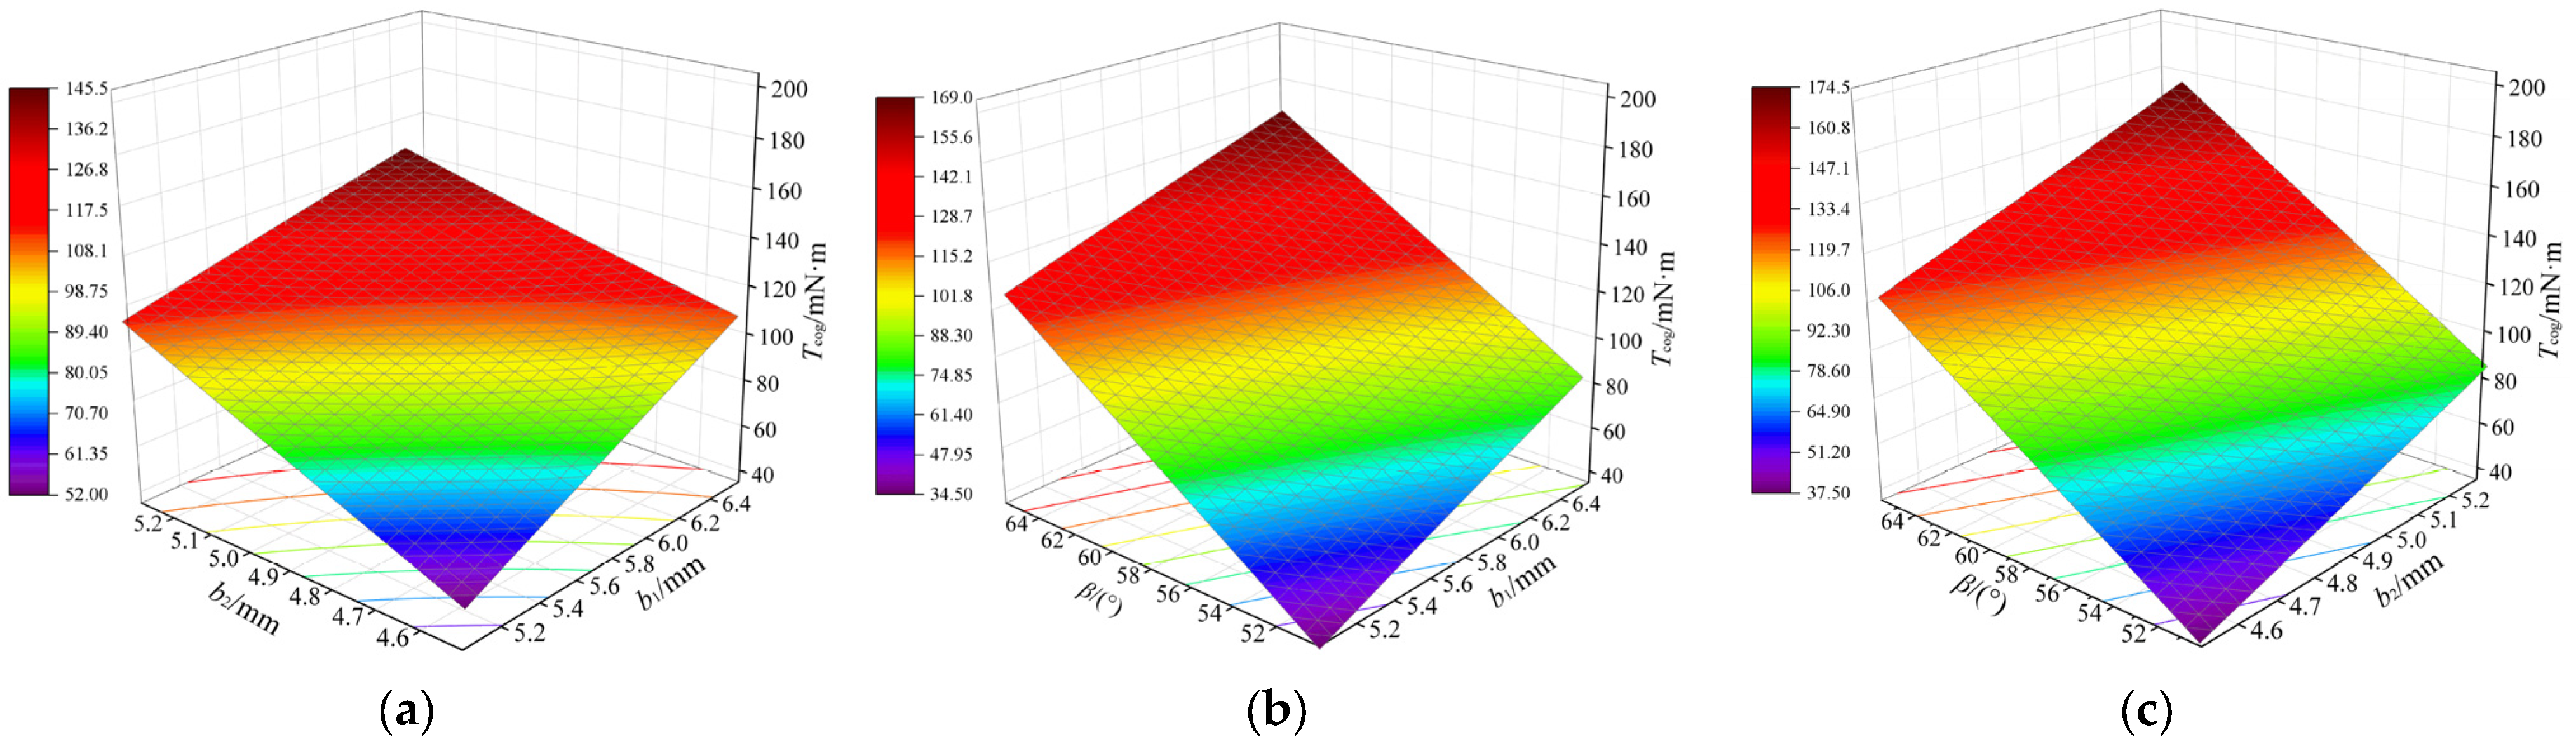
4. Establishment and Analysis of Response Surface Model

Based on the results of the sensitivity analysis, three optimized structural parameters and three optimization objectives with significant impacts—A-phase no-load induced electromotive force EA, cogging torque Tcog, and air gap flux density Br—are selected for further optimization. The mathematical relationships between the optimization parameters and the optimization objectives are complex and intricate, making traditional functional relationship solving methods impractical. Evaluating the effects of different structural parameters on generator performance using finite element simulation in the subsequent optimization process would be time-consuming. To simplify the problem model, reduce computational effort, and enhance optimization efficiency, a proxy model is constructed to approximate the relationship between the optimization variables and the optimization objectives.
The response surface model is a statistically based model constructed through regression analysis of experimental data. It employs polynomial functions to map the relationship between optimization variables and the optimization objective. This model is particularly suitable for addressing nonlinear problems and is highly effective in solving generator optimization problems. By leveraging the response surface model, parameter optimization can be conducted more efficiently, thereby enhancing the performance of the generator. The specific mathematical form of the response surface model is:
Y = γ 0 + i = 1 K γ i X i + i = 1 K γ i i X i 2 + i = 1 K 1 j = i + 1 K γ i j X i X j + ε
where γ is the regression model coefficient, Xi is the design variable, and ε is the error term.
Using Latin hypercube sampling and central composite design sampling, 15 sets of important parameter combinations for the optimized design variables are extracted. The corresponding generator performance data are obtained using a finite element simulation. The results are presented in Table 4.
Due to the deviation between parametric modeling and actual generator operation, it is essential to validate the accuracy of the response surface model. This validation process is crucial for ensuring the model’s credibility and accuracy. The coefficient of determination, R2, is a statistical measure that evaluates the fit between the experimental model and the actual generator. An R2 value closer to 1 indicates a better fit, thereby more accurately reflecting the generator’s actual performance. The expression for calculating R2 is as follows:
R 2 = 1 i = 1 N P i P ^ i 2 i = 1 N P i P ¯ i 2
where Pi is the actual response value, P i ^ is the predicted response value, P i ¯ is the mean value, and N is the total number of experiments. The predicted and actual values are normalized, as shown in Figure 7.
The coefficients of determination (R2) for the response surface model with respect to EA, Tcog, and Br are calculated using Formula (17) and are found to be R E A 2 = 0.9856 , R T cog 2 = 0.9767 , and R B r 2 = 0.9967 , respectively. In summary, the experimentally designed response surface model exhibits high prediction accuracy.
From Figure 8, Figure 9 and Figure 10, it is evident that increasing the width of RPM1 (b1), the width of RPM2 (b2), and the deflection angle (β) enhances EA and Br to their maximum values. However, this also leads to an increase in Tcog. When the optimization parameters exceed a certain range, EA and Br exhibit a decreasing trend, while Tcog decreases again. Different parameter combinations have varying impacts on EA, Tcog, and Br. Therefore, in the design and optimization process, the effects of these parameters must be considered comprehensively to achieve optimal results.

5. Multi-Objective Optimization and Simulation Verification

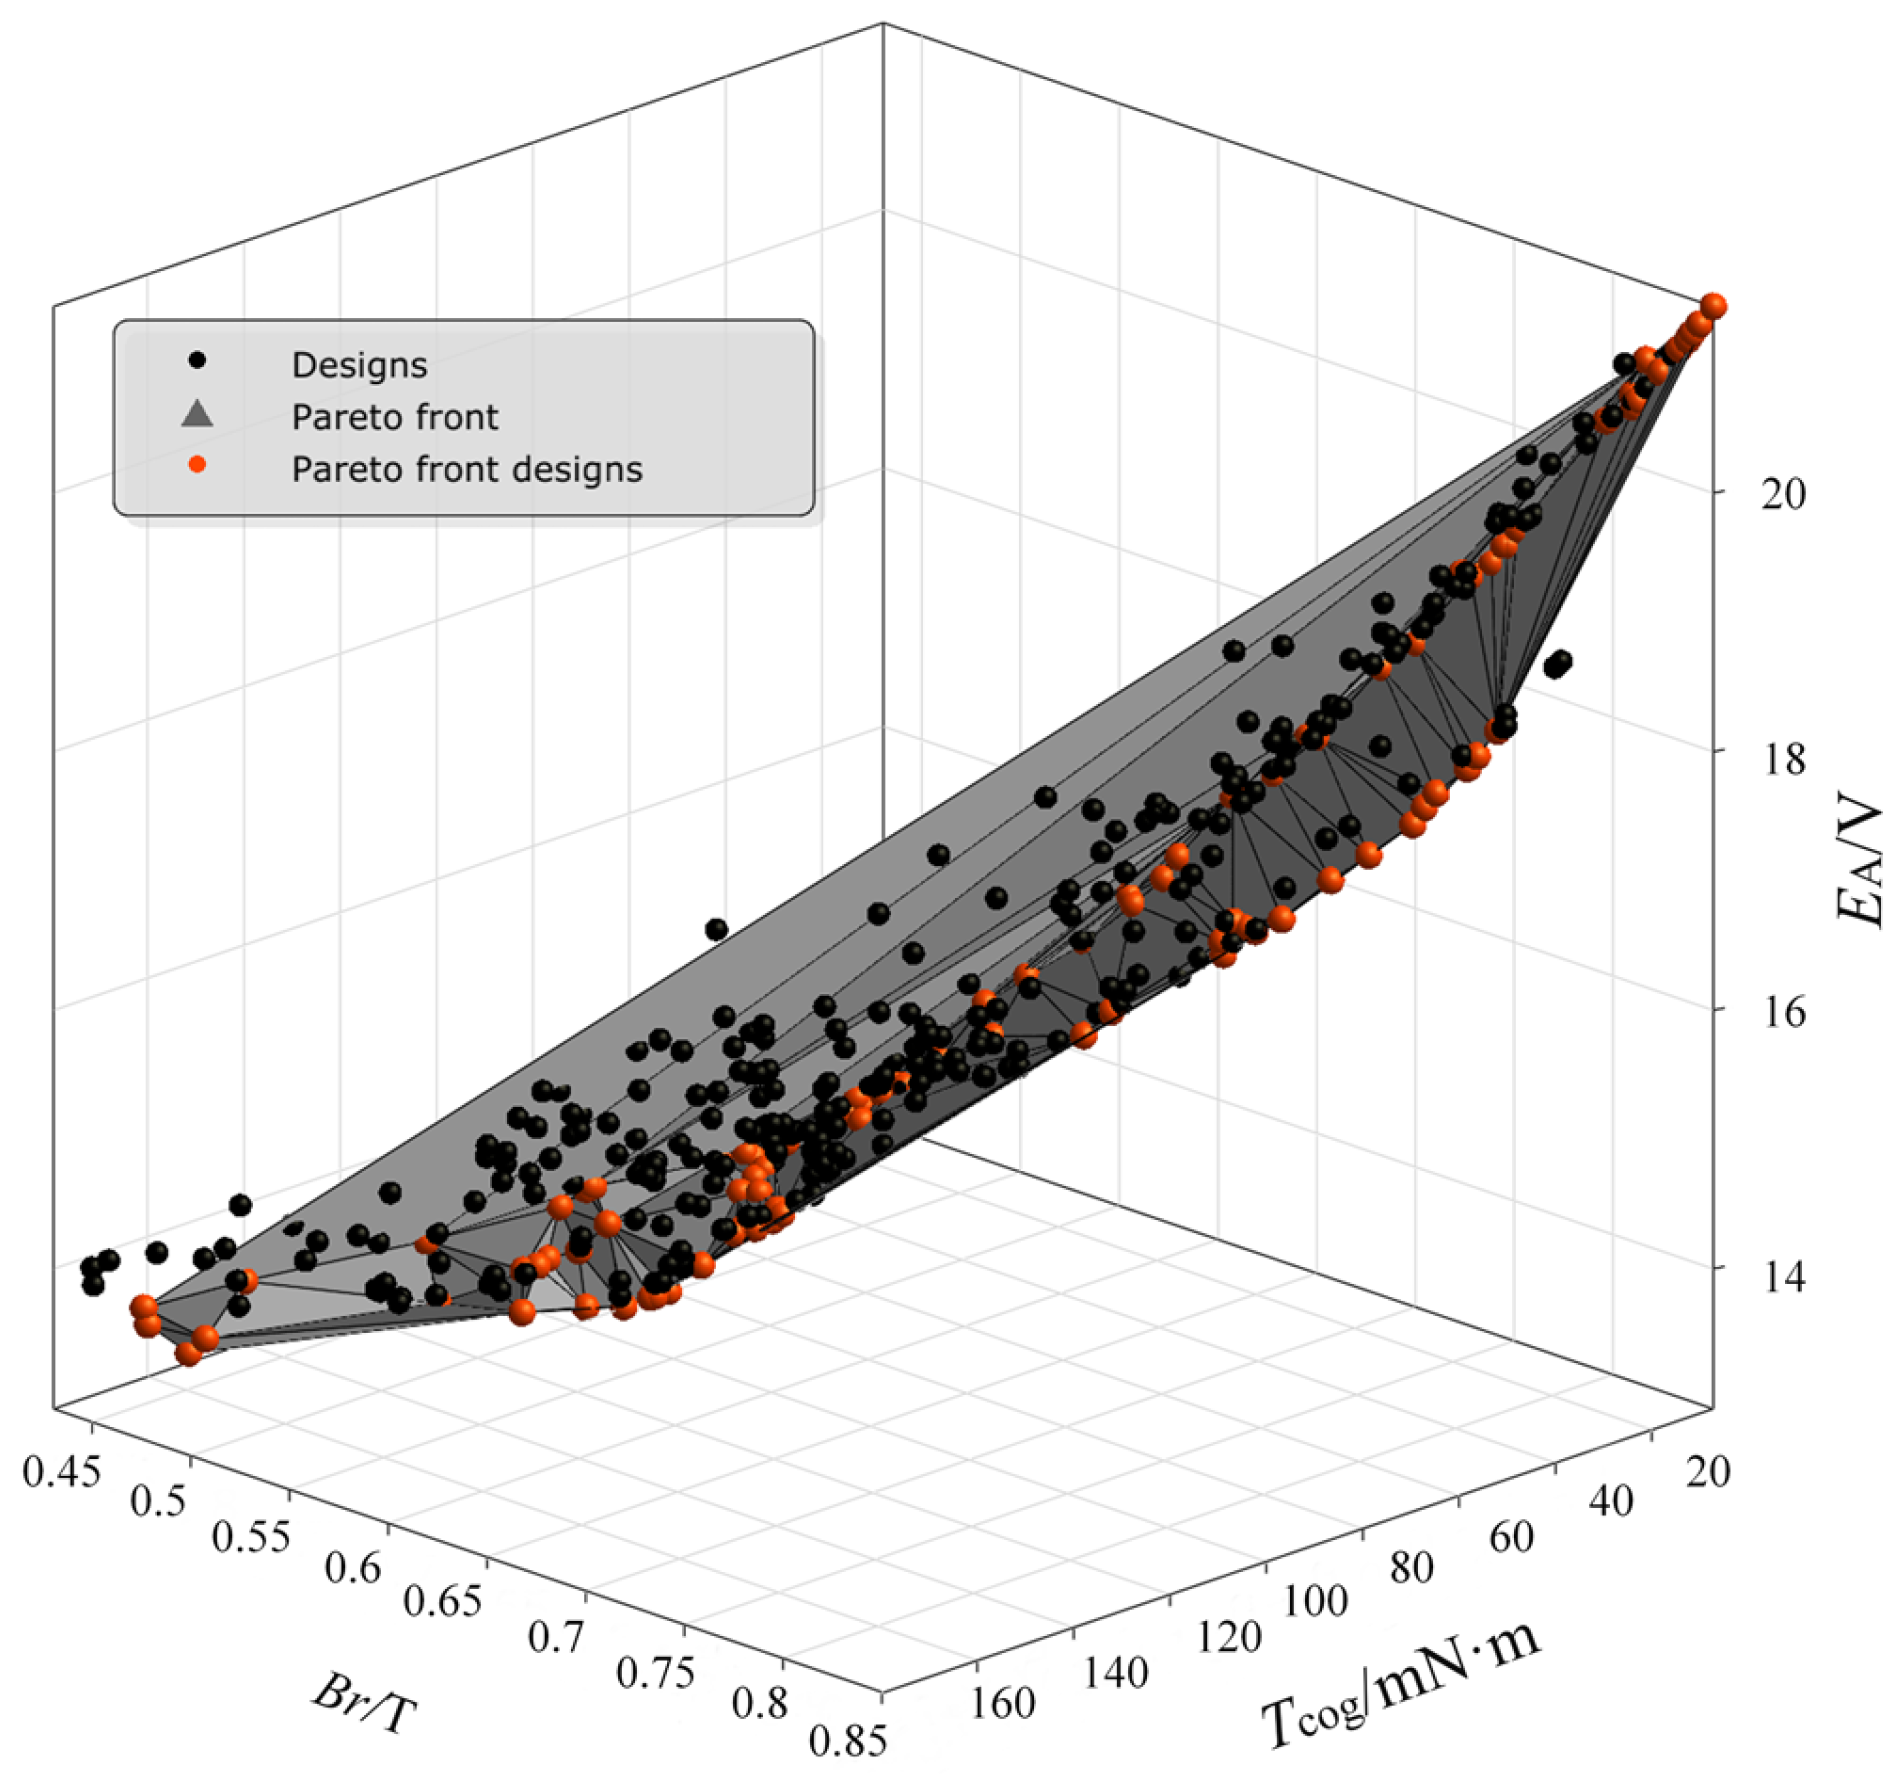
5.1. Multi-Objective Optimization

Since the fitted plots of the design variables and response values can only reflect the influence of two parameters on the response values and cannot intuitively derive the PM structural parameters under the optimal solutions for EA, Tcog, and Br, further optimization is conducted on the results of the best predictive meta-model adaptive sampling algorithm. This process aims to elucidate the impact of the design variables on the characteristics of the response values. Adaptive genetic algorithms are employed to determine the PM structural parameters under the relatively optimal solutions for EA, Tcog, and Br.
From the derivation of the above formula, it is evident that each structural parameter of the generator is not independent. The interconnection between each parameter has a complex and variable impact on the generator’s performance. Finite element simulation is utilized to investigate the effects of various PM structural parameters on generator performance, with the goal of maximizing EA and Br, while minimizing Tcog. The mathematical models for these three optimization objectives are presented as follows:
max E A x 1 , x 2 , x m min T cog x 1 , x 2 , x m max B r x 1 , x 2 , x m
This paper selects three parameters for simultaneous optimization. To improve work efficiency and reduce computation time, an adaptive genetic algorithm is used to adjust the variance and crossover factors, with the sample size set at 500. The crossover probability and variance probability are adaptively adjusted to generate a 3D distribution of the Pareto front, which includes 386 effective sample points of the optimized model, as shown in Figure 11. In the figure, the x, y, and z axes represent Br, Tcog, and EA, respectively. Red points indicate effective sample points that satisfy the constraints, while black points represent sample points that do not meet the constraints. The gray triangle depicts the irregular surface domain of the Pareto front. The input variables of the relative optimal solution are located on the Pareto front surface. Table 5 presents some optimal solution sample points from the Pareto front distribution chart.
Based on the above analysis, to determine the optimal solution from the Pareto front distribution graph, the value of the parameter matching coefficient k must be defined. A larger value of k indicates better generator performance. Therefore, the three optimization objectives are assigned to the following expression:
k = Q 1 E A x 1 , x 2 , x m E A 0 Q 2 T cog x 1 , x 2 , x m T cog 0 + Q 3 B r x 1 , x 2 , x m B r 0
where Q1, Q2, and Q3 denote the weighted scale factors. Specifically, Q1 is assigned 0.4, Q2 is assigned 0.3, and Q3 is assigned 0.6. EA0 is 18.96 V, representing the no-load induced electromotive force in phase A before optimization. Tcog0 is 177.08 mN·m, indicating the generator cogging torque before optimization. Br0 is 0.789 T, representing the generator air gap flux density before optimization.
Based on the evaluation function derived from the above weighted assignment method and considering the optimization magnitude of EA, Tcog, and Br, the optimal solution is selected from the Pareto front. The results are verified by simulation, and the value of k is obtained according to the parameter matching coefficient formula, as shown in Figure 12. According to the optimization objective conditions, sample point 111 is identified as the relatively optimal solution for model optimization. A comparison of generator structural parameters before and after optimization is presented in Table 6.

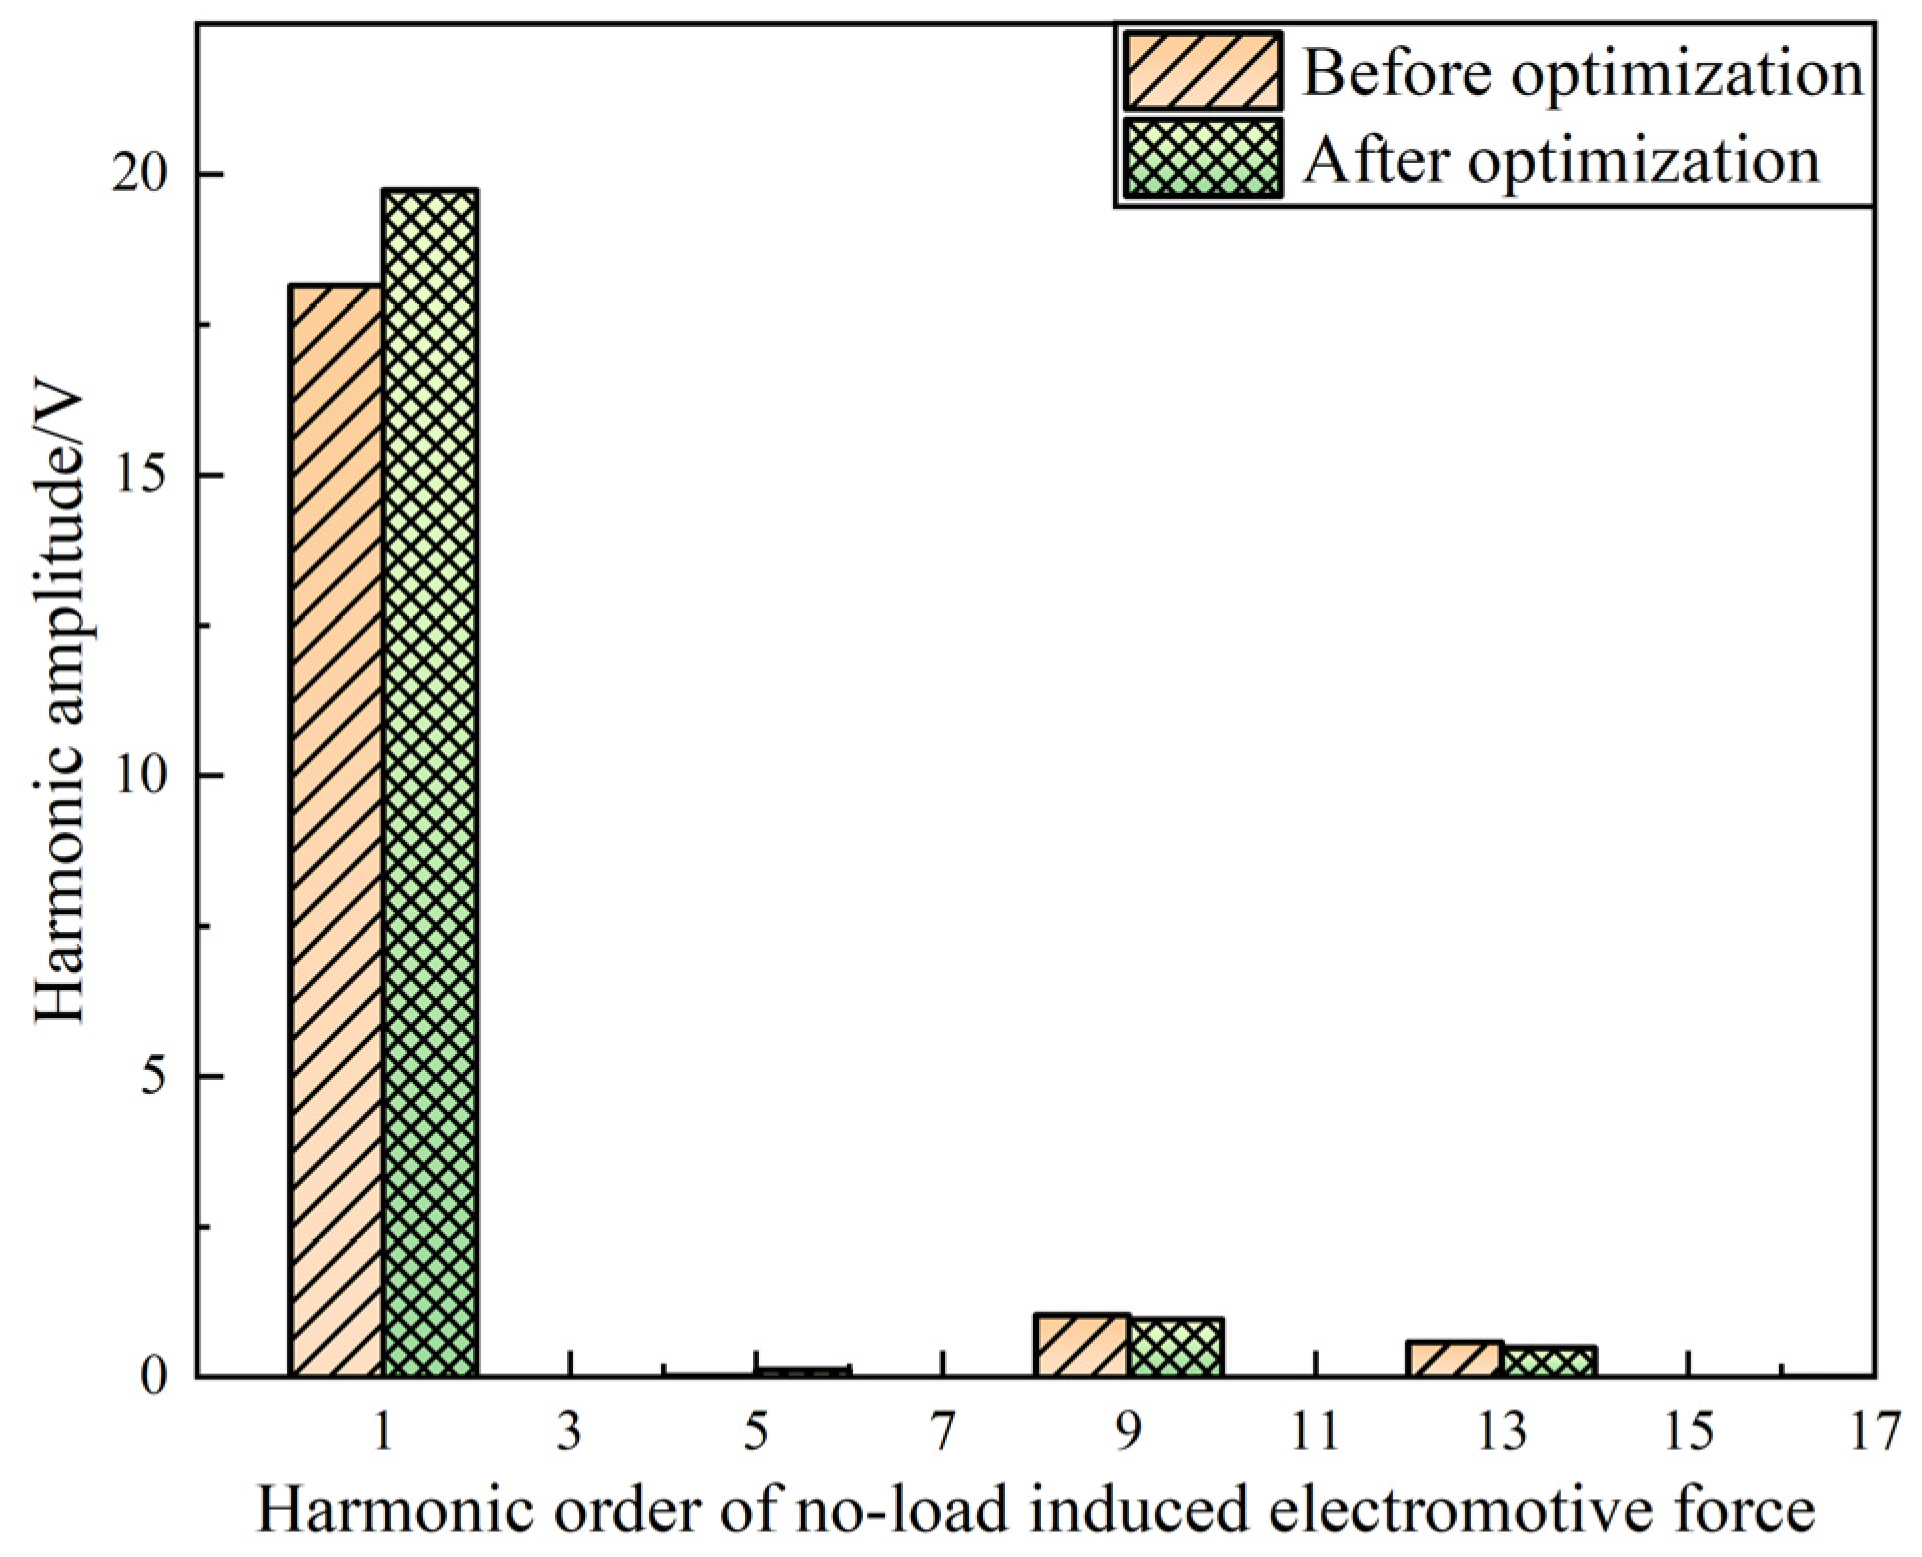
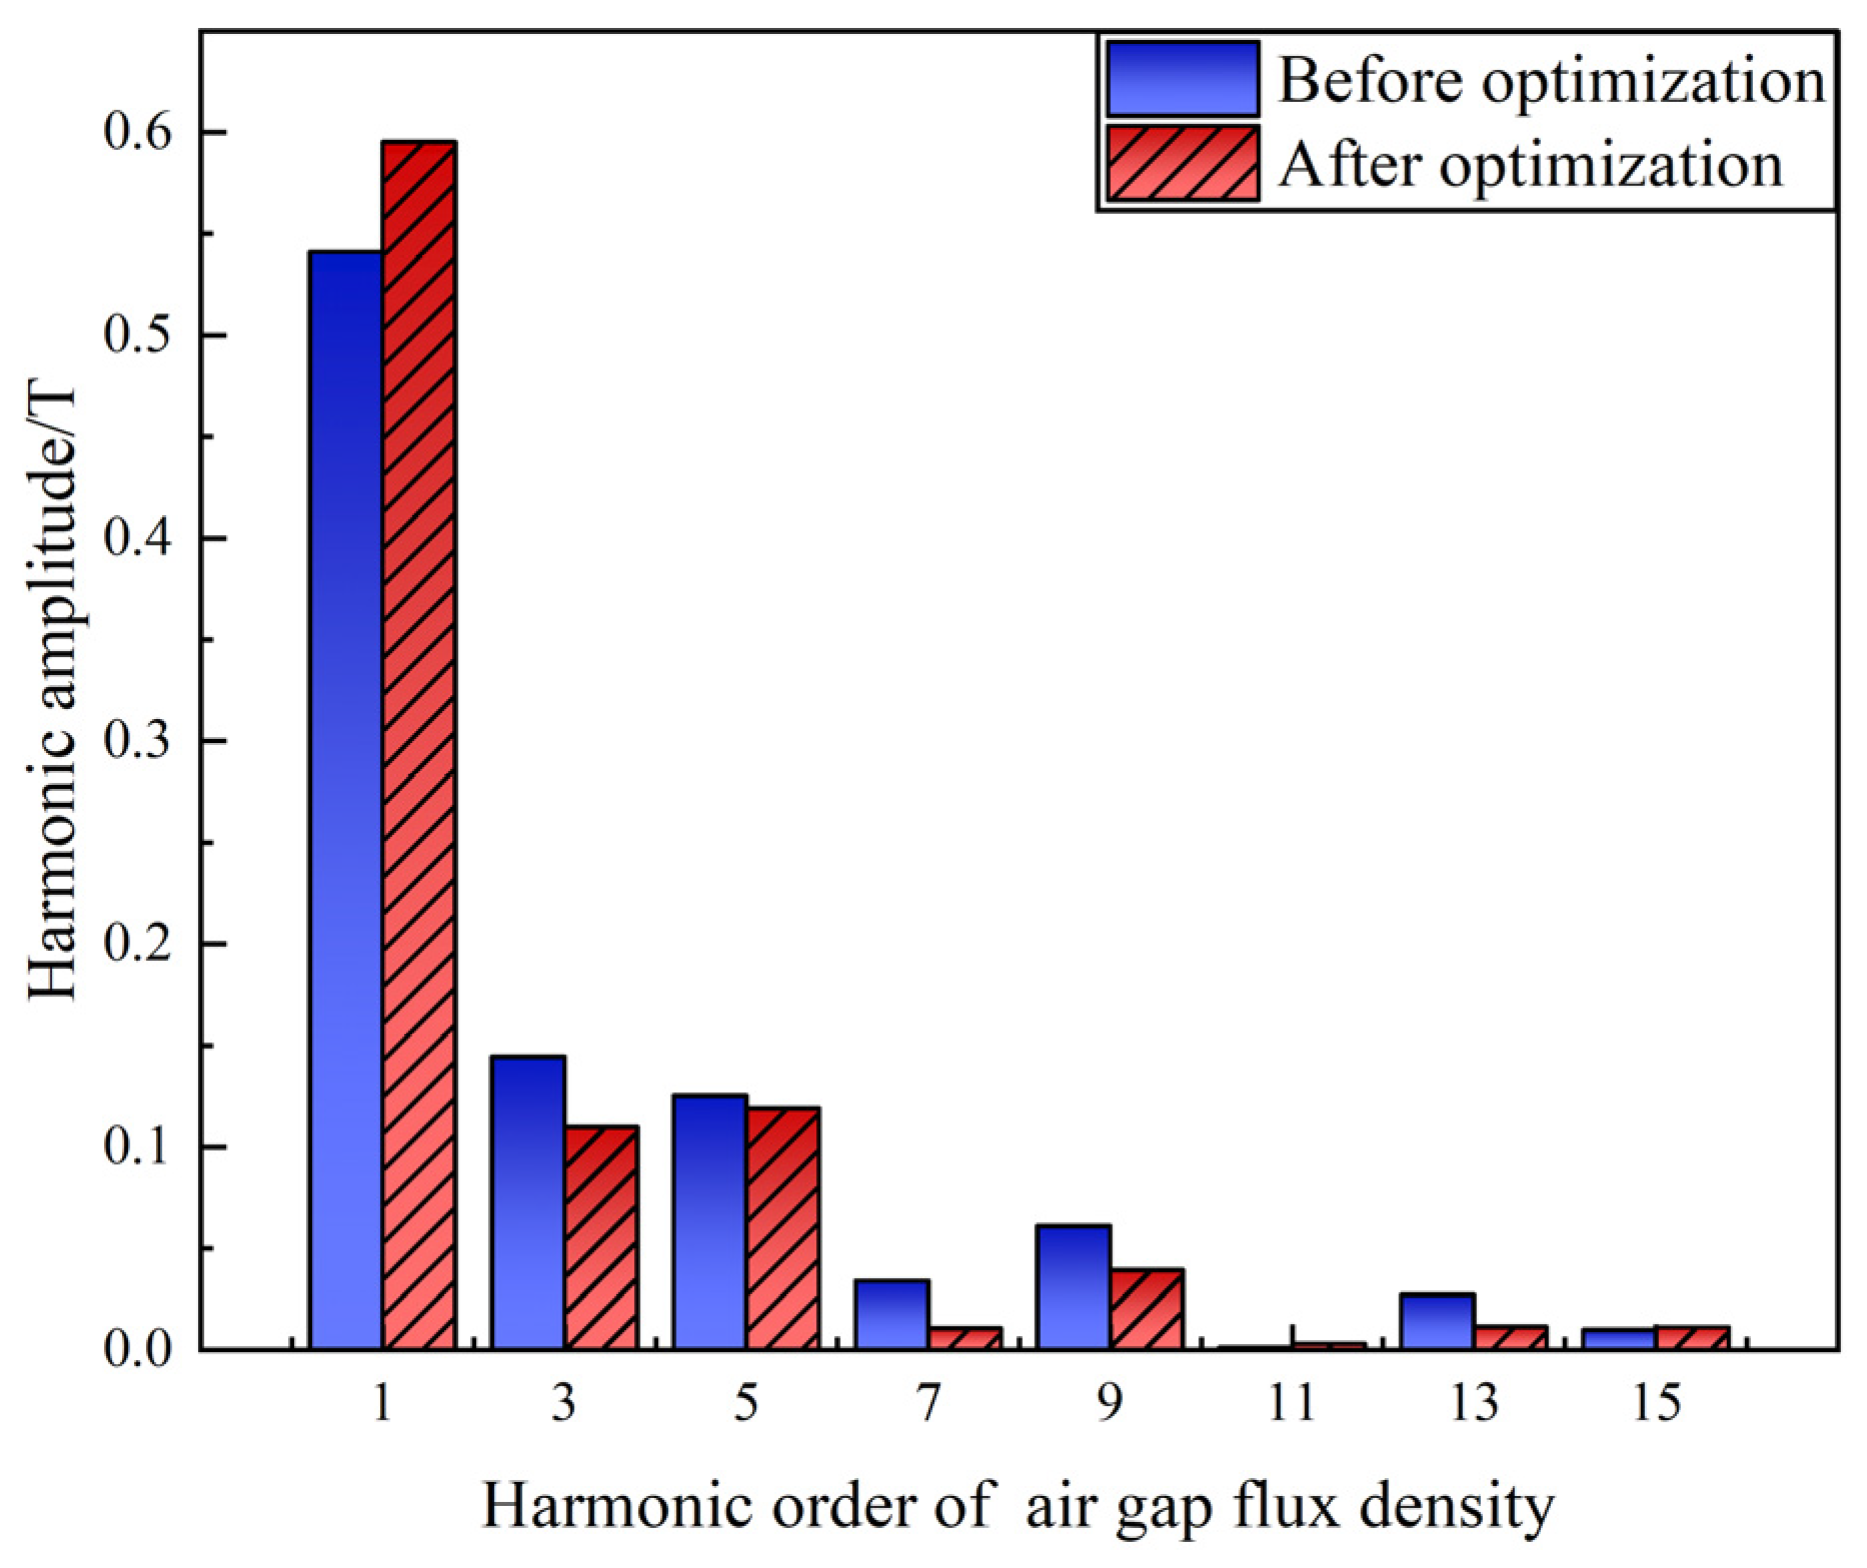
5.2. Simulation Verification

To verify the correctness of the optimized design, the no-load induced electromotive force, cogging torque, and air gap flux density are compared and verified using finite element simulation based on the rotor structural parameters of the generator before and after optimization. As shown in Figure 13, the no-load induced electromotive force of the generator increases by 1.18 V to 20.14 V after optimization, and the optimized waveform of the no-load induced electromotive force is smoother.
The waveform of the no-load induced electromotive force is decomposed using Fourier functions before and after optimization, resulting in the histogram of the harmonic amplitudes of the no-load induced electromotive force, as shown in Figure 14. Prior to optimization, the fundamental amplitude was approximately 18.14 V, which increased to 19.73 V after optimization. The 5th harmonic increased from 0.027 V to 0.118 V, while the 9th harmonic slightly decreased from 1.04 V to 0.97 V. Similarly, the 13th harmonic was reduced from 0.59 V to 0.49 V. The 3rd, 7th, 11th, 15th, and 17th harmonics remained near zero in both cases. It can be observed from this that after optimization, the amplitude of the fundamental wave increases and the content of high-order harmonics decreases. Therefore, the waveform is more sinusoidal. The correctness of theoretical analysis in the previous text is verified.
As shown in Figure 15, the optimized cogging torque has been significantly reduced from 177.08 mN·m to 90.52 mN·m, representing a decrease of 48.88%.
As shown in Figure 16, the optimized air gap flux density has increased by 5.07%, from 0.789 T to 0.829 T, and the optimized air gap magnetic flux density waveform is closer to sine. The Fourier function decomposition of the air gap flux density waveform is performed, and a comparison of the harmonic amplitudes before and after optimization is shown in Figure 17.
As we can see from Figure 17, the fundamental amplitude was approximately 0.541 T, which increased to 0.595 T after optimization. The 3rd harmonic decreased from 0.145 T to 0.11 T, the 5th harmonic decreased from 0.126 T to 0.119 T, the 7th harmonic decreased from 0.034 T to 0.011 T, the 9th harmonic decreased from 0.061 T to 0.039 T, the 13th harmonic decreased from 0.027 T to 0.012 T, the 15th harmonic decreased increased from 0.01 T to 0.011 T, and the 11th harmonic remained near zero in both cases. Therefore, after optimization, the HEG can reduce the high harmonic content of air gap magnetic density.
The total harmonic distortion (THD) of the air gap flux density waveform is a key indicator of the performance of the HEG. It is typically calculated based on the harmonic amplitude. A lower THD indicates less harmonic content and a waveform that more closely approximates a sinusoidal shape. The THD is calculated using the following formula:
THD = B 2 2 + B 2 2 + B 2 2 + B n 2 B 1 × 100 %
The total harmonic distortion has decreased to 2.38%, which is a 39.3% reduction compared to the value before optimization. This indicates a significant improvement in the sinusoidal waveform of the air gap flux density.

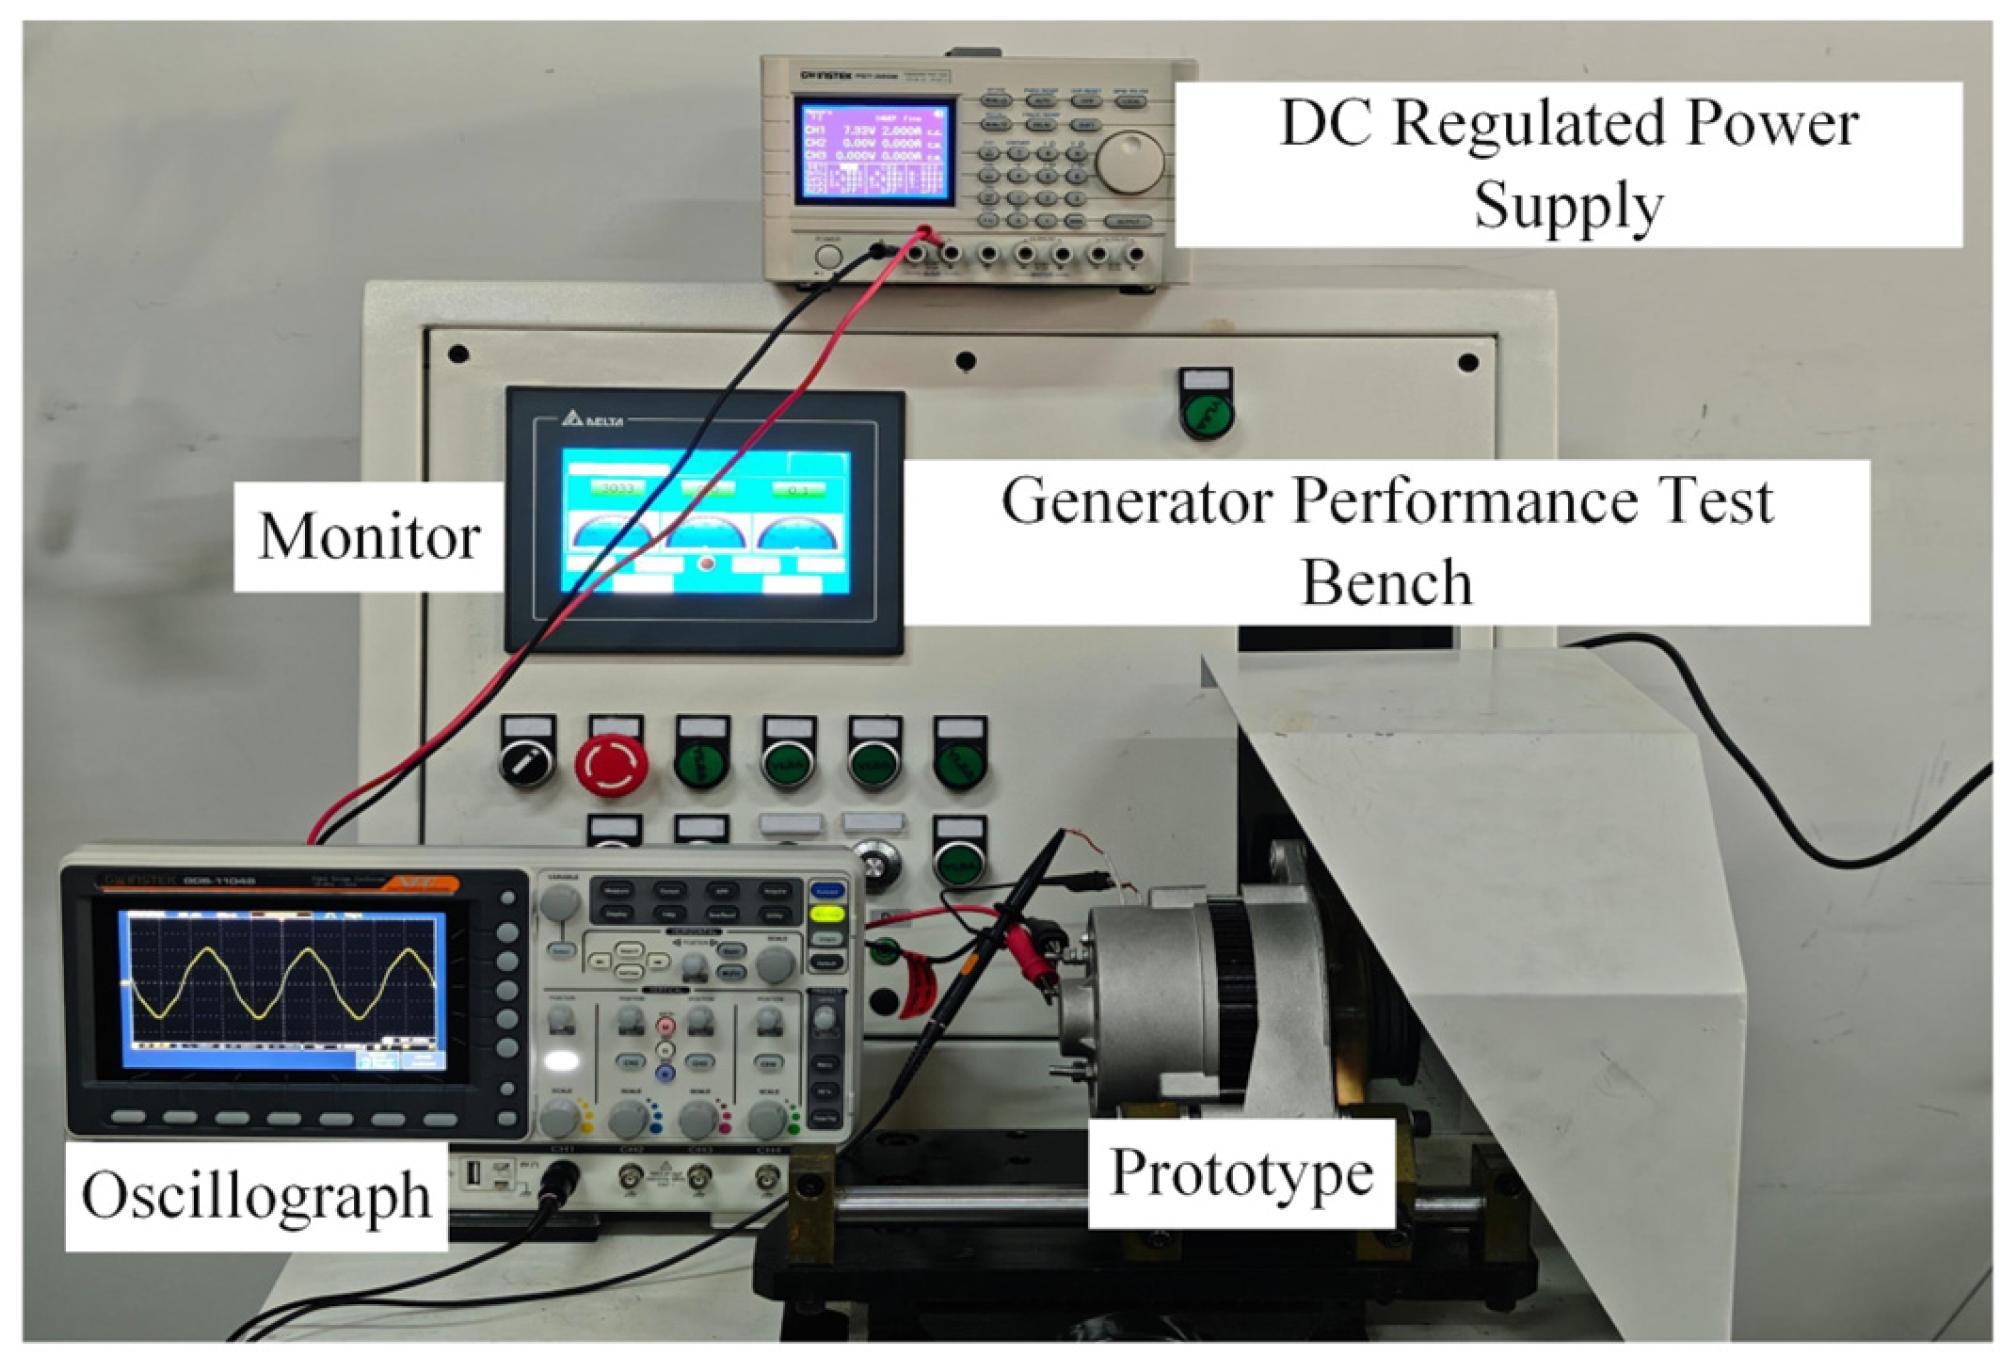
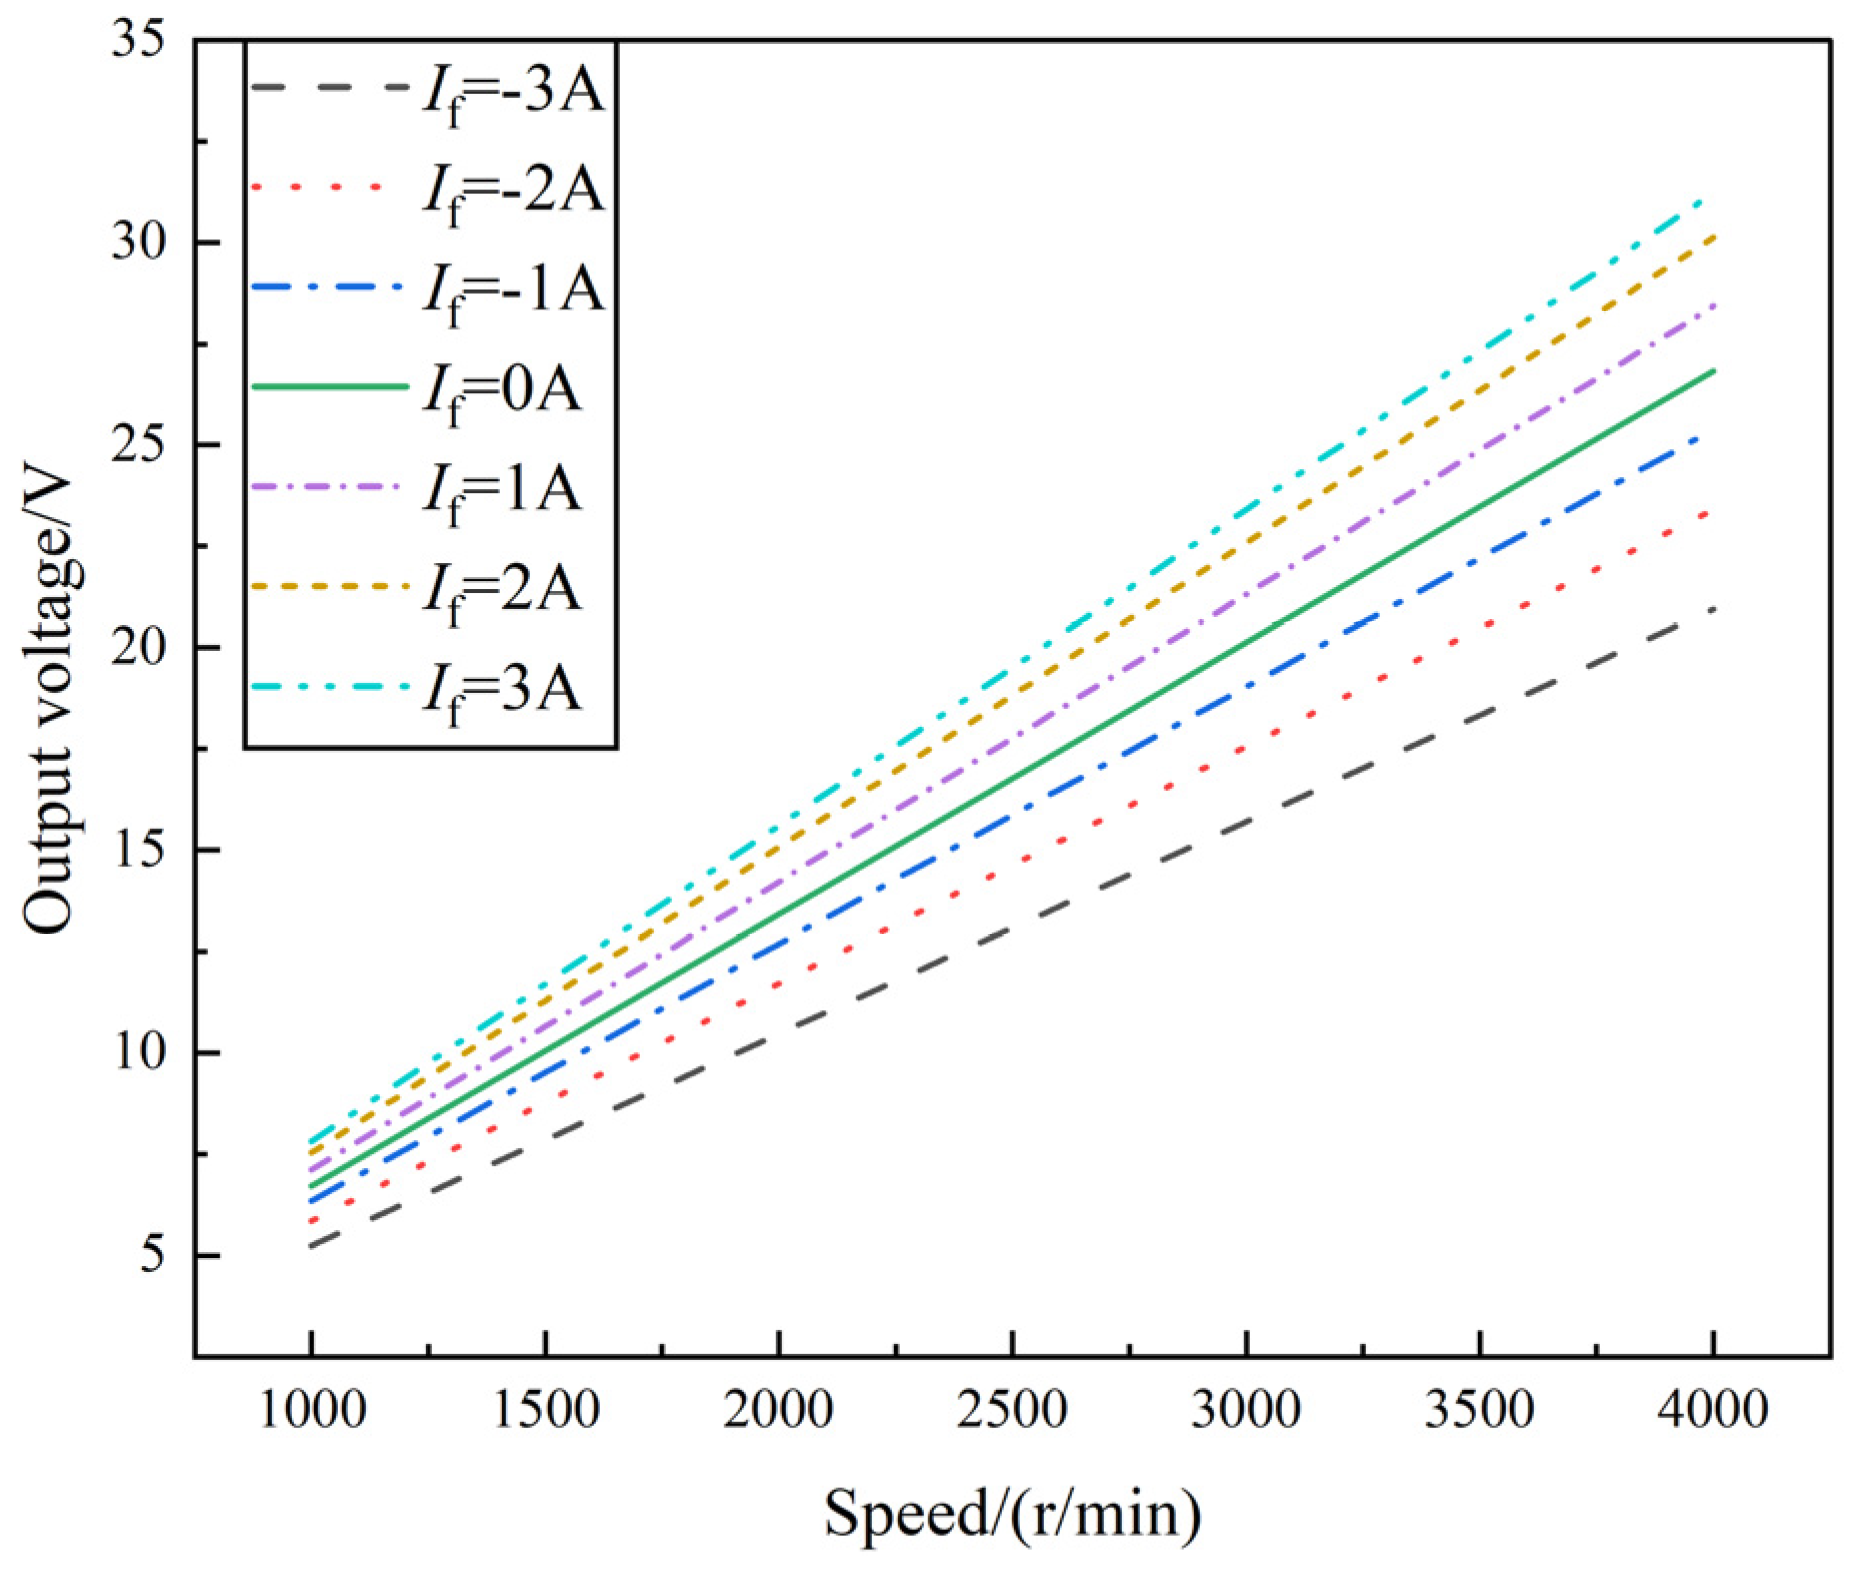
6. Experimental Verification

A 3-phase, 8-pole, 36-slot, built-in U-shaped permanent magnet with salient pole electromagnetic HEG was prototyped based on the optimization results presented in the previous section. The generator stator and rotor are shown in Figure 18. The prototype’s performance was evaluated using a generator test platform. As shown in Figure 19, this platform features a comprehensive performance test system that is suitable for various models of automotive generators. It allows for manual control of the generator, including setting the generator speed, regulating the electronic load, and increasing the load current. The system is user-friendly and offers comprehensive test capabilities.
Under no-load conditions, the experimental results for the generator’s induced electromotive force are presented in Figure 20. As the excitation current varies from −3 A to 3 A, the output voltage curve of the compound-excited generator is depicted in Figure 21 and Figure 22, with increasing speed.
When the generator operates at its rated speed, it can maintain the rated output voltage under various load power conditions by adjusting the excitation current. The performance curve obtained in this process is the regulation characteristic curve, as shown in Figure 23. As the load current increases, the load power rises, and the excitation current required to maintain a stable output voltage grows approximately linearly. When the load current exceeds 65.8 A and the load power exceeds 800 W, the excitation current must be greater than 0 A to ensure the rated voltage output. At this point, the slope of the regulation characteristic curve increases, indicating that a greater increase in excitation current is needed to maintain voltage stability for the same increment in load current.
Conversely, when the load current is below 64.3 A and the load power is below 750 W, the excitation current must be less than 0 A to maintain a stable output voltage. In this case, the slope of the regulation characteristic curve is small, indicating that a small change in excitation current can significantly affect the output voltage.
Under rated load conditions, with a load power of 1000 W and a load current of 73.5 A, the excitation current is only 1.5 A. At this point, the generator is primarily dominated by the PMF, with the EEMF providing auxiliary support, thereby reducing excitation losses.
When the generator operates at half-load, with a load power of 500 W and a load current of 53.7 A, the excitation current is −1.9 A. Here, the EEMF weakens the PMF to achieve a stable output voltage. When the load power reaches 1200 W, the generator enters an overload condition, and the excitation current is 2.6 A. At this point, the EEMF enhances the synthetic magnetic field to meet the higher power demand.
The test results illustrate the hybrid excitation generator proposed in this design. It has good no-load performance and adjustment characteristics, which can meet the design requirements, thereby verifying the correctness of the optimization design method in this paper.

7. Conclusions

This paper presents a novel design structure for a generator. By establishing an equivalent magnetic circuit model, expressions for no-load induced electromotive force, cogging torque, and air gap flux density are derived. Optimization parameters are selected based on a sensitivity analysis. The no-load induced electromotive force, cogging torque, and air gap flux density amplitude are chosen as optimization objectives, and the structural dimensions of the rotor and PM are optimized using a multi-objective genetic algorithm. As a result, the optimized no-load induced electromotive force increased from 18.96 V to 20.14 V, representing a 6.22% improvement; the cogging torque decreased from 177.08 mN·m to 90.52 mN·m, a 48.88% reduction; the air gap flux density increased from 0.789 T to 0.829 T, a 5.07% improvement; and the air gap flux density waveform distortion rate decreased from 6.22% to 2.38%, a 39.3% reduction.
A prototype is fabricated based on the optimized generator parameters and experimentally verified. The experimental results demonstrate that the generator can maintain a stable output voltage by adjusting the excitation current. Under rated load conditions, when the excitation current is 1.5 A, the HEG is primarily dominated by the PMF and supplemented by the EEMF, thereby reducing excitation losses. Under overload conditions, the EEMF enhances the synthetic magnetic field to meet the higher power demand.
The optimized design is validated through prototype fabrication and experimental testing. The experimental results are in good agreement with the finite element simulation results, confirming the validity and feasibility of the optimized design. The optimized generator achieves the expected performance goals, exhibiting excellent voltage regulation and electromagnetic performance, which meet the application requirements.

Author Contributions

Conceptualization, S.M. and K.C.; methodology, S.M. and K.C.; software, K.C.; validation, S.M., K.C., Y.W. and C.L.; formal analysis, J.M., S.M. and K.C.; writing—original draft preparation, K.C.; writing—review and editing, S.M., K.C., C.L. and Y.W.; supervision, S.M.; project administration, S.M.; funding acquisition, S.M. All authors have read and agreed to the published version of the manuscript.

Funding

This research was funded by the National Natural Science Foundation of China (grant number: 52305276), the Tianjin Education Commission Research Program Project (grant number: 2022KJ122), and the Tianjin University of Technology and Education Scientific Research Project (grant number: KYQD202339). We have carefully checked and found that the information about the funds is accurate.

Data Availability Statement

The data presented in this study are included in the article.

Conflicts of Interest

Author Shilun Ma was employed by Tianjin Zhenghan Technology Co., Ltd. The remaining authors declare that the research was conducted in the absence of any commercial or financial relationships that could be construed as potential conflicts of interest.

References

  1. Zhang, X.; Du, Q.; Xu, J.; Zhao, Y.; Ma, S. Development and Analysis of the Magnetic Circuit on Double-Radial Permanent Magnet and Salient-Pole Electromagnetic Hybrid Excitation Generator for Vehicles. Chin. J. Mech. Eng. 2019, 32, 33. [Google Scholar] [CrossRef]
  2. Zhao, C.; Qin, H.; Zhang, Z.; Yan, Y. Structural and Principle Analysis of Radial Structure Hybrid Excitation Synchronous Generator with Magnetic Shunt. Proc. CSEE 2008, 28, 145–150. [Google Scholar] [CrossRef]
  3. Ma, S.; Zhang, X.; Du, Q.; Shi, L.; Meng, X. Optimization Design of a New Type of Interior Permanent Magnet Generator for Electric Vehicle Range Extender. J. Electr. Comput. Eng. 2019. [Google Scholar] [CrossRef]
  4. Zhu, C.Q.; Wang, X.H.; Yang, Y.B.; Shen, Y.M.; Yu, P.J.; Zhang, G.B. Structural and Voltage Regulation Analysis of Parallel Hybrid Excitation Synchronous Generator under Double-Pole Induction. Proc. CSEE 2020, 40, 7890–7898+8226. [Google Scholar] [CrossRef]
  5. Yang, H.; Zheng, H.; Zhu, Z.Q.; Lin, H.Y.; Lyu, S.K.; Pan, Z.B. Comparative Study of Partitioned Stator Memory Machines with Series and Parallel Hybrid PM Configurations. IEEE Trans. Magn. 2019, 55, 1–8. [Google Scholar] [CrossRef]
  6. Xiu, W.; Dong, Q.; Chang, Z. Finite Element Analysis of Magnetic Field Regulation Characteristics of New Type of Hybrid Excitation Brushless Claw-Pole Generator. J. Electr. Control Eng. 2013, 17, 99–104. [Google Scholar] [CrossRef]
  7. Dong, Q.; Xiu, W.; Chang, Z. Analysis and Experimental Study of Magnetic Field Regulation Characteristics of New Type of Hybrid Excitation Brushless Claw-Pole Generator. Proc. CSEE 2013, 33, 115–121. [Google Scholar] [CrossRef]
  8. Geng, W.; Zhang, Z.; Yu, L.; Yan, Y. Structure Principle and Magnetic Field Regulation Characteristics of New Type of Parallel Hybrid Excitation Brushless DC Motor. Trans. China Electrotech. Soc. 2013, 28, 131–137+154. [Google Scholar] [CrossRef]
  9. Chao, Z. Structure Design and Characteristics of Series Magnetic Circuit Hybrid Excitation Claw-Pole Generator. Trans. China Electrotech. Soc. 2009, 24, 1–6+12. [Google Scholar] [CrossRef]
  10. Zhuo, Z.; Dong, W.; Wei, H. Review and Prospect of Structure Principle, Design and Operation Control Technology of Hybrid Excitation Motor. Proc. CSEE 2020, 40, 7834–7850+8221. [Google Scholar] [CrossRef]
  11. Zhu, X.Y.; Cheng, M.; Zhao, W.X.; Zhang, J.Z.; Hua, W. Review and Prospect of Hybrid Excitation Motor Technology. Trans. China Electrotech. Soc. 2008, 23, 30–39. [Google Scholar] [CrossRef]
  12. Gu, X.; Zhang, Z.; Sun, L.; Yu, L. Magnetic Field Enhancement Characteristic of an Axially-Parallel Hybrid Excitation DC Generator. IEEE Trans. Magn. 2020, 99, 1. [Google Scholar] [CrossRef]
  13. Gu, X.; Zhang, Z.; Sun, L.; Yu, L. Phase Displacement Characteristics of a Parallel Hybrid Excitation Brushless DC Generator. IEEE Trans. Energy Convers. 2020, 35, 875–885. [Google Scholar] [CrossRef]
  14. Gong, H.L.; Zhang, Y.Z.; Wang, L.; Zhao, Y.J.; Hu, L.J.; Zhang, C.L. Rotor Pole Matching of Parallel Rotor Hybrid Excitation Synchronous Generator. J. Electr. Control Eng. 2020, 24, 128–137. [Google Scholar] [CrossRef]
  15. Yan, S.; Zhang, X.; Zhang, J.; Zhang, Y.; Xu, M.; Gao, T.; Hua, S. Magnetic Field Analysis and Performance Optimization of Dual-Rotor Hybrid Excitation Generator for Automobile. Machines 2022, 10, 816. [Google Scholar] [CrossRef]
  16. Geng, H.; Zhang, X.; Yan, S.; Tong, L.; Ma, Q.; Xu, M.; Zhang, Y.; Han, Y. Magnetic Field Analysis and Performance Optimization of Hybrid Excitation Generators for Vehicles. Sustain. Energy Technol. Assess. 2022, 52, e102222. [Google Scholar] [CrossRef]
  17. Hu, W.; Zhang, X.; Geng, H.; Gao, T.; Shi, L.; You, D. Electromagnetic Design and Flux Regulation Analysis of New Hybrid Excitation Generator for Electric Vehicle Range Extender. J. Electr. Comput. Eng. 2021, 2021, 5547517. [Google Scholar] [CrossRef]
  18. Wang, M.; Kou, B.; Zhang, L.; Zhao, Y.; Xu, J. A Novel Hybrid Excitation Doubly Salient Generator with Separated Windings by PM Inserted in Stator Slot for HEVs. Energies 2022, 15, 7968. [Google Scholar] [CrossRef]
  19. Wei, C.; Wu, Q.; Bao, J.; Yan, Q.; Wang, S.; Sui, Y.; Wei, F. Structural Design and Parameter Optimization of Parallel Claw-Pole Hybrid Excitation Motor for New Energy Vehicles. Sci. Technol. Eng. 2025, 25, 1496–1502. [Google Scholar] [CrossRef]
  20. Guo, Y.; Jin, P.; Lin, H.; Yang, H.; Lyu, S. Design and Analysis of a Flux Intensifying Permanent Magnet Embedded Salient Pole Wind Generator. AIP Adv. 2018, 8, 056627. [Google Scholar] [CrossRef]
  21. Geng, H.; Zhang, X.-Y.; Gao, Y.; Yan, S.; Zhang, Y.; Han, Y.; Wang, L.; Hua, S. Performance Analysis and Optimization of Built-In Permanent Magnet and Salient-Pole Electromagnetic Hybrid Excitation Generators for Vehicles. J. Eng. 2022, 2022, 1–19. [Google Scholar] [CrossRef]
  22. Geng, H.; Zhang, X.; Zhang, Y.; Hu, W.; Lei, Y.; Xu, X.; Wang, A.; Wang, S.; Shi, L. Development of Brushless Claw Pole Electrical Excitation and Combined Permanent Magnet Hybrid Excitation Generator for Vehicles. Energies 2020, 13, 4723. [Google Scholar] [CrossRef]
  23. Shi, Y.; Xue, Z.; Yan, G. Influence of Rotor Internal Slotting on Cogging Torque of Segmented Permanent Magnet Synchronous Motor. J. Xi’an Univ. Technol. 2022, 38, 433–441. [Google Scholar] [CrossRef]
  24. Ma, S.; Chen, K.; Zhang, Q. Analysis of Multi-Objective Optimization Design of Interior Double Radial and Tangential Combined Magnetic Pole Permanent Magnet Drive Motor for Electric Vehicles. World Electr. Veh. J. 2024, 15, 4. [Google Scholar] [CrossRef]
  25. Huang, C.; Li, S.; Liu, X.; Sun, Y. Multi-Objective Optimization Method of Permanent Magnet Assisted Synchronous Reluctance Motor Based on KELM-NSGA-II. Sci. Technol. Eng. 2025, 25, 1065–1074. [Google Scholar]
  26. Gandarillas, V.; Joshy, A.J.; Sperry, M.Z.; Ivanov, A.K.; Hwang, J.T. A Graph-Based Methodology for Constructing Computational Models that Automates Adjoint-Based Sensitivity Analysis. Struct. Multidiscip. Optim. 2024, 67, 5. [Google Scholar] [CrossRef]
Figure 1. Schematic diagram of the HEG structure.
Symmetry 17 00897 g001
Figure 2. Magnetic flux density distribution.
Symmetry 17 00897 g002
Figure 3. Magnetic circuit distribution of the HEG.
Symmetry 17 00897 g003
Figure 4. Equivalent magnetic circuit diagram of the HEG: (a) magnetic circuit of RPM1 and (b) magnetic circuit of RPM2.
Symmetry 17 00897 g004
Figure 5. Design parameters of a single salient pole structure.
Symmetry 17 00897 g005
Figure 6. Pearson coefficient diagram of each design parameter and optimization target.
Symmetry 17 00897 g006
Figure 7. Normalization of predicted and actual values.
Symmetry 17 00897 g007
Figure 8. Response surfaces of b1, b2, and β with EA: (a) effect of b1 and b2 on EA; (b) effect of b1 and β on EA; and (c) effect of b2 and β on EA.
Symmetry 17 00897 g008
Figure 9. Response surfaces of b1, b2, and β with Tcog: (a) effect of b1 and b2 on Tcog; (b) effect of b1 and β on Tcog; and (c) effect of b2 and β on Tcog.
Symmetry 17 00897 g009
Figure 10. Response surfaces of b1, b2, and β with Br: (a) effect of b1 and b2 on Br; (b) effect of b1 and β on Br; and (c) effect of b2 and β on Br.
Symmetry 17 00897 g010
Figure 11. A 3D distribution of the pareto front.
Symmetry 17 00897 g011
Figure 12. Statistical chart of the k-value of the parameter matching coefficient.
Symmetry 17 00897 g012
Figure 13. Comparison chart of no-load induced electromotive force before and after optimization.
Symmetry 17 00897 g013
Figure 14. Histogram of no-load induced electromotive force harmonic amplitude.
Symmetry 17 00897 g014
Figure 15. Comparison of cogging torque before and after optimization.
Symmetry 17 00897 g015
Figure 16. Comparison of air gap flux density before and after optimization.
Symmetry 17 00897 g016
Figure 17. Histogram of air gap flux density harmonic amplitudes.
Symmetry 17 00897 g017
Figure 18. The diagram of prototype: (a) stator and (b) rotor.
Symmetry 17 00897 g018
Figure 19. The diagram of generator test platform.
Symmetry 17 00897 g019
Figure 20. Experimental results of no-load induced electromotive force.
Symmetry 17 00897 g020
Figure 21. No-load characteristic curve of the HEG.
Symmetry 17 00897 g021
Figure 22. Variation curves of output voltage and excitation current of the HEG at different speeds.
Symmetry 17 00897 g022
Figure 23. Adjustment characteristic curve of the HEG.
Symmetry 17 00897 g023
Table 1. Main parameters of the HEG.
ParametersNumerical ValueParametersNumerical Value
Rated power/W1000Stator–rotor axial length/mm24
Rated speed/(r/min)3000Stator outer diameter/mm110
Number of poles/slots8/36Stator inner diameter/mm82
Rated voltage/V14Rotor outer diameter/mm81
Table 2. Variation ranges of design parameters.
ParametersRange of ValuesParametersRange of Values
ws/mm21~23.5h1/mm2~3
hs/mm9~11b2/mm4.5~5.5
wb/mm10~13h2/mm2~2.5
hb/mm10~13.5h3/mm4~6
b1/mm5~7.7β/(°)50~65
Table 3. Pearson correlation coefficient composite sensitivity index.
ParametersPearson Correlation Coefficient WeightsIntegrated
Sensitivity/%
|SEMF (0.25)||STcog (0.25)||SBr (0.5)|
ws0.4300.5230.0790.063
hs0.0230.0260.0230.012
wb0.0870.0700.0470.063
hb0.0360.0350.0420.039
b10.7300.4240.7290.653
h10.2180.0980.2170.187
b21.0000.5411.0000.885
h20.1620.6100.4010.394
h30.1660.0940.1370.086
β0.4561.0000.6610.694
Table 4. Experimental design data and results.
Serial NumberOptimization ParametersOptimization Goals
b1/mmb2/mmβ/(°)EA/(V)Tcog/(mN∙m)Br/(T)
16.174.7358.5018.271459.3030.7015
25.635.0059.5018.495269.1260.7139
37.614.9352.5020.250267.6220.7944
45.815.4763.5019.7596106.770.7932
57.435.3353.5020.609379.2820.8247
65.095.4051.5018.507740.7930.6954
75.994.6062.5016.434151.2130.6295
85.274.8061.5015.740542.1450.5993
96.895.2757.5020.182487.9890.8079
107.074.8764.5019.6449112.000.7892
116.535.1355.5019.726969.6870.7725
127.254.6754.5019.475061.7840.7558
136.355.0756.5019.421469.1750.7593
145.454.5350.5013.34698.92810.4796
156.715.2060.5019.952196.9600.8011
Table 5. Optimal solutions of the model on the pareto front.
Serial Numberb1/mmb2/mmβ/(°)EA/(V)Tcog/(mN∙m) B r / ( T )
15.434.5050.0513.48156.640.481
155.444.5150.0913.65461.620.486
525.514.5051.0715.41677.330.532
⋯⋯⋯⋯⋯⋯⋯⋯⋯⋯⋯⋯⋯⋯
1717.475.0458.0320.335143.270.798
2187.455.0456.0320.324114.450.797
3867.305.1053.0419.7887.440.768
Table 6. Comparison of generator structural parameters before and after optimization.
Parametersws/mmhs/mmwb/mmhb/mmh3/mmb1/mmh1/mmb2/mmβ/(°)h2/mm
Before optimization22.8710.712.310.25.75.32.65.164.82.3
After optimization221011.613.867.435.353.52
Disclaimer/Publisher’s Note: The statements, opinions and data contained in all publications are solely those of the individual author(s) and contributor(s) and not of MDPI and/or the editor(s). MDPI and/or the editor(s) disclaim responsibility for any injury to people or property resulting from any ideas, methods, instructions or products referred to in the content.

