Abstract
In industrial inspection, X-ray detection methods are the mainstream approach for non-destructive testing (NDT) of weld defects. In response to the issues of insufficient detection accuracy and slow detection speed in existing X-ray weld defect detection (WDD) methods, a lightweight X-ray WDD model, AFD-YOLOv10, based on an improved YOLOv10n, is proposed. First, by introducing variable kernel convolution (AKConv) to replace traditional convolution in the backbone network, the model better adapts to the multi-scale variations in weld defects while maintaining its lightweight nature. Second, a lightweight C2f-Faster module is incorporated into both the backbone and neck networks to achieve a more symmetrical and efficient feature flow, reducing the model’s computational complexity and achieving lightweight design. Finally, dynamic upsampling (DySample) is added to the neck network to enhance the model’s detection accuracy for targets of different scales. This combination of innovations strikes an effective symmetry between model complexity, inference speed, and detection performance. Experimental results show that the improved AFD-YOLOv10 model achieves accuracies, recall rates, and mean average precision values of 90.7%, 88.8%, and 93.8%, respectively, on five typical X-ray weld defects, representing improvements of 4.9%, 4.1%, and 5.3% over the YOLOv10n baseline model, with a 10.1% reduction in model parameters and a 13.3% increase in detection speed. Compared with other existing mainstream detection methods, the AFD-YOLOv10 model not only improves the accuracy of X-ray WDD but also achieves model lightweighting, demonstrating overall detection performance superior to other mainstream algorithms, thus meeting the industrial production requirements for X-ray WDD. Additionally, generalization experiments conducted using a public dataset of surface defects in steel validate the good generalization performance of the AFD-YOLOv10 model.
1. Introduction
Welding technology is a crucial process in industries such as petrochemicals, pressure vessels, and aerospace, and its quality has a direct impact on the safety and reliability of welded structures [1,2,3]. However, during the welding process, the weld area is susceptible to internal defects such as porosity, cracking, and incomplete fusion [4,5], and the formation and morphology of these defects are strongly influenced by the microstructure and deformation mechanisms of the base material. Recent studies on nano-twinned steels have demonstrated that twinning behavior, phase transformations, and alloy composition can significantly affect the initiation and evolution of such defects [6]. These defects can lead to structural failure and even major safety accidents. Therefore, to prevent accidents caused by weld quality issues, it is necessary to conduct defect detection on welds. In industrial inspections, NDT methods such as ultrasonic testing [7], X-ray testing [8], and magnetic particle inspection [9] are commonly used to detect whether there are defects in the welds. Among these, X-ray testing is extensively utilized in industrial inspections owing to its brief detection time and high precision in identifying weld defects.
Conventional inspection techniques (such as manual–visual inspection) are limited by low efficiency, high subjectivity, and dependence on experienced inspectors. This is especially problematic when dealing with large volumes of X-ray image data, as it can lead to issues such as missed detections, false positives, and inconsistent detection standards, which cannot meet the demands of actual industrial inspections. With the development of computer technology, traditional machine vision-based defect detection methods, such as artificial neural networks (ANN) [10] and support vector machines (SVM) [11], have gradually been applied to WDD. Although traditional machine vision detection has achieved automated inspection, it lacks robustness and generalization ability, making it difficult to meet the requirements of practical industrial inspections. In recent years, deep learning technology has achieved significant advancements in the fields of image recognition and defect detection. Its capacity to automatically extract deep features from images using models such as convolutional neural networks (CNN) offers novel approaches for the intelligent detection of weld defects. Currently, deep learning-based WDD methods can be categorized into two-stage detection methods, such as Faster R-CNN [12] and Mask R-CNN [13], and single-stage detection methods, such as SSD [14] and the YOLO series [15,16]. Two-stage object detection methods first generate candidate regions and then screen out regions that are likely to contain objects from the image. After that, these candidate regions are further processed to complete object classification and precise bounding box regression. In contrast, single-stage detection directly models target detection as a dense prediction task via a single network pass, concurrently outputting the class probabilities and bounding box coordinates of the targets. This method can improve detection speed while enhancing model detection accuracy. Among these, the YOLO series of detection algorithms are extensively utilized in industrial defect detection owing to their superior overall detection performance. However, when faced with complex and diverse X-ray weld defects, both detection accuracy and speed still need improvement.
To achieve efficient and high-precision X-ray WDD, this paper presents a lightweight X-ray WDD approach grounded in an enhanced YOLOv10n model. This method effectively reduces the model’s parameter count while enhancing the accuracy of X-ray WDD, thus significantly increasing the model’s processing speed. The primary contributions of this study are outlined as follows:
- The traditional convolution SCDown in the backbone network of YOLOv10n is replaced with a variable kernel convolution AKConv, which enhances the adaptability to multi-scale variations of X-ray weld defects while maintaining the model’s lightweight nature.
- The lightweight C2f-Faster module is incorporated into both the backbone and neck networks, thereby reducing redundant computations and memory access, resulting in a more lightweight model.
- The DySample module is integrated into the neck network of YOLOv10n, which enhances detection speed while improving the accuracy of defect detection.
- Comparative experiments are conducted on the GDXray weld defect dataset with different models, demonstrating that the improved model can achieve efficient and high-precision X-ray WDD. Additionally, to evaluate the generalization capability of the proposed algorithm, experiments were performed using the NEU-DET public dataset for steel surface defects, which verified that the enhanced algorithm exhibits strong generalization ability.
The organization of this paper is as follows: Section 2 summarizes the application of existing defect detection methods in WDD; Section 3 introduces the network structure and basic principles of the improved X-ray WDD algorithm; Section 4 validates the feasibility of the proposed algorithm in X-ray WDD through ablation studies and comparisons with different models; Section 5 verifies the generalization capability of the improved model through generalization experiments; finally, the research work in this paper is summarized, and future research directions for X-ray WDD are discussed.
2. Related Work
2.1. Traditional Machine Vision Methods for Weld Defects
The traditional machine vision-based WDD methods require image preprocessing, threshold segmentation, and feature extraction to achieve defect detection and classification. For example, Li et al. [17] employed a fast discrete Curvelet transform for noise suppression during the preprocessing stage and constructed a grayscale distribution model through cubic Fourier curve fitting, effectively addressing the challenges of defect detection against complex weld backgrounds. Malarvel et al. [18] innovatively proposed a multi-class support vector machine (MSVM) detection framework, utilizing an improved anisotropic diffusion algorithm for image smoothing and combining it with the Otsu segmentation method to achieve precise localization of defect areas, ultimately achieving multi-class defect classification using MSVM. Sun et al. [19] established a feature region extraction method based on Gaussian mixture models, achieving good detection results in actual industrial production. Although conventional WDD methods show fairly steady performance in particular settings, their heavy dependence on manual feature design restricts their ability to adjust to the intricate and diverse industrial inspection environment. Furthermore, these methods are highly sensitive to image quality, exhibiting insufficient robustness under low contrast or high noise conditions.
2.2. Deep Learning-Based Weld Defect Methods
In deep learning-based X-ray WDD, Chen et al. [20] integrated the Res2Net module and a weighted feature fusion mechanism into the Faster R-CNN framework, significantly improving the detection accuracy of small defects such as microcracks. Xu et al. [21] made multi-dimensional improvements to YOLOv5, introducing a coordinate attention (CA) mechanism to enhance spatial feature correlation, employing the SIOU function and FReLU function to optimize the model’s bounding box regression and enhance the model’s nonlinear expressive capability, ultimately raising the average precision to 95.5% while maintaining real-time detection speed. Shi et al. [22] built a multi-scale feature enhancement network based on YOLOv7, achieving cross-frequency domain feature fusion through the WMA module, along with the PSS module and PEANet module, resulting in a 1.2% improvement in average precision. The DFW-YOLO model proposed by Han et al. [23] innovatively introduces FasterNet into the backbone network and utilizes the WGFPN module, significantly enhancing the representation capability of deep features. Ding et al. [24] developed a hybrid enhancement strategy based on an improved SRGAN, combining traditional enhancement methods such as translation and noise injection with an MHSA and a C2f-SGE module, improving the detection accuracy of YOLOv8s by 3.5%.
Based on the practical needs of industrial detection, researchers have made significant progress in model lightweighting and small target detection. Yang et al. [25] reduced the parameter count of the YOLOv3-tiny model by over 70% by incorporating the DSConv module and the SPP module. The LF-YOLO model developed by Liu et al. [26] employs an efficient feature extraction module, EFE, and an RMF multi-scale enhancement structure, achieving an inference speed of 61.5 frames per second while ensuring detection accuracy. The S-YOLO model proposed by Zhang et al. [27] improved feature map quality through full-dimensional dynamic convolution and vertical enhancement modules, effectively addressing the detection challenges of small target defects and occluded scenes by combining a mixed loss function strategy.
In summary, although the current WDD methods have made certain progress in improving detection accuracy and speed, the existing methods mostly rely on fixed convolutional kernels, which makes it difficult to adapt to the multi-scale variations and irregular shapes of weld defects (such as cracks and porosities) in X-ray images. Moreover, lightweight models often reduce computational complexity at the expense of detection accuracy. Existing lightweight designs may introduce redundant computations or inefficient memory access patterns, failing to balance parameter reduction and accuracy maintenance in complex industrial scenarios. Therefore, the development of lightweight and high-precision X-ray WDD methods remains a direction worthy of in-depth research.
3. Basic Principles
3.1. YOLOv10n Network Structure
As shown in Figure 1. YOLOv10n [28], serving as a one-stage object detection method, can attain high precision and efficiency in detection tasks. This detection method consists of three main components: the backbone network, the neck network, and the head network.
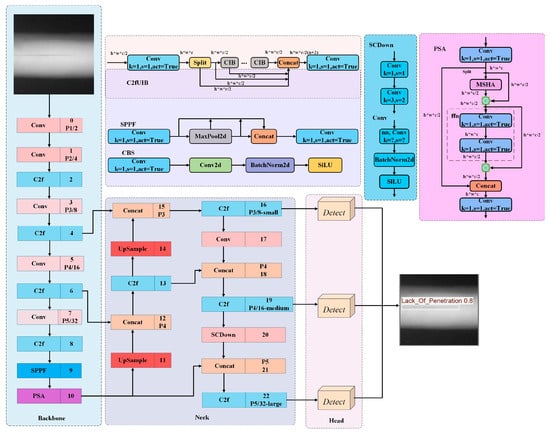
Figure 1.
YOLOv10n network framework [28].
Backbone Network: YOLOv10n uses CSPNet as its backbone network, replacing the original Conv in the fourth and fifth layers of the backbone with SCDown modules. Additionally, C2f modules are embedded after each convolution operation to enhance the representational capability of the output features. In addition, the SPPF module and PSA module are added at the end of the backbone network to optimize the model’s multi-scale feature extraction. The final network outputs feature maps with three different sizes and downsampling rates through a hierarchical feature extraction architecture.
Neck Network: YOLOv10n employs a PANet as the neck component, establishing a multi-path information flow via a bidirectional feature pyramid that integrates both descending and ascending structures. To enhance the efficiency of cross-layer feature propagation, PANet introduces lateral connections to create short-path information bridges, allowing shallow features to directly participate in the reconstruction of deep features, effectively alleviating the semantic gap problem caused by multi-level downsampling in traditional pyramid structures.
Head Network: The detection head of YOLOv10n adopts a dynamic task-decoupled dual-branch parallel architecture that is responsible for processing multi-scale feature maps from the feature fusion module. During training, both heads participate in loss computation simultaneously, allowing the model to optimize its parameters using the rich supervisory signals from the one-to-many head. In the inference phase, only the one-to-one head is used, enabling the output of high-precision detection results without relying on non-maximum suppression (NMS) post-processing.
3.2. YOLOv10n Algorithm Improvements
The improved YOLOv10n algorithm network framework is shown in Figure 2. First, due to the significant multi-scale and irregular morphology of weld defects (such as cracks and porosity) in X-ray images, traditional fixed-size convolutional kernels struggle to effectively capture these features, resulting in lower defect detection accuracy. To address this, we replaced the traditional convolution SCDown in the 3rd, 5th, and 7th layers of the backbone network with the AKConv module. The deformable sampling mechanism of the AKConv module allows the convolutional kernel to adaptively adjust its shape and size based on the input content, accommodating the multi-scale variations in X-ray weld defects and improving detection accuracy. Second, to enable the model to be embedded in X-ray weld defect scanning devices, we performed a lightweight processing of the original YOLOv10n model. Therefore, we replaced the C2f modules in the 2nd, 4th, 6th, and 8th layers of the backbone network and the 13th, 16th, 19th, and 22nd layers of the neck network with the lightweight C2f-Faster module. This reduces parameter redundancy during the feature extraction process, effectively decreasing the computational burden while accurately identifying defects. Finally, to better fuse the multi-scale features extracted by AKConv, we introduced DySample dynamic upsampling in the 11th and 14th layers of the neck network, enhancing the model’s detection accuracy for targets of different scales while reducing complex computations. Through this optimization strategy, the model improves the detection accuracy of X-ray weld defects while achieving a lightweight design.
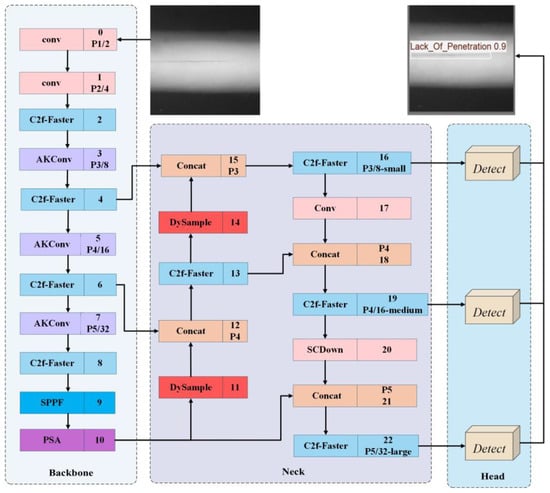
Figure 2.
AFD-YOLOv10 network framework.
3.2.1. AKConv Variable Kernel Convolution
Currently, the standard convolution operation still has two structural flaws. First, the local neighborhood modeling mechanism results in a limited receptive field, making it difficult to establish long-range dependencies across regions, and the fixed grid sampling pattern lacks the ability to adaptively adjust to the input content. Second, conventional convolutional kernels generally employ fixed square dimensions. This results in a higher parameter count as the kernel dimensions expand, thereby markedly increasing the model’s complexity. Therefore, when addressing industrial detection targets that exhibit multi-scale and multi-morphological characteristics (such as irregular cracks and pores in weld defects), this fixed local sampling strategy and square convolution kernels struggle to adapt to ever-changing targets.
AKConv [29,30], proposed in this paper, introduces a dynamically parameterized convolution kernel structure that breaks the fixed parameter limitations of traditional convolution kernels. This allows the kernel to modify its dimensions and form based on specific requirements, thus enabling more efficient adaptation to objects with varying shapes and sizes. For convolution kernels of varying sizes, AKConv devises an innovative coordinate generation method to establish the initial coordinates of the convolution kernel, thereby augmenting its adaptability when dealing with objects of diverse dimensions. To align with target variations, AKConv modifies the sampling locations of non-uniform convolution kernels by incorporating offsets, which in turn enhances the precision of feature extraction. AKConv facilitates linear scaling of the number of convolution parameters, which aids in optimizing performance within hardware settings and renders it especially fitting for lightweight model applications.
The sampling grid used in traditional convolution operations has a regular structure. Assuming the convolution operation is 3 × 3, R represents the sampling grid as follows:
The innovation of AKConv lies in the construction of irregularly shaped convolution kernels. Therefore, an algorithm suitable for convolution kernels of any size has been designed, with the core focus on generating the initial sampling coordinates of the convolution kernel Pn, as shown in Figure 3. Since irregular convolutions rarely have a central point in terms of size, the top-left corner coordinates of the input feature map (0,0) are established as the sampling reference point to match the extent of the applied convolution. Once the starting positions Pn of the irregular convolution kernel are defined, the convolution operation at the spatial position P0 can be formally expressed as follows:
where ω represents the convolution parameters. Through a series of operations, the introduction of AKConv addresses the issue of irregular sampling coordinates being unable to match the corresponding size of convolution operations.
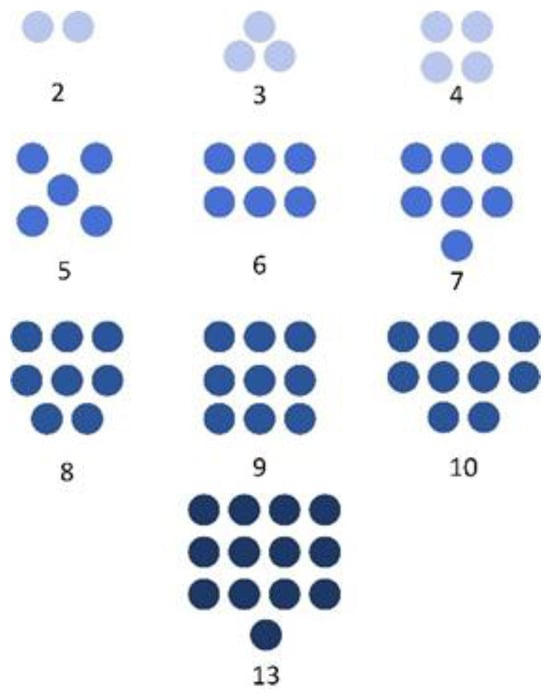
Figure 3.
Initial sampling coordinates for arbitrary convolution kernel sizes [29,30].
The architecture of AKConv is depicted in Figure 4. Initially, the input image, characterized by its dimensions (C, H, and W), serves to ascertain the preliminary sampling dimensions of the convolution kernel. Herein, C, H, and W are related to the channel count, spatial height, and width, respectively. Subsequently, primary feature extraction from the input image is executed via Conv2d, followed by modifications to the initial sampling configuration based on the acquired offsets. This adaptive deformation mechanism constitutes the essence of the algorithm, facilitating dynamic optimization of the convolution kernel’s configuration and thereby significantly bolstering the feature extractor’s adaptability to target morphology. Following this, the feature map is resampled in accordance with the modified sampling configuration. The resampled feature map then undergoes reshaping, additional convolution operations, and normalization, culminating in the generation of the output response through the SiLU activation function. Compared with the fixed and regular initial sampling grid, the sampling shape at each position after resampling changes, allowing AKConv to dynamically adjust its operations based on the image content, providing unprecedented flexibility and adaptability to the convolutional network.

Figure 4.
AKConv structure diagram [29,30].
3.2.2. C2f-Faster Module
In the YOLOv10n network, the C2f framework is composed of multiple convolutional layers and residual modules; however, it is encumbered by excessive redundant information, which restricts the speed of training and inference, rendering it unsuitable for deployment on edge devices. Furthermore, the traditional backbone network structure has certain limitations in processing multi-scale information, making it difficult to accurately capture the overall features of X-ray weld defects. In the face of these issues, this study incorporates the lightweight FasterNet module into the C2f framework to significantly diminish the model’s complexity. Introduced by Chen et al. [31], the FasterNet module comprises a partial convolution (PConv) along with two point-wise convolutions (PWConv). To bolster the model’s stability, BN and ReLU activation layers are integrated between the two PWConv layers. The module’s architecture is depicted in Figure 5.
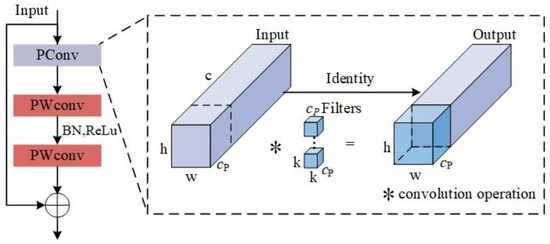
Figure 5.
FasterNet module structure diagram [31].
Research has demonstrated that reducing the floating-point operations (FLOPs) of a model does not necessarily result in enhanced computational speed. This phenomenon is largely attributed to the inefficiency of floating-point operations per second (FLOPS). The fundamental reason for the restricted efficiency of FLOPS is that frequent memory access during the computation process significantly impedes the utilization of computational resources. Therefore, the FasterNet module proposes the use of PConv to achieve a reduction in redundant computations while also decreasing the number of memory accesses, thereby enabling more efficient extraction of spatial features. In the PConv architecture, h and w correspond to the width and height of the input feature map, respectively, c signifies the channel count in conventional convolution, cp denotes the number of channels used for feature extraction in PConv, and k specifies the dimensions (both height and width) of the filter. The symbol ∗ indicates the convolution operation. PConv performs standard convolution on a subset of input channels for spatial feature extraction, retaining the remaining channels in their original form. Consequently, even though the input and output feature maps have identical channel counts, the FLOPs and memory access frequency S of PConv are significantly reduced to:
The FLOPs and memory access count S for conventional convolution Conv are as follows:
In calculations, c is generally greater than cp. Consequently, using PConv can reduce the computational load while decreasing the amount of memory access.
By embedding PWConv after PConv, the information from all channels can be fully utilized. The comparison of the PConv + PWConv structure is shown in Figure 6. It can be observed that the effective receptive field of this structure on the input feature map resembles a T-shaped Conv, which prioritizes the central location more than the conventional Conv.

Figure 6.
Structural comparison diagram. (a) PConv + PWConv. (b) T-shaped Conv. (c) Regular Conv [31].
3.2.3. DySample Module
The fundamental concept of DySample [32] is to accomplish the upsampling procedure via point sampling. This upsampling method teaches the positions of the sampling points and, combined with the strategy of dynamic upsampling, avoids the complex computations associated with dynamic convolution. Therefore, compared with traditional upsampling methods (such as FADE, SAPA, etc.), DySample is more flexible and can adapt to the needs of different scenarios. The flowchart of DySample is shown in Figure 7.

Figure 7.
DySample flowchart [32].
Initially, an input feature map X of size C × H × W is introduced. Thereafter, the dynamic sampling point generator dynamically generates sampling coordinates based on the characteristics of X. These coordinates form a sampling set S of size 2g × sH × sW, where 2g represents the coordinates in the x and y dimensions. Finally, the gridsample function employs the coordinates from sampling set S to locate the pixel values within the feature map X and produces an upsampled feature map of size C × Sh × sW through interpolation, denoted as X’. The corresponding formula is shown in Equation (7):
The procedure for generating the sampling set is depicted in Figure 8. To enhance the quality and precision of sampling set S, it is essential to determine the offset range based on both the static and dynamic range factors.
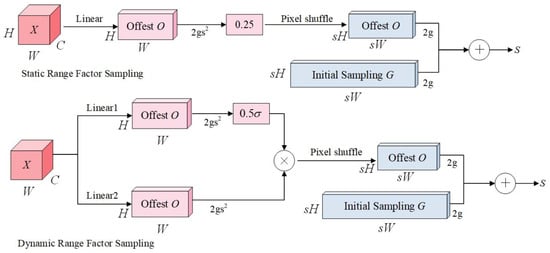
Figure 8.
Sampling set generation process [32].
The sampling method is based on the static range factor. First, the input feature map X is characterized by dimensions C × H × W. Subsequently, a linear transformation is applied to X, with C input channels and 2s2 output channels, resulting in an offset O with dimensions 2s2 × H × W. As illustrated in Equation (8):
To constrain the range of movement for local sampling positions and prevent significant overlap in the movement range, the static sampling factor is set to 0.25. The offset O is subsequently reconfigured to dimensions of 2 × H × W through the pixel reorganization technique. Sampling set S is obtained by adding the offset O to the original sampling grid G. As depicted in Equations (9) and (10):
For the sampling approach based on dynamic range factors, the primary concept involves utilizing linear projection to transform the information within the feature map into a novel space, thus generating a distinct dynamic range factor for each sampling point. By integrating the sigmoid function with a static factor of 0.5, the dynamic range factor’s value is confined within the range [0, 0.5]. This ensures that the midpoint value of the dynamic range factor aligns with the static range factor at 0.25. Subsequently, the offset O is derived via a pixel reorganization technique. As illustrated in Equation (11):
4. Experimental Results and Analysis
4.1. Dataset Collection and Processing
This study utilizes the publicly available GDXray [33] X-ray WDD dataset. This dataset, provided by the German Federal Institute for Materials Research and Testing (BAM), comprises weld joints of a fusion welding type. Traditional X-ray film was used to capture the weld images, which were then digitized using a Lumisys LS85 SDR laser scanner (Budapest, Hungary). The considerable image dimensions in the GDXray dataset could result in the omission of weld defect information during the defect detection process. Therefore, this paper employs a sliding window-based image patch processing technique to segment the images into sub-images of 640 × 640 pixels. A total of 865 weld defect images were collected, covering five common defect types: fissures, voids, inadequate fusion, insufficient penetration, and entrapped inclusions. The characteristics of these five weld defects are shown in Figure 9. There are 227 images containing “Crack”, 166 images containing “Lack Of Fusion”, 151 images containing “Lack Of Penetration”, 241 images containing “Porosity”, and 125 images containing “Slag Inclusion”. Furthermore, to simulate X-ray weld image acquisition in a real industrial environment, the X-ray weld defect dataset was processed using methods such as horizontal flipping, reducing brightness, increasing brightness, and adding noise. Using these methods, an experimental dataset of 3460 X-ray weld defect images was constructed. Some X-ray weld defect processing methods are illustrated in Figure 10. In addition, the dataset is divided into training, validation, and testing subsets at a ratio of 8:1:1 through random assignment.

Figure 9.
Five types of X-ray weld defects. (a) Crack. (b) Lack of penetration. (c) Lack of fusion. (d) Porosity. (e) Slag Inclusion.

Figure 10.
X-ray weld seam images simulating a real industrial environment. (a) Original image. (b) Horizontal flip. (c) Increased brightness. (d) Decreased brightness. (e) Added noise.
4.2. Experimental Configuration
The hyperparameter settings for the current experiment are detailed as follows: the input image resolution is configured at 640 × 640 pixels, the batch size is set to 16, the iteration count is fixed at 200, the initial learning rate is adjusted to 0.01, the weight decay coefficient is set to 0.0005, the momentum coefficient is set to 0.937, and the optimization algorithm used is stochastic gradient descent (SGD). The experiment was conducted on a Windows 11 operating system using the PyTorch 2.0.1 deep learning framework. The specific experimental parameter settings during the training phase are summarized in Table 1.

Table 1.
Experimental parameter configuration.
4.3. Evaluation Metrics
The model’s performance is evaluated using metrics such as precision (P), recall (R), mean average precision (mAP), parameter count (Params), floating-point operations (GFLOPs), and detection frame rate (FPS). A quantitative analysis approach is utilized to comprehensively evaluate the effectiveness of the enhanced algorithm in the context of the X-ray WDD task. The mathematical expressions for these evaluation metrics are provided as follows:
In the formula, TP denotes the number of samples accurately identified as weld defects; FP indicates the number of samples mistakenly identified as weld defects; FN signifies the number of samples accurately identified as non-weld defects.
4.4. Ablation Experiments
To comprehensively assess the enhancement of AFD-YOLOv10 relative to the original YOLOv10n architecture and to validate the effectiveness of every new component, a series of ablation studies was executed on the enhanced algorithm. All experiments were performed in a consistent environment, employing identical hyperparameter settings and a stepwise module integration approach to form the experimental groups. Among them, Group 1 is the original YOLOv10n model, Group 8 is the improved AFD-YOLOv10 model, and Groups 2–7 are intermediate models progressively adding different innovative modules based on the YOLOv10n model. The experiments used the GDXray weld defect dataset for validation, and P, R, mAP, Params, GFLOPs, and FPS were used as evaluation metrics. The results of these ablation experiments are presented in Table 2.

Table 2.
Ablation experiments.
The comparative analysis of the ablation experiments shows that Experiment 1 is the original model of YOLOv10n. In Experiment 2, the replacement of traditional convolution in the YOLOv10n backbone with AKConv variable kernel convolution yielded substantial improvements in P, R, and mAP, with respective increases of 3.3%, 3.7%, and 3.9%. Additionally, the Params were reduced by 0.02 M. This suggests that the flexible convolution mechanism of the variable kernel convolution can adaptively adjust the size and shape of the convolution kernel according to specific requirements, thereby enhancing the model’s ability to accommodate the multi-scale variations of weld defects. Moreover, the flexible convolution mechanism can reduce unnecessary parameters to optimize model performance and ensure the model’s lightweight nature. In Experiment 3, exchanging the C2f module within the backbone and neck for the lightweight C2f-Faster led to a small drop in defect DA. However, the model’s FPS increased from 78.7 f/s to 87.9 f/s. This demonstrates that the C2f-Faster module can effectively reduce redundant computations and memory accesses, thereby achieving a more lightweight and efficient model architecture. In Experiment 4, the integration of the DySample module into the neck network achieved a P of 88.9%, R of 87.8%, and mAP of 91.6%. The model’s Params and GFLOPs remained largely stable, while the FPS increased to 79.5 f/s. This suggests that DySample, by employing point sampling, effectively avoids the intricate computational processes inherent in traditional dynamic convolutions. Consequently, it significantly enhances the model’s detection accuracy for weld defects and improves detection speed.
When the three innovative modules are combined, a significant synergistic effect on model performance can be observed. For example, in Experiment 5, by adding AKConv variable kernel convolution to the basis of Experiment 3, the model’s P, R, and mAP reached 88.3%, 87.9%, and 92.1%. These metrics show a significant improvement in detection accuracy compared with Experiment 3. Concurrently, the model’s Params and GFLOPs decreased by 0.03 M and 0.1, respectively, while the FPS increased to 88.6 f/s. The dynamic convolution operation in the AKConv module compensates for the information loss that might occur due to C2f-Faster channel pruning. This allows for improved defect detection accuracy while maintaining the lightweight nature of the model. In Experiment 6, adding the DySample module to the basis of Experiment 3 also significantly improved detection accuracy, with a slight increase in detection speed compared with Experiment 3. The lightweight C2f-Faster reduces memory access bottlenecks, enabling DySample to perform dynamic upsampling with minimal latency. This ensures efficient feature fusion within the neck network, balancing detection speed and accuracy. In Experiment 7, the concurrent addition of AKConv variable kernel convolution and the DySample module to the model yielded substantial improvements in P, R, and mAP, with mAP reaching 93.9%, the highest value observed across all experiments. Although the model’s Params and GFLOPs slightly increased compared with the original YOLOv10n model, they increased by 0.17 M and 1.0 compared with Experiment 3, which only added the C2f-Faster module, while the FPS decreased by 7.7. This indicates that the C2f-Faster module can achieve model lightweighting, thereby improving detection speed. The irregular kernel sampling of AKConv enhances the richness of spatial features, while DySample’s dynamic upsampling preserves crucial defect details during resolution recovery. This pairing avoids the “fixed grid” limitations of traditional convolution and upsampling, enabling a joint optimization of multi-scale feature extraction and reconstruction. In Experiment 8, when all three innovative modules—AKConv, C2f-Faster, and DySample—were introduced into the model, the P, R, and mAP reached 90.7%, 88.8%, and 93.8%, respectively. Although the mAP slightly decreased compared with Experiment 7, the model’s Params and GFLOPs were significantly reduced to 2.47 M and 6.8, respectively, while the FPS reached 89.1 f/s. Compared with the unmodified YOLOv10n model, the detection accuracy has significantly improved, with noticeable reductions in Params and GFLOPs, as well as a significant increase in detection speed. Therefore, the synergistic interplay of the three modules allows the model to strike a balance between detection efficiency and accuracy, demonstrating the effectiveness of the proposed AFD-YOLOv10 model for detecting X-ray weld defects.
4.5. Comparison of the Improved Model with the Original Model
To visually demonstrate the detection effectiveness of the AFD-YOLOv10 model for X-ray weld defects, a contrast of the confusion matrices is shown between the AFD-YOLOv10 and YOLOv10n baseline models, as illustrated in Figure 11. In the confusion matrix, the rows represent the true defect categories, while the columns represent the defect categories predicted by the model. The value in each cell indicates the proportion of samples from the corresponding true category that are predicted as that category. The main diagonal area represents the model’s correct recognition rate for each defect category, which is the recall rate for each defect detection. The other areas indicate the proportion of misclassifications. The depth of the color reflects the proportion, with darker colors indicating higher proportions and lighter colors indicating lower proportions. By comparing the confusion matrices, it is evident that the main diagonal area of the AFD-YOLOv10 confusion matrix is darker and has higher values than that of the YOLOv10n main diagonal area. This indicates that the AFD-YOLOv10 model has a higher recall rate for each category of X-ray weld defects compared with the YOLOv10n baseline model. Therefore, the AFD-YOLOv10 model demonstrates better detection performance for X-ray weld defects.
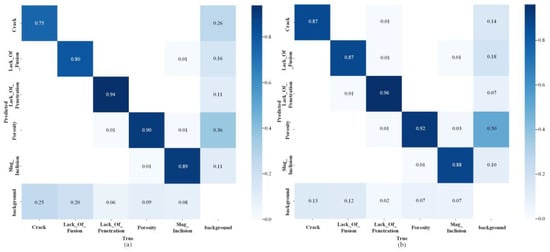
Figure 11.
Comparison of confusion matrices. (a) Confusion matrix of YOLOv10n. (b) Confusion matrix of AED-YOLOv10.
To visually demonstrate the accuracies of the AFD-YOLOv10 and YOLOv10n models in detecting various categories of X-ray weld defects, we compared the models using PR curves, as depicted in Figure 12. In this figure, “all classes” denotes the mean average precision for all defect categories in X-ray welds, while the other curves represent the recognition accuracy for each specific defect category. The comparison results indicate that the improved model shows varying degrees of enhancement in detection accuracy across the five types of X-ray weld defects, with particularly significant enhancement observed in the detection of Crack defects, where the accuracy rose from 78.4% to 91.6%. Additionally, the detection accuracy for the Lack of Penetration defect reached the highest at 97.4%. Overall, the mean average precision for all categories of X-ray weld defects improved from 88.5% to 93.8%, representing an increase of 5.3%.
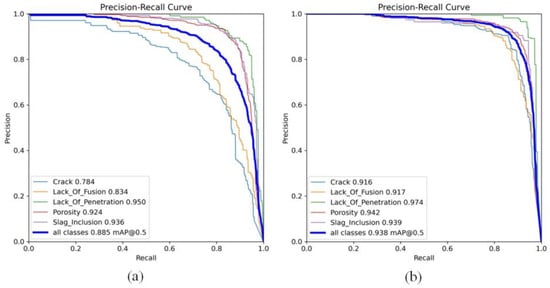
Figure 12.
Comparison of P-R Curves. (a) P-R curve of YOLOv10n. (b) P-R curve of AED-YOLOv10.
4.6. Comparison Experiments and Visualization Analysis of Different Models
The ablation experiments substantiated the viability of the enhanced algorithm introduced in this study. To further systematically evaluate the holistic efficacy of the AFD-YOLOv10 architecture for X-ray weld defect identification, comparative experiments were designed and executed. AFD-YOLOv10 was compared and analyzed with the baseline model YOLOv10n, as well as the currently mainstream defect detection methods: Faster R-CNN, SSD, YOLOv3-tiny, YOLOv5n, YOLOv7n, YOLOv8n, and YOLOv9t. The evaluation metrics utilized included P, R, mAP, Params, GFLOPs, and FPS. The comparison results are presented in Table 3.

Table 3.
Comparison of results from different models.
By analyzing the experimental results, the AFD-YOLOv10 model introduced in this research enhances mAP by 3.7% when compared with Faster R-CNN. However, Faster R-CNN achieved an average precision of 90.1% in X-ray WDD, which is higher than YOLOv5n, YOLOv8n, YOLOv9t, and YOLOv10n, the model’s large number of parameters results in a reduced detection speed. Industrial inspection requires high-performance equipment for deployment, which incurs high costs. While the SSD model is designed for single-stage detection, its overall performance still shows a significant gap compared with the YOLO series models. YOLOv3-tiny, YOLOv5n, YOLOv8n, and YOLOv9t, as part of the YOLO series, demonstrate varying degrees of improvement in detection accuracy and speed compared with the SSD model, but their performance is still not satisfactory. As an advanced model, YOLOv10n demonstrates substantial enhancements in detection accuracy and speed when juxtaposed with YOLOv3-tiny, YOLOv5n, YOLOv8n, and YOLOv9t, attaining values of 88.5% and 78.7%, respectively. The overall performance of the AFD-YOLOv10 model shows a substantial enhancement compared with YOLOv10n, with an average precision increase of 5.3%, a reduction in model parameters by 0.28 M, and a detection rate improvement of 10.4%. Therefore, the AFD-YOLOv10 model not only enhances the detection accuracy of X-ray weld defects but also realizes model lightweighting, significantly improving detection performance. In summary, the AFD-YOLOv10 algorithm model introduced in this study outperforms other algorithms in the task of detecting X-ray weld defects, enabling rapid and high-precision identification of defects in X-ray welds.
To visually present the performance of mainstream models in X-ray WDD, a performance comparison chart was generated after 200 training epochs, using P, R, mAP@50, and mAP@50-95 as evaluation metrics. The comparative performance of mainstream models is depicted in Figure 13. Upon examining the figure, it is evident that following 200 training epochs, the AFD-YOLOv10 model performs excellently in terms of P, R, mAP@50, and mAP@50-95 compared with other mainstream models. Therefore, the AFD-YOLOv10 model shows significant performance improvements in the task of detecting X-ray weld defects.
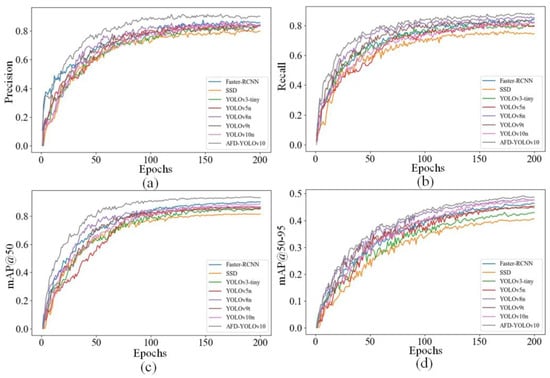
Figure 13.
Performance comparison of mainstream models. (a) Precision. (b) Recall. (c) mAP@50. (d) mAP@50-95.
Low detection accuracy in small object detection is a key challenge in the field of NDT. Therefore, to validate the detection performance of the AFD-YOLOv10 model for five types of X-ray weld defects—Crack, Lack of Fusion, Lack of Penetration, Porosity, and Slag Inclusion—the AFD-YOLOv10 model was compared with mainstream detection algorithm models in terms of detection accuracy for these five X-ray weld defects. Table 4 presents the results of this comparison.

Table 4.
Comparison of detection accuracy for five X-ray weld defects across different models.
Table 4 shows that the proposed AFD-YOLOv10 model achieves detection accuracies of 0.916, 0.917, 0.974, 0.942, and 0.939 for the five X-ray weld defects: Crack, Lack of Fusion, Lack of Penetration, Porosity, and Slag Inclusion, respectively. Compared with other mainstream detection models, the proposed model achieves the highest accuracy for all five defect types. Furthermore, it can accurately detect small target defects, such as porosity within the weld, and exhibits high accuracy in detecting the rare Slag Inclusion defect type.
Selected results comparing the AFD-YOLOv10 model with other mainstream models in X-ray WDD are illustrated in Figure 14. The illustration clearly reveals that, compared with the optimized AFD-YOLOv10 model, several other models exhibit issues such as insufficient detection accuracy, anchor box mismatches, and missed detections in X-ray WDD. Figure 14 indicates that anchor box mismatches can be categorized into two main situations: one is that the defect area is not adequately enclosed, and the other is that multiple anchor boxes are used to enclose the defect area. Moreover, missed detections for small targets are observed in the detection outcomes of YOLOv9t in Column (Figure 14d) and SSD, YOLOv9t, and YOLOv10n in Column (Figure 14e). Through a comparison of the detection results of various models for the five categories of X-ray weld defects, it is evident that the enhanced AFD-YOLOv10 model introduced in this study effectively addresses issues of inadequate detection accuracy, anchor box mismatches, and missed detections.
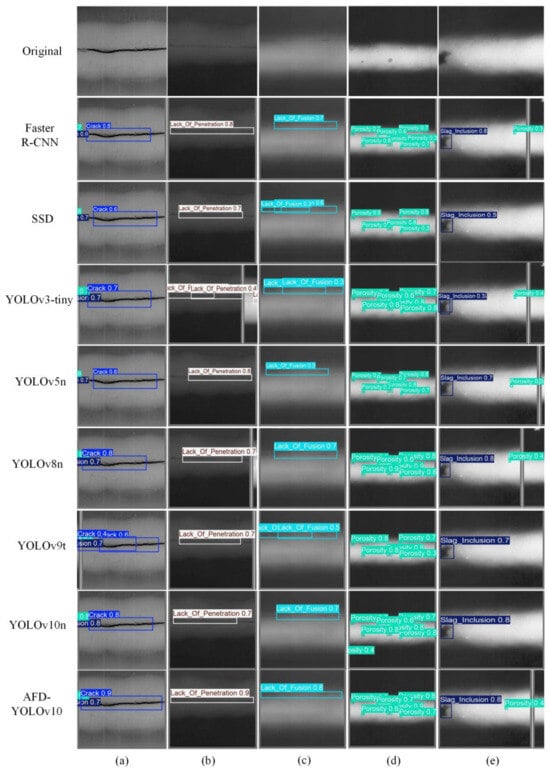
Figure 14.
Comparison of detection results of different models. (a) Crack. (b) Lack of Penetration. (c) Lack of Fusion. (d) Porosity. (e) Slag Inclusion.
To visually present the performance of different models in detecting X-ray weld defects, this study employs a heatmap visualization method to compare and analyze the detection results of AFD-YOLOv10 with mainstream object detection algorithms, aiming to investigate the attention distribution of the models when detecting different types of defects. A comparison of heatmaps for different models is shown in Figure 15. The color depth of the heatmap reflects the model’s level of attention to that specific area, with red areas indicating the highest level of attention. The comparison of the heatmaps reveals that Faster R-CNN and YOLOv10n exhibit overly concentrated attention distributions, which tend to overlook the detailed features of the target areas, making the distinction of key regions less obvious. SSD, YOLOv3-tiny, and YOLOv5n exhibit excessive dispersion in their attention, making it difficult to accurately locate key areas, and their positioning ability and detection accuracy in low-resolution images are insufficient. YOLOv8n and YOLOv9t show some improvement in attention distribution, being able to focus more accurately on defect areas; however, when faced with blurred defect features, their attention does not fully cover the defects, resulting in poor detection stability and insufficient capture of some detailed features. In contrast, the AFD-YOLOv10 model significantly improves its attention capability towards target defect areas. In the heatmap of AFD-YOLOv10, the attention coverage is broader, allowing for accurate focus on defect areas while reducing attention to background and other distracting information. Therefore, the AFD-YOLOv10 model is better equipped to handle complex tasks, making it more practical and reliable in real-world applications.
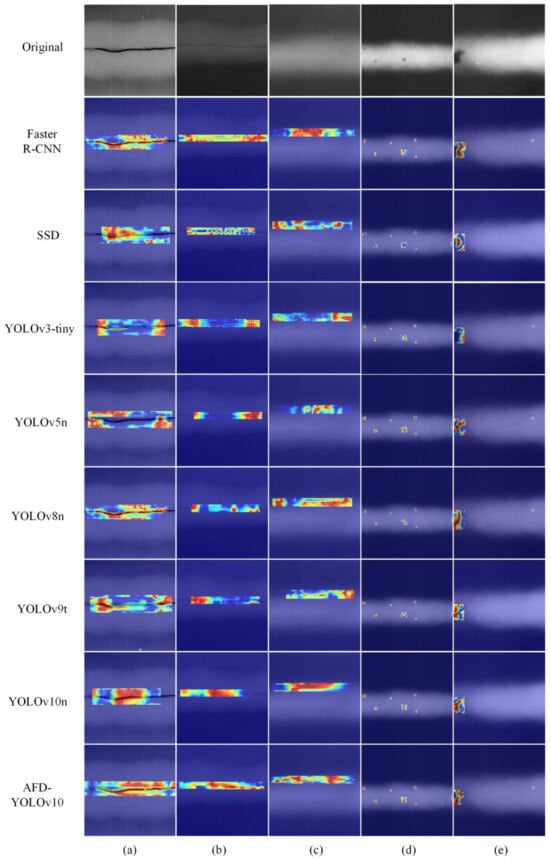
Figure 15.
Comparison of heatmaps for different models. (a) Crack. (b) Lack of Penetration. (c) Lack of Fusion. (d) Porosity. (e) Slag Inclusion.
4.7. Generalization Experiment
To assess the generalization capacity of the AFD-YOLOv10 algorithm presented in this study, the trained model was applied to the NEU-DET dataset [34] for surface defect detection on steel. This dataset includes six types of defects: Rolled-in scale, Patches, Cracking, Pitted surface, Inclusion, and Scratches, totaling 1800 images. A comparison between the AFD-YOLOv10 and YOLOv10n algorithms was conducted, and the results are shown in Table 5.

Table 5.
Comparison of generalization experiment results.
The AFD-YOLOv10 model achieved a P of 88.2%, a R of 91.1%, and a mAP of 92.5% on the NEU-DET dataset. These metrics represent improvements of 4.6%, 5.3%, and 5.9% over YOLOv10n, respectively. Additionally, the model’s Params and GFLOPs were reduced by 0.24 M and 2.2, while the FPS increased by 11.7 f/s. The outcomes of the comparative experiment demonstrate that the enhanced AFD-YOLOv10 model is capable of rapidly and accurately detecting various defects, thereby exhibiting strong generalization ability.
The comparison of PR curves for the AFD-YOLOv10 and YOLOv10n models on the NEU-DET dataset is depicted in Figure 16. Research findings reveal that the AFD-YOLOv10 model achieved a 5.9% enhancement in average precision for detecting all defect categories compared with the YOLOv10n model. Furthermore, the model showed varying degrees of improvement in detection accuracy for the six types of defects on the steel surface. Among these, the detection accuracy for cracking defects saw the largest increase, rising from 53.4% to 73.7%. Additionally, recognition accuracy for the remaining five defects—namely, Inclusion, Patches, Pitted surface, Rolled-in scale, and Scratches—also exhibited varying degrees of improvement.
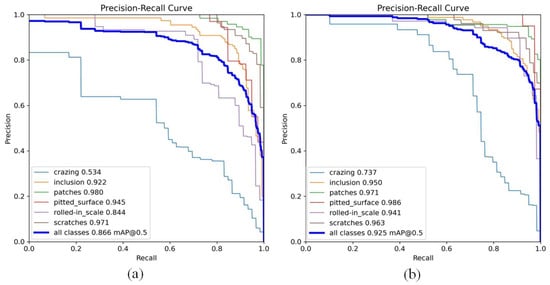
Figure 16.
P-R Curve Comparison. (a) P-R curve of YOLOv10n. (b) P-R curve of AED-YOLOv10.
Figure 17 shows partial result images detected by the AFD-YOLOv10 and YOLOv10n models. Figure 17 reveals that, compared with the enhanced AFD-YOLOv10 model, the YOLOv10n baseline model displays issues such as inadequate detection accuracy, anchor box mismatches, and missed detections in detecting surface defects on steel, especially in the detection of small targets. For example, there were missed detections of small targets for the defects of Inclusion, Patches, and Rolled-in scale, and anchor box mismatches were observed for the cracking defect. By comparing the detection results, the AFD-YOLOv10 model performs excellently in effectively addressing the missed detection issues and improving detection accuracy for surface defects on steel. This further validates the practicality and effectiveness of the AFD-YOLOv10 model in industrial production.
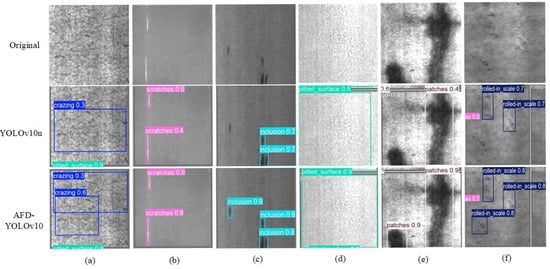
Figure 17.
Comparison of detection results of different models. (a) Cracking. (b) Scratches. (c) Inclusion. (d) Pitted surface. (e) Patches. (f) Rolled-in scale.
The improved model AFD-YOLOv10 demonstrated strong generalization ability, as validated using the NEU-DET dataset. However, it is crucial to acknowledge that while the improved model demonstrates robust performance on datasets beyond GDXray, defect characteristics can vary substantially depending on the alloy system and the thermomechanical history of the material. For example, nano-twinned high-Mn steels display unique crack propagation and void coalescence mechanisms that might not be fully captured or represented in standard datasets [35].
5. Conclusions
This paper addresses the low accuracy and slow detection speed issues in NDT of X-ray weld defects. It proposes a lightweight X-ray weld defect detection model, AFD-YOLOv10, utilizing the GDXray dataset. First, the traditional convolutional layers in the backbone network of the YOLOv10n baseline model were replaced with the AKConv variable-kernel convolutional module. The adaptable convolutional framework of AKConv facilitates enhanced accommodation to the multi-scale variations of welding defect features while diminishing the number of model parameters. Additionally, the lightweight C2f-Faster module was introduced into both the backbone and neck networks, which effectively decreased the parameter count and computational complexity, achieving model lightweighting. Moreover, the DySample module was embedded in the neck network. By employing point sampling, DySample avoided the complex calculations associated with traditional dynamic convolutions.
The experimental results demonstrate that compared with the YOLOv10n baseline model, the improved AFD-YOLOv10 model in this paper achieves a significant enhancement in average precision, from 88.5% to 93.8%. Meanwhile, the model’s parameters are reduced from 2.75 M to 2.47 M, and the detection speed increases from 78.7 f/s to 89.1 f/s. For the five types of X-ray weld defects—Crack, Lack of Fusion, Lack of Penetration, Porosity, and Slag Inclusion—the detection precision of the AFD-YOLOv10 model reaches 0.916, 0.917, 0.974, 0.942, and 0.939, respectively. These results confirm the effectiveness of the AFD-YOLOv10 model in achieving high-precision and lightweight detection. When contrasted with other mainstream models, the AFD-YOLOv10 model stands out as the most accurate in detection, the smallest in size, and the fastest in detection speed. Additionally, experiments on the NEU-DET steel surface defect dataset validate the strong generalization ability of the AFD-YOLOv10 model.
Although the effectiveness of the AFD-YOLOv10 model has been validated using the GDXray dataset, this dataset has certain limitations because of the relatively small number of original weld defect images and its laboratory-quality nature, which do not fully reflect the imaging conditions of X-ray images in real industrial environments. While attempts to add noise aim to simulate real industrial imaging conditions, there remains a gap compared with actual industrial settings. Therefore, the improved model presented in this paper may lack robustness in detecting actual X-ray weld defects. Additionally, the improved model in this study has not yet been validated in real scenarios on embedded systems, nor has it been tested for defect detection on nonlinear weld contours, such as cylindrical pipes. Future research will focus on collecting X-ray images of linear and nonlinear fusion weld defects generated in real industrial environments to validate the effectiveness of the AFD-YOLOv10 model. Efforts will also continue to explore new improvement strategies to enable real-time detection of X-ray weld defects on X-ray welding scanning devices.
Author Contributions
Conceptualization, H.W.; methodology, H.W.; software, H.H.; validation, H.W., H.H. and T.S.; formal analysis, H.W.; investigation, H.W.; resources, H.W.; data curation, H.W.; writing—original draft preparation, H.W.; writing—review and editing, R.G.; visualization, H.W.; supervision, R.G.; project administration, R.G.; funding acquisition, R.G. All authors have read and agreed to the published version of the manuscript.
Funding
This research is funded by the National Natural Science Foundation of China (Grant No. 52075261).
Data Availability Statement
The datasets presented in this article are not readily available because these data are part of an ongoing study. Requests to access the datasets should be directed to rrgeng@nuaa.edu.cn.
Acknowledgments
The author sincerely thanks those who have provided assistance with this manuscript.
Conflicts of Interest
The authors declare no conflicts of interest.
References
- Li, L.L.; Ren, J.; Wang, P.; Lv, Z.G.; Di, R.H.; Li, X.Y.; Gao, H.; Zhao, X.M. Defect detection method for high-resolution weld based on wandering Gaussian and multi-feature enhancement fusion. Mech. Syst. Sig. Process. 2023, 199, 110484. [Google Scholar] [CrossRef]
- Liu, X.Y.; Liu, J.H.; Zhang, H.Q.; Zhang, H.G.; Shen, X.K. DGICR-Net: Dual-Graph Interactive Consistency Reasoning Network for Weld Defect Recognition with Limited Labeled Samples. IEEE Trans. Instrum. Meas. 2024, 73, 4503612. [Google Scholar] [CrossRef]
- Zuo, F.; Liu, J.; Zhao, X.; Chen, L.; Wang, L. An X-ray-based automatic welding defect detection method for special equipment system. IEEE-ASME Trans. Mechatron. 2023, 29, 2241–2252. [Google Scholar] [CrossRef]
- Yang, D.M.; Cui, Y.R.; Yu, Z.Y.; Yuan, H.Q. Deep learning based steel pipe weld defect detection. Appl. Artif. Intell. 2021, 35, 1237–1249. [Google Scholar] [CrossRef]
- Xu, L.H.; Dong, S.H.; Wei, H.T.; Peng, D.H.; Qian, W.C.; Ren, Q.Y.; Wang, L.M.; Ma, Y.D. Intelligent identification of girth welds defects in pipelines using neural networks with attention modules. Eng. Appl. Artif. Intell. 2024, 127, 107295. [Google Scholar] [CrossRef]
- Khedr, M.; Wei, L.; Na, M.; Liu, W.Q.; Jin, X.J. Effects of increasing the strain rate on mechanical twinning and dynamic strain aging in Fe-12.5Mn-1.1C and Fe–24Mn-0.45C–2Al austenitic steels. Mat. Sci. Eng. A-Struct. 2022, 842, 143024. [Google Scholar] [CrossRef]
- Mohandas, R.; Mongan, P.; Hayes, M. Ultrasonic Weld Quality Inspection Involving Strength Prediction and Defect Detection in Data-Constrained Training Environments. Sensors 2024, 24, 6553. [Google Scholar] [CrossRef]
- Zhang, R.; Liu, D.H.; Bai, Q.F.; Fu, L.H.; Hu, J.; Song, J.L. Research on X-ray weld seam defect detection and size measurement method based on neural network self-optimization. Eng. Appl. Artif. Intell. 2024, 133, 108045. [Google Scholar] [CrossRef]
- Tang, S.Y.; Gao, X.R.; Tian, K.; Zhang, Q.; Zhang, X.; Peng, J.P.; Guo, J.Q. Non-destructive evaluation of weld defect with coating using electromagnetic induction thermography. Nondestruct. Test. Eval. 2024, 39, 347–365. [Google Scholar] [CrossRef]
- Chen, Y.H.; Chen, B.; Yao, Y.Z.; Tan, C.W.; Feng, J.C. A spectroscopic method based on support vector machine and artificial neural network for fiber laser welding defects detection and classification. NDT E Int. 2019, 108, 102176. [Google Scholar] [CrossRef]
- Wang, Y.; Guo, H. Weld defect detection of X-ray images based on support vector machine. IETE Technol. Rev. 2014, 31, 137–142. [Google Scholar] [CrossRef]
- Ajmi, C.; Zapata, J.; Elferchichi, S.; Laabidi, K. Advanced faster-RCNN model for automated recognition and detection of weld defects on limited X-ray image dataset. J. Nondestr. Eval. 2024, 43, 14. [Google Scholar] [CrossRef]
- Ren, S.Q.; He, K.M.; Girshick, R.; Sun, J. Faster R-CNN: Towards real-time object detection with region proposal networks. Adv. Neural Inf. Process. Syst. 2016, 39, 1137–1149. [Google Scholar] [CrossRef]
- Liu, W.; Anguelov, D.; Erhan, D.; Szegedy, C.; Reed, S.; Cheng, Y.F. Ssd: Single shot multibox detector. In Proceedings of the Computer Vision–ECCV 2016: 14th European Conference, Amsterdam, The Netherlands, 11–14 October 2016; pp. 21–37. [Google Scholar]
- Li, K.N.; Jiao, P.G.; Ding, J.M.; Du, W.B. Bearing defect detection based on the improved YOLOv5 algorithm. PLoS ONE 2024, 19, e0310007. [Google Scholar] [CrossRef] [PubMed]
- Szolosi, J.; Szekeres, B.J.; Magyar, P.; Adrian, B.; Farkas, G.; Ando, M. Welding defect detection with image processing on a custom small dataset: A comparative study. IET CIM. 2024, 6, e70005. [Google Scholar] [CrossRef]
- Li, X.Q.; Liu, P.Y.; Yin, G.F.; Jiang, H.H. Weld defect detection by X-ray images method based on Fourier fitting surface. Trans. China Weld. Inst. 2014, 35, 61–64. [Google Scholar]
- Malarvel, M.; Singh, H. An autonomous technique for weld defects detection and classification using multi-class support vector machine in X-radiography image. Optik 2021, 231, 166342. [Google Scholar] [CrossRef]
- Sun, J.; Li, C.; Wu, X.J.; Palade, V.; Fang, W. An effective method of weld defect detection and classification based on machine vision. IEEE Trans. Ind. Inform. 2019, 15, 6322–6333. [Google Scholar] [CrossRef]
- Chen, Y.B.; Wang, J.R.; Wang, G.T. Intelligent Welding Defect Detection Model on Improved R-CNN. IETE J. Res. 2022, 69, 9235–9244. [Google Scholar] [CrossRef]
- Xu, L.S.; Dong, S.H.; Wei, H.T.; Ren, Q.Y.; Huang, J.W.; Liu, J.Y. Defect signal intelligent recognition of weld radiographs based on YOLO V5-IMPROVEMENT. J. Manuf. Processes. 2023, 99, 373–381. [Google Scholar] [CrossRef]
- Shi, L.K.; Zhao, S.Y.; Niu, W.F. A welding defect detection method based on multiscale feature enhancement and aggregation. Nondestr. Test. Eval. 2024, 39, 1295–1314. [Google Scholar] [CrossRef]
- Han, Z.L.; Li, S.S.; Chen, X.M.; Huang, B.C.; Sun, J.; Zhang, Q.G. DFW-YOLO: YOLOv5-based algorithm using phased array ultrasonic testing for weld defect recognition. Nondestr. Test. Eval. 2024, 40, 2516–2539. [Google Scholar] [CrossRef]
- Ding, B.D.; Zhang, H.M.; Huang, Z.H.; Ding, S.Z. Data enhanced YOLOv8s algorithm for X-ray weld defect detection. Nondestructive. Nondestr. Test. Eval. 2024, 41, 1–24. [Google Scholar] [CrossRef]
- Yang, J.; Fu, B.; Zeng, J.Q.; Wu, S.X. Yolo-xweld: Efficiently detecting pipeline welding defects in x-ray images for constrained environments. In Proceedings of the International Joint Conference on Neural Networks (IJCNN), Padua, Italy, 18–23 July 2022; pp. 1–7. [Google Scholar] [CrossRef]
- Liu, M.Y.; Chen, Y.P.; Xie, J.M.; He, L.; Zhang, Y. LF-YOLO: A lighter and faster yolo for weld defect detection of X-ray image. IEEE Sens. J. 2023, 23, 7430–7439. [Google Scholar] [CrossRef]
- Zhang, Y.; Ni, Q.J. A novel weld-seam defect detection algorithm based on the s-yolo model. Axioms 2023, 12, 697. [Google Scholar] [CrossRef]
- Wang, A.; Chen, H.; Liu, L.H.; Chen, K.; Lin, Z.J.; Han, J.G.; Ding, G.G. Yolov10: Real-time end-to-end object detection. Adv. Neural Inf. Process Syst. 2024, 37, 107984–108011. [Google Scholar]
- Zhu, J.C.; Ma, C.H.; Rong, J.; Cao, Y. Bird and UAVs Recognition Detection and Tracking Based on Improved YOLOv9-DeepSORT. IEEE Access. 2024, 12, 147942–147957. [Google Scholar] [CrossRef]
- Wang, J.W.; Cao, Y.; Guo, Z.K.; Xu, C. Research on long-distance snow depth measurement Method based on improved YOLOv8. IEEE Access. 2025, 13, 55370–55380. [Google Scholar] [CrossRef]
- Chen, J.; Kao, S.H.; He, H.; Zhuo, W.; Wen, S.; Lee, C.H.; Chan, S.H.G. Run, Don’t Walk: Chasing Higher FLOPS for Faster Neural Networks. In Proceedings of the IEEE/CVF Conference on Computer Vision and Pattern Recognition, Vancouver, BC, Canada, 17–24 June 2023; pp. 12021–12031. [Google Scholar]
- Fu, R.G.; Hu, Q.Y.; Dong, X.H.; Gao, Y.H.; Li, B.; Zhong, P. Lighten CARAFE: Dynamic Lightweight Upsampling with Guided Reassemble Kernels. In Proceedings of the International Conference on Pattern Recognition, Kolkata, India, 1–5 December 2024; pp. 383–399. [Google Scholar]
- Mery, D.; Riffo, V.; Zscherpel, U.; Mondragon, G.; Lillo, L.; Zuccar, L.; Lobel, H.; Carrasco, M. GDXray: The database of X-ray images for nondestructive testing. J. Nondestr. Eval. 2015, 34, 42. [Google Scholar] [CrossRef]
- Hu, H.Y.; Tong, J.W.; Wang, H.B.; Lu, X.Y. EAD-YOLOv10: Lightweight Steel Surface Defect Detection Algorithm Research Based on YOLOv10 Improvement. IEEE Access. 2025, 13, 55382–55397. [Google Scholar] [CrossRef]
- Khedr, M.; Wei, L.; Na, M.; Yu, L.; Jin, X.J. Evolution of Fracture Mode in Nano-twinned Fe-1.1C-12.5Mn Steel. Jom 2019, 71, 1338–1348. [Google Scholar] [CrossRef]
Disclaimer/Publisher’s Note: The statements, opinions and data contained in all publications are solely those of the individual author(s) and contributor(s) and not of MDPI and/or the editor(s). MDPI and/or the editor(s) disclaim responsibility for any injury to people or property resulting from any ideas, methods, instructions or products referred to in the content. |
© 2025 by the authors. Licensee MDPI, Basel, Switzerland. This article is an open access article distributed under the terms and conditions of the Creative Commons Attribution (CC BY) license (https://creativecommons.org/licenses/by/4.0/).