Article

Extracting Multi-Dimensional Features for BMI Estimation Using a Multiplex Network

1
School of Artificial Intelligence and Information Technology, Nanjing University of Chinese Medicine, Nanjing 210023, China
2
Jiangsu Collaborative Innovation Center of Traditional Chinese Medicine in Prevention and Treatment of Tumor, Nanjing 210023, China
3
Jiangsu Province Engineering Research Center of TCM Intelligence Health Service, Nanjing University of Chinese Medicine, Nanjing 210023, China
4
Jiangsu Research Center for Major Health Risk Management and TCM Control Policy, Nanjing University of Chinese Medicine, Nanjing 210023, China
*
Author to whom correspondence should be addressed.
Symmetry 2025, 17(6), 877; https://doi.org/10.3390/sym17060877
Submission received: 29 April 2025 / Revised: 21 May 2025 / Accepted: 27 May 2025 / Published: 4 June 2025
(This article belongs to the Section Computer)

Abstract

:
Body Mass Index (BMI) is a crucial indicator for assessing human obesity and overall health, providing valuable insights for applications such as health monitoring, patient re-identification, and personalized healthcare. Recently, several data-driven methods have been developed to estimate BMI using 2D and 3D features extracted from facial and body images or RGB-D data. However, current research faces challenges such as the incomplete consideration of anthropometric features, the neglect of multiplex networks, and low-BMI-estimation performance. To address these issues, this paper proposes three 3D anthropometric features, one 2D anthropometric feature, and a deep feature extraction method to comprehensively consider anthropometric features. Additionally, a BMI estimation method based on a multiplex network is introduced. In this method, three types of features are extracted by constructing a multichannel network, and BMI estimation is performed using Kernel Ridge Regression (KRR). The experimental results demonstrate that the proposed method significantly outperforms state-of-the-art methods. By incorporating symmetry into our analysis, we can uncover deeper patterns and relationships within complex systems, leading to a more comprehensive understanding of the phenomena under investigation.

1. Introduction

Body Mass Index (BMI) is a commonly used indicator to measure the degree of obesity, classifying people as underweight, normal weight, overweight, or obese [1,2]. In recent years, research focused on the prediction of BMI has attracted increasing attention. Traditionally, BMI is obtained by measuring an individual’s height and weight. However, this method may encounter multiple challenges due to the physical limitations of certain patients. To address this issue, vision-based BMI measurement methods have emerged as a viable solution [3]. Previous studies have proposed predicting BMI based on facial images by analyzing the relationship between facial features and BMI [4,5,6]. Xiang et al. [7] proposed a three-dimensional deep model named STNet for visual BMI estimation. However, compared to 2D body images, clear facial images are generally more challenging to obtain due to privacy protection concerns. In addition, BMI prediction based on facial images also faces certain accuracy challenges. To overcome these challenges, some researchers have turned to using 3D human body data or RGB-D images to calculate BMI [8,9]. Although these methods can estimate BMI with reasonable accuracy under certain conditions, the acquisition of RGB-D images is highly sensitive to sunlight exposure and measurement distance, making it difficult to obtain high-quality 3D human body data in outdoor environments.
Symmetry refers to the invariance of an object or system under certain transformations, such as reflection, rotation, or translation. This concept has wide-ranging applications across multiple disciplines, from physics and chemistry to biology and engineering. By incorporating symmetry into our analysis, we can uncover deeper patterns and relationships within complex systems, leading to a more comprehensive understanding of the phenomena under investigation.
With the continuous development of computer vision and image-processing technology, some scholars have utilized 3D human reconstruction methods [10] to extract 3D anthropometric features, such as waist circumference and hip circumference, from 2D images and have then used regression methods to estimate BMI [11]. These 3D anthropometric features have been proven by Coetzee et al. [12] to be closely related to BM, and can also be predicted using parametric models. However, learning from these 3D anthropometric features still cannot strongly represent body shape information. This is the problem with the incomplete consideration of anthropometric features.
Recently, numerous health science studies have shown that certain 2D anthropometric indicators are closely related to BMI [13,14]. However, most 2D anthropometric measurement features, such as waist-to-thigh width ratio and hip-to-head width ratio, only represent the lateral proportions of the body and lack longitudinal information.
With the development of computational power, big data and deep learning, particularly Convolutional Neural Networks (CNNs), have made significant progress in the field of image processing [15]. A deep network model that extracts deep features has been applied to BMI estimation tasks; Sui et al. [11] proposed a three-branch BMI estimation method that integrates hand-defined 3D anthropometric features with features extracted using a CNN model to improve the accuracy of BMI estimation. It is evident that deep features can effectively represent the semantic characteristics of images and enhance the accuracy of BMI estimation.
Therefore, to address these issues, such as the incomplete consideration of anthropometric features, the neglect of multiplex networks, and the low performance of BMI estimation, we propose a BMI estimation method based on multiplex networks. In the proposed method, 3D anthropometric features, 2D anthropometric features, and deep features are extracted by constructing a multichannel network, and BMI estimation is performed by Kernel Ridge Regression (KRR). The 3D anthropometric extraction network calculates 3D anthropometric characteristics, such as waist circumference (WC), hip circumference (HC), and the ratio of waist circumference to hip circumference (WCHCR), using human pose estimation [16] and the reconstruction of 3D body shapes. The 2D anthropometric extraction network computes 2D anthropometric features, including the waist-to-thigh width ratio (WTR), the waist-to-hip width ratio (WHpR), the waist-to-head width ratio (WHdR), the hip-to-head width ratio (HpHdR), the number of pixels per unit area between the waist and hip (Area), the ratio of the distance from nose to knee to waist (HWR), the waist-to-width ratio (WSR), and the ratio of the distance from nose to knee to hip (H2H), through skeleton joint detection [17] and body contour detection [18]. These features comprehensively represent human body information. The deep learning extraction network extracts deep features from images using the attention-enhanced VGG model proposed in this paper. The experimental results indicate that the proposed method improves the accuracy of BMI prediction on public datasets while enhancing estimation accuracy without relying on additional information. The main contributions of this research are summarized as follows:
(1)
To address the issue of insufficient consideration of anthropometric features in existing methods, three 3D anthropometric features, one 2D anthropometric feature, and a deep feature extraction method are proposed.
(2)
A framework based on multiplex networks is proposed for estimating BMI from a single body image, addressing the neglect of multiplex networks and outperforming conventional single-network designs.
(3)
A comprehensive comparison between the state-of-the-art methods and extensive ablation studies is conducted to verify the effectiveness of the proposed method.

2. Related Works

2.1. BMI Estimation Based on 3D Anthropometric Features

With the development of 3D image technology, BMI estimation based on 3D images has gradually become a research hotspot [19], as these images can provide accurate and comprehensive body shape information. Velardo and Dugelay [20] inferred 3D anthropometric features from RGB-D body contours. Nguyen et al. [21] proposed a weight estimator based on a single RGB-D image that utilizes visual color, depth, and gender information. Currently, the estimation of body weight or BMI based on RGB-D images heavily relies on the measurement of depth information. However, as a low-cost optical sensor, the measurement accuracy of Kinect [22] is limited; therefore, the accuracy of BMI estimation is also limited.
In order to solve the aforementioned problems, some scholars use 3D imaging methods to extract 3D anthropometric features such as WC and HC from 2D images, followed by regression methods to estimate BMI. Wuhrer and Shu [23] and Pujades et al. [24] proposed methods for computing 3D anthropometric features, which can extract anthropometric data from 3D human body meshes. Subsequently, Sui et al. [11] proposed a BMI estimation method based on three branches, which fused the manually defined 3D anthropometric features with the features extracted by the CNN model to improve the accuracy of BMI estimation. These 3D anthropometric features were proven by Velardo et al. [12] to be closely related to BMI. These methods only consider 3D anthropometric features, ignoring the importance of 2D anthropometric features.

2.2. BMI Estimation Based on 2D Anthropometric Features

The conventional way of computing BMI is time-consuming and most often results in inaccuracies, as stated by Bipembi et al. [25]. The proposed approach captures the image of a person and then converts it into a silhouette. The height and volume are determined using silhouette analysis, before these parameters are used as input parameters for calculating the BMI of a person. Recently, many health science studies have shown that some 2D anthropometric indicators are closely related to BMI [13,14]. Velardo and Dugelay [26] proposed an image-based weight estimation method. This method is based on anthropometric data collected by the National Health and Nutrition Examination Survey [27]. They tested the correlation between different 2D anthropometric features and body weight to lay the foundation for subsequent vision-based estimation techniques. Building on their research, Jiang and Guo [28] first proposed five anthropometric features (WTR, WHpR, WHdR, HpHdR, and Area) for estimating BMI from 2D human images. Recently, Jin et al. [29] introduced two additional anthropometric features (HWR and WSR) to improve the generalization and accuracy of BMI estimation.
However, 2D anthropometric features, such as WTR, WHpR, WHdR, HpHdR, Area, and WSR, only represent transverse body proportions and lack longitudinal information. Although HWR includes longitudinal information, it cannot distinguish individuals with similar waist widths but significantly different hip widths. This comprises the problem of incomplete consideration of anthropometric features.

2.3. BMI Estimation Based on Deep Features

With the continuous development of deep learning, deep network models for extracting deep features have been widely applied to BMI estimation tasks. Kocabey et al. [30] utilized pre-trained VGG-Net [31] and VGG-Face models [32] to extract facial representations and employed a Support Vector Regression (SVR) model [33] to predict BMI. Diba et al. [34] addressed the research gap by proposing a deep learning approach to estimate BMI from handwritten characters, developing a CNN-comparing ResNet model [35]. Recently, deep learning-based methods have been increasingly used for BMI estimation from body images. Jin et al. [29] applied the ResNet model to extract deep features for BMI estimation, while Kim et al. [36] used a CNN to determine BMI from images, demonstrating a high correlation between predicted and actual values in test data. Jin et al. [37] further proposed an end-to-end deep learning framework for BMI estimation from body images. Despite these advancements, multiplex networks have not been widely utilized in BMI estimation research.

3. Proposed BMI Estimation Framework

Figure 1 illustrates the framework of the proposed method. In this method, the 3D anthropometric feature, 2D anthropometric feature, and deep feature are extracted using multiplex networks, and BMI estimation is performed via KRR. Specifically, the input body image is processed by three major networks: the 3D anthropometric feature extraction network, which calculates 3D features through human pose estimation, 3D human shape reconstruction, virtual measurements, the 2D anthropometric feature extraction network, which computes 2D features, and the deep learning feature extraction network, which extracts deep features from the image. Finally, the three types of features are concatenated and mapped to BMI using a regression model.

3.1. Three-Dimensional Anthropometric Feature Extraction

In the process of extracting 3D anthropometric features, data preprocessing is first performed on the input RGB image using OpenPose to obtain human pose information. OpenPose was chosen for its real-time performance and robustness in detecting human poses across diverse datasets and scenarios. Its widespread adoption and community support facilitated seamless integration into our pipeline. Although alternative methods like AlphaPose [38] offer similar capabilities, OpenPose’s extensive documentation and pre-trained models make it a more practical choice for implementation in our research.
Then, the SMPL-X [39] model was employed for 3D human reconstruction, acquiring parameters such as body shape, body offsets, and pose. SMPL-X provides a high-fidelity parametric model that captures not only body shapes and poses but also facial expressions and hand gestures. This level of detail is crucial for our application, where generating realistic and detailed human models is essential. Compared to other models, like SMPL [40], SMPL-X’s ability to model the full body, including hands and face, made it the preferred choice. SMPL-X is a 3D body shape reconstruction model that computes body poses, hand poses, and facial expressions from a single body image. It maps shape parameters β , pose parameters θ , and expression parameters ψ to a 3D mesh M with N = 10,475 vertices and K = 54 joints. SMPL-X includes joints of the neck, jaw, eyeball, and fingers. The shape parameter β R B ( B 300 ) has coefficients in a low-dimensional PCA space, which are calculated as follows:
M ( β , θ , ψ ) : R | θ | × | β | × | ψ | R 3 N
where θ is the pose parameter, θ R 3 ( K + 1 ) . K is the number of keypoints, β is the shape parameter β R | β | , and ψ is the expression parameter ψ R | ψ | .
Finally, 3D anthropometric features are calculated using the Shapy method [41], which leverages linguistic annotations to improve the accuracy of 3D shape reconstruction. In this study, after obtaining parameters such as body shape, body offset, and pose, WC and HC are calculated, followed by the HCHCR. The three 3D anthropometric features are calculated as follows:
(1) WC: The waist circumference is calculated as follows:
W C = ( i , j ) β x i y i z i T T t i x j y j z j T T t j 2
where i and j are two points in the convex hull and β is the SMPL-X shape parameter. ( x i , y i , z i ) are the coordinates of the waist landmark points, and t i is the body triangle index. · 2 denotes the Euclidean norm, and T t i and T t j represent transformation matrices associated with the body triangle indices t i and t j .
(2) HC: The hip circumference is calculated given the coordinates of the hip landmarks ( h i , m i , n i ) and the body triangle index t i . The HC can be calculated according to Equation (2), where the hip landmark points replace the waist landmark points in the calculation.
(3) WCHCR: The waist circumference-to-hip circumference ratio, which is based on the circumference of the waist and hips, can be calculated using the following formula:
W C H C R = W C H C

3.2. Two-Dimensional Anthropometric Feature Extraction

Two-dimensional anthropometric feature extraction involves skeleton joint detection, human contour detection, and feature calculation. First, skeleton joint detection is performed using Mask R-CNN [17]. Mask R-CNN was selected for its state-of-the-art instance segmentation capabilities, which are essential to isolate and analyze specific regions of interest in our study. Compared with a traditional two-stage method, such as R-FCN [42], Mask R-CNN’s performance is better. To meet the study’s requirements, the detected skeleton joints were converted from the original mask to a binary mask, where non-zero pixels indicate the exact location of the skeleton joints. To ensure accurate body part positioning, 17 key skeletal joints were selected for detailed contour detection [17], as shown in Figure 1. Accurate skeleton joints improve the detection accuracy of human contours and perform well even in occluded body images.
Secondly, human contour detection was performed using Pose2Seg [18], a human instance segmentation-based approach that separates instances based on human poses rather than proposal region detection, thereby reducing the influence of pose and occlusion. Pose2Seg leverages pose information to improve segmentation accuracy, which is particularly beneficial for human contour detection. However, during 2D anthropometric feature calculation, it was found that waist width measurements may include the width of the detected arm, particularly when the arm is naturally positioned next to the body. This can lead to the overestimation of waist width, negatively impacting BMI estimation accuracy. To address this issue, a self-correcting human parsing method was employed to subtract the arm regions from the contour map [43], as shown in Figure 1.
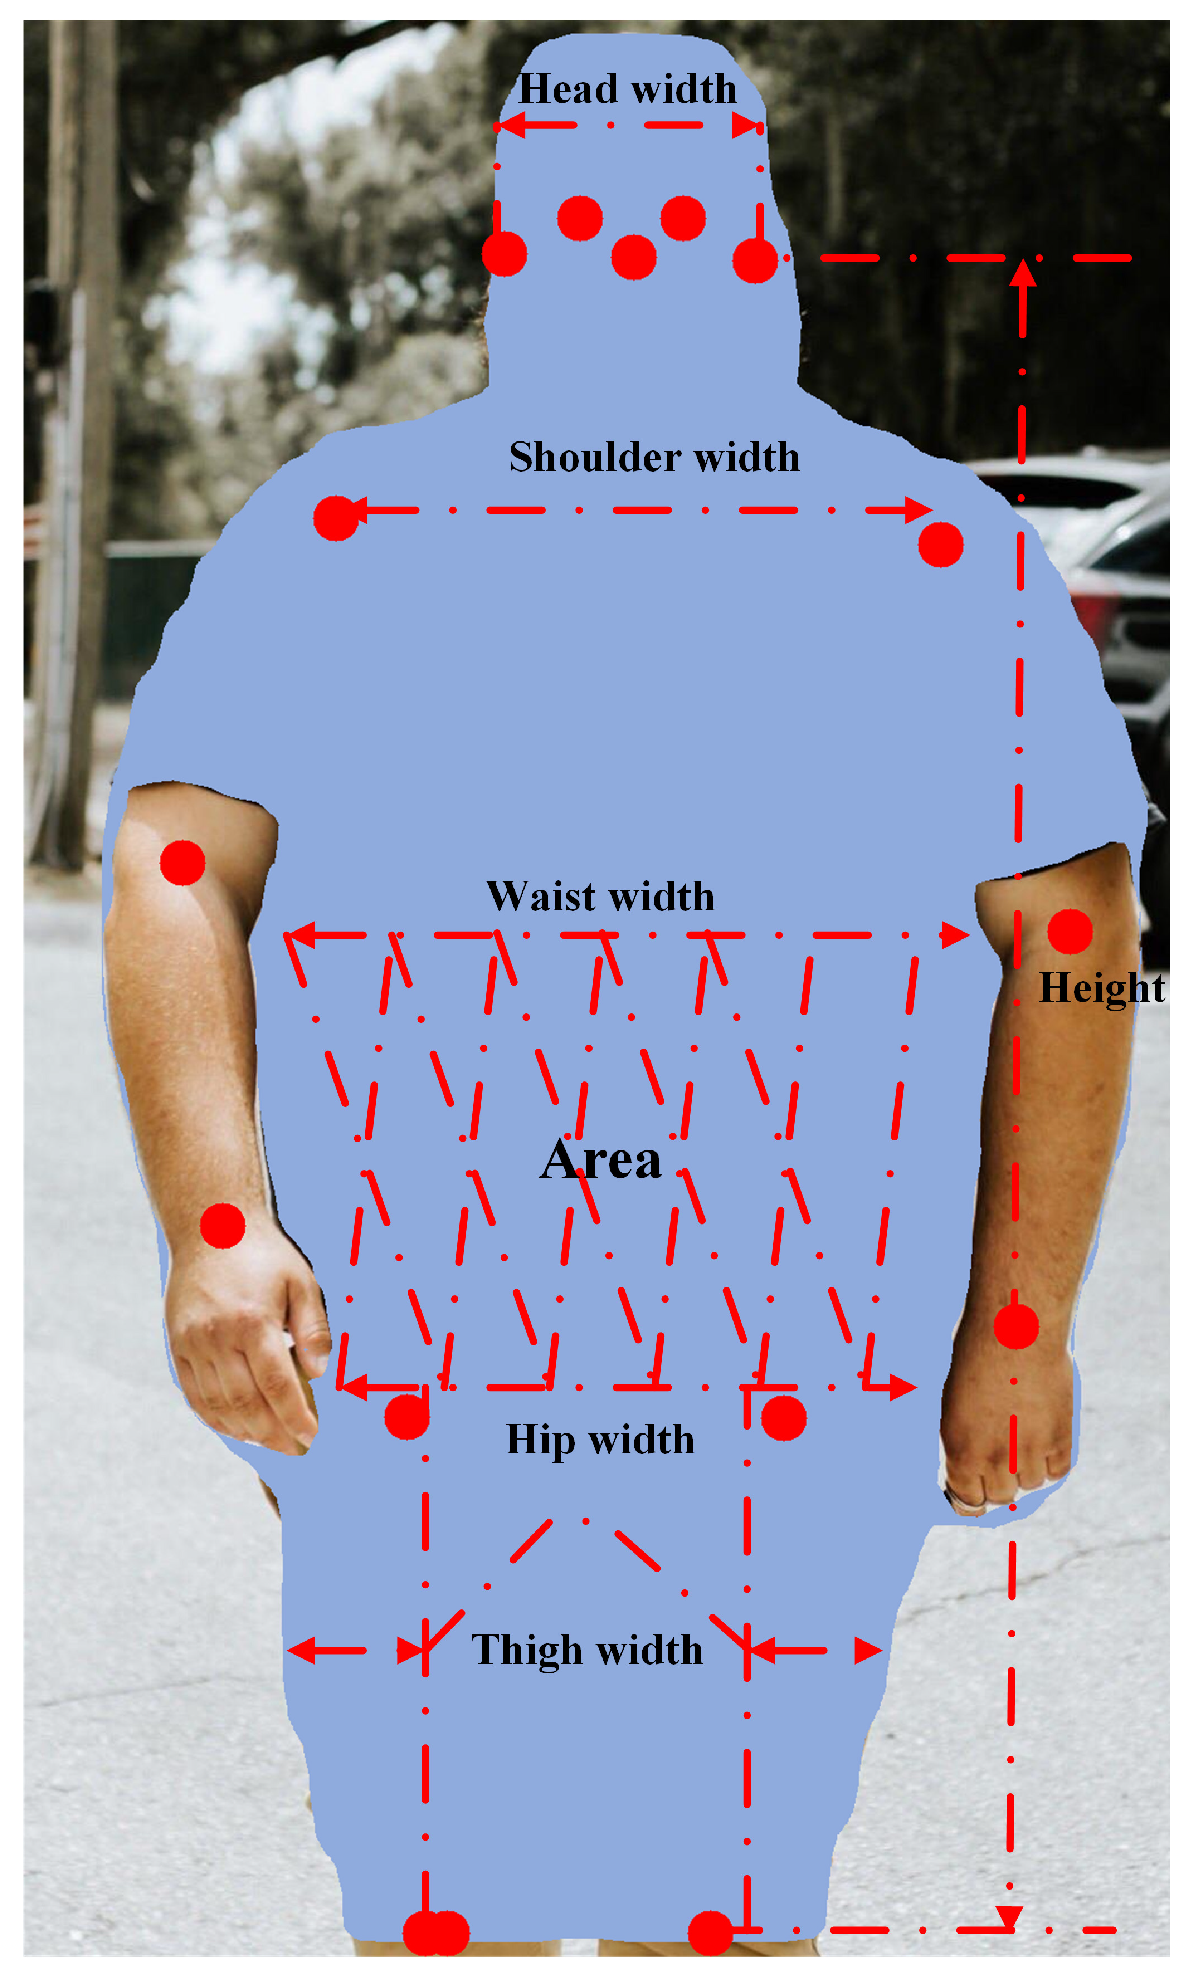
Finally, after skeleton joint detection and human contour detection, the next step was to calculate 2D anthropometric features. Jin et al. [29] provided calculation methods for seven anthropometric features: WSR, WTR, WHpR, WHdR, HpHdR, Area, and HWR. The definitions of these features are as follows: WTR refers to the waist width-to-thigh width ratio; WHpR denotes the waist width-to-hip width ratio; WHdR is the waist width-to-head width ratio; HpHdR represents the hip width-to-head width ratio; Area indicates the number of pixels per unit area (noted by P) between the waist and hip; HWR corresponds to the ratio of the distance from nose to knee to the waist width; and WSR represents the waist width-to-shoulder width ratio. Please see Figure 2 for more details.
The formula for H2H proposed in this study is as follows:
H 2 H = D n k D h p
D n k = ( y n y k ) 2 + ( x n x k ) 2
x k = 1 2 × ( x l k + x r k )
y k = y l k = y r k
where D n k is the Euclidean distance from the nose to the knee, D h p is hip circumference, the nose coordinate point is ( x n , y n ) , the knee coordinate point is ( x k , y k ) , the left knee coordinate point is ( x l k , y l k ) , and the right knee coordinate point is ( x r k , y r k ) .

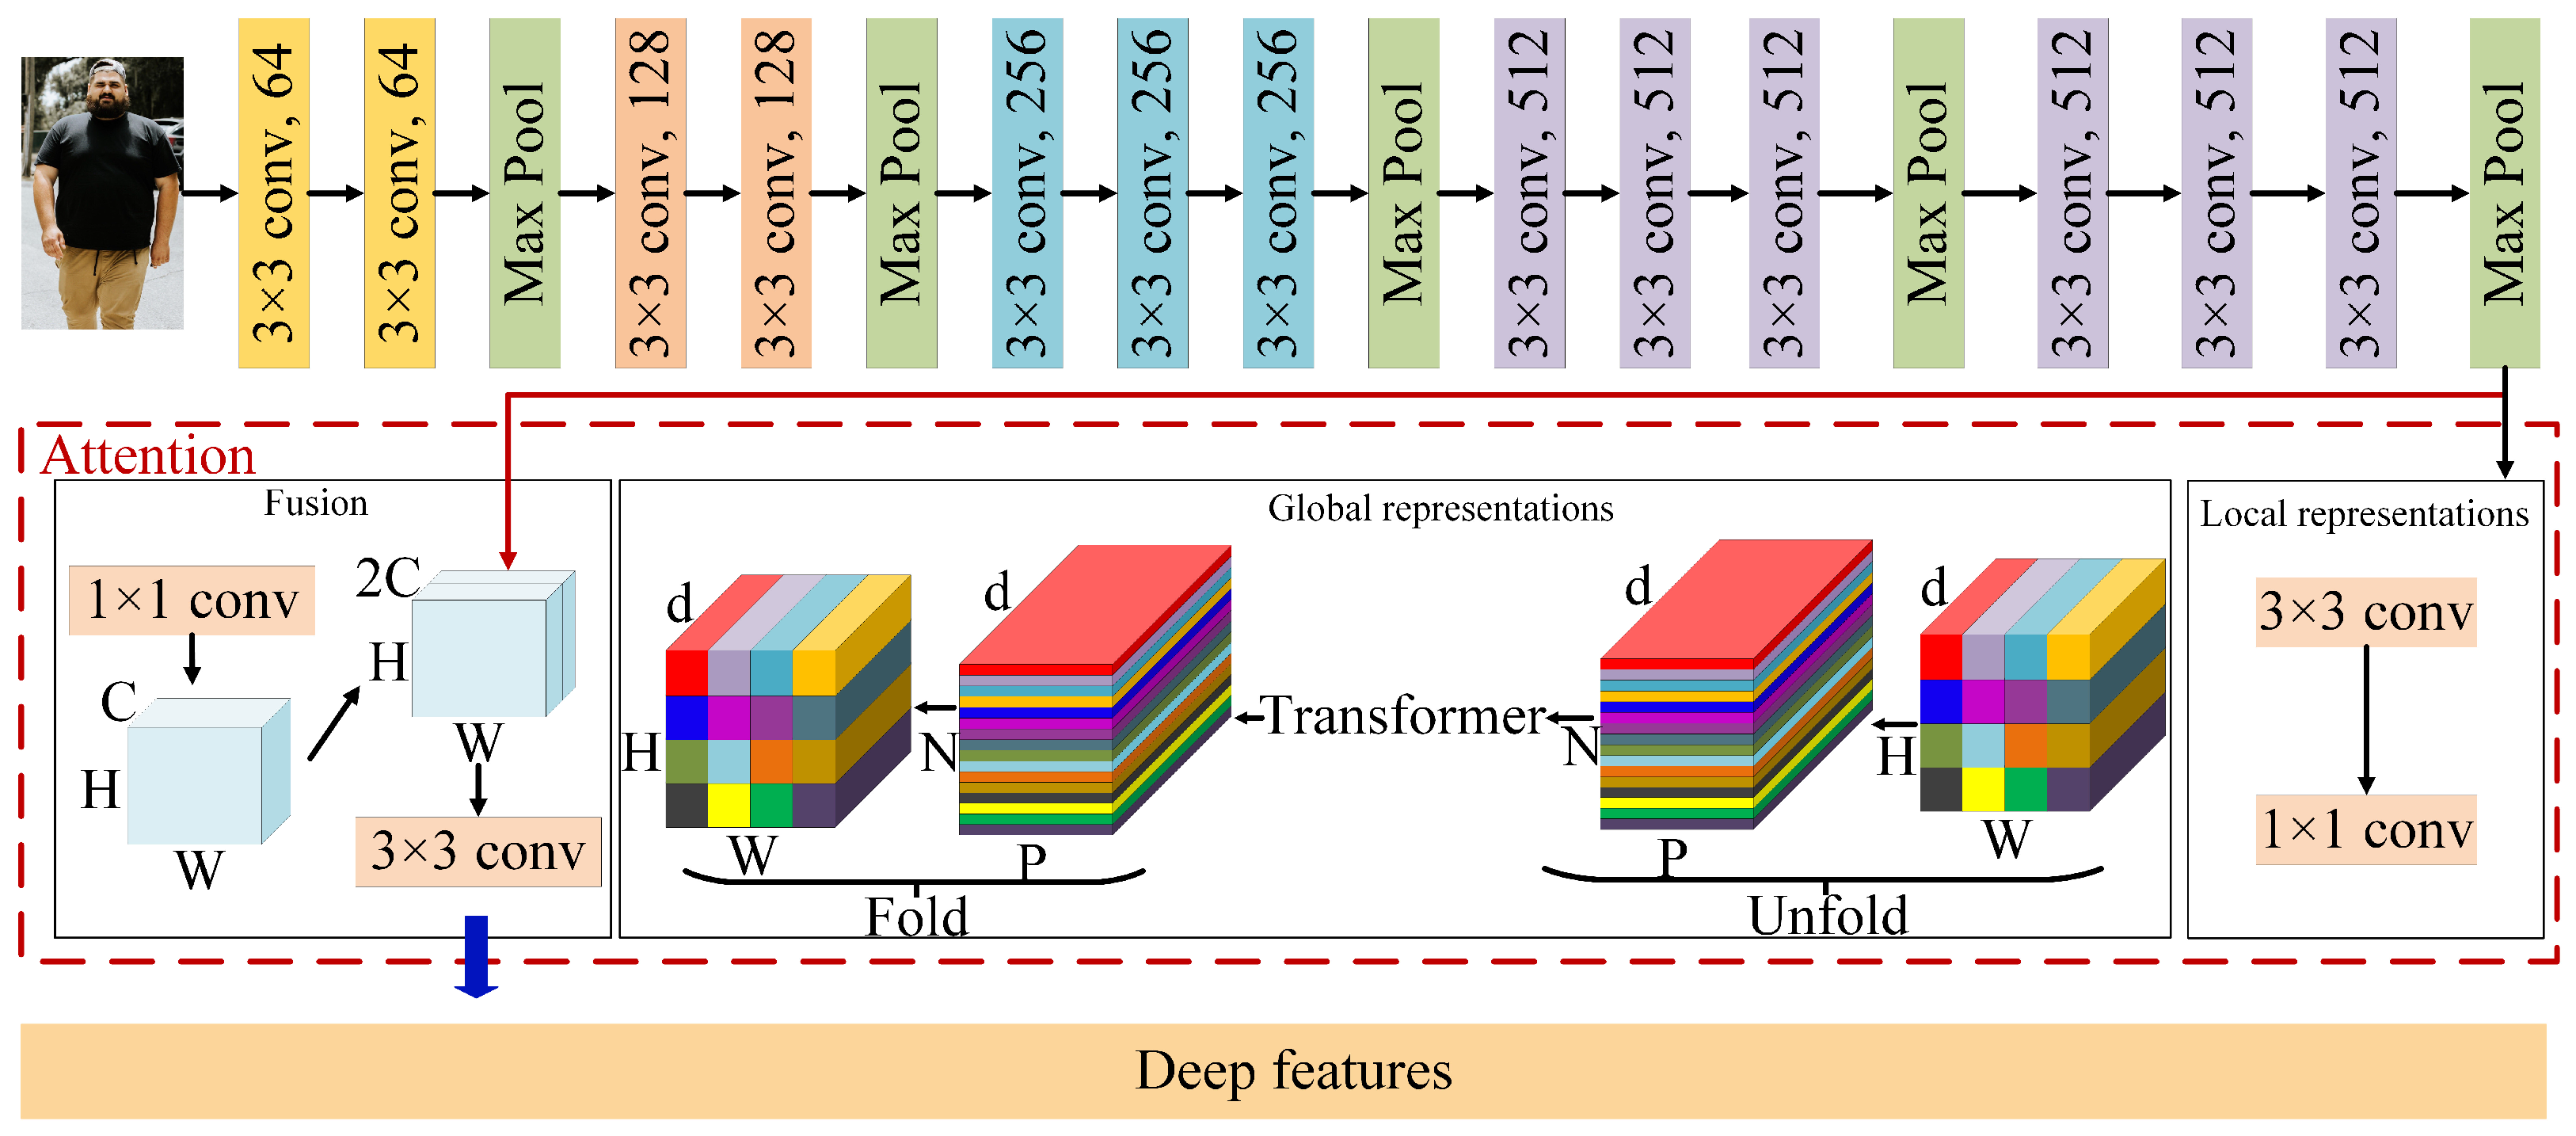
3.3. Deep Feature Extraction

Deep feature extraction employs VGG as the backbone network, which has been shown to significantly improve performance in image classification, object detection, and segmentation [44]. In this study, an attention-enhanced VGG model is proposed to extract deep features, as shown in Figure 3. The proposed model in this study is based on the VGG model and incorporates the MobileViT attention mechanism [45], enhancing the network’s focus on important image regions and improving its feature extraction capability. The MobileViT attention mechanism works by selectively emphasizing informative features while suppressing less relevant ones. This selective focus allows the model to better understand the spatial relationships between different parts of the body, which is crucial for accurate BMI estimation from body images.
The attention-enhanced VGG network model proposed in this study utilizes VGG pre-trained weights on ImageNet [46] to extract more image features and initialize network parameters effectively. Then, it is trained on the proposed dataset to accomplish a specific task. Additionally, the number of outputs in the last fully connected layer is modified from 1000 to a length of 10 for the deep feature DFs.

3.4. Feature Concatenation

BMI estimation can be defined as a regression problem that maps deep and anthropometric features to BMI. In this study, this paper uses regression models for BMI estimation. First of all, each image, given eight 2D anthropometric features, three 3D anthropometric features, and eleven anthropometric features, where F = [WSR, WTR, WHpR, WHdR, HpHdR, Area, HWR, H2H, WC, HC, WCHCR], undergoes normalized processing. Then, the deep feature vector DFs and the anthropometric feature vector F are concatenated into the KRR model to produce more accurate results.

3.5. Implementation Detail

The attention-enhanced VGG employs a VGG16 backbone with pre-trained weights. To align images of different sizes, the images are first scaled diagonally, resizing the longer side to 224. The shorter side is then padded with zeros (zero-padding) until the final image size is 224 × 224. Since the images are scaled diagonally, the short and long sides are adjusted proportionally while maintaining their original ratio. The input image tensor is normalized using mean values [0.485, 0.456, 0.406] and standard deviation values [0.229, 0.224, 0.225] before feeding into the network. The Adam optimizer [47], with a learning rate of 0.0001, a batch size of 32, and 100 training epochs, is adopted to update the weights, and the Mean Square Error (MSE) is used as the loss function.

4. Experiments

4.1. Dataset and Environment Configuration

The GPU of the computing platform environment used in this study is the GeForce RTX 3080, and the RAM capacity is 32GB. The Python3.7 programming language was used, and torch1.8.2+cu111 was used for network building, training, and testing.
In this study, the 2D image-to-BMI public dataset [29] was used to evaluate the proposed method. The dataset consists of images collected from posts on the website Reddit, including 1477 male and 2712 female images, with gender, age, height, and weight attributes retained. The dataset is randomly split into training and test sets in a 7:3 ratio. The training set contains 1032 male and 1903 female images, which are further divided into training and validation sets in a 4:1 ratio, with no overlap between the two. The test set includes 445 male and 809 female images. The dataset was originally collected to provide a diverse range of images that reflect real-world scenarios, including potential quality issues such as occlusion and low resolution.
In this study, the Mean Absolute Error (MAE), Mean Absolute Percentage Error (MAPE), Root Mean Square Error (RMSE), and the Coefficient of Determination (R2), which are commonly used in regression tasks, were selected as evaluation metrics for BMI estimation. The MAE, MAPE, R2, and RMSE are calculated as follows:
MAE = 1 N i = 1 N | X ^ i X i |
MAPE = 100 N i = 1 N X ^ i X i X i
R 2 = 1 i = 1 N ( X i X ^ i ) 2 i = 1 N ( X i X ¯ ) 2
RMSE = 1 N i = 1 N ( X ^ i X i ) 2
where X ^ i is the estimated BMI of the ith image, X i is the true BMI of the ith image, and N is the total number of test images. Unlike MAE, MAPE not only measures the absolute differences between predicted and actual values but also provides an error estimate for the entire dataset by calculating the percentage of these differences relative to the actual values. Among the above evaluation metrics, smaller values for RMSE, MAPE, and MSE indicate that the model can accurately establish a mapping relationship between input features and predicted values. R 2 ( , 1 ] , with a coefficient closer to 1, signifies the better fitting performance of the model.
In order to accurately assess BMI, this study employed distance correlation [48] to analyze the relationship between the extracted features and BMI. Distance correlation is a statistical method used to measure the association between two variables and is capable of detecting both linear and nonlinear relationships. Given X = [ x 1 , x 2 , , x n ] and Y = [ y 1 , y 2 , , y n ] , the correlation coefficient D s can be calculated using Equation (12), as follows:
D s = d C o r ( X , Y ) = d C o v ( X , Y ) d V a r ( X ) × d V a r ( Y )
where d C o v ( X , Y ) = 1 n 2 A i × B i is the distance covariance, d V a r ( X ) = 1 n 2 A i 2 , and d V a r ( Y ) = 1 n 2 B i 2 is the distance variance. By centering the distance matrices | x i x j | and | y i y j | , we obtain the centered matrices A and B [49]. The distance correlation coefficient D s ranges from 0 to 1, where 0 indicates independence and 1 indicates perfect correlation, and values in-between reflect the strength of the relationship, with higher values indicating stronger dependencies.

4.2. Correlation Between Extracted Features and BMI

This study presents the correlation analysis results between several features proposed on the public dataset and BMI, as shown in Table 1. The results demonstrate that all features exhibit positive correlations with BMI, with most exceeding a correlation coefficient of 0.4, indicating moderate to strong associations. Notably, DFs show particularly high correlation values, with males demonstrating a correlation of 0.8953 and females demonstrating a correlation of 0.3716, resulting in an overall correlation of 0.8889. This highlights the significant influence of deep features, such as DFs, on BMI estimation. Deep features are automatically learned from large-scale data by deep neural networks, enabling them to capture complex textures, shapes, colors, and local structural information in images.
In contrast, traditional anthropometric features mainly rely on predefined geometric metrics (such as distances and ratios), which may not encompass all potential and meaningful information. Furthermore, anthropometric features—H2H, WC, HC, and WCHCR—exhibit correlations with BMI ranging from 0.0549 to 0.5024. Among these, the highest correlation is observed for WC in female subjects at 0.5024. The correlation differences between males and females may be attributed to variations in body posture, clothing styles, and fat distribution patterns. Research has shown that there are significant differences in body fat distribution between males and females [50]; males tend to have a higher percentage of visceral fat, while females have a higher percentage of subcutaneous fat. This difference in fat distribution can affect the correlation between certain features (e.g., H2H and HC) and BMI. The type and fit of clothing can influence the accuracy of measurements and the extraction of features from body images. For example, tight-fitting clothing can alter the appearance of body contours, potentially affecting the correlation between features and BMI. Differences in posture can affect the extraction of features from body images, leading to variations in the correlation between features and BMI.
In summary, the consistent positive correlations across all features emphasize their relevance and practical utility in the estimation of BMI.

4.3. Comparative Experiment

To evaluate the performance of the proposed method across different genders and the overall dataset, the SVR and Gaussian Process Regression (GPR) [51] methods proposed by Jiang et al. [28], the methods of Jin et al. [29], and some deep learning methods [37] are compared with the proposed method. On the same dataset, the results in Table 2 show the performance of MAE and MAPE metrics for male, female, and overall cases. From Table 2, it can be seen that, in the male, female, and overall cases, the proposed method outperforms the state-of-the-art method of Jin et al. [29]. Specifically, the MAE metrics of the proposed method are lower by 2.35, 2.03, and 0.13, respectively, while the MAPE metrics are lower by 7.93, 6.81, and 0.5, respectively. It can be seen that the proposed method shows better performance in the three cases of male, female and overall cases. Compared to Jin et al. [37], the MAE metrics for the proposed method are lower by 1.96, 2.08, and 0.01 in the male, female, and overall cases, respectively. Additionally, the MAPE metrics for the proposed method are lower by 6.47 and 6.67 in the male and female cases, while they are nearly identical in the overall case. These results demonstrate that the proposed method significantly improves prediction accuracy, especially in terms of the MAE and MAPE metrics.

4.4. Comparison of Different Regression Methods

To evaluate the performance of different regression methods, SVR, KRR [52], and GPR are compared for male, female and overall cases, with the results shown in Table 3. In Table 3, when comparing different regression methods, KRR excels in performance across the MAE, MAPE, R2, and RMSE metrics, making it the top choice for the regression method in the proposed model. It outperforms SVR across all these indicators and slightly outperforms GPR in MAPE and RMSE. This selection ensures enhanced prediction accuracy and stability across various data distributions.

4.5. Comparison of Different Deep Network Models

To evaluate the performance of the proposed attention-enhanced VGG model in extracting deep features, a comparative analysis of Googlenet [53], Mobilenet [54], AlexNet [55], Resnet101 [35], and VGG16 [31] is conducted on the same dataset, as shown in Table 4. In Table 4, it can be seen that the attention-enhanced model demonstrates superior performance across multiple metrics compared to other deep learning models. It has the lowest MAE of 3.83, MAPE of 12.81, and RMSE of 5.39, while also achieving the highest R2 value of 0.59. The differences are particularly notable when compared to AlexNet, which has the highest MAE of 4.78, MAPE of 15.65, and RMSE of 6.57, and the lowest R2 value of 0.38. These results highlight the effectiveness of the attention mechanism in enhancing model accuracy by capturing more intrinsic data characteristics.

4.6. Comparison of Different Attention Modules

To evaluate the performance of different attention modules in deep feature extraction, the effects of MobileViT [45], CBAM [56], SE [57], ECA [58], and MHSA [59] modules are compared. All the experiments were conducted on the same dataset, and the results are shown in Table 5. From Table 5, it can be seen that the MobileViT module outperforms the others across all key performance indicators. Specifically, MobileViT has an MAE of 3.83, which is 0.07 lower than that of the second-best performing SE module and 0.18 lower than that of the MHSA module, which has the highest MAE. In terms of the MAPE, MobileViT’s 12.81 score is 0.4 lower than MHSA’s 13.21 score. Regarding the R2 value, MobileViT’s 0.59 is 0.05 higher than MHSA’s 0.54, indicating a better model fit. Lastly, regarding the RMSE metric, MobileViT’s 5.39 score is 0.26 lower than MHSA’s 5.65 score, further confirming its advantage in predictive accuracy. These differences demonstrate that MobileViT is significantly superior to the other attention modules in capturing data features and improving prediction accuracy.

4.7. Comparison of the Number of Deep Features

To evaluate the impact of different numbers of deep features on performance, experiments were conducted by varying the number of deep features. All the experiments were performed on the same dataset, and Table 6 shows the MAE, MAPE, R2, and RMSE results of the proposed model as the number of deep features increased from 5 to 30. As shown in Table 6, when the number of deep features increased from 5 to 10, the model’s MAE, MAPE, and RMSE all decreased, while the R2 value increased, indicating improved predictive accuracy. However, as the number of features continued to increase up to 30, these metrics showed a trend of slight improvement followed by a slight deterioration. The model performed best with 10 deep features; thus, it is recommended to choose 10 deep features as the final configuration for the model to balance predictive accuracy and computational efficiency.

4.8. Ablation Experiment

When comparing different features, the MAE and MAPE values of the following features were analyzed: 2DFs, 3DFs, DFs, 2DFs + DFs, 3DFs + DFs, 2DFs + 3DFs, and ALL (2DFs + 3DFs + DFs). Table 7 presents the performance of MAE, MAPE, R2, and RMSE metrics for male, female, and overall cases under the same dataset. As shown in Table 7, the performance of different features varies significantly. The 2DFs feature performs the worst. In comparison, other feature combinations exhibit lower MAE and MAPE values, with DFs and 2DFs + DFs performing relatively well, though still at a suboptimal level. In contrast, the ALL feature fusion, which integrates all features, achieves the best performance across all evaluation metrics: MAE values of 2.12 for males, 1.63 for females, and 3.83 overall; MAPE values of 6.96 for males, 5.54 for females, and 12.81 overall; R2 values of 0.90 for males, 0.91 for females, and 0.59 overall; and RMSE values of 2.92 for males, 2.28 for females, and 5.39 overall. This demonstrates that combining all the features effectively improves prediction accuracy, as it provides more comprehensive information and ensures better model performance compared to single or partial feature combinations.

4.9. Visual Analysis

In this study, our approach achieved promising results on the overall dataset. To further validate its effectiveness, we compared the results across four BMI categories. Within each BMI category, individuals were randomly selected from the dataset to ensure impartiality and avoid bias in representation. The actual BMI, predicted BMI, and absolute error between the two were analyzed for each category, as shown in Table 8. The results demonstrated that the proposed method’s predictions for overweight and obesity categories are highly consistent with the true values. For underweight and normal weight categories, the errors are 0.42 and 0.30, respectively. Although there are slight differences between predicted and true values, the overall error remains below 0.5, confirming the model’s adaptability and accuracy across different BMI intervals. In summary, the proposed model exhibits high accuracy in predicting different BMI categories.

5. Conclusions

In this study, we propose three 3D anthropometric features, one 2D anthropometric feature, and a deep feature extraction method to address the incomplete consideration of anthropometric features. In addition, a BMI estimation method based on a multiplex network is proposed. In this method, three types of features are extracted by constructing a multiple network, and BMI estimation is performed using KRR. Compared with existing state-of-the-art methods, the proposed method significantly improves performance. These findings highlight the potential of our framework for practical applications in health informatics, such as remote health monitoring and personalized healthcare.
This study currently has the following limitations: First, the diversity of the dataset remains constrained by collection conditions, with insufficient coverage of extreme BMI values and special populations. Second, the simulation of complex environmental factors in real-world scenarios, such as lighting variations and occlusions, has not yet been systematically addressed. Third, although the model enhances resistance to image quality interference through a multi-scale feature fusion mechanism, its sensitivity to low-resolution images still requires further optimization. To address these issues, future work will focus on the following key improvements: First, a cross-regional, multimodal BMI dataset that incorporates medical-grade measurement device data should be constructed to strengthen the reliability of biometric characteristics. Second, an adaptive environmental perception module should be developed to improve stability in complex scenarios through domain generalization techniques. These enhancements will systematically elevate the clinical utility of the BMI estimation model in real-world medical applications.

Author Contributions

A.X. and T.W. performed the statistical analysis and machine learning model building, explained the data, and drafted the first manuscript. T.Y. and K.H. were involved in drafting the manuscript and conducted the statistical analyses. T.W., T.Y. and K.H. reviewed analyses for the revised manuscript and made edits to the data analyses and interpretation. All authors have read and agreed to the published version of the manuscript.

Funding

The research in this paper was supported by the National Key Research and Development Program of China (2022YFC3502302), the National Youth Science Foundation of China (82204770), and the Graduate Research Innovation Program of Jiangsu Province (KYCX23_2078).

Data Availability Statement

Publicly available datasets were analyzed in this study. These data can be found at https://github.com/FVL2020/2DImage2BMI, accessed on 28 July 2024.

Acknowledgments

We would like to thank Zhi Jin, Wenjin Wang, Aolin Xiong, and Xiaojun Tan for providing the public dataset.

Conflicts of Interest

The authors declare no conflicts of interest.

References

  1. Sweatt, K.; Garvey, W.T.; Martins, C. Strengths and Limitations of BMI in the Diagnosis of Obesity: What is the Path Forward? Curr. Obes. Rep. 2024, 13, 584–595. [Google Scholar] [CrossRef] [PubMed]
  2. Tzenios, N.; Tazanios, M.E.; Chahine, M. The impact of BMI on breast cancer–an updated systematic review and meta-analysis. Medicine 2024, 103, e36831. [Google Scholar] [CrossRef]
  3. Jiang, M.; Guo, G.; Mu, G. Visual BMI estimation from face images using a label distribution based method. Comput. Vis. Image Underst. 2020, 197, 102985. [Google Scholar] [CrossRef]
  4. Yousaf, N.; Hussein, S.; Sultani, W. Estimation of BMI from facial images using semantic segmentation based region-aware pooling. Comput. Biol. Med. 2021, 133, 104392. [Google Scholar] [CrossRef]
  5. Pentakota, S.S.; Priya, A.L.; Reddy, S.S.; Umarani, J. Body Mass Index (BMI) Estimation from Multi-view Facial Images. In Proceedings of the 2024 IEEE International Conference on Computer Vision and Machine Intelligence (CVMI), Prayagraj, India, 19–20 October 2024; pp. 1–6. [Google Scholar]
  6. Pham, Q.T.; Luu, A.T.; Tran, T.H. BMI estimation from facial images using residual regression model. In Proceedings of the 2021 International Conference on Advanced Technologies for Communications (ATC), Ho Chi Minh City, Vietnam, 14–16 October 2021; pp. 140–145. [Google Scholar]
  7. Xiang, C.; Liu, B.; Zhao, L.; Zheng, X. Three-dimension deep model for body mass index estimation from facial image sequences with different poses. J. Vis. Commun. Image Represent. 2025, 107, 104381. [Google Scholar] [CrossRef]
  8. Wells, M.; Goldstein, L.N.; Wells, T.; Ghazi, N.; Pandya, A.; Furht, B.; Engstrom, G.; Jan, M.T.; Shih, R. Total body weight estimation by 3D camera systems: Potential high-tech solutions for emergency medicine applications? A scoping review. JACEP Open 2024, 5, e13320. [Google Scholar] [CrossRef]
  9. Fuster-Guilló, A.; Azorin-Lopez, J.; Saval-Calvo, M.; Castillo-Zaragoza, J.M.; Garcia-D’Urso, N.; Fisher, R.B. RGB-D-based framework to acquire, visualize and measure the human body for dietetic treatments. Sensors 2020, 20, 3690. [Google Scholar] [CrossRef] [PubMed]
  10. García Flores, F.I.; Klünder Klünder, M.; López Teros, M.T.; Muñoz Ibañez, C.A.; Padilla Castañeda, M.A. Development and Validation of a Method of Body Volume and Fat Mass Estimation Using Three-Dimensional Image Processing with a Mexican Sample. Nutrients 2024, 16, 384. [Google Scholar] [CrossRef] [PubMed]
  11. Sui, J.; Bu, C.; Zhao, X.; Liu, C.; Ren, L.; Qian, Z. Body Weight Estimation Using Virtual Anthropometric Measurements from a Single Image. IEEE Trans. Instrum. Measur. 2023, 72, 5022113. [Google Scholar] [CrossRef]
  12. Coetzee, V.; Chen, J.; Perrett, D.I.; Stephen, I.D. Deciphering faces: Quantifiable visual cues to weight. Perception 2010, 39, 51–61. [Google Scholar] [CrossRef]
  13. Vazquez, G.; Duval, S.; Jacobs, D.R., Jr.; Silventoinen, K. Comparison of body mass index, waist circumference, and waist/hip ratio in predicting incident diabetes: A meta-analysis. Epidemiol. Rev. 2007, 29, 115–128. [Google Scholar] [CrossRef] [PubMed]
  14. Ashwell, M.; Chinn, S.; Stalley, S.; Garrow, J. Female fat distribution-a simple classification based on two circumference measurements. Int. J. Obes. 1982, 6, 143–152. [Google Scholar] [PubMed]
  15. Pushpa, B.; Ashok, A.; Av, S.H. Plant disease detection and classification using deep learning model. In Proceedings of the 2021 Third International Conference on Inventive Research in Computing Applications (ICIRCA), Coimbatore, India, 2–4 September 2021; pp. 1285–1291. [Google Scholar]
  16. Cao, Z.; Simon, T.; Wei, S.E.; Sheikh, Y. Realtime multi-person 2d pose estimation using part affinity fields. In Proceedings of the IEEE Conference on Computer Vision and Pattern Recognition, Honolulu, HI, USA, 21–26 July 2017; pp. 7291–7299. [Google Scholar]
  17. He, K.; Gkioxari, G.; Dollár, P.; Girshick, R. Mask r-cnn. In Proceedings of the IEEE International Conference on Computer Vision, Venice, Italy, 22–29 October 2017; pp. 2961–2969. [Google Scholar]
  18. Zhang, S.H.; Li, R.; Dong, X.; Rosin, P.; Cai, Z.; Han, X.; Yang, D.; Huang, H.; Hu, S.M. Pose2seg: Detection free human instance segmentation. In Proceedings of the IEEE/CVF Conference on Computer Vision and Pattern Recognition, Long Beach, CA, USA, 16–17 June 2019; pp. 889–898. [Google Scholar]
  19. Pfitzner, C.; May, S.; Nüchter, A. Body weight estimation for dose-finding and health monitoring of lying, standing and walking patients based on RGB-D data. Sensors 2018, 18, 1311. [Google Scholar] [CrossRef]
  20. Velardo, C.; Dugelay, J.L. What can computer vision tell you about your weight? In Proceedings of the 2012 20th European Signal Processing Conference (EUSIPCO), Bucharest, Romania, 27–31 August 2012; pp. 1980–1984. [Google Scholar]
  21. Nguyen, T.V.; Feng, J.; Yan, S. Seeing human weight from a single rgb-d image. J. Comput. Sci. Technol. 2014, 29, 777–784. [Google Scholar] [CrossRef]
  22. Kamble, T.U.; Mahajan, S.P. 3D vision using multiple structured light-based kinect depth cameras. Int. J. Image Graph. 2024, 24, 2450001. [Google Scholar] [CrossRef]
  23. Wuhrer, S.; Shu, C. Estimating 3D human shapes from measurements. Mach. Vis. Appl. 2013, 24, 1133–1147. [Google Scholar] [CrossRef]
  24. Pujades, S.; Mohler, B.; Thaler, A.; Tesch, J.; Mahmood, N.; Hesse, N.; Bülthoff, H.H.; Black, M.J. The virtual caliper: Rapid creation of metrically accurate avatars from 3D measurements. IEEE Trans. Vis. Comput. Graph. 2019, 25, 1887–1897. [Google Scholar] [CrossRef]
  25. Bipembi, H.; Panford, J.; Appiah, O. Calculation of body mass index using image processing techniques. Int. J. Artif. Intell. Mechatronics 2015, 4, 1–7. [Google Scholar]
  26. Velardo, C.; Dugelay, J.L. Weight estimation from visual body appearance. In Proceedings of the 2010 Fourth IEEE International Conference on Biometrics: Theory, Applications and Systems (BTAS), Washington, DC, USA, 28–30 September 2010; pp. 1–6. [Google Scholar]
  27. Lewis, R.M.; Laprise, J.F.; Gargano, J.W.; Unger, E.R.; Querec, T.D.; Chesson, H.W.; Brisson, M.; Markowitz, L.E. Estimated prevalence and incidence of disease-associated human papillomavirus types among 15-to 59-year-olds in the United States. Sex. Transm. Dis. 2021, 48, 273–277. [Google Scholar] [CrossRef]
  28. Jiang, M.; Guo, G. Body weight analysis from human body images. IEEE Trans. Inf. Forensics Secur. 2019, 14, 2676–2688. [Google Scholar] [CrossRef]
  29. Jin, Z.; Huang, J.; Wang, W.; Xiong, A.; Tan, X. Estimating human weight from a single image. IEEE Trans. Multimed. 2022, 25, 2515–2527. [Google Scholar] [CrossRef]
  30. Kocabey, E.; Camurcu, M.; Ofli, F.; Aytar, Y.; Marin, J.; Torralba, A.; Weber, I. Face-to-BMI: Using computer vision to infer body mass index on social media. In Proceedings of the International AAAI Conference on Web and Social Media, Montréal, QC, Canada, 15–18 May 2017; Volume 11, pp. 572–575. [Google Scholar]
  31. Simonyan, K.; Zisserman, A. Very deep convolutional networks for large-scale image recognition. arXiv 2014, arXiv:1409.1556. [Google Scholar]
  32. Parkhi, O.; Vedaldi, A.; Zisserman, A. Deep face recognition. In Proceedings of the BMVC 2015-Proceedings of the British Machine Vision Conference 2015, Swansea, UK, 7–10 September 2015. [Google Scholar]
  33. Awad, M.; Khanna, R.; Awad, M.; Khanna, R. Support vector regression. In Efficient Learning Machines: Theories, Concepts, and Applications for Engineers and System Designers; Springer: Berlin/Heidelberg, Germany, 2015; pp. 67–80. [Google Scholar]
  34. Diba, N.; Akter, N.; Chowdhury, S.; Giti, J. BMI Prediction from Handwritten English Characters Using a Convolutional Neural Network. arXiv 2024, arXiv:2409.02584. [Google Scholar]
  35. He, K.; Zhang, X.; Ren, S.; Sun, J. Deep residual learning for image recognition. In Proceedings of the IEEE Conference on Computer Vision and Pattern Recognition, Las Vegas, NV, USA, 27–30 June 2016; pp. 770–778. [Google Scholar]
  36. Kim, S.; Lee, K.; Lee, E.C. Multi-View Body Image-Based Prediction of Body Mass Index and Various Body Part Sizes. In Proceedings of the IEEE/CVF Conference on Computer Vision and Pattern Recognition, Vancouver, BC, Canada, 18–22 June 2023; pp. 6033–6040. [Google Scholar]
  37. Jin, Z.; Huang, J.; Xiong, A.; Pang, Y.; Wang, W.; Ding, B. Attention guided deep features for accurate body mass index estimation. Pattern Recognit. Lett. 2022, 154, 22–28. [Google Scholar] [CrossRef]
  38. Fang, H.S.; Li, J.; Tang, H.; Xu, C.; Zhu, H.; Xiu, Y.; Li, Y.L.; Lu, C. Alphapose: Whole-body regional multi-person pose estimation and tracking in real-time. IEEE Trans. Pattern Anal. Mach. Intell. 2022, 45, 7157–7173. [Google Scholar] [CrossRef]
  39. Pavlakos, G.; Choutas, V.; Ghorbani, N.; Bolkart, T.; Osman, A.A.; Tzionas, D.; Black, M.J. Expressive body capture: 3d hands, face, and body from a single image. In Proceedings of the IEEE/CVF Conference on Computer Vision and Pattern Recognition, Long Beach, CA, USA, 15–20 June 2019; pp. 10975–10985. [Google Scholar]
  40. Loper, M.; Mahmood, N.; Romero, J.; Pons-Moll, G.; Black, M.J. SMPL: A skinned multi-person linear model. In Seminal Graphics Papers: Pushing the Boundaries, Volume 2; Association for Computing Machinery: New York, NY, USA, 2023; pp. 851–866. [Google Scholar] [CrossRef]
  41. Choutas, V.; Müller, L.; Huang, C.H.P.; Tang, S.; Tzionas, D.; Black, M.J. Accurate 3D body shape regression using metric and semantic attributes. In Proceedings of the IEEE/CVF Conference on Computer Vision and Pattern Recognition, New Orleans, LA, USA, 18–24 June 2022; pp. 2718–2728. [Google Scholar]
  42. Dai, J.; Li, Y.; He, K.; Sun, J. R-fcn: Object detection via region-based fully convolutional networks. Adv. Neural Inf. Process. Syst. 2016, 29. [Google Scholar] [CrossRef]
  43. Li, P.; Xu, Y.; Wei, Y.; Yang, Y. Self-correction for human parsing. IEEE Trans. Pattern Anal. Mach. Intell. 2020, 44, 3260–3271. [Google Scholar] [CrossRef]
  44. Ye, M.; Ruiwen, N.; Chang, Z.; He, G.; Tianli, H.; Shijun, L.; Yu, S.; Tong, Z.; Ying, G. A lightweight model of VGG-16 for remote sensing image classification. IEEE J. Sel. Top. Appl. Earth Obs. Remote Sens. 2021, 14, 6916–6922. [Google Scholar] [CrossRef]
  45. Mehta, S.; Rastegari, M. Mobilevit: Light-weight, general-purpose, and mobile-friendly vision transformer. arXiv 2021, arXiv:2110.02178. [Google Scholar]
  46. Deng, J.; Dong, W.; Socher, R.; Li, L.J.; Li, K.; Fei-Fei, L. Imagenet: A large-scale hierarchical image database. In Proceedings of the 2009 IEEE Conference on Computer Vision and Pattern Recognition, Miami, FL, USA, 20–25 June 2009; pp. 248–255. [Google Scholar]
  47. Kingma, D.P. Adam: A method for stochastic optimization. arXiv 2014, arXiv:1412.6980. [Google Scholar]
  48. Székely, G.J.; Rizzo, M.L. Partial Distance Correlation with Methods for Dissimilarities. arXiv 2013, arXiv:1310.2926. [Google Scholar] [CrossRef]
  49. Nielsen, F.; Nielsen, F. Hierarchical clustering. In Introduction to HPC with MPI for Data Science; Springer: Cham, Switzerland, 2016; pp. 195–211. [Google Scholar]
  50. Mai, J.; Wu, Q.; Wu, H.; Zeng, C.; Li, Y.; Shang, J.; Wu, B.; Cai, Q.; Du, J.; Gong, J. Assessment of whole-body and regional body fat using abdominal quantitative computed tomography in Chinese women and men. Lipids Health Dis. 2024, 23, 47. [Google Scholar] [CrossRef] [PubMed]
  51. Seeger, M. Gaussian processes for machine learning. Int. J. Neural Syst. 2004, 14, 69–106. [Google Scholar] [CrossRef]
  52. Maalouf, M.; Homouz, D. Kernel ridge regression using truncated newton method. Knowl.Based Syst. 2014, 71, 339–344. [Google Scholar] [CrossRef]
  53. Szegedy, C.; Liu, W.; Jia, Y.; Sermanet, P.; Reed, S.; Anguelov, D.; Erhan, D.; Vanhoucke, V.; Rabinovich, A. Going deeper with convolutions. In Proceedings of the IEEE Conference on Computer Vision and Pattern Recognition, Boston, MA, USA, 7–12 June 2015; pp. 1–9. [Google Scholar]
  54. Sandler, M.; Howard, A.; Zhu, M.; Zhmoginov, A.; Chen, L.C. Mobilenetv2: Inverted residuals and linear bottlenecks. In Proceedings of the IEEE Conference on Computer Vision and Pattern Recognition, Lake City, UT, USA, 18–22 June 2018; pp. 4510–4520. [Google Scholar]
  55. Krizhevsky, A.; Sutskever, I.; Hinton, G.E. Imagenet classification with deep convolutional neural networks. Adv. Neural Inf. Process. Syst. 2012, 25. [Google Scholar] [CrossRef]
  56. Woo, S.; Park, J.; Lee, J.Y.; Kweon, I.S. Cbam: Convolutional block attention module. In Proceedings of the European Conference on Computer Vision (ECCV), Munich, Germany, 8–14 September 2018; pp. 3–19. [Google Scholar]
  57. Hu, J.; Shen, L.; Sun, G. Squeeze-and-excitation networks. In Proceedings of the IEEE Conference on Computer Vision and Pattern Recognition, Lake City, UT, USA, 18–22 June 2018; pp. 7132–7141. [Google Scholar]
  58. Wang, Q.; Wu, B.; Zhu, P.; Li, P.; Zuo, W.; Hu, Q. ECA-Net: Efficient channel attention for deep convolutional neural networks. In Proceedings of the IEEE/CVF Conference on Computer Vision and Pattern Recognition, Seattle, WA, USA, 14–19 June 2020; pp. 11534–11542. [Google Scholar]
  59. Wu, C.; Wu, F.; Ge, S.; Qi, T.; Huang, Y.; Xie, X. Neural news recommendation with multi-head self-attention. In Proceedings of the 2019 Conference on Empirical Methods in Natural Language Processing and the 9th International Joint Conference on Natural Language Processing (EMNLP-IJCNLP), Hong Kong, China, 3–7 November 2019; pp. 6389–6394. [Google Scholar]
Figure 1. Framework of the proposed approach.
Symmetry 17 00877 g001
Figure 2. The 2D anthropometric features computed for body weight analysis.
Symmetry 17 00877 g002
Figure 3. Attention -enhanced VGG network architecture.
Symmetry 17 00877 g003
Table 1. Distance correlation of extracted features and BMI.
FeaturesMaleFemaleOverall
H2H0.05490.53230.0587
DFs0.89530.37160.8889
WC0.46040.50240.3900
HC0.44020.37160.1513
WCHCR0.37780.53230.3170
Table 2. Comparison of BMI estimation between our method and other methods.
MethodsMAEMAPE (%)
Male Female Overall Male Female Overall
Jiang et al. [28]SVR6.725.505.9421.1318.1319.20
GPR6.445.255.6721.8618.3219.58
Jin et al. [29]KRR4.483.703.9714.9212.4513.33
SVR4.473.693.9714.8312.3713.26
GPR4.453.663.9614.8912.3513.31
VGG6.004.965.3319.2316.3417.36
Attention-Enhanced VGG4.263.573.8414.2011.9912.88
Jin et al. [37]4.083.713.8413.4312.3012.71
Ours2.121.633.836.965.5412.81
Table 3. Comparison of different regression methods.
MethodsMAEMAPE (%)R2RMSE
Male Female Overall Male Female Overall Male Female Overall Male Female Overall
SVR4.273.583.8614.2612.0012.940.590.570.585.955.085.42
KRR2.121.633.836.965.5412.810.900.910.592.922.285.39
GPR3.973.113.8413.2810.4512.870.650.670.595.474.445.39
Table 4. Comparison of different deep learning models.
ModelMAEMAPE (%)R2RMSE
Attention-Enhanced3.8312.810.595.39
VGG163.8912.710.575.52
Resnet1013.9713.230.575.52
Mobilenet4.1714.070.535.72
Googlenet4.2114.020.515.87
AlexNet4.7815.650.386.57
Table 5. Comparison of different attention modules.
AttentionMAEMAPE (%)R2RMSE
MobileViT3.8312.810.595.39
SE3.9013.000.575.47
ECA3.9113.180.585.42
CBAM3.9313.070.565.53
MHSA4.0113.210.545.65
Table 6. Comparison of different deep feature extraction networks.
NumbersMAEMAPE (%)R2RMSE
53.8713.010.585.44
103.8312.810.595.39
153.8712.930.585.46
203.9013.090.585.45
253.8512.940.585.42
303.8712.950.575.49
Table 7. Performance comparisons of feature types.
FeatureMAEMAPE (%)R2RMSE
Male Female Overall Male Female Overall Male Female Overall Male Female Overall
2DFs6.736.666.1322.5721.5220.540.04−0.460.0019.139.398.31
3DFs2.282.145.437.517.1817.930.900.870.202.922.857.50
DFs4.283.573.8414.2612.0012.880.590.580.585.955.035.41
2DFs + DFs4.303.573.8514.3312.0012.910.590.580.585.975.035.41
3DFs + DFs4.733.373.8813.7510.2112.640.320.400.537.686.025.71
2DFs + 3DFs2.853.635.479.3011.9318.020.740.410.174.745.987.65
ALL2.121.633.836.965.5412.810.900.910.592.922.285.39
Table 8. Case study of different BMI categories.
BMI CategoriesUnderweightNormalOverweightObese
Input imageSymmetry 17 00877 i001Symmetry 17 00877 i002Symmetry 17 00877 i003Symmetry 17 00877 i004
Ground true14.7722.8125.5832.01
Predict value14.3523.1125.6632.02
Absolute error0.420.300.080.02
Disclaimer/Publisher’s Note: The statements, opinions and data contained in all publications are solely those of the individual author(s) and contributor(s) and not of MDPI and/or the editor(s). MDPI and/or the editor(s) disclaim responsibility for any injury to people or property resulting from any ideas, methods, instructions or products referred to in the content.

