1. Introduction
Current research on classroom facial expression recognition primarily focuses on the application of visible light images. For instance, Shou et al. [
1] proposed a Residual Channel Attention Transformer Masking Network (RCTMasking-Net) for facial expression recognition in classrooms, while Yuan et al. [
2] used MTCNN for face detection and image segmentation in classroom images and introduced a visual motion analysis method that integrates global and local features for classroom expression recognition. However, these studies fail to consider the impact of environmental light changes on visible light images. For example, Beveridge et al. [
3] demonstrate that illumination variations, such as side lighting or extreme lighting conditions can degrade face recognition performance by introducing strong shadows and asymmetry, potentially reducing the accuracy of visible-light-based models for subtle expressions like confusion or boredom by up to 20–30%.
Unlike prior studies that predominantly rely on visible light images, this research pioneers the application of thermal infrared facial expression recognition in smart classrooms, offering a novel solution tailored to educational environments. Compared to visible light, thermal infrared facial images capture the distribution of facial temperature features and are uniquely unaffected by illumination, making them highly valuable for expression recognition in low-light scenarios [
4,
5,
6]. To date, no researchers have applied thermal infrared expressions to classroom settings. Traditional facial expression recognition models are based on Multilayer Perceptrons (MLPs), which, according to the universal approximation theorem, can approximate any continuous function. However, MLPs require more neurons or deeper networks to achieve the same approximation effect and their approximation process lacks the efficient mathematical structure of KANs. MLPs also often face issues such as overfitting, vanishing or exploding gradients, and scalability problems [
7]. In contrast, the Kolmogorov–Arnold Network (KAN) provides a mathematically efficient structure that mitigates these problems, offering improved interpretability and fitting capabilities [
8]. This raises the possibility of leveraging a KAN to enhance thermal infrared facial expression recognition in educational contexts.
Ethical considerations for this study, particularly regarding the recording of students in classrooms for the GUET thermalface dataset, include anonymizing thermal images using mosaicing techniques to obscure identifiable features and obtaining informed consent from participants, ensuring compliance with privacy regulations.
1.1. Research Questions
This study aims to address the gaps in current research by exploring the application of thermal infrared facial expression recognition in smart classrooms. Specifically, it seeks to answer the following research questions (RQs):
RQ1: How can thermal infrared facial images be effectively utilized to recognize student expressions in smart classroom environments, overcoming the limitations of visible-light-based methods under varying illumination conditions?
RQ2: To what extent does the integration of a Kolmogorov–Arnold Network (KAN) into a thermal infrared facial expression recognition model improve accuracy and robustness compared to traditional MLP-based approaches?
RQ3: What are the practical challenges and performance differences when applying a thermal infrared recognition model to a real-world classroom dataset compared to controlled public datasets?
1.2. Contribution
This paper proposes CTIFERK, a novel thermal infrared facial expression recognition model combining MobileViT and Kolmogorov–Arnold Networks (KANs) for smart classrooms. The main contributions are as follows:
We introduce CTIFERK, which integrates multiple KAN layers to process pooled feature vectors from the MobileViT backbone, enhancing feature extraction and fitting capabilities compared to traditional MLP-based models. Unlike prior works such as IRFacExNet [
9] and MobileNetv3 with the Binary Dragonfly Algorithm [
10], which rely on convolutional neural networks (CNNs) or MLPs, CTIFERK leverages the KAN’s mathematically efficient structure to mitigate overfitting and improve interpretability, achieving superior accuracy (e.g., 81.82% on Tufts Face Database vs. 76.36% for IRFacExNet and MobileNetv3).
We constructed the GUET thermalface dataset, tailored for smart classroom settings, capturing 1852 thermal infrared images across six expression categories. Unlike the controlled settings of public datasets like the Tufts Face Database and IRIS Thermal/Visible Face Database, GUET thermalface addresses real-world classroom challenges, such as varying resolutions and head poses. Experiments on GUET thermalface and public datasets demonstrate CTIFERK’s robustness, with accuracies of 65.22%, 81.82%, and 82.19%, respectively, outperforming baselines like IRFacExNet [
9] and MobileNetv3 [
10].
These contributions advance thermal infrared facial expression recognition by addressing the limitations in existing methods, particularly for dynamic educational environments, offering a scalable solution for smart education.
The remainder of this paper is organized as follows:
Section 2 introduces related work.
Section 3 outlines the datasets used in the experiments and introduces the proposed model, model evaluation metrics, and experimental environment.
Section 4 analyzes the experimental results to evaluate the performance of the proposed algorithm.
Section 5 provides a discussion of the experimental results. Finally,
Section 6 concludes the paper and provides future research directions.
2. Related Work
In the field of thermal infrared facial expression recognition, Nguyen et al. [
11] developed a facial expression computing system based on thermal infrared images, effectively overcoming the limitations of visible light images. Ilikci et al. [
12] improved the YOLO algorithm to achieve facial expression detection in thermal infrared images and systematically compared the detection performance of YOLO, ResNet, and DenseNet. Nguyen et al. [
13] integrated visible light and thermal infrared images and used wavelet transform and Principal Component Analysis (PCA) for expression recognition. Kamath et al. [
14] employed features extracted from the VGG-Face CNN model for expression recognition in thermal infrared images. Rooj et al. [
15] generated a set of optimal local region-specific filters using convolutional sparse coding for feature extraction and proposed a supervised dimensionality reduction algorithm to improve the accuracy of thermal infrared image expression recognition. Filippini et al. [
16] introduced an automatic facial expression recognition model using a feedforward neural network as the deep learning algorithm. Assiri et al. [
17] divided the entire facial image into four parts and proposed a ten-fold cross-validation method to improve recognition accuracy using Convolutional Neural Networks (CNNs). Bhattacharyya et al. [
9] proposed a deep learning network called IRFacExNet for facial expression recognition from thermal infrared images, which consists of transformation units and residual units and employs a cosine annealing learning rate scheduler and snapshot ensembling method. Prasad et al. [
10] introduced a new MobileNetv3 deep learning technique for classifying facial expressions in thermal infrared images, which normalizes the images and uses the Binary Dragonfly Algorithm (BDA) to extract facial features, followed by expression recognition using MobileNetv3. A summary of the related work on thermal infrared expression recognition is shown in
Table 1.
Currently, there have been many attempts to utilize and improve KANs that have mainly falling into two categories: modifying the basis functions of the KAN and integrating KANs with commonly used neural network models. For example, Aghaei [
18] replaced the B-spline curves in a KAN with rational functions, while Abueidda et al. [
19] used Gaussian radial basis functions to enhance the computational speed and approximation capability of the original KAN. In terms of integration, Drokin [
20] replaced the fixed activation functions and linear transformations in CNNs with KANs, while Wang et al. [
21] incorporated a KAN into physics-informed neural networks to enable the model to solve partial differential equations efficiently and accurately.
3. Materials and Methods
3.1. Dataset
This paper used the public thermal infrared facial datasets Tufts Face Database and IRIS Thermal/Visible Face Database for experiments. The Tufts Face Database is currently the most comprehensive large-scale facial dataset, containing over 10,000 images of 74 females and 38 males from more than 10 countries, with ages ranging from 4 to 70 years. This database includes six types of images: visible light, near-infrared, thermal infrared, computer-generated sketch images, recorded videos, and 3D images. For this experiment, we used the thermal infrared images with expression labels, which consist of 558 thermal infrared facial images of 112 individuals, labeled as (1) neutral, (2) smile, (3) sleepy, (4) shocked, and (5) wearing sunglasses. The IRIS Thermal/Visible Face Database is a collection of the OTCBVS benchmark dataset. It contains thermal and visible light facial images under various illumination conditions, positions, and facial expressions. The dataset includes 320 × 240 pixel thermal and visible light images of 30 individuals, covering different lighting conditions. For this experiment, we used the thermal infrared images in the Expression folder of the IRIS Thermal/Visible Face Database, which consist of 737 thermal infrared facial images of 30 individuals, labeled as (1) surprised, (2) laughing, and (3) angry. To study student thermal infrared facial expressions in a classroom setting, the most important foundational work is to construct a student classroom thermal infrared facial expression dataset. Therefore, this paper introduces the GUET thermalface dataset for smart classrooms, which comprises 1852 images of six expression categories (“happy”, “focused”, “confused”, “tired”, “distracted”, and “bored”) captured from students attending a particular course in 2023.The GUET thermalface dataset was captured using the YOSEEN X thermal imager produced by the YOSEEN INFRARED company (Wuhan, China, resolution: 640 × 480, thermal sensitivity: <50 mK@25 °C, frame rate: 30 Hz, with a camera installed on the podium during students’ classes. The details are shown in
Table 2.
A single train–test split was used instead of cross-validation due to differences in the collection methods and scenarios of the three datasets, with the dataset split into 80% for the training and 20% for the validation.
3.2. The Classroom Thermal Infrared Facial Expression Recognition Model with KAN (CTIFERK)
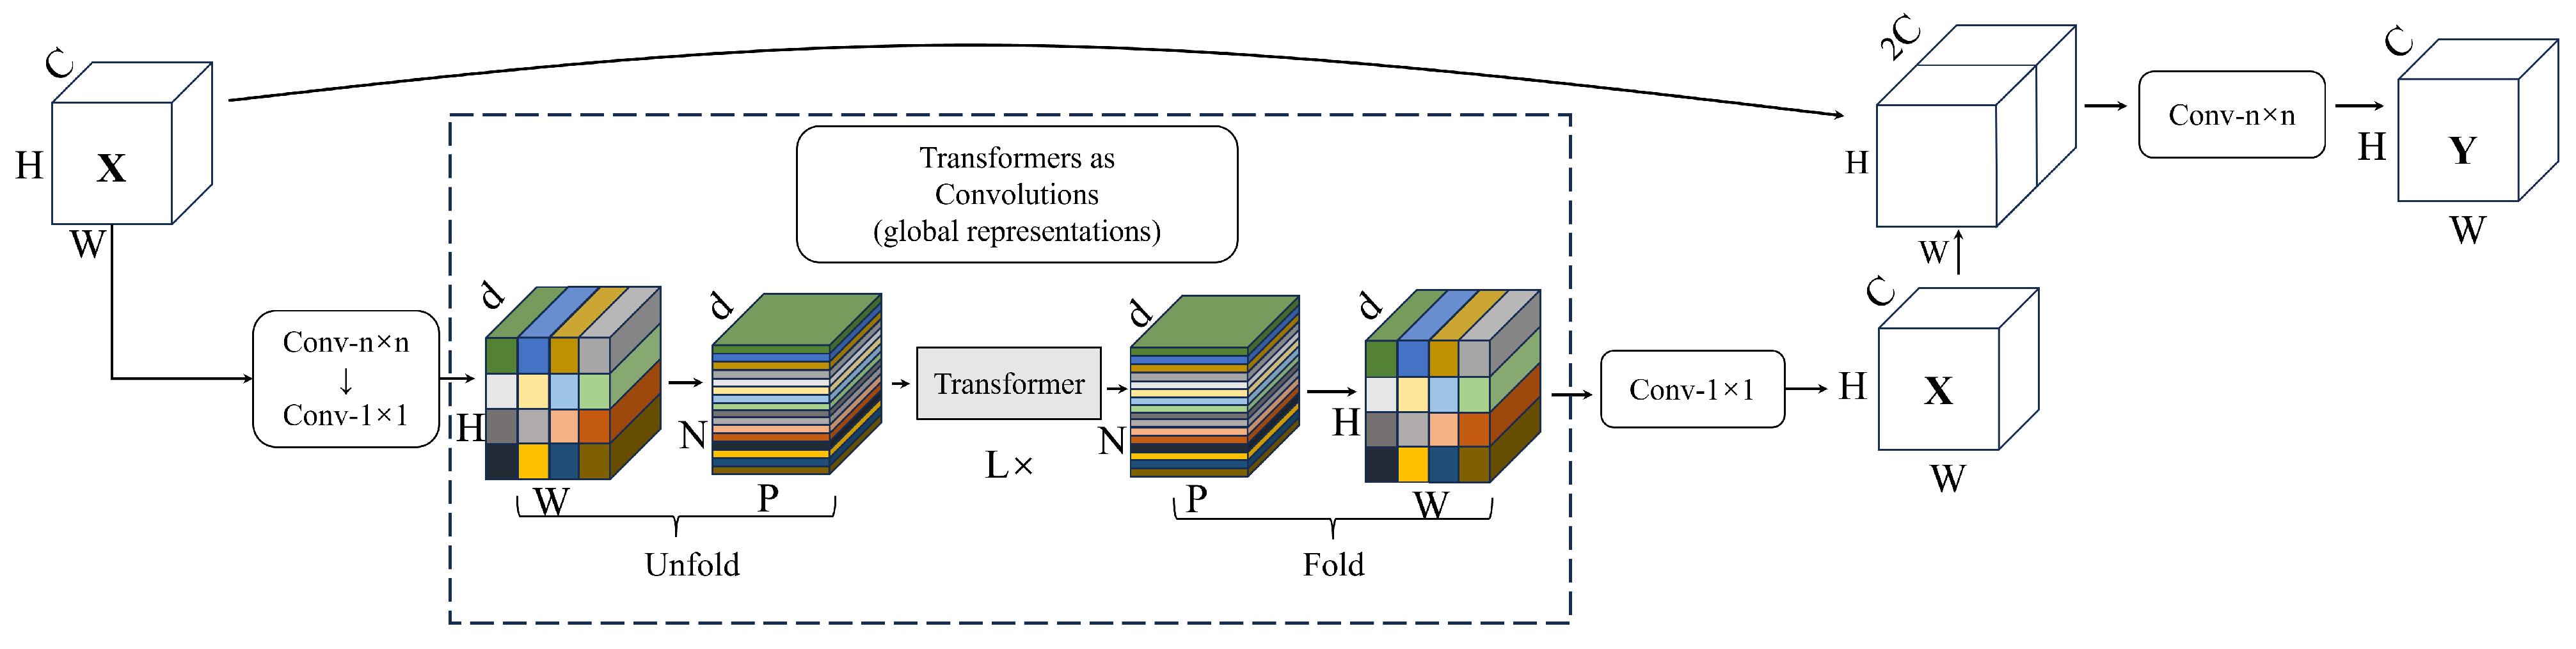
This section introduces the structure of the CTIFERK model. The overall structure of the model is shown in
Figure 1. The model consists of MV2 modules, MViT modules, and KAN modules; MobileViT was chosen as the backbone due to its lightweight architecture and its ability to balance parameter efficiency with high accuracy, outperforming heavier models like IRFacExNet in resource-constrained settings while achieving competitive accuracy for thermal infrared images [
9]. KAN enhances this by replacing MLPs with a mathematically efficient structure, improving fitting and reducing overfitting. The convolutional layers of the MobileViT model are used to extract low-level and mid-level features from the thermal infrared facial images, while the Transformer modules are used to extract high-level semantic features from the input images. In the MobileViT model, the input to the Transformer module is the feature map extracted by the convolutional layers. Each position’s feature vector represents the semantic information of the pixel at that position in the feature space. The Transformer module encodes these feature vectors using the self-attention mechanism, retaining local features while preserving global information. The feature vectors are then transformed nonlinearly by the feedforward network. The combined action of the self-attention mechanism and the feedforward network enhances the model’s predictive accuracy. Finally, the output of the backbone network is pooled by a global pooling layer, and the resulting feature vectors are input into the multi-layer KAN network for feature processing and prediction.
3.2.1. MViT Structure
The internal structure of MViT is shown in
Figure 2. It has the characteristic of modeling local and global information in the input tensor with relatively fewer parameters. When input tensor
, since the
convolutional layer can project the input tensor into a higher-dimensional space (dimension d,
), the tensor
is transformed into tensor
through an
standard convolutional layer and a pointwise convolutional layer.
Unfold
into N non-overlapping flat patches
. Here,
,
is the number of patches, and
and
are the height and width of each patch. For each patch
, the transformer encodes the patch to obtain
, as given by the following formula:
where
is the global feature representation for patch p,
is the unfolded patch input,
denotes the Transformer encoding function, and P is the total number of patches.
uses convolution to encode the local information within
regions, while
encodes the global information of patches at the p-th position. Therefore, each pixel in
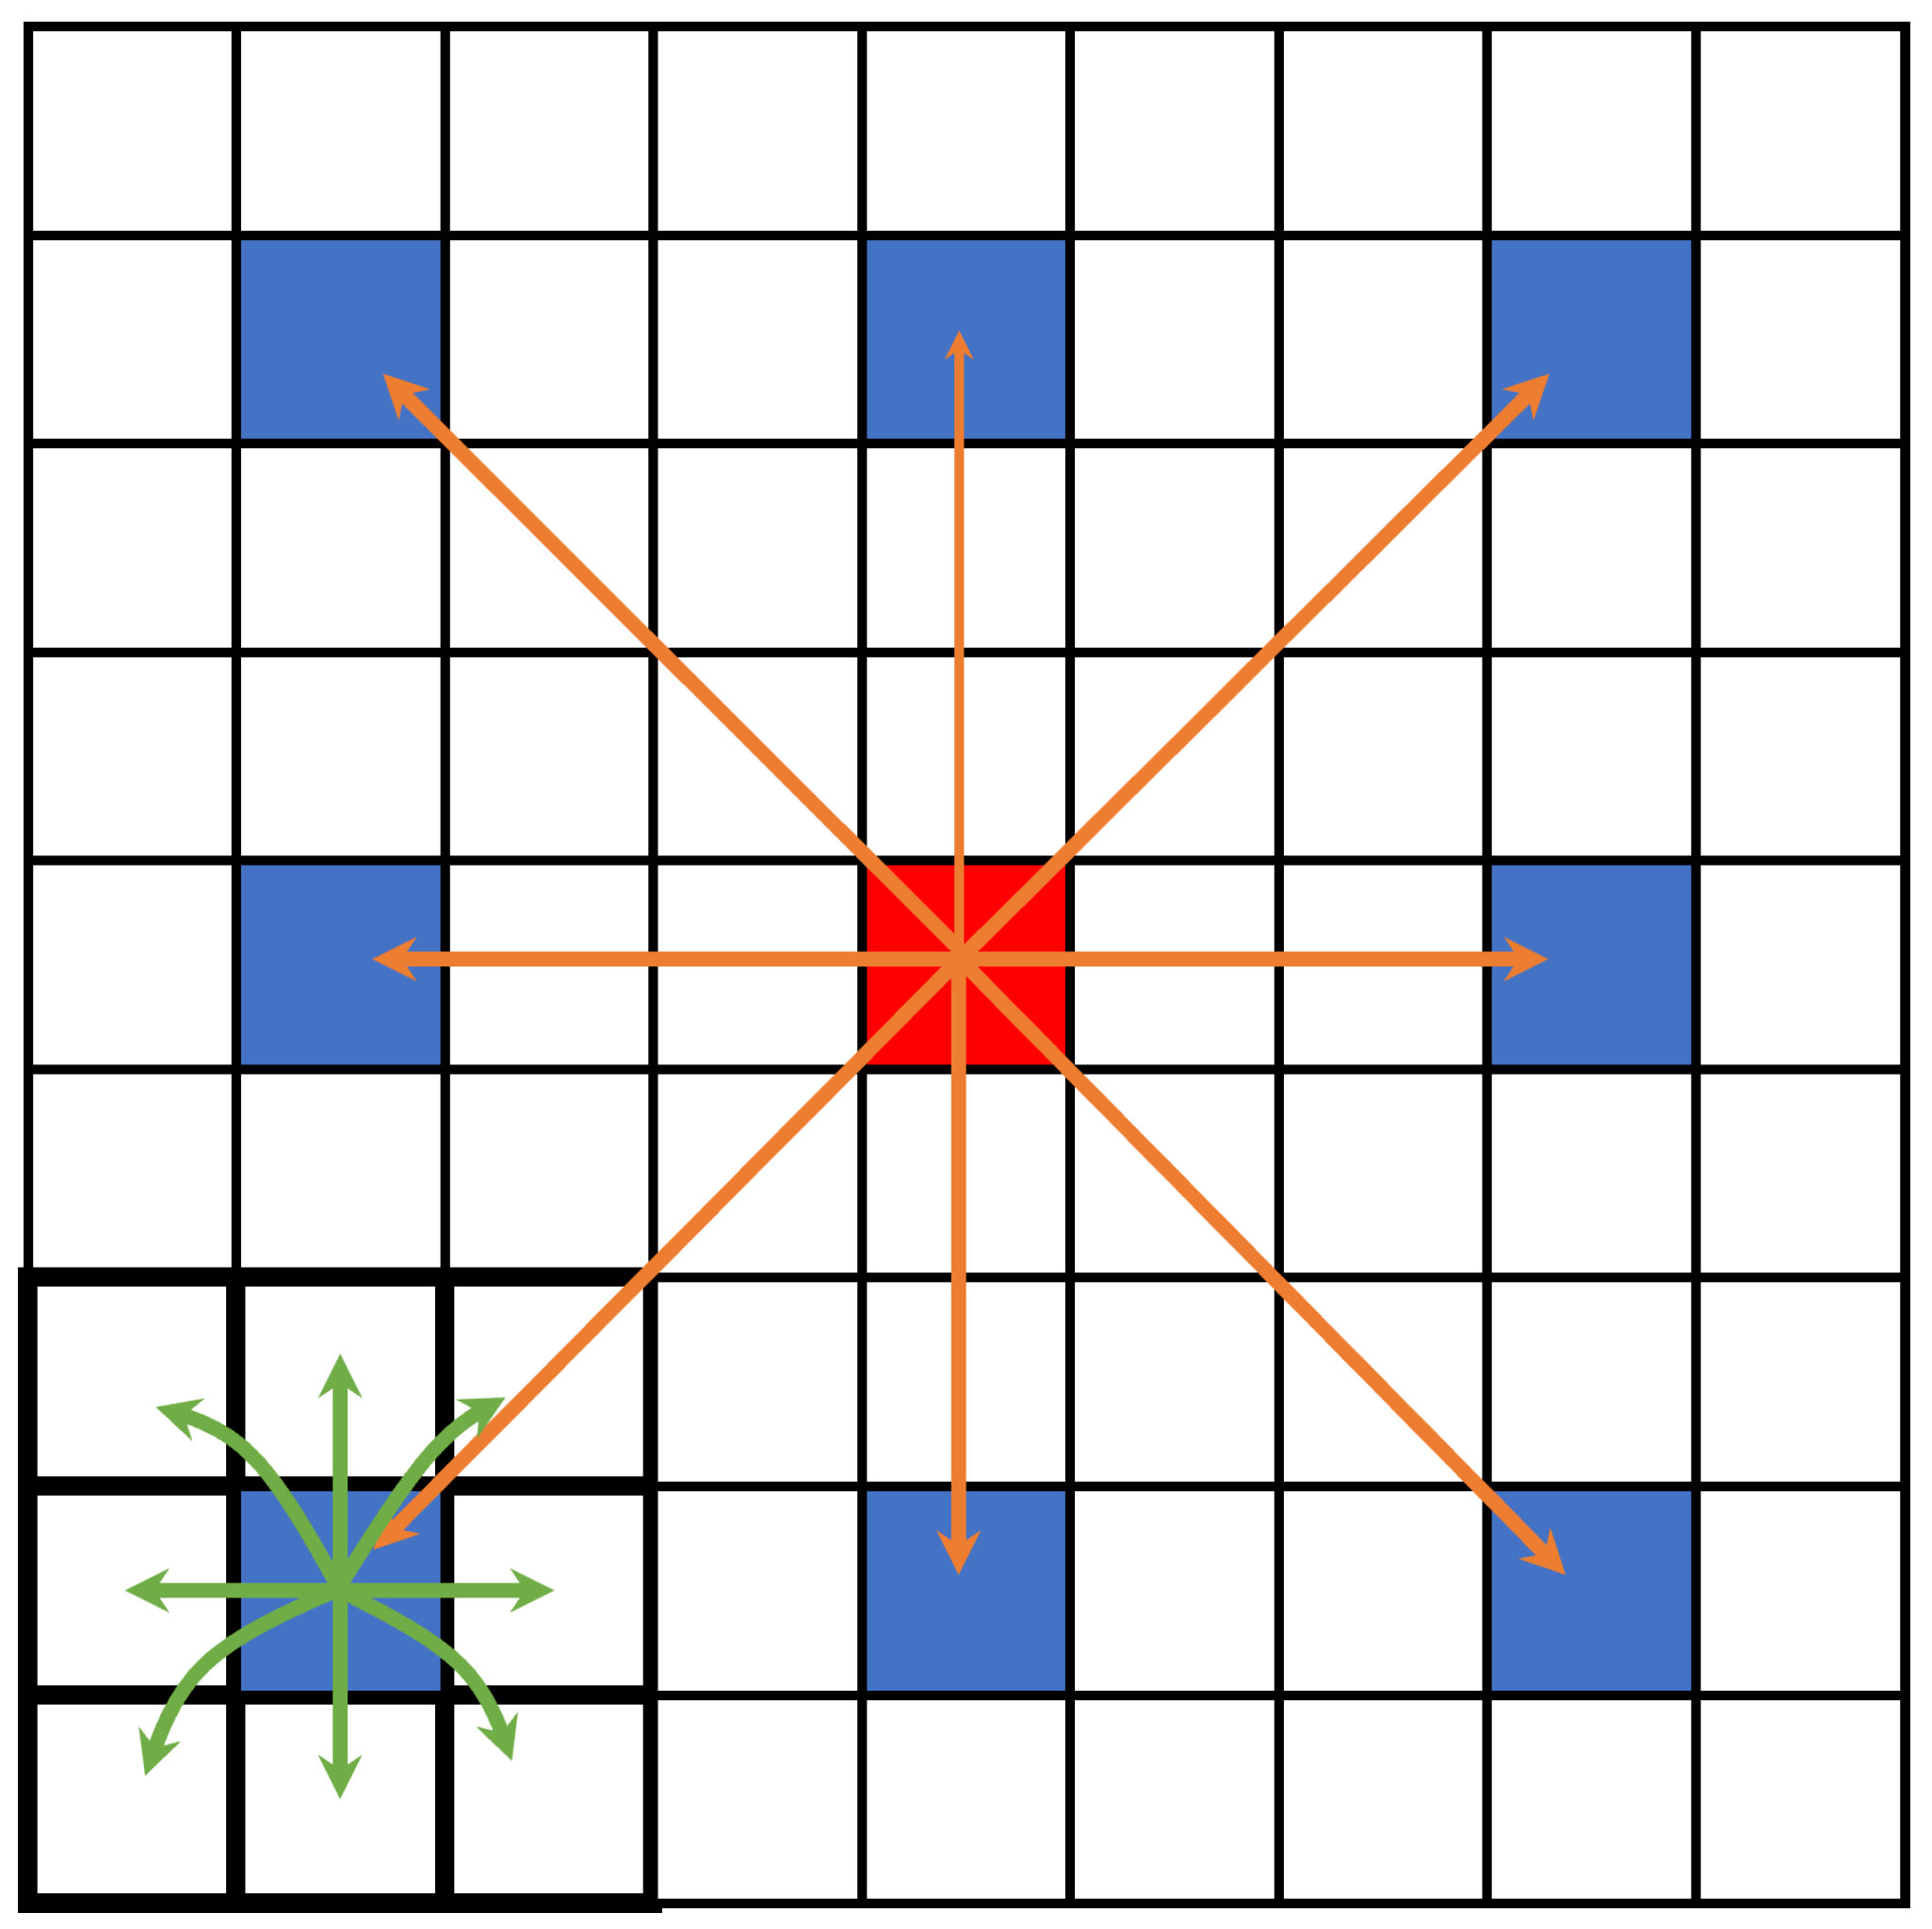
can encode information from all pixels in X. As shown in
Figure 3, in the MobileViT pixel attention map, the red pixel uses the Transformer to apply attention mechanisms to the blue pixels, while the blue pixels use convolution to encode information from neighboring pixels. This is equivalent to the red pixel encoding information from all pixels in the image.
After folding , we obtain ; is projected into a C-dimensional space via pointwise convolution, then concatenated with the input tensor X. Finally, an convolutional layer is used to fuse these concatenated features.
3.2.2. KAN Structure
The Kolmogorov–Arnold Network (KAN) is a network structure established based on the Kolmogorov–Arnold Representation Theorem (KAR) and B-spline curves. It employs univariate functions as the network’s weights and activation functions, which are adjusted during model training. The formula for the Kolmogorov–Arnold Representation Theorem (KAR) is as follows:
In Equation (
2),
is a multivariate function,
are univariate functions. The upper limit of the outer summation is 2n + 1, which is related to the input dimension n.
is the q-th function in the outer summation,
is the function combining the q-th and p-th terms, and
is the p-th component of the input vector.
The activation function of KAN is the sum of the basis function and the spline function. Therefore, the activation function
is given by the sum of the basis function b(x) and the spline function, with the calculation formula as follows:
In Equation (
5),
are trainable parameters used to adjust the weights of each spline function and
are the B-spline functions used to form the spline combinations.
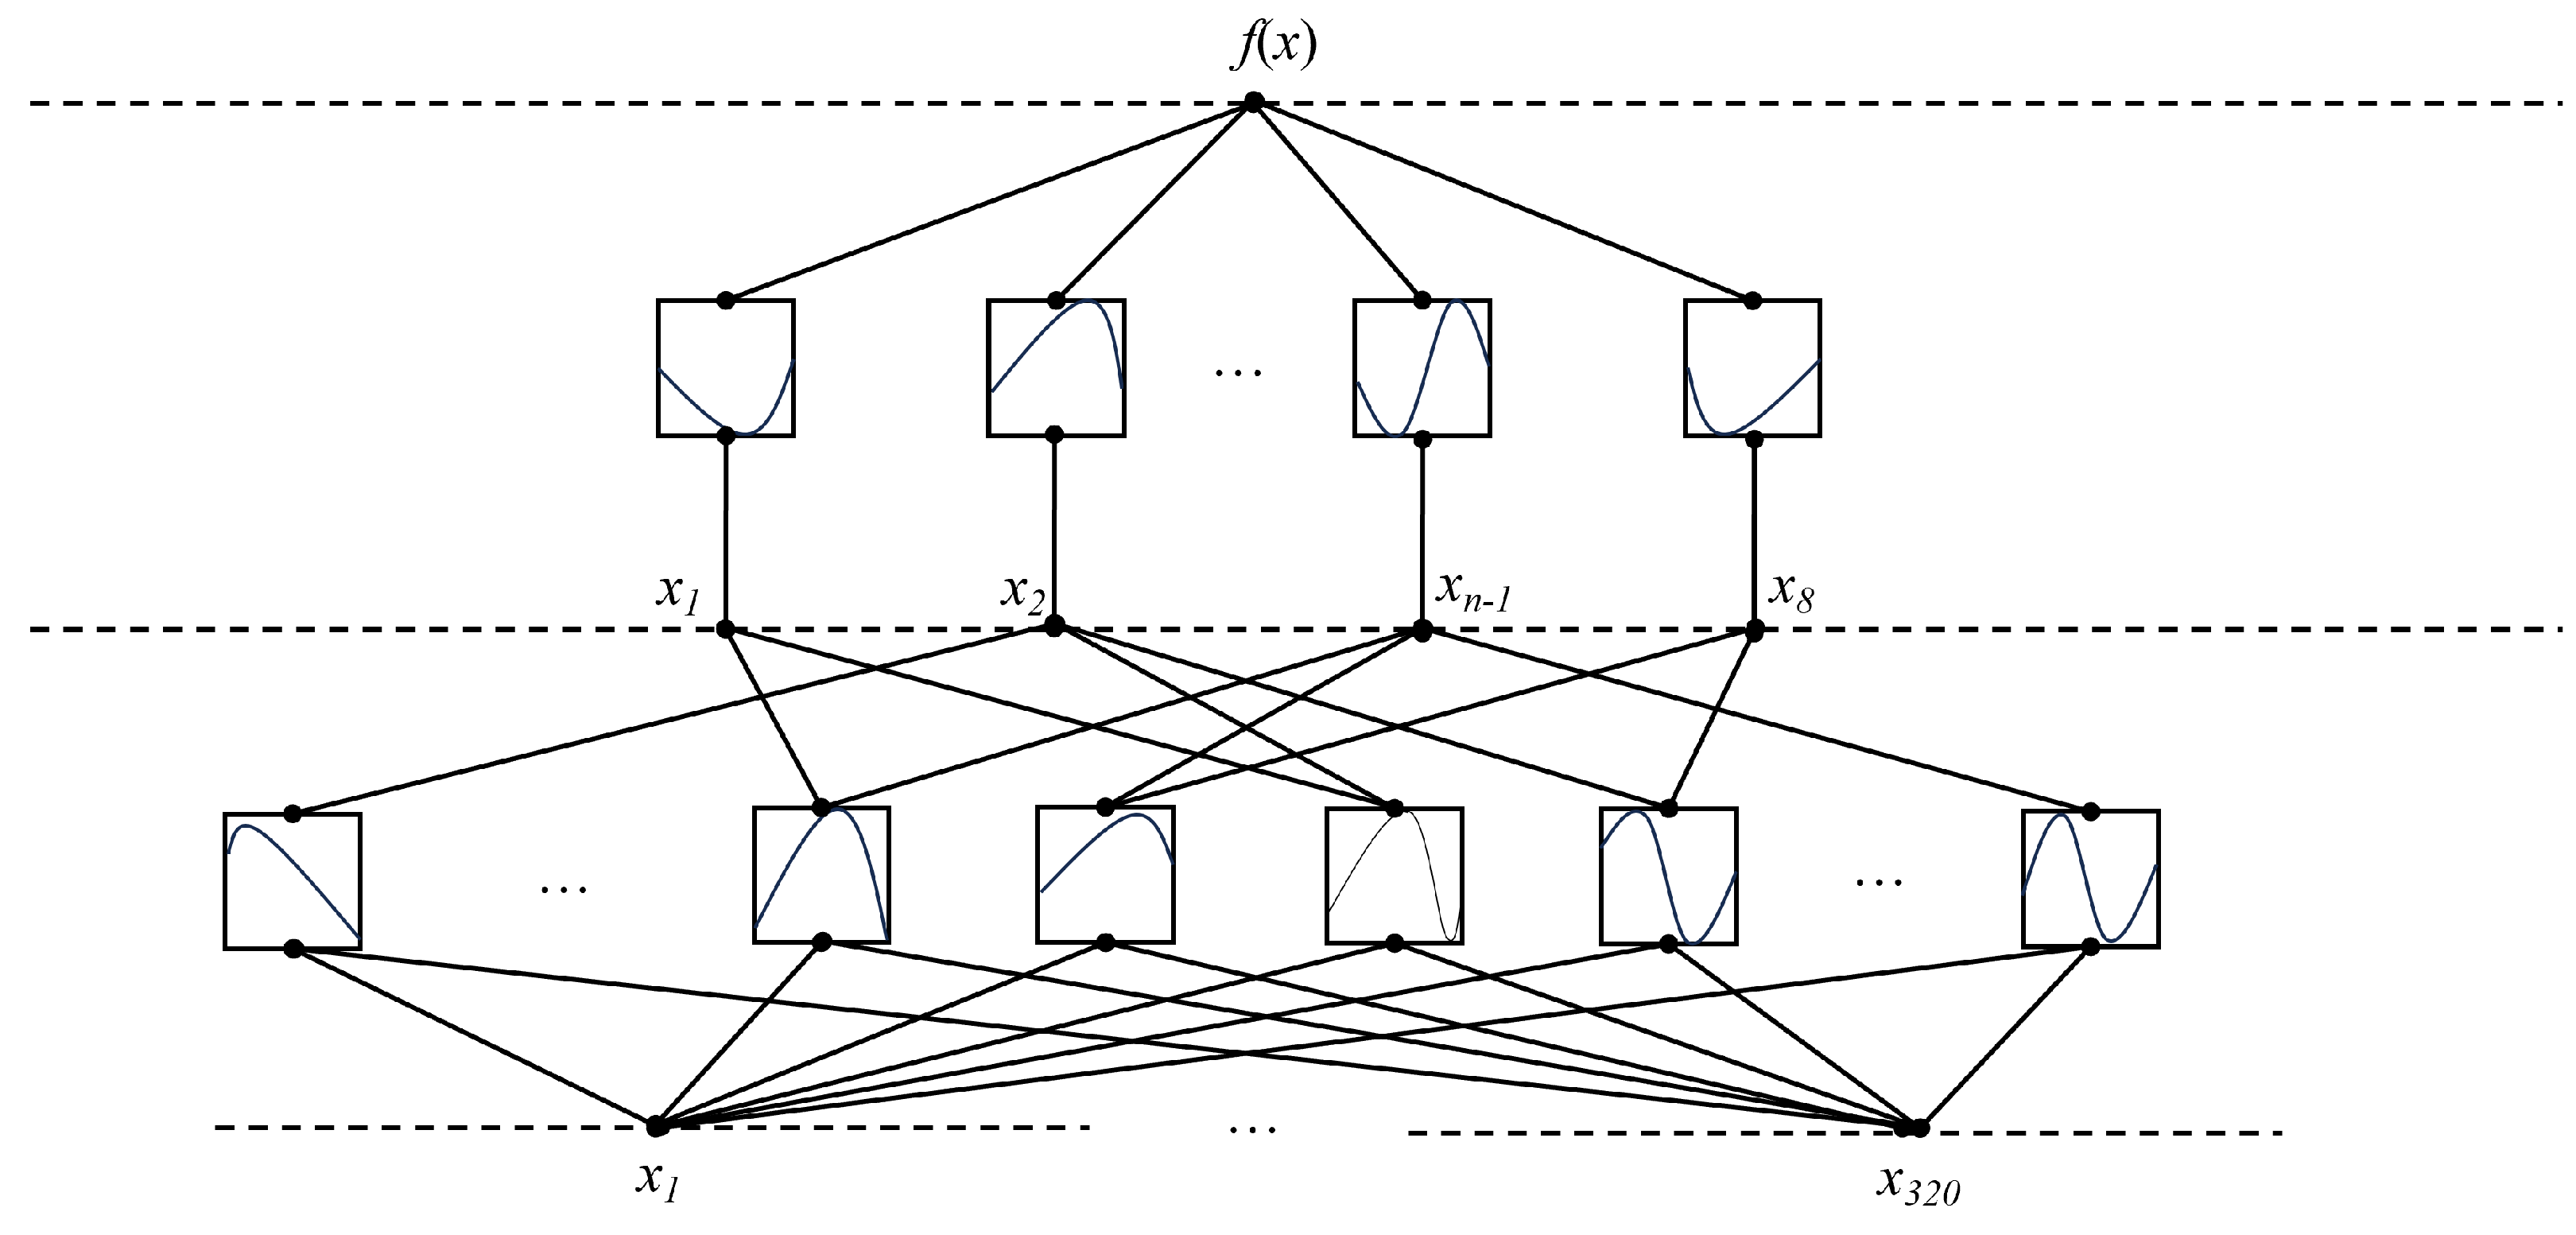
In the Kolmogorov–Arnold Representation (KAR) theorem, the inner functions form one KAN layer and the outer functions form another KAN layer. The theorem in Equation (
5) essentially represents a combination of two KAN layers. By stacking multiple KAN layers, the KAN structure can be extended to arbitrary widths and depths. This allows the construction of a transfer matrix between the input and output, with the calculation formula as follows:
In Equation (
6),
is the output of the (
)-th layer,
is the activation function for each edge, and
is the input to the l-th layer. By expressing the multi-layer function cascade relationship in matrix form, the formula for calculating the output of the KAN model is as follows:
In Equation (
7), KAN(x) represents the output of the KAN network,
is the function matrix corresponding to the l-th KAN layer, and x is the input sensor. The KAN model established in this paper consists of two layers, and the structure of the three-layer KAN is shown in
Figure 4.
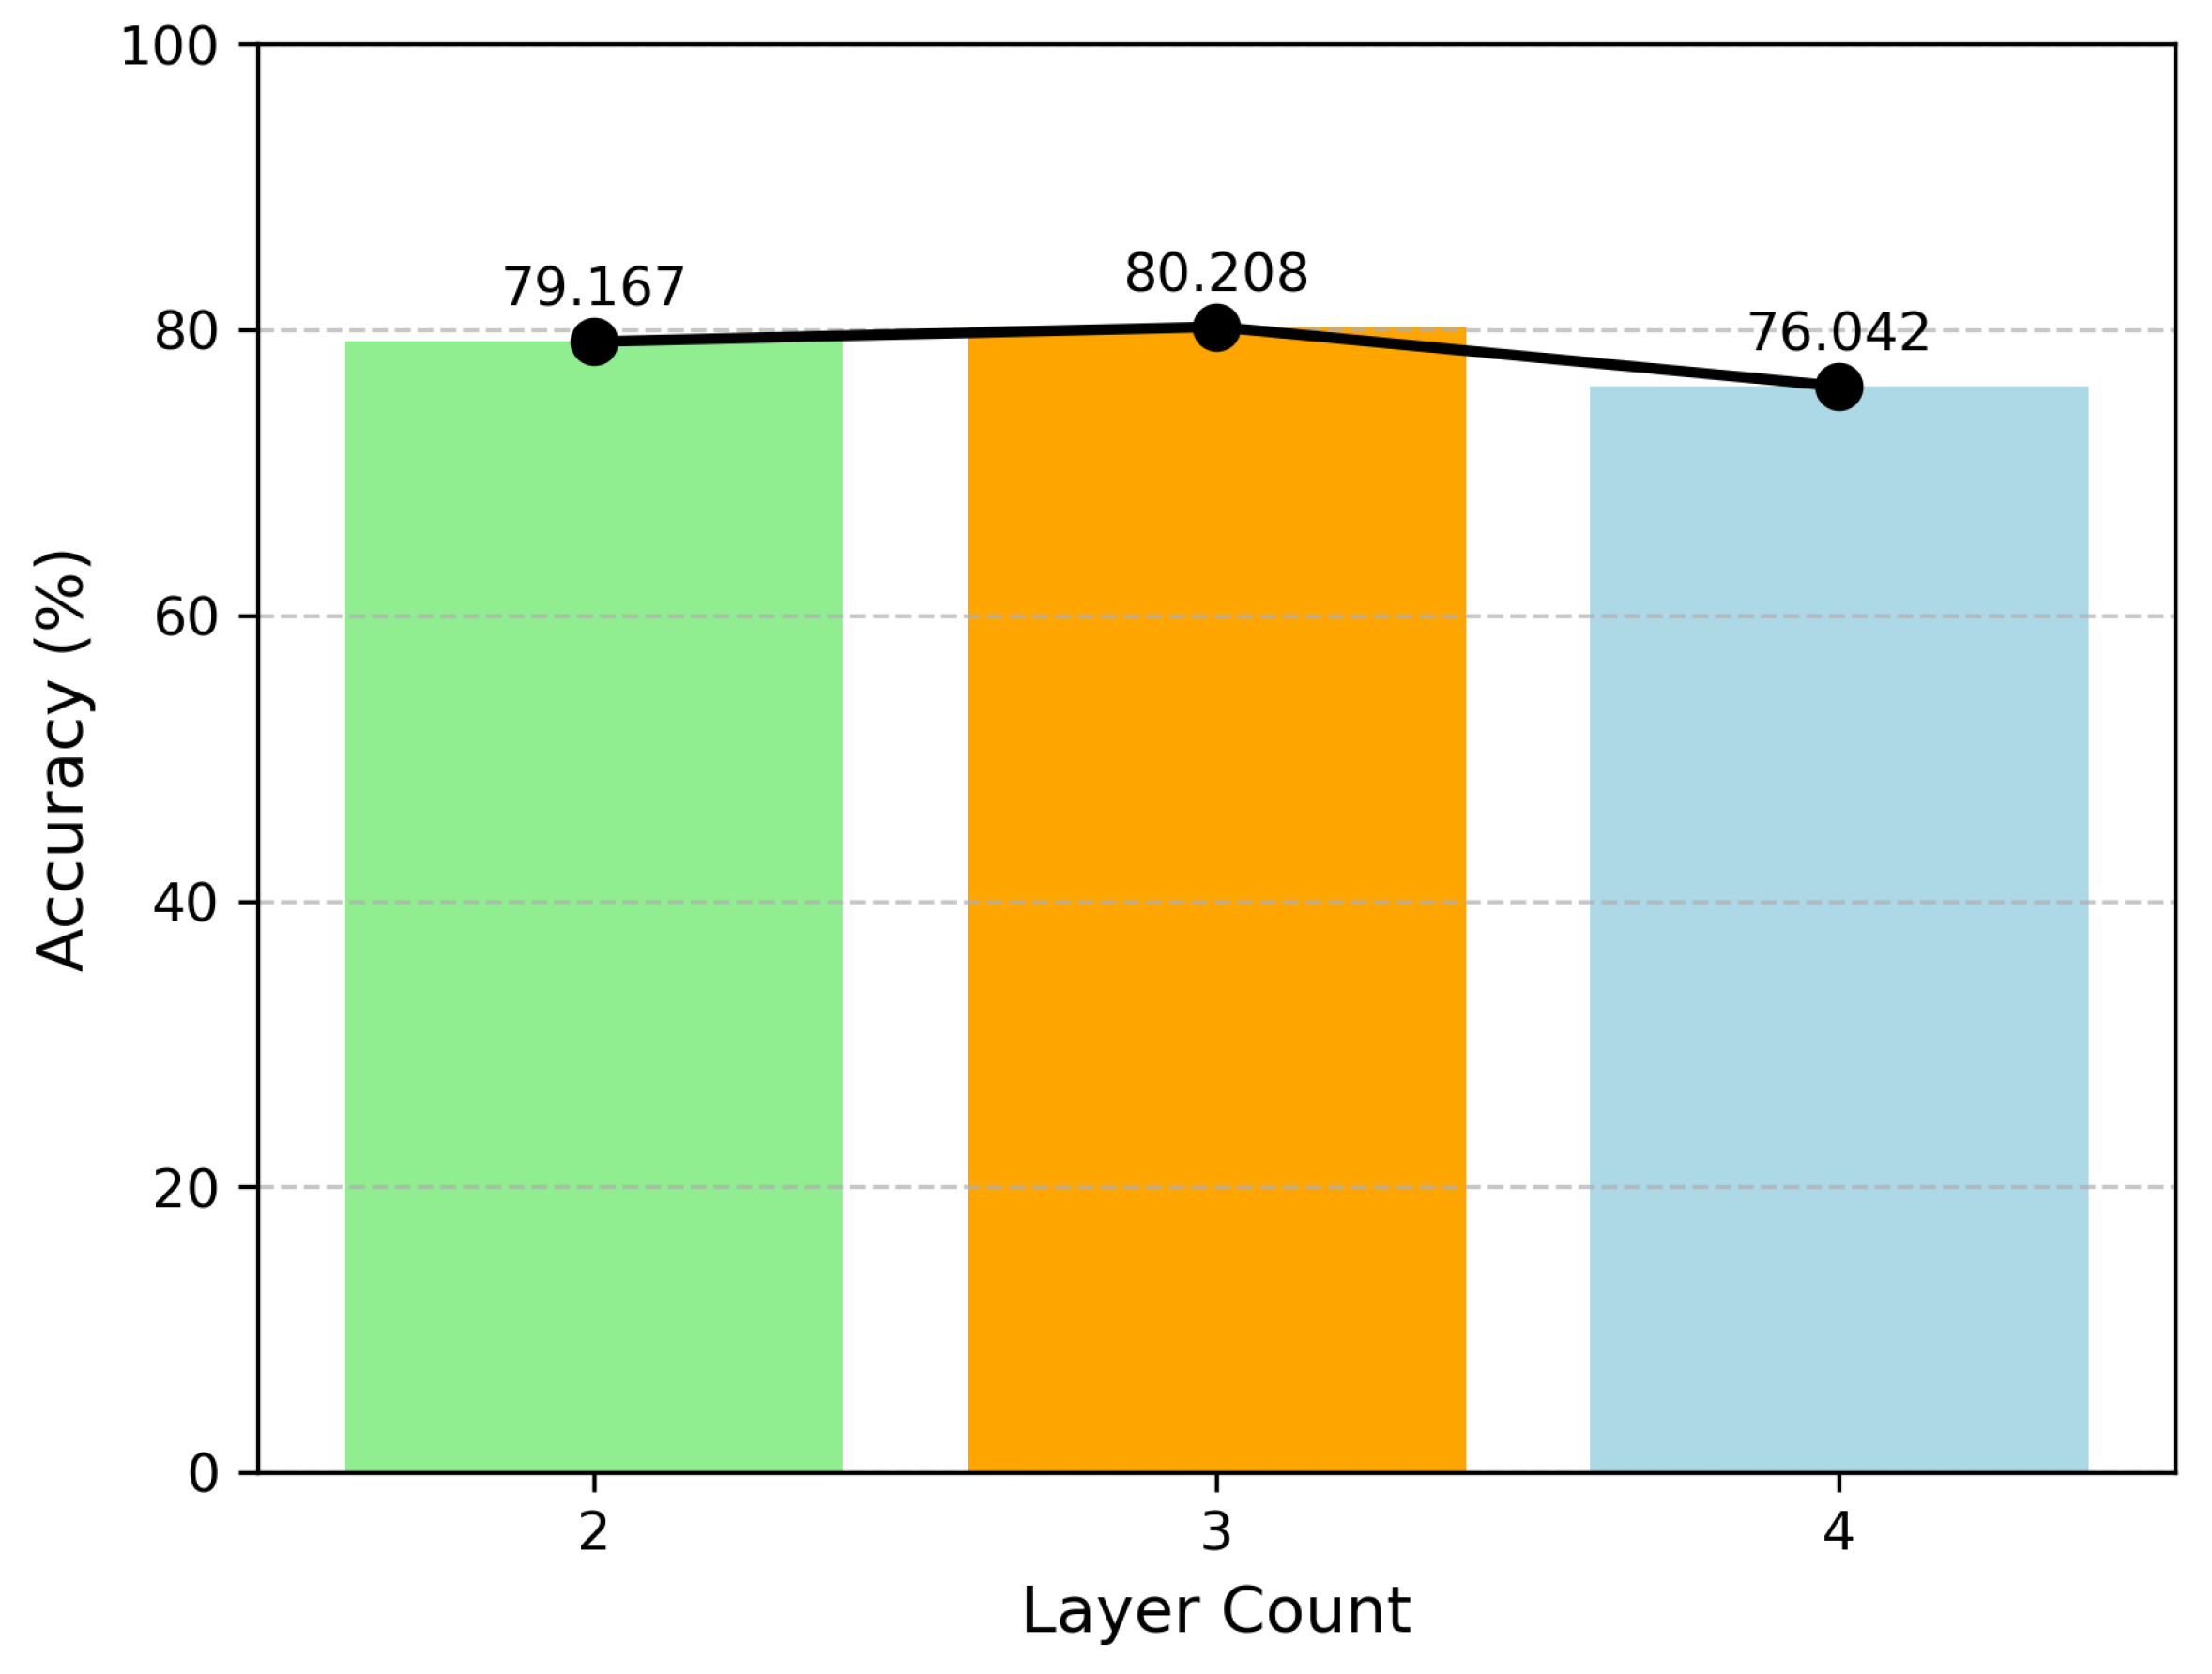
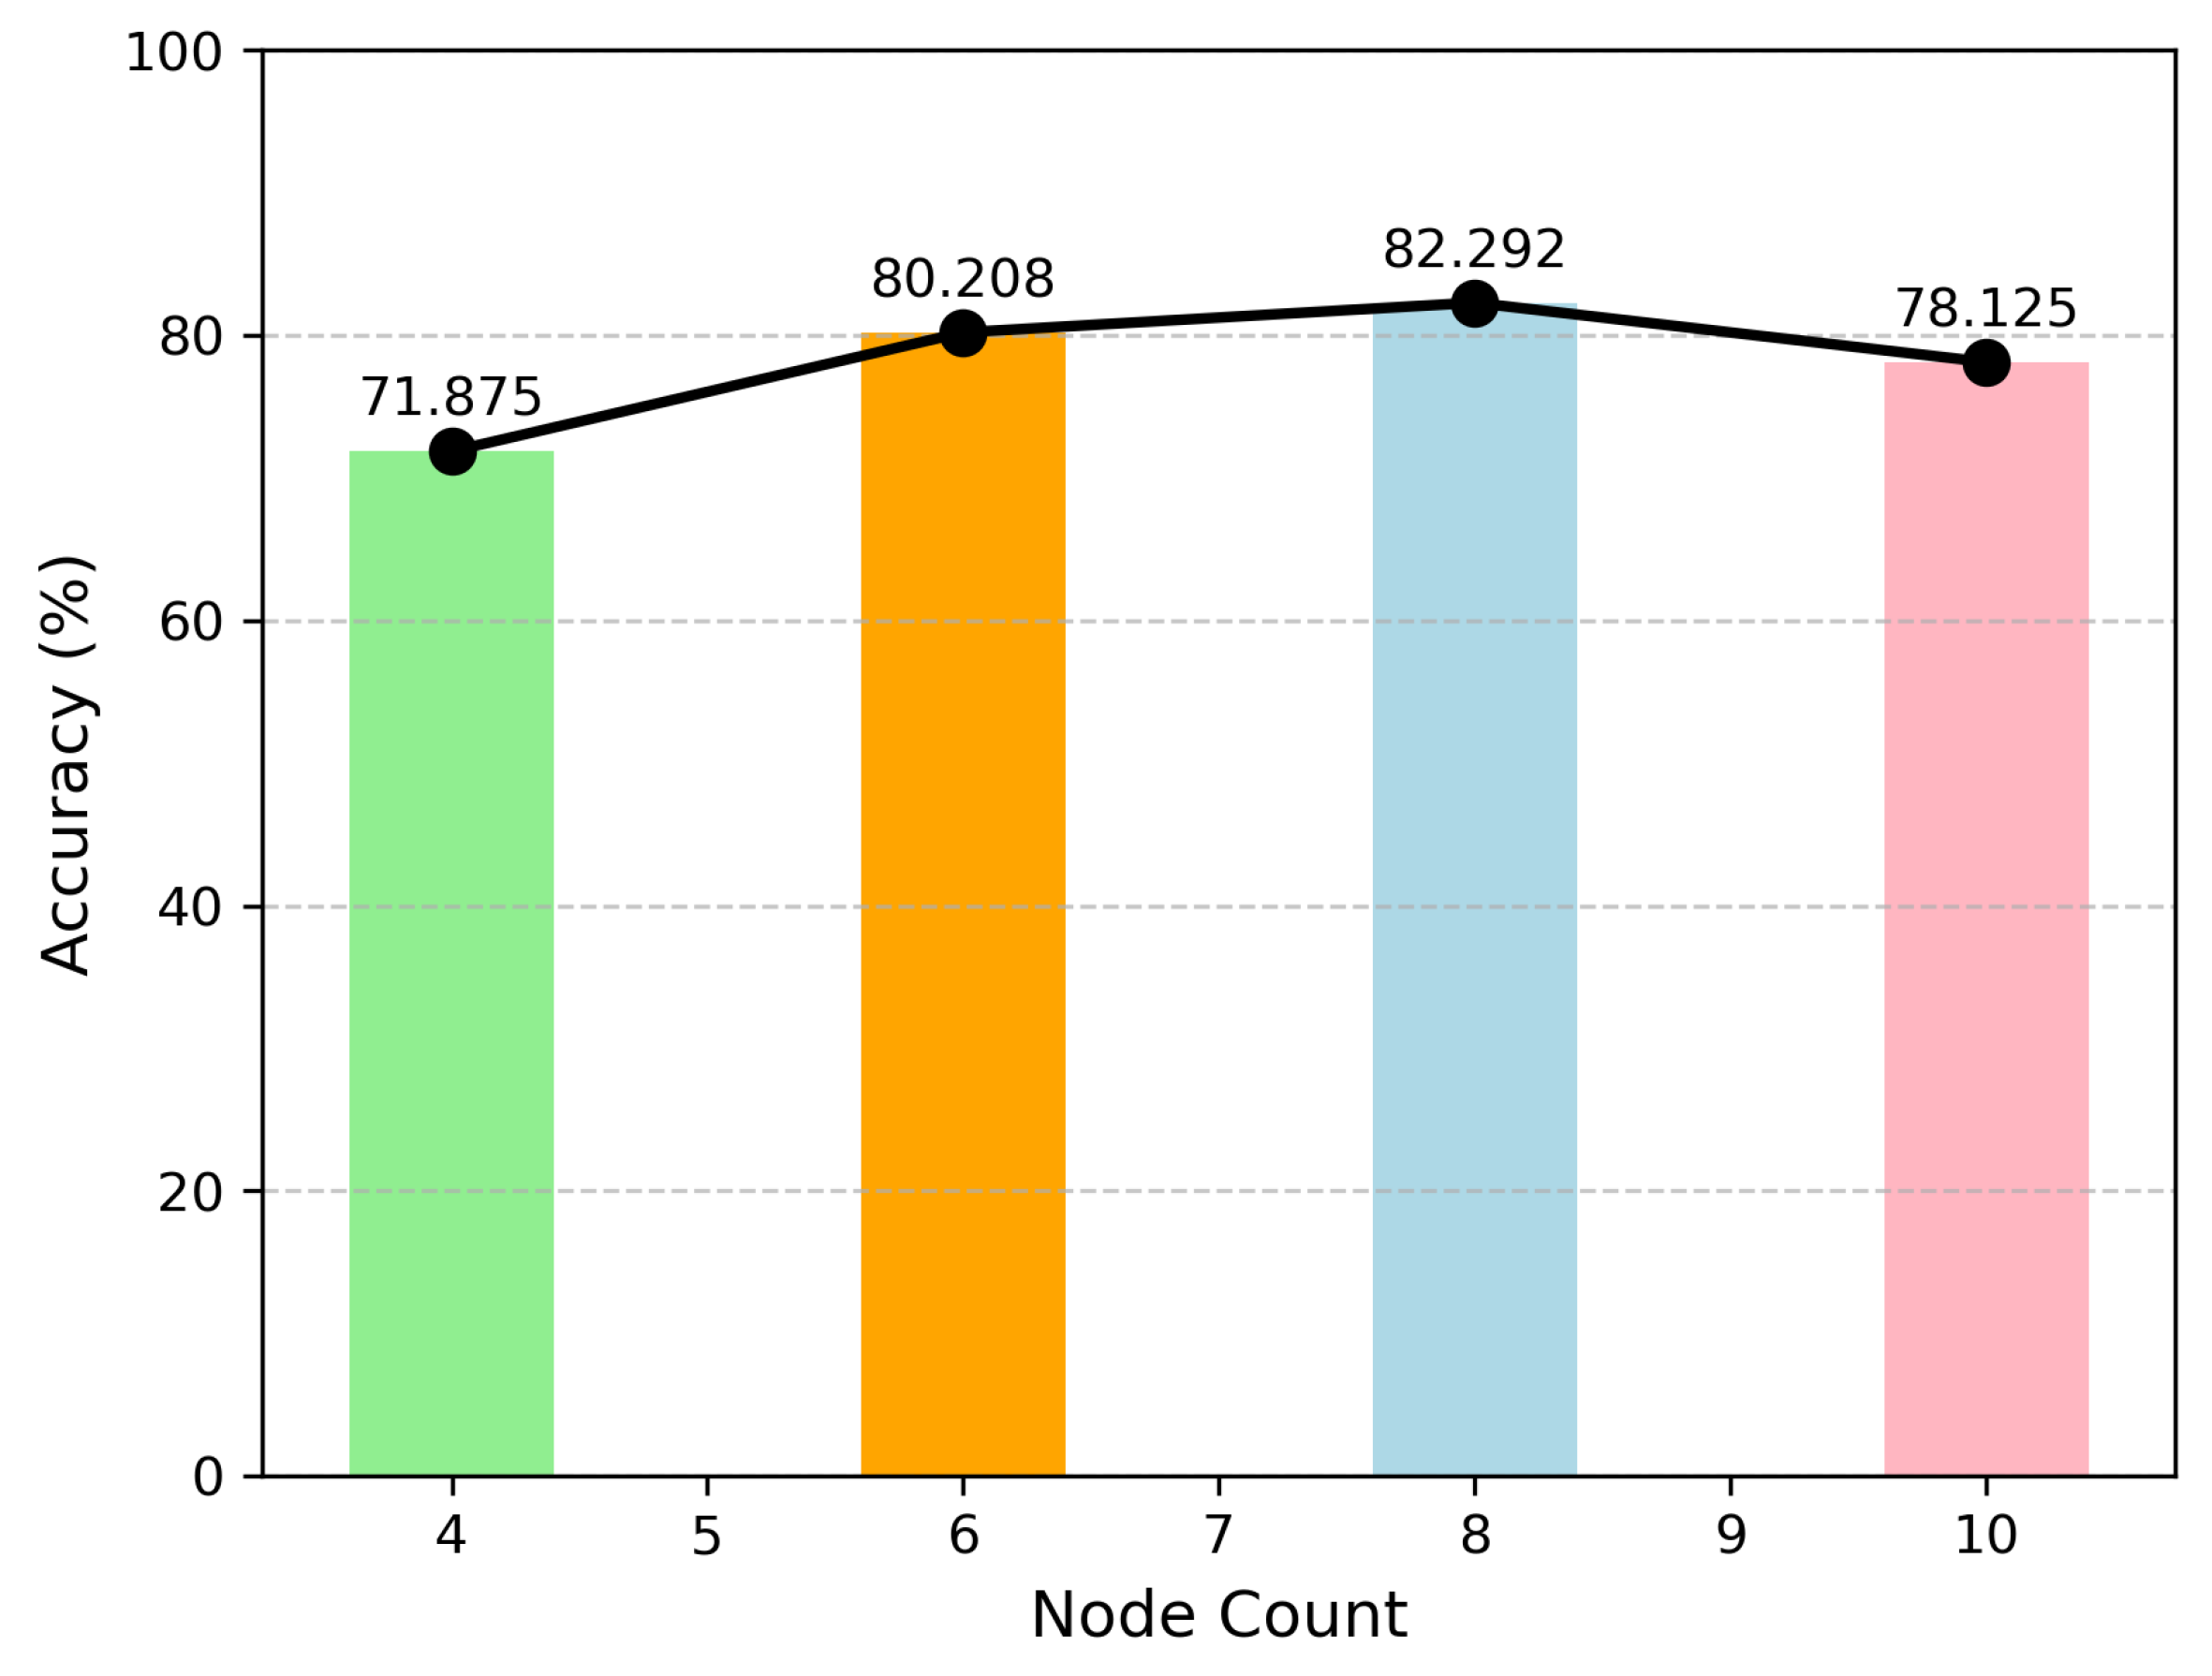
The first layer is a KAN layer with dimensions [320, 8]. It takes a tensor with 320 channels output from the pooling layer as input, and each node represents the sum of 320 learned activation functions. The second layer is a KAN layer with dimensions [8, n], which further trains the 8 nodes output from the first layer and sums the resulting activation functions. f(x) represents the output of the KAN model, with a total of n output variables corresponding to the categories in the dataset.
3.3. Metrics
Model performance was evaluated using accuracy (Acc, proportion of correct predictions), precision (positive predictive value), recall (sensitivity), F1 score (harmonic mean of precision and recall), and ROC curves with AUC (area under the curve) to assess the classification robustness across thresholds.
3.3.1. Acc
Accuracy is the proportion of correct predictions made by a model out of all predictions. It measures how often the model is right, regardless of the class (positive or negative).
TP (True Positives): Number of positive cases correctly predicted.
TN (True Negatives): Number of negative cases correctly predicted.
FP (False Positives): Number of negative cases incorrectly predicted as positive.
FN (False Negatives): Number of positive cases incorrectly predicted as negative.
3.3.2. Precision
Precision measures the proportion of true positive predictions out of all positive predictions made by the model.
3.3.3. Recall
Recall measures the proportion of actual positive cases that the model correctly identifies.
3.3.4. F1 Score
The F1 score is the harmonic mean of precision and recall. It provides a single metric that balances the trade-off between precision and recall and is especially useful when the dataset is imbalanced.
3.3.5. ROC Curve and AUC
A ROC curve (Receiver Operating Characteristic curve) is a graphical plot that shows the trade-off between the True Positive Rate (TPR) and the False Positive Rate (FPR) at various classification thresholds. AUC stands for Area Under the Curve, specifically the area under the Receiver Operating Characteristic (ROC) curve.
3.3.6. Cohen’s Kappa
Cohen’s Kappa is a statistical measure designed to evaluate the agreement between two raters or classifiers while correcting for agreement that could occur by chance. In the context of multi-class classification, Cohen’s Kappa extends naturally from its binary form to handle multiple categories. It is widely used in machine learning, psychology, and other fields to assess inter-rater reliability or classification consistency across more than two classes.
is the proportion of samples where the predicted and true labels match. For a multi-class confusion matrix, this is the sum of the diagonal elements divided by the total number of samples:
where
is the number of samples correctly classified for category i, k is the number of classes, and N is the total number of samples.
is the proportion of agreement expected by chance, calculated as the sum of the products of the marginal probabilities for each class:
where
is the row sum for class (i) and
is the column sum for class (i).
3.3.7. MCC
The Matthews Correlation Coefficient (MCC) was originally developed for binary classification but can be adapted for multi-class problems. In its binary form, MCC measures the correlation between predicted and actual labels using all four elements of a confusion matrix. For multi-class classification, MCC is typically computed by applying the One-vs.-Rest (OvR) approach for each class and then averaging the results.
3.3.8. Cohen’s d
Cohen’s d is a statistical measure used to quantify the effect size, representing the standardized difference between the means of two groups relative to their pooled standard deviation. It is widely applied in machine learning, psychology, and social sciences to assess the magnitude of differences, such as model performance in classification accuracy.
and
are the means of the two groups, and
s is the pooled standard deviation, calculated as
where
and
are the standard deviations,
and
are sample sizes, and
and
are variances. Common thresholds are
(small),
(medium), and
(large).
3.4. Experimental Design
The experimental environment is shown in
Table 3.
The CTIFERK model was trained using the cross-entropy loss function, which is widely used in classification tasks due to its effectiveness in handling multi-class problems like thermal infrared expression recognition. Compared to other loss functions, such as focal loss (which is often used to address class imbalance) or triplet loss (commonly employed in face recognition studies), cross-entropy loss demonstrated stable convergence and superior generalization across diverse expression classes in our datasets. These advantages led us to choose cross-entropy loss as the primary loss function for our model.
Key hyperparameters, such as the learning rate, batch size, and epoch count, were selected based on a grid search over ranges (learning rate: [1 , 1 , 1 ]; batch size: [16, 32, 64]; epochs: [100, 150, 200]) to maximize validation accuracy on the database. After experimentation, it was ultimately decided to use the Adam optimizer for gradient descent optimization, with the learning rate of the backbone network set to 1 . In the training process, the learning rate is reduced to 0.1 of its original value every 30 epochs. The input image size was set to , as this resolution balances computational efficiency with sufficient detail for thermal infrared data, which typically has lower spatial cues than visible light images. The thermal images in our datasets (e.g., GUET thermalface at 640 × 480) retain critical temperature distribution patterns even after resizing to . This resolution aligns with MobileViT’s architecture, optimized for inputs, ensuring efficient processing on classroom hardware. The batch size was set to 32, and the total number of training epochs was 150.
5. Discussion
This study aimed to tackle the challenge of accurately recognizing student facial expressions in smart classroom environments, especially under varying illumination conditions where traditional visible-light-based methods struggle. By leveraging thermal infrared imaging and integrating the Kolmogorov–Arnold Network (KAN) into the CTIFERK model, we developed a novel approach tailored to educational settings. Below, we discuss the findings in relation to the research questions outlined in
Section 1.1.
RQ1: How can thermal infrared facial images be effectively utilized to recognize student expressions in smart classroom environments, overcoming the limitations of visible-light-based methods under varying illumination conditions?
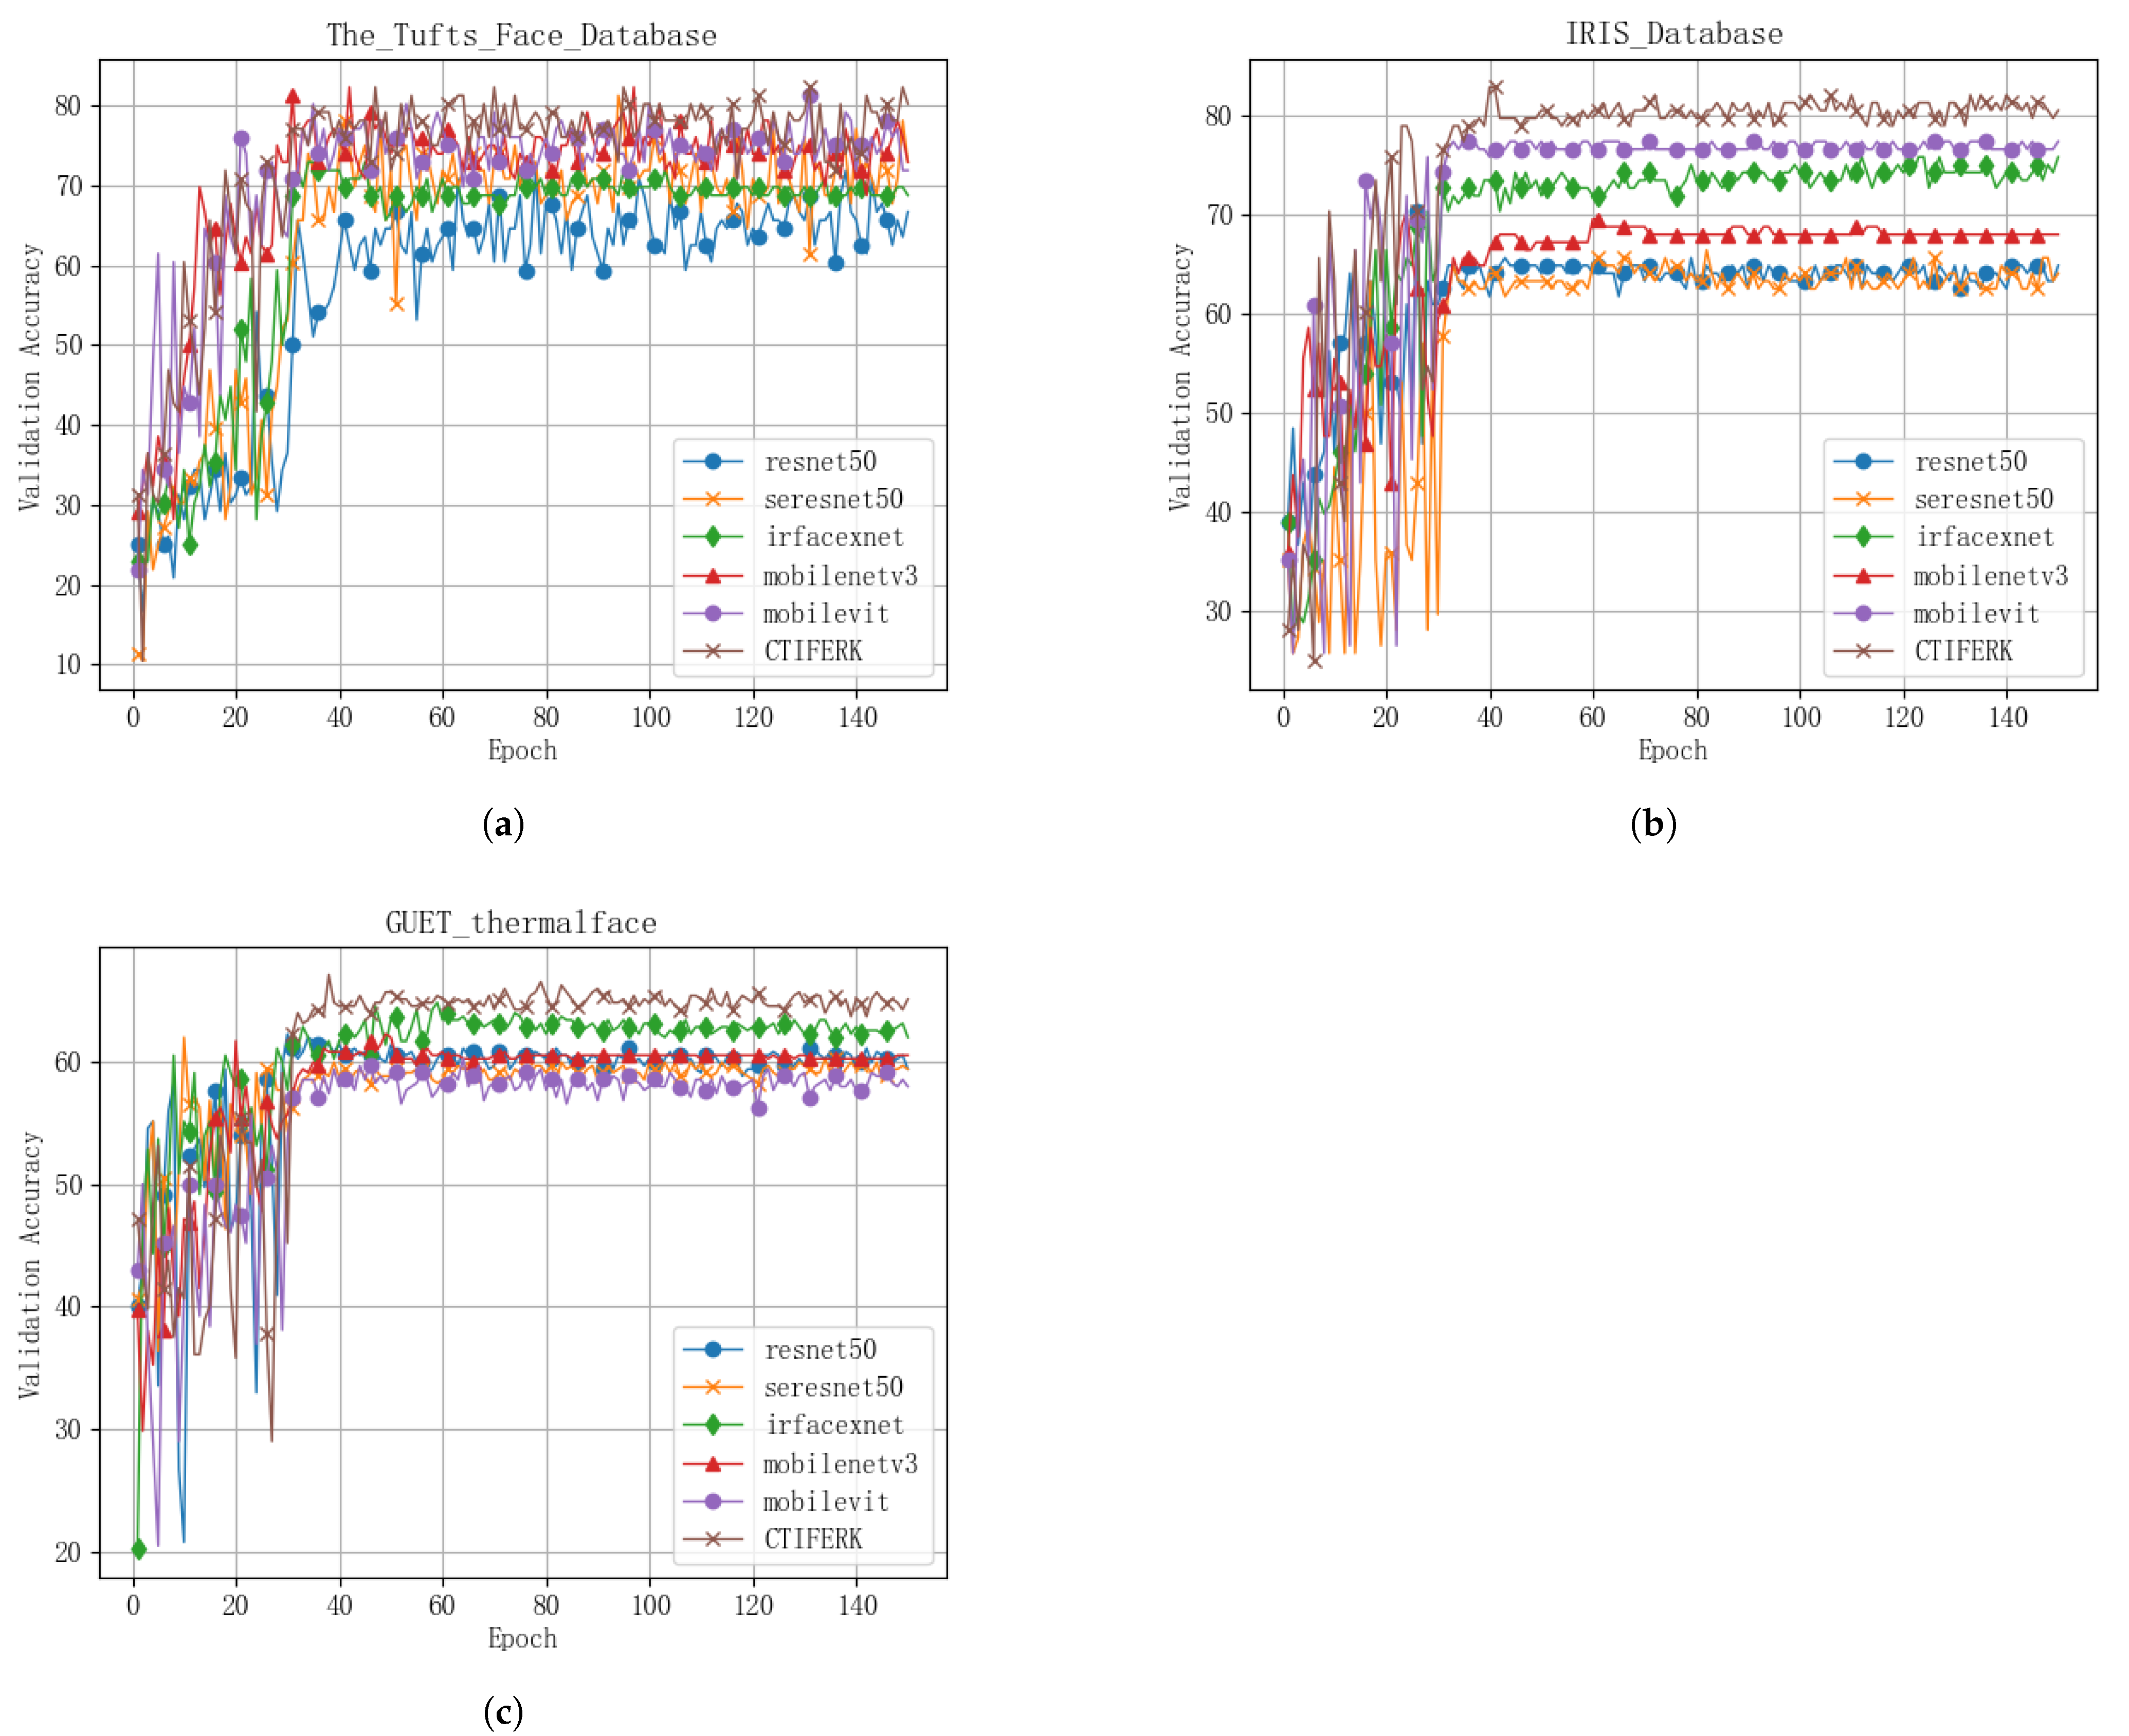
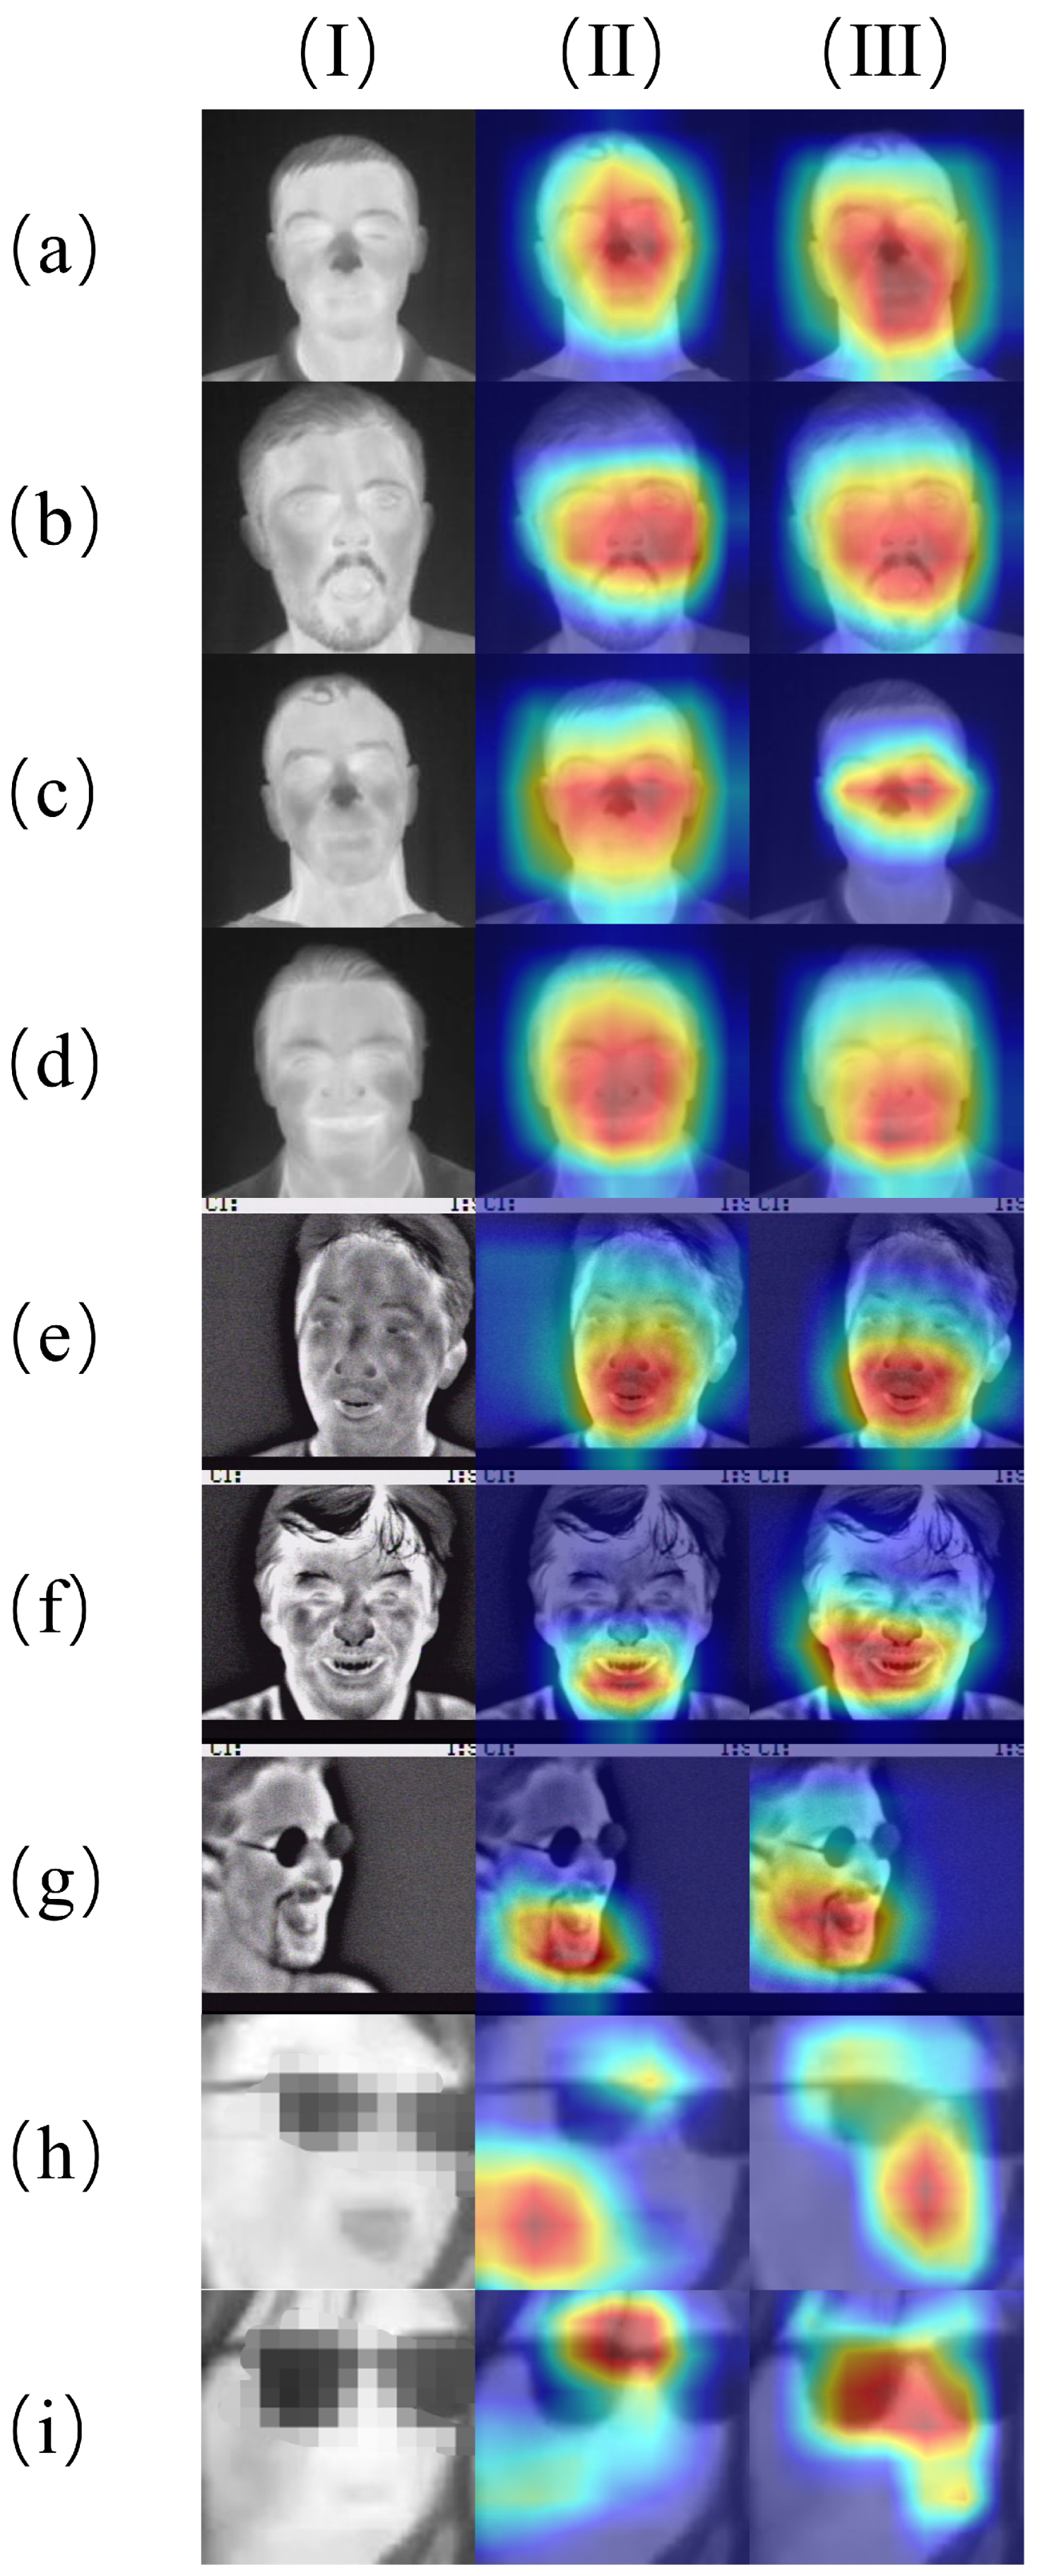
The experimental results show that thermal infrared facial images, which capture temperature distribution symmetry unaffected by lighting changes, offer a robust alternative to visible-light-based methods. The CTIFERK model achieved accuracies of 81.82% on the Tufts Face Database and 82.19% on the IRIS Thermal/Visible Face Database, significantly outperforming baseline models like ResNet50 and MobileNetv3 under controlled conditions. Even on the real-world GUET thermalface dataset where accuracy dropped to 65.22%, CTIFERK maintained superiority over baselines, indicating its ability to address illumination-related limitations. This success stems from KAN’s multi-layer structure, which preserves symmetrical facial features during learning, enhancing feature extraction in low-light or variable-light scenarios. However, challenges such as lower resolution in classroom settings suggest that improved imaging hardware is needed to fully unlock this potential.
RQ2: To what extent does the integration of Kolmogorov–Arnold Networks (KANs) into a thermal infrared facial expression recognition model improve accuracy and robustness compared to traditional MLP-based approaches?
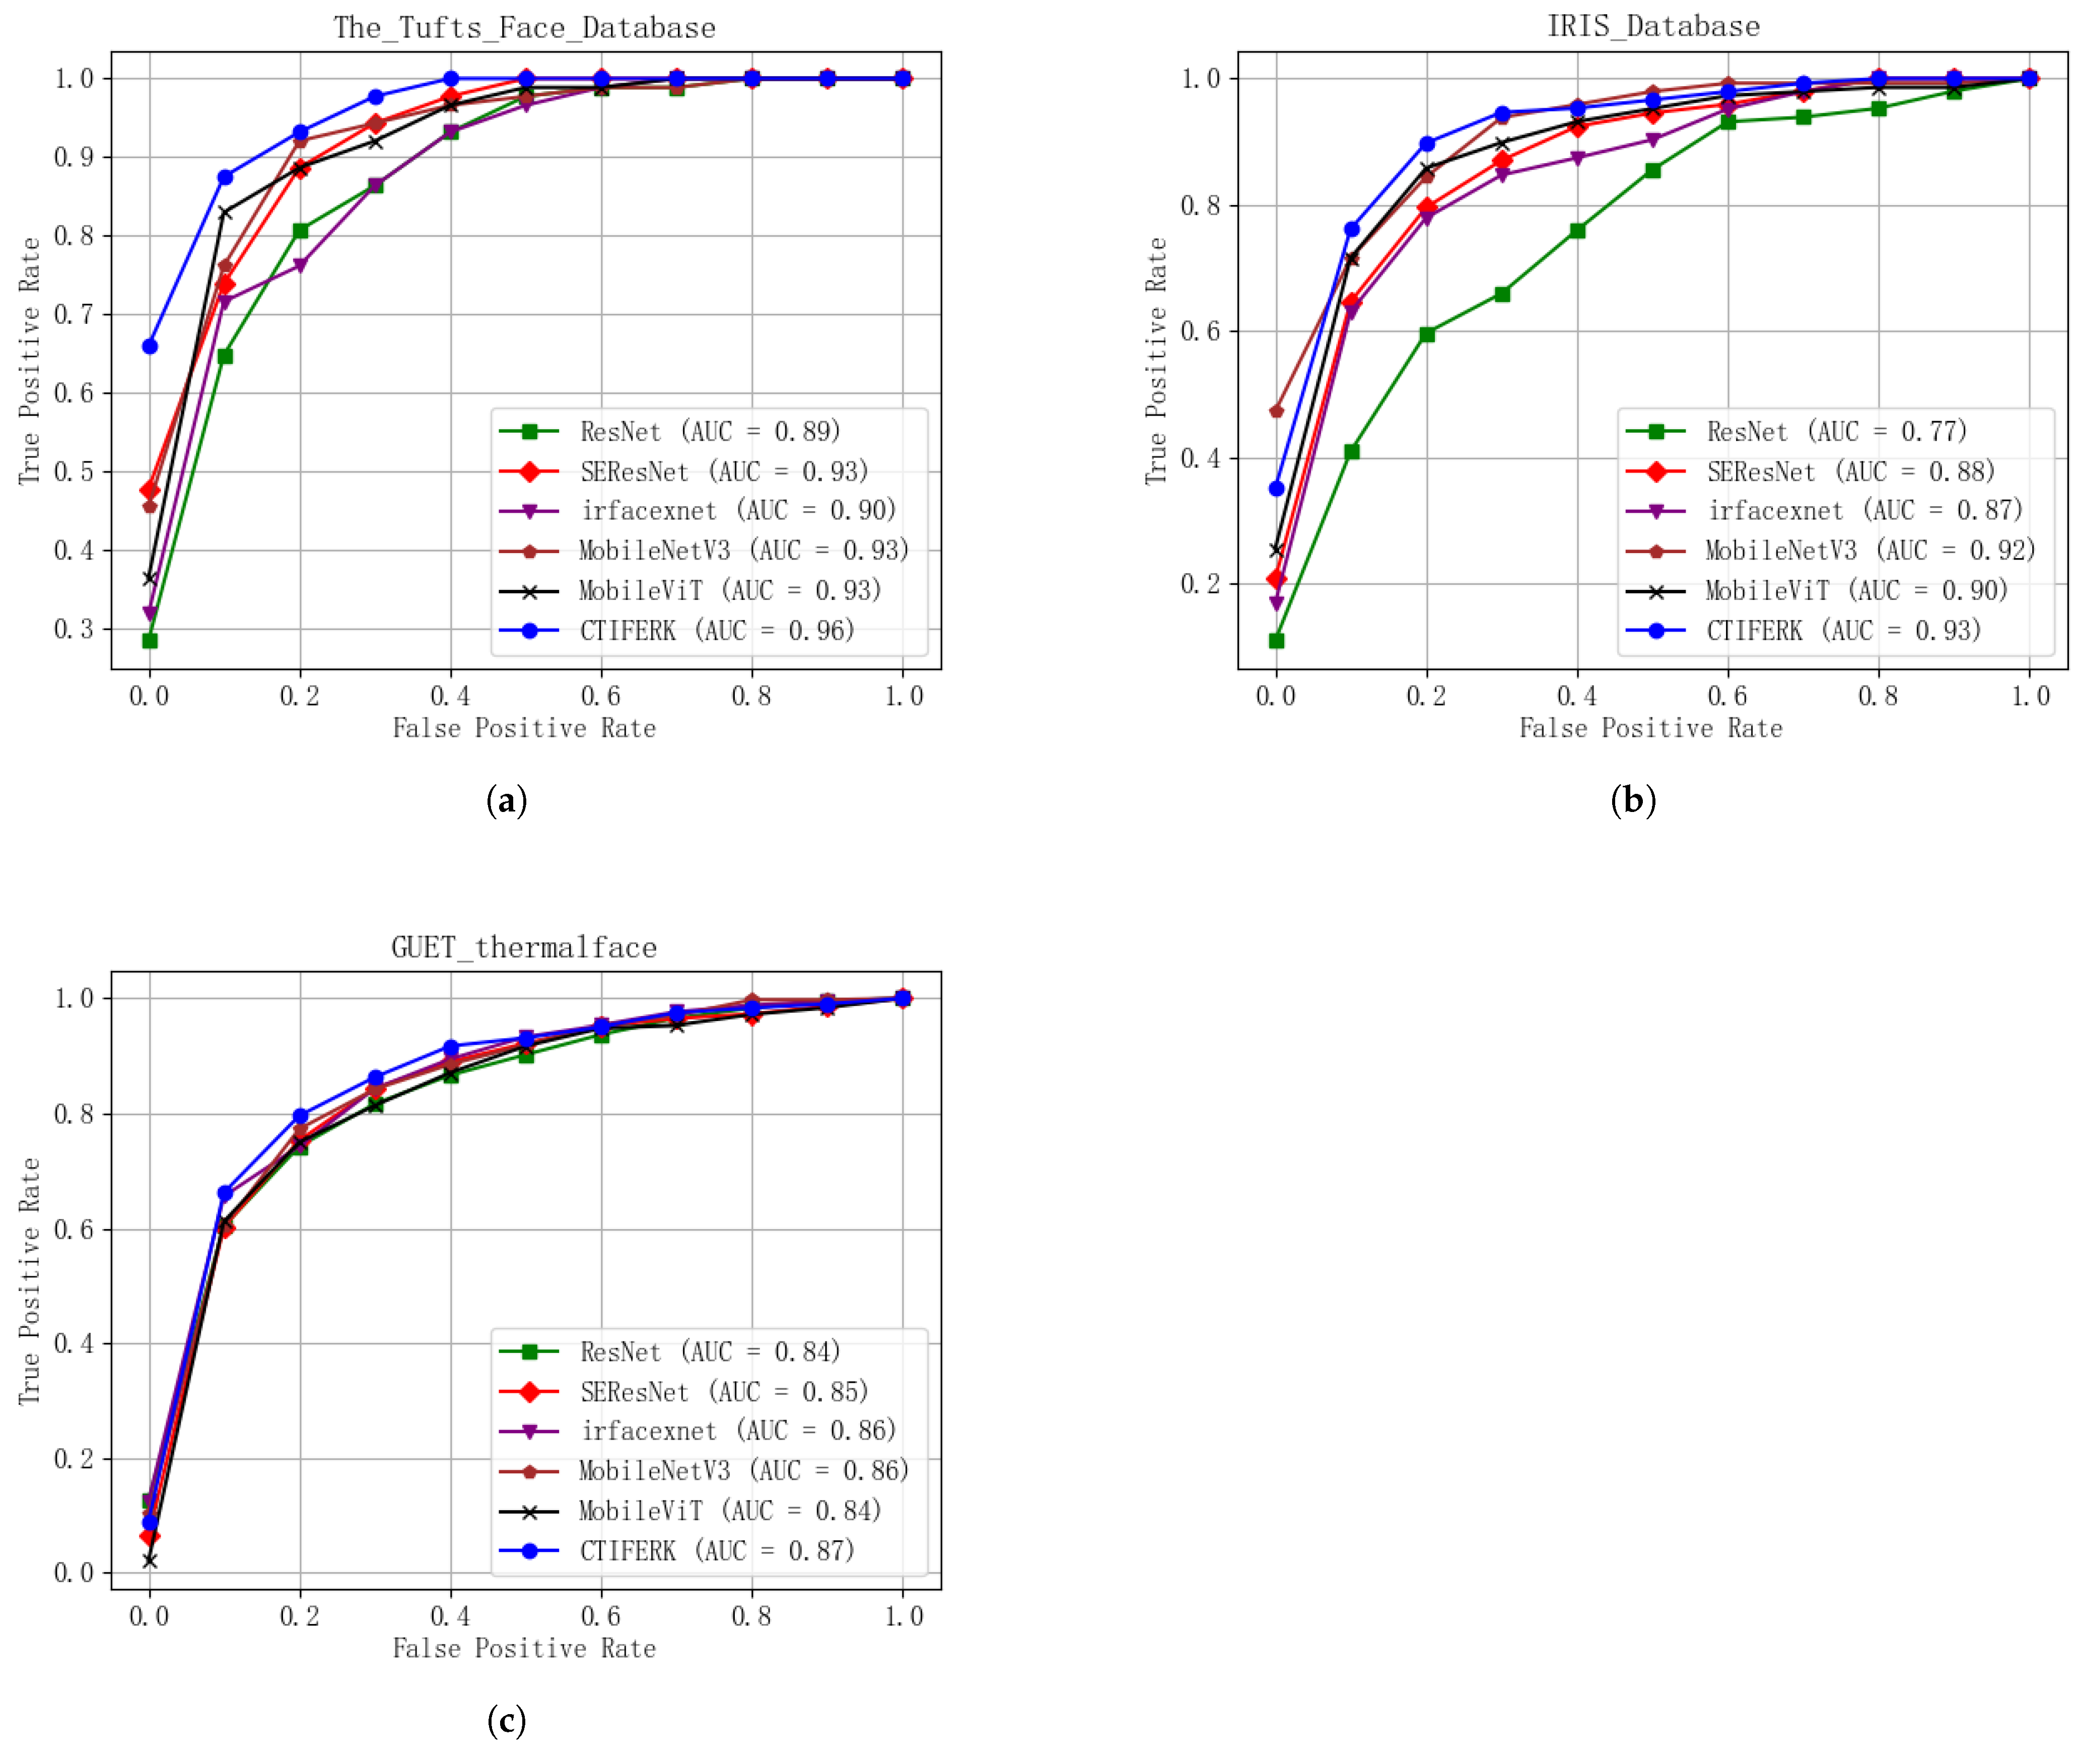
Integrating a KAN into CTIFERK markedly improves accuracy and robustness over traditional MLP-based models. Ablation experiments (
Figure 9) and performance metrics (
Table 4) reveal that CTIFERK consistently surpasses MobileViT alone, with accuracy gains of 1–7% across datasets. Higher AUC values in ROC curves (
Figure 9) further confirm enhanced classification robustness.
Table 5 underscores the KAN’s impact, with Cohen’s Kappa values and MCC ranges reflecting strong, consistent performance. Unlike MLPs, which are prone to overfitting and scalability issues, KAN’s mathematical efficiency mitigates these risks, as shown by rapid convergence after the 30th epoch (
Figure 5), validating its advantage in thermal infrared facial expression recognition.
RQ3: What are the practical challenges and performance differences when applying a thermal infrared recognition model to a real-world classroom dataset compared to controlled public datasets?
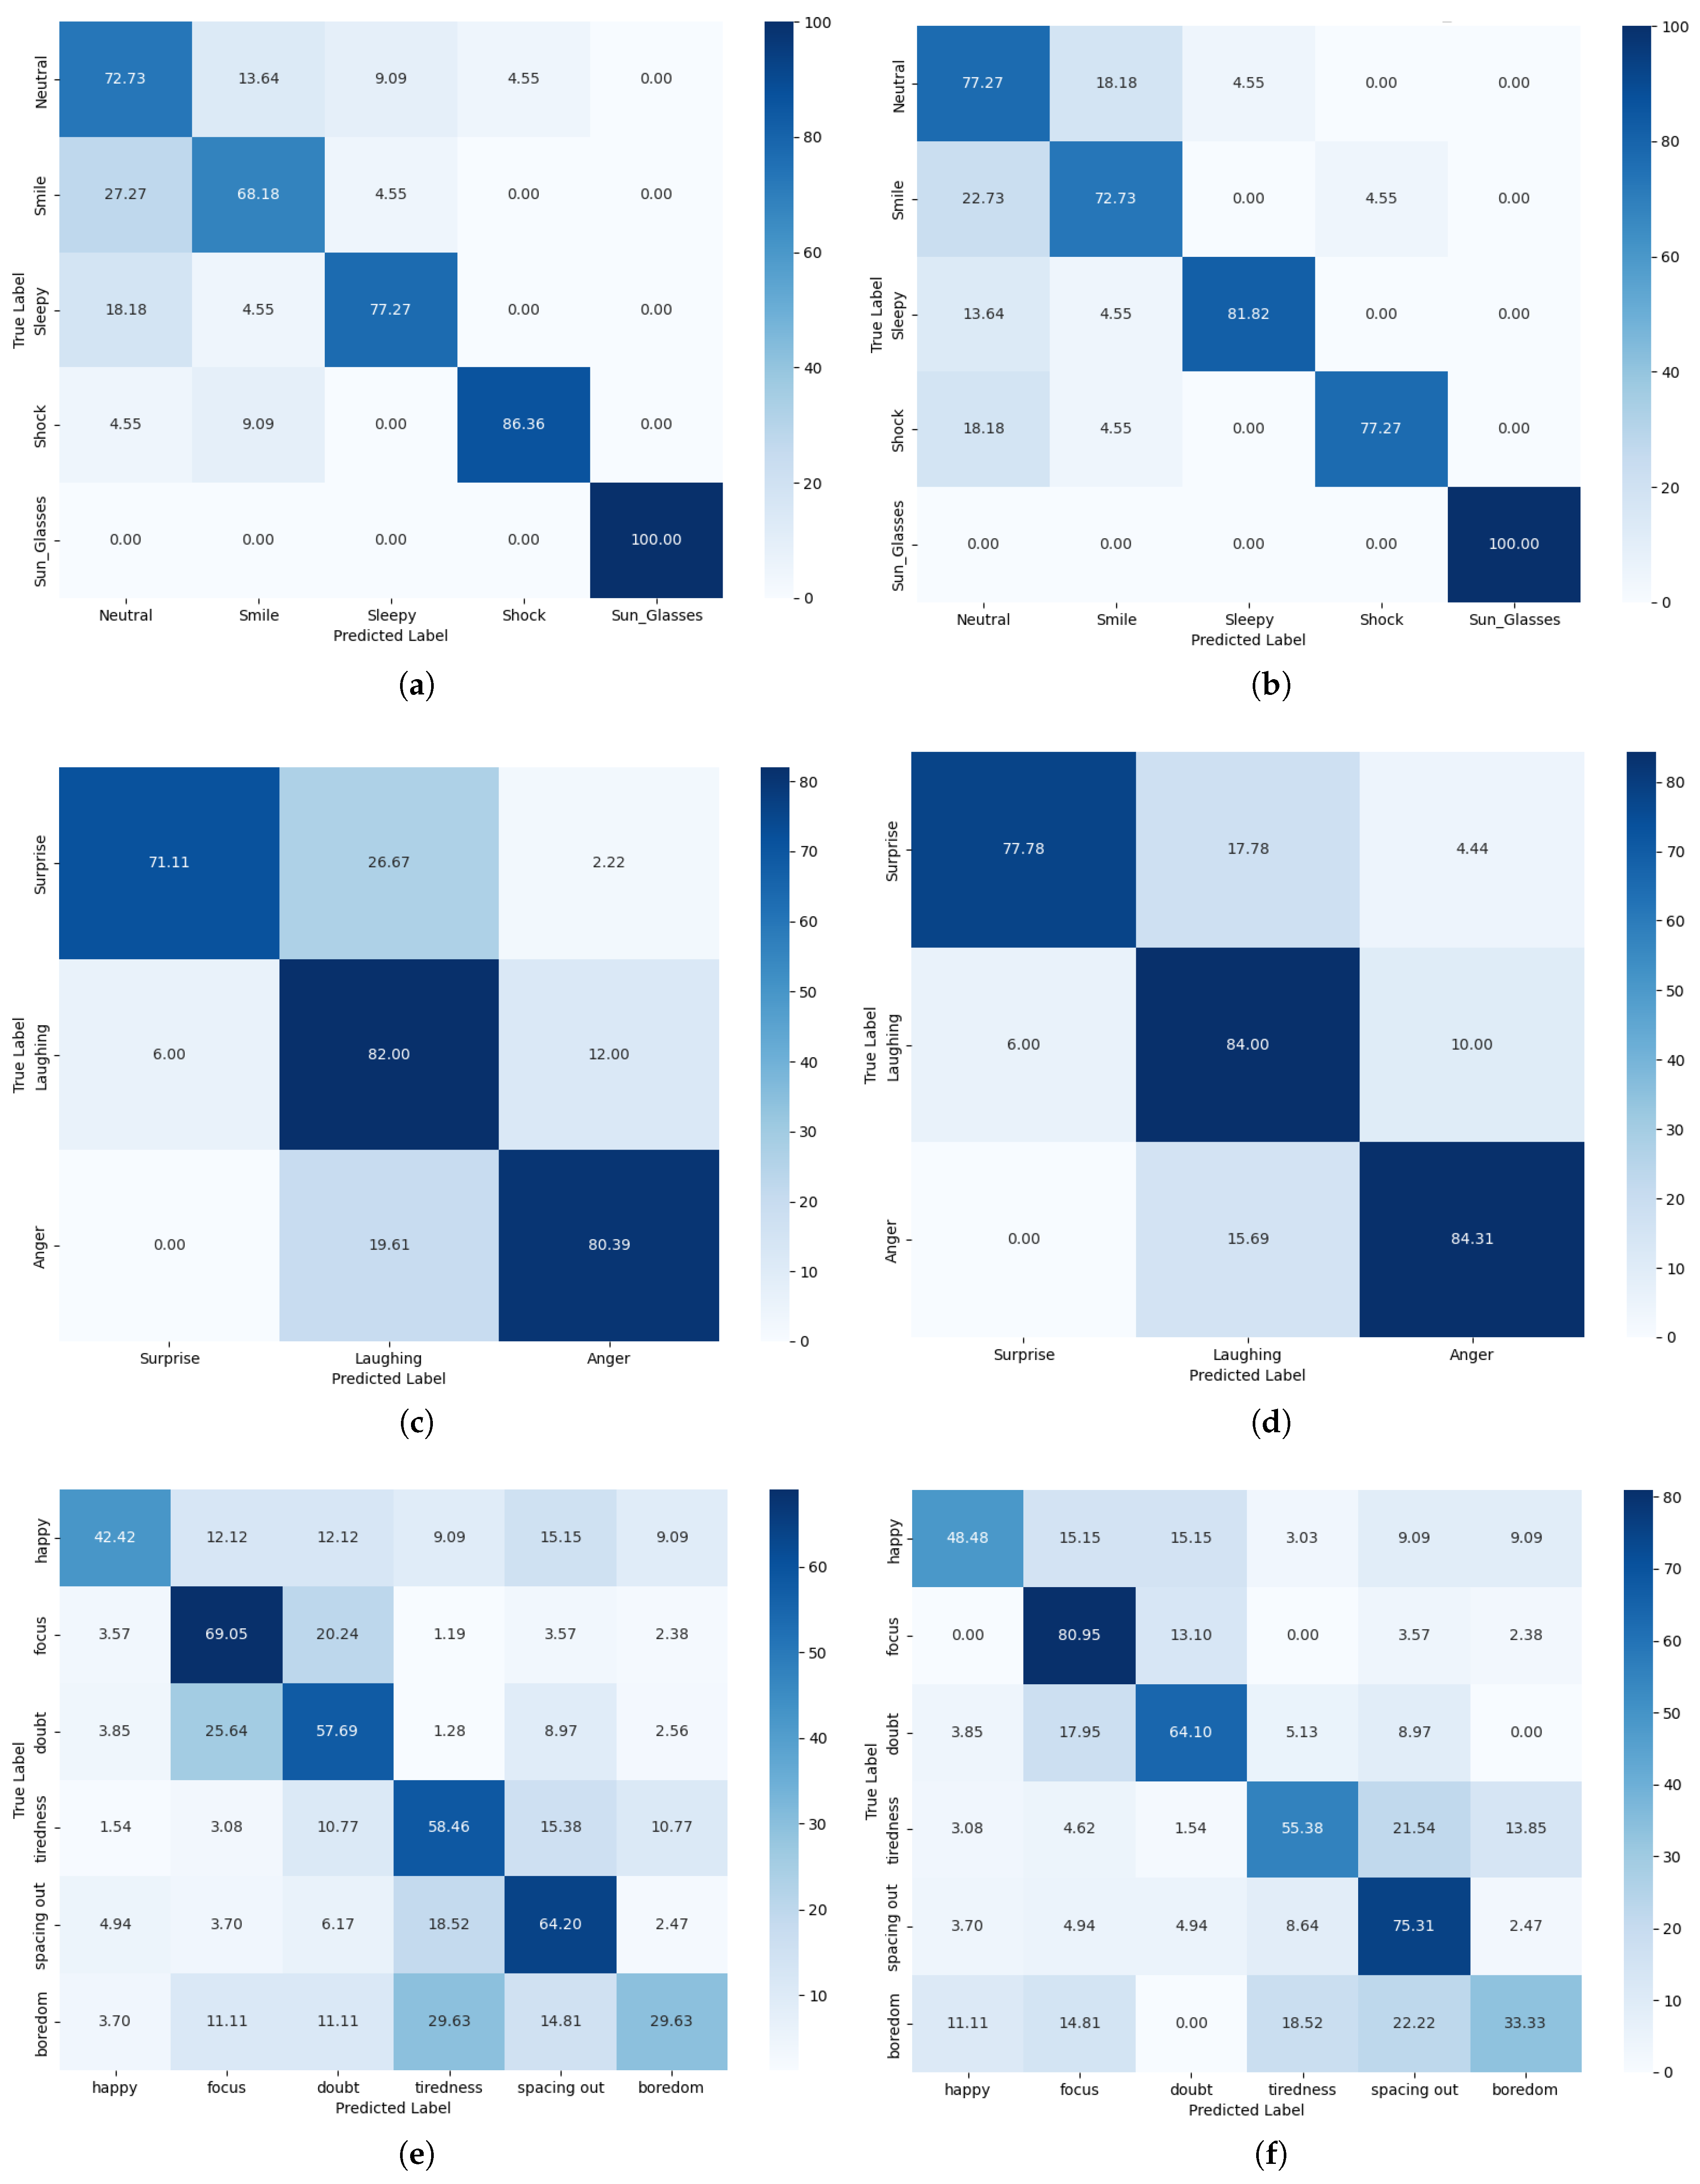
The GUET thermalface dataset’s lower accuracy (65.22%) compared to Tufts (81.82%) and IRIS (82.19%) highlights the practical challenges in real-world classroom settings. Key issues include the YOSEEN X imager’s lower resolution and greater capture distance, which hinder fine-grained feature extraction. Confusion matrices (
Figure 9) reveal that overlapping head poses—e.g., between “happy”, “focused”, and “confused” or “tired”, “distracted”, and “bored”—cause misclassifications, a problem less evident in controlled datasets with single-subject, high-resolution images. The Kappa value of 0.533 and MCC range of 0.297–0.668 on GUET thermalface (
Table 5) indicate weaker performance due to data imbalance and sparse intervals. While CTIFERK excels in controlled environments, its real-world application demands hardware upgrades and techniques like pose normalization to address these challenges.
From a practical perspective, the CTIFERK model’s ability to monitor student emotions in real-time, regardless of lighting conditions, holds significant promise for smart classrooms. By leveraging thermal infrared imaging, CTIFERK enables personalized learning and teacher interventions through reliable engagement tracking with minimal computational complexity (0.98 M vs. 0.95 M parameters for MobileViT), making it feasible for standard hardware. Ablation experiments (
Figure 9) reinforce the value of integrating Kolmogorov–Arnold Networks (KANs), showing consistent accuracy gains of 1–7% over MobileViT and improved per-category performance, aligning with prior work highlighting KAN’s superiority over MLPs in interpretability and fitting efficiency.
This study confirms that thermal infrared facial expression recognition, powered by CTIFERK, offers a viable alternative to visible-light-based methods. As shown in
Table 4, CTIFERK achieved accuracies of 81.82% on the Tufts Face Database and 82.19% on the IRIS Thermal/Visible Face Database, significantly outperforming baselines. However, its performance on the real-world GUET thermalface dataset (65.22%) is lower, with a Cohen’s Kappa of 0.533 and MCC range of 0.297–0.668 (
Table 5), reflecting the practical challenges in classroom settings.
Several limitations hinder CTIFERK’s real-world application. First, hardware constraints pose significant barriers. The YOSEEN X thermal imager, costing approximately USD 7000, limits adoption in resource-constrained educational settings. Its low resolution and greater capture distance further restrict fine-grained feature extraction, contributing to misclassifications, as seen in GUET thermalface’s confusion matrices (
Figure 9). Additionally, CTIFERK requires controlled conditions, such as fixed camera positions and minimal occlusions, which are often infeasible in dynamic classrooms. Second, algorithmic challenges arise from the KAN architecture and MobileViT. While mathematically efficient, KAN’s reliance on B-spline computations is computationally intensive for high-dimensional inputs, potentially limiting scalability on low-power devices. MobileViT, despite its lightweight design, struggles with subtle expression variations in low-resolution thermal images, exacerbating GUET’s lower accuracy. Third, data-related issues compound these challenges. The GUET thermalface dataset’s category imbalances and sparse intervals, particularly for the “bored” class, lead to misclassifications due to overlapping head poses (e.g., “happy” vs. “focused” or “tired” vs. “distracted”). Manual annotation of 1852 images across six expression categories, cross-referenced with visible light images, required approximately 100 h of expert labeling, highlighting the resource-intensive nature of thermal image annotation. Finally, a potential confounding factor is elevated skin temperature due to fever, which may alter facial thermal patterns, mimicking emotions like “angry” or “surprised”. CTIFERK mitigates this through intensity normalization during preprocessing, but residual effects persist.
Future work will address these limitations to enhance CTIFERK’s scalability and robustness. Upgrading imaging hardware to support higher resolution will improve feature extraction and reduce misclassifications in dynamic settings. Noise-robust preprocessing and pose normalization techniques can mitigate head pose overlaps and environmental constraints, enabling deployment in uncontrolled classrooms. Incorporating multi-modal data, such as facial temperature, and physiological baselines, like body temperature measurements, will filter fever-related artifacts, ensuring accurate emotion mapping. To address annotation costs, semi-supervised or active learning could prioritize high-impact samples, potentially reducing labeling time by 30–50% while maintaining performance. Optimizing KAN’s computational efficiency and enhancing MobileViT’s handling of subtle expressions will further improve scalability on low-power devices, advancing CTIFERK’s applicability in educational analytics.
Despite these challenges, CTIFERK’s robust performance and real-time capabilities underscore its potential to transform smart classrooms by facilitating data-driven, personalized education. Continued advancements in hardware, algorithms, and data processing will unlock its full potential, contributing to the broader goal of enhancing educational outcomes through affective computing.
6. Conclusions
Aiming at the problem of thermal infrared facial expression recognition in classroom learning scenarios, we propose a thermal infrared facial expression recognition model based on MobileViT and KAN (CTIFERK). By integrating the Kolmogorov–Arnold Network (KAN) into the image classification network to process image features, the overall fitting capability of the model is enhanced, thereby further improving the model’s accuracy and outperforming existing thermal infrared facial expression recognition models. Experimental results demonstrate CTIFERK’s superior performance, achieving 81.82% accuracy on the Tufts Face Database, 82.19% on the IRIS Database, and 65.22% on GUET thermalface, outperforming baselines in smart classroom scenarios. Beyond its superior performance, CTIFERK has significant implications for smart education, enabling real-time emotion monitoring to support personalized learning and teacher interventions. Its robustness to lighting conditions broadens its applicability to diverse classroom settings, potentially transforming educational analytics and student engagement strategies.
For future research, we plan to enhance CTIFERK’s ability to handle high-dimensional datasets by integrating multi-modal data, such as combining thermal infrared images with physiological signals (e.g., heart rate or skin conductance) to capture richer emotional cues. Preliminary experiments will involve collecting synchronized thermal and physiological data from a small cohort of students in a controlled classroom setting to evaluate feature fusion techniques, such as attention-based multi-modal transformers. Additionally, we aim to employ data augmentation techniques, including generative adversarial networks (GANs), to increase the diversity of thermal infrared facial images, addressing the limitations of low-resolution and sparse datasets like GUET thermalface. Upgrading to high-resolution thermal imaging hardware (e.g., FLIR T-series with 1280 × 960 resolution) will also be explored to capture finer facial details, with initial tests planned on a subset of the GUET thermalface dataset to quantify improvements in feature extraction and recognition accuracy.


