Article

Reliability Design on the Output Shaft of Shearer Cutting Units Based on Correlated Failure Modes

1
School of Mechatronics Engineering, Shenyang Aerospace University, Shenyang 110136, China
2
Key Laboratory of Rapid Development & Manufacturing Technology for Aircraft, Shenyang Aerospace University, Ministry of Education, Shenyang 110136, China
3
College of Mechanical Engineering, Liaoning Technical University, Fuxin 123000, China
4
Liaoning Provincial Key Laboratory of Large-Scale Mining Equipment, Fuxin 123000, China
*
Author to whom correspondence should be addressed.
Symmetry 2025, 17(6), 858; https://doi.org/10.3390/sym17060858
Submission received: 30 March 2025 / Revised: 22 May 2025 / Accepted: 26 May 2025 / Published: 31 May 2025
(This article belongs to the Section Engineering and Materials)

Abstract

:
To improve the reliability of the shearer output shaft in coal seams with gangue, taking the MG400/951-WD shearer model as the research object, a test system for the physical and mechanical properties of coal seam samples containing gangue was established. Based on the coal breaking theory, the impact load of the spiral drum in a coal seam with gangue was simulated. Combined with rigid-flexible coupling virtual prototype technology, a rigid-flexible coupling virtual prototype model of a shearer with an output shaft as the modal neutral file was established. The output shaft is a typical symmetrical part, and it is of great significance to analyze it by using dynamic theory and mechanical reliability theory. The shearer system modal, the stress distribution of output shaft, and vibration characteristics were obtained by dynamic simulation. Based on resonance failure criterion and combined with a neural network, the output shaft stress reliability, vibration reliability, amplitude reliability, and reliability sensitivity were analyzed under relevant failure modes. The state function of the output shaft reliability optimization design was established, and the structural evolution algorithm obtained the optimal design variables. The results show that the maximum stress of the output shaft is reduced by 14.06%, the natural frequency of the output shaft is increased, the amplitude of the output shaft is reduced by 31.13%, and the reliability of the output shaft is improved. The combination of rigid-flexible coupling virtual prototype technology, reliability sensitivity design theory considering correlated failure modes, and structural evolution algorithm provides a more reliable analysis method for the reliability analysis and design of mechanical equipment transmission mechanisms, which can enhance the reliability of the shearer’s cutting unit and improve safety in fully mechanized coal mining faces. The proposed methodology demonstrates broad applicability in the reliability analysis of critical components for mining machinery, exhibiting universal adaptability across various operational scenarios.

1. Introduction

The working environment of the shearer is harsh and complex, and variable impact loads significantly affect the reliability of its key components, which is crucial for ensuring the safe operation of the fully mechanized mining face. The output shaft of the shearer’s cutting unit experiences substantial working loads. Due to the symmetry of the output shaft, it undergoes regular, symmetric, cyclic loading, which significantly impacts its reliability. Conducting reliability studies and optimization designs for the output shaft of the shearer’s cutting unit during the shearer’s design and development stage can enhance operational safety, shorten the design cycle, and reduce development costs.
In recent years, scholars at home and abroad have conducted systematic research on the reliability of core components of coal shearers, with significant findings summarized as follows.
Regarding the dynamic characteristics of transmission systems, Ma Lianwei established the first co-simulation platform for coal shearers in 2013, obtaining for the first time the minimum fatigue life of key components like planet carriers under full coal working conditions through stress-intensity analysis [1]. In 2015, Zhang Jinghui broke through traditional design concepts and established the first mathematical model of the walking wheel assembly system, optimizing component life using the PSO algorithm [2]. In 2024, Zhang Baofang systematically solved the fracture issue of the MG1000/2500-WD planetary carrier by constructing an electromechanical coupled dynamic model, substantially improving the dynamic response performance of two-stage planetary carriers [3].
Regarding reliability optimization in cutting systems, Mao Jun applied Workbench to visualize the stress fields of rocker arms and established a correlation model between fatigue life and reliability in 2015 [4]. Sun Feixiang used ANSYS/LS-DYNA (R14.5)to simulate the three-directional forces in pick-cutting processes, developing a stress-to-random-variable mapping relationship to analyze pick reliability [5]. In 2016, Lei Meirong built a failure mode database of cutting units via ANSYS (R14.5) finite element analysis, providing quantitative design guidance for key components [6]. In 2018, Lin Xiaoyan proposed a copula-based dynamic reliability decay model, performing the first coupled analysis of multiple failure modes for rocker arm gear systems [7]. In 2021, Yilmaz, Enver investigated longwall top coal mining shearer performance through discrete event simulation, including modeling of double-drum shearers, conveyors, stage loaders, and armored face conveyors (AFCs), to evaluate system performance considering daily production, thus identifying critical factors affecting coal production and developing a data-driven framework [8].
Qin DT broke through traditional modeling limitations in the dynamic reliability of traveling systems in 2018 by creating the first frame-transmission coupled dynamic hybrid model, reducing dynamic deformation by 17.5% and mesh misalignment by 12.3% [9]. Zhang Jinrui redesigned the shearer’s walking mechanism in 2019, conducting static analysis, dynamic analysis, dynamic gradient reliability analysis, and sensitivity analysis for critical components [10]. In 2020, Wan LR developed a gear-pin meshing contact force model, revealing for the first time the nonlinear influences of impact load amplitude and duration on walking wheel reliability [11]. In 2021, Bai Yangxi used the Lagrange method to establish a coal shearer dynamic model, systematically analyzing sliding shoe vibration characteristics and structural optimization criteria [12].
Mechanical reliability design methods provide new perspectives for coal shearer optimization design, with numerous scholars improving and applying mechanical reliability algorithms to shearer optimization. In system modeling innovations, Zhang Yimin introduced mechanical reliability design connotations and progressive reliability norms, standards, and outlines for mechanical product development in 2014 [13]. In 2017, Zhou Di developed dynamic reliability sensitivity analysis methods for complex transmission systems, enabling the quantitative evaluation of coupled multi-parameter influences [14]. In 2021, Gao HB constructed gear system dynamic equations using the harmonic balance method, achieving multi-objective optimization that reduced system size by 5.4% and significantly lowered failure rates [15]. In 2022, Zhu Lisha proposed the probabilistic perturbation fourth-order moment method, improving computational efficiency by 83% compared to traditional Monte Carlo methods [16].
In algorithm and simulation technology breakthroughs, Luo Weiting developed the intelligent extreme response–hierarchical PSO algorithm in 2019, significantly enhancing the reliability optimization efficiency for complex systems [17]. In 2023, Liu Xunan built a scraper drum–coal wall coupling model and employed the NSGA-II algorithm for the dual-objective optimization of coal loading efficiency and energy consumption [18]. In 2024, X.ZP innovatively proposed the CPSO-SVM reliability prediction method, achieving a verified prediction accuracy of 92.7% based on field data [19]. The working environment of the shearer’s cutting unit is highly complex, with multiple potential failure modes. Considering only single failure modes while neglecting failure correlations represents a theoretical deficiency in shearer design, leading to insufficient engineering support.
Previous research on shearer reliability typically considered single failure modes of critical components, ignoring the combined effects of related failure modes and thus inadequately representing reliability information. Conditions are exacerbated by coal–rock mixture loading scenarios. Developing a design method that considers related failure modes for output shafts is crucial for high-reliability drive components. Combining field sampling, instantaneous dynamic load simulation, and rigid-flexible coupling virtual prototype dynamics simulation provides foundational reliability data. Employing resonance failure criteria, a Copula function is introduced to establish output shaft failure mode correlations for analyzing design variables’ reliability and reliability sensitivity. Structural evolutionary algorithms are then used for reliability optimization, yielding high-reliability output shafts that meet design requirements.
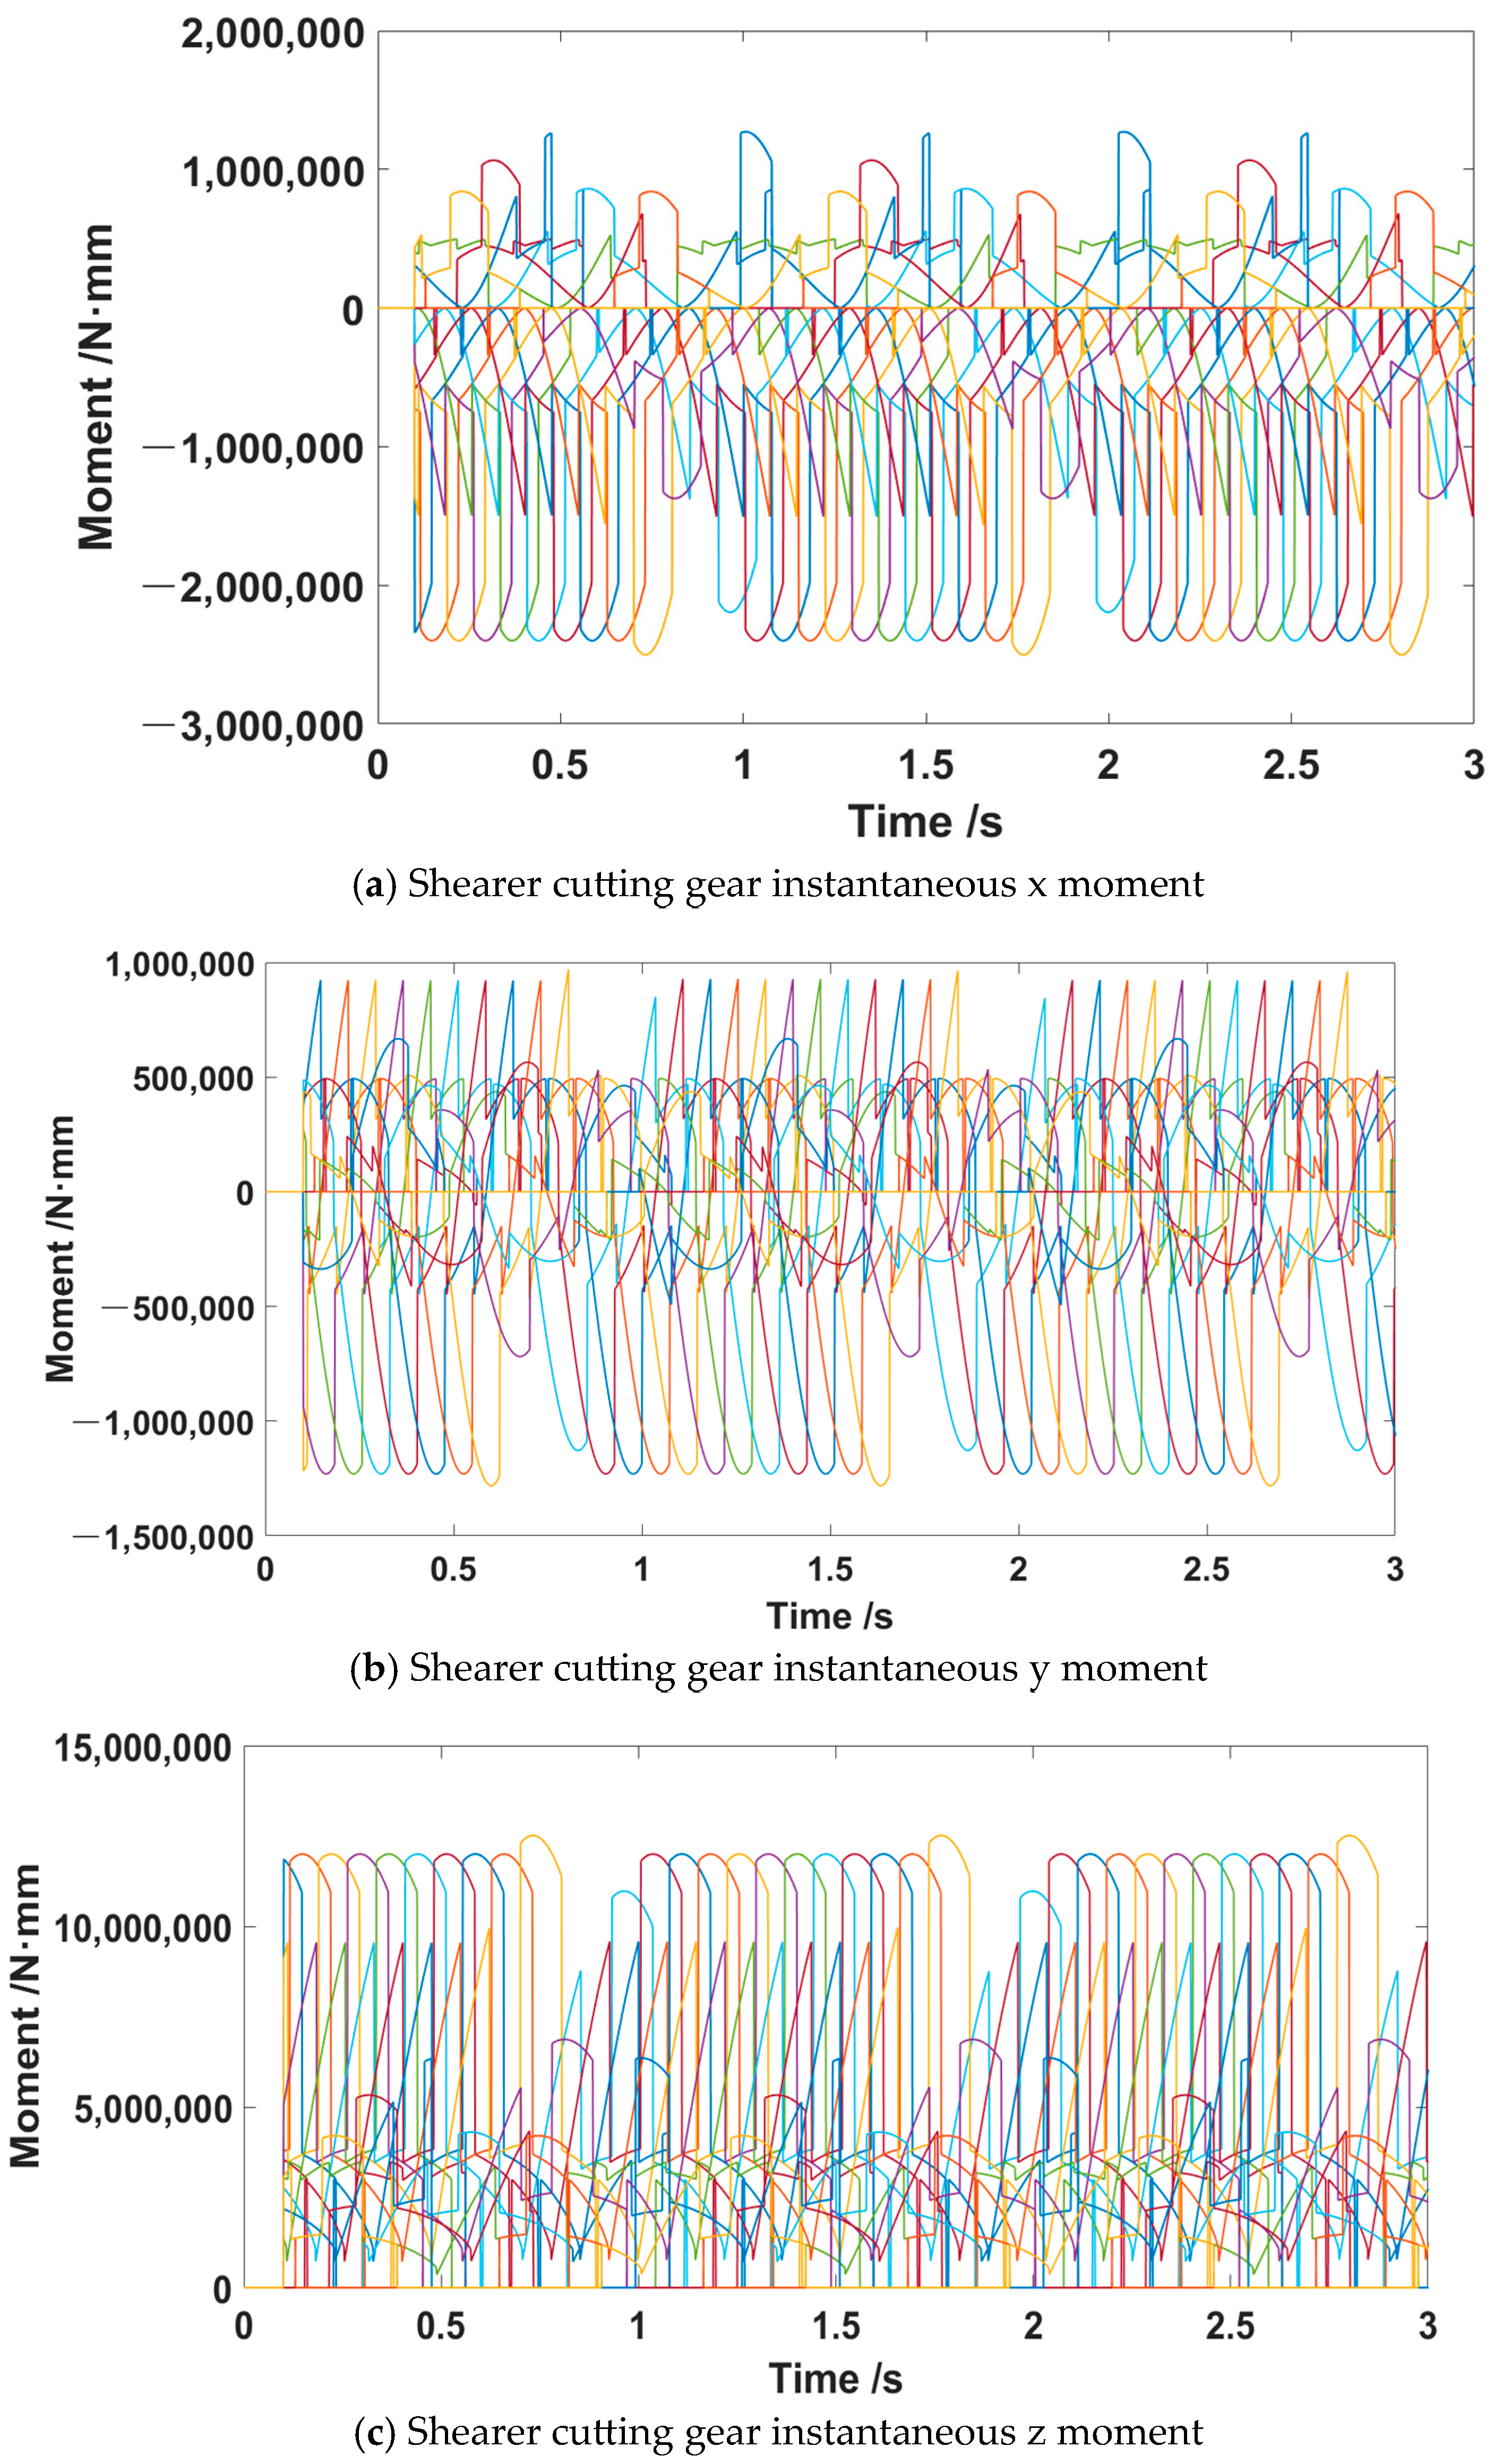
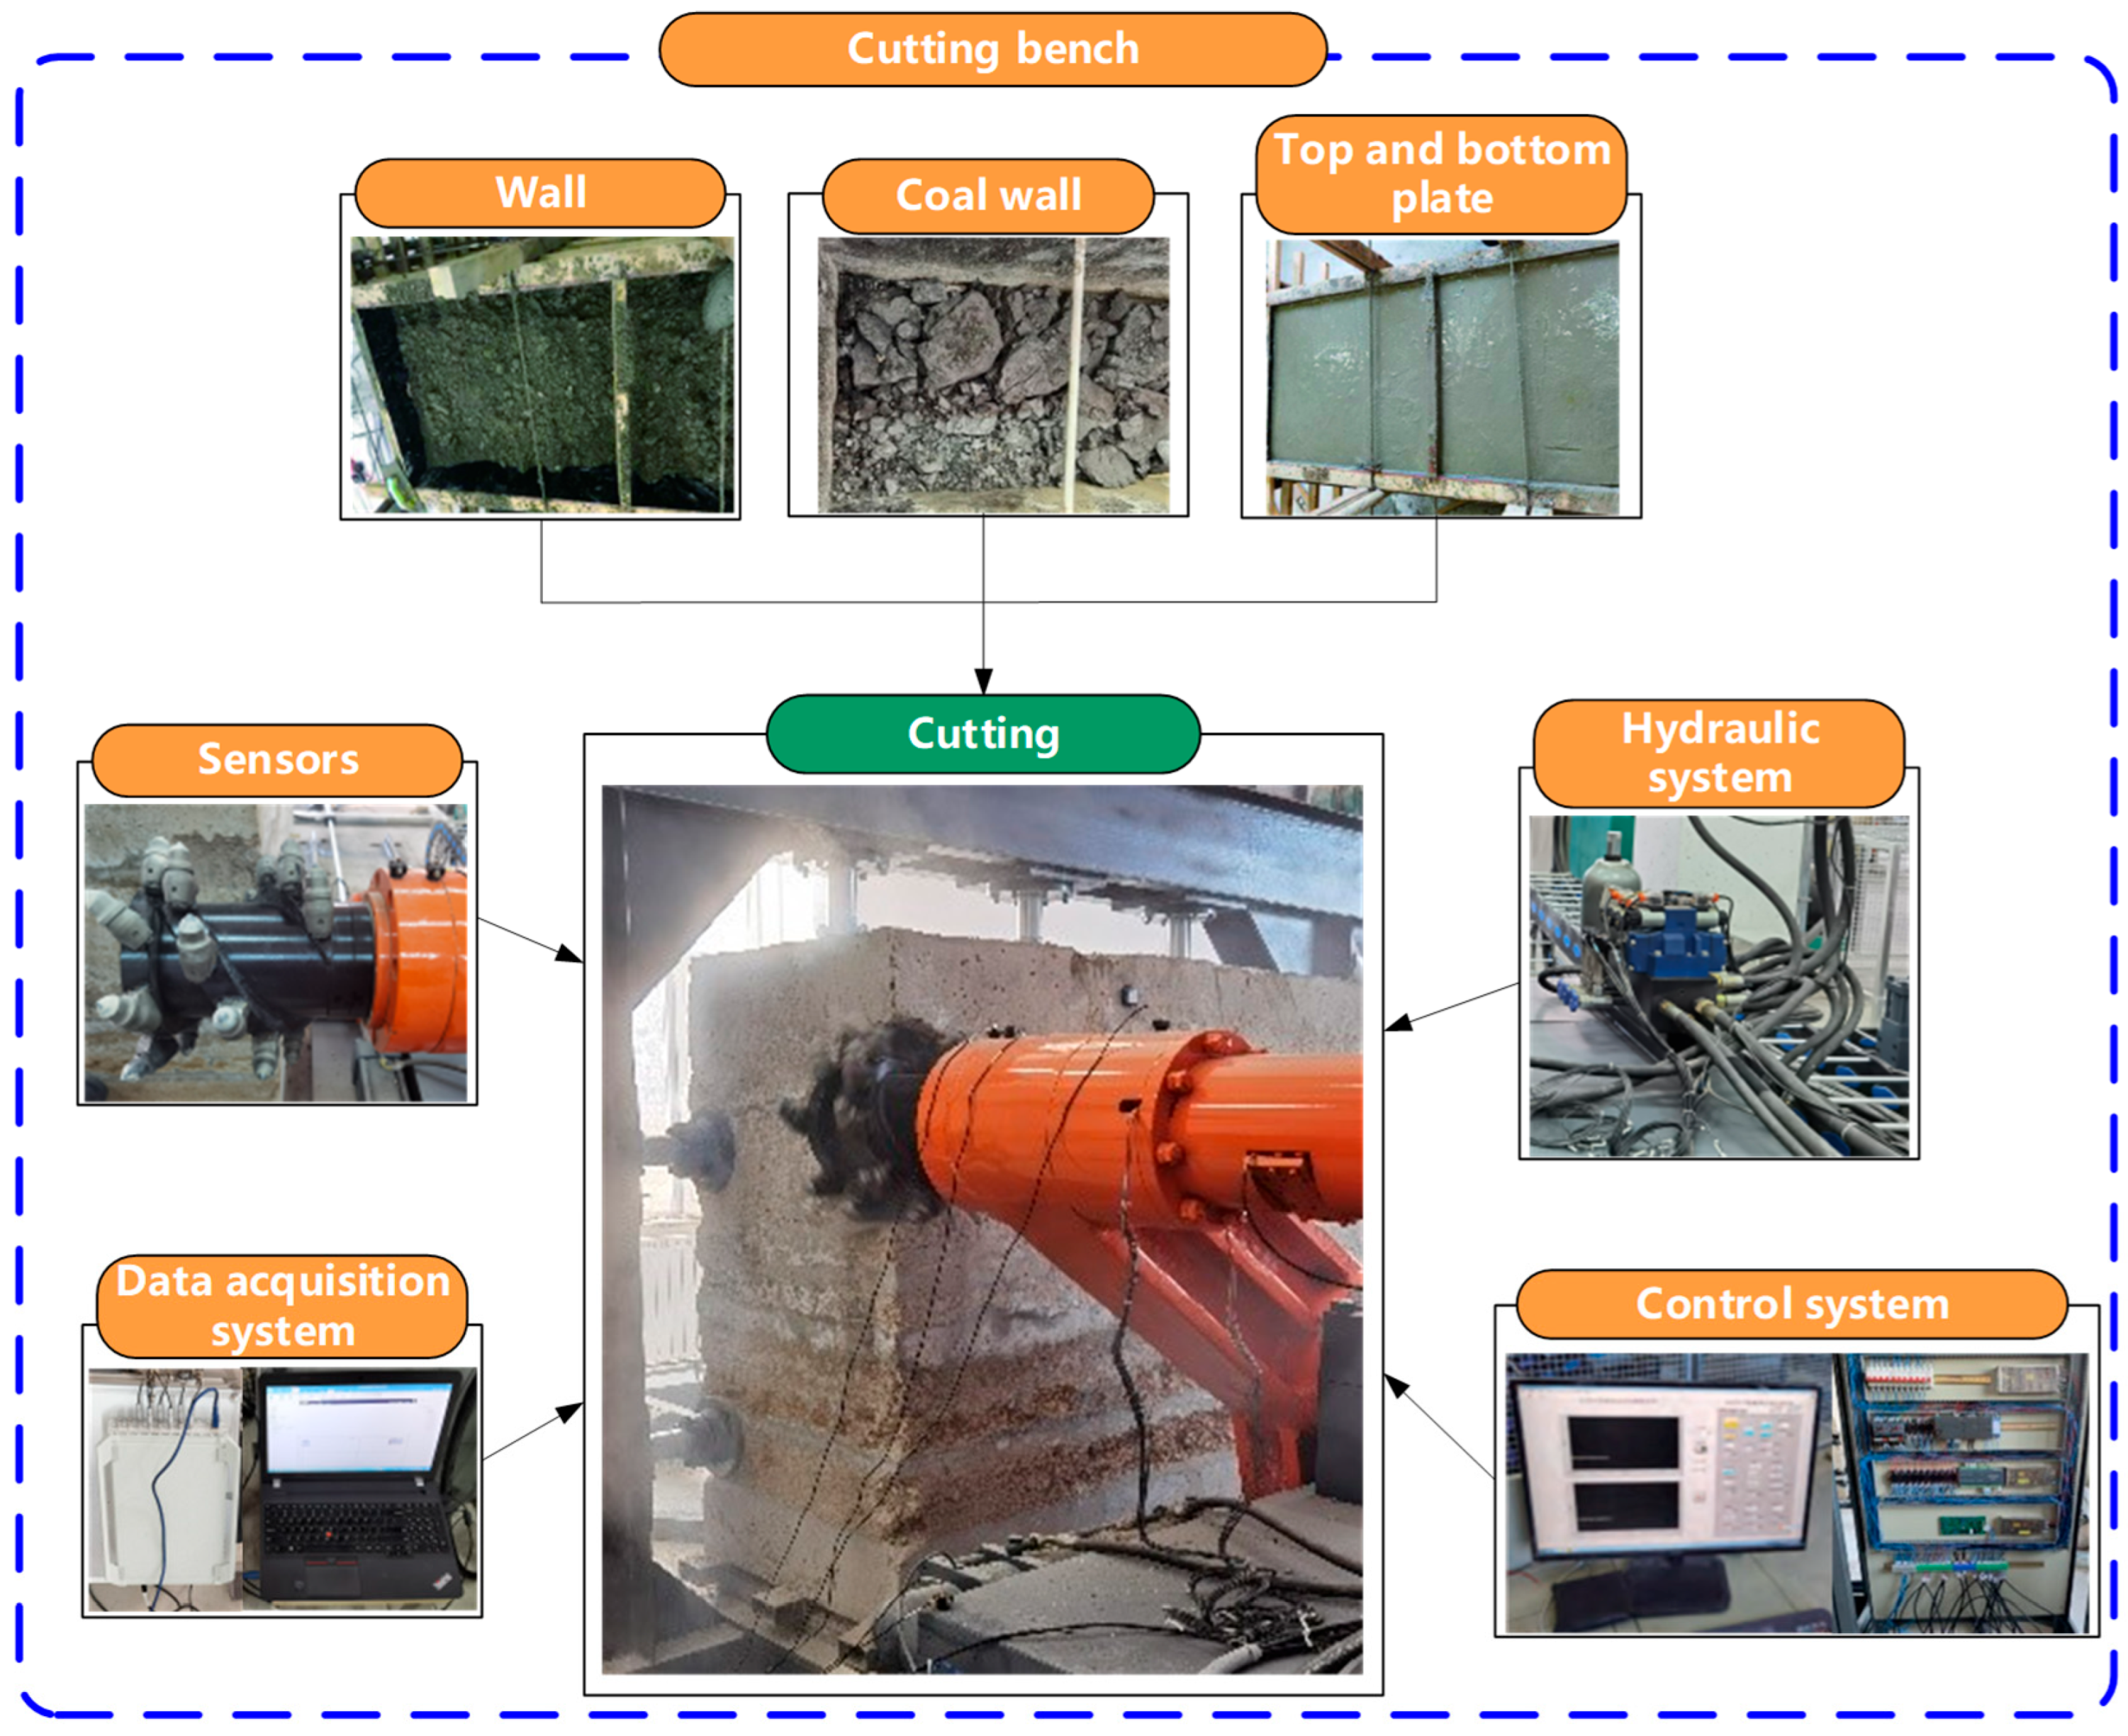
Using rigid-flexible coupling virtual prototyping, a three-dimensional shearer model was built using CREO. Numerical simulations of spiral drum pick loads were conducted with MATLAB(R2022a), and an experimental platform for physical load measurement of shearer picks was constructed, including complex coal seam cutting power systems and data acquisition systems. The data acquisition system gathers and analyzes mathematical models, extracting feature sets for accurate reliability evaluation and optimization. Virtual shearer prototypes were created in ADAMS, with modal neutral files for output shafts generated in ANSYS(2022 R1), facilitating multi-domain collaborative modeling. CREO-ADAMS-ANSYS(2022 R1) collaborative modeling ensures convenient data acquisition, high accuracy, and efficiency. Applying related failure mode reliability analysis to output shaft optimization reduces R&D costs and ensures high reliability for optimized designs.
Current research on shearer reliability predominantly focuses on single failure modes, neglecting the coupling effects of multiple failures. This study innovatively integrates Copula functions with multidisciplinary collaborative simulation (combining experimental testing and virtual prototyping) to establish a multi-failure correlated reliability model for output shafts. Through sensitivity analysis and evolutionary algorithms, we achieve a highly credible optimal design, filling the research gap in the synergistic analysis of multiple failure modes under complex loading conditions while providing a novel methodology for designing critical shearer components.

2. Reliability Analysis Theory of Output Shaft

2.1. Reliability and Reliability Sensitivity

The reliability index is defined as
β = μ g σ g = E g ( x ) Var g ( x )
where μ g is the state function’s first moment (mean) g ( X ) , and σ g is the second moment of the state function g ( X ) [20].
The design variables follow a normal distribution, and their reliability is given by
R = Φ ( β )
Based on the perturbation method and matrix differential theory, the mean sensitivity of reliability R to the design variables is calculated as
d R ( β ) d B ¯ T = d R ( β ) β β μ g μ g d B ¯ T
where
β μ g = 1 σ g
μ g d B ¯ T = [ g ¯ X 1 , g ¯ X 2 , g ¯ X 3 g ¯ X n ]
To standardize the units of design variables in reliability analysis, the dimensional normalization of the sensitivity of reliability to the design variables is performed as follows:
α wlg = d R d X i ¯ σ i * R *
where σ i * is the standard deviation of the design variables, and R * is the reliability.

2.2. Reliability Optimization Design

To reduce the impact of design variables on the reliability of the output shaft, a reliability optimization design is performed [21]; the reliability optimization design evaluation function is
min S ( X ) = w 1 S 1 ( X ) + w 2 S 2 ( X ) s . t R S R 0 X min X X max
where S ( X ) is the reliability optimization design evaluation function; S 1 ( X ) is the simulation result evaluation function; S 2 ( X ) is the sensitivity analysis evaluation function of the output shaft design variables; w 1 and w 2 are the weights; X is the system design variable; R 0 is the specified reliability; and X max and X min are the upper and lower bound intervals of the design variables, respectively.
The calculation methods for the weights w 1 and w 2 are as follows:
w 1 = S 2 ( X * 1 ) S 2 ( X * 2 ) [ S 1 ( X * 2 ) S 1 ( X * 1 ) ] + [ S 2 ( X * 1 ) S 2 ( X * 2 ) ]
w 2 = 1 w 1
S 2 ( X ) is established by the F-norm of the reliability sensitivity vector:
S 2 ( X ) = P X F = i = 1 k R X i 2
where P X is the first-order partial derivative vector of reliability concerning the design variables.

3. Simulation of Instantaneous Dynamic Loads on Shearer

The working conditions at coal mining faces are complicated and harsh, making it difficult and risky to measure drum loads directly at the mining face. This difficulty directly affects the accuracy of load data. Therefore, simulating instantaneous dynamic loads is crucial for the reliability analysis of critical shearer components under coal seams interbedded with gangue conditions. Establishing a physical–mechanical properties testing system and testing the characteristics of coal seams interbedded with gangue by national standards is a key step in simulating shearer drum loads and studying shearer reliability.

3.1. Force Analysis of Pick Cutter in Coal Seams Interbedded with Gangue

According to shearer coal-breaking theory, when cutting coal-rock materials, pick cutters experience traction resistance Y j , lateral force X j , and cutting resistance Z j . The formulas for calculating cutter forces differ when cutting coal versus rock. The thin-seam shearer studied here adopts a design with a front drum cutting the bottom coal and a rear drum cutting the top coal. Based on actual seam conditions, this study analyzes a scenario where the front drum cuts through two interbedded gangue layers. The forces acting on the pick cutters of the spiral drum-cutting coal seams interbedded with gangue are illustrated in Figure 1.
The cutting resistance encountered by the pick cutter while cutting coal is given by
Z j = Z 0 + 100 f σ y S d K t
Z 0 = 10 A p ¯ 0.35 b p + 0.3 ( b p + h c p tan φ ) K ψ h c p t c p K ε K y K ϕ K c K o t 1 cos β
where Z j is the blunt pick cutter’s cutting resistance, N; Z 0 is the sharp pick cutter’s cutting resistance, N; f is the cutting impedance coefficient; K δ is the volume coefficient of the stress state of the ore body; A p ¯ is the average cutting impedance value of the coal seam in the non-geostress affected zone, N/mm; b p is the calculated width of the pick cutter’s working part, cm; K ψ is the coal’s brittleness coefficient; h max is the maximum cutting thickness of the pick cutter, cm; θ is the angle of the pick cutter’s position, °; t c p is the cutting width of the pick cutter, cm; K z is the exposed free surface coefficient; K y is the cutting angle impact coefficient; K φ is the impact coefficient of the pick cutter’s front edge shape; Kc is the coefficient of the pick cutter arrangement pattern; K o t is the geostress effect coefficient on the coal wall; and β is the deflection angle between the pick cutter and the traction direction, ° [22].
The traction resistance of the pick cutter is given by
Y j = Y 0 + 100 σ y S d K t
The lateral force of the pick cutter is given by
X j = 0.2 Z j
The cutting resistance encountered by the pick cutter when cutting gangue is given by
Z j = P K [ k T k φ k φ k d k y ( 0.25 + 1.8 h max sin θ t c p ) + 0.1 S j ]
where P K is the rock contact strength, MPa; k T is the pick cutter type coefficient; k φ is the carbide head shape coefficient; k φ is the cutter head shape coefficient; k d is the carbide cutter head diameter coefficient; and k y is the cutting angle impact coefficient of the pick cutter.
The traction resistance of the pick cutter is given by
Y j = 2.5 Z j ( 0.15 + 0.00056 P K ) / ( 10 h c p sin θ ) 0.4  
The lateral force is related to the arrangement of the pick cutters, the geometric shape of the pick cutters, and the cutting kinematic parameters. The calculation formula is as follows:
X j = Z j ( C 1 C 2 + 10 h max sin θ + C 3 ) h max sin θ t c p
where C i is the coefficient of the influence of the pick cutter arrangement (i = 1, 2, 3). From Figure 1, the conditions for the pick cutter cutting through the entire coal are analyzed as follows:
R G 2 ( R G x g 1 ) 2 R G sin β R G 2 x g 2 2 R G 0 sin β R G 2 ( R G x g 3 ) 2 R G 0 β 180 °
R G is the radius of the spiral drum; θ  is the angle between the position of the pick cutter and the radial centerline of the spiral drum (°); xg1, xg2, xg3 are the thicknesses of the gangue layers; and θ  is the angle at which the pick cutter cuts through the entire coal. The forces on the pick cutter are calculated using Equations (11)–(14).
When the pick cutter is positioned at an angle to cut through the gangue, the forces on it are calculated using Equations (15)–(17).
0 sin β R G 2 ( R G x g 1 ) 2 R G R G 2 ( R G x g 2 ) 2 R G sin β 1 R G 2 ( R G x g 3 ) 2 R G sin β 1 0 β 180 °

3.2. Experimental Analysis of Physical and Mechanical Properties of Coal-Rock

According to the geological conditions of the V-1 working face at Wenyu Coal Mine in Inner Mongolia, physical and mechanical tests were conducted on coal samples containing gangue inclusions. The test system is illustrated in Figure 2.
Coal-rock samples were prepared. Coal blocks approximately 50 cm × 50 cm × 50 cm in size were obtained along the coal-rock bedding, as shown in Figure 3.
The compressive strength of the samples was determined using a DQ-1 cutting machine. The firmness coefficient was evaluated using the crushing method, and the density was measured using the pycnometer and drying method. A wire-wound strain gauge with a resistance of 120 Ω and a gauge length of 3 mm × 20 mm was selected, and the strength was measured using a WDW-100E microcomputer-controlled electronic universal testing machine. The physical and mechanical properties of the test systems constructed are shown in Figure 4 and Figure 5, and the obtained physical and mechanical parameters are presented in Table 1.

3.3. Simulation of Instantaneous Dynamic Loads Under Conditions of Coal Seams Interbedded with Gangue

Based on the geological conditions of the V-1 working face at Wenyu Coal Mine in Inner Mongolia and the force analysis of pick cutters for coal seams interbedded with gangue (as discussed earlier), the coal seam conditions depicted in Figure 1 were analyzed. The corresponding coal strength coefficient was 2.0, while the gangue strength coefficient was 4.1. The thicknesses of gangue layers were 42 mm and 127 mm, respectively, with a cutting depth of 800 mm. The drum rotation speed was 58 r/min, the mining height of the working face was 1500 mm, and the shearer traction speed was 4 m/min. Under these conditions, the three-directional force and moment load curves for the drum pick cutters are shown in Figure 6 and Figure 7.
Figure 6 shows the instantaneous forces in the X, Y, and Z directions acting on the drum teeth. Different-colored lines correspond to the forces exerted by 38 teeth on the spiral drum. The maximum instantaneous forces experienced by the drum pick in the X, Y, and Z directions are 2.3817 × 10⁴ N, 1.8831 × 10⁴ N, and 2.258 × 10³ N, respectively. Figure 7 shows the instantaneous torques in the X, Y, and Z directions acting on the drum teeth. Different-colored lines correspond to the torques exerted by 38 teeth on the spiral drum. The maximum instantaneous moments acting on the drum pick in the X, Y, and Z directions are 1.3137 × 10⁶ N·mm, 9.308 × 10⁵ N·mm, and 1.24733 × 10⁷ N·mm, respectively. These simulation results provide essential data support for the rigid-flexible coupled dynamic simulation of the shearer.
A Bluetooth wireless acceleration sensor was installed at the drum’s rear end to collect vibration signals from the helical drum. A computer was employed for posture configuration and acceleration calibration, ensuring more accurate measurement results. The collected acceleration data from the experiment were transmitted via a wireless network to a computer for display, storage, and analysis.
Based on the working conditions at the Yangcun coal mine of the Yankuang Group, the similarity criteria between the coal-rock and the helical drum were derived. According to similarity theory, the basic parameters of the coal wall used in the experiments were calculated. Sand, cement, gypsum, and water were mixed in varying proportions to produce different coal walls containing gangue inclusions, ensuring their mechanical properties closely matched those of coal-rock with gangue inclusions.
The vibration data of the shearer’s helical drum cutting through coal-rock containing gangue were obtained using an established coal-rock cutting comprehensive experimental platform. These data were then used to train and test the network model, verifying the superiority of the constructed DCGAN-RFCNN network model in recognizing coal-rock cutting states.
Following similarity theory, a comprehensive coal-rock cutting experimental platform was established, as illustrated in Figure 8. This test bench comprises the artificial coal wall, shearer, power system, and data acquisition system.

4. Reliability Analysis of the Cutting Unit Output Shaft Based on Relevant Failure Modes

4.1. Dynamic Simulation Analysis of the Shearer

A complete model of the shearer was created using Pro/Engineer and imported into ADAMS. Finite element analysis software ANSYS (2022 R1)was employed to mesh the helical drum and output shaft, generating modal neutral files to replace the corresponding rigid components. Constraints, contacts, and driving forces were applied to the virtual prototype to establish the rigid-flexible coupling model of the shearer, as illustrated in Figure 9.
The obtained cutting pick load data was imported into ADAMS. Three-directional forces and three-directional torques were applied to each pick on the drum. The simulation time was set to 3 s, with a simulation step size of 0.001 s, and the Wstiff integrator was used to conduct the rigid-flexible coupled virtual prototype simulation of the shearer. The ADAMS post-processing module shows that the front-cutting unit experiences more severe loading conditions than the rear-cutting unit during operation in coal seams containing gangue; therefore, the front-cutting unit was selected as the primary object of study. The simulation results, including the stress contour of the output shaft and the curve of maximum stress points obtained through the ADAMS post-processing module, are illustrated in Figure 10 and Figure 11.
Figure 10 and Figure 11 show that the maximum load on the output shaft occurs at 0.1087 s, with significant fluctuations observed in the stress values. The maximum stress reaches 548.4057 MPa, resulting in a safety factor of 1.736 calculated from the yield strength of the shaft material. The point of maximum stress is located at the spline undercut groove connecting the output shaft to the low-speed, heavy-duty gear at the output end.
Natural modal frequency analysis of the output shaft was performed using ANSYS(2022 R1). The analysis indicates that the first six natural frequencies of the component in the free state are either zero or near zero, classified as rigid modes. Therefore, these modes have negligible influence on the component’s vibration characteristics and are not considered further. The summarized natural frequency analysis results for the component are listed in Table 2.
Forced vibration characteristics of the shearer’s rigid-flexible coupled model were analyzed through ADAMS/Vibration. ADAMS’s load curves imported from the dynamic simulation were subjected to Fourier transformation, obtaining frequency–domain curves for vibration analysis. These frequency–domain curves, representing the load on the cutting picks, were added as external excitations in the Input Channel, with PSD selected as the excitation parameter, and applied at the tip of the cutting picks. According to the shearer’s rigid-flexible coupled dynamics simulation results, an output channel was established, and the note point at the maximum stress position on the output shaft was selected as the test point for displacement response vibration analysis. The simulation frequency was 0.001–50 Hz, with 2500 steps. The system modes obtained from the forced vibration simulation are shown in Figure 12, and the first 30 natural frequencies extracted from the system are listed in Table 3.
The real parts of the system modes shown in Figure 12 are all negative, indicating that the established rigid-flexible coupled model of the shearer has high stability. A comparison between the system modal in Table 3 and the output shaft modal frequencies in Table 2 provides a basis for vibration reliability research. The modal shape contours of the output shaft reveal that the modal shapes from the first to sixth orders are relatively stable. The modal shapes from the seventh to twelfth orders exhibit comparatively lower frequencies than other orders, and these low-frequency vibrations commonly result in failures during shearer operation. To illustrate the characteristics and patterns of the modal shapes, the modal shape contours of orders 7–12 are presented as examples in Figure 13.
As shown in Figure 13, the most severe vibration of the output shaft occurs at the meshing region with the low-speed, heavy-duty gear at the output end of the cutting unit. The second most severe vibration area is at the connection end between the output shaft and the square head. This is because the output shaft, serving as the primary power transmission mechanism during the cutting process of the helical drum, experiences substantial torques at both connection points, leading to intense vibrations. The displacement frequency response of the test point on the output shaft is presented in Figure 14.
As shown in Figure 14, the displacement response curves of the test point on the output shaft display relatively high values within the low-frequency range of 0.001–0.1 Hz. The vibration of the critical component test point is the most severe in the X-direction, followed by the Y-direction, with the smallest amplitude observed in the Z-direction. The maximum displacement response value at the output shaft test point is 1.7515 mm. The dynamic simulation results from the rigid-flexible coupled virtual prototype align closely with the actual operating conditions of the shearer, providing essential data support for the reliability analysis of the output shaft.

4.2. Reliability and Reliability Sensitivity Analysis of the Output Shaft

The output shaft, as the primary power transmission component of the shearer, may experience failure under alternating torque and impact loads, influencing the equipment’s overall operational performance. Based on simulation results, the shearer’s cutting unit output shaft’s stress, frequency, and amplitude reliability are analyzed.

4.2.1. Selection of Design Variables

The rigid-flexible coupled simulation results for the output shaft indicate three regions of stress concentration, located, respectively, at the spline undercut groove where the output shaft meshes with the low-speed heavy-duty gear at the cutting unit output end; the shaft’s largest radial position; and the spline undercut groove at the connection between the output shaft and the square head of the cutting unit, as illustrated in Figure 15.
The design variables for Region 1 are the spline undercut radius Rza, radial diameter Dza, and axial length Lza of the output shaft and the cutting unit gear meshing. The design variables for Region 2 are the maximum radial diameter Dzb and axial length Lzb of the output shaft. The design variables for Region 3 are the spline undercut radius Rzc of the output shaft meshing with the square head and the axial length Lzc of the spline meshing with the square head, as shown in Figure 16. The initial values of the design variables for the three regions are Xza = [35, 240, 49]T, Xzb = [273, 113]T, and Xzc = [35, 96]T. The probabilistic statistical characteristics of the design variables are shown in Table 4. The meaning of subscripts in the following text corresponds to the definitions in Table 5.

4.2.2. Stress Reliability and Reliability Sensitivity Analysis of the Output Shaft

Neutral files for the output shaft modal with different design variables are established, and dynamic simulations of the rigid-flexible coupling virtual prototype are performed. The simulation results establish a functional relationship between the output shaft design variables and the maximum stress. Combining the mechanical properties of the output shaft material, the limit state functions for the stress of the three focus areas of the cutting unit output shaft are established:
G z a yl ( R z a , D z a , L z a ) = σ z y l g z a y l ( R z a , D z a , L z a ) = 0.1730 R z a 3   17.4776 R z a 2 + 593.2843 R z a + 3.4234 × 10 4 D z a 3 0.3174 D z a 2 + 95.6904 D z a 2.7834 × 10 4 L z a 3 + 0.0240 L z a 2 1.6385 L z a 1.6086 × 10 4
G z b yl ( D z b , L z b ) = σ z y l g z b y l ( D z b , L z b ) = 1.3018 × 10 4 D z b 3   0.1206 D z b 2 + 37.8195 D z b + 1.0017 × 10 4 L z b 3 + 0.0278 L z b 2 3.2206 L z b 3.8101 × 10 3
G z c yl ( R z c , L z c ) = σ z y l g z c y l ( R z c , L z c ) = 0.3675 R z c 3 36.7175 R z c 2 + 1.2321 × 10 3 R z c + 0.0130 L z c 3 4.1421 L z c 2 + 443.6184 L z c 2.9732 × 10 4
where σ z y l is the yield strength of the output shaft; and g z a y l ( R z a , D z a , L z a ) , g z b y l ( D z b , L z b ) , g z c y l ( R z c , L z c ) is the multi-objective optimization design evaluation function for the stress of the three focus areas, obtained using the ideal point and linear weighting method. Based on the reliability and reliability sensitivity theory in Equations (1)–(6), the reliability of the three focus areas is calculated as follows: R z a z y l = 0.9068 , R z b z y l = 0.9679 , and R z c y l = 0.9301 . The dimensional normalized sensitivity values for the mean stress reliability of the design variable [ R z a , D z a , L z a ] 3 × 1 T are [118.4899, 52.9558, −27.696]; the dimensional normalized sensitivity values for the mean stress reliability of design variable [ D z b , L z b ] 2 × 1 T are [11.7199, −8.5631]; and the dimensional normalized sensitivity values for the mean stress reliability of design variable [ R z c , L z c ] 2 × 1 T are [159.3910, 99.4217].

4.2.3. Frequency Reliability and Reliability Sensitivity Analysis of the Output Shaft

Based on the interference theory of reliability analysis, the state function for the resonance failure of the shearer cutting unit output shaft is
G z p l i j ( p z p l j , ω z p l i ) = p z p l t j ω z p l t i ( i = 1 , 2 , n , j = 1 , 2 , m )
where p z p l j is the j-th order excitation frequency of the entire shearer system, and ω z p l i is the i-th order natural frequency of the output shaft. Based on the relationship between p z p l j and ω z p l i , the resonance failure state of the output shaft is obtained as
G z p l i j ( p z j , ω z p l i ) = p z p l j ω z p l i γ
where γ is a specific interval. According to experience, the specific interval γ is taken as 10% to 15% of the corresponding frequency mean for reliability analysis standards [23]. Let g z p l i j = p z p l j ω z p l i , then the method for calculating the mean of the output shaft operational failure state function is
μ g g t p l i j = E ( g g t p l i j ) = E ( p g t p l i j ) - E ( ω g t p l i j )
The probability of resonance failure of the output shaft is
P z p l i j = P g t p l i j ( γ g z p l i j γ )
When both the excitation frequency of the entire system and the natural frequency of the output shaft follow a normal distribution, the failure probability of the output shaft is
P z p l i j = Φ ( γ μ g z p l i j σ g z p l i j ) Φ ( γ μ g z p l i j σ g z p l i j )
where Φ ( ) is the standard normal distribution function.
When the system excitation and natural frequencies are close, resonance may occur. The failure probability of the output shaft based on the resonance failure criterion for reliability analysis is
P z p l = 1 i = 1 n j = 1 m ( 1 P z p l i j )
The frequency reliability of the output shaft is
R z p l = 1 P z p l = i = 1 n j = 1 m R z p l i j = i = 1 n j = 1 m ( 1 P z p l i j )
The frequency reliability of the output shaft can be determined by combining the results from dynamic simulation, its natural frequency, and the excitation frequency of the shearer system R z p l = 0.9953 .
The mean reliability sensitivity of the output shaft frequency reliability R z p l to the design variables is
d R d x ¯ = u = 1 n v = 1 m i = 1 n j = 1 m R i j R u v × R u v β u v 1 β u v 1 μ g u v μ g u v ω ¯ u ω ¯ u d x ¯ + β u v 1 γ u γ u ω ¯ u ω ¯ u d x ¯ + R u v β u v 2 β u v 2 μ g u v μ g u v ω ¯ u ω ¯ u d x ¯ + β u v 2 γ u γ u ω ¯ u ω ¯ u d x ¯
Based on the probabilistic statistical characteristics of the output shaft design variables (Table 4), 64 samples of the design variables were drawn using the Latin hypercube sampling method. The experimental data were used as training samples for the neural network, and the sample data are shown in Table 6.
A BP neural network model is established using MATLAB (R2022a), with the output shaft design variables as the input to the neural network and the natural frequency as the output parameter. The network architecture consists of two hidden layers [24]: the first hidden layer comprises 11 neurons, while the second has a single neuron. The hyperbolic tangent sigmoid (tansig) function is adopted as the activation function for the hidden layers, whereas a linear transfer function (purelin) is applied to the output layer. The model is trained using the Levenberg–Marquardt algorithm (trainlm), with mean squared error (MSE) serving as the performance metric, and the standard regression validation parameter is 1e-6. To mitigate overfitting, L2 regularization (with a coefficient of 0.01) combined with Dropout (rate = 0.5) was implemented in the BP neural network architecture.
The functional relationship between the output shaft natural frequency yz and the design variables [Rza, Dza, Lza, Dzb, Lzb, Rzc, Lzc]T7×1 can be expressed as
y z = θ K + j = 1 m w k j δ θ j + i = 1 n w j i x i
where θ K is the threshold from the hidden layer to the output layer; w k j is the weight from the hidden layer to the output layer; θ j is the threshold from the input layer to the hidden layer; and w j i is the weight from the input layer to the hidden layer.
After 184 training iterations, the training samples’ approximation error reached the target error of l × 10−6. The training error is shown in Figure 17.
By combining the nonlinear function of the natural frequency yz obtained from the neural network training with Equation (30), the mean sensitivity numerical results for the design variables [Rza, Dza, Lza, Dzb, Lzb, Rzc, Lzc]T7×1 are obtained as [−0.0011, 9.7565 × 10⁻⁴, −2.7200 × 10⁻⁴, 0.0015, 0.0026, 0.0012, 0.0013], indicating the extent of the impact of the design variables on the output shaft frequency reliability.

4.2.4. Output Shaft Amplitude Reliability and Reliability Sensitivity Analysis

Based on the vibration simulation results of the shearer rigid-flexible coupling model, which includes different output shaft design variables, a relationship between the design variables and the output shaft amplitude is established. The amplitude limit state functions for the first, second, and third focus areas of the output shaft are established:
G z a z f ( R z a , D z a , L z a ) = σ z z f g z a z f ( R z a , D z a , L z a ) = 5.5523 × 10 4 R z a 3 + 0.0530 R z a 2 1.6720 R z a + 4.6377 × 10 6 D z a 3 0.0038 D z a 2 + 1.0088 D z a   4.9783 × 10 6 L z a 3 + 6.0027 × 10 4 L z a 2 0.0292 L z a 71.9998
G z b z f ( D z b , L z b ) = σ z z f g z b z f ( D z b , L z b ) = 1.7900 × 10 6 D z b 3 0.0015 D z b 2 + 0.4309 D z b + 1.3501 × 10 7 L z b 3 + 2.7528 × 10 5 L z b 2 0.0032 L z b 40.7181
G z c z f ( R z c , L z c ) = σ z z f g z c z f ( R z c , L z c ) = 2.5861 × 10 4 R z c 3 + 0.0229 R z c 2 0.6528 R z c + 6.6849 × 10 5 L z c 3 +   0.0212 L z c 2 2.2371 L z c + 84.8948
where σ z z f is the output shaft’s maximum amplitude; and gzazf(Rza, Dza, Lza), gzbzf(Dzb, Lzb), gzczf(Rzc, Lzc) are the multi-objective optimization design evaluation functions for the amplitudes of the output shaft’s first, second, and third focus areas.
The reliability and sensitivity of the output shaft amplitude are analyzed using reliability theory. The amplitude reliability for the three focus areas of the output shaft is obtained as R z a z f = 0.9501 , R z b z f = 0.9253 , and R z c z f = 0.8767 . The dimensional normalized sensitivity values for the mean amplitude reliability of the design variable are [−0.0036, 0.0161, −0.0115]; the dimensional normalized sensitivity values for the mean of design variable [ D z b , L z b ] 2 × 1 T are [0.0050, −0.0043]; and the dimensional normalized sensitivity values for the mean of design variable are [−4.9531 × 10⁻⁴, −0.0125].

4.3. Output Shaft Reliability and Reliability Sensitivity Analysis Based on Correlated Failure Modes

During the output shaft’s operation, stress, resonance, and amplitude failures occur due to severe loading and intense vibrations. These failure modes are correlated [25], so the combined effects of the correlated failure modes on the output shaft’s reliability and the reliability sensitivity of the design variables must be considered.
In the reliability analysis of mechanical component failures, Copula functions effectively characterize dependence structures among failure modes. The fundamental concept of Copula functions lies in transforming marginal variables into uniformly distributed variables, thereby eliminating the need to examine numerous diverse marginal distributions. This approach simplifies the problem by defining dependence structures through a joint distribution over uniform margins. Copulas thus provide an efficient framework for modeling and quantifying dependencies among components. The Gumbel Copula exhibits upper-tail dependence, making it suitable for common-cause failures induced by extreme events. The Clayton Copula emphasizes lower-tail dependence, which is appropriate for modeling progressive failure correlations such as fatigue and wear. The Frank Copula demonstrates symmetric dependence without tail dependence, rendering it applicable for analyzing mid-range correlations influenced by multiple uniform factors. Through comparative analysis, the Gumbel Copula was selected to establish the dependent failure reliability model for output shafts.
The failure modes of the three focus areas of the output shaft are in a series relationship, with the maximum stress reliability as R z y l = R z a y l × R z b y l × R z c y l and the amplitude reliability as R z z f = R z a z f × R z b z f × R z c z f .
When considering the three failure modes—stress failure, resonance failure, and amplitude failure—the failure probability of the output shaft based on the bivariate Gumbel Copula function is obtained as
P z = P z y l + P z p l + P z z f C P z y l , P z p l C P z y l , P z z f C P z p l , P z z f + C P z y l , P z p l , P z z f
where P z is the output shaft failure probability; P zyl is the output shaft stress failure probability; P zpl is the output shaft resonance failure probability; P zzf is the output shaft amplitude failure probability; and C P i , P j is the correlation coefficient between failure mode i and failure mode j expressed as
C P i , P j = exp ln P i 1 θ i j + ln P j 1 θ i j θ i j
where θ i j is the bivariate Gumbel Copula function coefficient.
C P zyl , P zpl , P zzf = C C P zyl , P zpl , P zzf
The output shaft reliability, considering the correlated failure modes, is calculated as R z = 1 P z = 0.6047 . Based on the theory of random variable correlation in probability theory and considering the correlation between the three failure modes of stress failure, resonance failure, and amplitude failure, the mean reliability sensitivity of the output shaft failure probability with respect to the design variables is
P z X ¯ z T = P z y l X ¯ z T + P z p l X ¯ z T + P z z f X ¯ z T C P z y l , P z p l X ¯ z T C P z y l , P z z f X ¯ z T C P z z f , P z p l X ¯ z T + C P z y l , P z p l , P z z f X ¯ z T
Equation (38) takes the mean reliability sensitivity of the output shaft design variables’ stress failure probability as an example:
P zyl X ¯ z T = P zyl β zyl β zyl μ G zyl μ G zyl X ¯ z T
In the equation, the partial derivative of the output shaft stress failure probability with respect to the reliability index is
P zyl β zyl = φ β zyl
In Equation (38), the mean reliability sensitivity of the output shaft stress failure probability and resonance failure probability correlation coefficient with respect to the design variables is
C P zyl , P zpl X ¯ z T = C P zyl , P zpl P zyl P zyl X ¯ z T + C P zyl , P zpl P zpl P zpl X ¯ z T
Based on the probabilistic statistical information of the design variables, the dimensional normalized sensitivity of the output shaft design variables under the correlated failure modes of stress failure, resonance failure, and amplitude failure is analyzed. The results are shown in Figure 18.
As shown in Figure 18, the dimensional normalized mean sensitivity numerical results for the design variables [Rza, Dza, Lza, Dzb, Lzb, Rzc, Lzc]T7×1 are [1.3395 × 10⁸, 5.0558 × 10⁹, −4.8939 × 10⁹, 1.5315 × 10⁸, 1.2226 × 10⁸, 2.1416 × 10⁸, 2.1294 × 10⁹]. The normalized sensitivity values reflect the relative influence of design parameters on system reliability. A positive value indicates that reliability improves as the parameter increases, while a negative value suggests the opposite. Larger absolute values correspond to more significant impacts. The mean increases in the undercut groove radius Rza, diameter Dza, diameter Dzb, length Lzb, undercut groove radius Rzc, and spline length Rzc lead to a more reliable output shaft, while the increase in the mean of length Lza reduces the output shaft’s reliability. Among the design variables, the diameter Dza has the largest impact on the reliability of the output shaft’s correlated failure modes, while the length Lzb has the smallest impact. These analysis results provide the basis for the optimization design of the output shaft.

5. Reliability Optimization Design of Output Shaft Based on Structural Evolution

The goal of reliability optimization design is to improve the reliability of the output shaft under relevant failure modes while simultaneously reducing the influence of design variables on reliability. Integrating the reliability analysis results with the structural evolution algorithm, a reliability-based optimization design is performed on the output shaft to identify optimal design variables.
Based on the Rastringin function, a hybrid strategy combining Boltzmann selection, elitist strategy, and steady-state strategy is chosen. Single-point crossover is employed for the crossover operation, and basic-bit mutation is selected as the mutation method within the structural evolution algorithm to solve the optimization problem [26]. The procedural flowchart of the structural evolution algorithm is shown in Figure 19.
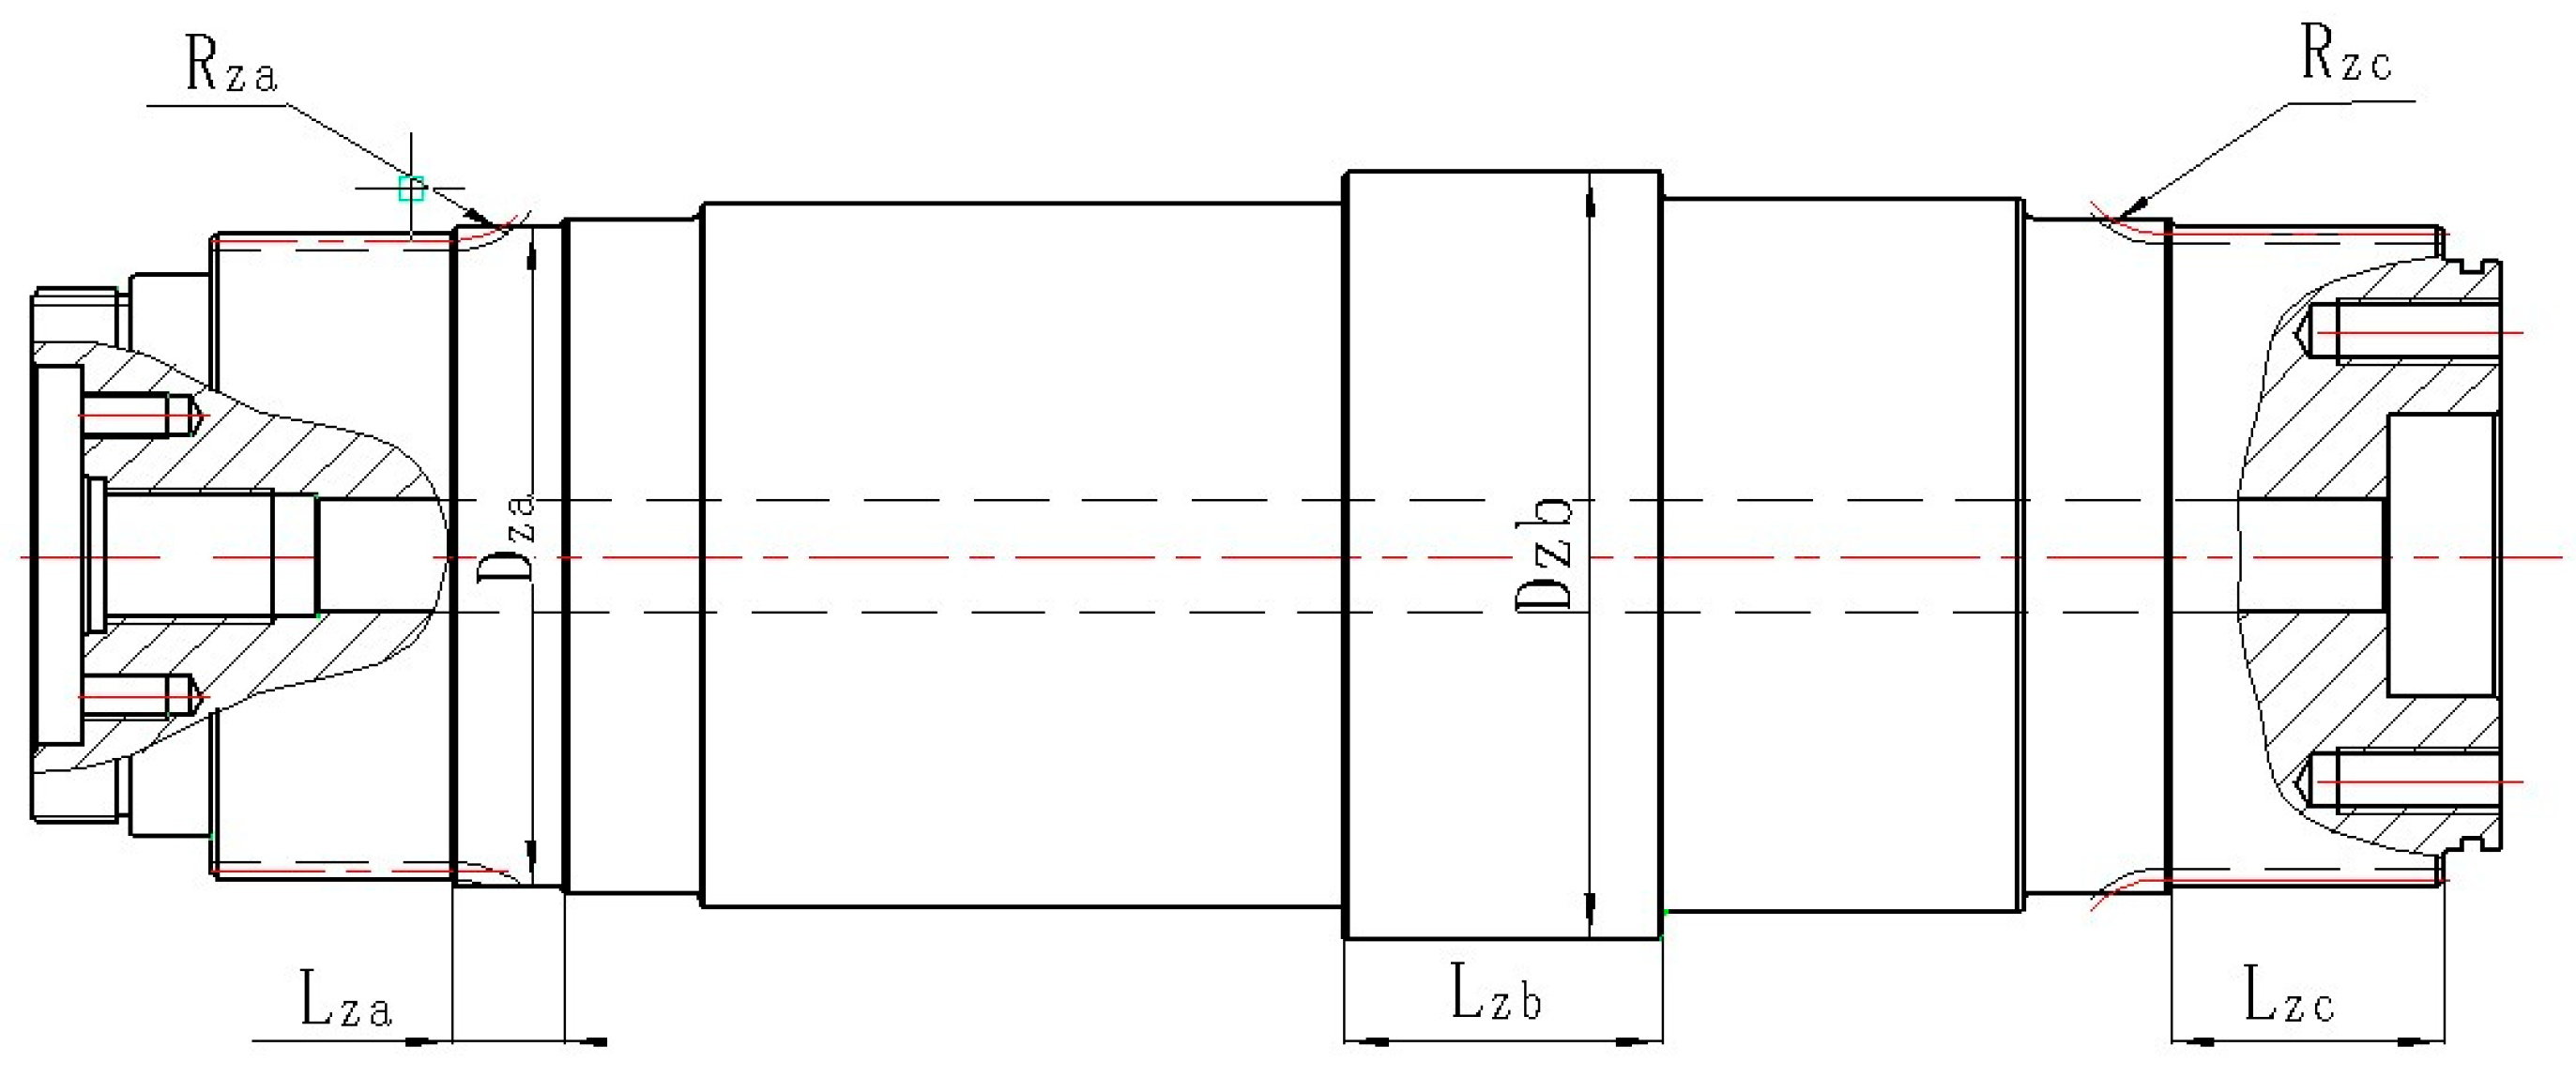
The design variables for the reliability optimization design of the output shaft are
X = R z a , D z a , L z a , D z b , L z b , R z c , L z c
See Equation (7); the state function for the reliability optimization design of the output shaft is
G z R z a , D z a , L z a , D z b , L z b , R z c , L z c = ω 1 G z y l R z a , D z a , L z a , D z b , L z b , R z c , L z c + ω 2 G z p l R z a , D z a , L z a , D z b , L z b , R z c , L z c + ω 3 G z z f R z a , D z a , L z a , D z b , L z b , R z c , L z c
According to the requirements of reliability optimization design, the reliability sensitivity function is introduced, and the overall function for the robust reliability optimization design of the output shaft is constructed as
min G z _ y h = G z R z a , D z a , L z a , D z b , L z b , R z c , L z c + w e i = 1 7 R X i 2
Based on the assembly relationship between the output shaft and the shearer, the constraint conditions for the design variables are obtained as
30 R z a 37.5 ;   235 < D z a < 260 ;   30 L z a 60 ;   254 D z b 310 ; 32 L z b < 122 ;   30 R z c 37.5 ;   96 L z c 117
The population size was set to 100, and an initial population was established. The maximum number of evolutions was set to 500, with the stopping iteration number also set to 500. The deviation for the fitness function value was defined as 1 × 10⁻⁶. The structural evolution algorithm was applied within the constraints to optimize the output shaft’s overall robust reliability optimization design function established by Equation (44). Upon completion of population evolution and algorithm termination, the optimal individual predicted by the algorithm (i.e., optimal design variables) was obtained, as listed in Table 7.
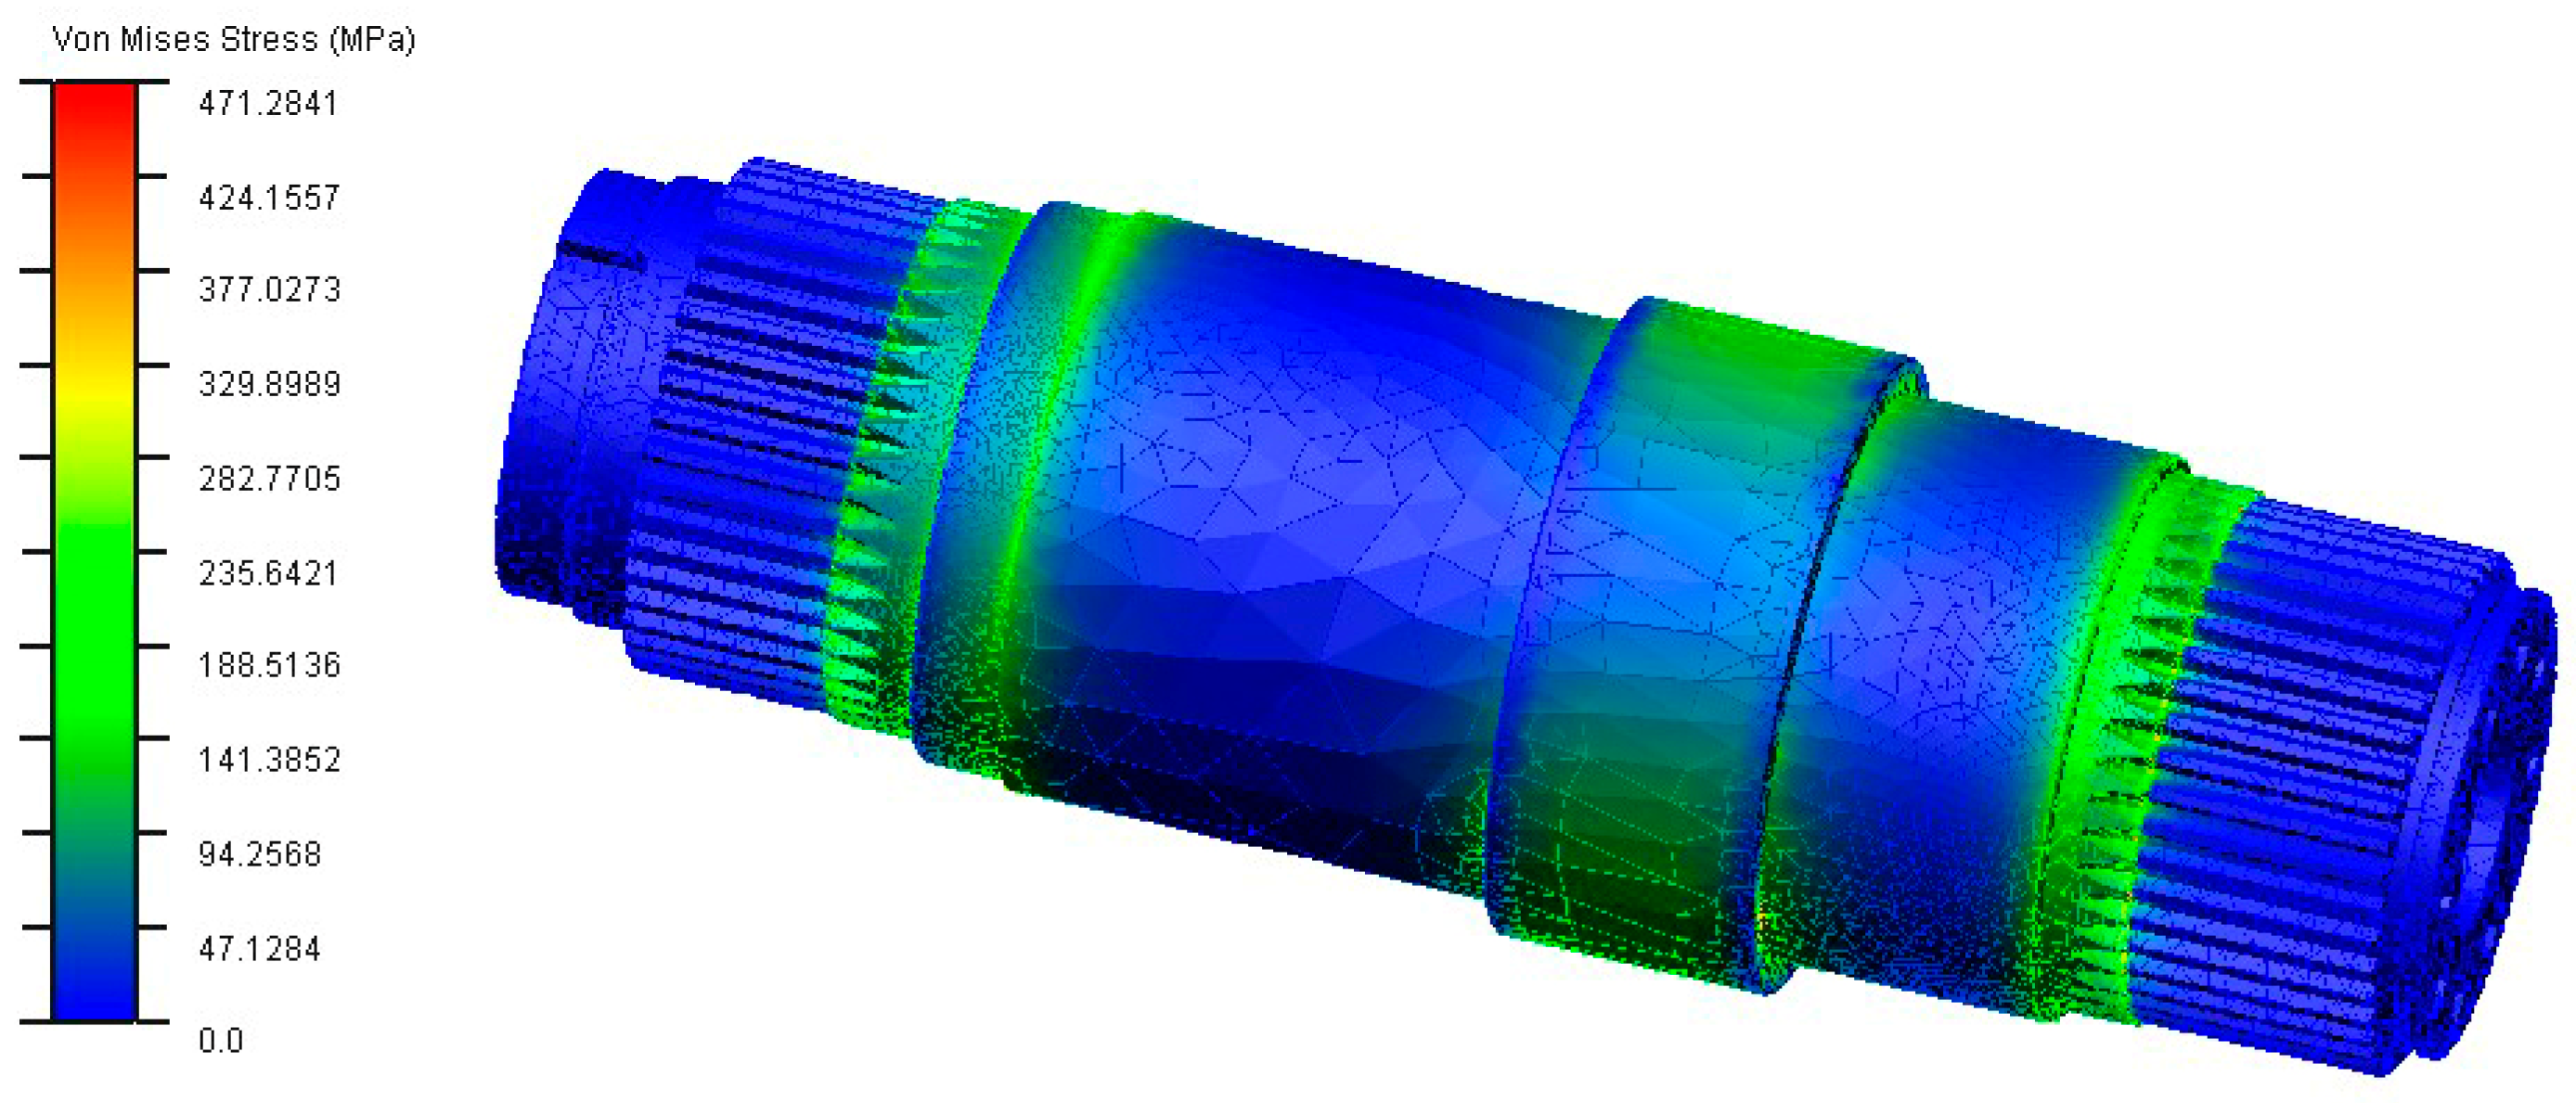
Based on the optimized design variables, the output shaft’s three-dimensional solid and finite element models were re-established using Pro/E and ANSYS. The modal neutral files before optimization in ADAMS were replaced with these newly generated files, and rigid-flexible coupled virtual prototype simulations were conducted. The stress contour of the optimized output shaft is shown in Figure 20; the optimized natural frequencies are listed in Table 8; and the comparison of dynamic indexes before and after optimization is summarized in Table 9.
Figure 20 and Table 8 and Table 9 show that after optimization, the maximum stress of the output shaft is reduced to 471.2841 MPa, representing a decrease of 14.06% compared with the pre-optimization value. Additionally, the optimized output shaft exhibits improved natural frequencies. The amplitude of the optimized output shaft is reduced to 1.2062 mm, a decrease of 31.13% compared to the pre-optimized condition, indicating an improvement in the dynamic performance indices. These results confirm the effectiveness of the structural evolution algorithm predictions. Subsequently, reliability and sensitivity analyses of design variables were conducted on the optimized output shaft, with the results presented in Figure 21.
As shown in Figure 21, the optimized mean sensitivity results of the design variables [Rza, Dza, Lza, Dzb, Lzb, Rzc, Lzc]T7×1 are [0.0003, 0.0116, −0.0028, 0.0036, 0.0063, 0.0047, 0.007]. Compared to the sensitivity analysis results before optimization presented in Figure 18, the absolute sensitivity values decreased after optimization, indicating that the influence of these design variables on output shaft reliability has diminished. After optimization, the reliability of the output shaft increased from 0.6047 to 0.9860.
The post-optimization analysis demonstrates that structural evolutionary algorithm optimization significantly improves the output shaft’s reliability and enhances its dynamic performance, meeting design requirements. The research findings hold significant practical engineering value for improving the stability of shearer systems and ensuring the safe, efficient mining of thin coal seams.
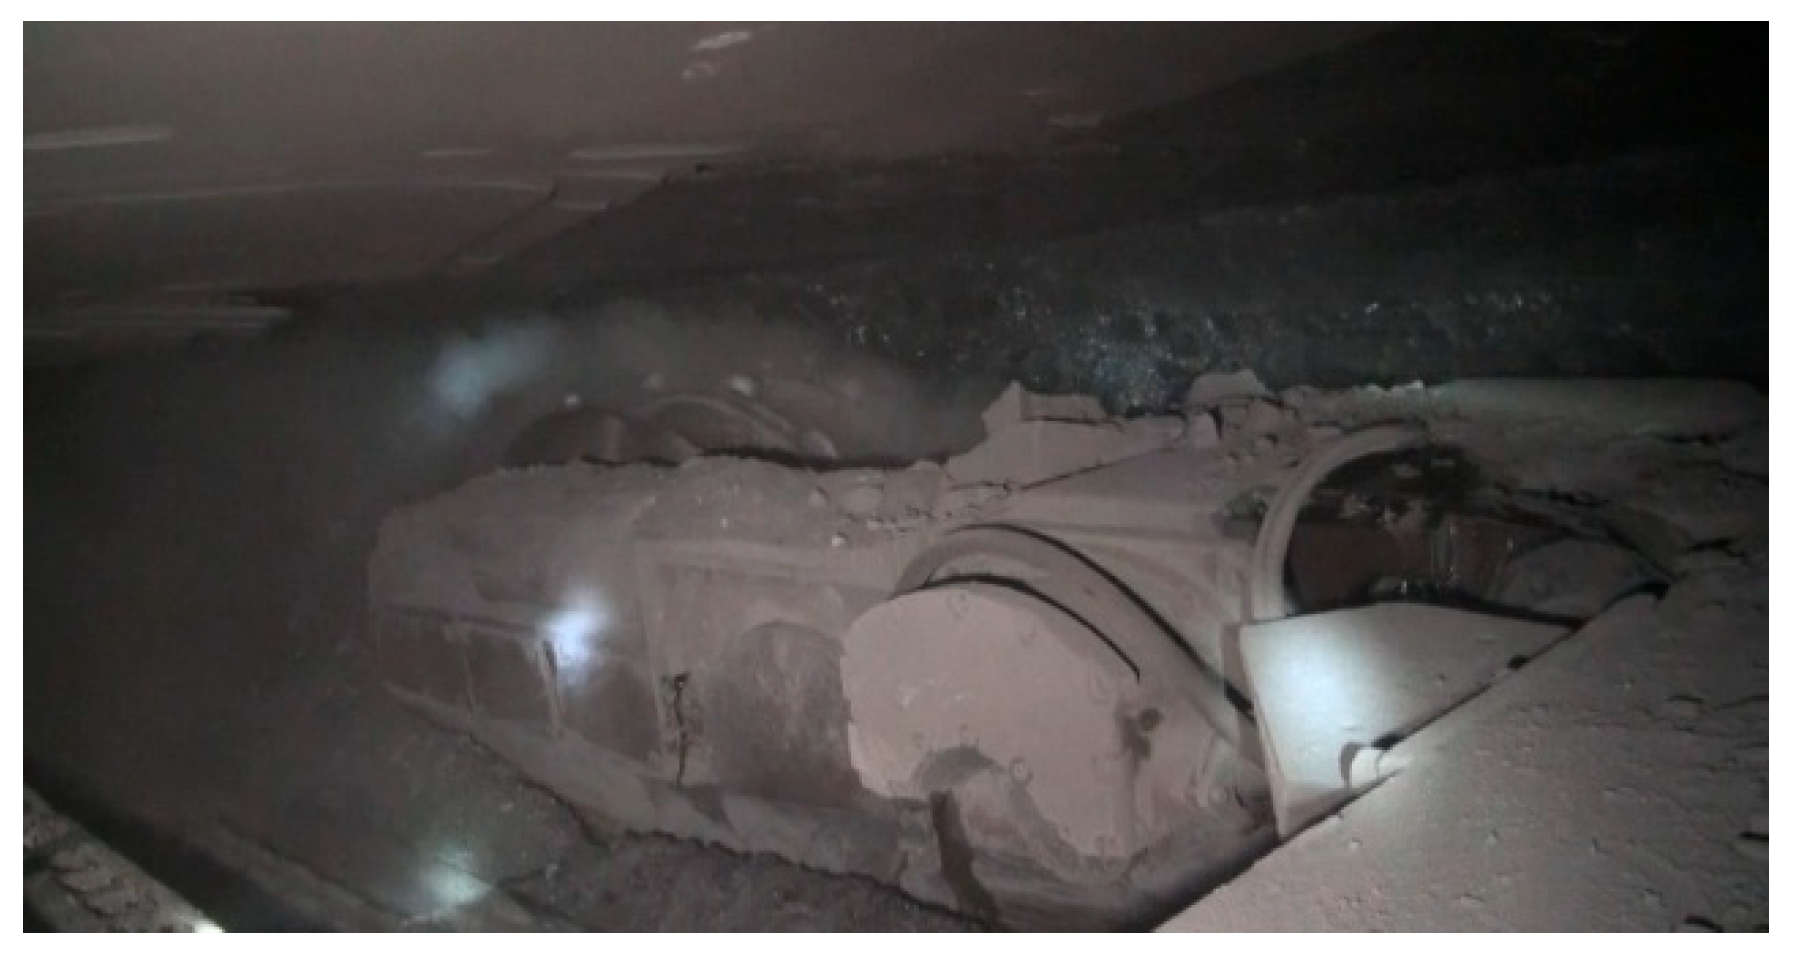
An industrial trial and subsequent formal production deployment of a shearer designed based on these optimized results were conducted at Wenyu Coal Mine in Ordos in Figure 22 and Figure 23. To date, this shearer has been operating reliably and stably at the headquarters coal mine of the Yanzhou Coal Mining Company.

6. Discussion

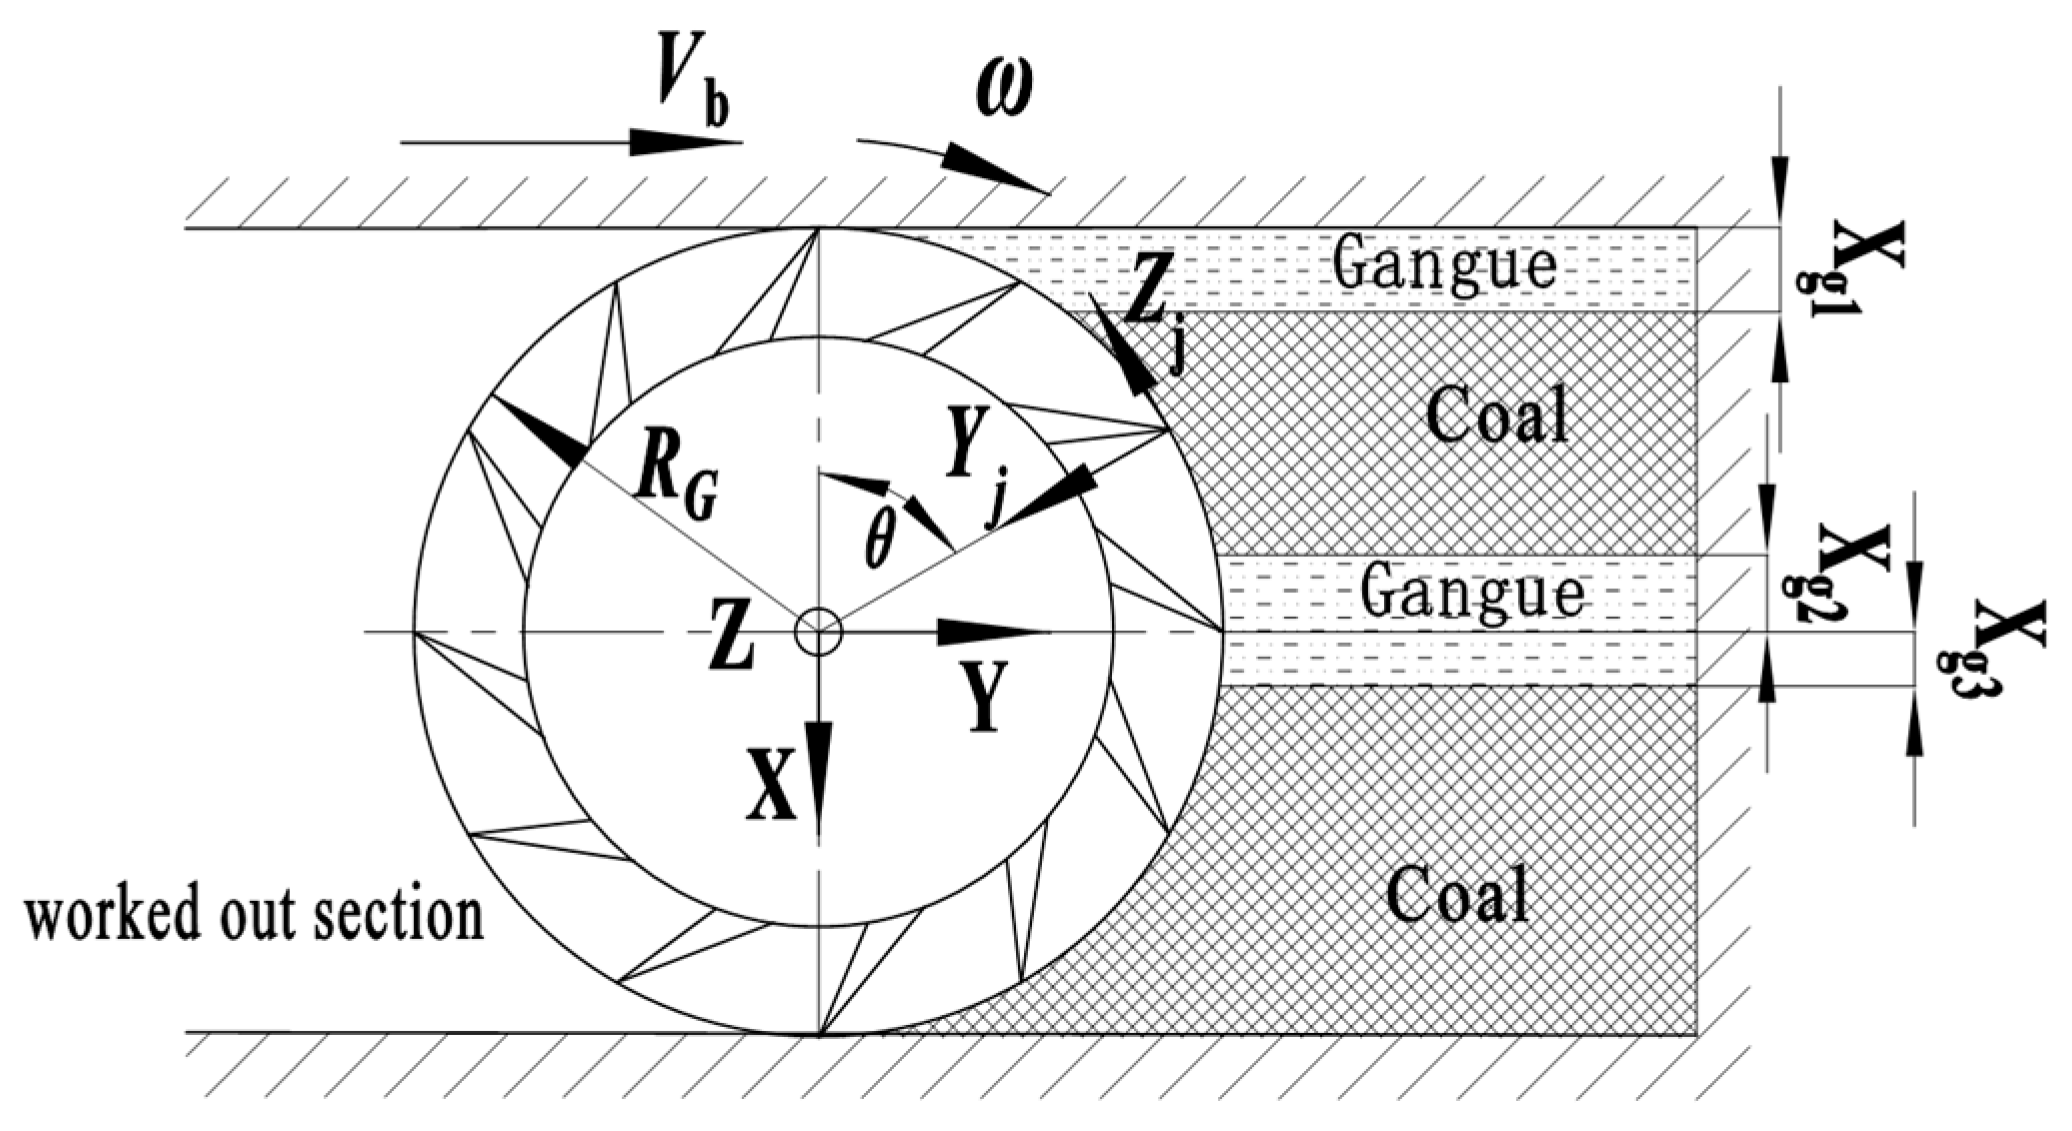
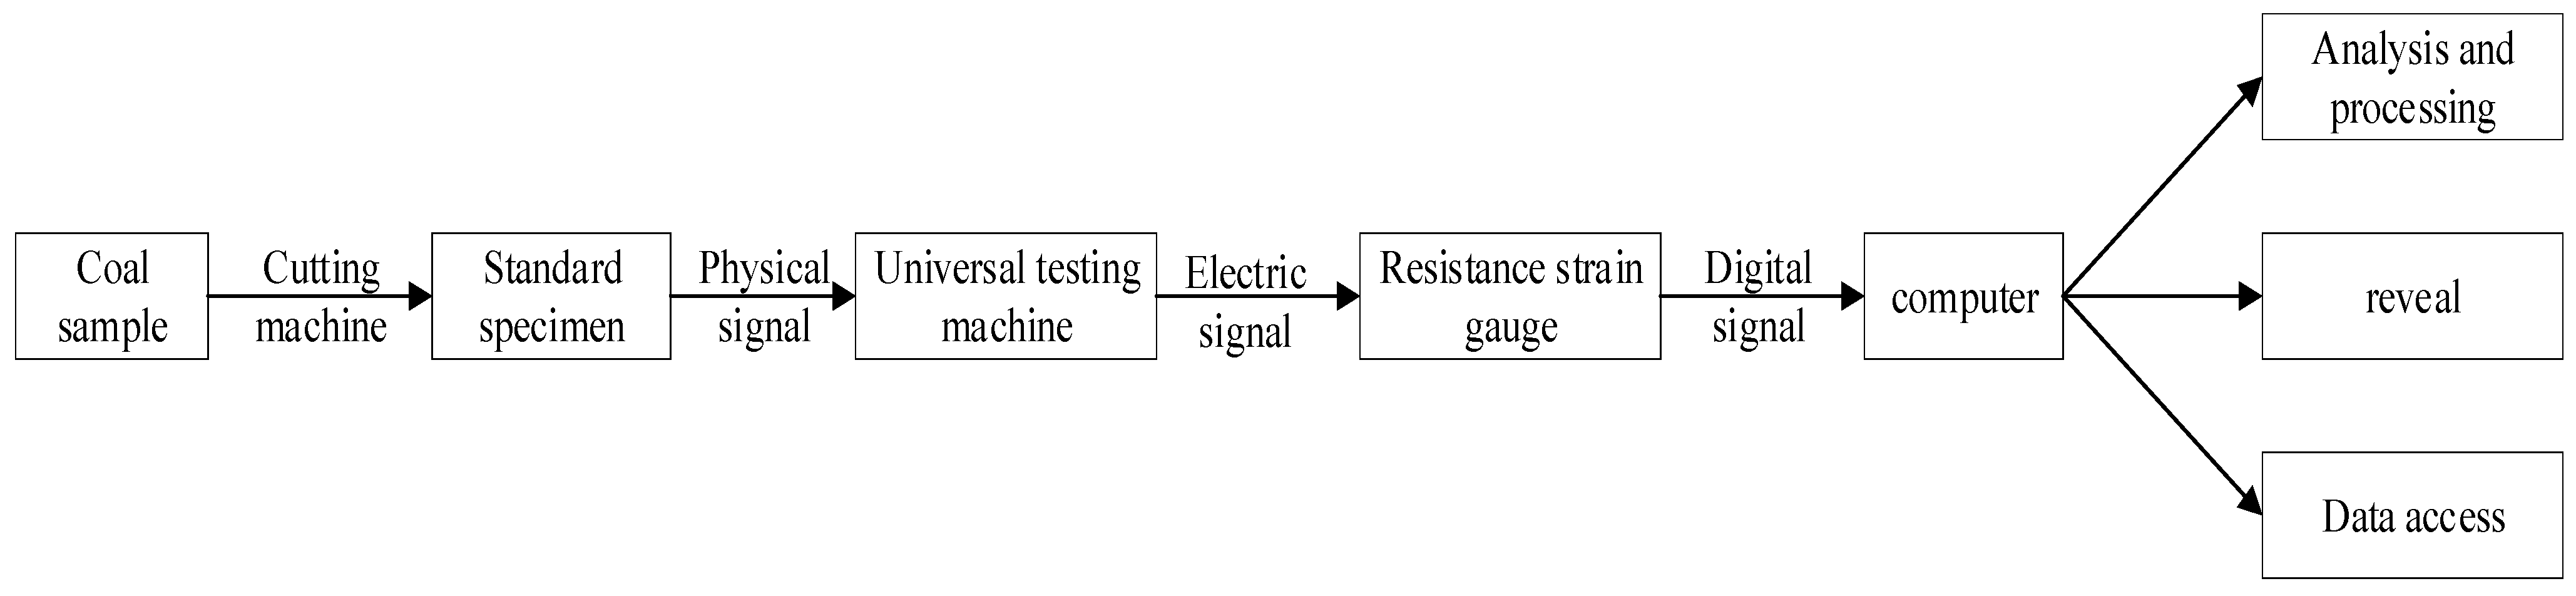
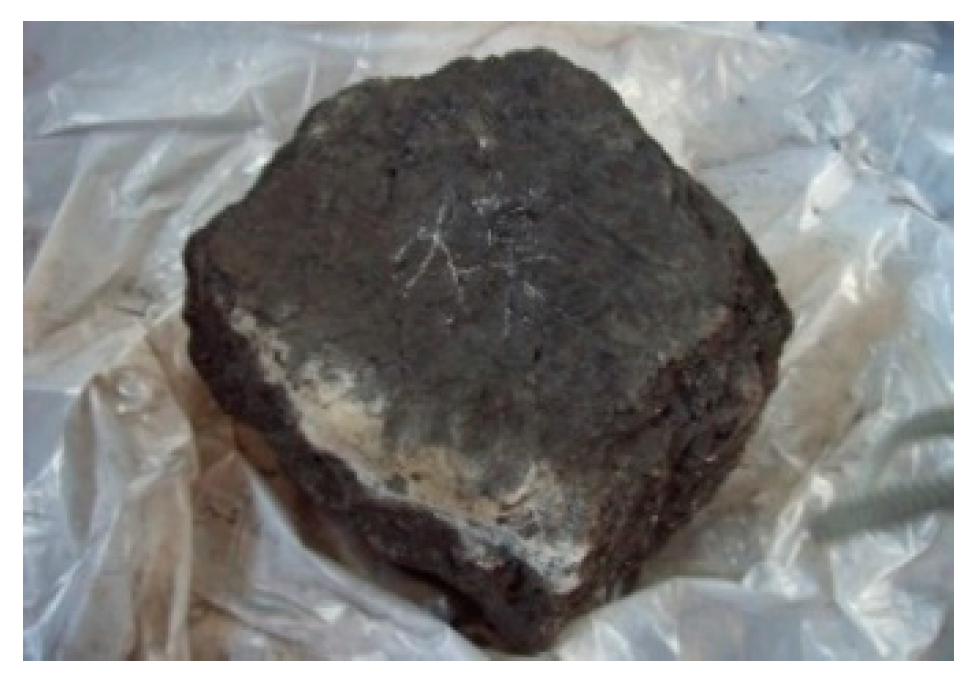
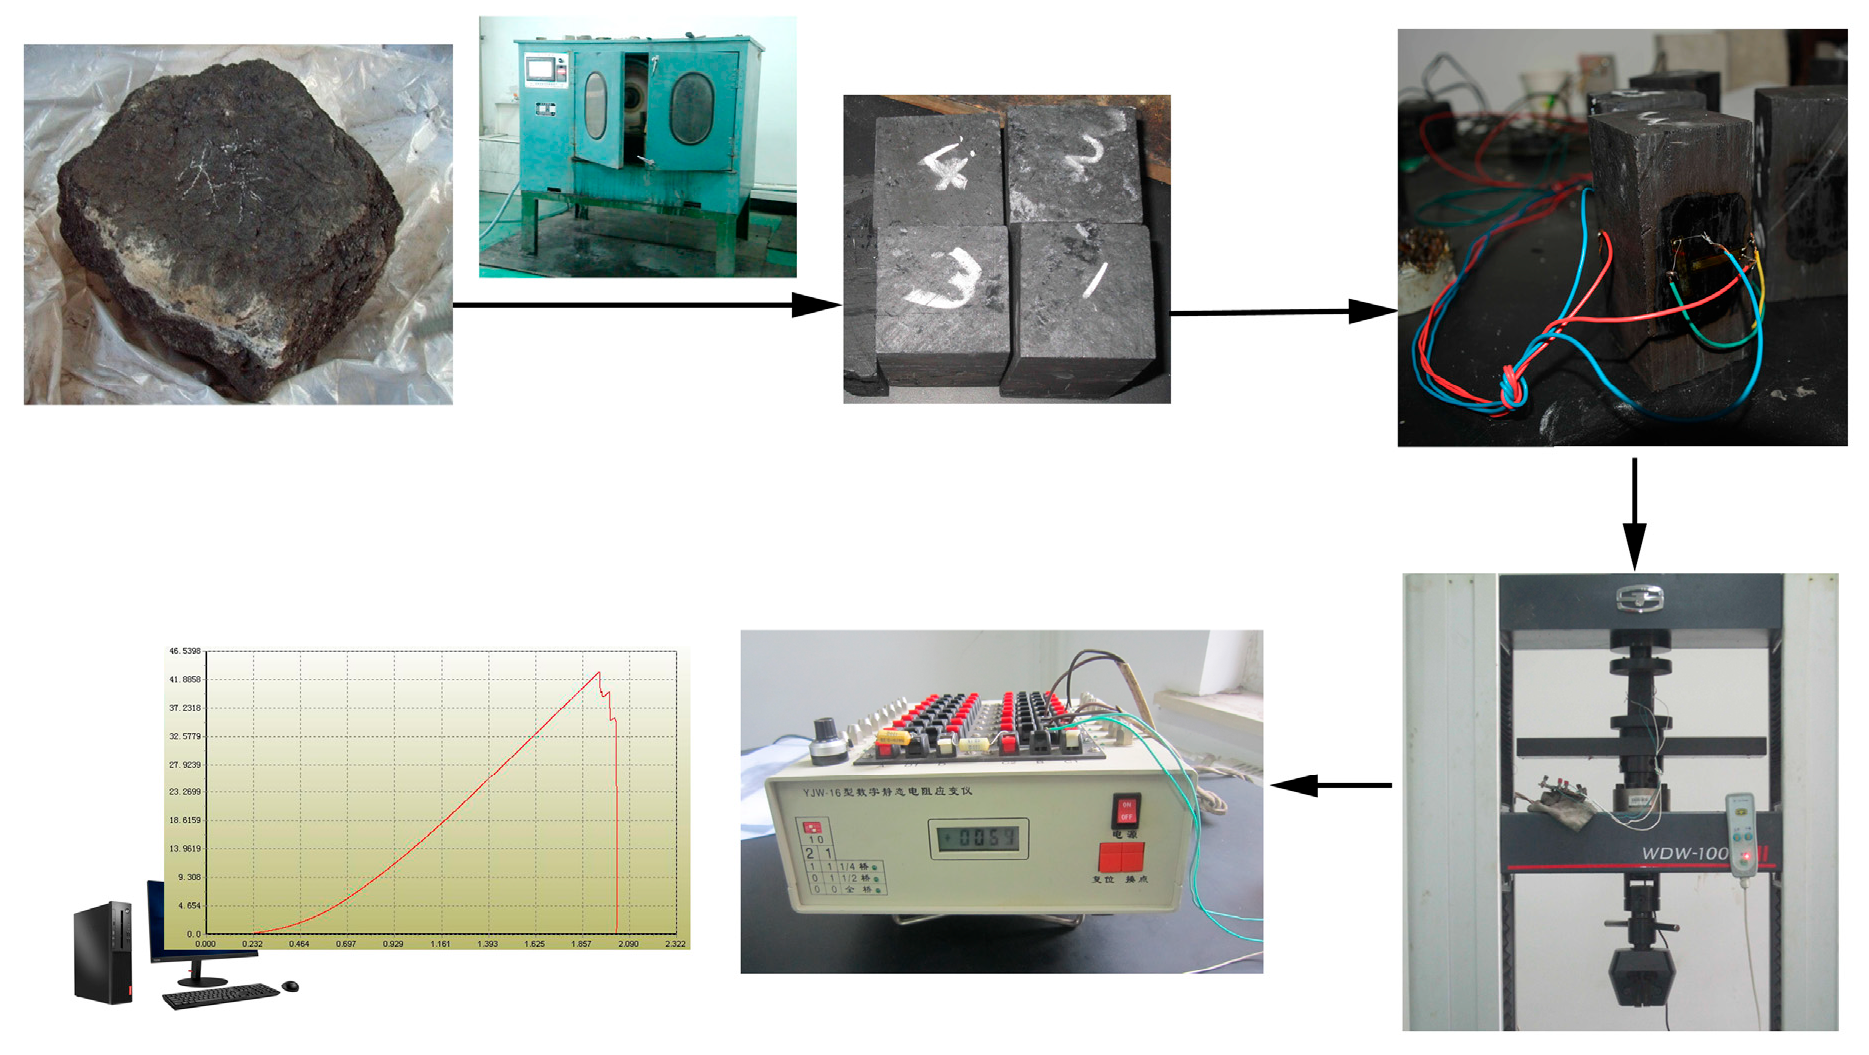
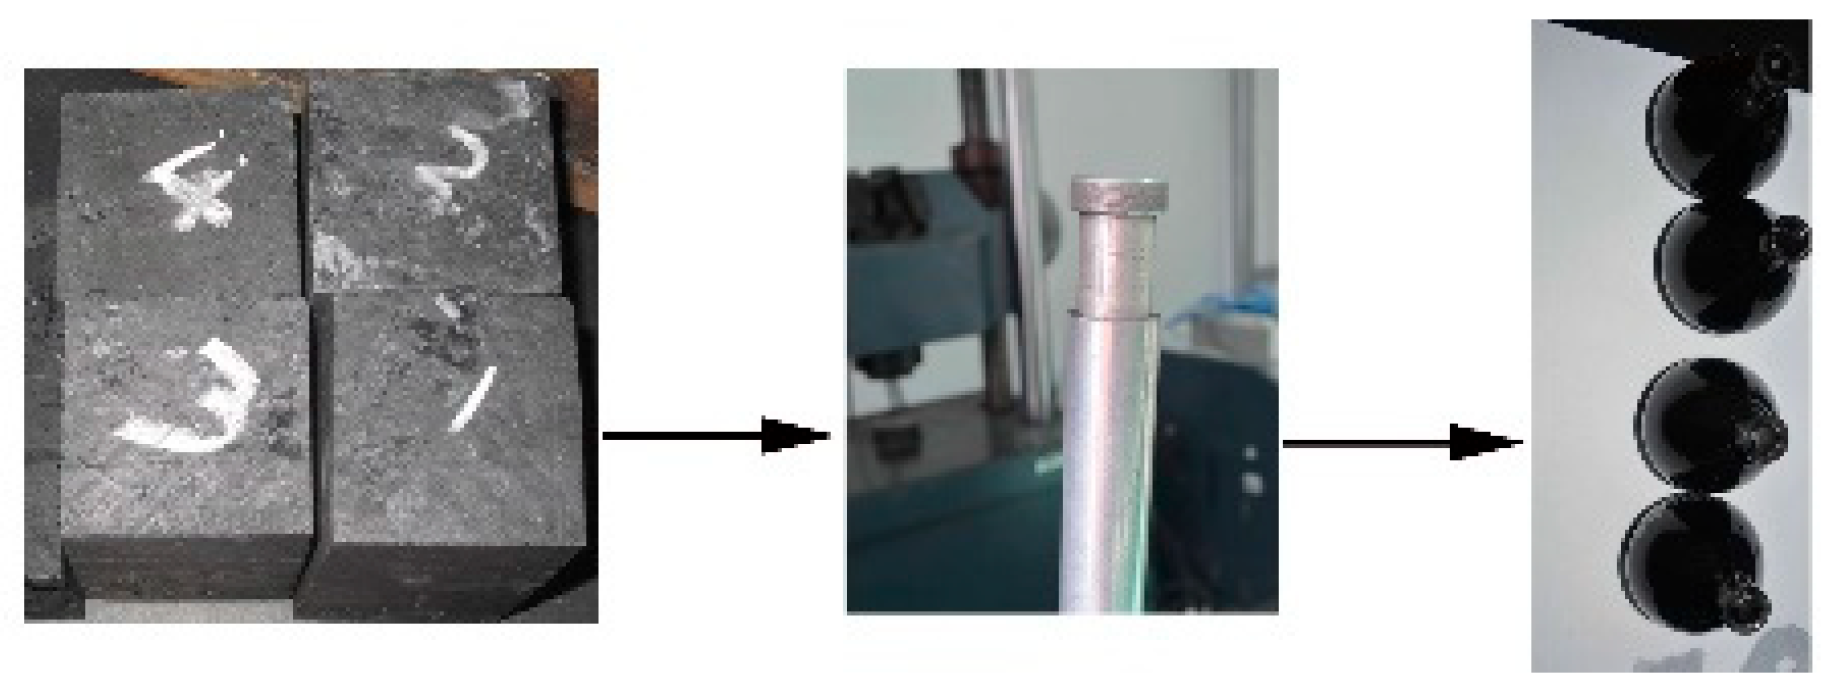
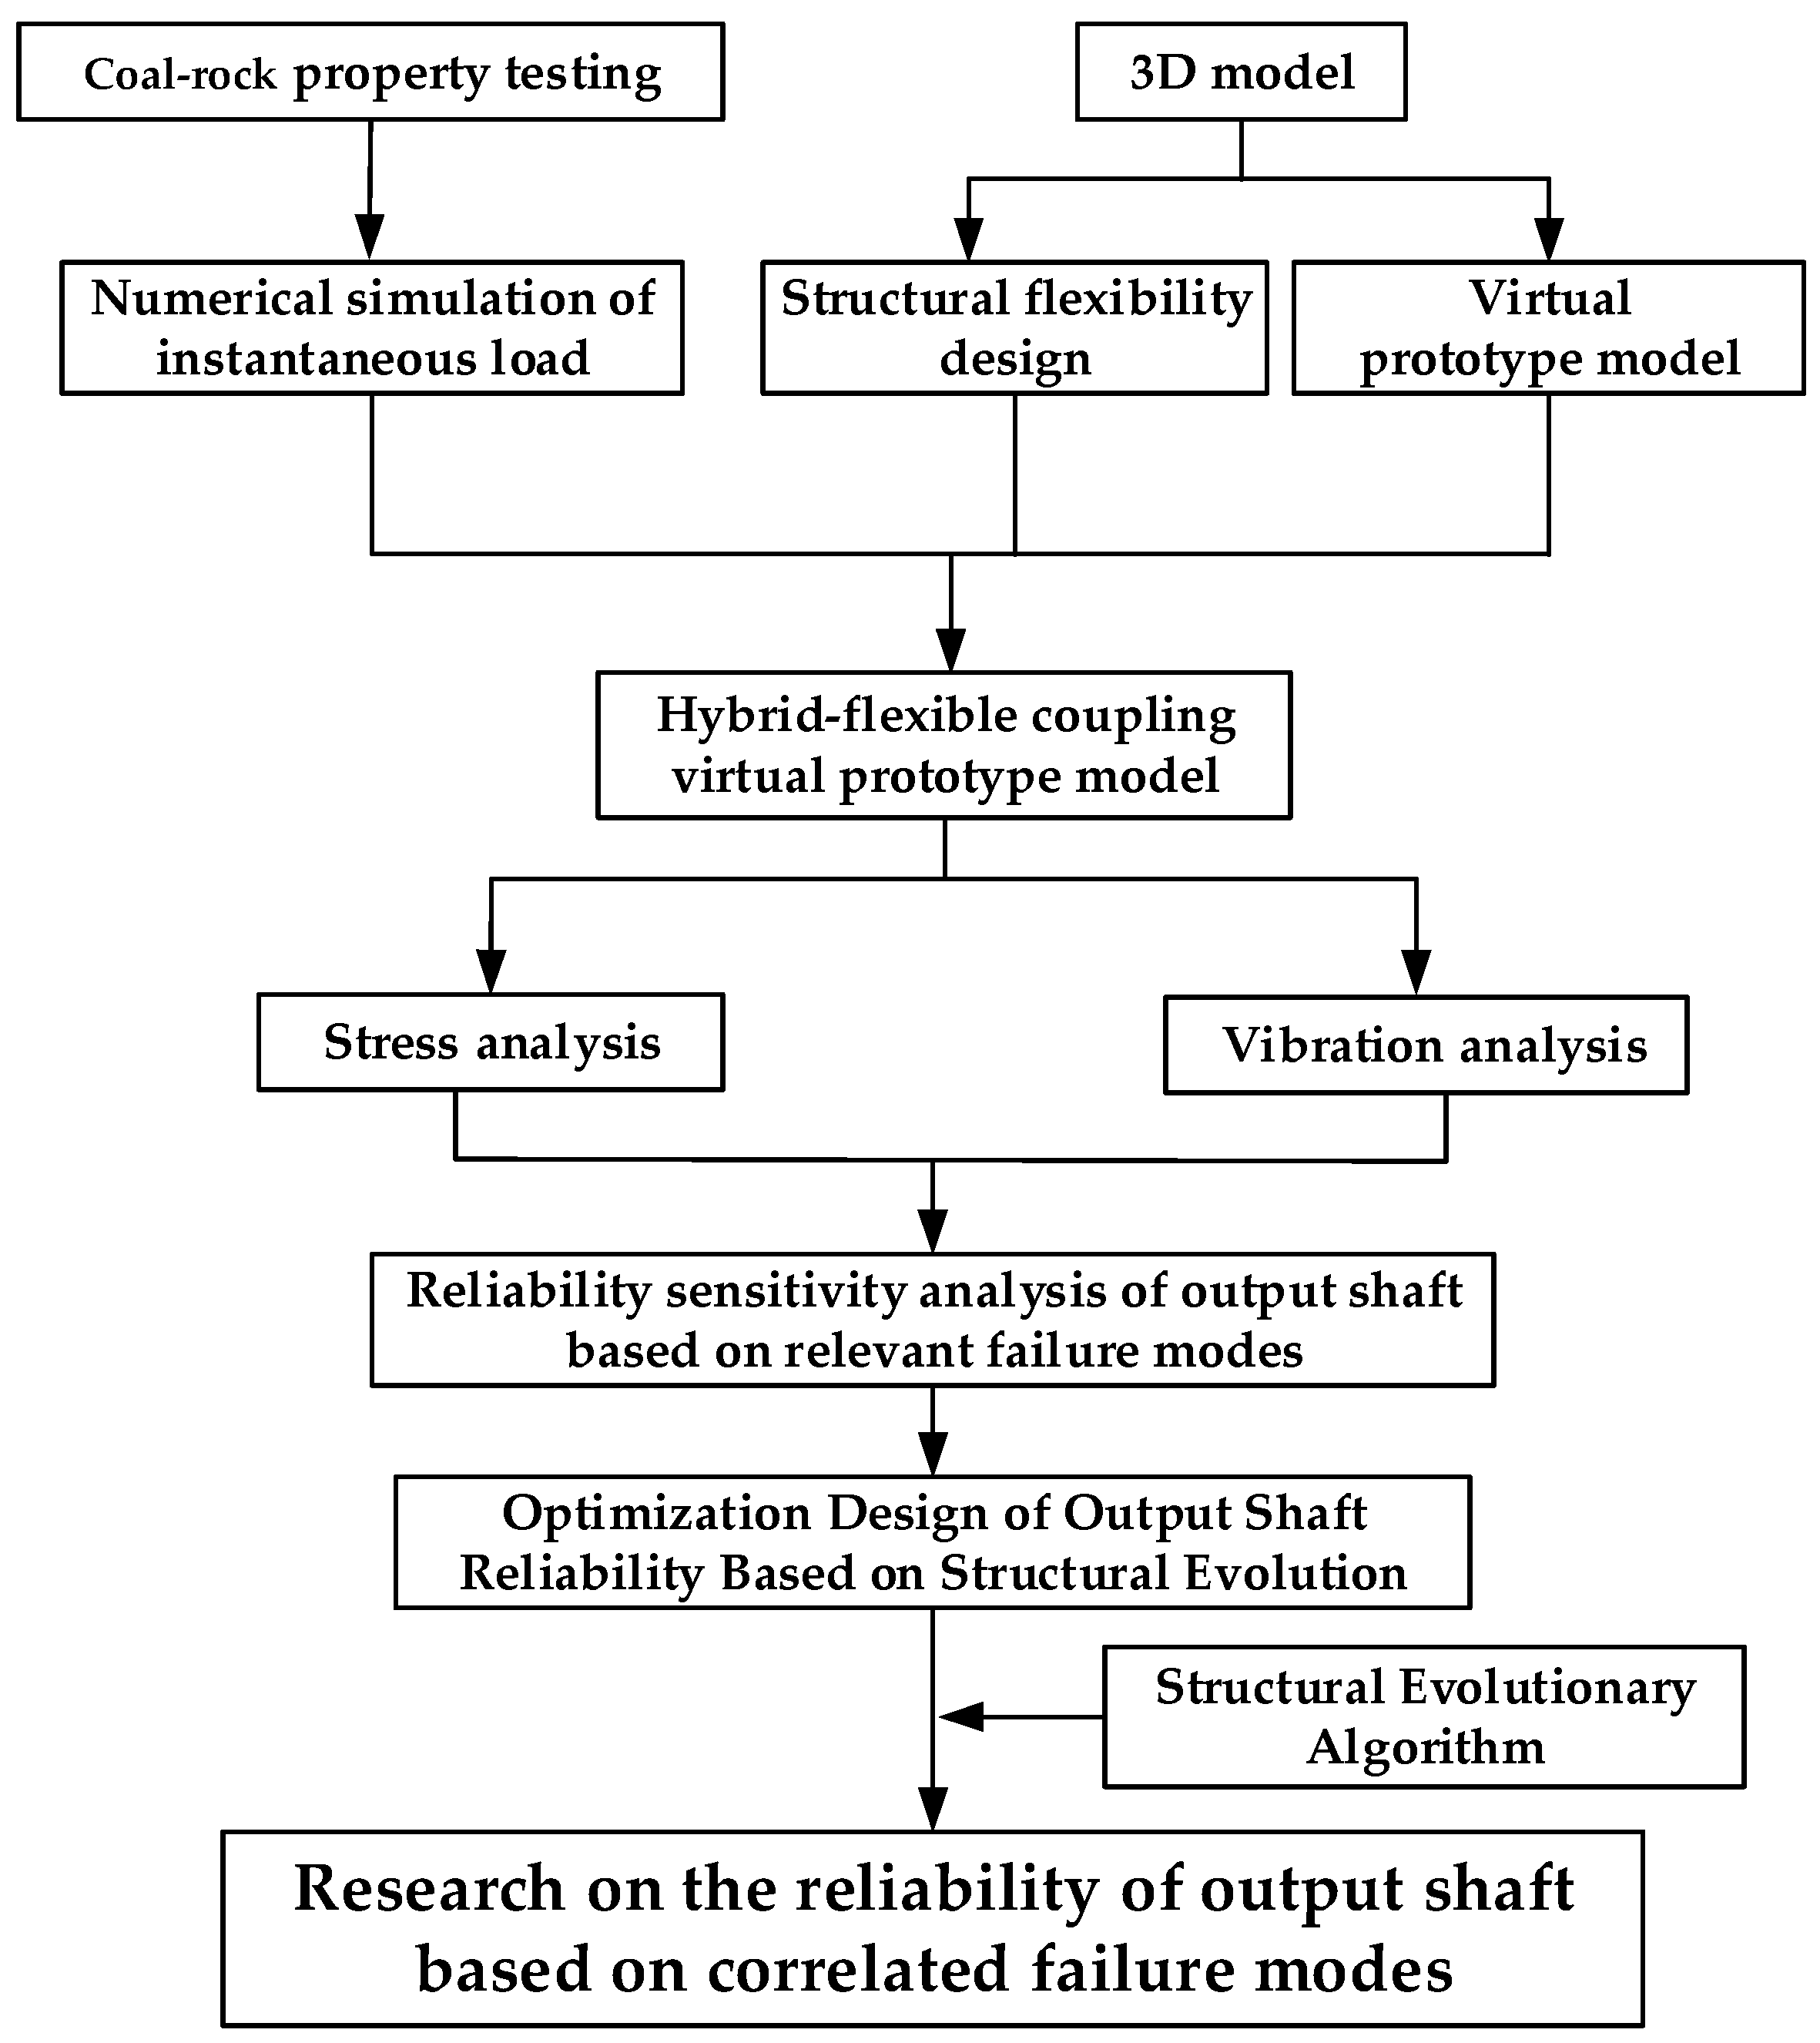
To investigate the vibration reliability of the output shaft in the cutting section of a shearer under coal seams containing hard gangue inclusions, this study focuses on the “MG400/951-WD” shearer model and conducts physical–mechanical parameter testing on coal seam samples with gangue inclusions. A rigid-flexible coupling reliability analysis method considering correlated failure modes is proposed for critical shearer components. This methodology integrates field sampling tests, rigid-flexible coupling virtual prototyping technology, reliability design theory, resonance failure theory, and reliability sensitivity theory to systematically study the reliability of the output shaft under coal seam conditions containing gangue inclusions. The technical roadmap of the research methodology is illustrated in Figure 24.
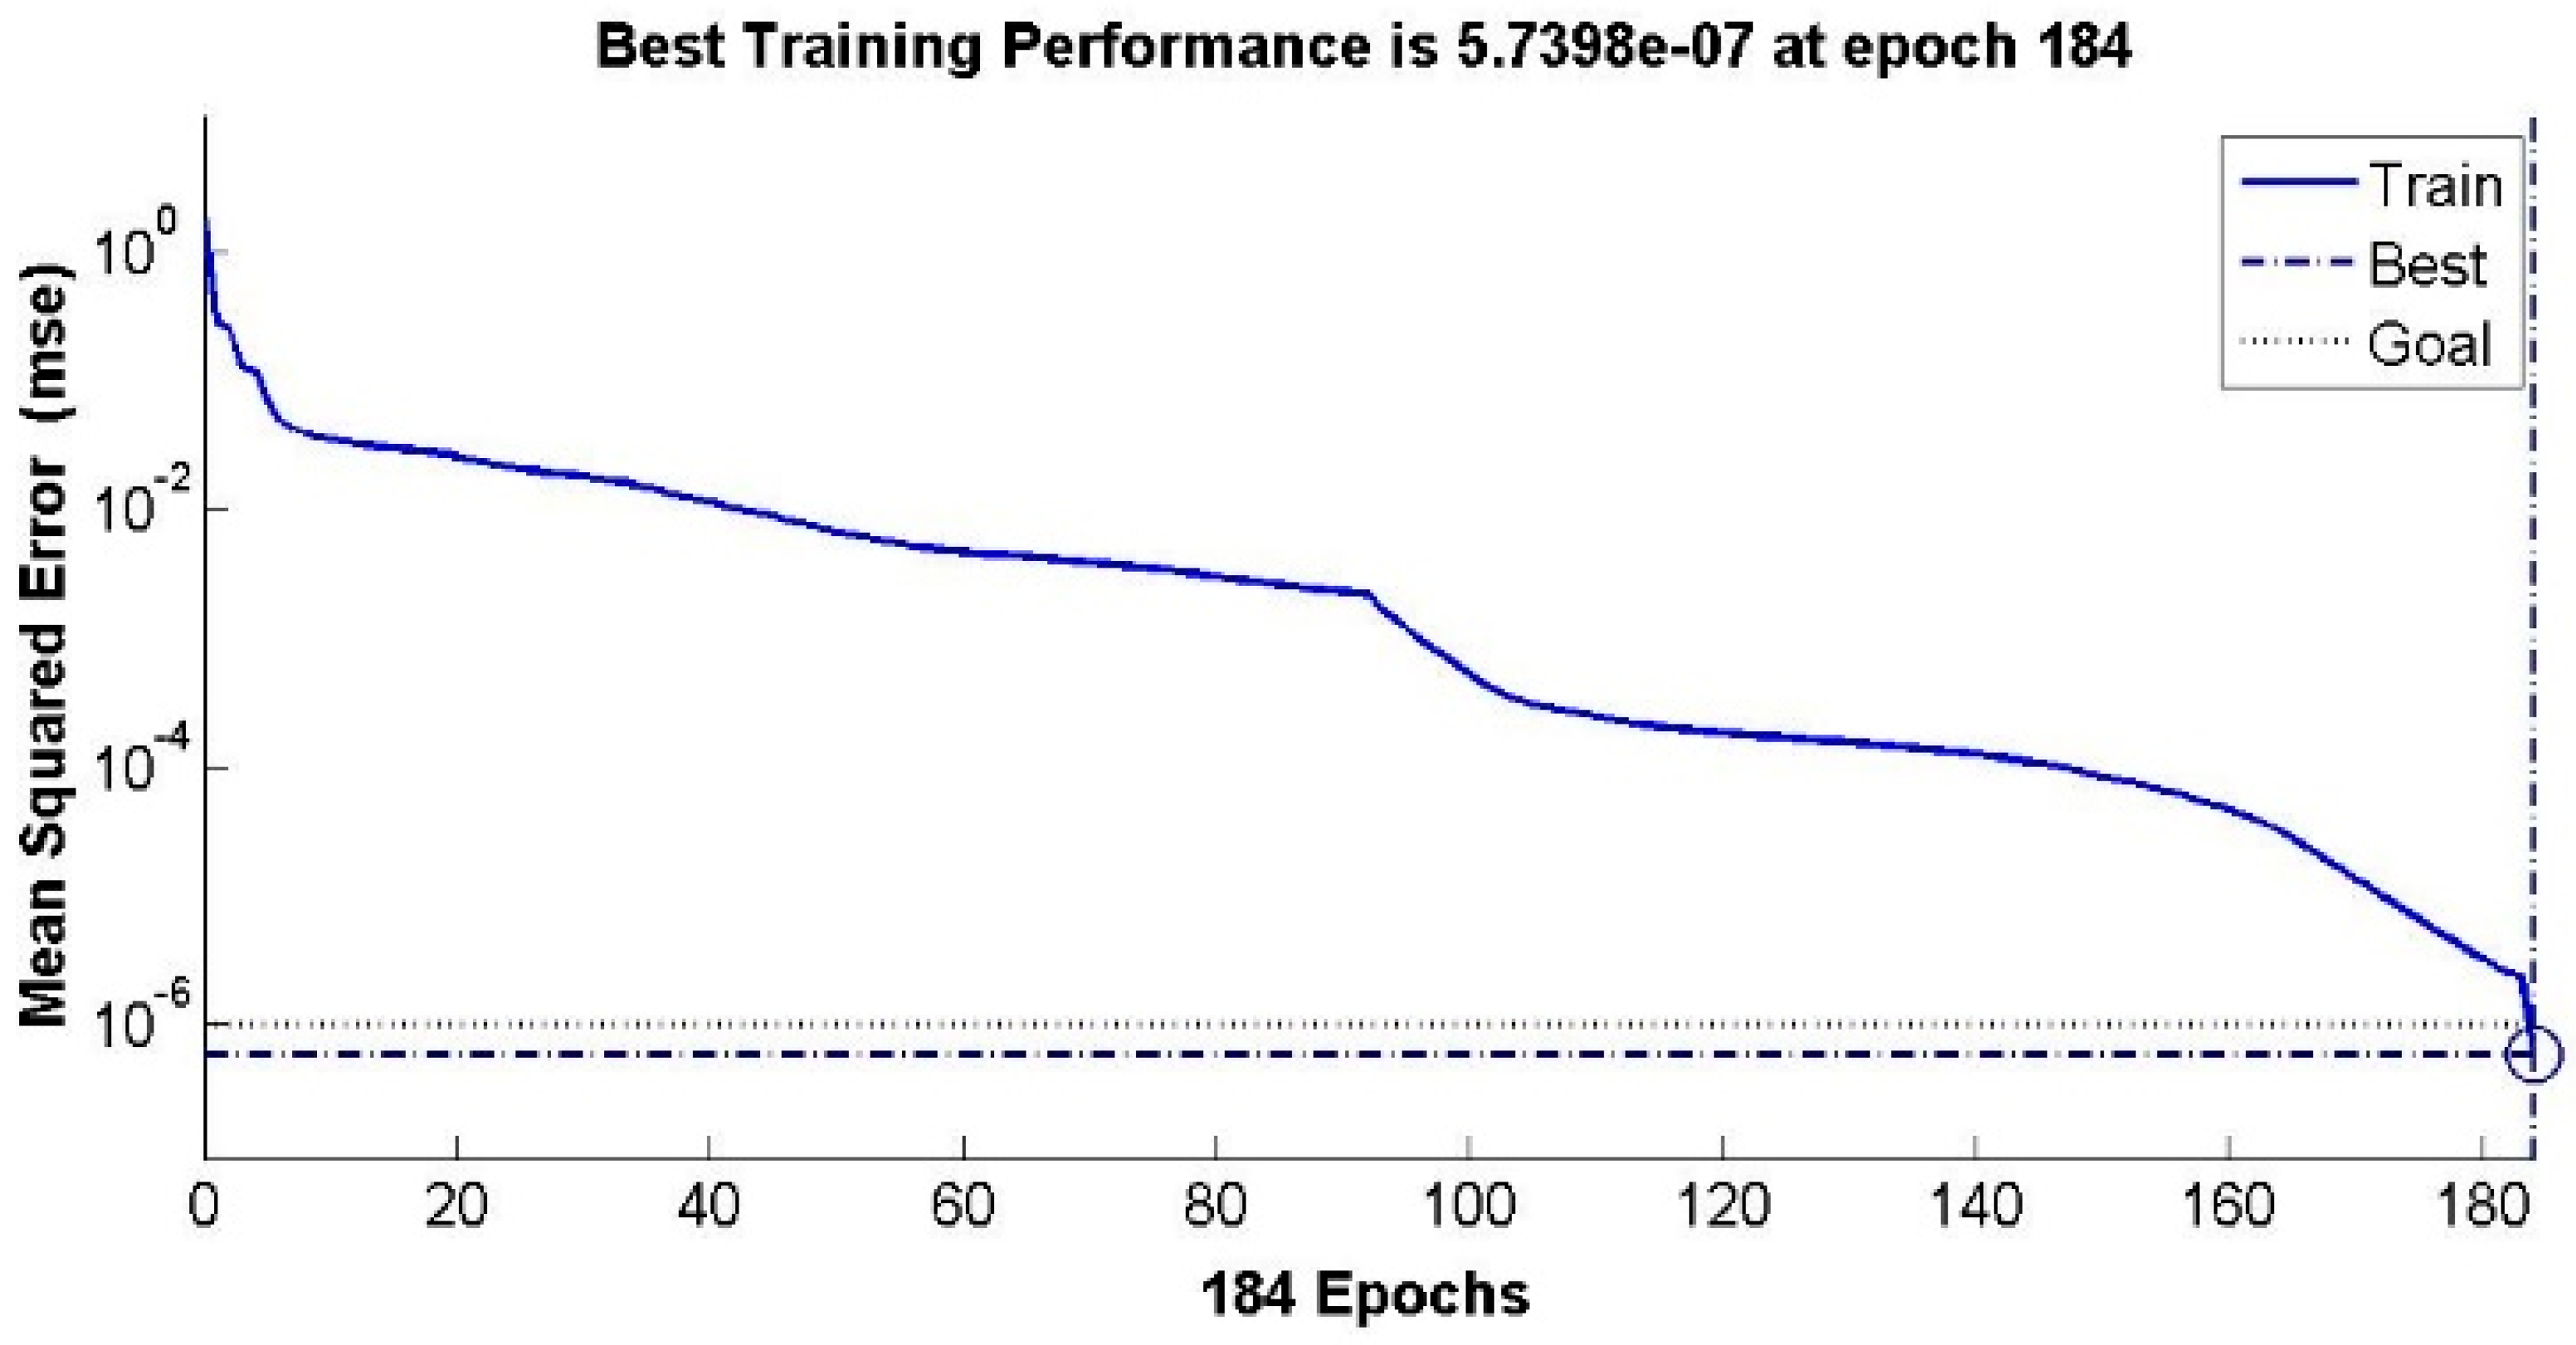
Based on coal fragmentation theory, MATLAB(R2022a) was utilized to derive the impact loads on shearer spiral drum picks in complex coal seams with hard gangue inclusions. Forced vibration analysis was performed on the rigid-flexible coupled virtual prototype model, identifying locations of severe vibration in the output shaft and displacement responses at monitoring points. A resonance failure criterion for the output shaft was established using reliability interference theory, with dynamic simulations revealing a frequency reliability of 0.9953. BP neural network-enhanced reliability sensitivity analysis was conducted to evaluate the influence of structural parameters on vibration reliability. A structural evolutionary algorithm was developed to optimize the reliability design of the output shaft, achieving reductions in maximum stress (19.2% decrease), vibration amplitude (1.2062 mm, 31.13% reduction), and improvements in natural frequency. The optimized design enhanced reliability from 0.9953 to 0.9999 under correlated failure modes while reducing sensitivity to design variables.
This research combines rigid-flexible coupling virtual prototyping with reliability interference theory, neural network-based sensitivity analysis, and structural evolutionary algorithms, establishing a theoretical foundation and data-driven framework for designing critical shearer components. The proposed reliability framework exhibits broad applicability beyond the MG400/951-WD shearer, as its core methodology is model-agnostic and adaptable to diverse mechanical systems. In terms of modeling, the CREO-ADAMS-ANSYS(2022 R1) rigid-flexible coupling approach is transferable to other shearer models or mining machinery by adjusting geometric or dynamic parameters. In terms of failure mode, the Copula-based correlation analysis can integrate additional failure modes, provided empirical or simulation data are available. In terms of load adaptability, MATLAB(R2022a)-derived load models and neural networks accommodate varying geological conditions through recalibrated material properties and cutting dynamics. In terms of optimization, the evolutionary algorithm optimizes any parameterized component if reliability sensitivity gradients are computable. The integrated methodology demonstrates significant engineering value for developing high-reliability mechanical transmission systems, particularly in challenging geological conditions with heterogeneous coal–rock interfaces. The optimization outcomes meet design requirements through enhanced vibration reliability, improved dynamic performance metrics, and reduced parametric sensitivity, providing an effective paradigm for the reliability-driven design of mining machinery components.

7. Conclusions

This research proposes a rigid-flexible coupling reliability analysis method for critical shearer components, considering correlated failure modes. Reliability optimization design is performed for the shearer’s output shaft, a key component. Under correlated failure modes, the reliability and performance of the output shaft are improved and optimized. The proposed method provides a faster and more reliable technical approach for designing high-reliability shearers under coal seams interbedded with gangue conditions.
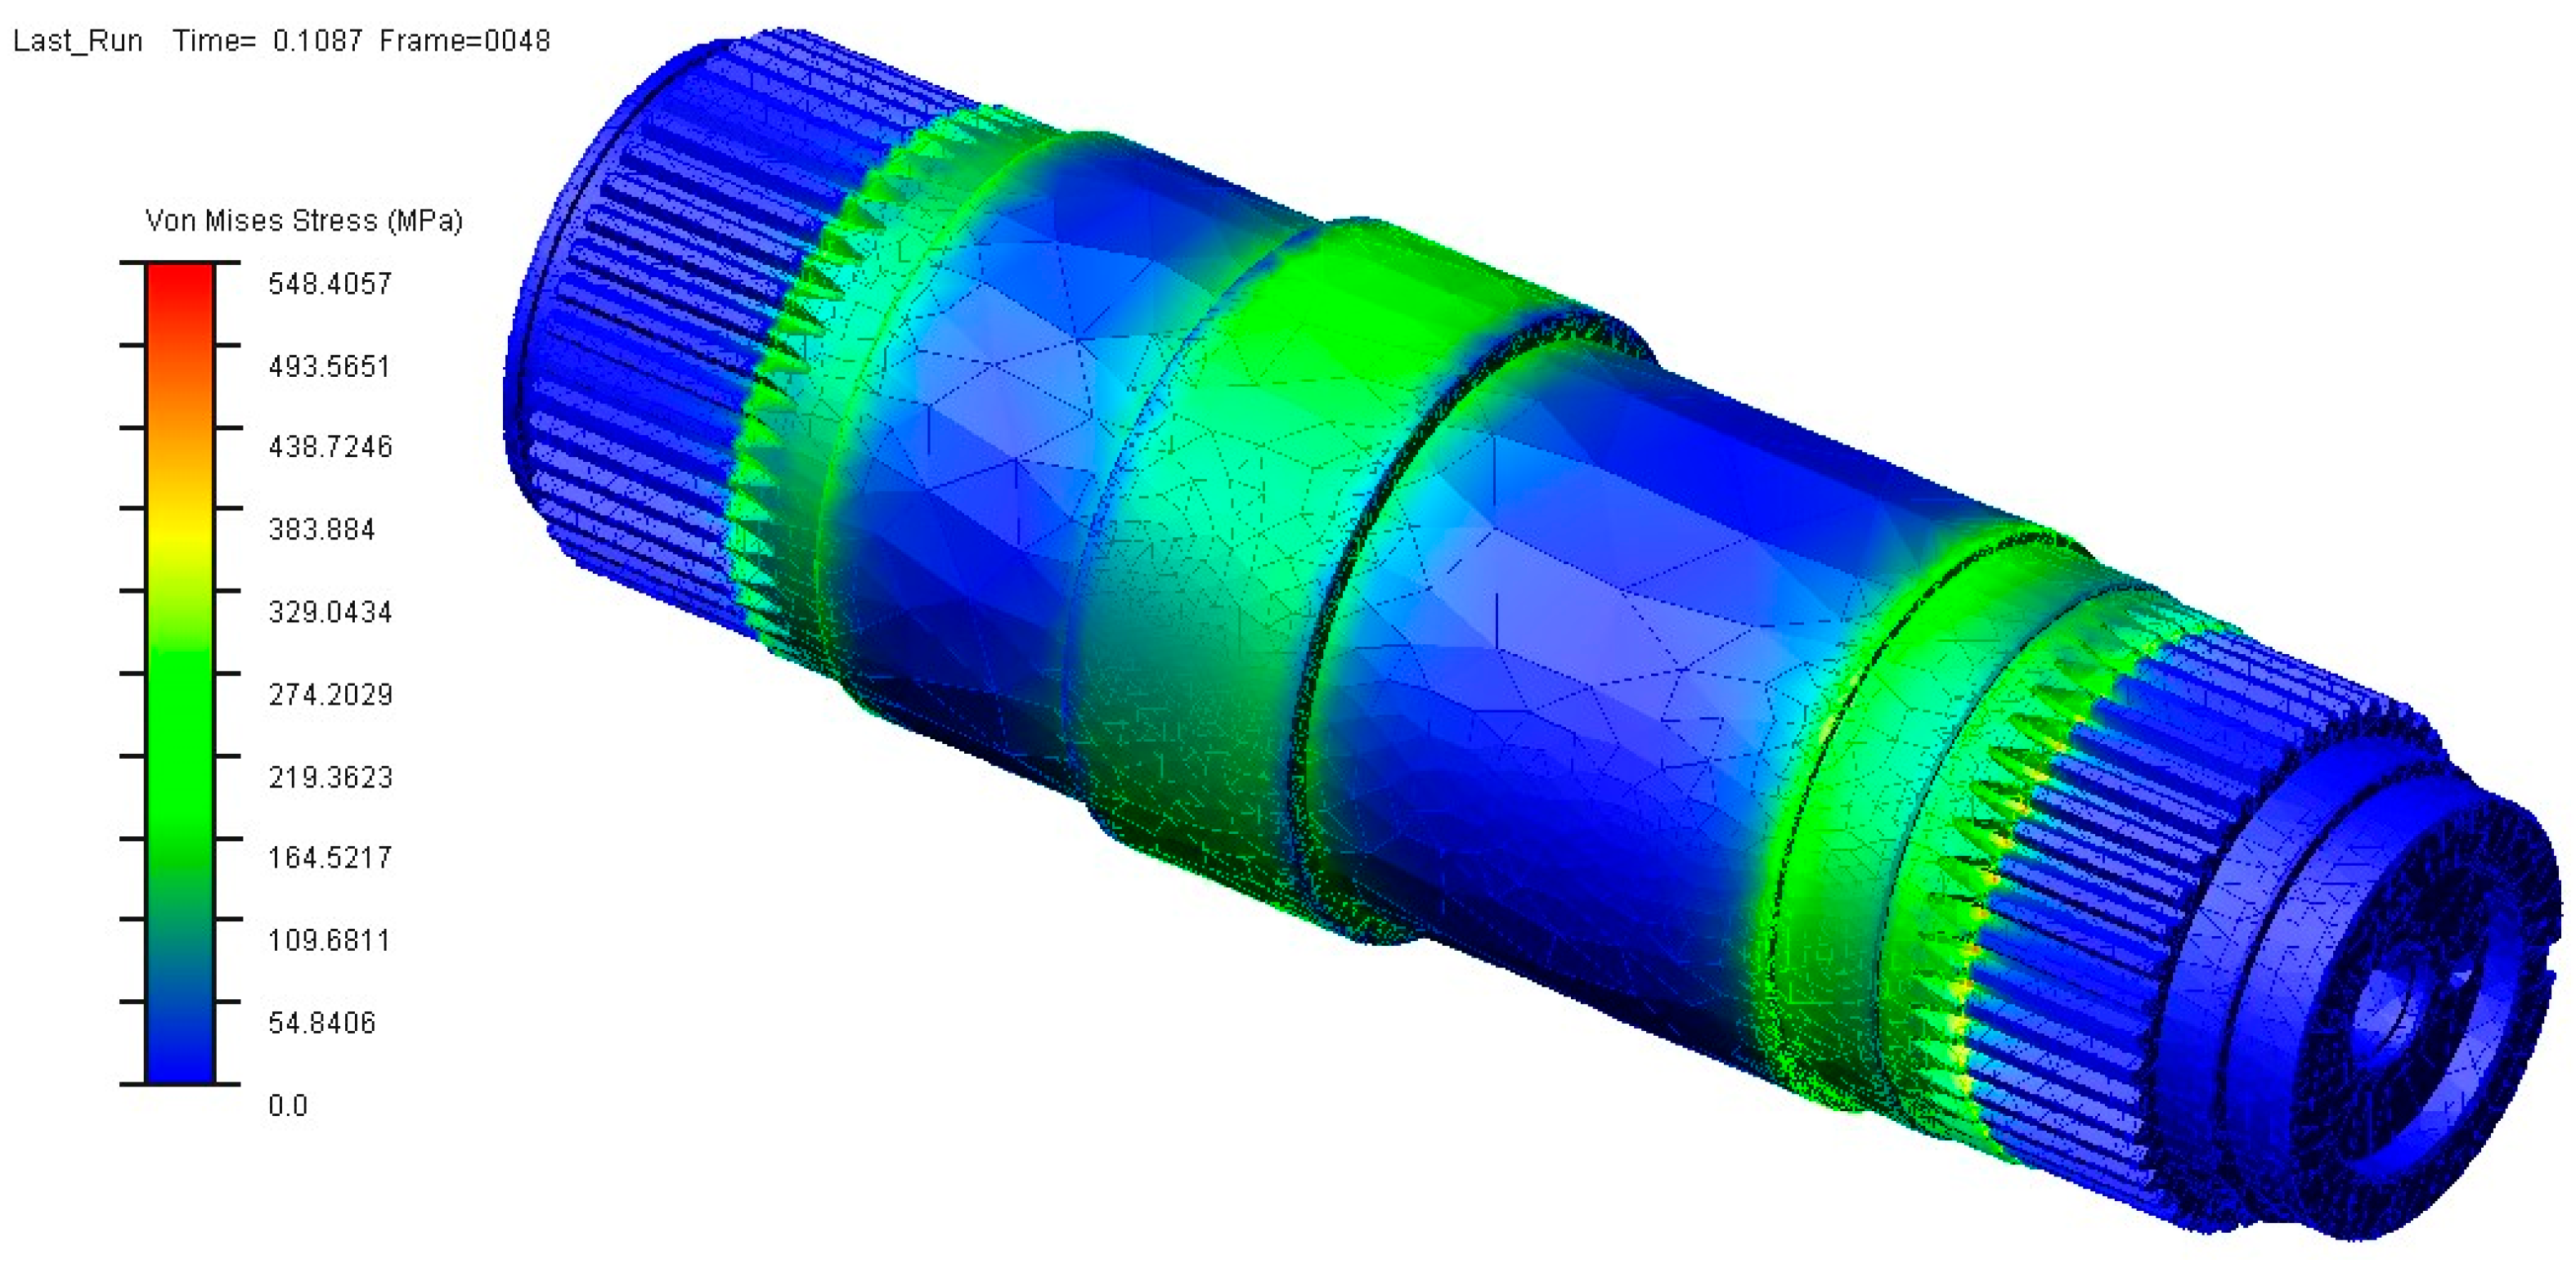
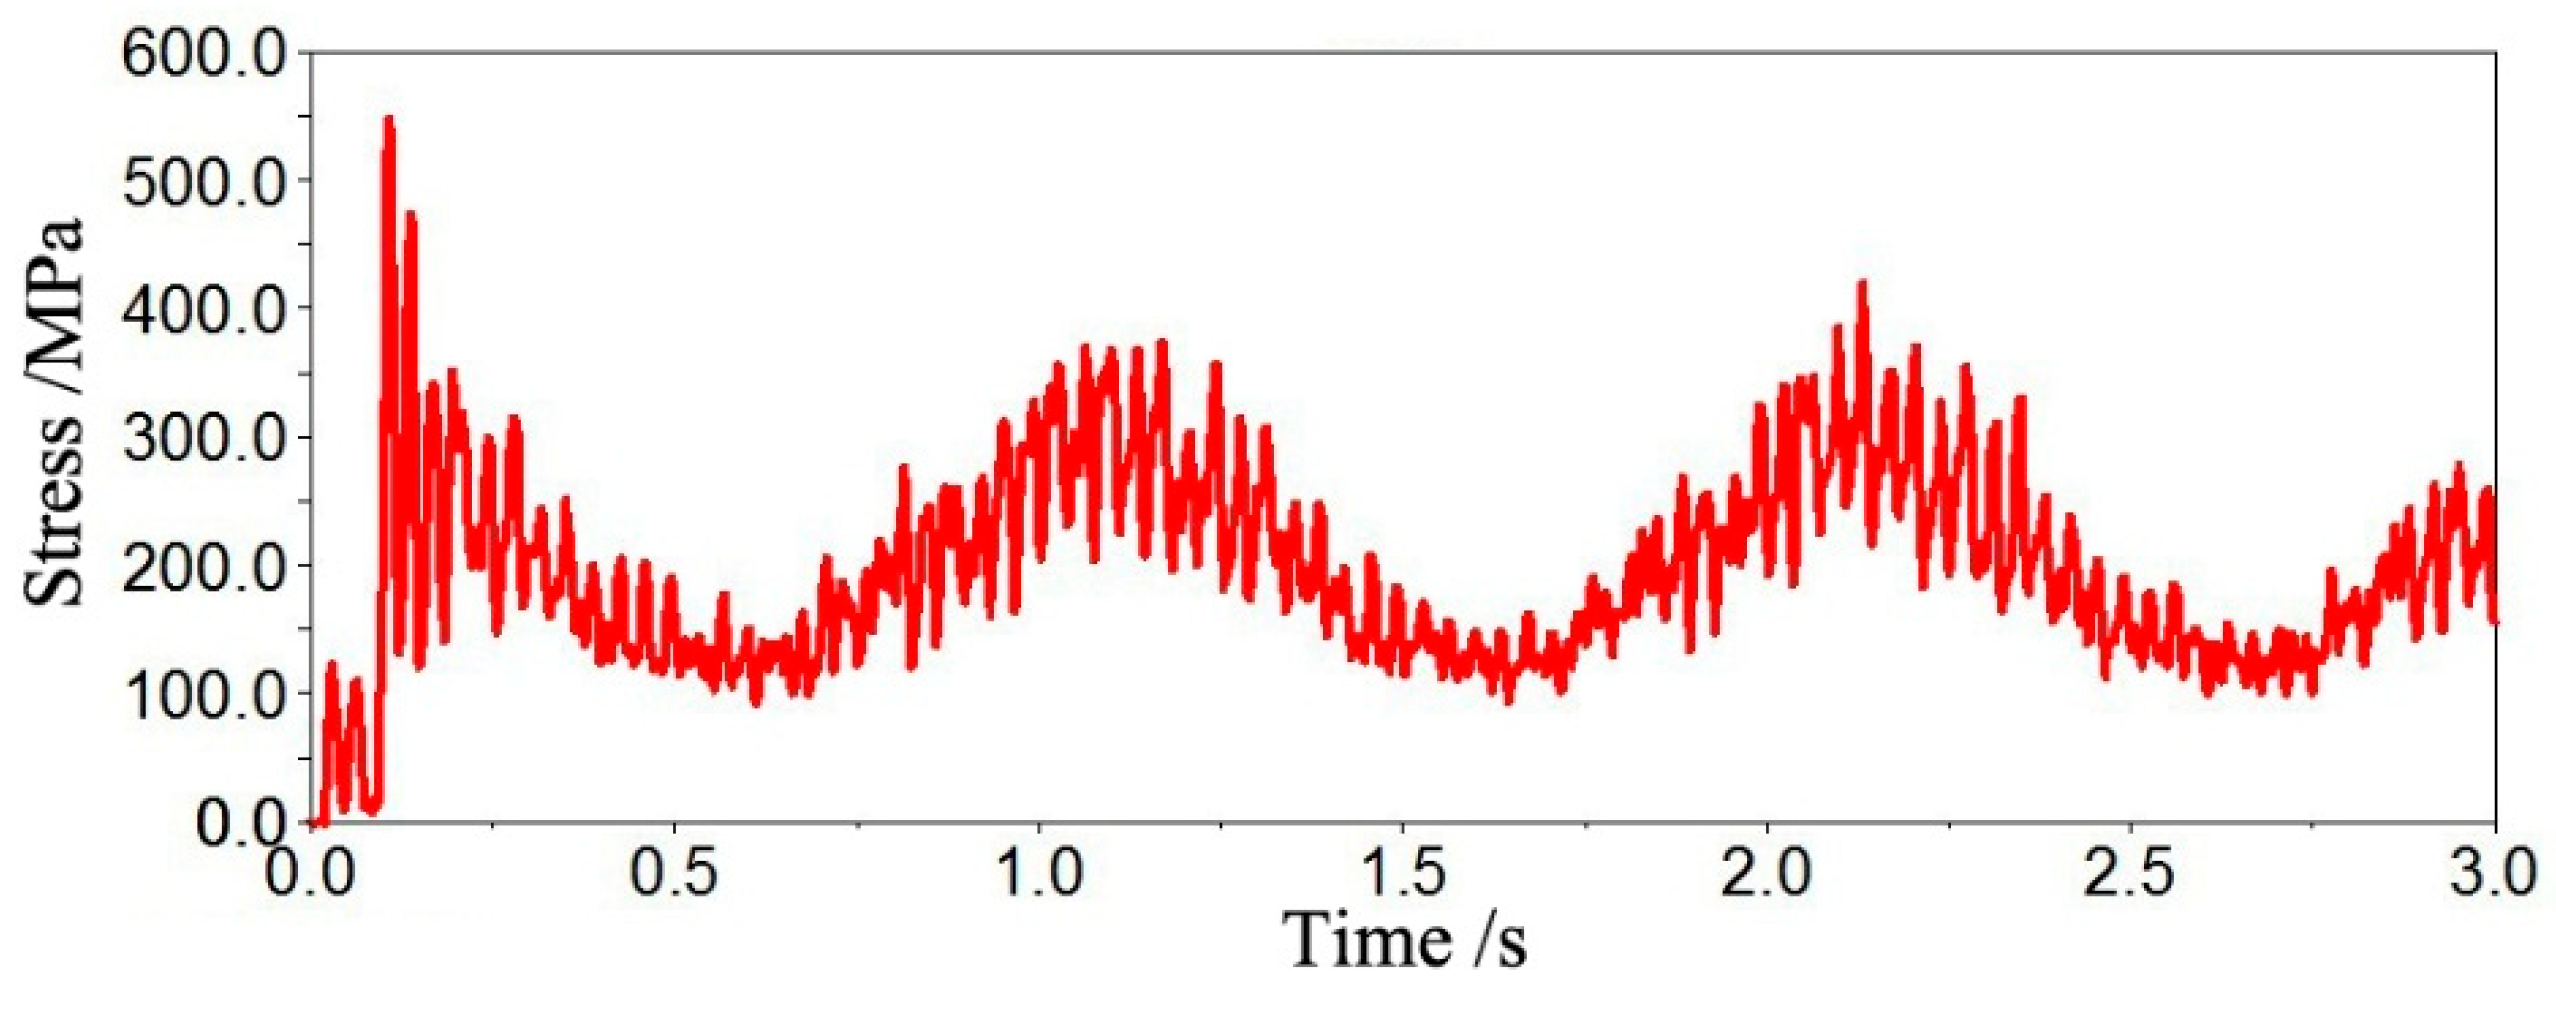
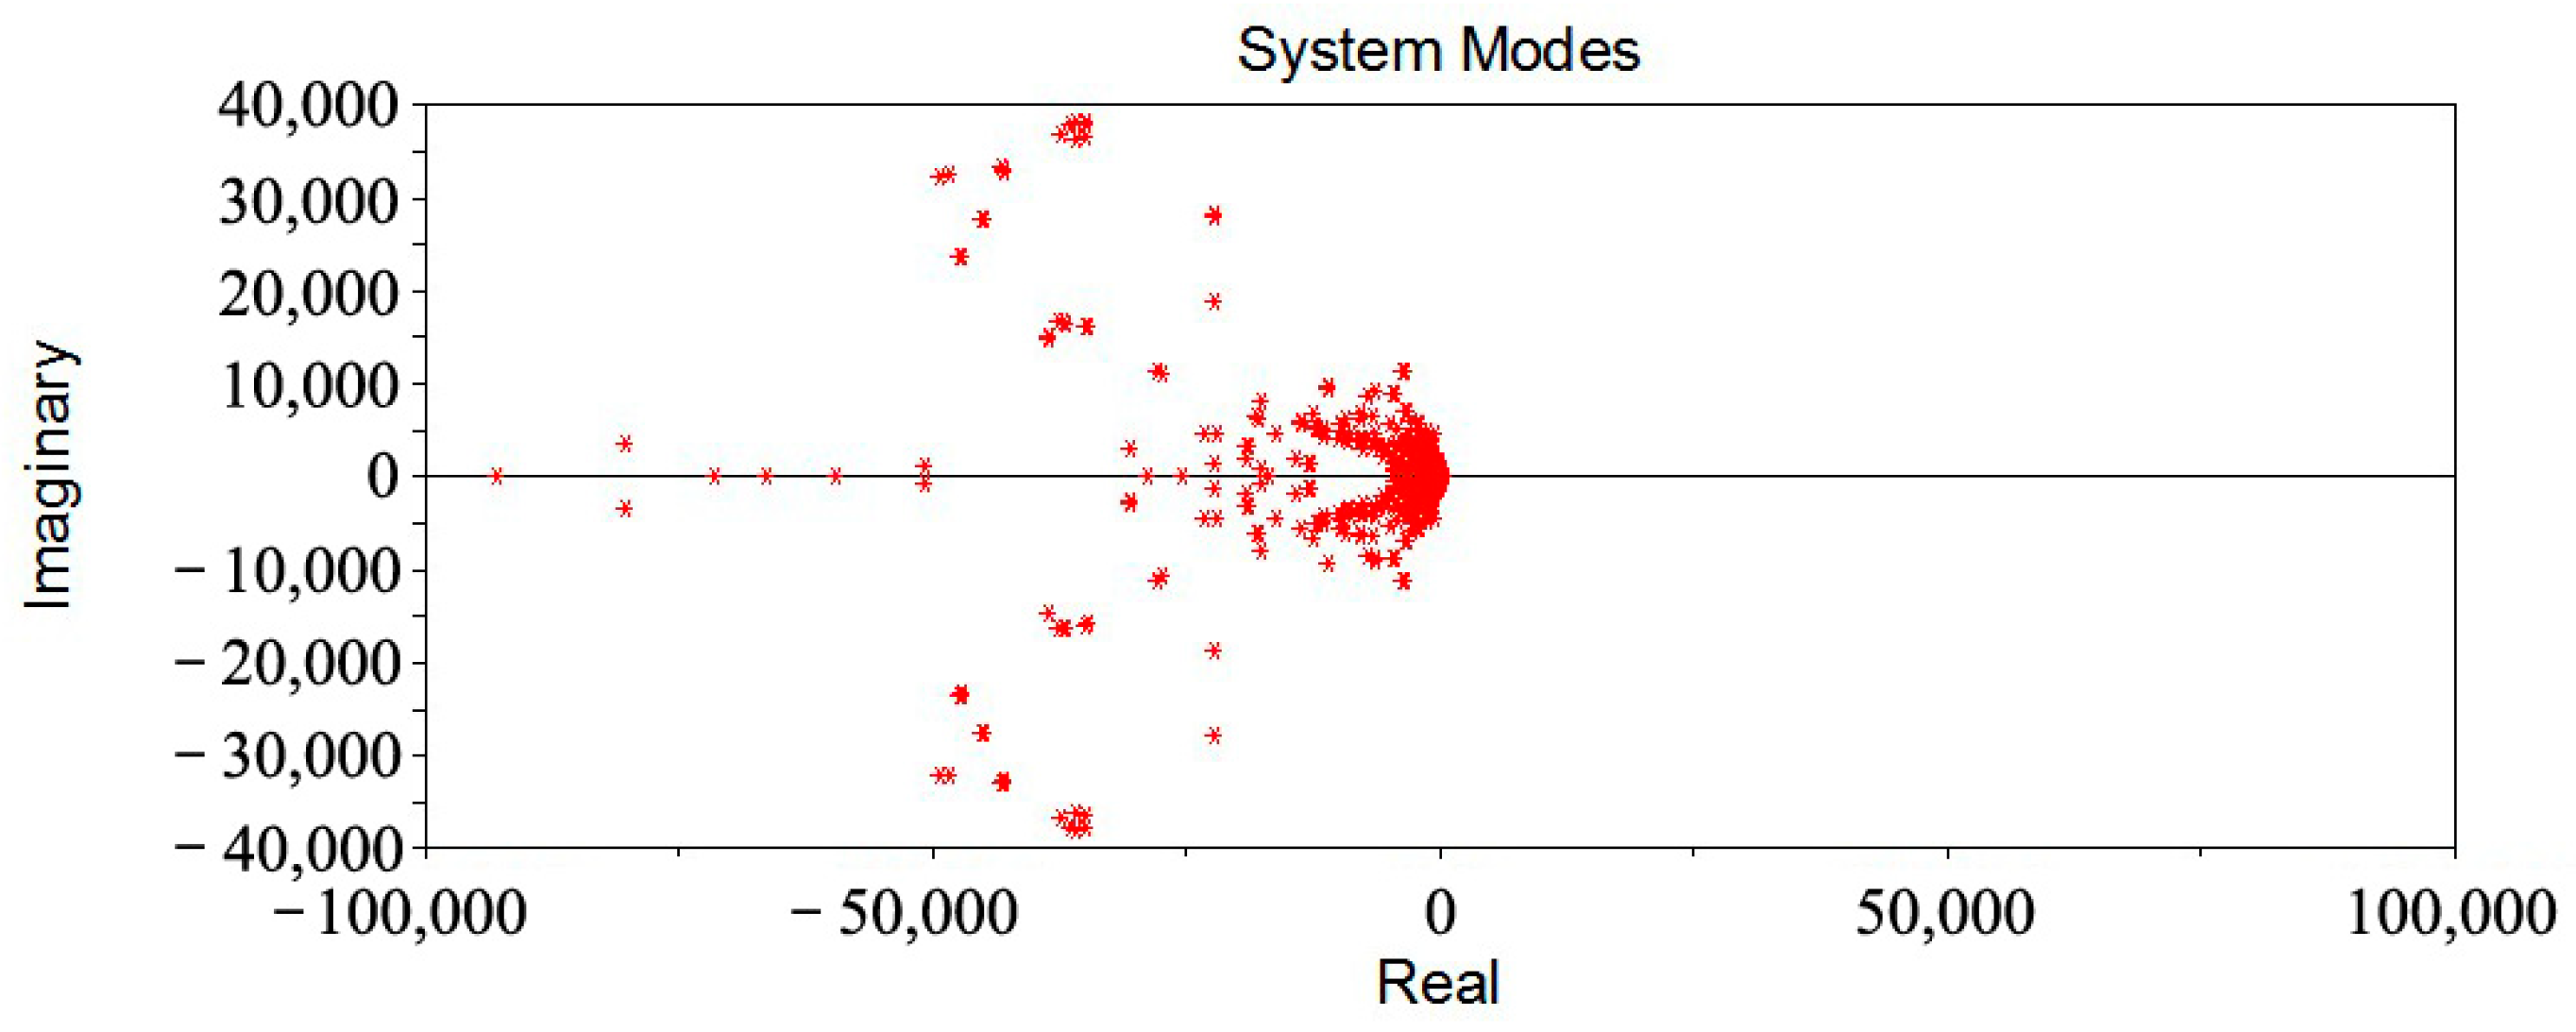
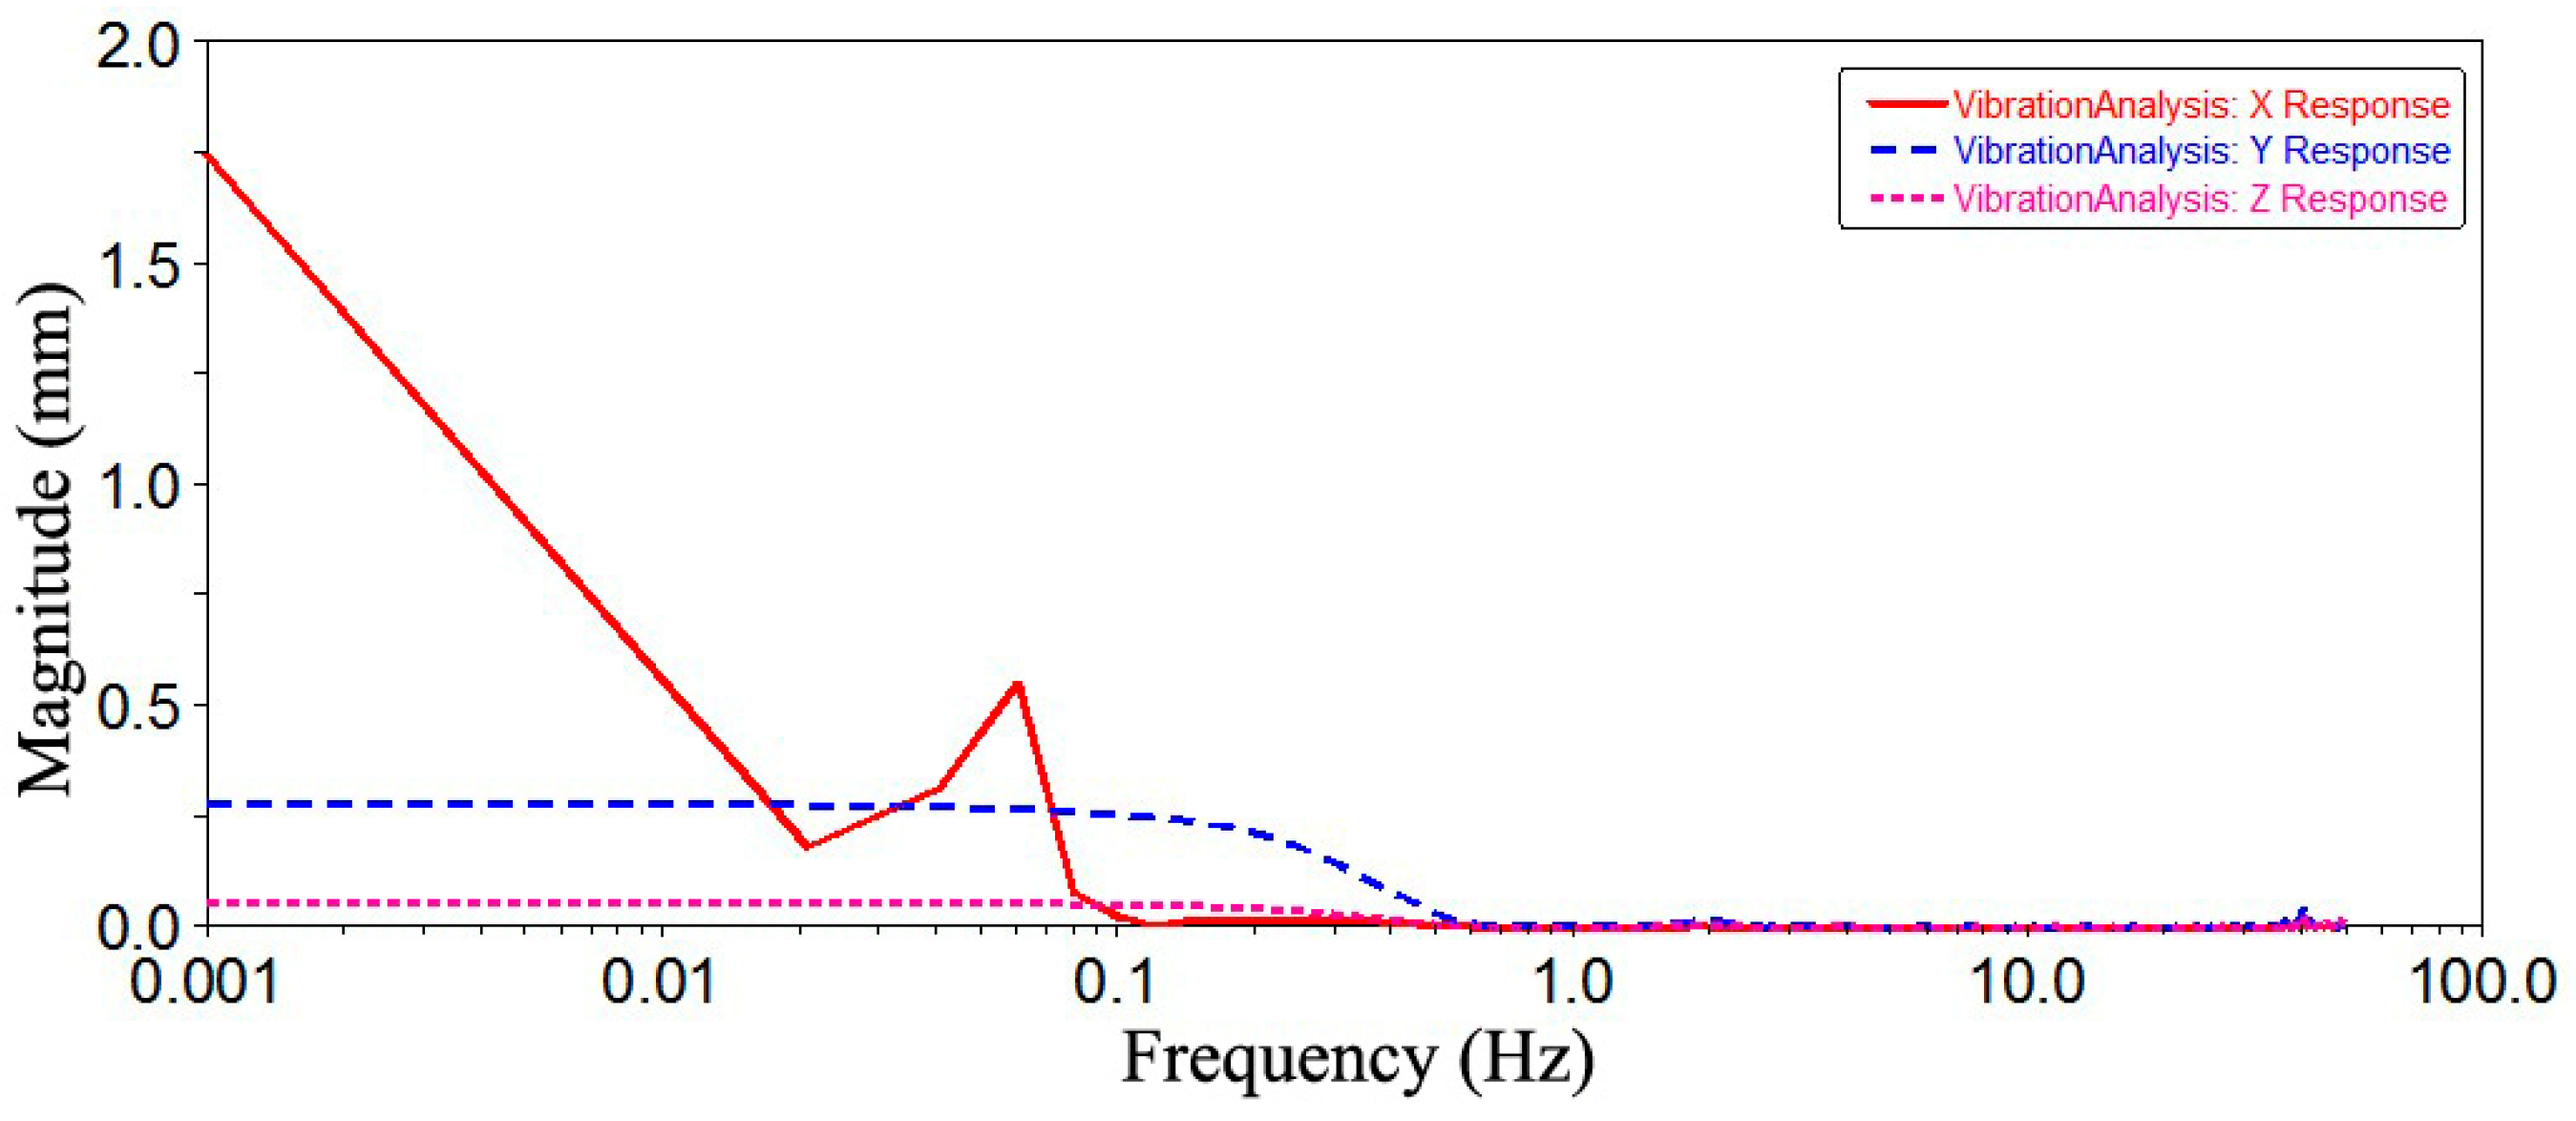
(1) A physical–mechanical property testing system for coal seams containing gangue was established to measure their physical–mechanical indicators and simulate instantaneous dynamic loads on shearers under such conditions. A rigid-flexible coupling virtual prototype model of the shearer was developed. Dynamic simulation results indicated that the maximum stress on the output shaft of the cutting unit is 548.4057 MPa, located at the spline undercut groove connecting the output shaft with the low-speed heavy-load gear at the output end. The vibration was the most severe at the meshing region between the output shaft and the low-speed heavy-load gear at the cutting unit output end, with a maximum displacement response of 1.7515 mm. Additionally, system modal frequencies were obtained, providing data support for reliability and the reliability sensitivity analysis of the output shaft.
(2) Using resonance failure criteria combined with neural networks, the stress reliability, frequency reliability, and amplitude reliability of the output shaft were analyzed. Considering the combined effects of correlated failure modes, the reliability of the output shaft was determined to be 0.6047, and the effects of design variables on output shaft reliability were analyzed.
(3) Structural evolutionary algorithms were applied to optimize the reliability state function of the output shaft, considering correlated failure modes. After optimization, rigid-flexible coupling dynamic simulation showed that the maximum stress of the output shaft decreased to 471.2841 MPa, a reduction of 14.06% compared to before optimization. The maximum stress has decreased significantly, and the stress concentration has been improved. The natural frequency of the output shaft increased, and the amplitude decreased to 1.2062 mm, a reduction of 31.13%. The reliability of the output shaft improved significantly from 0.6047 to 0.9860, and the reliability sensitivity of design variables decreased. For future research, intelligent optimization algorithms such as Cat Swarm Optimization (CSO) and Ant Colony Optimization (ACO) will be considered to achieve faster convergence and more efficient solutions.

Author Contributions

Conceptualization, J.F. and L.Z.; formal analysis, J.F.; funding acquisition, J.F.; investigation, J.F. and L.Z. All authors have read and agreed to the published version of the manuscript.

Funding

This work was supported by the National Natural Science Foundation of China (Grant NO. 51674134), the fundamental research funds for the universities of Liaoning province (Grant NO. LJKQZ20222448), and the fundamental research funds for the universities of Liaoning province (Grant NO. LJ212410144076, LJ232410144074).

Data Availability Statement

The raw data supporting the conclusions of this article will be made available by the authors on request.

Acknowledgments

We have ensured that all individuals listed in this section have agreed to this acknowledgment; we thank the editors and the anonymous reviewers for their valuable comments and suggestions.

Conflicts of Interest

The authors declare no conflicts of interest.

References

  1. Ma, L. Research on Thin Seam Shearer Reliability and Fatigue Life. Ph.D. Thesis, Liaoning Technical University, Fuxin, China, 2013; pp. 18–37. [Google Scholar]
  2. Zhang, J. Research of Shear Wheel Box Optimization Based on PSO Algorithm. Coal Mine Mach. 2015, 36, 204–205. [Google Scholar]
  3. Zhang, B. Analysis and Improvement Design of Fracture Problem of Secondary Planetary Frame in the Cutting Section of Coal Mining Machine. Mech. Manag. Dev. 2024, 39, 218–219+222. [Google Scholar]
  4. Mao, J.; Miao, L.; Xie, M. Research on Dynamics Characteristics and Reliability of Shearer Cutting Unit. J. Mech. Strength 2015, 37, 880–885. [Google Scholar]
  5. Sun, F. Dynamics Analysis and Reliability Research of Shearer Picks Based on ANSYS/LS-DYNA. Ph.D. Thesis, Northeastern University, Shenyang, China, 2015; pp. 20–41. [Google Scholar]
  6. Lei, M.; Zhang, Y. Optimization Design of Key Parts of Coal Winning Machine Cutting Part Based on Finite Element. J. Shanxi Datong Univ. (Nat. Sci.) 2016, 32, 57–60. [Google Scholar]
  7. Lin, X. A Thesis Submitted to Chongqing University in Partial Fulfillment of the Requirement for the Master’s Degree of Engineering. Master’s Thesis, Chongqing University, Chongqing, China, 2017. [Google Scholar]
  8. Yilmaz, E.; Erkayaoglu, M. A Discrete Event Simulation and Data-Based Framework for Equipment Performance Evaluation in Underground Coal Mining. Min. Metall. Explor. 2021, 38, 1877–1891. [Google Scholar] [CrossRef]
  9. Qin, D.; Jia, H. Hybrid Dynamic Modeling of Shearer’s Drum Driving System and the Influence of Housing Topological Optimization on the Dynamic Characteristics of Gears. J. Adv. Mech. Des. Syst. Manuf. 2018, 12, AMDSM0020. [Google Scholar] [CrossRef]
  10. Zhang, J. Research on Mechanical Property Analysis and Reliability Evaluation of New Coal Shearer’s Walking Section. Ph.D. Thesis, Northeastern University, Shenyang, China, 2019. [Google Scholar]
  11. Wan, L.; Zhang, X.; Ma, D. Research on Meshing Characteristics of Shearer Walking Wheel Based on Rigid-Flexible Coupling. Math. Probl. Eng. 2020, 2020, 8301086. [Google Scholar] [CrossRef]
  12. Bai, Y.; Chen, H.; Chen, H.; Wang, X.; Li, J. Vibration Analysis and Experimental Verification of Shearer Sliding Shoes Based on Drum Load. Chin. J. Eng. Des. 2021, 28, 358–366. [Google Scholar]
  13. Zhang, Y.; Sun, Z. The Reliability Syllabus of Mechanical Products. J. Mech. Eng. 2014, 50, 14–20. [Google Scholar] [CrossRef]
  14. Zhou, D.; Zhang, X.; Zhang, Y. Reliability Analysis of the Traction Unit of a Shearer Mechanism with Response Surface Method. J. Mech. Sci. Technol. 2017, 31, 4679–4689. [Google Scholar] [CrossRef]
  15. Gao, H.; Chen, J. Intelligent Optimization Design of the Cutting Unit’s Transmission System of a Shearer Based on Robustness. Int. J. Pattern Recognit. Artif. Intell. 2021, 35, 2150010. [Google Scholar] [CrossRef]
  16. Zhu, L.S.; Yuan, C.; Li, H.J.; Huang, J. Dynamic and Gradual Coupled Reliability Analysis of the Transmission System of a Shearer Cutting Arm. Proc. Inst. Mech. Eng. Part O J. Risk Reliab. 2022, 236, 738–750. [Google Scholar] [CrossRef]
  17. Luo, W. Intelligent Extremum Response Surface Optimization Design Method of Flexible Manipulator. Modul. Mach. Tool Autom. Manuf. Tech. 2019, 12, 40–43. [Google Scholar]
  18. Liu, X.; Li, X.; Fu, X.; Yang, X.; Zhang, J. Analysis on the Influence Law of Traction Speed on the Cutting Performance of Coal Containing Hard Concretion. Mech. Ind. 2023, 24, 14. [Google Scholar] [CrossRef]
  19. Xu, Z. Shearer Reliability Prediction Using Support Vector Machine Based on Chaotic Particle Swarm Optimization Algorithm. Mater. Rio De Janeiro 2023, 28, e20230245. [Google Scholar]
  20. Yang, Z. Reliability-Based Sensitivity and Reliability-Based Robust Design for Mechanical Components with Non-Normal Random Variables; Northeastern University: Shenyang, China, 2010. [Google Scholar]
  21. Gao, S.; Yu, Y.; Zhang, Y. Evaluation and Prediction of Rolling Bearing Reliability Based on SSA-RVM. Mach. Des. Manuf. 2024, 7, 368–371. [Google Scholar]
  22. Zhao, L.; Fan, J. Based On Neural Network Reliability Study Of Shearer’s Cutting Part. J. Mech. Strength 2018, 40, 869–874. [Google Scholar]
  23. Lü, C.; Zhang, Y.; Liu, Y.; Zhou, N. Sensitivity analysis for frequency reliability of a random bending vibration system of continuous beam. J. Vib. Shock. 2013, 32, 159–162. [Google Scholar]
  24. Zhu, L. Vibration Analysis and Reliability-Based Robust Design of Large-Scale Compressor Rotor Systems with Multi-Failure Modes; Northeastern University: Shenyang, China, 2012. [Google Scholar]
  25. Zhu, L.; Wang, Q.; Luan, X.; Yuan, C.; Zhang, Y. Time Varying Meshing Stiffness Analysis on Helical Gears Based on the Coupled Slice Theory. J. Vib. Shock. 2022, 41, 66–71+80. [Google Scholar]
  26. Li, G.; Yuan, C.; Wang, S.; Mao, B.; Dong, Z. Structural Design of Compound Hydraulic Swing Cylinder Based on Co-evolution Multi-objective Genetic Algorithm. J. Ship Mech. 2022, 26, 1694–1704. [Google Scholar]
Figure 1. Force analysis of spiral drum.
Symmetry 17 00858 g001
Figure 2. Coal and rock’s physical and mechanical properties test system block diagram.
Symmetry 17 00858 g002
Figure 3. Coal sample with gangue.
Symmetry 17 00858 g003
Figure 4. Coal and rock mechanical properties testing system.
Symmetry 17 00858 g004
Figure 5. Physical characteristics test system.
Symmetry 17 00858 g005
Figure 6. Cutting gear three-way force load curve.
Symmetry 17 00858 g006
Figure 7. Cutting gear three-way torque load curve.
Symmetry 17 00858 g007
Figure 8. Cutting pick load experiment.
Symmetry 17 00858 g008
Figure 9. The VP model of the coupled shearer.
Symmetry 17 00858 g009
Figure 10. The output shaft stress program.
Symmetry 17 00858 g010
Figure 11. The output shaft maximum stress stress curve.
Symmetry 17 00858 g011
Figure 12. The system modal.
Symmetry 17 00858 g012
Figure 13. The output shaft modal pattern.
Symmetry 17 00858 g013
Figure 14. The output shaft displacement response.
Symmetry 17 00858 g014
Figure 15. Output shaft reliability analysis focus area.
Symmetry 17 00858 g015
Figure 16. Output shaft design variable.
Symmetry 17 00858 g016
Figure 17. Output shaft rectangular head neural network training error.
Symmetry 17 00858 g017
Figure 18. Output shaft correlated failure mode—dimensional normalization mean sensitivity.
Symmetry 17 00858 g018
Figure 19. Structure evolution algorithm flow.
Symmetry 17 00858 g019
Figure 20. Optimized output shaft equivalent stress.
Symmetry 17 00858 g020
Figure 21. Mean sensitivity of design variables after optimization.
Symmetry 17 00858 g021
Figure 22. Cutting state of shearer.
Symmetry 17 00858 g022
Figure 23. Industrial test.
Symmetry 17 00858 g023
Figure 24. Technical roadmap.
Symmetry 17 00858 g024
Table 1. The physical and mechanical property index of samples.
IndexCoalCoal with Gangue
Modulus of elasticity (MPa)43883600
Density (kg/m3)13322841
Poisson’s ratio μ0.230.24
Coefficient of robustness f2.04.1
Compressive strength (MPa)17.7135.57
Table 2. The output shaft modal frequency.
Order Frequency/HzOrderFrequency/HzOrderFrequency/HzOrderFrequency/HzOrderFrequency/HzOrderFrequency/Hz
1445.176549.4811635.6416688.7521736.9326775.16
2465.457572.0712650.8817695.2622749.9427785.94
3478.068609.2113660.9918706.6123752.3728797.72
4495.579629.3314678.4819717.1424762.7129808.49
5515.6810631.6315681.4920727.3725764.5930809.58
Table 3. The system modal.
Order Frequency/HzOrderFrequency/HzOrderFrequency/HzOrderFrequency/HzOrderFrequency/HzOrderFrequency/Hz
10.35640.141188.1016133.1021271.22263268.13
20.50749.081288.9817203.3122282.20273253.34
32.92850.471397.3718217.40231244.64282277.64
43.37960.6514101.1419220.6824313.18292280.31
538.041085.2715103.5120256.0025320.2230327.35
Table 4. Output shaft characteristics of rectangular head design variable.
RegionDesign VariableMean/mmVariance Distribution Type
Region oneRza350.175Gaussian
Dza2401.200Gaussian
Lza490.245Gaussian
Region twoDzb2731.365Gaussian
Lzb1130.565Gaussian
Region threeRzc350.175Gaussian
Lzc960.480Gaussian
Table 5. Subscripts and definitions.
SubscriptsDefinitions
zaylRegional 1 stress
zbylRegional 2 stress
zcylRegional 3 stress
zylOutput shaft stress
zplOutput shaft frequency
zzfOutput shaft amplitude
zazfRegional 1 amplitude
zbzfRegional 2 amplitude
zczfRegional 3 amplitude
Table 6. Output shaft Latin sample.
SampleRza (mm)Dza (mm)Lza (mm)Dzb (mm)Lzb (mm)Rzc (mm)Lzc (mm)
134.8459250.112149.0102273.4581108.469334.047995.1476
234.7626238.285349.7328275.8245114.061736.185494.8223
335.8330242.269146.1902272.9943111.723133.592597.1696
435.2010241.691250.0227266.9560116.080736.164094.8766
................................................
6434.7151243.510051.1747271.5674111.857835.524398.2594
Table 7. System optimal design variables.
Design VariableRza (mm)Dza (mm)Lza (mm)Dzb (mm)Lzb (mm)Rzc (mm)Lzc (mm)
Initial value35240492731133596
Predicted value362524228612136.5110
Table 8. Optimized modal frequency.
Order Frequency/HzOrderFrequency/HzOrderFrequency/HzOrderFrequency/HzOrderFrequency/HzOrderFrequency/Hz
1628.376703.2811796.4916892.3921990.46261150.88
2649.607718.8112824.1717915.57221023.25271173.93
3660.828720.0513831.0718948.63231047.21281192.07
4683.619746.7614850.4819966.47241060.71291233.34
5697.8410774.8315876.6120984.39251104.15301268.70
Table 9. The dynamic indicators.
Dynamics Index Maximum Stress (MPa)Amplitude (mm)
Before optimization548.40571.7515
Post-optimization471.28411.2062
Optimization quantity−77.1216−0.5453
Before optimization14.06%31.13%
Disclaimer/Publisher’s Note: The statements, opinions and data contained in all publications are solely those of the individual author(s) and contributor(s) and not of MDPI and/or the editor(s). MDPI and/or the editor(s) disclaim responsibility for any injury to people or property resulting from any ideas, methods, instructions or products referred to in the content.

