Article

GGD-YOLOv8n: A Lightweight Architecture for Edge-Computing-Optimized Allergenic Pollen Recognition with Cross-Scale Feature Fusion

1
School of Information Engineering, Inner Mongolia University of Technology, Hohhot 010051, China
2
Inner Mongolia Key Laboratory of Radar Technology and Application, Hohhot 010051, China
3
School of Economics and Management, Inner Mongolia University of Technology, Hohhot 010051, China
4
School of Energy and Power Engineering, Inner Mongolia University of Technology, Hohhot 010051, China
*
Author to whom correspondence should be addressed.
Symmetry 2025, 17(6), 849; https://doi.org/10.3390/sym17060849
Submission received: 24 April 2025 / Revised: 22 May 2025 / Accepted: 26 May 2025 / Published: 29 May 2025
(This article belongs to the Special Issue Symmetry/Asymmetry in Evolutionary Computation and Machine Learning)

Abstract

Pollen allergy has emerged as a critical global health challenge. Proactive pollen monitoring is imperative for safeguarding susceptible populations through timely preventive interventions. Current manual detection methods suffer from inherent limitations: notably, suboptimal accuracy and delayed response times, which hinder effective allergy management. Therefore, we present an automated pollen concentration detection system integrated with a novel GGD-YOLOv8n model (Ghost-generalized-FPN-DualConv-YOLOv8), which was specifically designed for allergenic pollen species identification. The methodological advancements comprise three components: (1) combining the C2f convolution in Backbone with the G-Ghost module, this module generates features through half-convolution operations and half-symmetric linear operations, enhancing the extraction and expression capabilities of detailed feature information. (2) The conventional neck network is replaced with a GFPN architecture, facilitating cross-scale feature aggregation and refinement. (3) Standard convolutional layers are substituted with DualConv, thereby reducing model complexity by 22.6% (parameters) and 22% GFLOPs (computational load) while maintaining competitive detection accuracy. This systematic optimization enables efficient deployment on edge computing platforms with stringent resource constraints. The experimental validation substantiates that the proposed methodology outperforms the baseline YOLOv8n model, attaining a 5.4% increase in classification accuracy accompanied by a 4.7% enhancement in mAP@50 metrics. When implemented on Jetson Nano embedded platforms, the system demonstrates computational efficiency with an inference latency of 364.9 ms per image frame, equating to a 22.5% reduction in processing time compared to conventional implementations. The empirical results conclusively validate the dual superiority in detecting precision and operational efficacy when executing microscopic pollen image analysis on resource-constrained edge computing devices; they establish a feasible algorithm framework for automated pollen concentration monitoring systems.

1. Introduction

Pollen allergy, a clinically significant allergic disorder, has demonstrated a marked escalation in global prevalence over recent decades [1,2]. Recognized by the World Health Organization (WHO) as one of the three principal diseases necessitating targeted intervention in the 21st century [2], its epidemiological impact is underscored by data indicating that 15–40% of the global population was affected by pollen allergy as of 2021 [3]. The pathophysiological basis of this condition lies in the interaction between allergenic pollen particles and the mucosal surfaces of the respiratory and ocular systems in sensitized individuals, culminating in heterogeneous clinical manifestations such as allergic rhinitis, asthma, and conjunctivitis [4]. Substantiating the dose–response relationship, Kitinoja et al. quantified that transient exposure to incremental pollen concentrations (10 grains/m3) correlates with a 2% elevation in allergy/asthma incidence and a 7% heightened risk of upper respiratory infections, thereby reinforcing the imperative for environmental monitoring in public health strategies [5].
An essential approach to addressing this issue necessitates effective pollen monitoring. Currently, the standardized methodology for pollen concentration detection predominantly employs manual Hirst-type traps to sample airborne particulates. This protocol requires transporting the Melinex tape, impregnated with pollen grains, to laboratory facilities for cytochemical staining. Qualified analysts subsequently perform microscopic analyses to classify and quantify pollen specimens [6]. Nevertheless, this conventional identification paradigm poses substantial challenges, encompassing laborious procedures and intensive manpower demands [7], and accuracy is difficult to guarantee. These constraints of suboptimal efficiency, variable accuracy, and excessive costs represent critical impediments in modern pollen monitoring systems [8].
Regarding pollen species identification, with the advancements in image processing and machine learning, automatic classification utilizing pollen image features has become feasible and emerged as an effective method for pollen recognition and classification [9]. Sun et al. achieved the classification of the Pollen13k image dataset through an improved d-EfficientNet model with transfer learning [10]. However, their approach only supports single-image classification and cannot handle images containing multiple pollen types [11]. B et al. implemented high-precision pollen detection using an SVM + ANN method, but its excessive reliance on optical hardware and the requirement for separate feature extraction and classification stages resulted in poor real-time performance [12]. Zhao et al. adopted a progressive learning framework, ultimately achieving 88.2% detection accuracy on an eight-species optical pollen dataset from Beijing using models including RetinaNet, VGG, and ResNet. Nevertheless, their proposed model demands substantial computing power, making it challenging for edge deployment [13].
The You Only Look Once (YOLO) architecture series [14], recognized as a paradigm of single-stage object detection frameworks, exhibits superior performance metrics in both computational efficiency and detection precision. These attributes align with the essential criteria for automated pollen identification systems, which require the simultaneous optimization of processing speed and analytical accuracy. Notwithstanding the enhanced recognition capabilities demonstrated by the Swin-transformer-YOLOv5 hybrid model developed by Zhang et al., which achieved state-of-the-art performance in multi-species pollen quantification, its operational feasibility remains constrained by prohibitive computational complexity and an excessive memory footprint, particularly in resource-constrained deployment environments [15]. Parallel investigations by Tan et al. employed a modified YOLOv5 architecture, revealing analogous limitations, with reported detection accuracy rates demonstrating significant interspecies variance: 99% (Gossypium hirsutum), 83% (Arabidopsis thaliana), 85% (Zea mays), 77% (Camellia japonica), and 64% (Rhododendron spp.) [16]. This pronounced performance heterogeneity across target species substantiates the critical need for architectural innovations addressing class-imbalance challenges in pollen detection systems.
The current research demonstrates substantial advancements in deep-learning-driven pollen classification and monitoring systems. Nevertheless, critical challenges persist in operational deployment scenarios. Although the models exhibit enhanced detection accuracy, this achievement is concomitant with prohibitive computational overheads. It is challenging to satisfy the requirements of economic viability, analytical precision, and operational efficiency in field-deployable pollen monitoring systems. In response to these exigencies, the present study proposes GGD-YOLOv8n, a computationally efficient architecture for allergenic pollen detection, engineered through the structural optimization of the YOLOv8n framework. The main outcomes of this study are as follows:
  • The integration of G-Ghost Bottleneck modules with C2f structures forms novel C2f-G-GhostBottleneck blocks, replacing standard backbone C2f modules. This structural modification optimizes conventional CNN architectures through enhanced GPU parallelization, reducing network complexity while preserving detection fidelity.
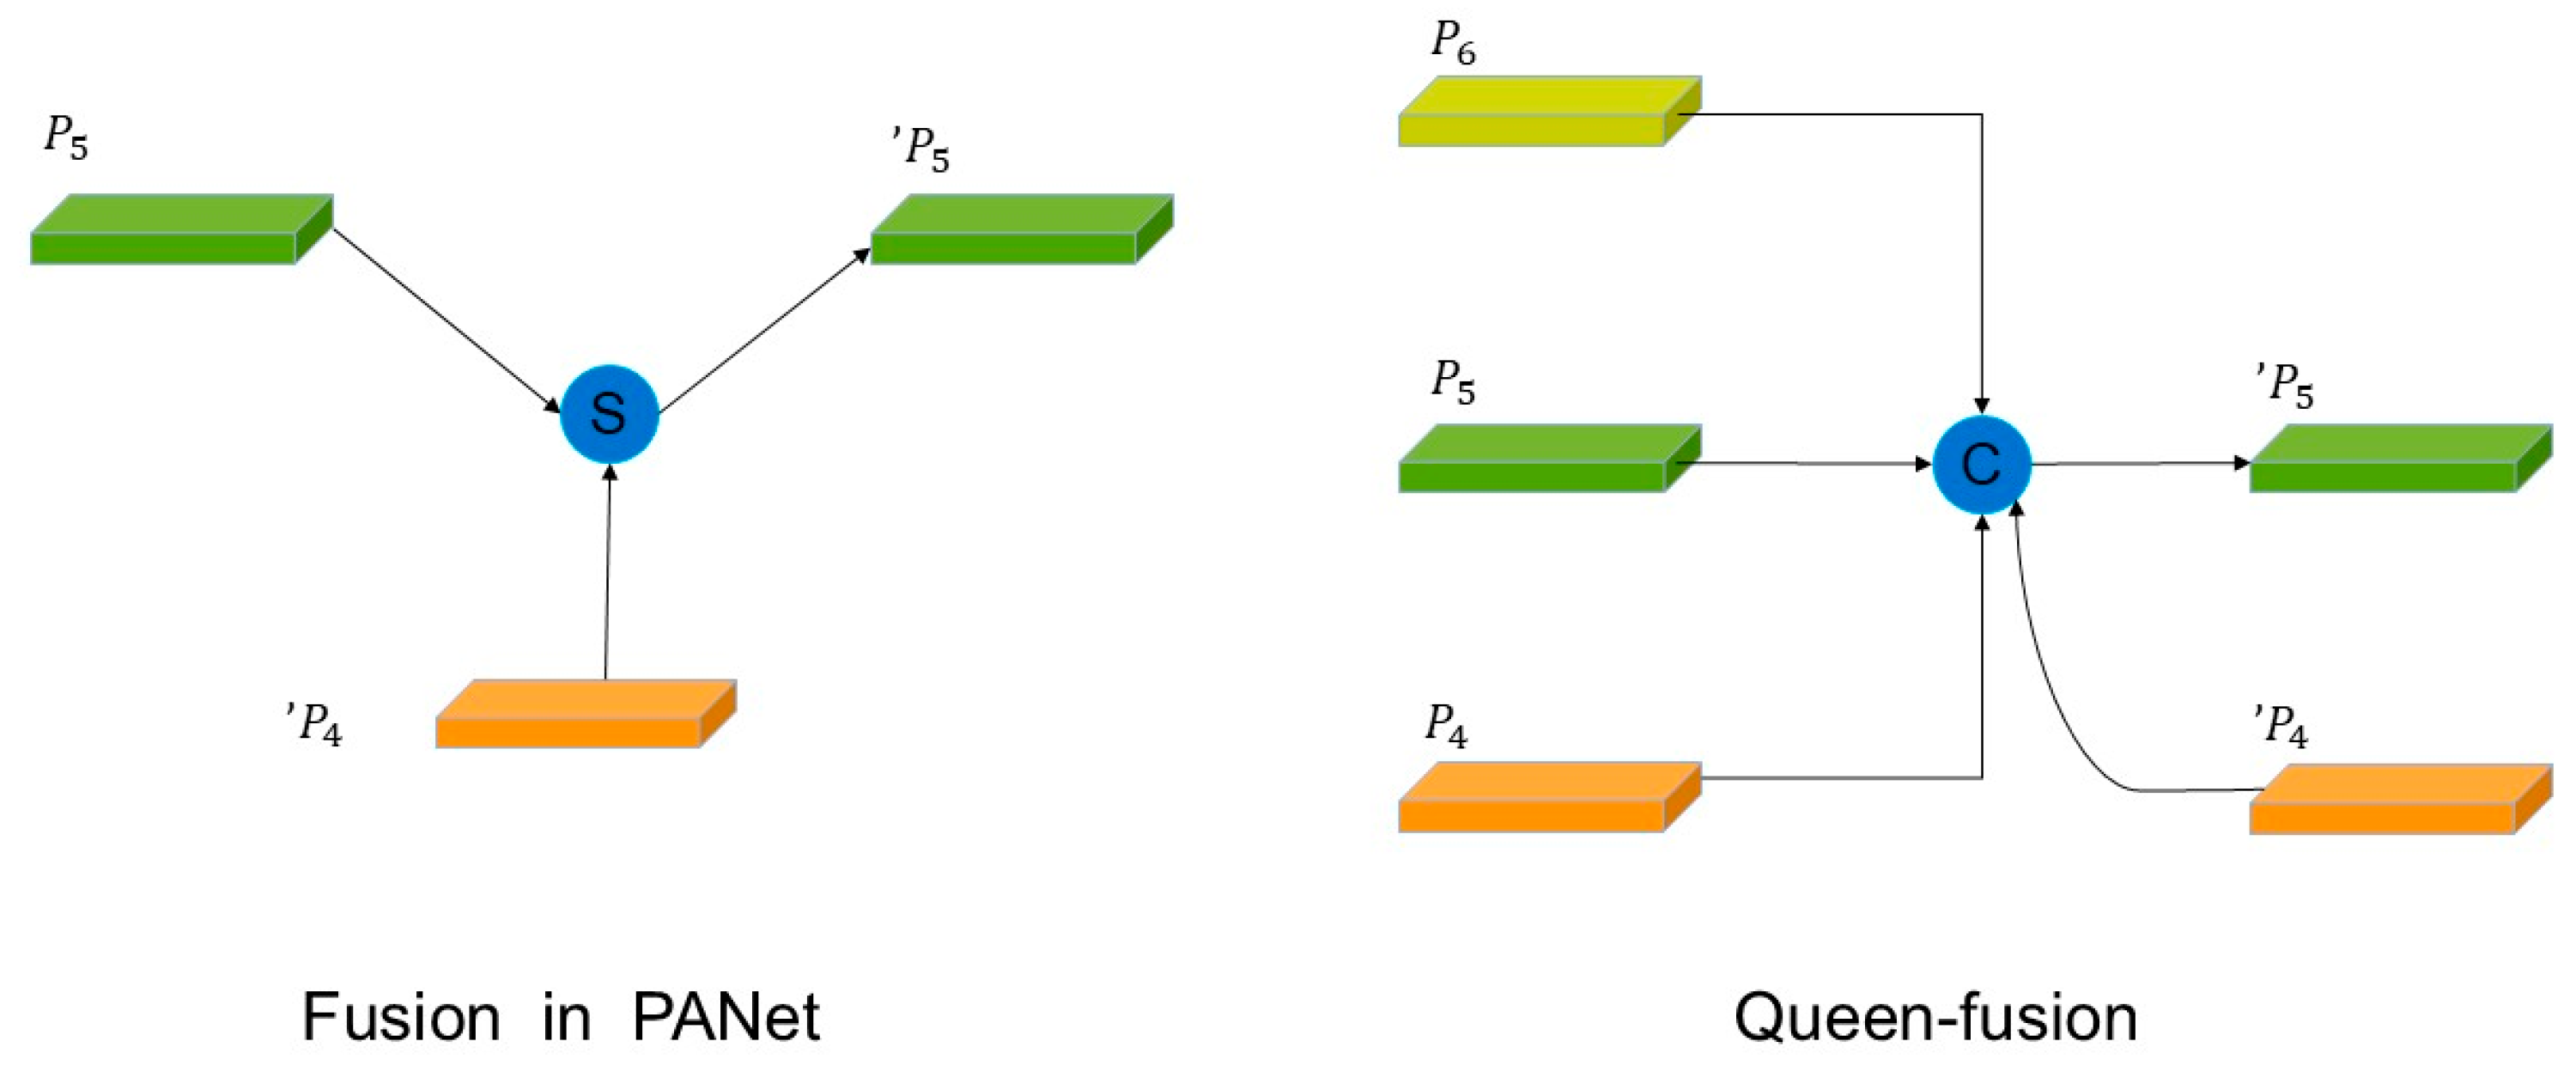
  • The implementation of Generalized-FPN (GFPN) modules from GiraffeDet in detection heads supersedes traditional C2f modules. The GFPN architecture strengthens multi-dimensional pollen feature extraction through skip-connection intra-blocks and cross-scale linkages, improving hierarchical feature integration.
  • Substituting standard Conv layers with DualConv operators, combining the GroupConv and HetConv paradigms, achieves parametric reduction without compromising detection performance, enabling efficient edge deployment.

2. Materials and Methods

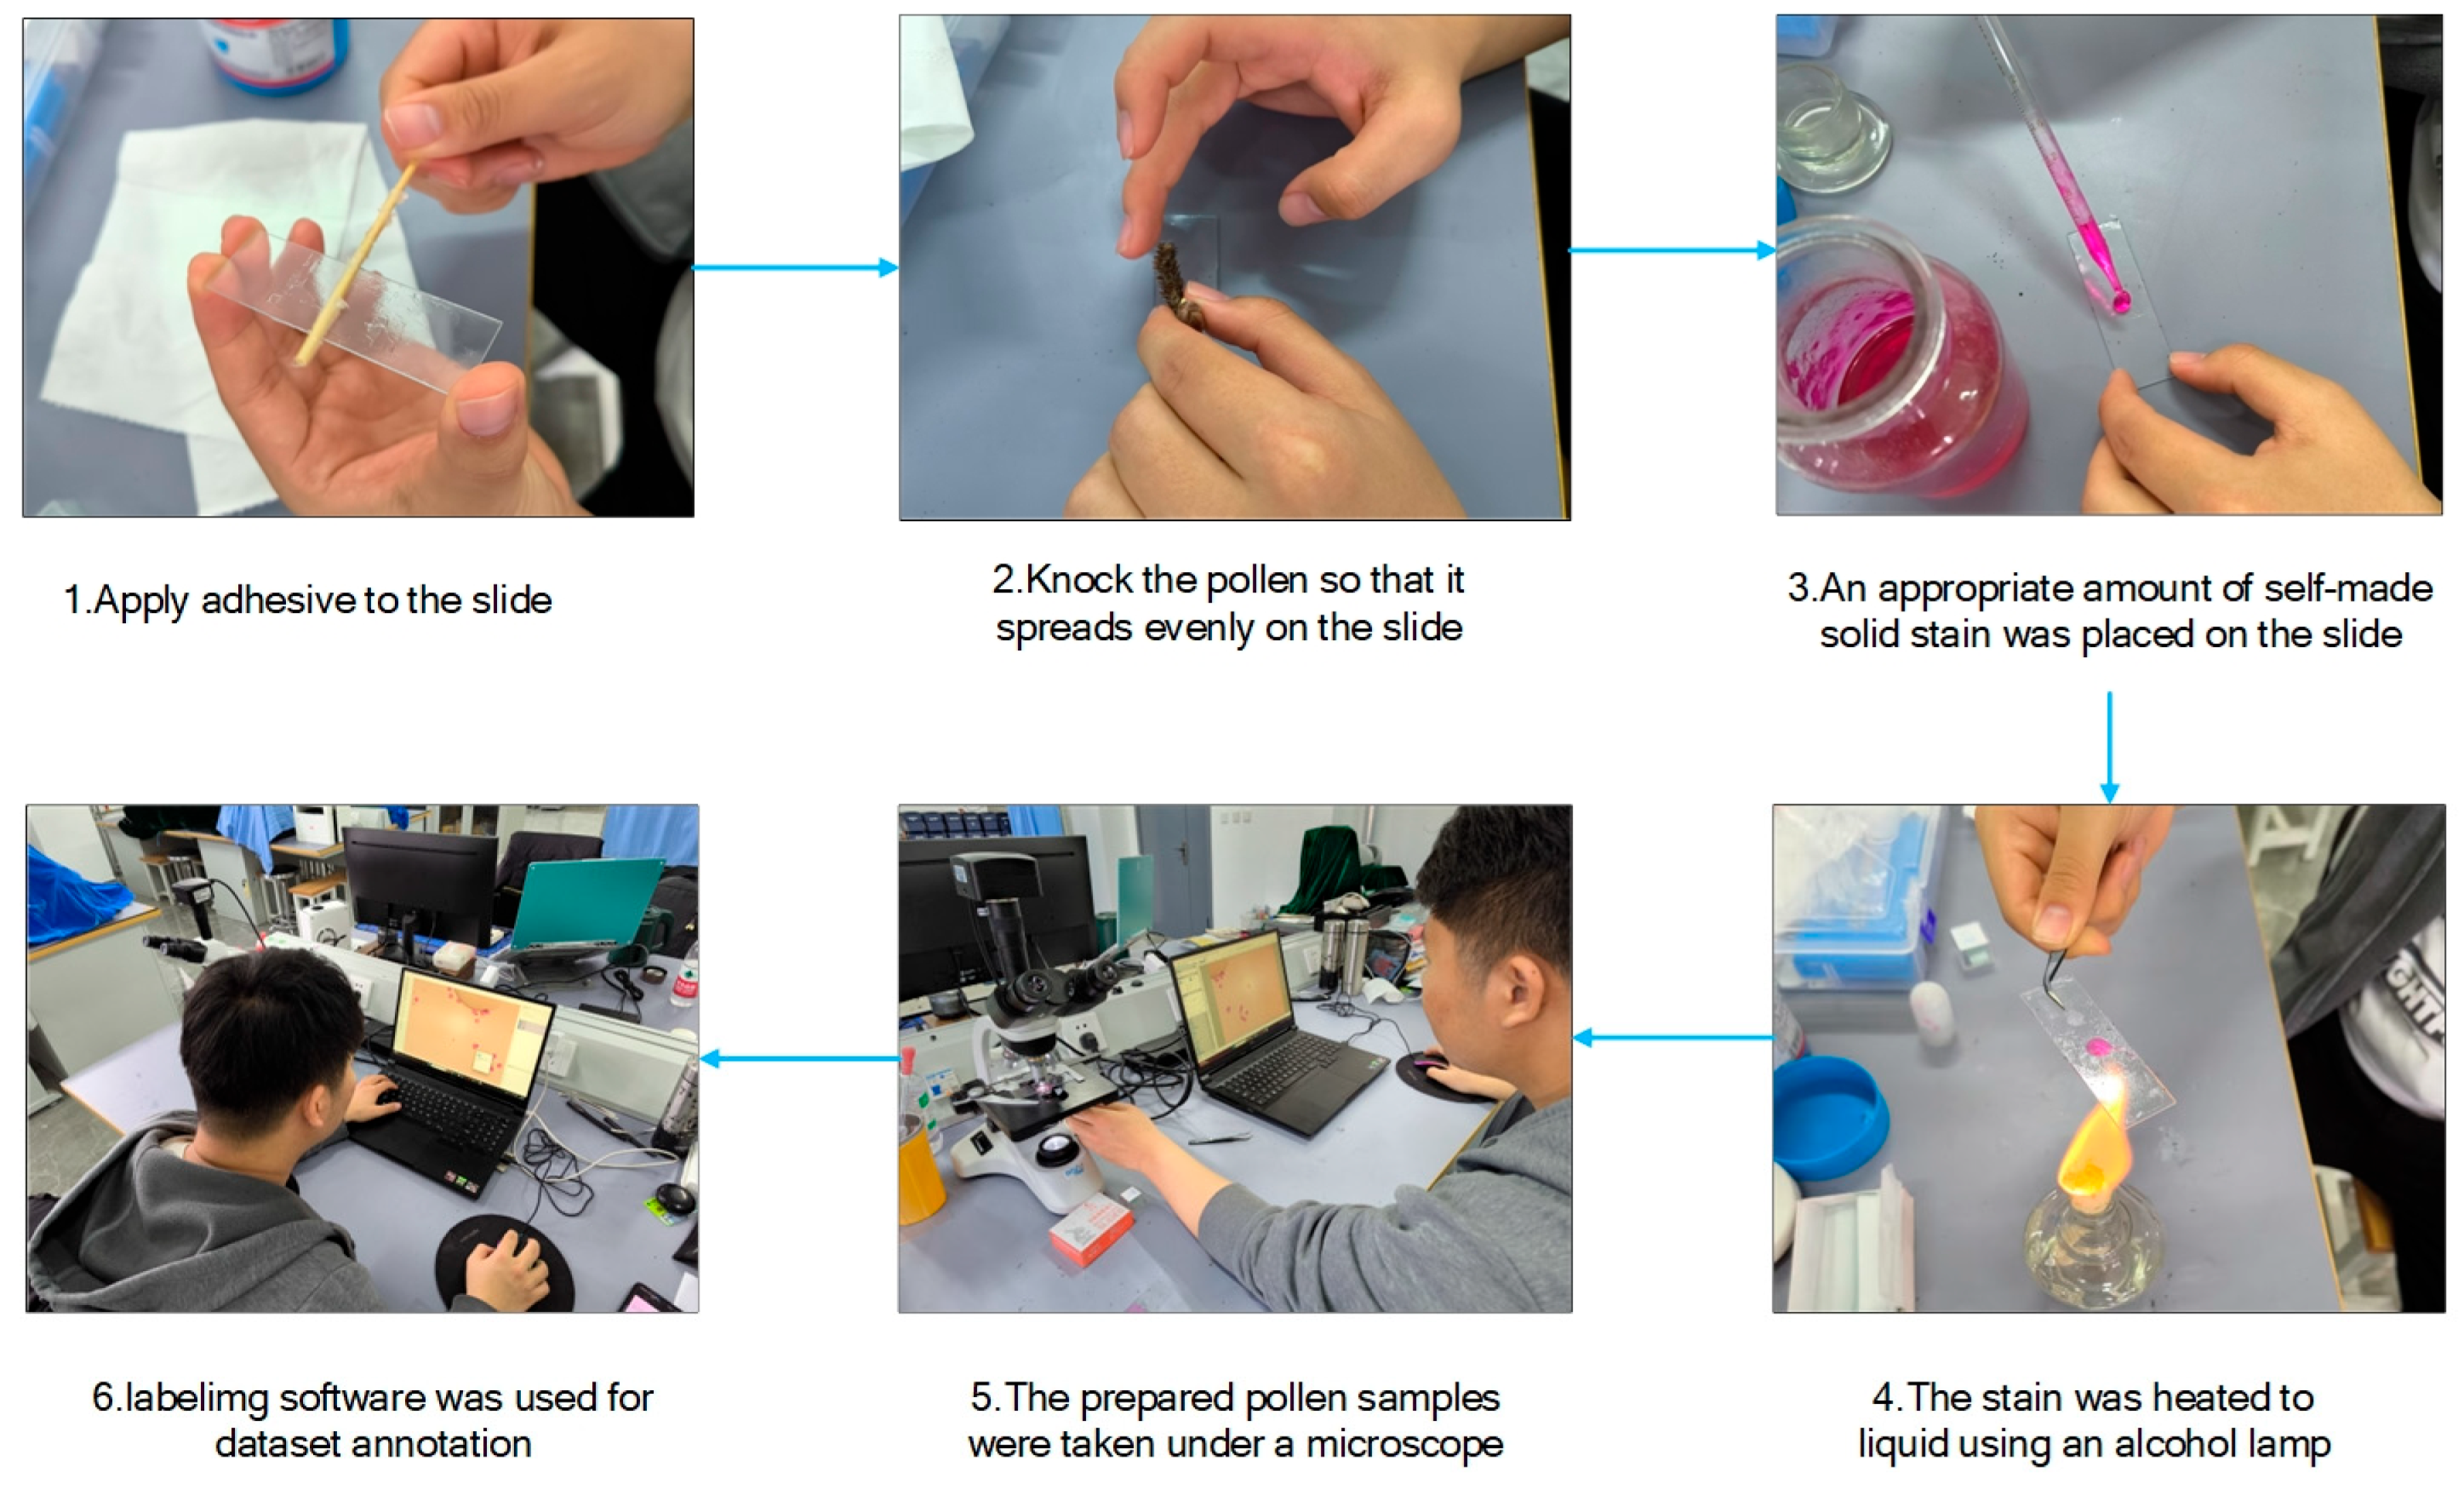
2.1. Image Acquisition and Data and Production

The dataset used in this paper comprises Artemisia, Chenopodium and Ambrosia pollen collected in autumn 2024 in Hohhot, Inner Mongolia. These pollens are the main autumn sensitizers in northern and northwestern China. Some examples of images in the dataset are shown in Figure 1.
The dataset was prepared as shown in the Figure 2. First, a clean slide was prepared and lightly coated with a thin layer of Vaseline as an adhesive, and then the flower parts of the allergenic plants were collected and the stamens were gently touched to spread the pollen evenly on the slide. Then, an appropriate amount of homemade solid stain was applied to the slide and heated with an alcohol lamp until the liquid stained the pollen dataset samples. The samples were photographed on an AOSVI PH50-3M180 camera microscope at 100 × magnification (Produced by AOSVI Optical Instrument Co., Ltd. in Shenzhen City, China). The “Labelimg” software was then used to complete the labelling of the images according to the YOLO format, and, finally, the dataset was divided into a training set and a validation set according to the ratio of 7:3 for network training.
The dataset contains a total of 350 images, each containing several pollen cells, and the distribution of the number of each category is shown in Figure 3.

2.2. Methods

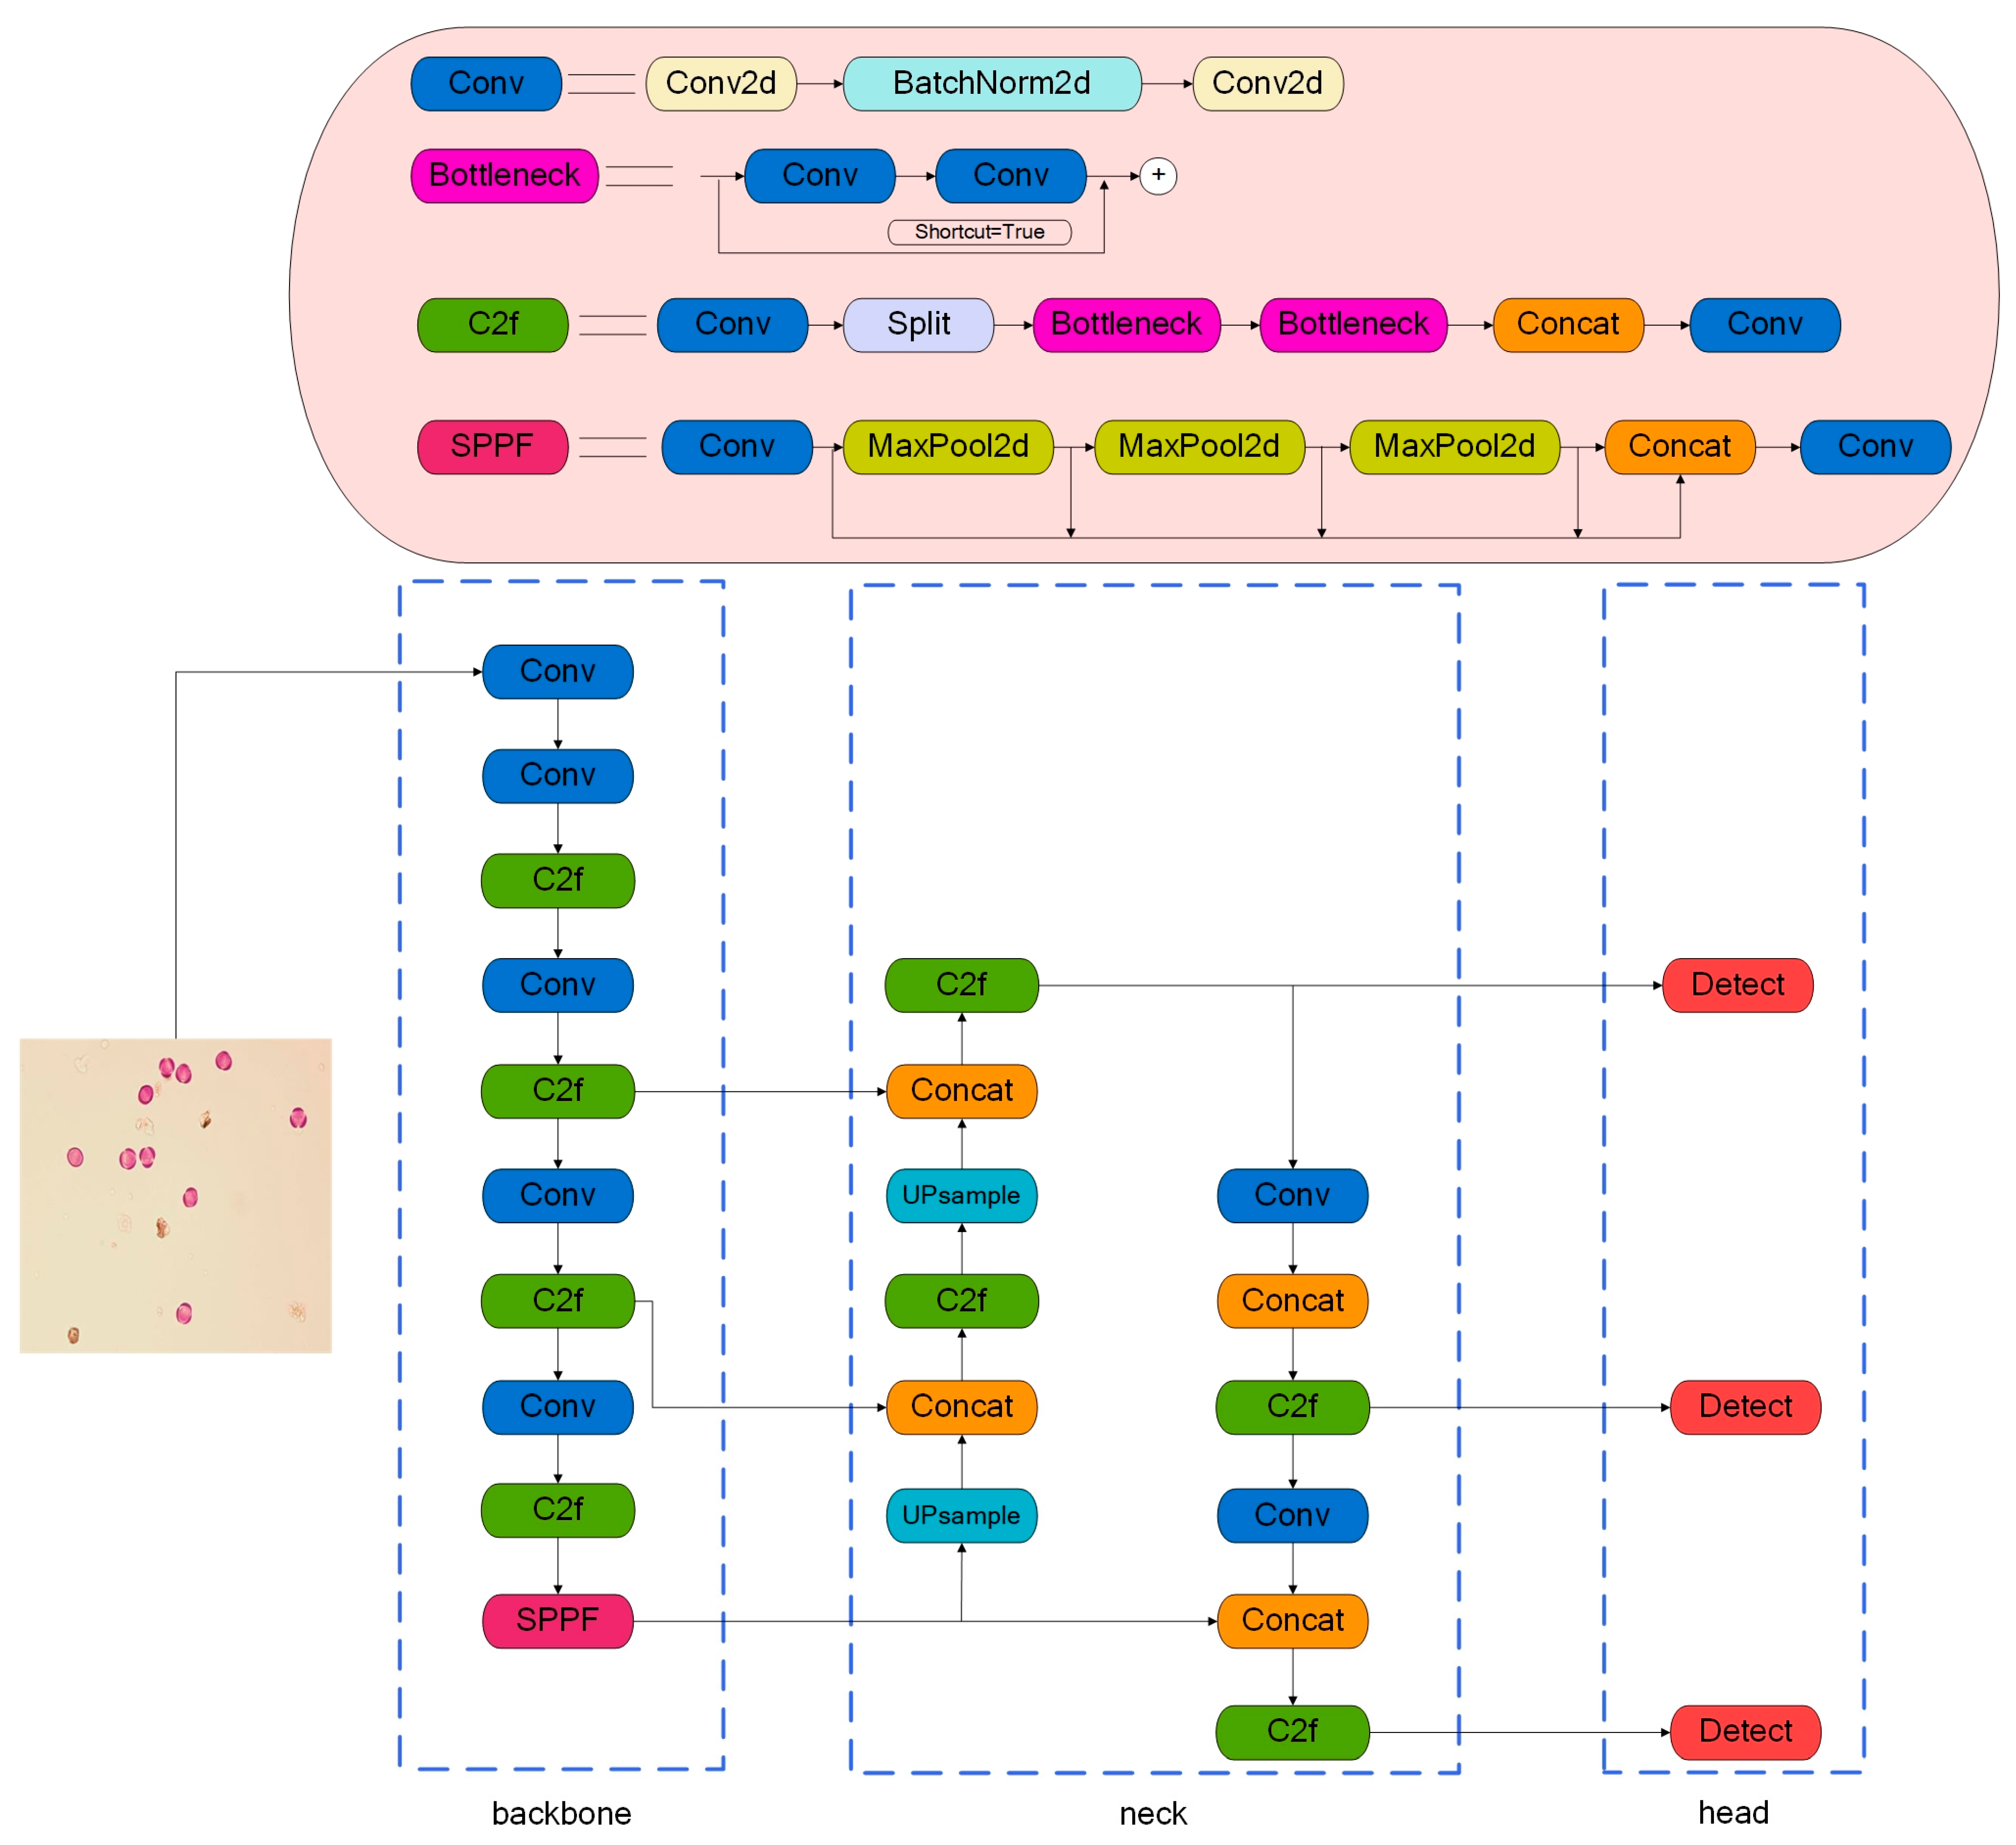
2.2.1. YOLOv8 Network

Based on deep learning, object detection networks are classified into single-stage and two-stage methods. Single-stage object detection methods directly utilize convolutional neural networks to predict the classification and location of objects simultaneously. Representative examples include the YOLO series, SSD [17], and Retina-Net [18]. Two-stage methods employ two network structures. The first stage focuses on identifying the locations of target objects through a region proposal network to obtain the proposed boxes. The second stage concentrates on classifying the proposed boxes using a convolutional neural network to find more precise locations. Typical representatives include SPPNet [19], Faster R-CNN [20], and Mask R-CNN. Due to the simplification of the training process, a reduction in the number of model parameters, and improvements in inference speeds compared to two-stage methods, single-stage methods are more suitable for deployment on mobile devices.
The YOLO series is one of the most advanced object detection algorithms available today. It is known for its speed and excellent portability and has been widely used in various fields. To meet practical requirements, YOLOv8n was selected as the baseline for comparison and improvement in this study. The network architecture of YOLOv8 is illustrated in Figure 4.
YOLOv8 consists of four main parts: input preprocessing, a backbone network, a neck network, and a detection head layer. YOLOv8 adopts a backbone architecture similar to YOLOv5, although some modifications are made in the CSPDarknet53 to 2-stage FPN (C2f) module. The C2f (cross-stage partial bottleneck with two convolutions) module integrates double-convolution cross-stage bottleneck components to optimize feature fusion and gradient flow. This architecture employs two consecutive convolutional layers within each bottleneck unit, followed by cross-stage partial connections that effectively merge high-level semantic features with rich contextual information. By maintaining distinct processing pathways for feature refinement and contextual integration, the C2f module enhances multi-scale representation capabilities while preserving computational efficiency, thereby significantly improving object detection accuracy. The neck network, strategically positioned between the backbone feature extractor and prediction heads, serves as a sophisticated feature aggregator. Typically implemented through architectures such as Feature Pyramid Networks (FPNs) or PANet variants, it systematically combines multi-scale feature maps extracted from different backbone stages. This hierarchical fusion process enables progressive upsampling and lateral connections that preserve spatial details from shallow layers while integrating semantic information from deeper layers. Through carefully designed fusion operations (e.g., concatenation or element-wise addition) and additional convolution blocks, the neck network optimizes feature representations for subsequent detection tasks, particularly enhancing performance for objects of varying scales through multi-resolution feature synthesis. In YOLOv8, the neck network integrates multi-scale features efficiently through the FPN structure [21], which is essential for constructing more comprehensive representations. Additionally, YOLOv8 transitions from the anchor-based approach used in YOLOv5 to an anchor-free approach and replaces the coupled head of YOLOv5 with decoupled heads that handle object detection, classification, and regression tasks independently. This design allows each branch to focus on its specific task, thereby improving the overall model accuracy.

2.2.2. GGD-YOLOv8

The GGD-YOLOv8 (Ghost-generalized-FPN-DualConv-YOLOv8) primarily optimizes the backbone network and detection head. In the backbone network, the C2f module is fused with the G-Ghost bottleneck module to form the C2f-G-Ghost bottleneck module, replacing the original standard C2f module. Within the neck network, the Generalized-FPN module from the GiraffeDet architecture replaces the 2-stage FPN module in the C2f of the target detection head. The original standard Conv in the network is replaced by DualConv. Figure 5 illustrates the design architecture of the GGD-YOLOv8 model.
The following section elaborates on the methods of improvement and the implementation process.

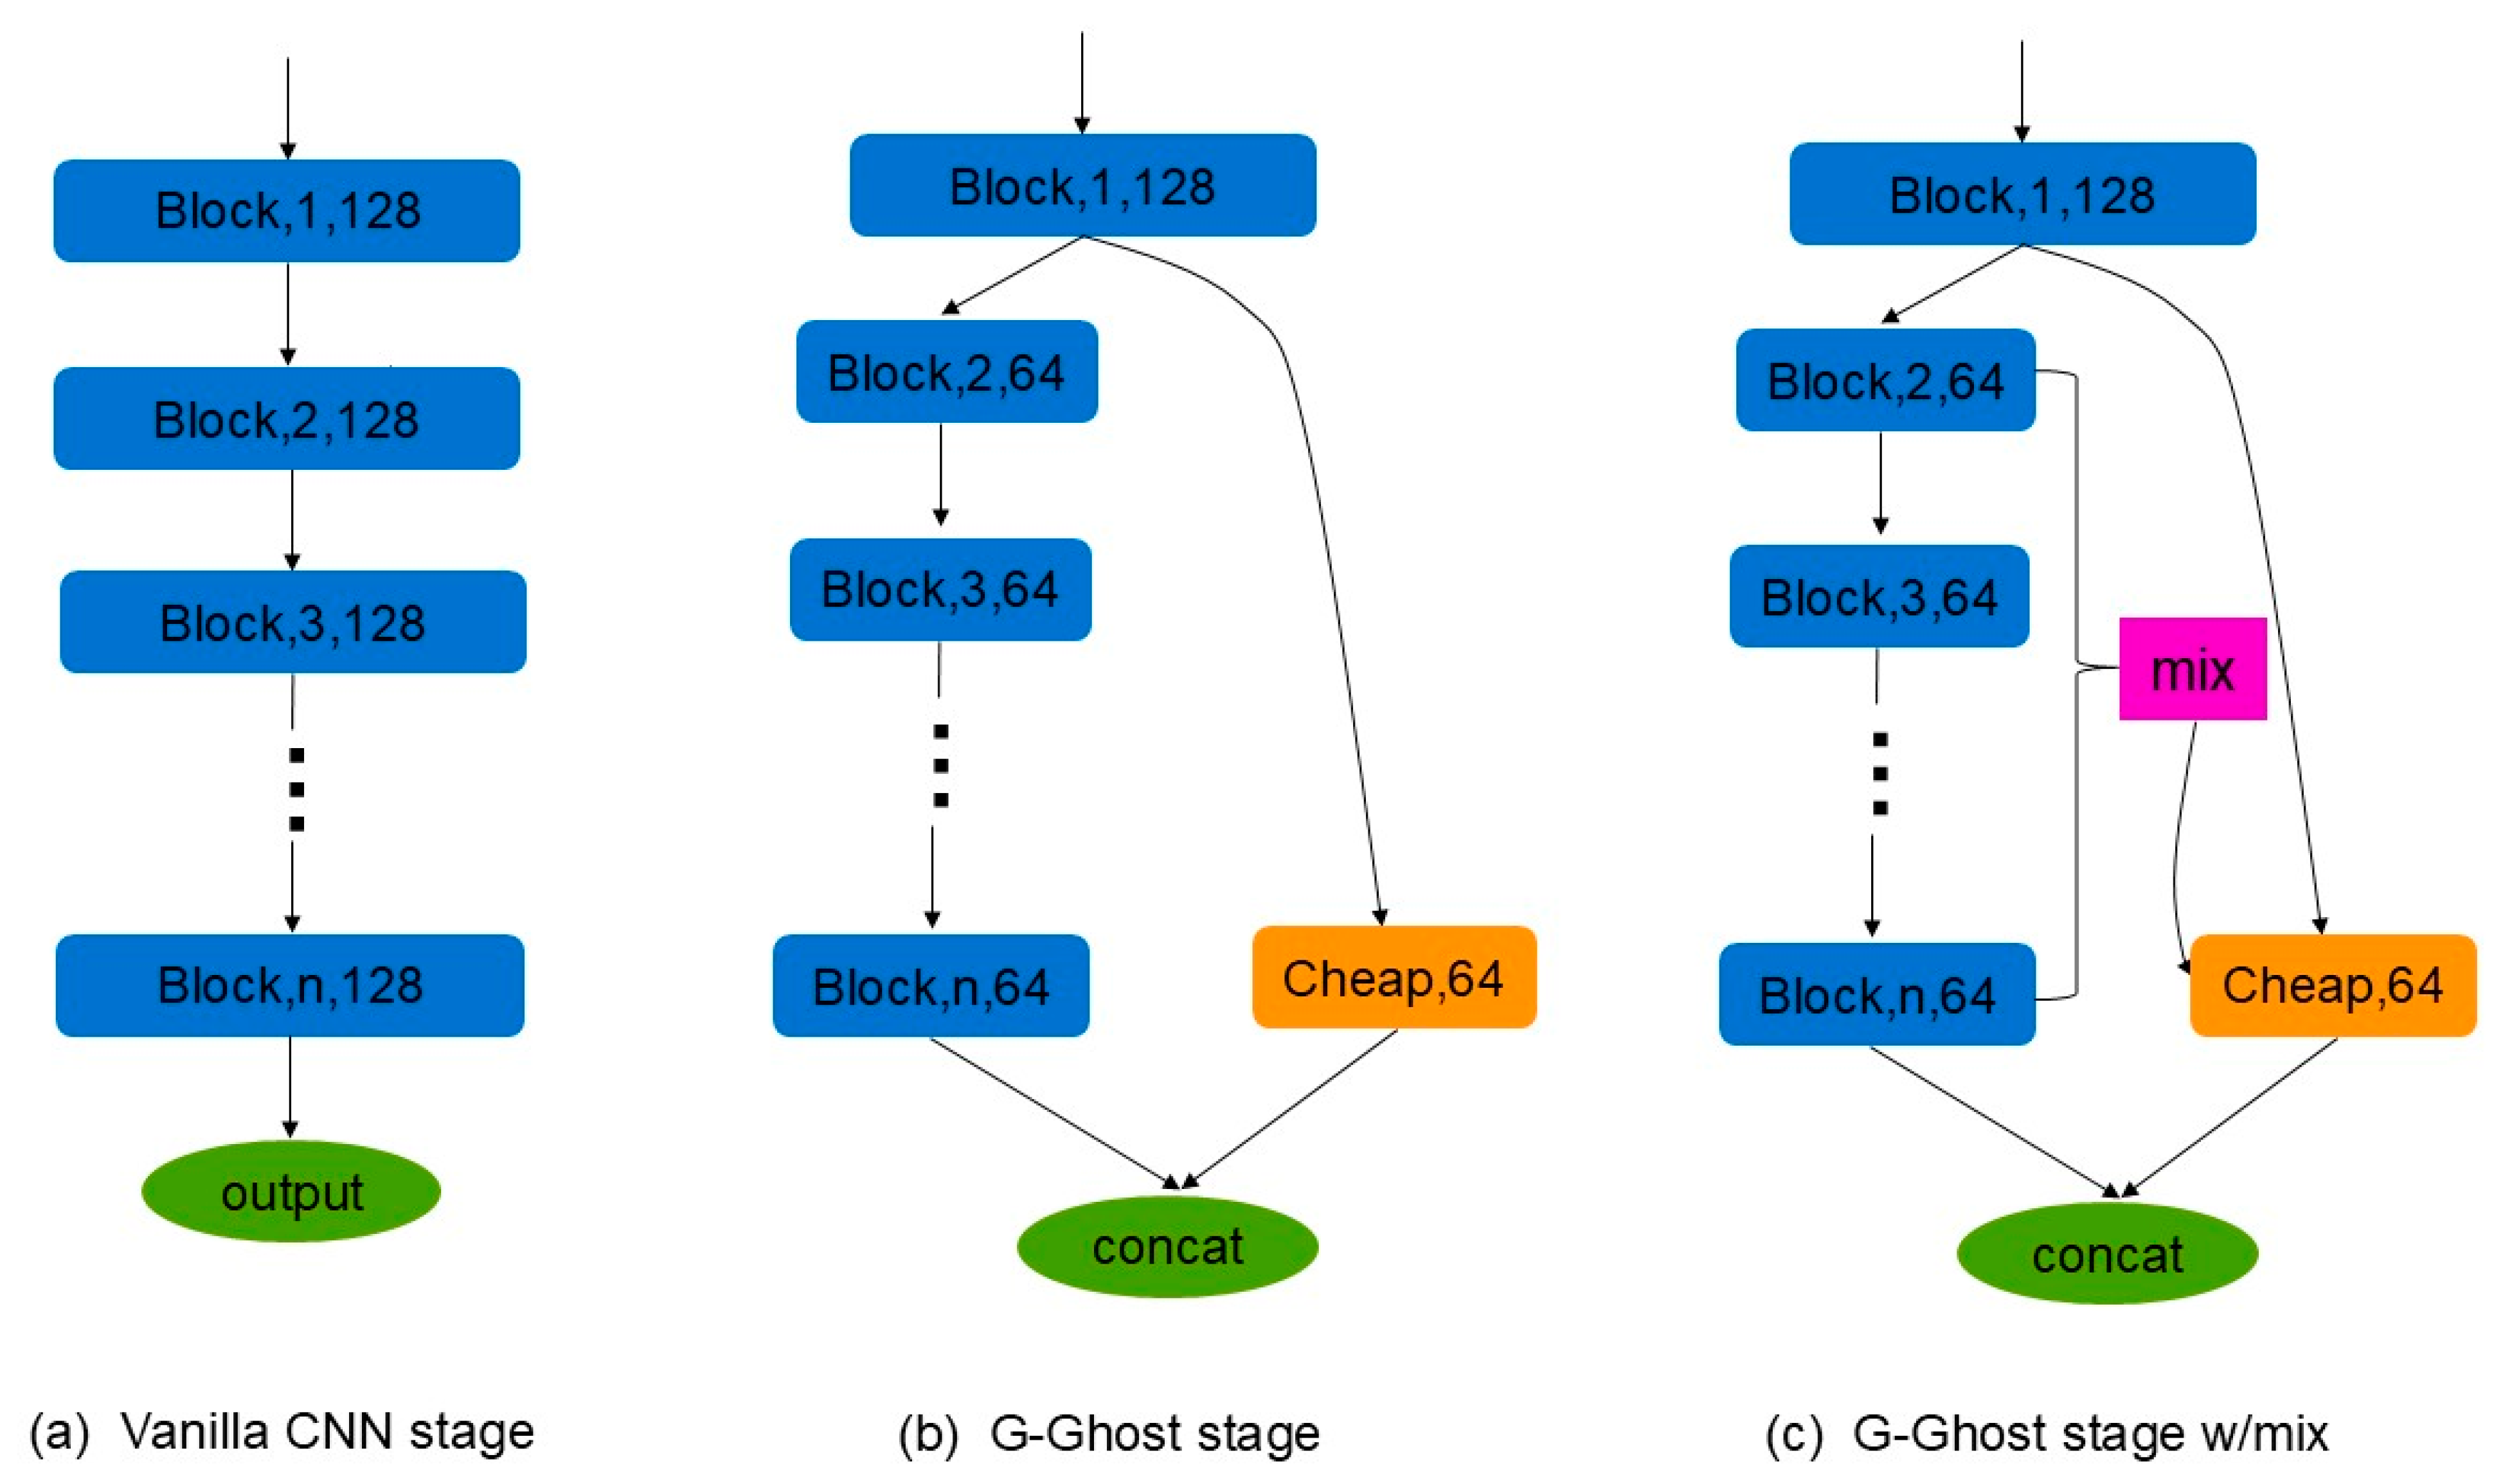
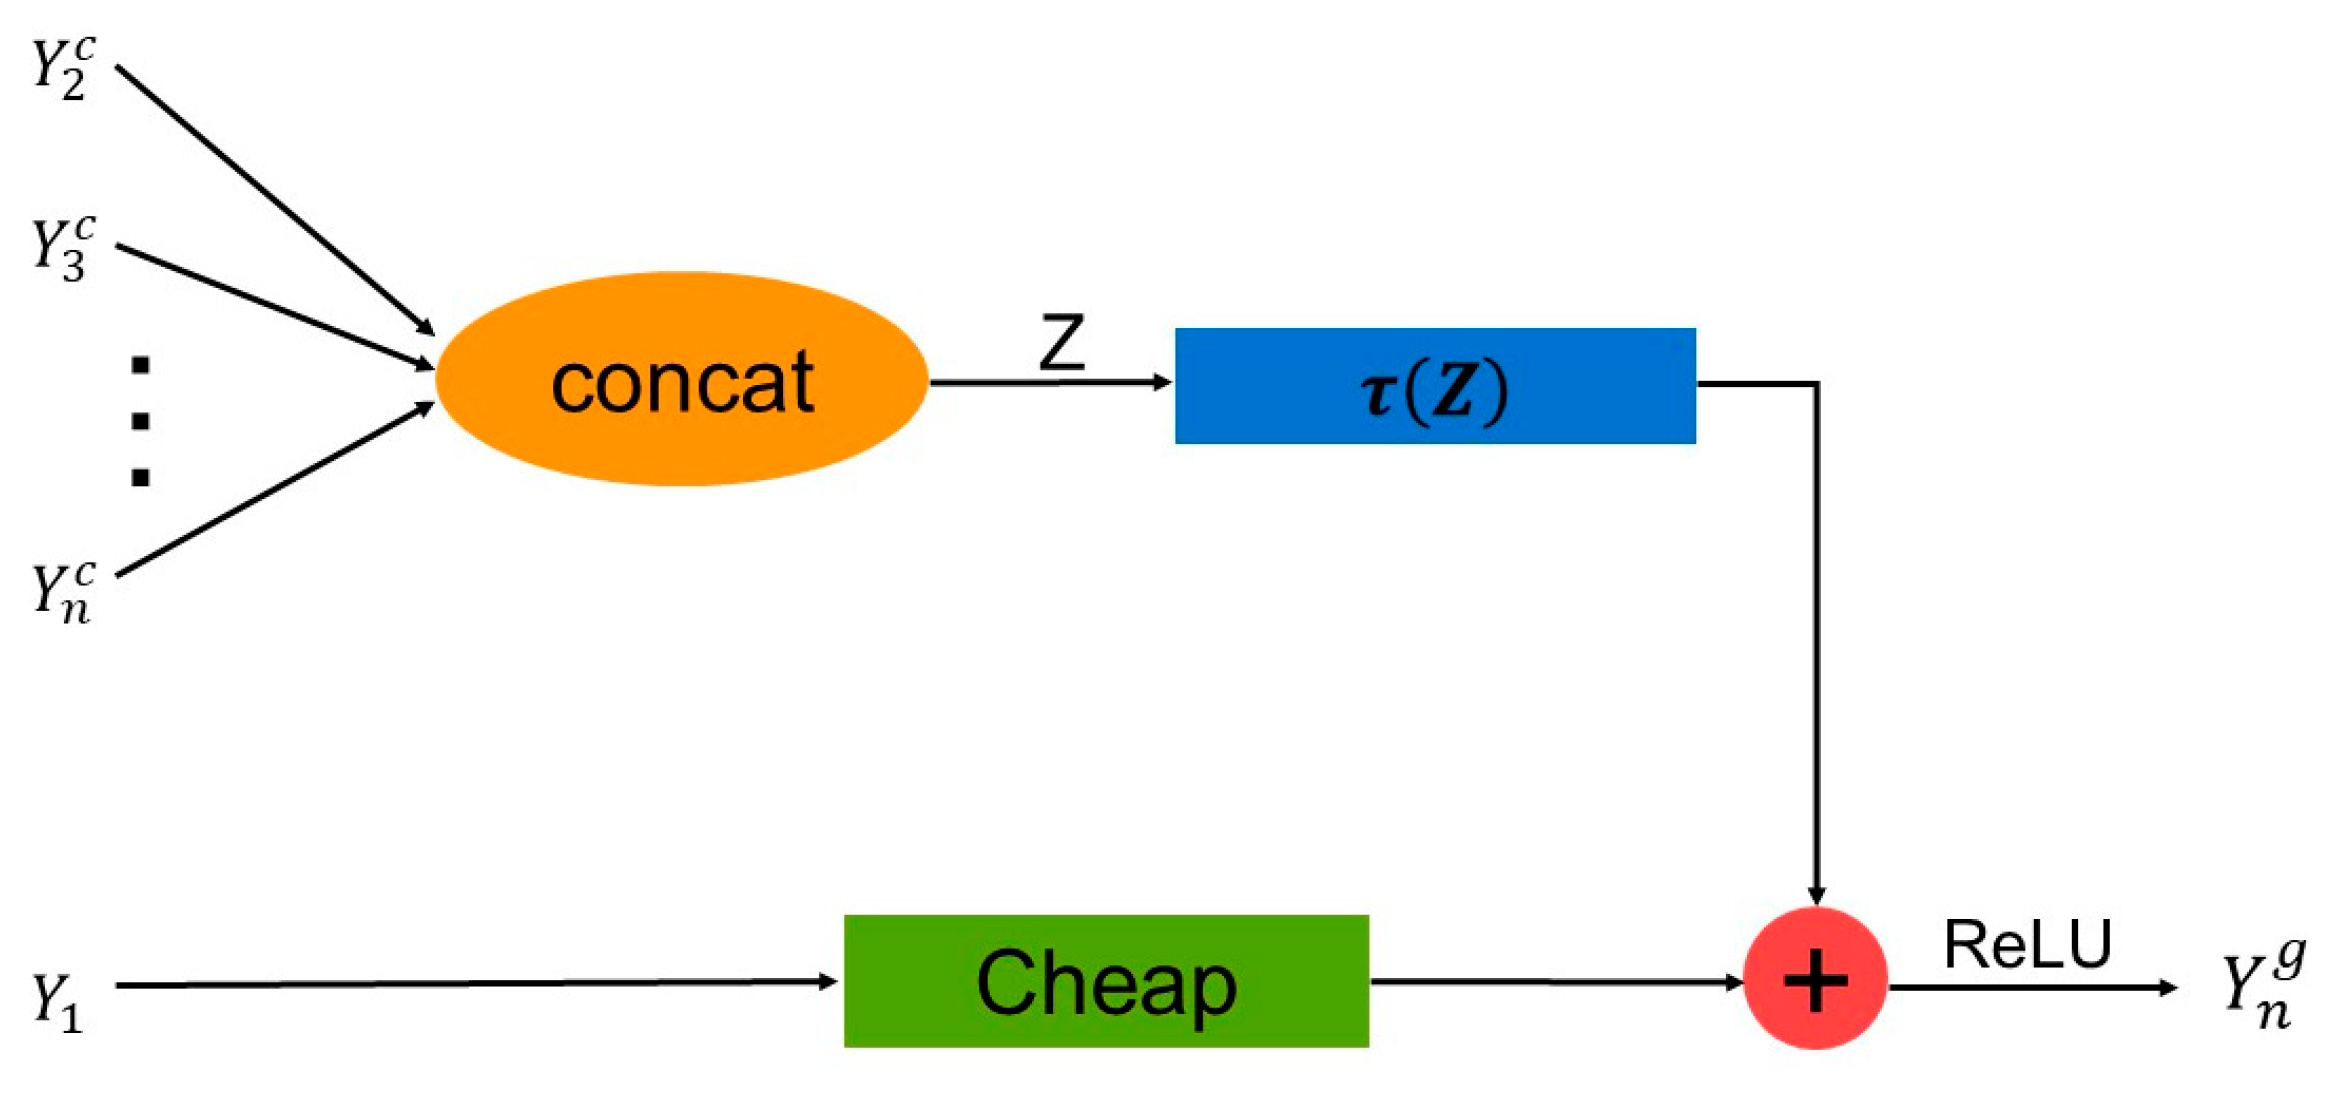
2.2.3. G-Ghost Bottleneck Module

The G-Ghost network [22] is an extension of the Ghost network [23]. Before introducing the G-Ghost bottleneck, it is essential to understand the Ghost network. Using an image of pollen from Artemisia as an example (Figure 6), within ResNet-50, the feature maps obtained after processing through the first residual block are extracted for comparison. Three similar feature maps are annotated with boxes of the same color (red boxes represent one type of similar feature map, while white boxes represent another type of similar feature map).
The feature information extracted through complex convolution demonstrates inherent similarity and redundancy, which enhances comprehensive input comprehension but increases computational complexity. To address this, the Ghost module employs minimal traditional convolutions to generate primary feature maps while maintaining model efficiency. Specifically, it first compresses input channel dimensions using 1 × 1 convolutions, then applies cost-effective linear transformations (e.g., depthwise 3 × 3 or 5 × 5 kernels) to produce supplementary feature maps. This approach enables the efficient extraction of high-level semantic information through flexible linear operations rather than relying on extensive conventional convolutions, significantly reducing computational demands while preserving feature diversity. The process, illustrated in Figure 7, achieves redundant feature generation through optimized spatial transformation rather than traditional convolution stacking.
Additionally, different sizes of convolutional kernels can be used for linear transformation operations. Typically, to account for inference on CPUs or GPUs, all 3 × 3 or all 5 × 5 convolutional kernels are employed. The size of the convolutional kernels is determined based on the identified targets. While maintaining the size of the output feature maps, this approach effectively reduces computational complexity, enhances operational speed and accuracy, and demonstrates strong versatility. Finally, they are combined into a new feature map output by concatenating different feature maps.
In Figure 7, c, h, and w represent the channels, height, and width of the input image, respectively. m, h’, and w’ represent the channels, height, and width of the intrinsic feature maps obtained after traditional convolution, respectively. n denotes the channels of the final output feature map, k represents the size of the traditional convolutional kernel, Φ signifies depth transformation, and d represents the size of the depth convolutional kernel. After s transformations, the acceleration ratio ( r s ) of computational complexity between traditional convolution and Ghost Conv is expressed in Equation (1):
r s = n h w c k k n s h w k k + s 1 . n s . h w d d = c k k 1 s c k k + s 1 s d d s c s + c 1 s
Similarly, the magnitude of d × d is similar to k × k, and, given that s ≪ c, the parameter compression ratio ( r c ) can be calculated as shown in Equation (2):
r c = n c k k n s c k k + s 1 . n s . d d s c s + c 1 s
The Ghost bottleneck is constructed based on the advantages of the Ghost module. Similar to the basic residual blocks in ResNet, the Ghost bottleneck integrates multiple convolutional layers and a shortcut. It consists of two stacked Ghost modules, as illustrated in Figure 8. The first Ghost module serves as the expansion layer, increasing the number of channels and utilizing depthwise convolutional downsampling in the high-dimensional space to compress the width and height of the feature maps. The second Ghost module decreases the number of channels to match the shortcut path. Then, the shortcut connects the inputs and outputs of these two Ghost modules. No ReLU is applied after the second Ghost module, and batch normalization (BN) and ReLU non-linear activation are applied after each layer. The described Ghost bottleneck is suitable for stride = 1. For the case of stride = 2, the shortcut path is achieved using downsampling layers and depthwise convolution with stride = 2.
Although the aforementioned network significantly reduces FLOPs while maintaining high performance, its inexpensive operations are not efficient enough for GPUs. Specifically, depthwise convolution has low computational density and cannot fully utilize the parallel computing capabilities of GPUs. If some features can be removed to significantly reduce intermediate features and thereby decrease computational complexity and memory usage, GPU latency can be reduced to a large extent.
Based on the understanding and analysis of the Ghost concept described earlier, the features processed with the first module can be obtained through a simple linear transformation of the bottom-level features.
We can categorize features into two types: “complicated” and “ghost”. The former requires processing using a large number of blocks, while the latter only requires the linear transformation of shallow features. Let us define a phase containing n blocks as { L 1 , L 2 , , L n } , where the output represents X R c × h × w . The “complicated” features are represented as Y n c R 1 λ c × h × w , and the “ghost” features are represented as y n g R λ c × h × w   ( 0 λ 1 ) . They are generated as follows (Equation (3)):
Y n c = L n ( L n 1 ( L 2 ( Y 1 ) ) ) Y n g = C ( Y 1 )
where C represents the cheap operation, which can be a 1 × 1 or 3 × 3 convolution. By combining the above two types of features, the current phase output features can be obtained: Y n = [ Y n c , Y n g ] .
Figure 9 illustrates the construction method of the G-Ghost phase, which generates features through cheap operations to explore redundancy between the first and last modules. Using this approach, the G-Ghost phase can significantly reduce computational complexity (as shown in Figure 9a,b). Although simple features can be generated through cheap operations, Y n g may lack the depth of information that requires multiple layers to extract. To compensate for the information loss, intermediate features from the “complicated” branch are proposed to enhance the expressive power of cheap operations. From the “complicated” branch, the collected features are represented as Z R c × h × w = [ Y 2 c , Y 3 c , Y n c ] . These intermediate features can provide rich information supplementation for cheap operations.
Figure 10 illustrates the information aggregation used in G-Ghost, where Z is first transformed to the same domain as Y n g , followed by information fusion: Y n g = Y n g + τ ( Z ) . To simplify computation, Z is first globally average-pooled to obtain aggregated features, and then a fully connected layer is used to transform it to the same domain: τ ( Z ) = W P o o l i n g ( Z ) + b .
This study employs the proposed G-Ghost to refactor existing CNN architectures, replacing the Conv and bottleneck in the C2f module with the G-Ghost Conv and G-Ghost bottleneck. Using the C2f-G-Ghost bottleneck reduces model parameters and improves inference speed. This method cheaply obtains similar feature maps, reducing computational overheads and fully utilizing the parallel computing capabilities of GPUs, meeting the requirements of lightweight networks running on GPU-embedded devices in this experiment.

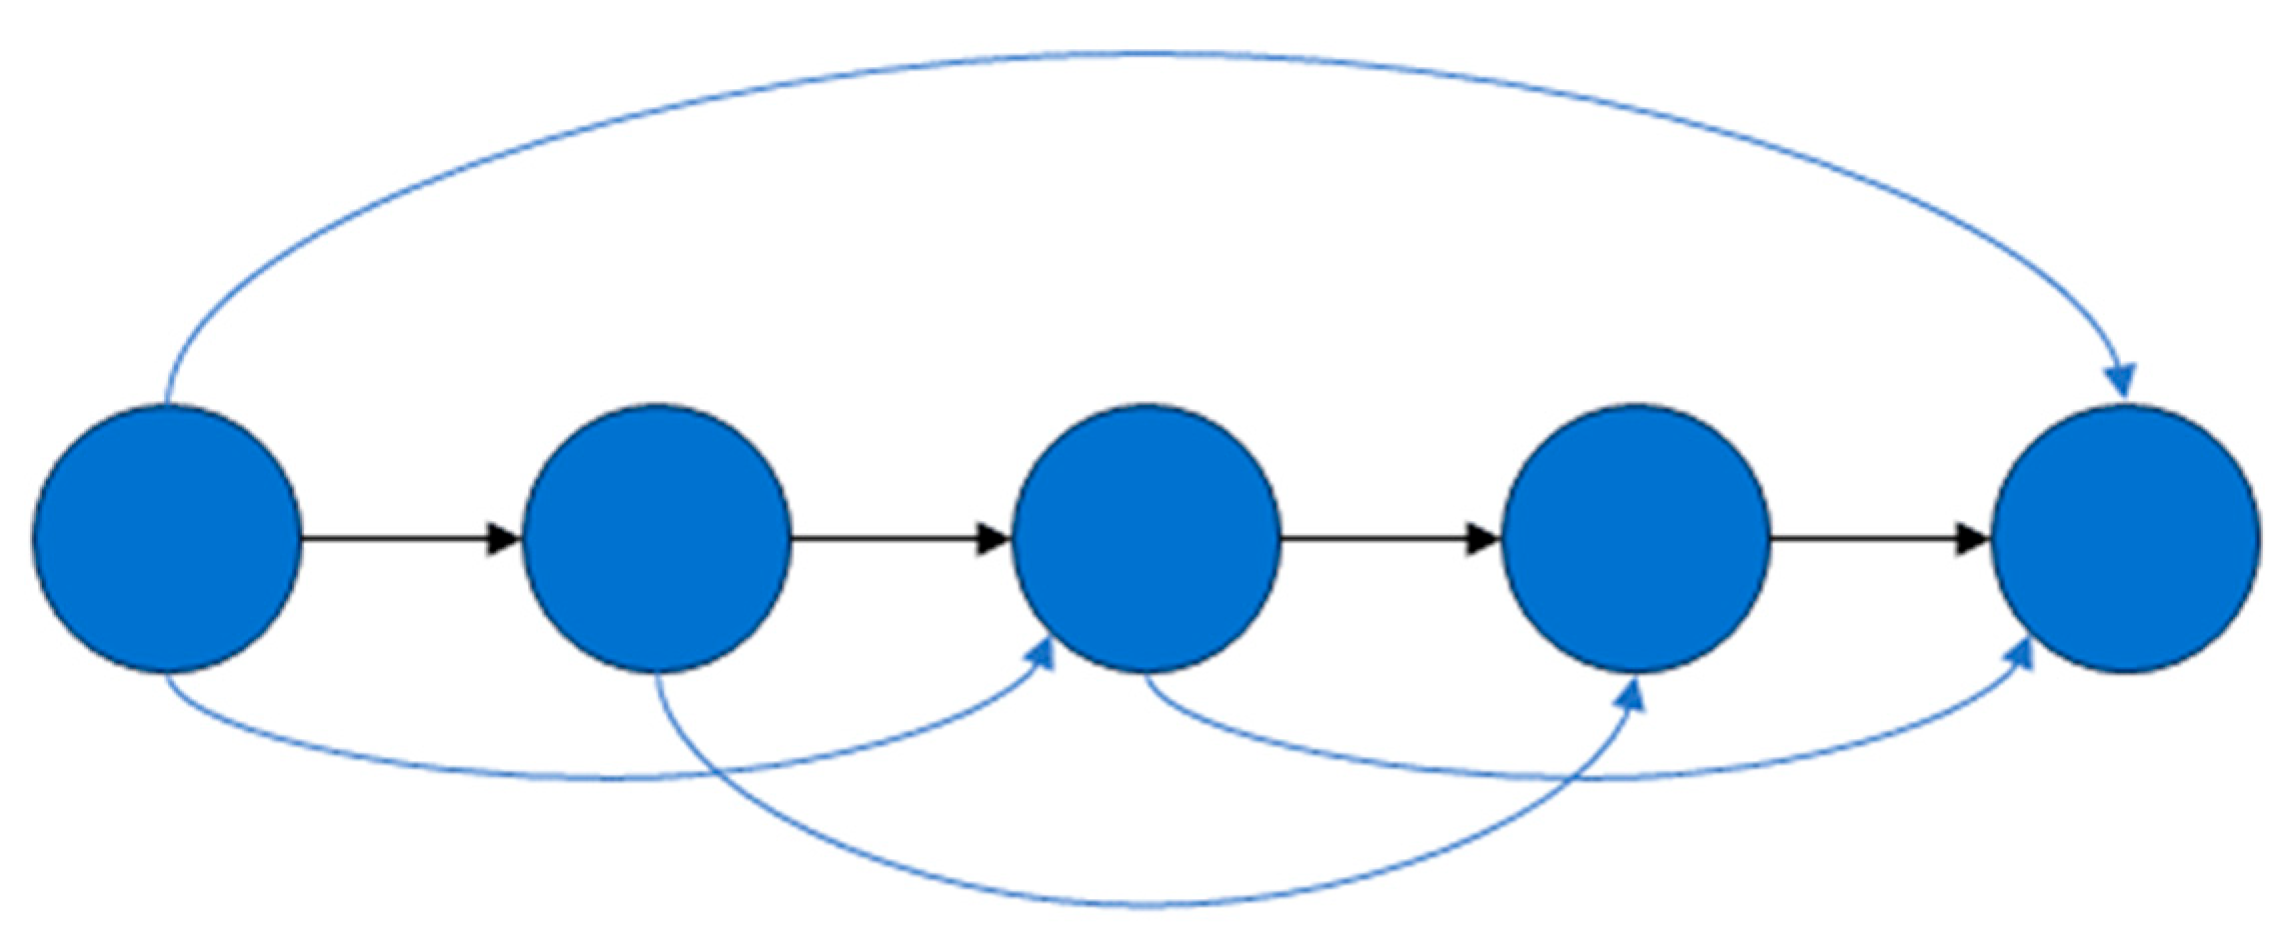
2.2.4. Generalized Feature Pyramid Network (GFPN)

During pollen dissemination peaks, overlapping pollen cells on microscope slides present identification challenges due to co-occurring species. The Neck network addresses this by strategically fusing multi-scale features from the backbone network: low-level features retain high spatial resolution and positional details that are critical for distinguishing overlapping instances but suffer from noise and weak semantics, while high-level features provide robust semantic representations at the cost of reduced resolution and the loss of fine-grained details. The effective hierarchical fusion of these complementary features—enhancing semantic richness while preserving spatial precision—is essential for optimizing detection accuracy in complex scenarios.
At present, feature fusion is the primary means of addressing differences in multi-scale features. Representative algorithms such as the feature pyramid network (FPN), path aggregation network (PANet), and bi-directional feature pyramid network (BiFPN) have been proposed. Their core idea is to effectively combine multi-scale feature information from different feature spaces in the backbone network. However, these feature pyramid architectures only focus on scale fusion and lack intra-block connections, neglecting feature hierarchy. When identifying pollen images under a microscope, because of their similar sizes, the feature maps only contain single or few-level features, making it difficult for the network to distinguish pollen grains of similar sizes but varying surface complexities. Therefore, Jiang et al. proposed a new feature fusion method, the generalized feature pyramid network (GFPN) [24], which is shown in Figure 11.
GFPN introduces a novel cross-scale fusion of interacting features from the same layer and adjacent layers, enabling more efficient information transmission. Meanwhile, GFPN proposes a new skip-layer connection method, log 2 n l i n k . As shown in Figure 12, this connection method effectively prevents gradient disappearance, enhances depth expansion, and increases feature reuse.
In scenes with large target differences, considering only same-level features and features one level up, as described above, will lead to poor model performance. Therefore, the structure of Queen-Fusion enables GFPN to overcome large-scale variations for more feature fusion. As shown in Figure 13, each node receives input from the previous node and from nodes diagonally above and below. Additionally, considering that summing for feature fusion may cause information loss, concatenation is used instead. This aids in effective information transmission for target features and enhances the network’s adaptability to different scale features.

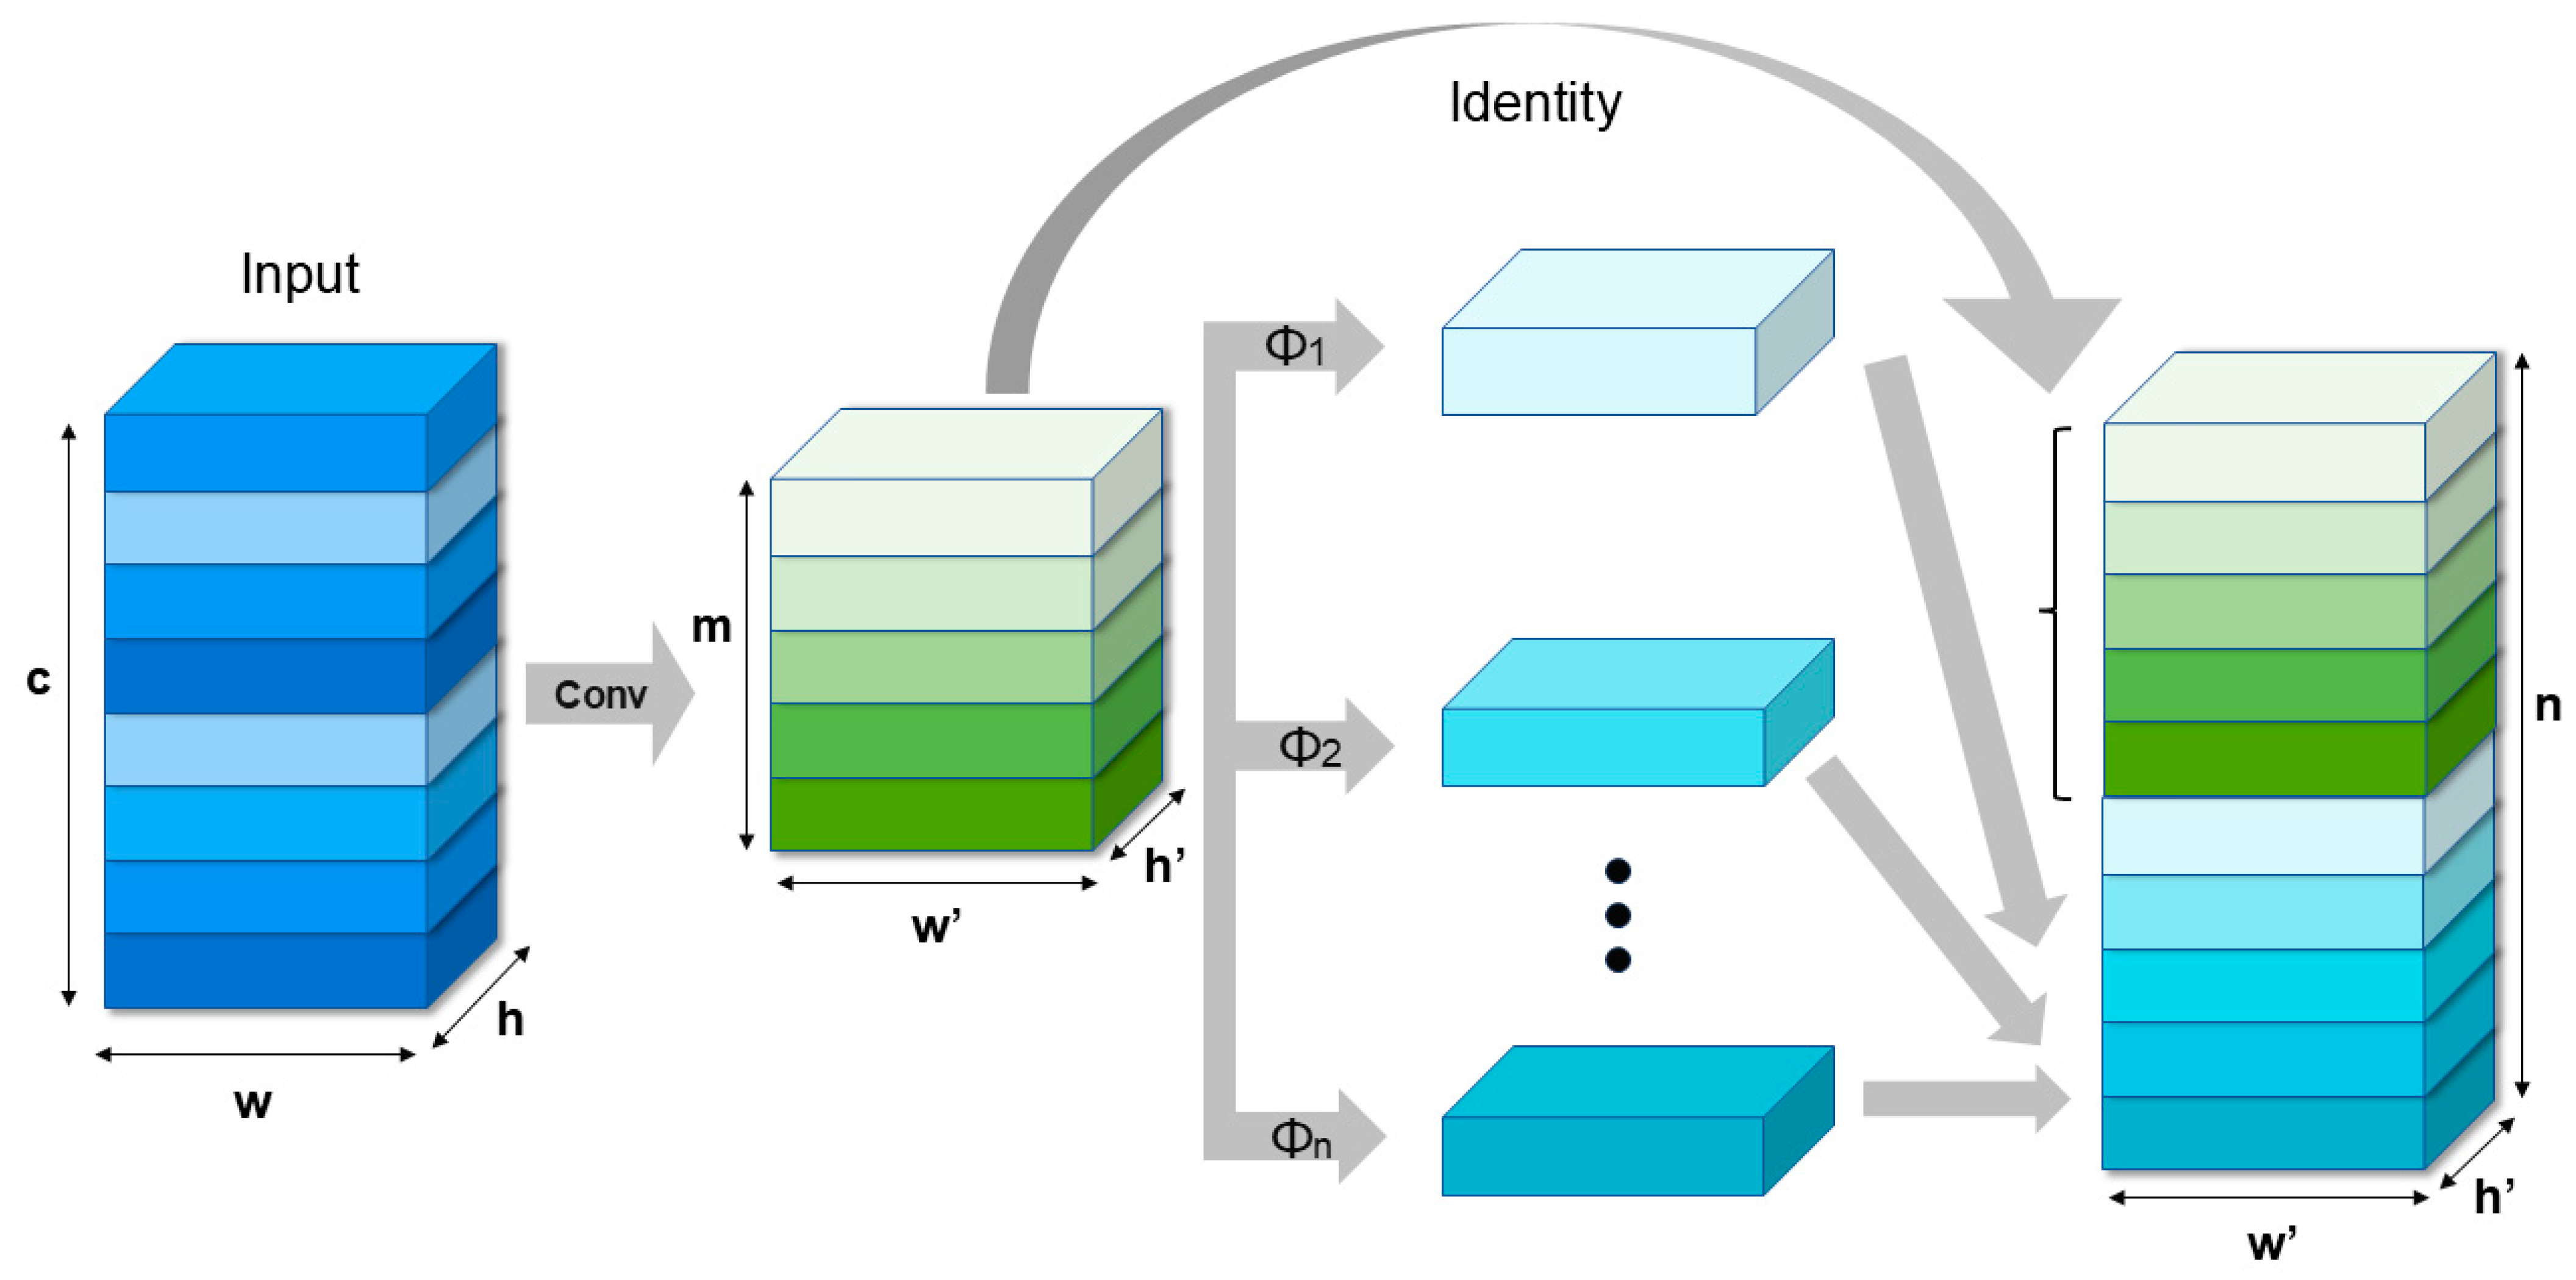
2.2.5. Introduction of DualConv

The backbone network of YOLO is reengineered by substituting the standard convolutional layer with the computationally efficient DualConv module, thereby significantly reducing the overall model complexity. Figure 14 illustrates the architecture of the DualConv network [25].
DualConv integrates the benefits of two lightweight convolutions: heterogeneous convolution and group convolution. As depicted in Figure 15, each DualConv module comprises two parallel operations: a 3 × 3 convolution kernel and a 1 × 1 convolution kernel, which process the input feature maps concurrently. The 3 × 3 convolution kernel specializes in extracting spatial detail features critical for identifying pollen-specific structures such as surface reticulation patterns, germination pores, or spinosities, which are essential for distinguishing key morphological differences between Ambrosia and Artemisia pollen. Meanwhile, the 1 × 1 convolution kernel reduces feature dimensions via channel compression and filters out background noise (e.g., defocused regions or dust particles). The outputs from both kernels are fused through channel concatenation, denoted by the ⊕ symbol in Figure 15, preserving high-dimensional feature representations to capture subtle inter-species differences. This dual-core collaborative mechanism achieves a balance between computational efficiency and feature richness, enabling the accurate localization and classification of pollen particles even against high-density, complex microscopic backgrounds. This cooperative mechanism allows the network to extract spatial context information through a large receptive field while establishing an efficient channel attention mechanism via point-wise convolution. The dual convolution mechanism not only leverages the advantages of both types of lightweight convolution but also effectively addresses the issues of information barriers between groups in traditional group convolutions and cross-channel feature incoherence.
Compared to YOLOv8, this algorithm has stronger feature perception and fusion capabilities. Furthermore, it reduces parameter and computational quantities, enhancing inference speed and reducing the demand for computational resources, making smooth deployment on edge computing servers such as Jetson Nano feasible.

3. Results: Analysis and Discussion

3.1. Experimental Environment Configuration

All models in this experiment were trained on a Windows 11 operating system equipped with an 11th Gen Intel® Core™ i5-11400H @ 2.70GHz processor, 16 GB of memory, and an NVIDIA GeForce RTX 3050 8 GB GPU. The training was conducted using Python 3.10 and Pytorch 2.1.1, with CUDA version 11.8. During the test inference speed phase, experiments were carried out on a Jetson Nano, which features an NVIDIA Maxwell architecture GPU with 128 NVIDIA CUDA cores, a quad-core ARM Cortex-A57 MPCore CPU, and 4 GB of 64-bit LPDDR4 memory (1600 MHz, 25.6 GB/s). For the inference stage, Python 3.8.6 and Pytorch 1.1.2 were used for training.

3.2. Model Parameter Settings

  • The training parameter settings are shown in Table 1.
2.
The training parameter settings are shown in Table 2.

3.3. Experimental Evaluation Indicators

In order to comprehensively analyze the performance of the pollen recognition model, this experiment adopts multiple evaluation metrics. For instance, accuracy (precision), recall rate (recall), and mean average precision (mAP) are utilized to assess the accuracy of the model. In contrast, model parameters, floating-point operations (FLOPs) within the model, and the inference speed (inference) are employed to evaluate the complexity of the model. These metrics are utilized for a comprehensive assessment of the model. The formulas for these metrics are as follows:
P r e c i s i o n = T P T P + F P
R e c a l l = T P T P + F N
m A P = 1 n i = 1 n A p i
In the formulas, TP represents the number of true positive samples correctly identified, TN denotes the number of true negative samples correctly identified, FP signifies the number of samples predicted to be positive while they are actually negative, and FN represents the number of samples predicted to be negative while they are actually positive. AP refers to the average precision of predictions for different categories (i.e., the area enclosed by the P–R curve). mAP denotes the mean average precision (AP) value across all categories.

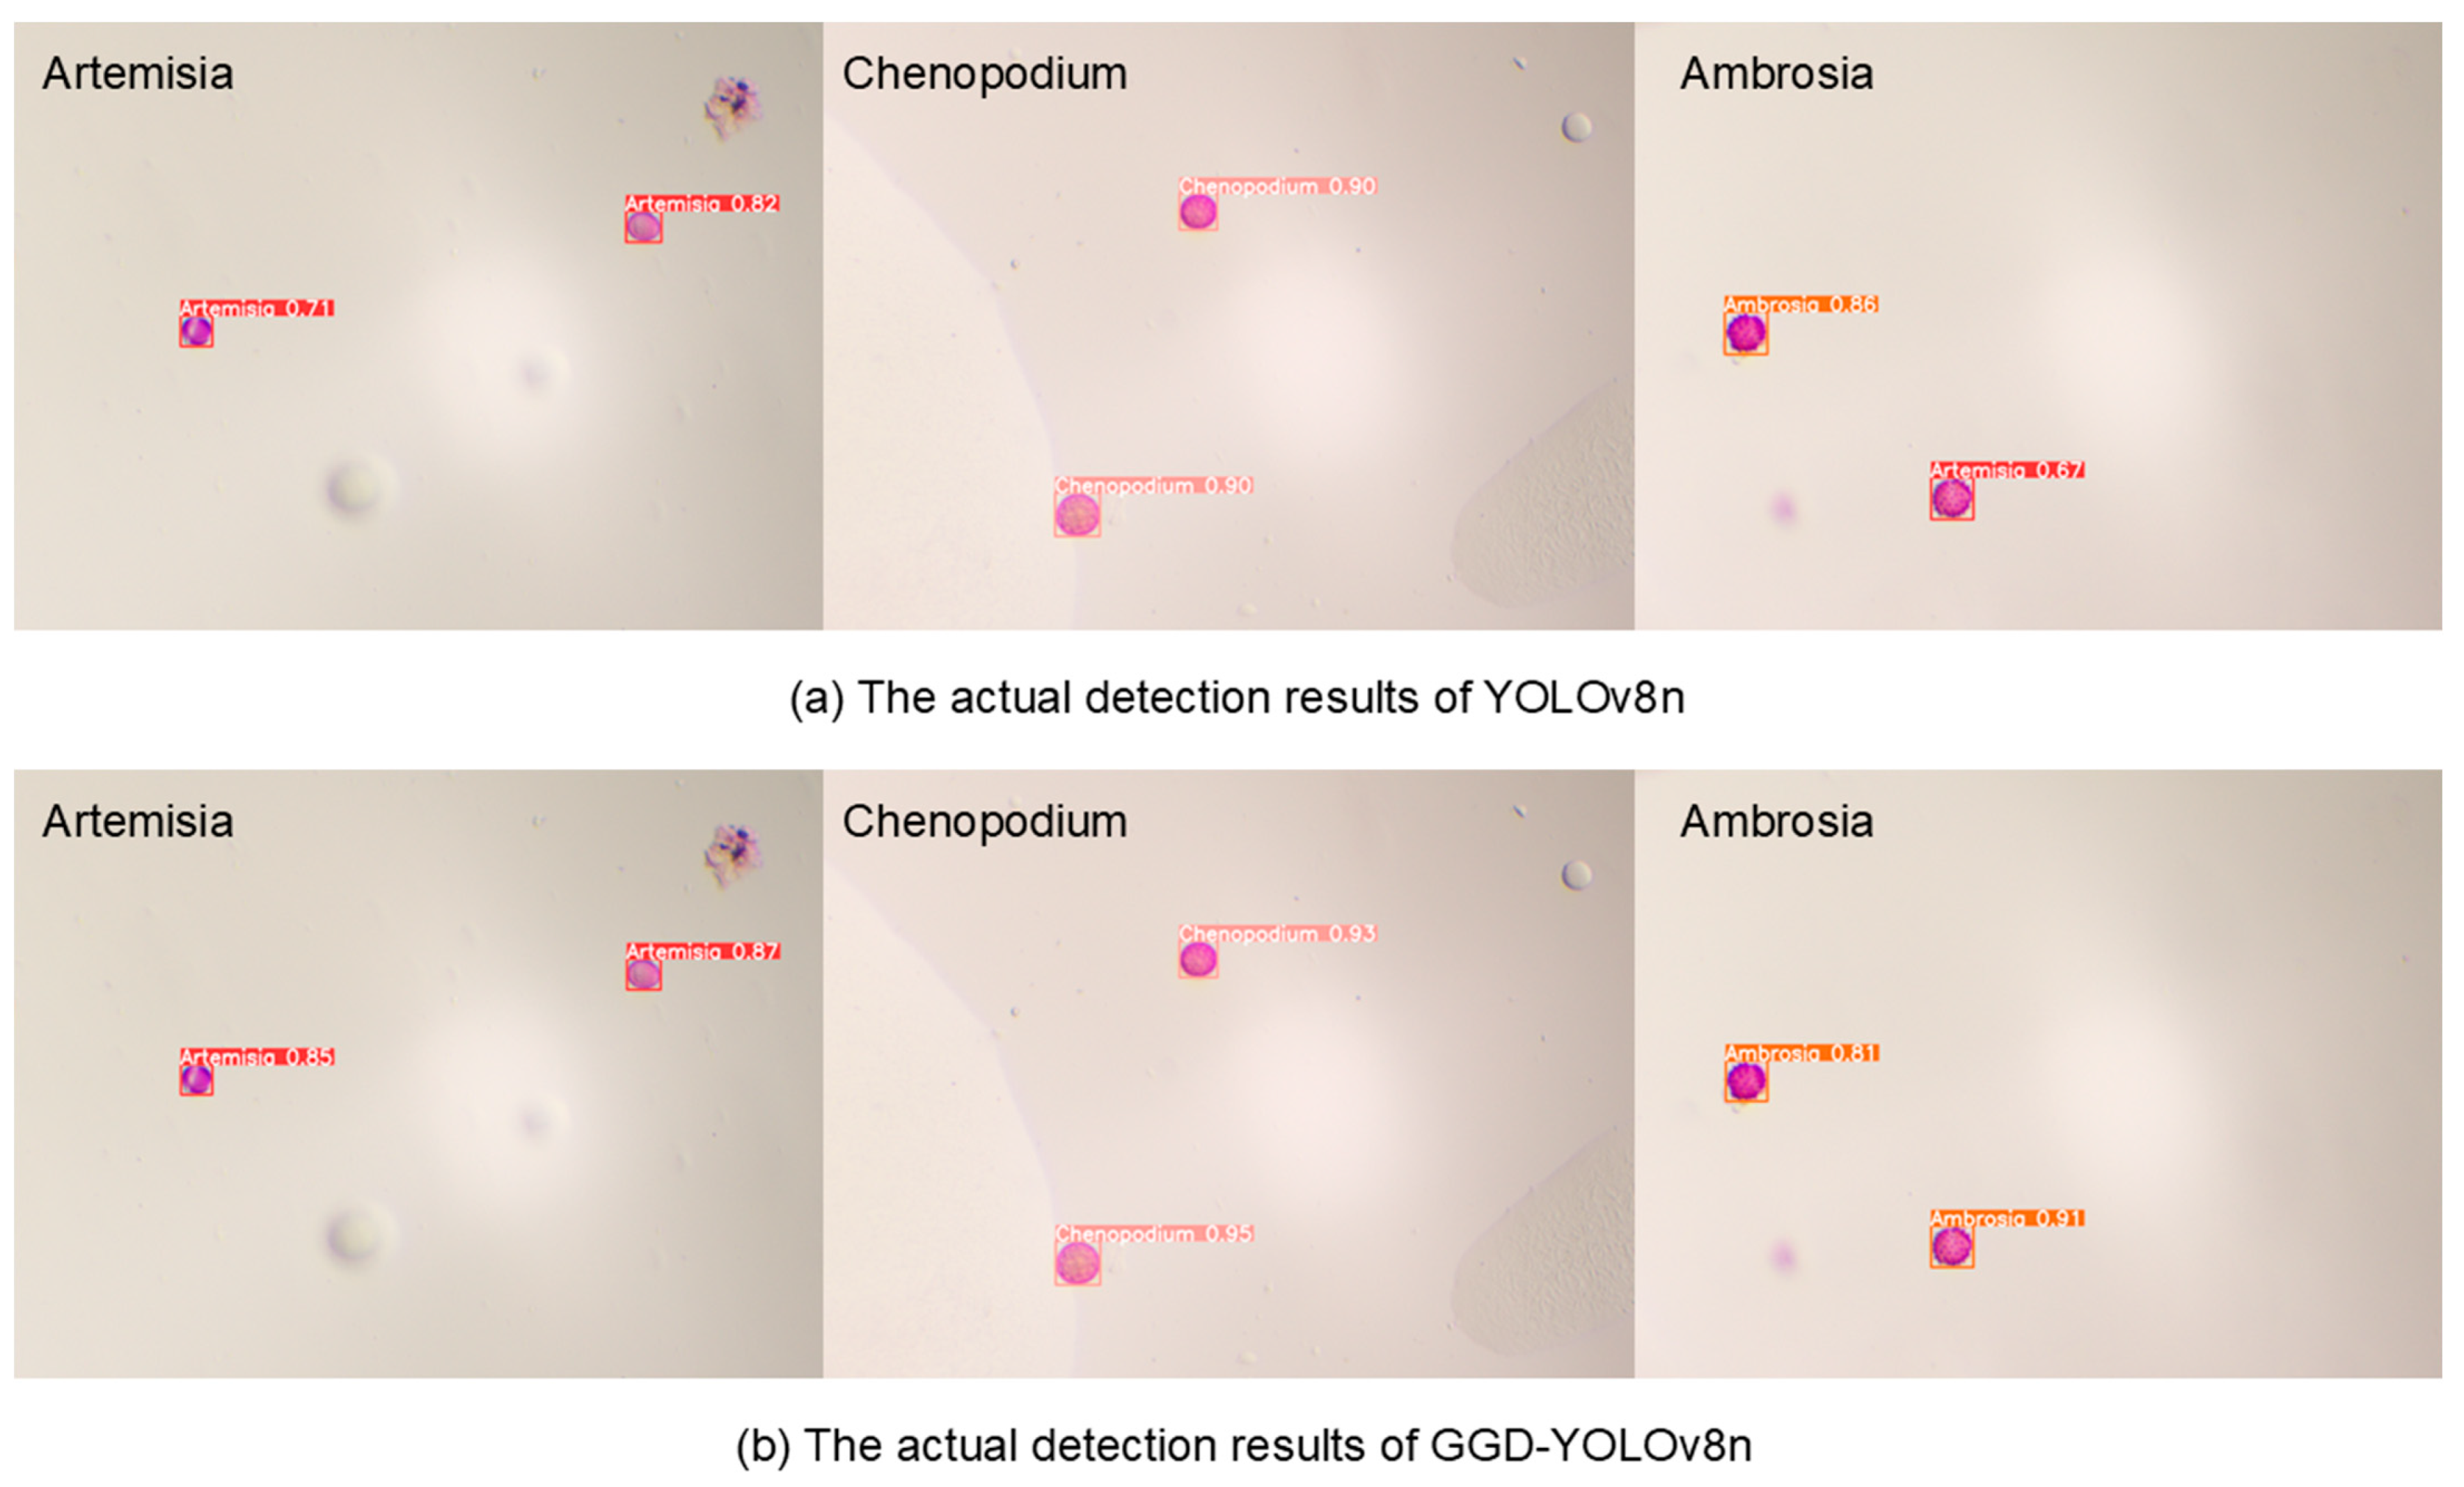
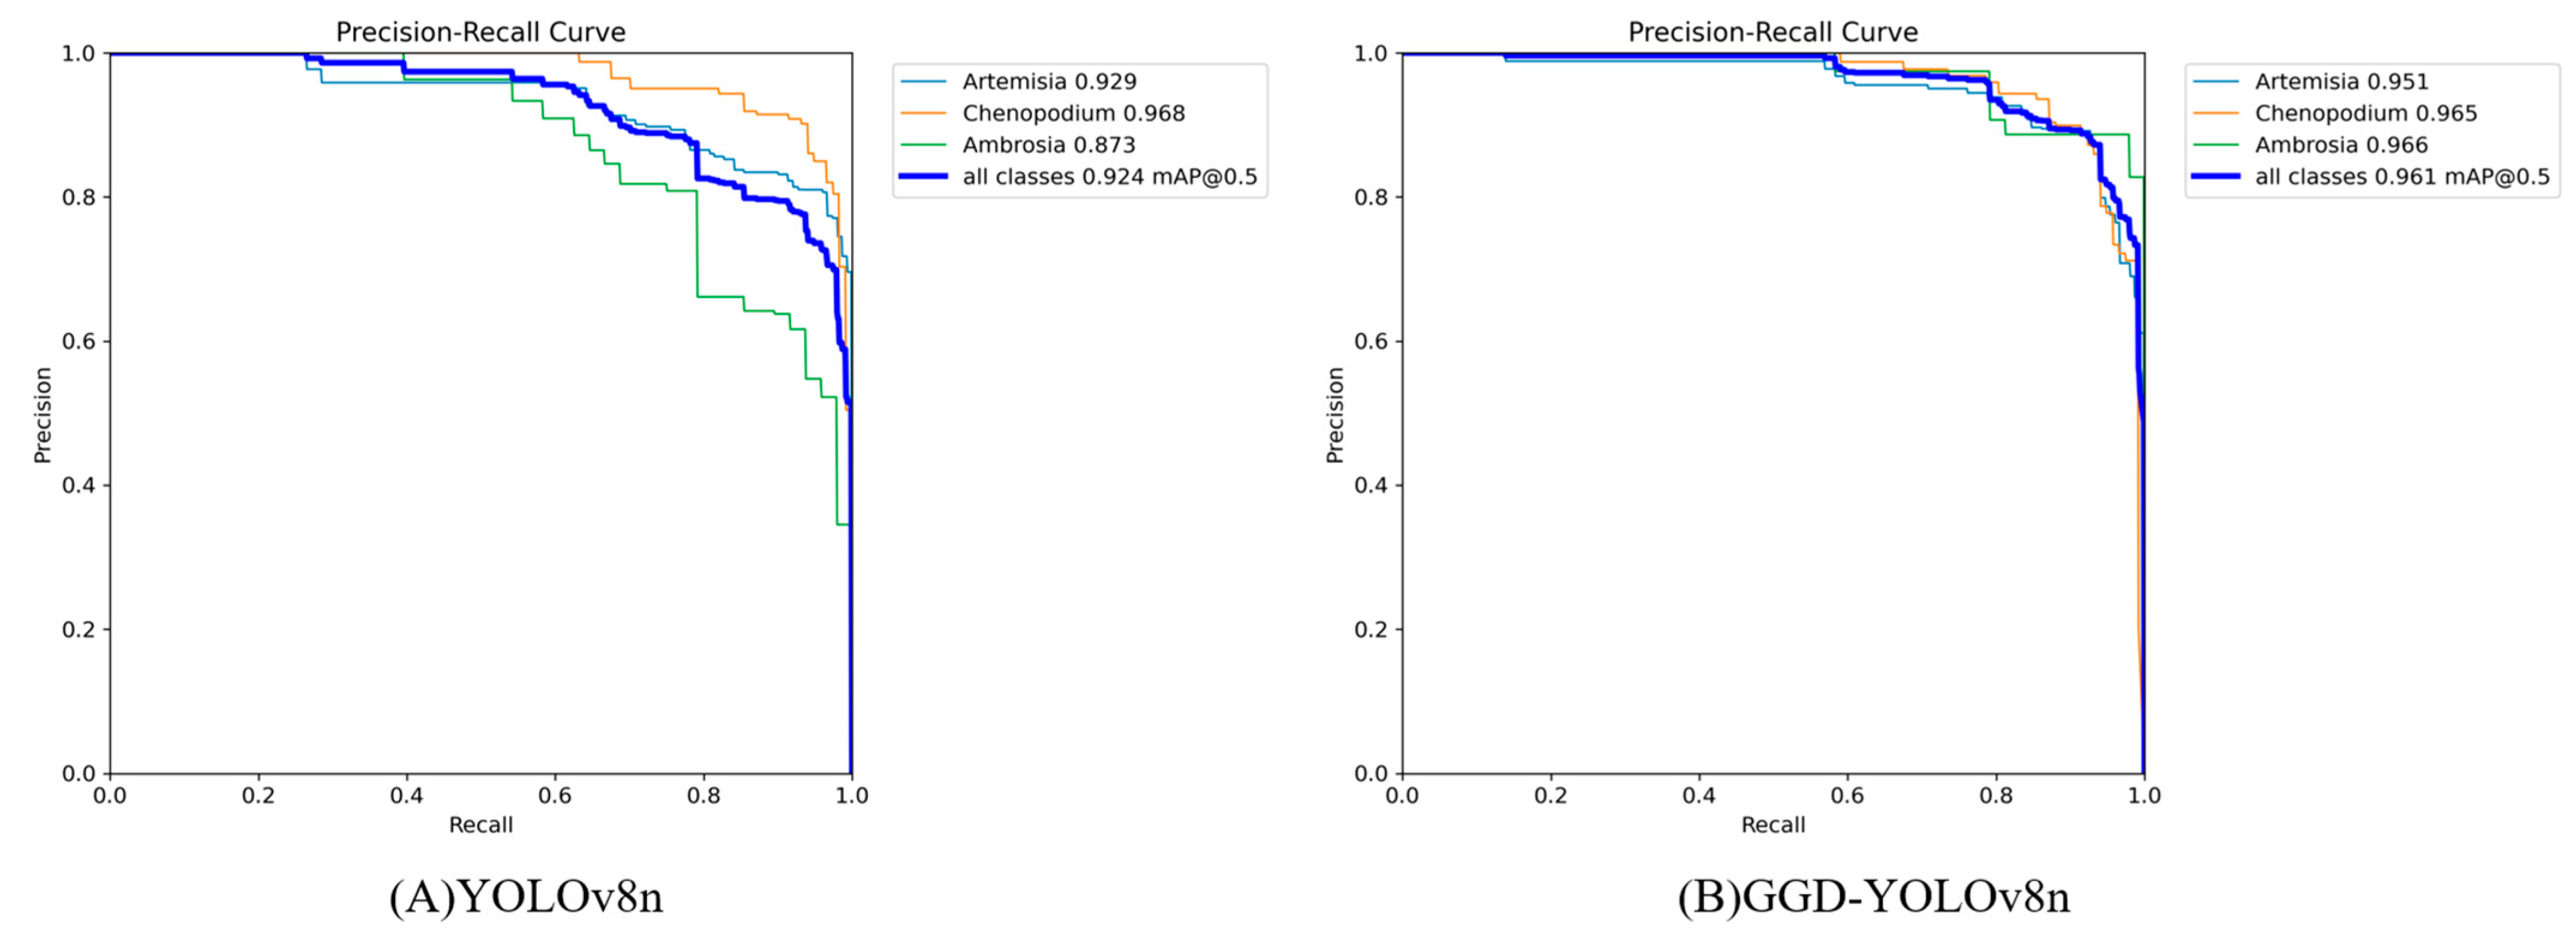
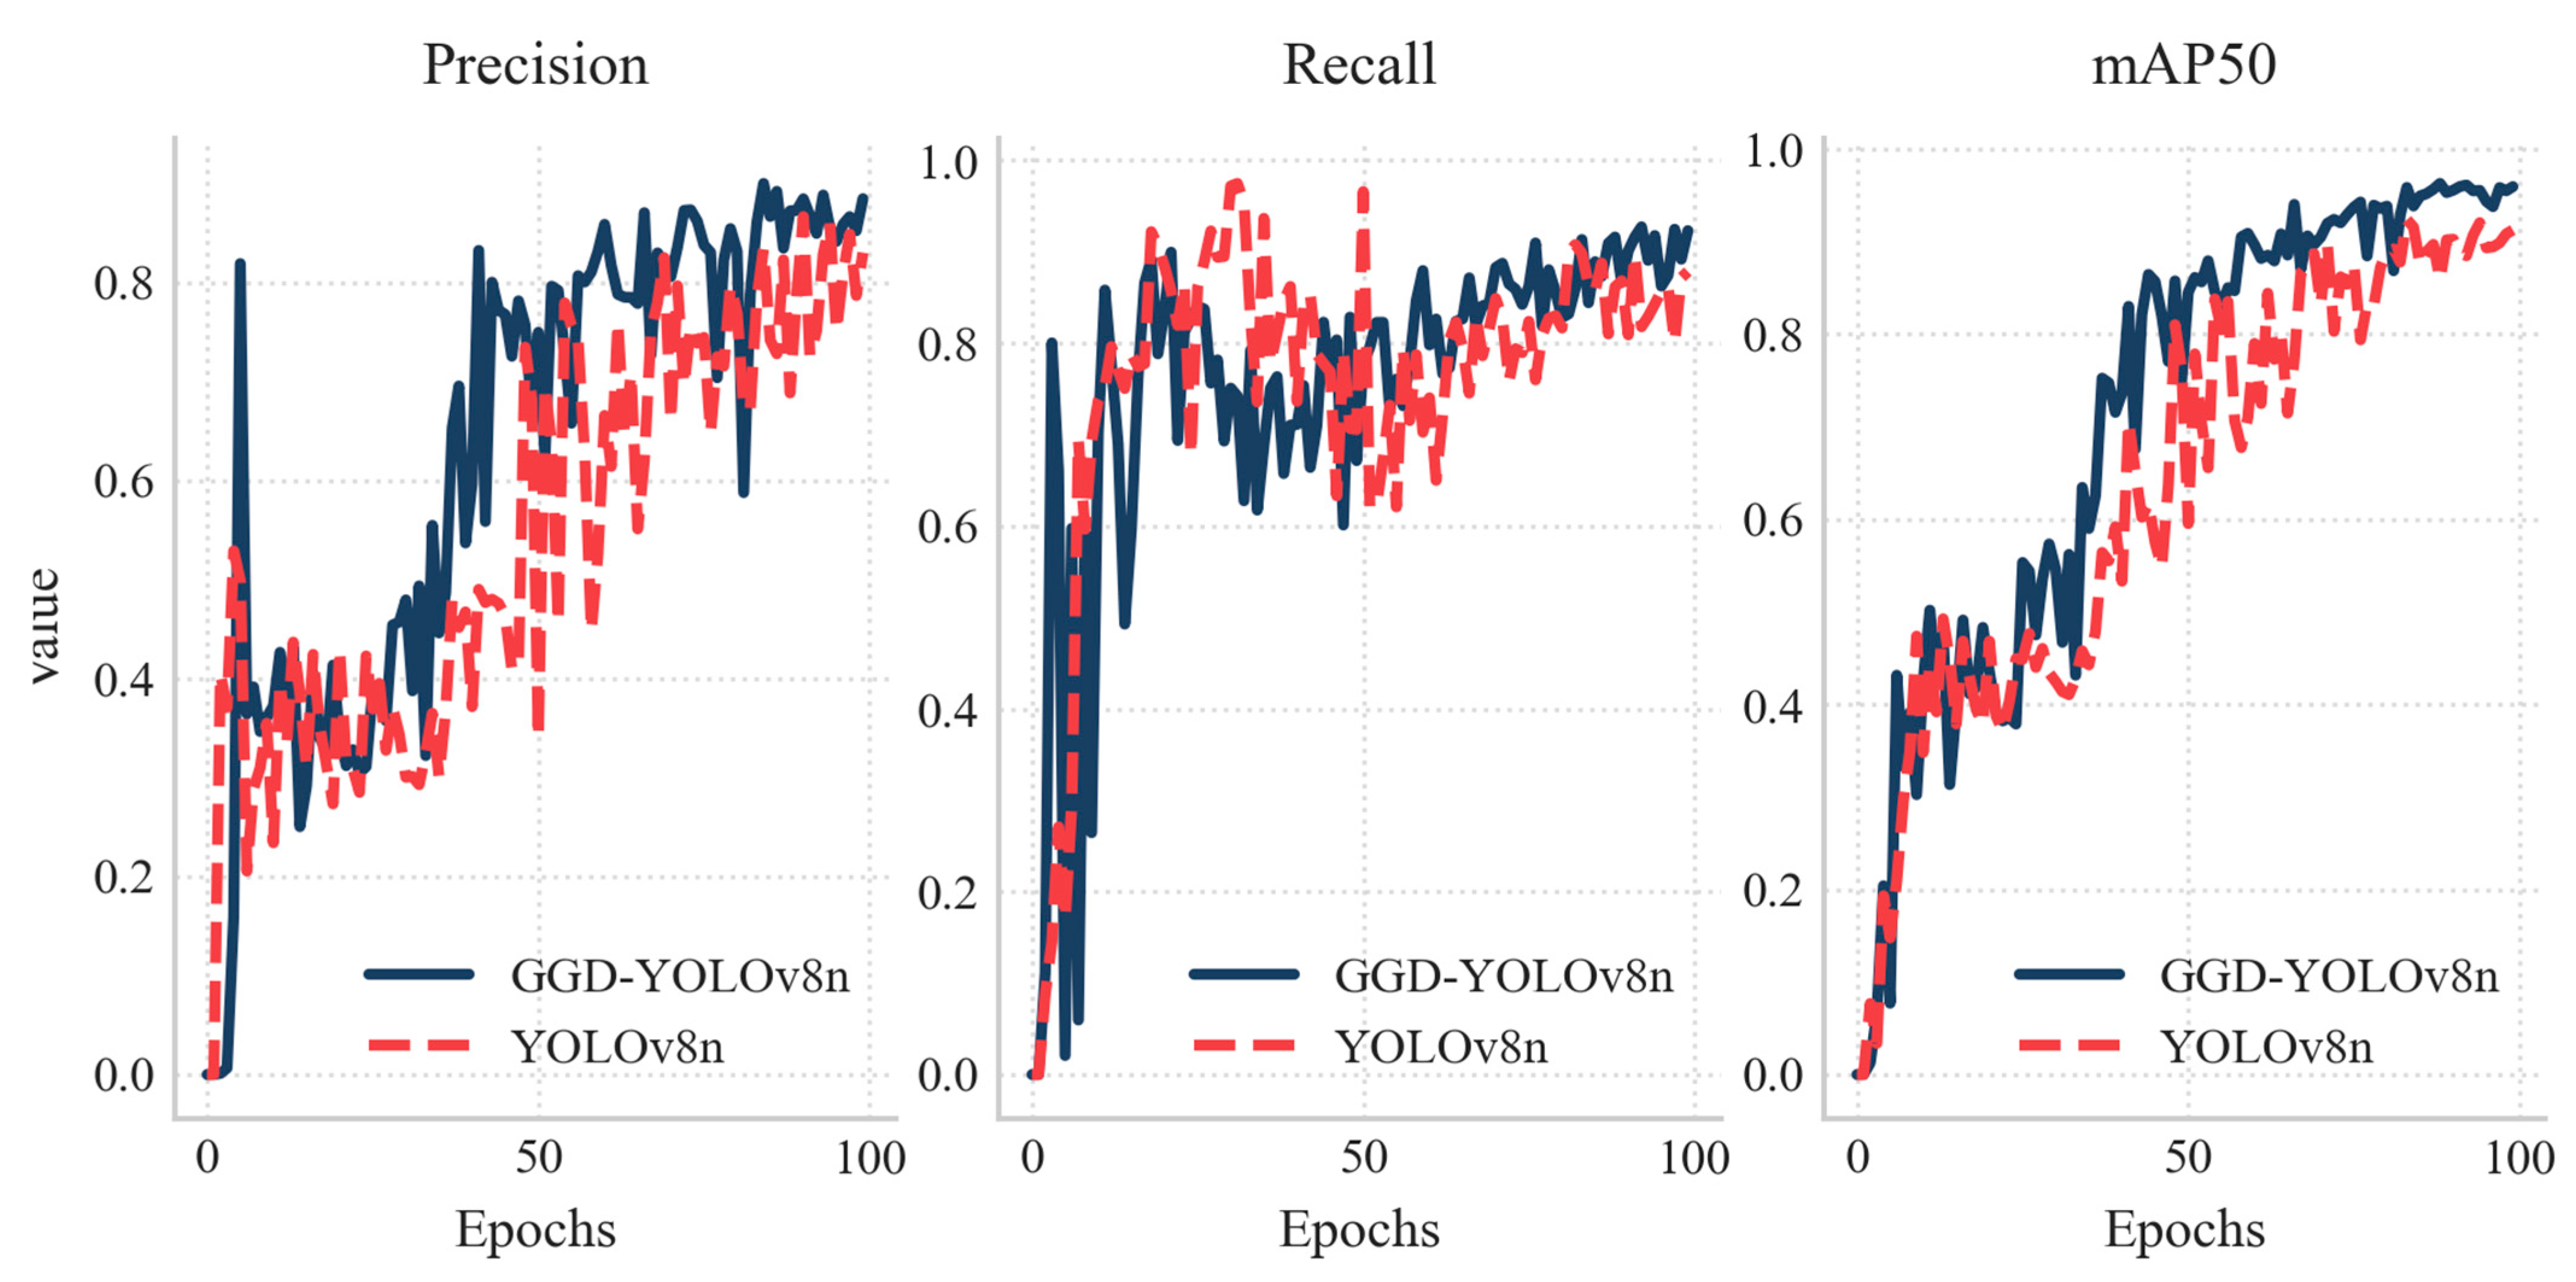
3.4. Comparison of Different Algorithms

To validate the performance of the GGD-YOLOv8n model, this study compares it with commonly used lightweight single-stage object detection algorithm models: YOLOv5n, YOLOv7-tiny, YOLOv8n, YOLOv10n, and YOLOv11n.
The experimental results are shown in Table 3. Through verification and comparison, we found that the GGD-YOLOv8n model is completely ahead of other models of the same level. Under the same experimental conditions, this result indicates that the model can still achieve better detection performance with fewer parameters and less computational complexity.
To comprehensively evaluate the detection performance of GGD-YOLOv8n, we selected an image of various types of pollen from within the dataset for detailed analysis. GGD-YOLOv8 can effectively extract the surface patterns, germination pores or spiky protrusions of different types of pollen, thereby enabling accurate identification. As illustrated in Figure 16, the detection accuracy and confidence levels of both standard YOLOv8n and GGD-YOLOv8n are compared when performing the same task. It is evident that, regardless of the type of pollen detected, GGD-YOLOv8n consistently demonstrates superior performance.
In comparison with the two-stage SSD network, the experimental results demonstrate that the evaluation metrics of SSD approach those of GGD-YOLOv8n after 200 training epochs. However, the SSD network exhibits significantly higher architectural complexity and lower computational efficiency than GGD-YOLOv8n. These results indicate that GGD-YOLOv8n maintains distinct advantages over conventional two-stage detection models in terms of both the structural design and operational performance.
To systematically evaluate model performance, Figure 17 presents the precision–recall (PR) curves for all pollen categories. These curves provide a visual characterization of category-specific detection performance. A comparative analysis of the curves reveals the enhanced discriminative capabilities of the proposed model in pollen feature extraction compared to the baseline YOLOv8n architecture.

3.5. Ablation Experiment

To systematically evaluate the impact of individual modules on the baseline model performance, a series of ablation studies were performed using YOLOv8n as the reference architecture. We progressively integrated three key components, the C2f-G-GhostBottleneck module, the Generalized Feature Pyramid Network (GFPN), and DualConv operations, while systematically evaluating their respective contributions to network optimization. The experimental results (Table 4) demonstrate that the enhanced GGD-YOLOv8n model achieves state-of-the-art performance, with synergistic improvements in both detection accuracy and computational efficiency. This comprehensive analysis validates the efficacy of the proposed architectural innovations in advancing object detection capability. The visualization comparison chart of the baseline network YOLOv8n and the improved GGD-YOLOv8n is shown in Figure 18.
The experimental results demonstrate that the individual integration of each proposed module (C2f-G-GhostBottleneck, GFPN, and DualConv) consistently enhances the model’s performance, with all configurations significantly outperforming the baseline YOLOv8n. The synergistic combination of these modules achieves an optimal accuracy–complexity balance, yielding a 5.2% improvement in the mean average precision coupled with a 22.6% reduction in the parameter count relative to the baseline. Notably, GGD-YOLOv8n maintains this performance advantage while achieving a 19.3% decrease in computational complexity, suggesting practical deployability in resource-constrained environments.

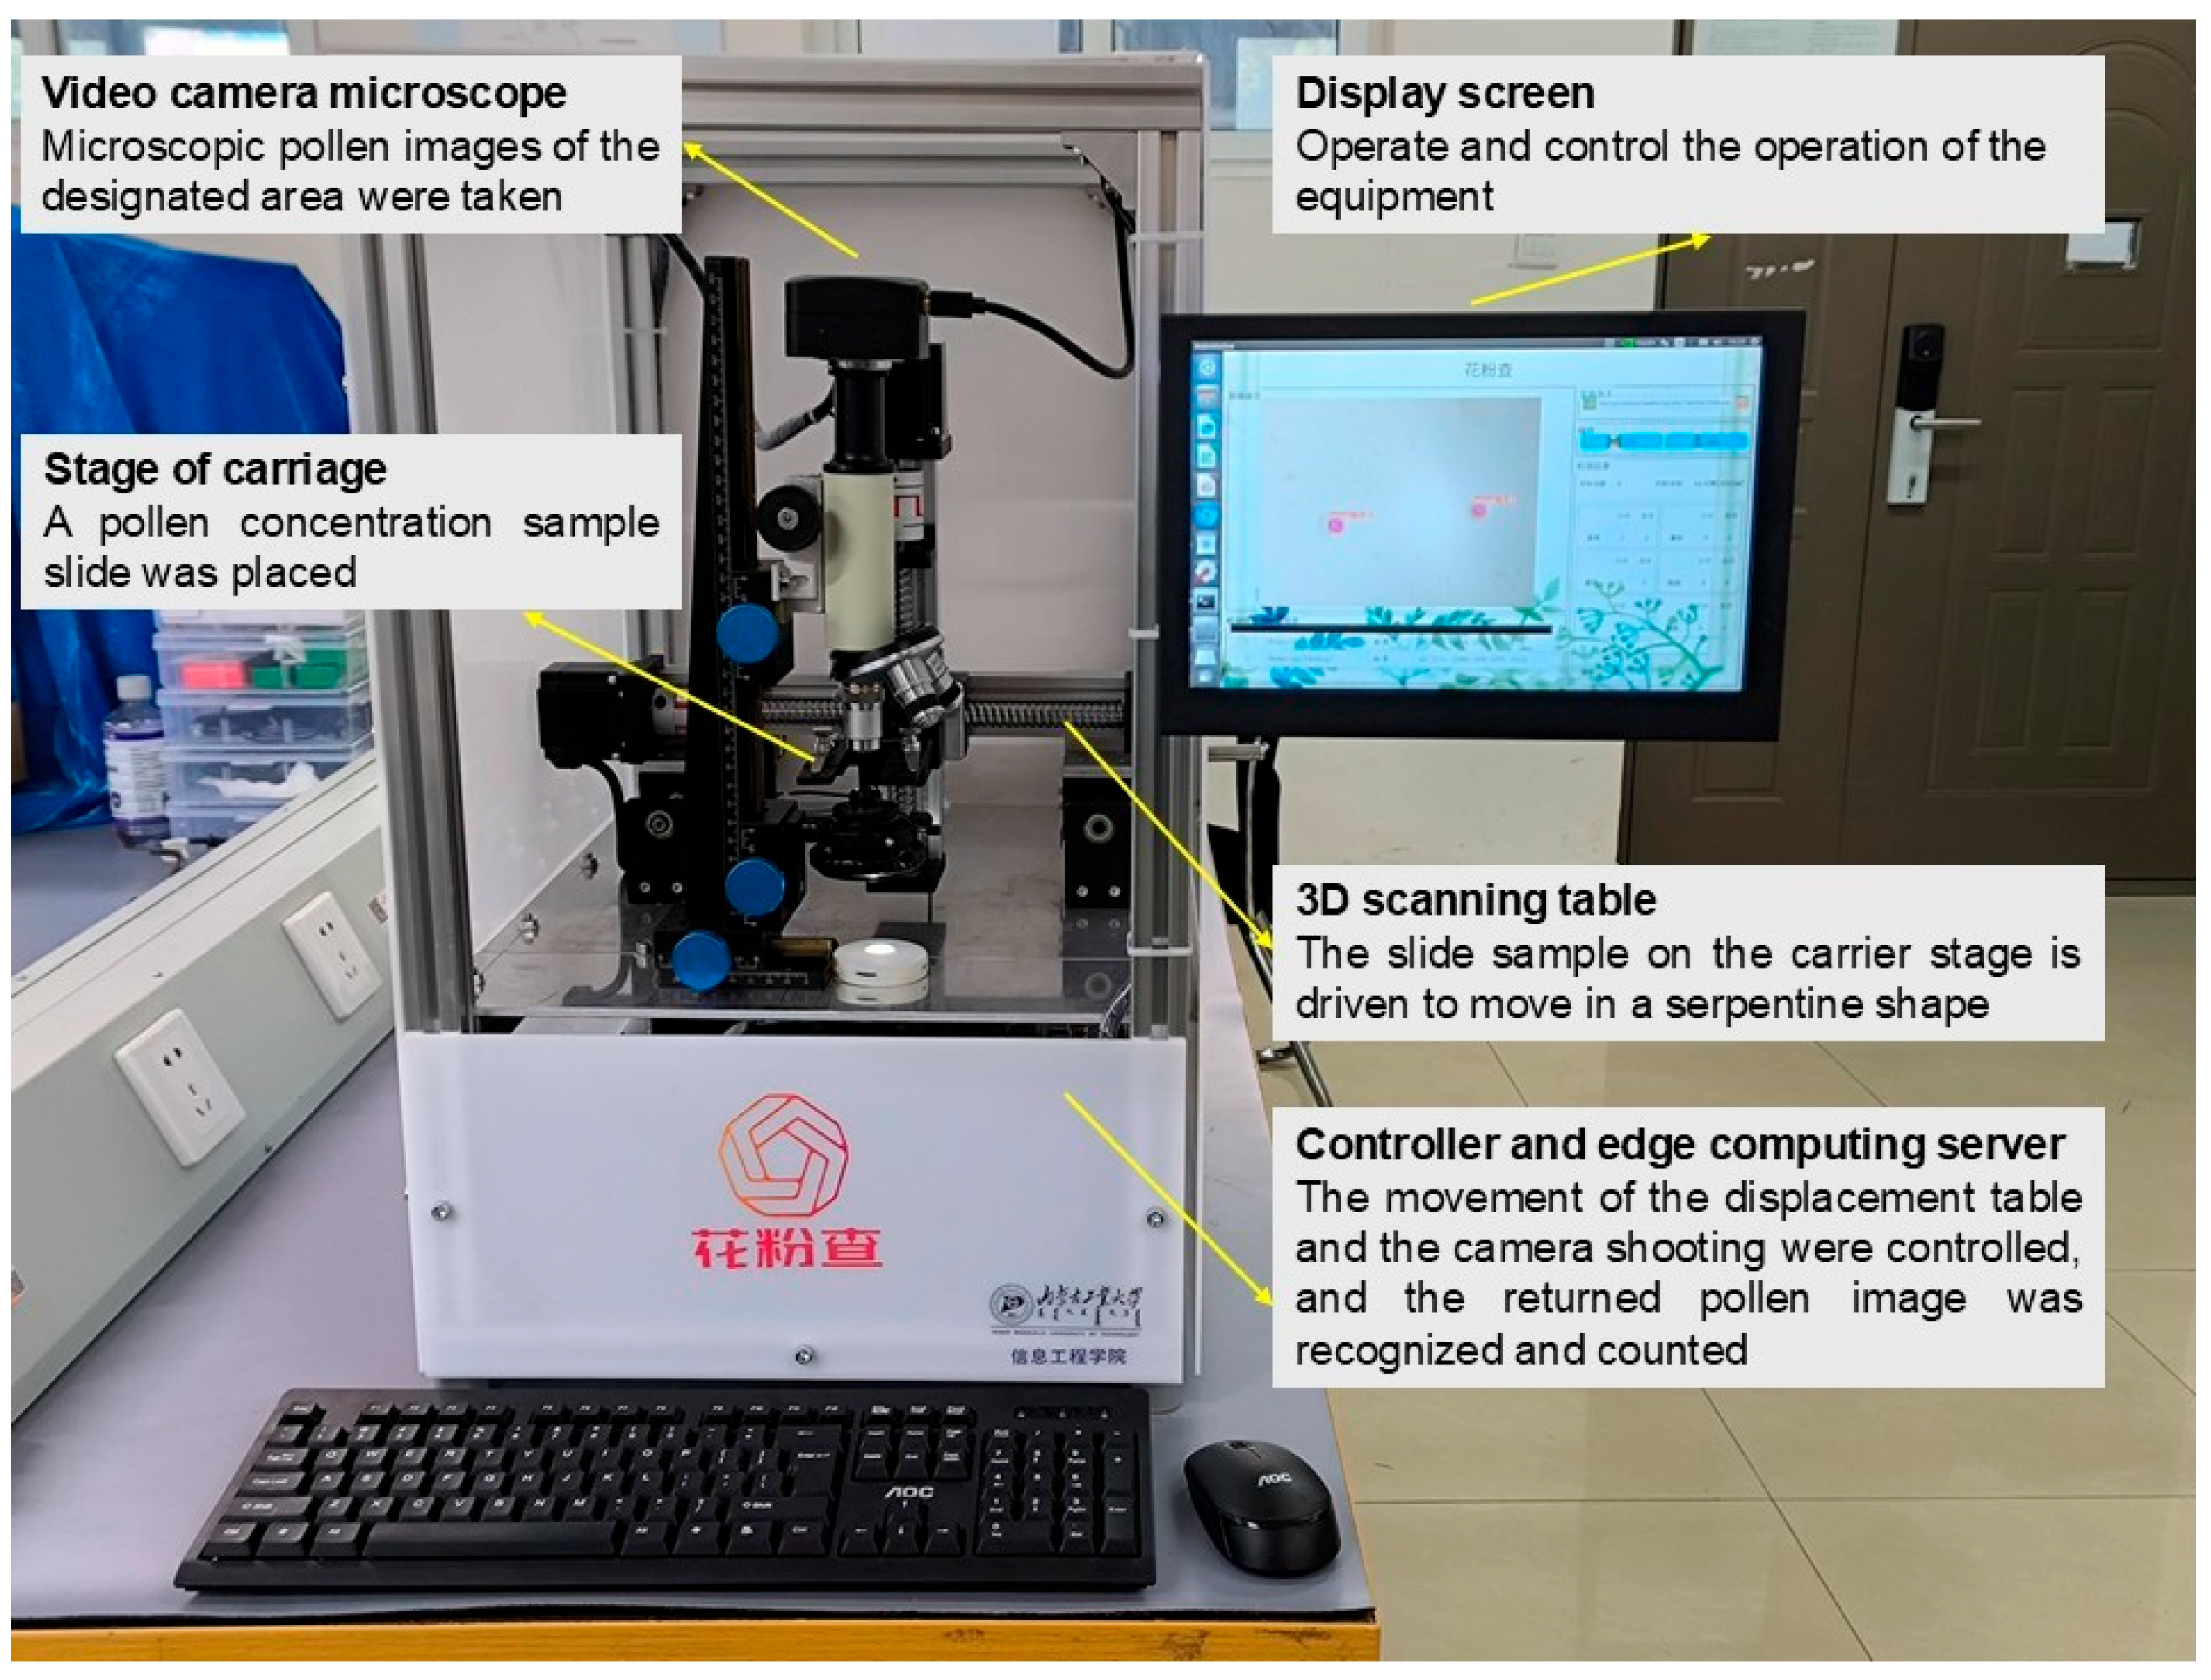
3.6. Embedded Deployment

As illustrated in Figure 19, we developed an automated pollen concentration detection system comprising three functional components. A gravity-sedimentation-prepared pollen sample slide is mounted on a motorized carrier stage, where a three-axis displacement platform enables the precise positioning of the specimen. This configuration allows the integrated microscopic camera system to sequentially capture predetermined sampling areas. The edge computing module, powered by an NVIDIA Jetson Nano processor, executes the embedded GGD-YOLOv8n algorithm for real-time pollen recognition and quantification, ultimately deriving the final concentration measurement through automated statistical analysis.
This study conducted inference speed tests for several algorithms on Jetson Nano, as presented in Table 5 Compared with other commonly used algorithms, the proposed model demonstrates a significant speed advantage, thereby validating the lightweight nature of the proposed network.

3.7. Discussion

It is worth noting that the proposed model not only outperforms various baseline versions of the YOLO series networks and commonly used two-stage object detection networks but also exhibits characteristics such as being lightweight, highly precise, and operating in real time. These attributes effectively address several challenges encountered by prior methods in pollen detection tasks, including low detection efficiency, difficulty in edge deployment, and unbalanced detection accuracy.
However, the generalization ability of this model still requires further validation. Existing public pollen datasets, such as Pollen 13k and Pollen 73s, are primarily designed for classification tasks after segmentation processing and thus cannot be directly utilized to evaluate this model. We are currently developing an image dataset of the primary allergenic pollen from Inner Mongolia during spring. In subsequent work, we will rigorously assess the generalization ability of this model using this new dataset.
Additionally, we have evaluated the scalability of the proposed architecture by extending it to different versions of the YOLO network. Among these, GGD-YOLOv11n demonstrates slightly superior performance compared to our proposed model. Nevertheless, considering the more mature edge AI application ecosystem of YOLOv8, we ultimately decided to enhance YOLOv8n for practical implementation.

4. Conclusions

This study presents the development of GGD-YOLOv8n, a lightweight pollen detection model derived from YOLOv8n, through three structural modifications. Specifically, the original C2f module was replaced with a hybrid architecture integrating C2f and G-Ghost components, the feature pyramid network was upgraded to GFPN, and standard Conv layers were substituted with DualConv operations. These optimizations collectively reduced model complexity by 22.6% (parameters) and 22% (computational load) while improving detection accuracy (+5.4% precision; +4.5% recall; +4.7% mAP50) compared to the baseline YOLOv8n. Experimental validation on custom-built automated pollen detection equipment demonstrated practical efficacy, achieving a 364.9ms per image inference speed (22.5% faster than baseline) through edge deployment on an NVIDIA Jetson Nano processor. Notably, this automated solution significantly outperformed manual detection in terms of the processing speed. Current limitations restrict the model’s application to three predominant autumnal allergenic pollen types in North China. Future work will expand the detection scope by constructing datasets encompassing broader allergenic pollen categories, ultimately aiming to develop scalable solutions for automated pollen monitoring systems.

Author Contributions

Conceptualization, T.Z. and X.J.; writing—original draft preparation, T.Z., H.Z. and Y.C.; data curation, T.Z. and X.J.; writing—review and editing, T.Z., X.J. and Y.C.; project administration, X.J. All authors have read and agreed to the published version of the manuscript.

Funding

This research was funded by the Entrepreneurship Training Program for Chinese College Students (No. 202410128014).

Data Availability Statement

The original contributions presented in the study are included in the article, further inquiries can be directed to the corresponding author.

Conflicts of Interest

The authors declare no conflicts of interest.

References

  1. Weinberg, E.G. THE WAO WHITE BOOK ON ALLERGY 2011–2012. Curr. Allergy Clin. Immunol. 2011, 24, 156–157. [Google Scholar]
  2. Platts-Mills, T.A.E. The Allergy Epidemics: 1870–2010. J. Allergy Clin. Immunol. 2015, 136, 3–13. [Google Scholar] [CrossRef] [PubMed]
  3. Tang, R.; Wang, L.; Yin, J.; Li, H.; Sun, J.; Zhi, Y.; Guan, K.; Wen, L.; Gu, J.; Wang, Z.; et al. History of hay fever in China. Sci. Sin.-Vitae 2021, 51, 901–907. [Google Scholar] [CrossRef]
  4. Stas, M.; Aerts, R.; Hendrickx, M.; Dendoncker, N.; Dujardin, S.; Linard, C.; Nawrot, T.S.; Van Nieuwenhuyse, A.; Aerts, J.-M.; Van Orshoven, J.; et al. Residential Green Space Types, Allergy Symptoms and Mental Health in a Cohort of Tree Pollen Allergy Patients. Landsc. Urban Plan. 2021, 210, 104070. [Google Scholar] [CrossRef]
  5. Kitinoja, M.A.; Hugg, T.T.; Siddika, N.; Yanez, D.R.; Jaakkola, M.S.; Jaakkola, J.J.K. Short-Term Exposure to Pollen and the Risk of Allergic and Asthmatic Manifestations: A Systematic Review and Meta-Analysis. BMJ Open 2020, 10, e029069. [Google Scholar] [CrossRef]
  6. Polling, M.; Li, C.; Cao, L.; Verbeek, F.; De Weger, L.A.; Belmonte, J.; De Linares, C.; Willemse, J.; De Boer, H.; Gravendeel, B. Neural Networks for Increased Accuracy of Allergenic Pollen Monitoring. Sci. Rep. 2021, 11, 11357. [Google Scholar] [CrossRef] [PubMed]
  7. Woosley, A.I. Pollen Extraction for Arid-Land Sediments. J. Field Archaeol. 1978, 5, 349–355. [Google Scholar] [CrossRef]
  8. Clot, B.; Gilge, S.; Hajkova, L.; Magyar, D.; Scheifinger, H.; Sofiev, M.; Bütler, F.; Tummon, F. The EUMETNET AutoPollen Programme: Establishing a Prototype Automatic Pollen Monitoring Network in Europe. Aerobiologia 2020, 40, 3–11. [Google Scholar] [CrossRef]
  9. Viertel, P.; König, M. Pattern Recognition Methodologies for Pollen Grain Image Classification: A Survey. Mach. Vis. Appl. 2022, 33, 18. [Google Scholar] [CrossRef]
  10. Battiato, S.; Ortis, A.; Trenta, F.; Ascari, L.; Politi, M.; Siniscalco, C. POLLEN13K: A Large Scale Microscope Pollen Grain Image Dataset. In Proceedings of the 2020 IEEE International Conference on Image Processing (ICIP), Abu Dhabi, United Arab Emirates, 25–28 October 2020; pp. 2456–2460. [Google Scholar]
  11. Sun, X.-C.; Fu, D.-M.; Qin, L.-L.; Fu, J.-C.; Li, Z.-G. Pollen image recognition model based on dynamic and efficient network. Comput. Eng. Des. 2023, 44, 852–858. [Google Scholar] [CrossRef]
  12. Crouzy, B.; Stella, M.; Konzelmann, T.; Calpini, B.; Clot, B. All-Optical Automatic Pollen Identification: Towards an Operational System. Atmos. Environ. 2016, 140, 202–212. [Google Scholar] [CrossRef]
  13. Zhao, L.-N.; Li, J.-Q.; Cheng, W.-X.; Liu, S.-Q.; Gao, Z.-K.; Xu, X.; Ye, C.-H.; You, H.-L. Simulation Palynologists for Pollinosis Prevention: A Progressive Learning of Pollen Localization and Classification for Whole Slide Images. Biology 2022, 11, 1841. [Google Scholar] [CrossRef] [PubMed]
  14. Redmon, J.; Divvala, S.; Girshick, R.; Farhadi, A. You Only Look Once: Unified, Real-Time Object Detection. In Proceedings of the 2016 IEEE Conference on Computer Vision and Pattern Recognition (CVPR), Las Vegas, NV, USA, 27–30 June 2016; pp. 779–788. [Google Scholar]
  15. Zhang, C.-J.; Liu, T.; Wang, J.; Zhai, D.; Chen, M.; Gao, Y.; Yu, J.; Wu, H.-Z. DeepPollenCount: A Swin-Transformer-YOLOv5-Based Deep Learning Method for Pollen Counting in Various Plant Species. Aerobiologia 2024, 40, 425–436. [Google Scholar] [CrossRef]
  16. Tan, Z.; Yang, J.; Li, Q.; Su, F.; Yang, T.; Wang, W.; Aierxi, A.; Zhang, X.; Yang, W.; Kong, J.; et al. PollenDetect: An Open-Source Pollen Viability Status Recognition System Based on Deep Learning Neural Networks. Int. J. Mol. Sci. 2022, 23, 13469. [Google Scholar] [CrossRef] [PubMed]
  17. Qingyuan, L.I.; Zhaohong, D.; Xiaoqing, L.U.O.; Xin, G.U.; Shitong, W. SSD Object Detection Algorithm with Attention and Cross-Scale Fusion. J. Front. Comput. Sci. Technol. 2022, 16, 2575. [Google Scholar] [CrossRef]
  18. Lin, T.-Y.; Goyal, P.; Girshick, R.; He, K.; Dollár, P. Focal Loss for Dense Object Detection. In Proceedings of the 2017 IEEE International Conference on Computer Vision (ICCV), Venice, Italy, 22–29 October 2017; pp. 2999–3007. [Google Scholar]
  19. He, K.; Zhang, X.; Ren, S.; Sun, J. Spatial Pyramid Pooling in Deep Convolutional Networks for Visual Recognition. IEEE Trans. Pattern Anal. Mach. Intell. 2015, 37, 1904–1916. [Google Scholar] [CrossRef] [PubMed]
  20. Ren, S.; He, K.; Girshick, R.; Sun, J. Faster R-CNN: Towards Real-Time Object Detection with Region Proposal Networks. arXiv 2016, arXiv:1506.01497v3. [Google Scholar] [CrossRef] [PubMed]
  21. Lin, T.-Y.; Dollár, P.; Girshick, R.; He, K.; Hariharan, B.; Belongie, S. Feature Pyramid Networks for Object Detection. In Proceedings of the 2017 IEEE Conference on Computer Vision and Pattern Recognition (CVPR), Honolulu, HI, USA, 21–26 July 2017; pp. 936–944. [Google Scholar]
  22. Han, K.; Wang, Y.; Xu, C.; Guo, J.; Xu, C.; Wu, E.; Tian, Q. GhostNets on Heterogeneous Devices via Cheap Operations. Int. J. Comput. Vis. 2022, 130, 1050–1069. [Google Scholar] [CrossRef]
  23. Han, K.; Wang, Y.; Tian, Q.; Guo, J.; Xu, C.; Xu, C. GhostNet: More Features from Cheap Operations. In Proceedings of the IEEE/CVF Conference on Computer Vision and Pattern Recognition (CVPR), Seattle, WA, USA, 14–19 June 2020; pp. 1580–1589. [Google Scholar]
  24. Jiang, Y.; Tan, Z.; Wang, J.; Sun, X.; Lin, M.; Li, H. GiraffeDet: A Heavy-Neck Paradigm for Object Detection. arXiv 2022, arXiv:2202.04256v2. [Google Scholar]
  25. Zhong, J.; Chen, J.; Mian, A. DualConv: Dual Convolutional Kernels for Lightweight Deep Neural Networks. IEEE Trans. Neural Netw. Learn. Syst. 2023, 34, 9528–9535. [Google Scholar] [CrossRef] [PubMed]
Figure 1. Example images of various types of pollen in the dataset.
Symmetry 17 00849 g001
Figure 2. Pollen image dataset production steps.
Symmetry 17 00849 g002
Figure 3. Distribution of the number of each class in the dataset.
Symmetry 17 00849 g003
Figure 4. YOLOv8 network structure diagram, mainly comprising Conv, C2f, SPPF and Detect modules.
Symmetry 17 00849 g004
Figure 5. Network structure diagram of GGD-YOLOv8. It is mainly composed of a DualConv module, a C2f-G-GhostBottleneck module, a C2f-GFPN module, an SPPF module, and a Detect module.
Symmetry 17 00849 g005
Figure 6. Visualization of ResNet50. Three similar feature maps are annotated with boxes of the same color (red boxes represent one type of similar feature map, while white boxes represent another type of similar feature map).
Symmetry 17 00849 g006
Figure 7. Schematic diagram of the Ghost module structure. The network first compresses input channels via 1 × 1 convolutions, then generates supplementary features through efficient linear ops (depthwise 3 × 3/5 × 5 kernels).
Symmetry 17 00849 g007
Figure 8. Schematic diagram of Ghost.
Symmetry 17 00849 g008
Figure 9. Schematic diagram of G-Ghost.
Symmetry 17 00849 g009
Figure 10. Hybrid operation for aggregating.
Symmetry 17 00849 g010
Figure 11. Iterative design of a feature pyramid network from level 3 to level 7 (P3-P7). (a) FPN: a top-down approach to aggregating multi-scale features; (b) PANet: an additional bottom-up approach is added compared to FPN; (c) BiFPN: compared with PANet, bidirectional cross-scale channels are added; (d) GFPN: compared with PANet, Queen Fusion and cross-scale connection are added.
Symmetry 17 00849 g011
Figure 12. log 2 n l i n k skip layer connections.
Symmetry 17 00849 g012
Figure 13. Improved cross-scale structure design. S represents the sum; C represents the concatenation; P k refers to the node of the next layer.
Symmetry 17 00849 g013
Figure 14. DualConv network architecture: internal structure of 1 × 1 and 3 × 3 dual convolutional kernels.
Symmetry 17 00849 g014
Figure 15. Diagram of three lightweight convolutional architectures.
Symmetry 17 00849 g015
Figure 16. (a) Original detection results of YOLOv8n and (b) detection results of GGD-YOLOv8n.
Symmetry 17 00849 g016
Figure 17. Comparison of PR curves between YOLOv8n and GGD-YOLOv8n.
Symmetry 17 00849 g017
Figure 18. Comparison of detection results between YOLOv8n and GGD-YOLOv8n.
Symmetry 17 00849 g018
Figure 19. Automatic pollen concentration detection equipment.
Symmetry 17 00849 g019
Table 1. Training parameter settings.
Parameter NameParameter Settings
Weightsnone
Img-size1280 × 1280
Epochs100
Batch-sizes8
Table 2. Training hyperparameter settings.
Parameter NameParameter SettingsParameter Explanation
Lr00.01Initial learning rate
Lrf0.01Cyclic learning rate
Momentum0.937Learning rate momentum
Weight_decay0.0005Weight decay factor
The rest of the parameters are set as default parameters.
Table 3. Performance evaluation of different algorithms.
AlgorithmParameter/MPrecision/%Recall/%mAP/%
YOLOv5n2.586.191.594.2
YOLOv7-tiny6.181.785.389.6
YOLOv8n (baseline)3.083.187.891.2
YOLOv10n2.784.486.792.2
YOLOv11n2.688.191.895.6
Swin-Transformer-YOLOv5l54.589.693.196.4
GGD-YOLOv8n2.388.592.395.9
Table 4. Results of ablation experiments.
AlgorithmParameter/MPrecision/%Recall/%mAP/%
YOLOv8n3.0183.187.891.2
YOLOv8n + G-Ghost2.5987.991.894.7
YOLOv8n + GFPN2.9883.386.792.0
YOLOv8n + DualConv2.7986.390.693.6
YOLOv8n + G-Ghost + GFPN2.5688.991.294.8
YOLOv8n + G-Ghost + DualConv2.3681.986.772.6
YOLOv8n + GFPN + DualConv2.7684.290.092.6
YOLOv8n + G-Ghost+GFPN + DualConv2.3388.592.395.9
Table 5. Comparison of reasoning times on Jetson Nano.
ModelsInference Time (Per Picture)
YOLOv5n392.4 ms
YOLOv7-tiny492.3 ms
YOLOv8n470.8 ms
YOLOv10n600.4 ms
YOLOv11n510.2 ms
GGD-YOLOv8n364.9 ms
Disclaimer/Publisher’s Note: The statements, opinions and data contained in all publications are solely those of the individual author(s) and contributor(s) and not of MDPI and/or the editor(s). MDPI and/or the editor(s) disclaim responsibility for any injury to people or property resulting from any ideas, methods, instructions or products referred to in the content.

