Article

Study of Numerical Modeling Method for Precooling of Spherical Horticultural Produce Stacked Symmetrically in Vented Package

1
The College of Electrical Engineering, Zhejiang University of Water Resources and Electric Power, Hangzhou 310018, China
2
Belarus Joint Laboratory of Intelligent Equipment and System for Water Conservancy and Hydropower Safety Monitoring, Hangzhou 310018, China
3
Zhejiang Dunan Cold Chain System Co., Ltd., Hangzhou 310051, China
*
Authors to whom correspondence should be addressed.
Symmetry 2025, 17(6), 810; https://doi.org/10.3390/sym17060810
Submission received: 21 April 2025 / Revised: 20 May 2025 / Accepted: 21 May 2025 / Published: 22 May 2025
(This article belongs to the Section Engineering and Materials)

Abstract

Numerical simulation has become a pivotal tool for analyzing airflow dynamics and temperature patterns during the precooling of postharvest horticultural products stacked in vented package. In this study, a three-dimensional mathematical model for iceberg lettuces stacked symmetrically in plastic crate was developed. The influence of the physical model at different gap sizes on the simulation accuracy was studied by assessing wall drag coefficient, airflow distribution, and heat transfer efficiency. The results show a reasonable decrease in the drag coefficient with an increasing gap size to 6 mm in terms of airflow distribution inside the plastic crate; any further increase in gap size and the average airflow velocity in both windward and leeward sides decreases rapidly. Interestingly, the gap size exhibited a limited impact on heat transfer characteristics during the cooling process. Thus, 6 mm was found to be the optimal distance to ensure good accuracy in simulation results and reduce the complexity of grid division. The numerical model was verified by experimental data. Moreover, the validation confirms good consistency between the simulated predictions and experimental measurements. This study provides a theoretical basis for establishing a reliable numerical model for the precooling of agricultural produce stacked symmetrically in a vented package.

1. Introduction

Fresh agricultural products serve as vital sources of essential nutrients, contributing to human health maintenance and disease risk mitigation [1,2]. Nevertheless, horticultural produce is prone to deterioration, resulting in large economic losses in the postharvest circulation process [3]. Temperature enormously affects the deterioration rate and products qualities during handling after harvest. So, prompt pre-cooling by lowering the produce temperatures to optimal storage condition plays a pivotal role in decelerating the metabolic processes such as respiratory function and preserving product quality [4,5]. Among various postharvest precooling methods, forced-air precooling (FAC) is a popularly adopted precooling method in horticultural products because of its low cost and universality [6]. FAC adopts an axial fan to generate the pressure differential to force the cooling air via vents in the box through stacked fresh products, cooling products through efficient convection heat transfer.
Numerous researchers [7,8] have extensively investigated the airflow and heat transfer characteristics within the vented packaging of agricultural products during FAC using experimental methods. These studies aimed to achieve quick and uniform precooling. However, conventional simple field experiments face limitations such as extensive human power and material resource demands, and a long experimental cycle. And they cannot obtain some valuable information in detail and maintain microcosmic resolution under the high spatiotemporal resolution [9]. Furthermore, computational fluid dynamic (CFD) simulation has become more popular in studies on the postharvest processing of agricultural products as it can easily realize a complex airflow and good temperature distribution [10,11,12,13]. In order to analyze the airflow and temperature pattern inside a vented package of horticultural produce during the FAC process, a three-dimensional (3D) CFD model of pomegranates [14], kiwifruits [15] and apples [16] stacked in vented box was developed, respectively, demonstrating both the feasibility and reliability of this numerical modeling. In addition, many researchers are focusing on optimizing package design to obtain uniform airflow and temperature distribution [17,18]. There are also researchers analyzing the precooling energy consumption related to different corrugated carton designs [19,20]. However, most of the vegetable package forms currently available on fruit and vegetable wholesale markets are plastic crates with large opening areas.
Current research in this field still exhibits notable limitations. For instance, Defraeye et al. [21] evaluated the cooling efficiency of orange packaging existing in the market and novel container designs, using pallet stacking during the FAC process by CFD simulation. The numerical model was simulated by a discrete approach, and the simulated results showed good consistency with the experimental data, affirming the reliability of numerical modeling. However, the influence of respiration and transpiration heat on the product-cooling process was not included in the governing equations. During the FAC of postharvest agricultural products, due to the mutual contact between the stacked agricultural products inside the vented box and between the agricultural products and the box wall, unstable and distorted mesh can form around the contact points when the grid is divided. Such mesh distortion may compromise simulation accuracy and convergence. In order to address grid integrity concerns, O′Sullivan et al. [12] developed a 3D numerical model for predicting the temperature distribution in palletized polylined kiwifruit packaging undergoing FAC and proposed that 2 mm was the minimum inter-product spacing that could prevent the occurrence of instability in the simulated results. However, this study focused solely on mesh integrity thresholds without establishing an optimized gap size under comprehensive consideration of other possible factors (i.e., complexity of grid division). Also, the study aimed to give the minimum gap to ensure mesh integrity and stability, irrespective of other parameters (i.e., airflow characteristics). Consequently, determining an optimal gap size that balances simulation accuracy, computational expense, and multiparameter interactions remains an unresolved challenge.
This work establishes 3D numerical modeling for spherical horticultural produce stacked symmetrically in a plastic crate to study precooling performance during the FAC process. We have considered the physiological processes of agricultural produce comprehensively and established a governing equation for the product domain. This paper focuses on optimizing the physical model by analyzing the influence of the gap size in adjacent products stacked in the package on the accuracy of the simulated results, thereby establishing a dependable numerical model to be adopted in CFD simulations for horticultural products during FAC. Furthermore, the simulated results were validated through systematic comparison with experiment measurements.

2. Materials and Methods
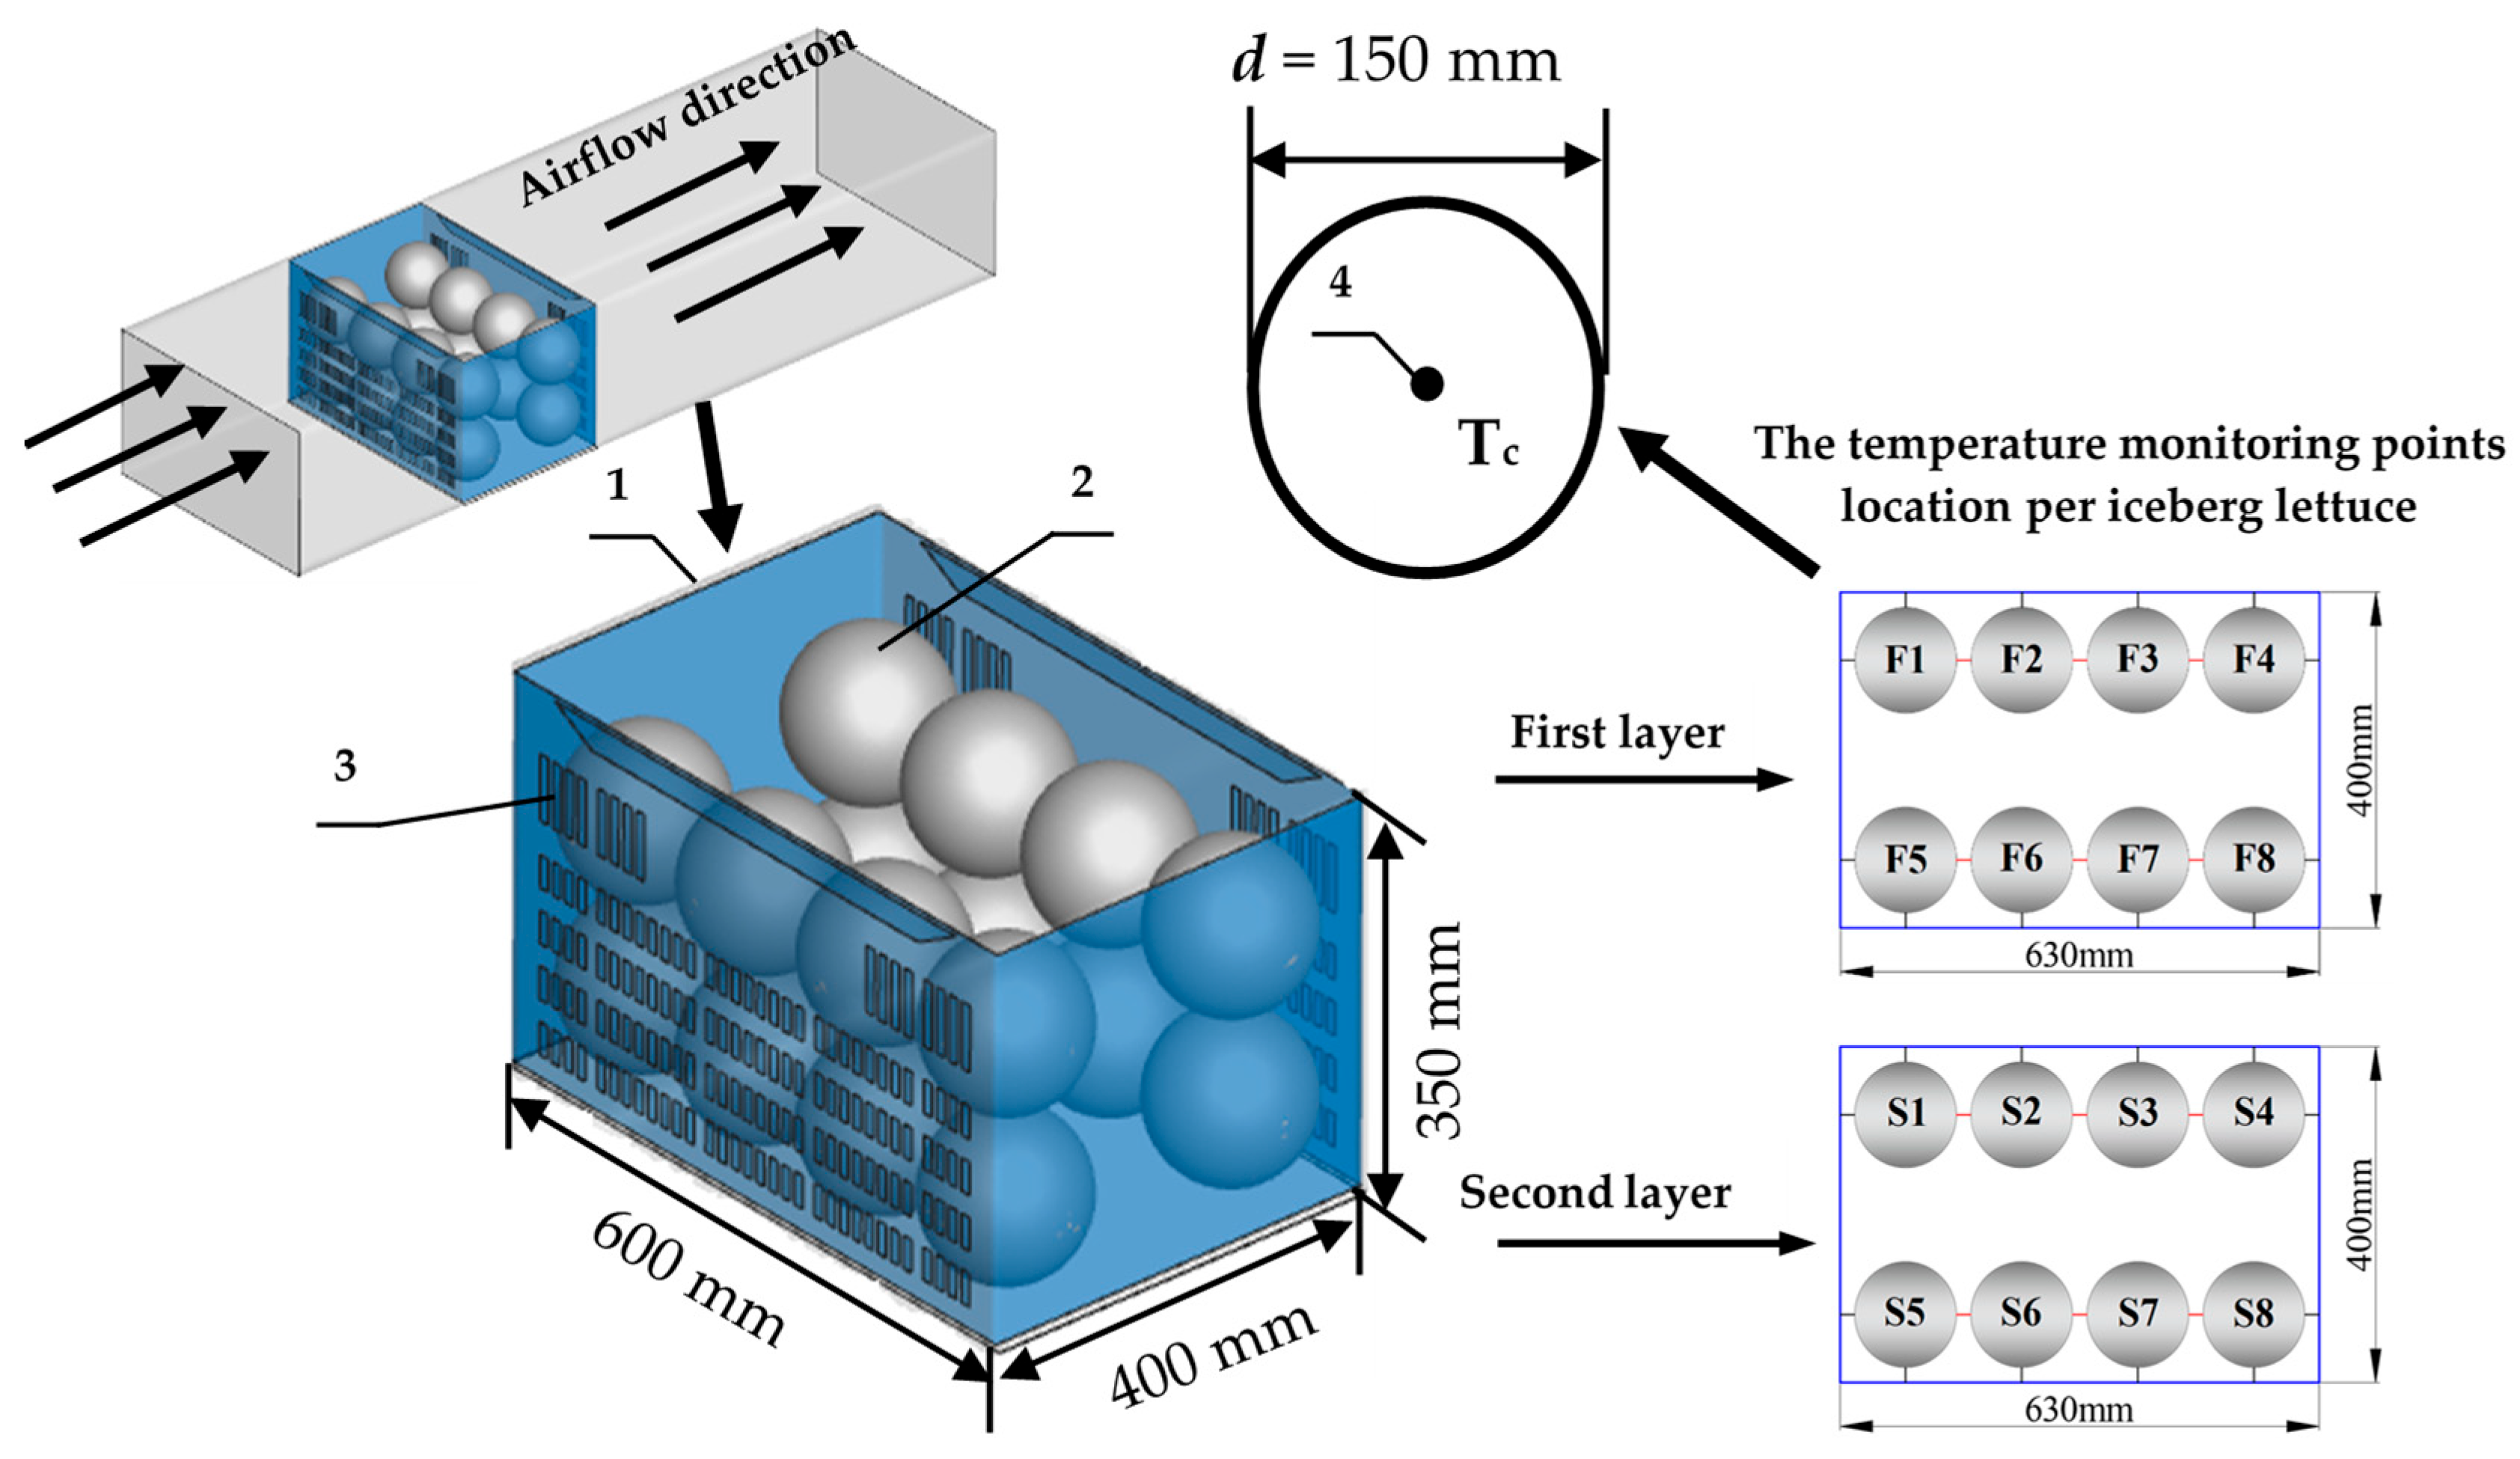
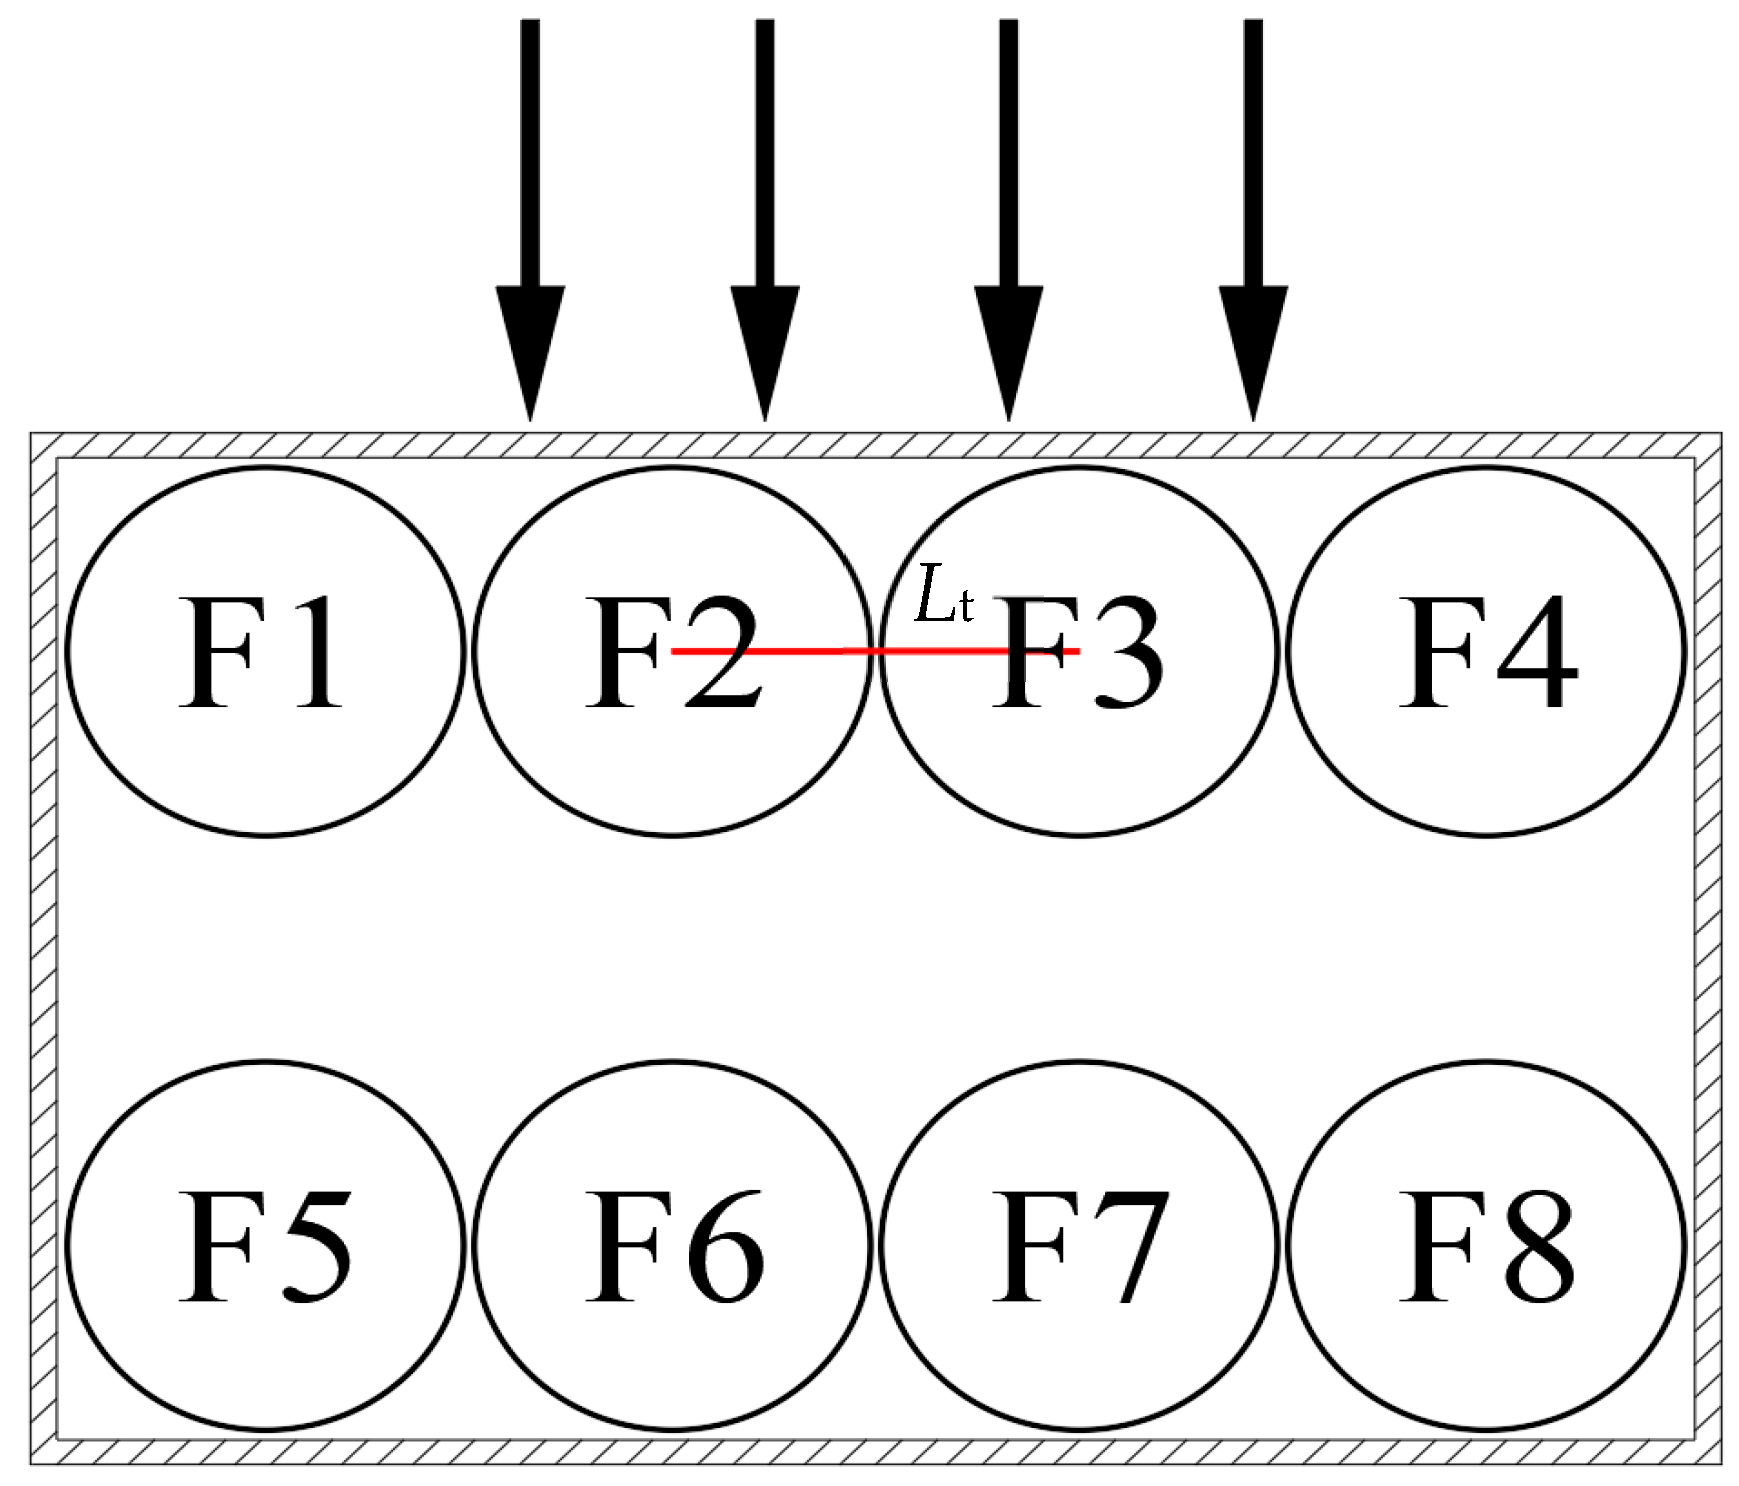
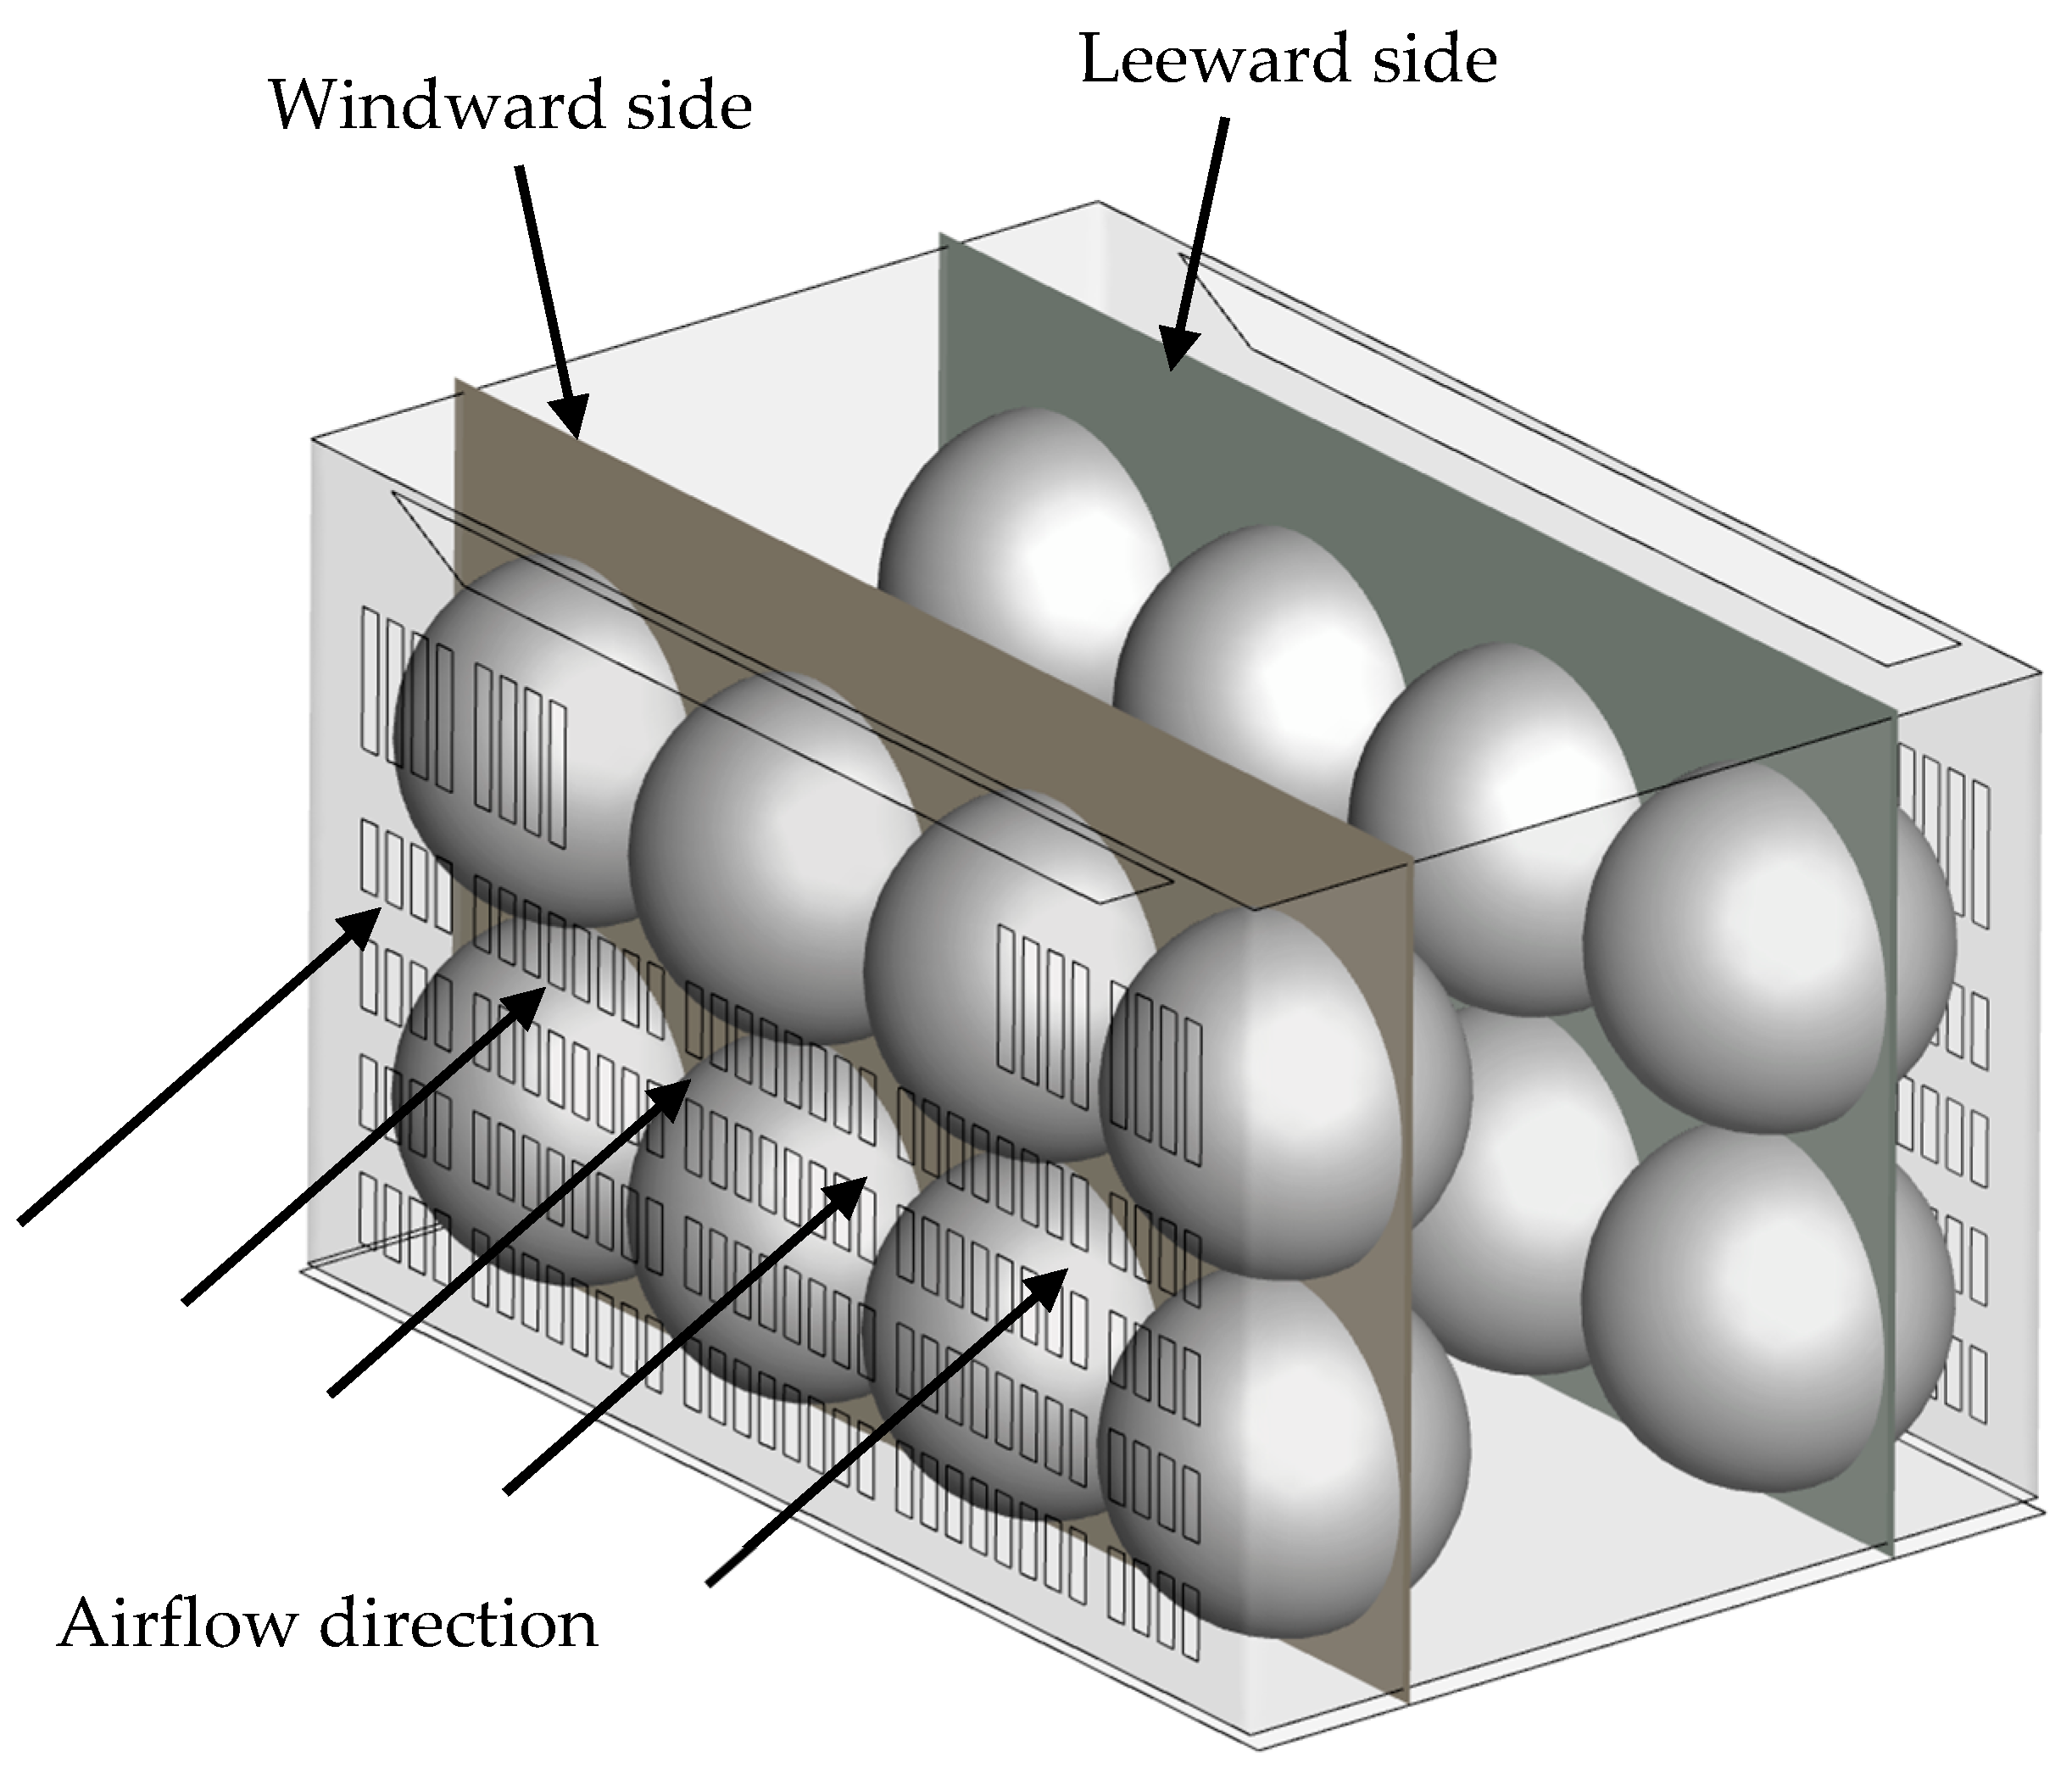
2.1. Physical Model

A standard polypropylene container (600 × 400 × 350 mm), widely utilized in China’s farmers’ markets for vegetables storage, was studied. This paper takes iceberg lettuce as the research object. Uniformly sized, disease-free products (mean diameter: 150 ± 5 mm; weight: 600 ± 20 g) were obtained from a local wholesale market. Each plastic crate contained two layers with eight vegetables per layer. The eight lettuces per layer were symmetrically arranged (see Figure 1) to ensure that the distance between each ball and the wall of the package is same. The iceberg lettuces without any inner plastic packaging were systematically positioned using a parallel alignment configuration within a ventilated container.
In the physical model, each iceberg lettuce was replaced by an equal-diameter (150 mm) sphere when establishing the physical model. When gaps are forced between produce and between products and the package wall, the length of the overall physical model increases correspondingly. Therefore, the corresponding physical model lengths for gap sizes of 2, 4, 6, 8, and 10 mm are 610, 620, 630, 640 and 650 mm, respectively. The physical model with a gap size of 6 mm is shown in Figure 1, detailing critical geometric parameters of both the polymetric container and spherical products, along with their spatial distribution patterns.

2.2. Experimental Designs

2.2.1. Experimental Device

The experimental platform of FAC was set up (see Figure 2). The plastic crate was placed in a circulating air duck environment. A centrifugal fan established controlled pressure gradients across the package to induce uniform cooling airflow penetration through the packaging vents and around individual iceberg lettuces. The fan’s rotational velocity was precisely regulated voltage modulation, enabling the dynamic adjustment of airflow intensity. During the whole precooling process, the FAC experiment platform maintained good hermetic seal to ensure that the internal environmental temperature of virtual wind tunnel remained at 2 °C.
Before the precooling experiment, the refrigeration compressor and centrifugal fan were turned on, and the cold air (2 °C) was circulated in the virtual wind tunnel for a period of time. The relative humidity in the virtual wind tunnel was maintained at 90% to prevent the moisture loss of iceberg lettuce controlled by the humidifier. Once the temperature and the relative humidity in the circulating air duck environment reached the required precooling start conditions, the package stacked with iceberg lettuces was placed into the FAC experiment platform.
The initial temperature of the package and the products was 27 °C for the experiments. Real-time thermal evolution of the iceberg lettuce was tracked using thermocouples with continuous monitoring, enabling precise experimental termination. Iceberg lettuces located in the first and second layer were labeled F1–F8 and S1–S8, respectively, as shown in Figure 1. The central monitoring point Tc of each individual iceberg lettuce was used, as shown in Figure 1. In order to compare to the simulated results, a K-type wireless thermometer was adopted to monitor the change process of the center temperature (Tc) in real time for products F2 and S6. Furthermore, central temperature profiles for the iceberg lettuces were recorded automatically every 60 s by a wireless multi-point temperature data recorder.

2.2.2. Equipment Parameters

The K-type wireless thermometers operated within a thermal range of –40 °C to 120 °C, maintaining a measurement precision of ±0.3 °C. Anemometric measurements on the cooling air inlet side of the polymetric container were conducted using a TSI 9545-A anemometer, covering flow velocities from 0 to 30 m s−1, with an instrumental error margin of ±0.03 m s−1. The ambient temperature and hygrometric parameters (%RH) were recorded using a 179-TH digital data logger, with an operating range of –40 to 100 °C in temperature and an operating range of 0 to 100% relative humidity, coupled with respective accuracies of ±0.3 °C and ±3%.

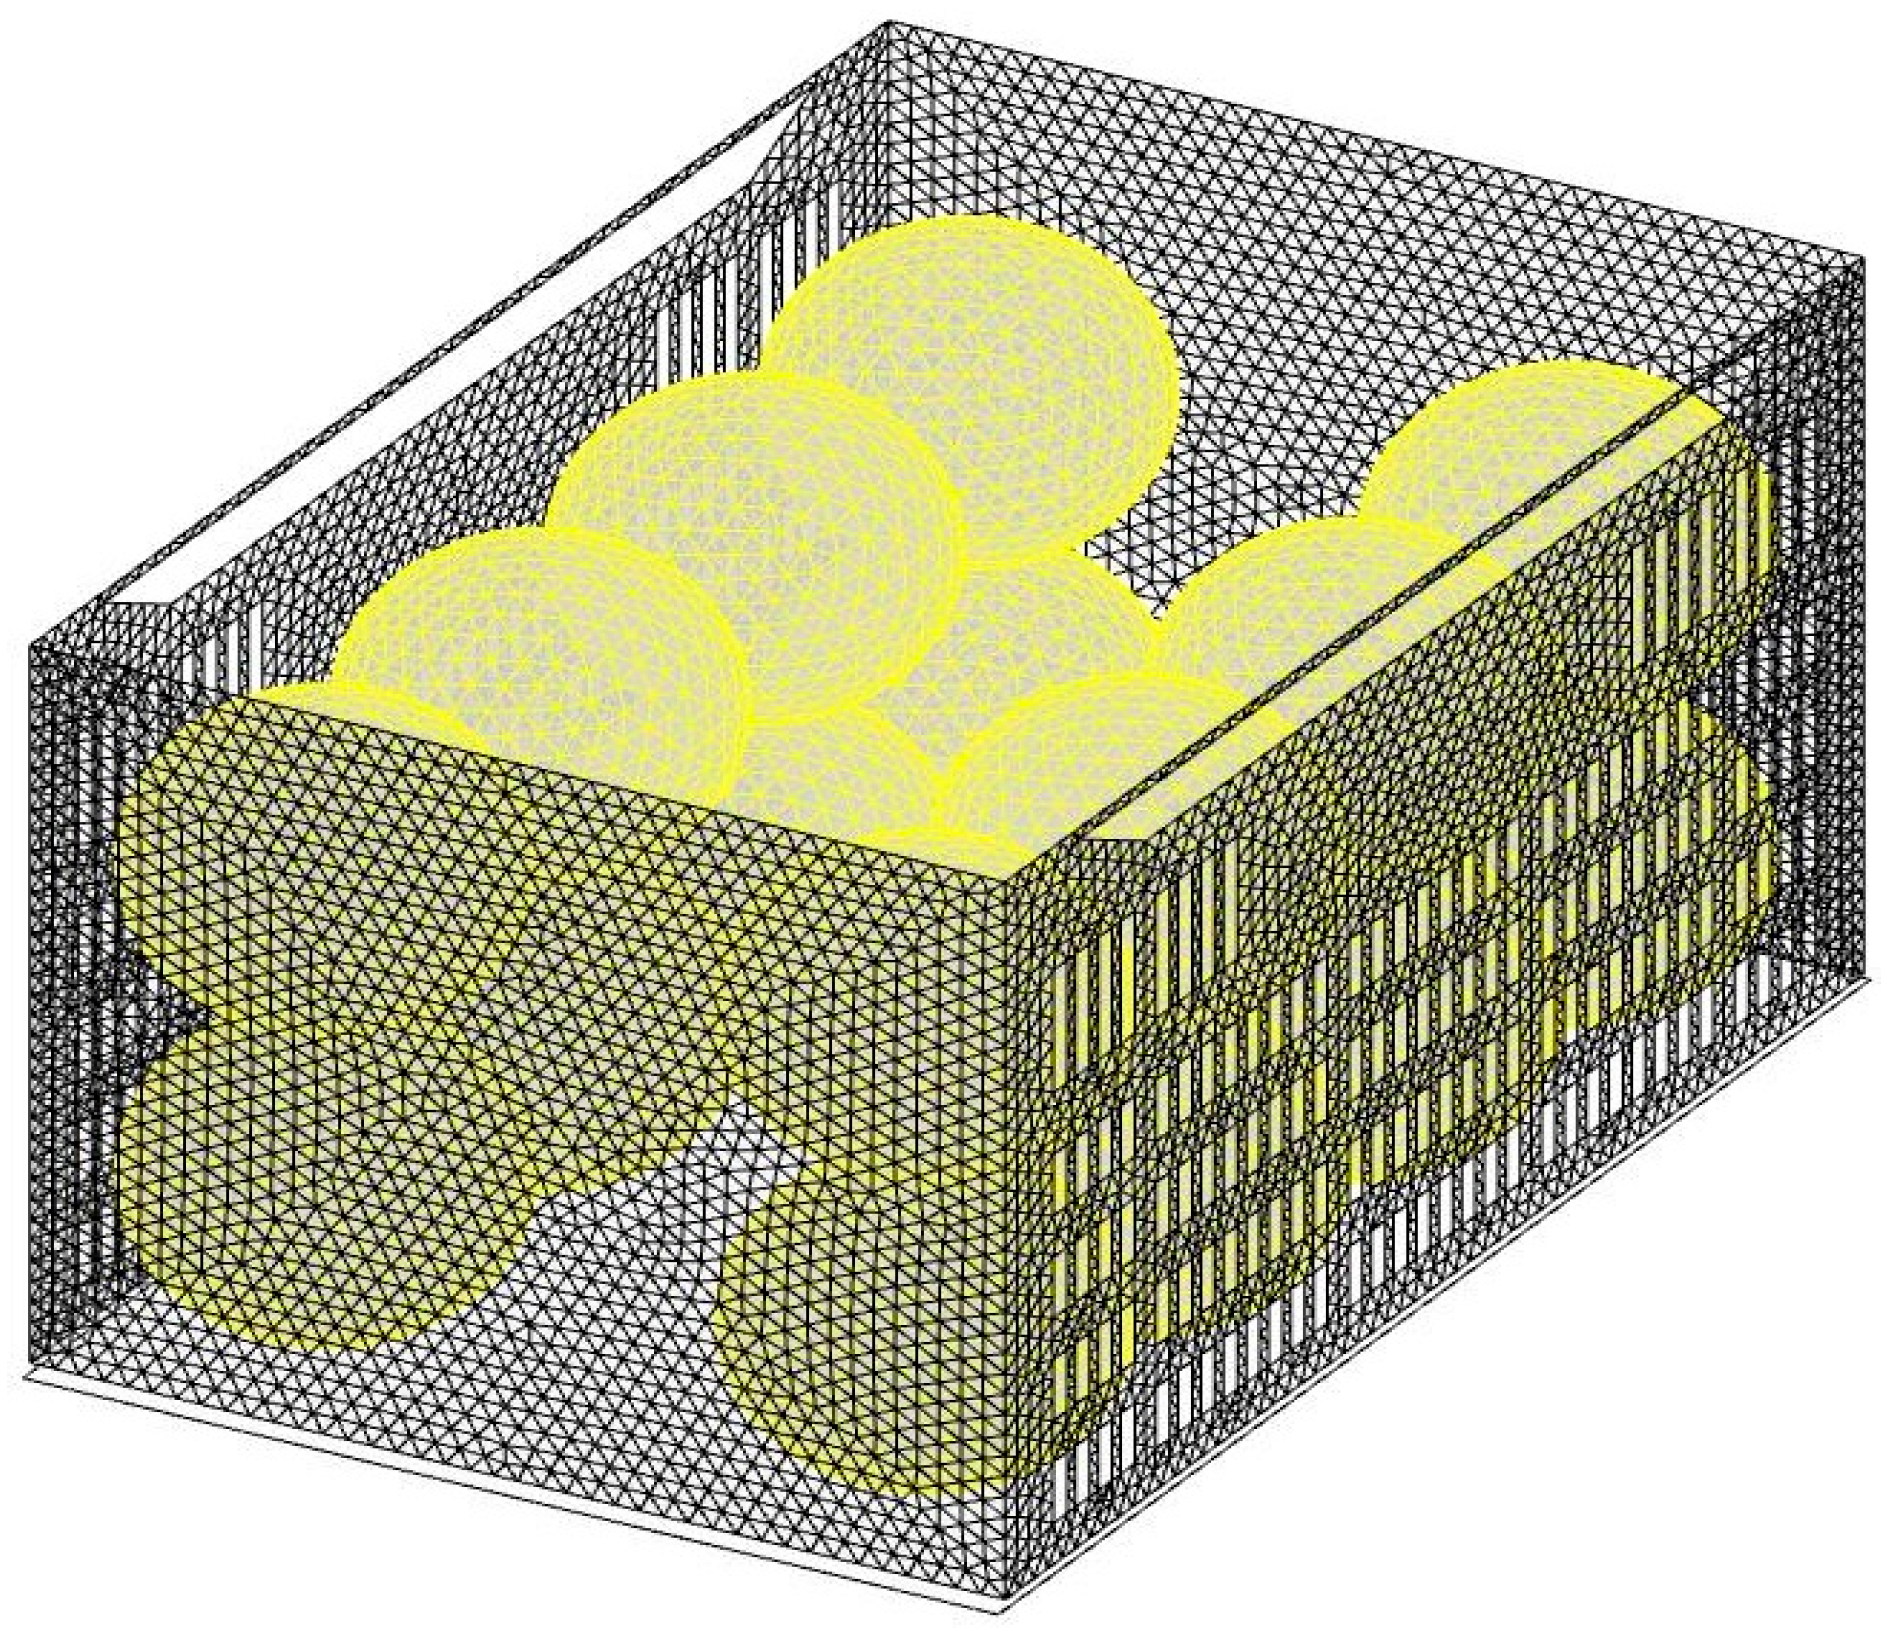
2.3. Numerical Modeling

2.3.1. Modeling Hypothesis

In this paper, a 3D CFD model including iceberg lettuces and a plastic crate is established. The FAC process of agricultural products is a complex unsteady heat and mass transfer process, involving multiphysics interactions that encompass both convective-driven sensible heat transfer and latent mechanisms involving conduction, radiation, and biological processes (transpiration/respiration). Consequently, so as to facilitate calculations for the numerical model while preserving experiment fidelity, the following modeling hypotheses were implemented [20,22,23]:
  • Individual iceberg lettuces were geometrically idealized as homogeneous isotropic spheres with a diameter of 150 mm. The effects of product ripening or senescence on respiration and transpiration were not considered.
  • The impact of radiation between iceberg lettuces, the cooling air, and the plastic crate on the simulated results was assumed to be negligible.
  • Any influence of experimental instruments on airflow was not considered.
  • The cooling air was regarded as Newtonian fluid and the gas medium was considered transparent in the visible range.
  • The thermophysical properties of the cooling air and produce were assumed to be constant throughout the whole FAC process.

2.3.2. Governing Equations

The computational domain was divided into the cooling free-airflow zone, product zone, and air–produce coupling interface zone. The governing equations for each subdomain are as follows.
The transport equations for the cooling airflow region were solved using the Reynolds-averaged Navier–Stokes (RANS) equations [24,25].
The mass conservation equation is given as
( ρ a ) t + ρ a u i x i = 0
The momentum conservation equation is given as
( ρ a u i ) t + ( ρ a u i u j ) x j = P x i + x j μ a u i x j + u j x i x j ρ a u i u j ¯     1 α T T 0 ρ a g
The energy conservation equation is given as
t ρ a c a T + x j ρ a c a u j T = x j ( λ a T a x j ) x j ρ a c a u j T a ¯
where ρa (kg m−3) is the cooling air density; t (s) is time; ui, uj (m s−1) are the cooling air velocity components in the x, y directions, respectively; xi, xj (m) are the Cartesian coordinates; P (N m−2) is the airflow pressure; μa (Pa s) is the dynamic viscosity; α (K−1) is the thermal expansion coefficient, Ta (K) is the cooling air temperature inside the plastic crate; T0 (K) is the reference temperature; u i u j ¯ is the Reynolds stress term; ca (J kg−1 K−1) is the specific heat capacity of cooling air; λa (W m−1 K−1) is the thermal conductivity for cooling air. T (K) is the cooling air temperature; T′ (K) is the fluctuating cooling air temperature.
For the iceberg lettuce domain, the primary internal heat sources include latent heat released from the products’ surface condensation (Qcon, W) and convective heat transfer from the products’ surface (Qconv, W) [26,27], respiration (Qr, W), and transpiration (Qe, W) [28,29]. Accordingly, the heat transfer equations involved in this region are defined as follows [30]:
ρ il c il T il t = λ il 2 T il + S e        
S e = Q r Q e + Q con Q conv V il        
Q r =   ρ il q r V il      
q r = 0.003   f 1.8 T il , m + 32 g        
Q e = L il m t A il  
m t = k t P sp P ap             P wp   >   P ap ,         P sp   >   P ap             0                                   other                                    
Q con = L il m con A il
m con = k a P ap P sp       P ap   >   P wp                     0                           other
Q conv = h il T il T a A il
where ρil (kg m−3) is the iceberg lettuce density, cil (J kg−1 K−1) is the iceberg lettuce specific heat capacity, Til (K) is the iceberg lettuce temperature, λil (W m−1 K−1) is the thermal conductivity for iceberg lettuce, Se (W m−3) represents the heat-source term, qr (W kg−1) represents the respiration heat release per unit mass, Vil (m3) is the volume for individual iceberg lettuces, Lil (J kg−1) represents the latent heat for evaporation, Ail (m2) is the surface area for individual iceberg lettuces, mt (kg m−2 s−1) is the moisture loss rate from iceberg lettuces, and kt (kg m−2 s−1 Pa−1) represents the transpiration coefficient. The quantity Pwp (Pa) represents the saturation water vapor partial pressure, Psp (Pa) represents the water vapor partial pressure of the evaporating surface, Pap (Pa) represents the water vapor partial pressure in cooling air, mcon (kg m−2 s−1) represents the condensation coefficient, and hil (W m−2 K−1) represents the heat transfer coefficient of the produce surface.
At the cooling air and produce coupling interface zone, based on energy conservation, the increase in air-side volumetric heat should equal a decrease in produce-side volumetric heat. Therefore, the corresponding air–produce interface heat transfer balance equation [9] is as follows:
λ a T a λ il T il n ap = L il m con L il m t h il ( T il T a )  
where nap represents the unit vector normal to the air–produce interface.

2.4. Initial and Boundary Conditions

The appropriate initial and boundary conditions were applied to solve the governing equations listed above. The initial conditions of the iceberg lettuces and plastic crate were maintained at 27 °C, similar to the beginning of the FAC process in the experiments.
  • Inlet boundary. The velocity-inlet boundary condition was adopted to define the airflow velocity at the inlet, which was set to 1 m s−1. The inlet cold air temperature was set to 2 °C.
  • Outlet boundary. At the outlet, a fully developed flow section boundary condition was imposed, where the outlet velocity was computed based on the mass conservation equation. The other variable gradients normal to the flow direction were also set to zero at the outlet [31].
  • Wall boundary. The iceberg lettuce surface and the inner and outer wall surfaces of the polymetric container were considered as no-slip wall boundary conditions, which assumed normal velocity components and normal gradients equal to zero at the boundary.

2.5. Numerical Simulation

The three-dimensional computational mesh was constructed utilizing the Gambit 2.4.6 software, an advanced CFD preprocessing tool for high-fidelity grid generation. The hybrid mesh was constructed for different regions by using the Tet/Hybrid meshing element and meshing type TGrid [32]. The grids near the spherical produce surfaces were refined locally. The total numbers of meshes for the overall model corresponding to different gap sizes were 2,274,016 (2 mm), 1,660,989 (4 mm), 835,671 (6 mm), 744,149 (8 mm), and 689,365 (10 mm). Through checking the mesh quality, it was found that the skewness of the overall model meshes under different gap sizes were all less than 0.93. A schematic diagram of the overall model meshing under a 6 mm gap size is given in Figure 3.
To enhance numerical convergence and mitigate grid distortion at contact points between products and container walls, a certain spacing was created between individual connecting points. Previous studies have shown that the gap size at the contact point when simulating agricultural products with a diameter of 70–80 mm is 2–3 mm [12,33]. Therefore, a simulated gap size value of 2 mm was used as the reference value to compare the changes in the drag coefficient Cd (14), heat transfer characteristics of the produce, and the airflow characteristics inside the plastic crate under different gap sizes. The temperature distribution on the central connection line (Lt, Figure 4) of the iceberg lettuce and the convective heat transfer coefficients (CHTC) on agricultural product surfaces were studied after 90 min of cooling.
C d = A p · τ 0.5 · ρ a · v 0 2 · A t
where τ (Pa) is the wall shear stress of airflow direction, Ap = πd2 (m2) is the surface area of an iceberg lettuce, and At = 0.25πd2 (m2) is the characteristic area of a single product perpendicular to the airflow direction, i.e., Cd = 8τ/ρav02.
The precooling dynamic phenomenon was investigated through a transient simulation approach, employing a 60 s time step with 40 iterations per time step during numerical simulation. Pressure–velocity coupling was achieved through the SIMPLE algorithm. Comparative analysis revealed that the shear stress transport (SST) κ-ω model exhibited better accuracy and convergence than the other two-equation turbulence models [34]. So, the (SST) κ-ω turbulence model was applied in this work.

3. Results

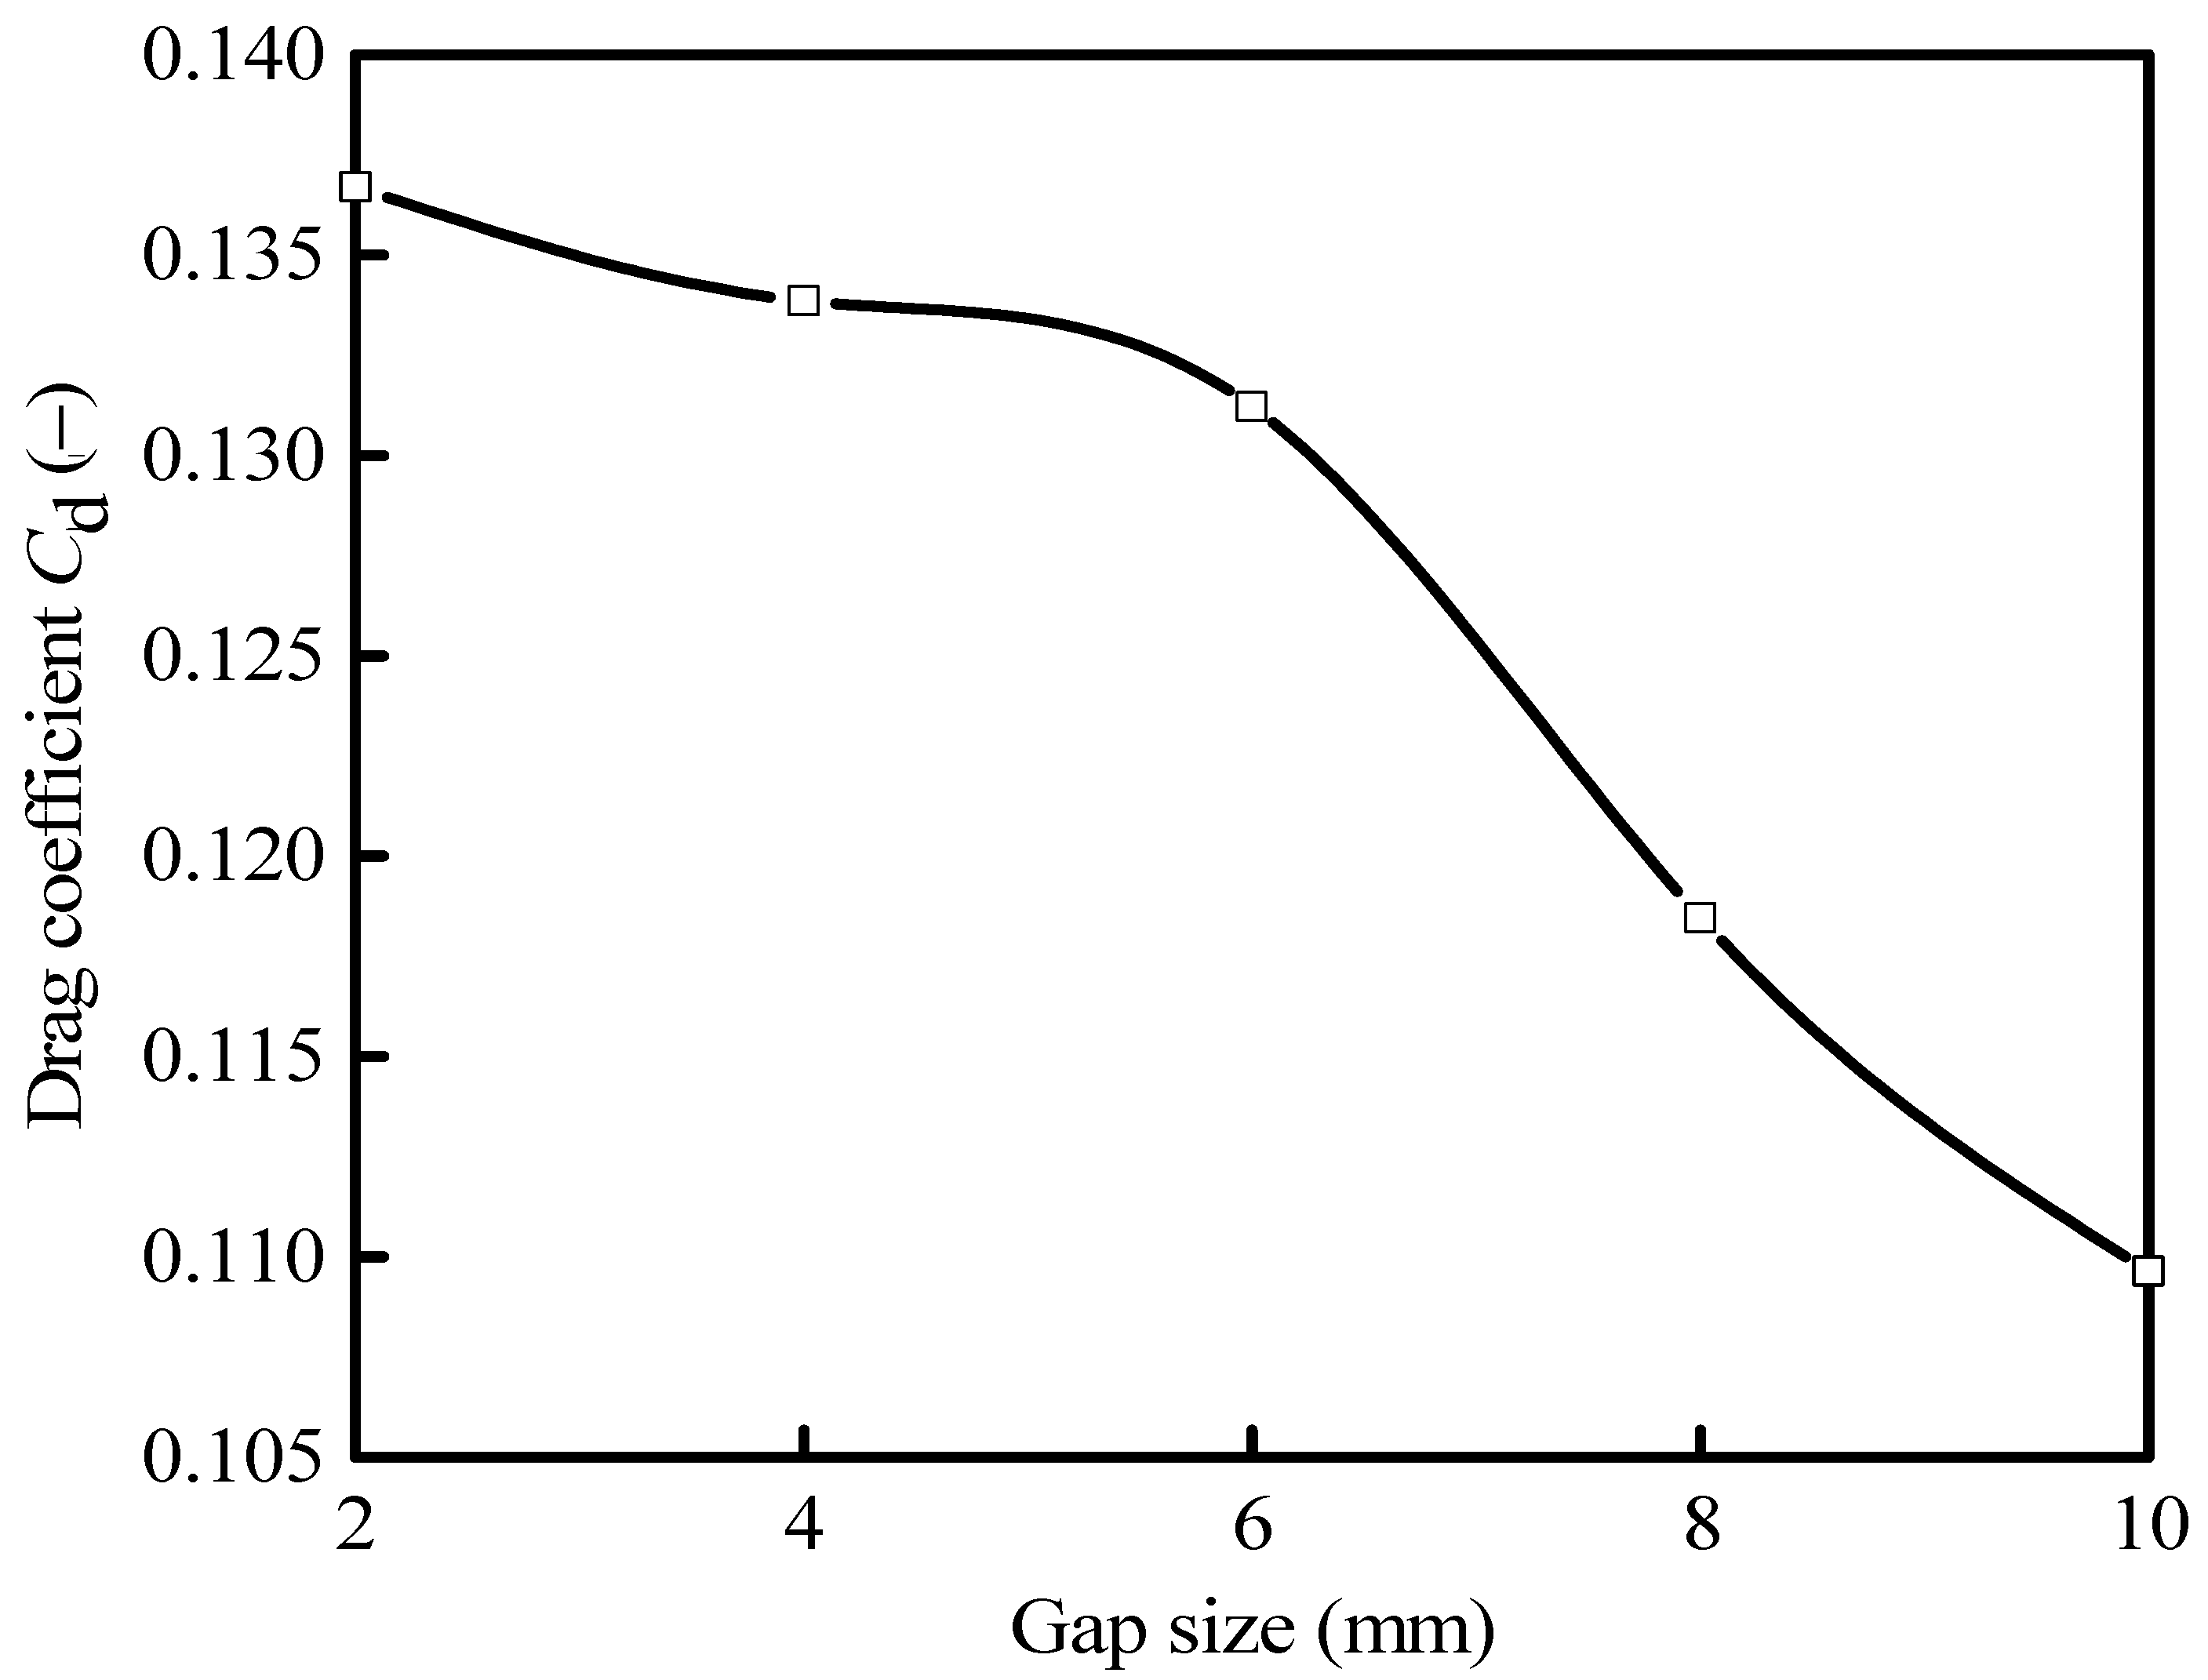
3.1. Drag Coefficient

The effect of the gap size between adjacent horticultural produce on the drag coefficient during precooling was studied, adopting the transient simulation of five different gap sizes: 2, 4, 6, 8n and 10 mm. From Figure 5, it can be seen that the drag coefficient shows a gradually decreasing trend with the increasing gap size. Compared to the reference value (2 mm gap size), the reduction rate in the drag coefficient at 4, 6, 8, and 10 mm gap sizes was 2.1%, 4.0%, 11.5%, and 16.4%, respectively. This indicates that with the increase in gap size, the deviation from the reference value also increases. When the gap size between adjacent iceberg lettuces and between produce and the wall of the plastic crate was 8 mm, the deviation rate from the reference value for drag coefficient exceeded 10%. This means that the drag coefficient at 8 mm has a greater deviation from the iceberg lettuces’ contact with each other when stacked in the plastic crate at during the actual precooling process. Therefore, according to the analysis of the flow field parameter value (drag coefficient), in order to reduce the calculation time and save computational resources while ensuring the accuracy of the numerical simulation results, it is recommended to construct a physical model with a 6 mm gap size between adjacent iceberg lettuces and between iceberg lettuces and the package wall when CFD is applied to the numerical simulation of a forced-air cooling process for fresh agricultural products.

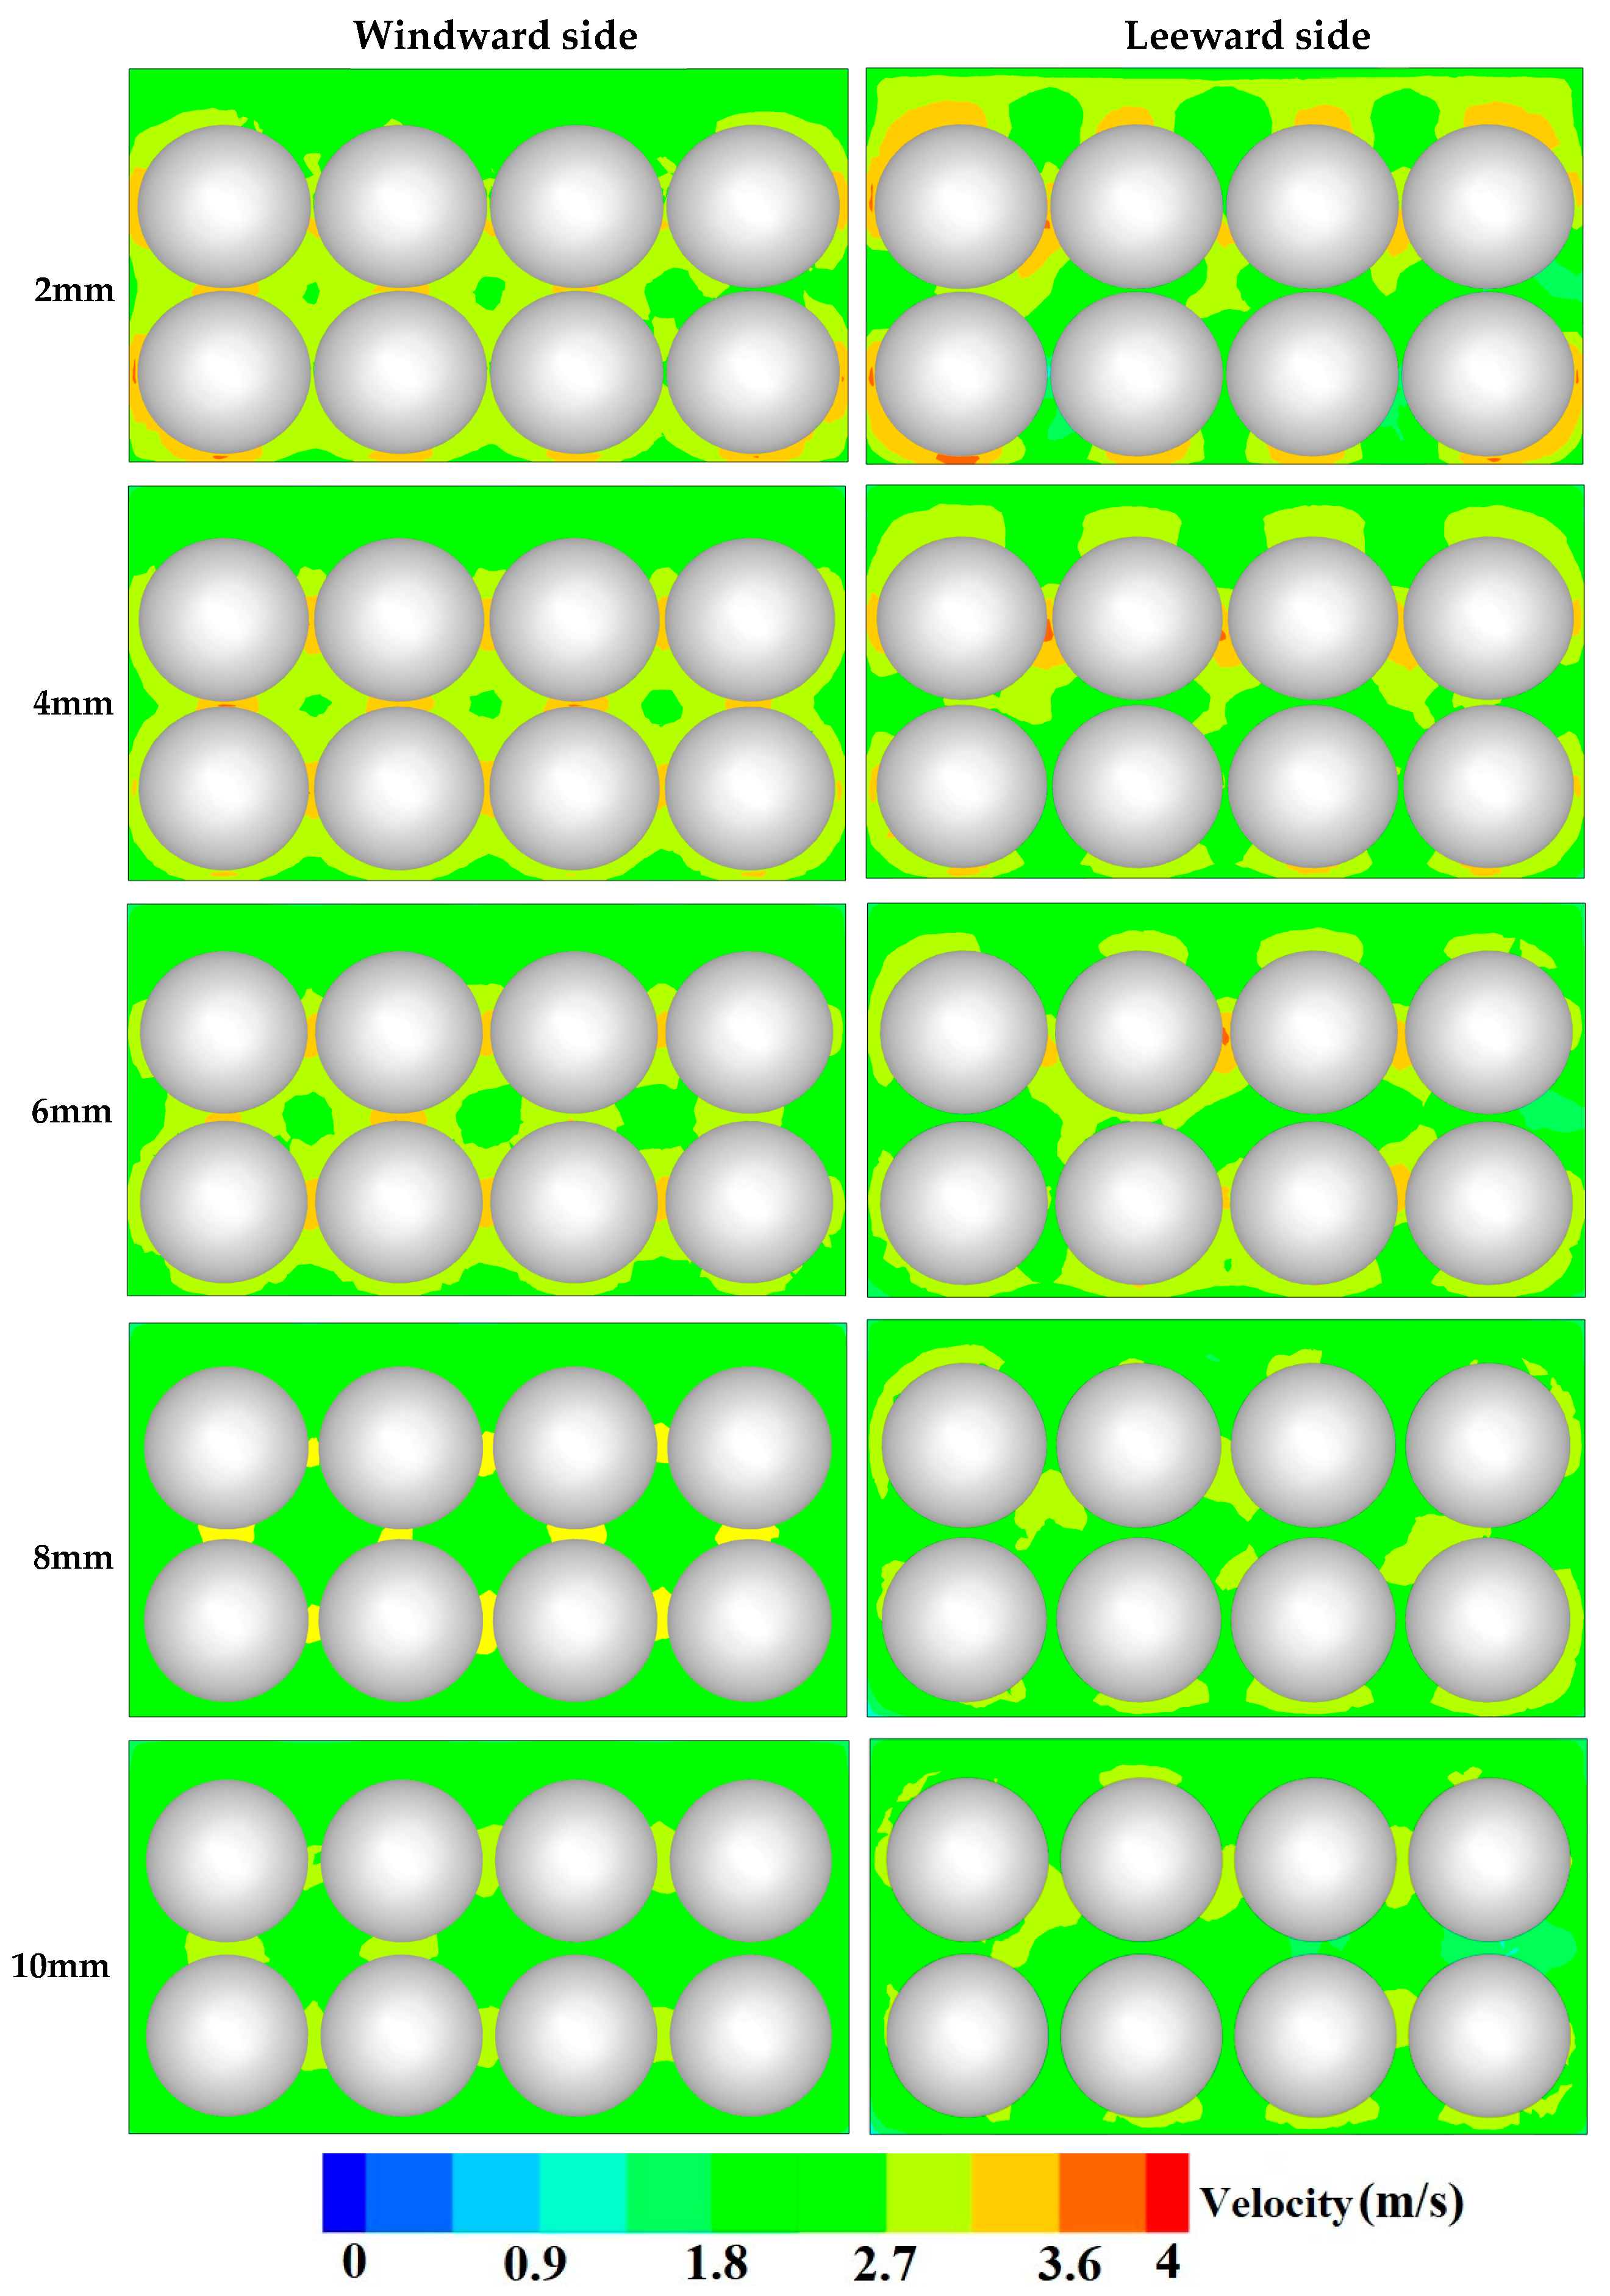
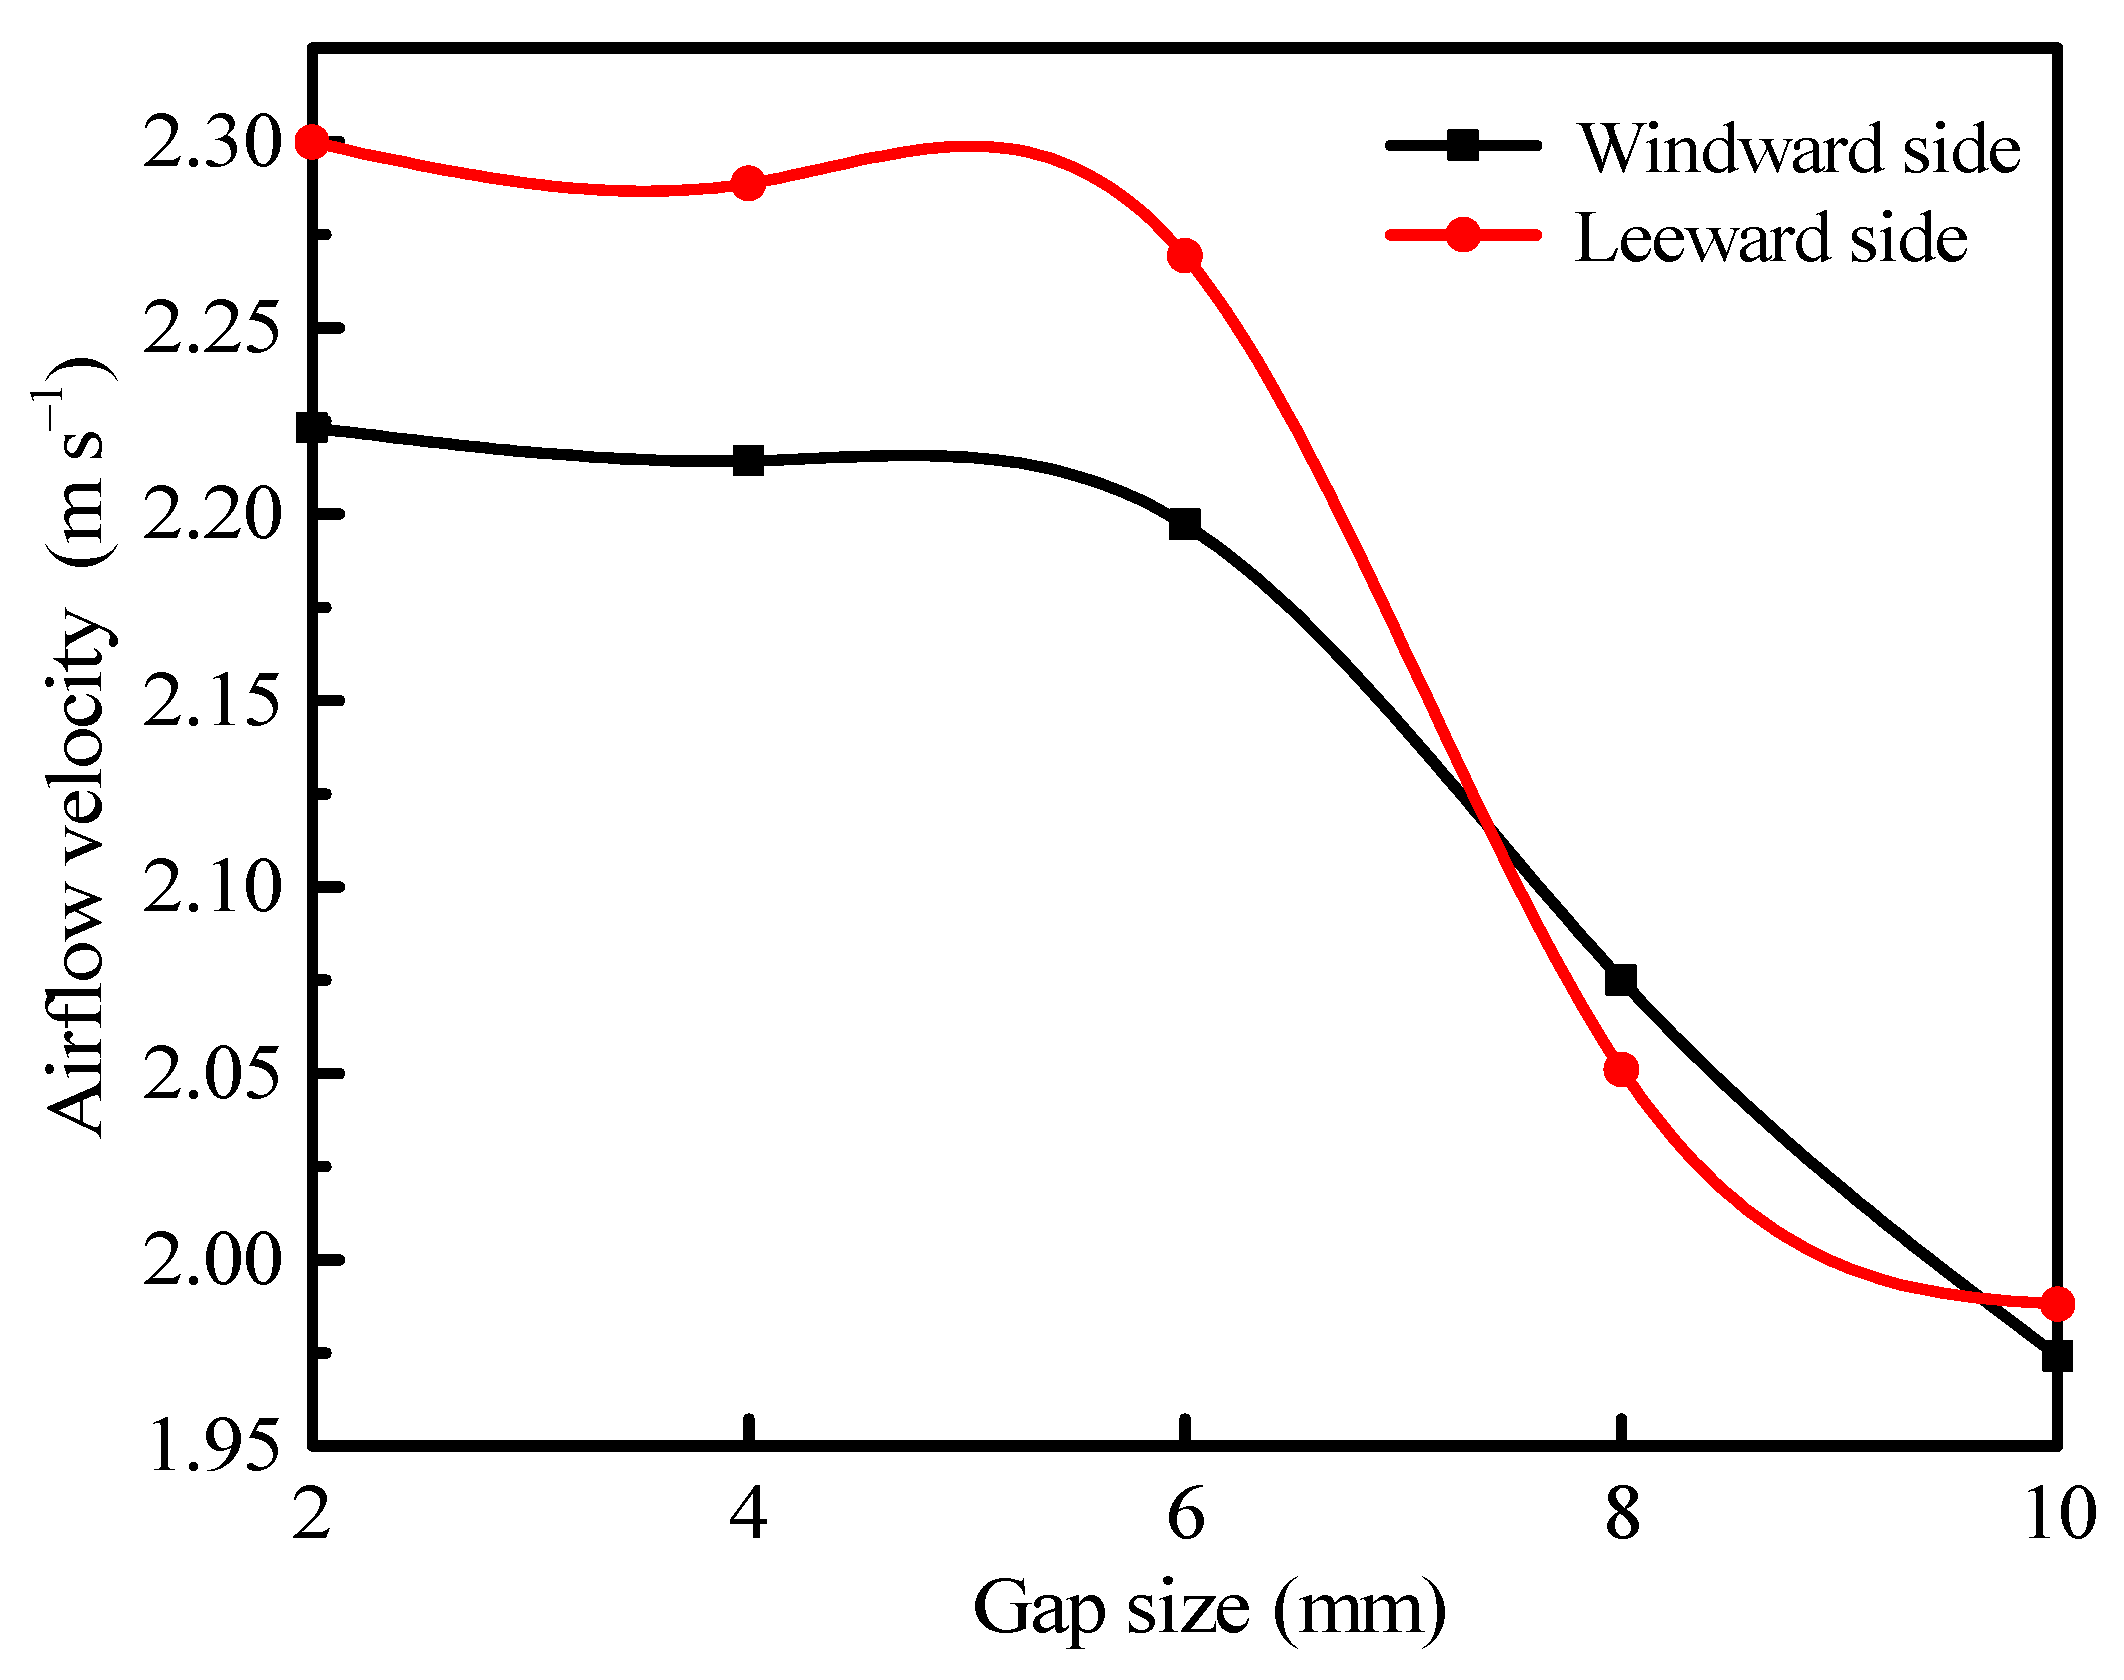
3.2. Airflow Characteristics

When there is a certain gap at the contact points of adjacent iceberg lettuces, as well as between iceberg lettuces and the package wall, the flow resistance of cold airflow through the local contact point position is reduced, and the simulated airflow field distribution inside the plastic crate during the pre-cooling process deviates from the actual condition, thereby resulting in distorted simulation results. In order to study the deviation degree for airflow distribution and heat transfer characteristics inside the plastic crate from the reference value during the pre-cooling process under different gap sizes, two typical vertical planes were selected for comparative analysis. As shown in Figure 6, there were the windward and leeward sides, respectively.
The airflow distribution inside the plastic crate under different gap sizes is shown in Figure 7. The closer to red, the higher the speed value in the region, and the closer to blue, the lower the speed value in the region. As shown in Figure 7, as the gap size increases, the larger speed zone at the contact point gradually decreases. When the gap size exceeds 6 mm, the orange zone at the gap almost disappears. It can be seen that when the gap size exceeds 6 mm, it causes a significant reduction in the local larger speed zone inside the plastic crate. During the actual pre-cooling process, due to the reduced cross-sectional area of the airflow channel, the velocity near the contact point between vegetables is relatively high. Therefore, the presence of a high-velocity area near the contact point is consistent with the airflow field distribution during the actual pre-cooling process of agricultural produce. However, when the gap size increases to 8 mm and 10 mm, respectively, the velocity at the gap decreases significantly (there is no orange zone). Furthermore, some researchers pointed out that using two-scale fractal dimensions could deepen the understanding of the fractal field [35], which could provide us with an effective solution when modeling and analyzing the flow properties for agricultural product precooling.
To compare the effects of different gap sizes on airflow velocity at windward and leeward sides, the average airflow velocity in two vertical planes as a function of gap size is given in Figure 8. From Figure 8, it can be seen that when the gap size is between 2 mm and 6 mm, the average velocity on both the windward and leeward sides is less affected by the gap size. However, when the gap size exceeds 6 mm, the average velocity on both the windward and leeward sides decreases significantly with the increase in gap size. This is because when the gap size is large, the resistance of the cooling airflow is small, and the local higher-speed region inside the plastic crate decreases (see Figure 7). Ultimately, during the precooling process of agricultural products stacked in package, the appropriate gap size for the physical model in numerical simulation is recommended as 6 mm.

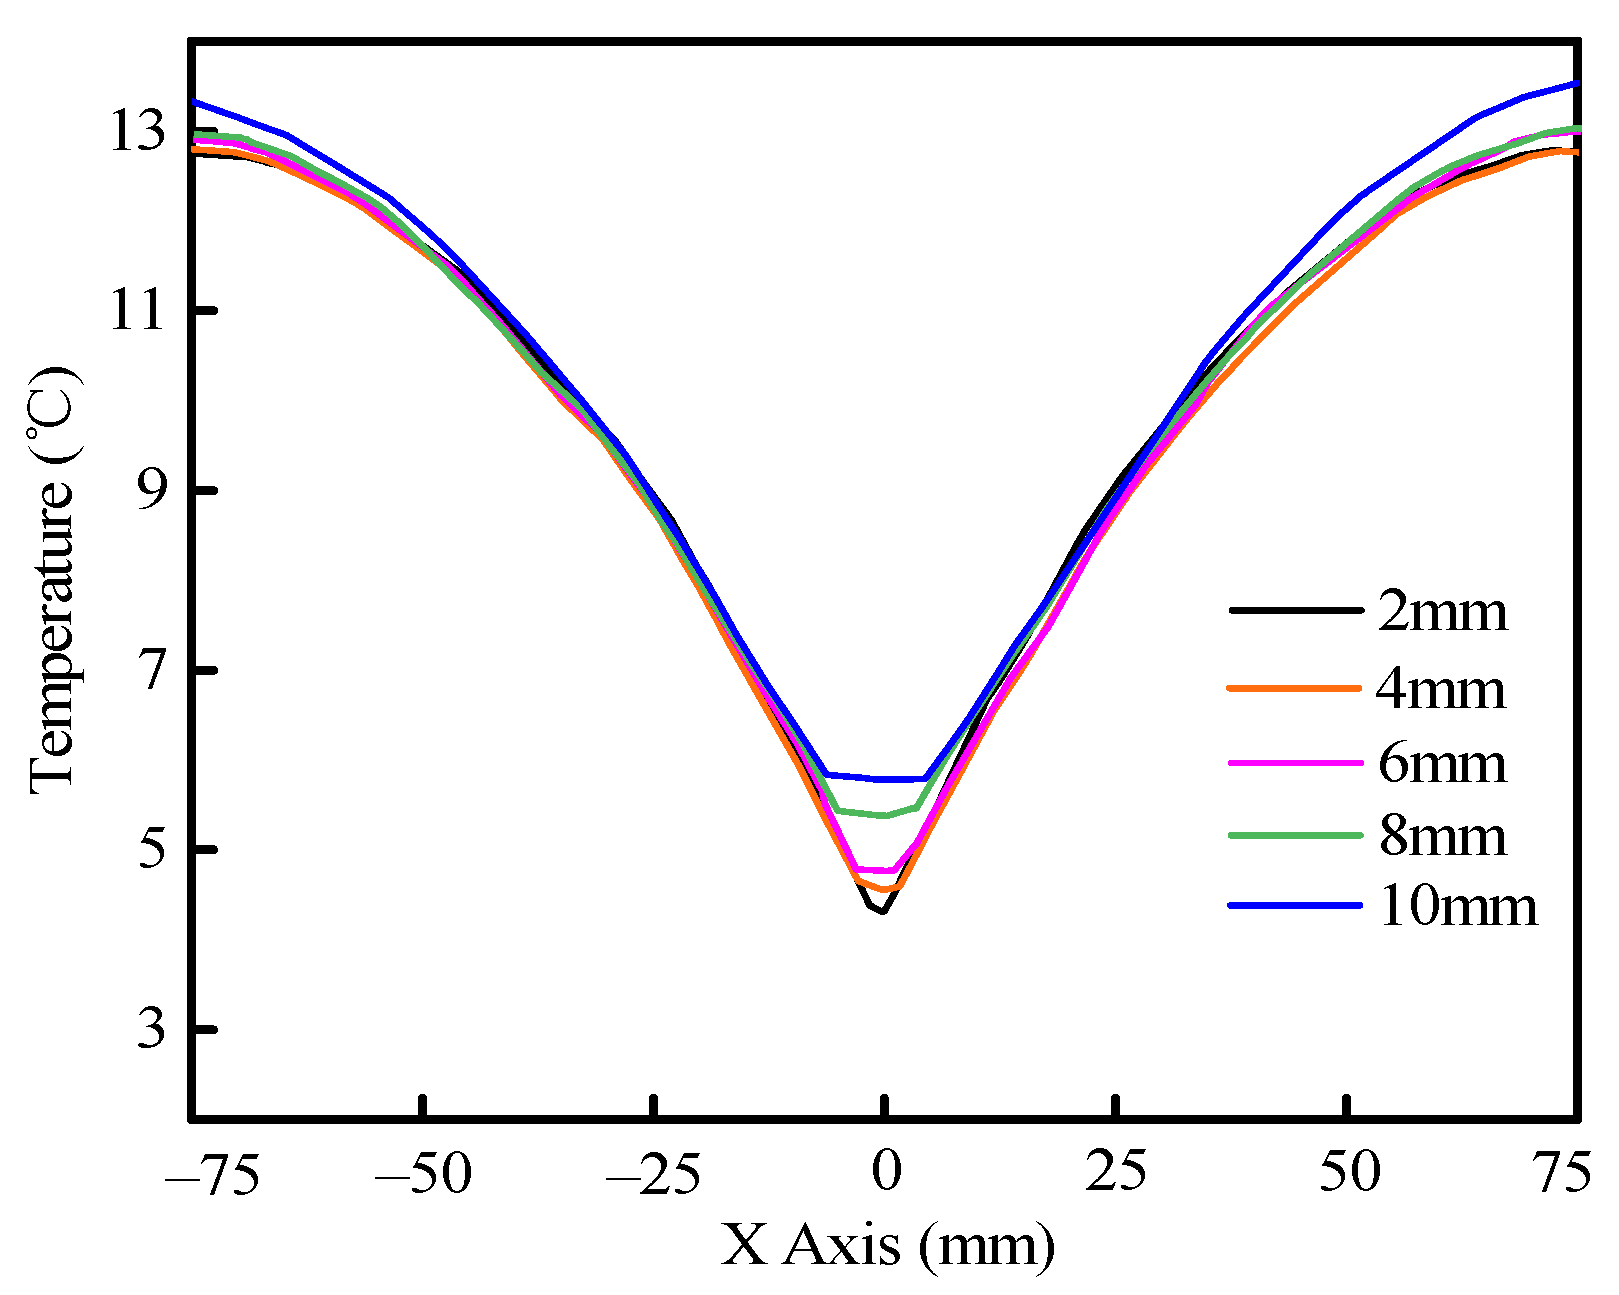
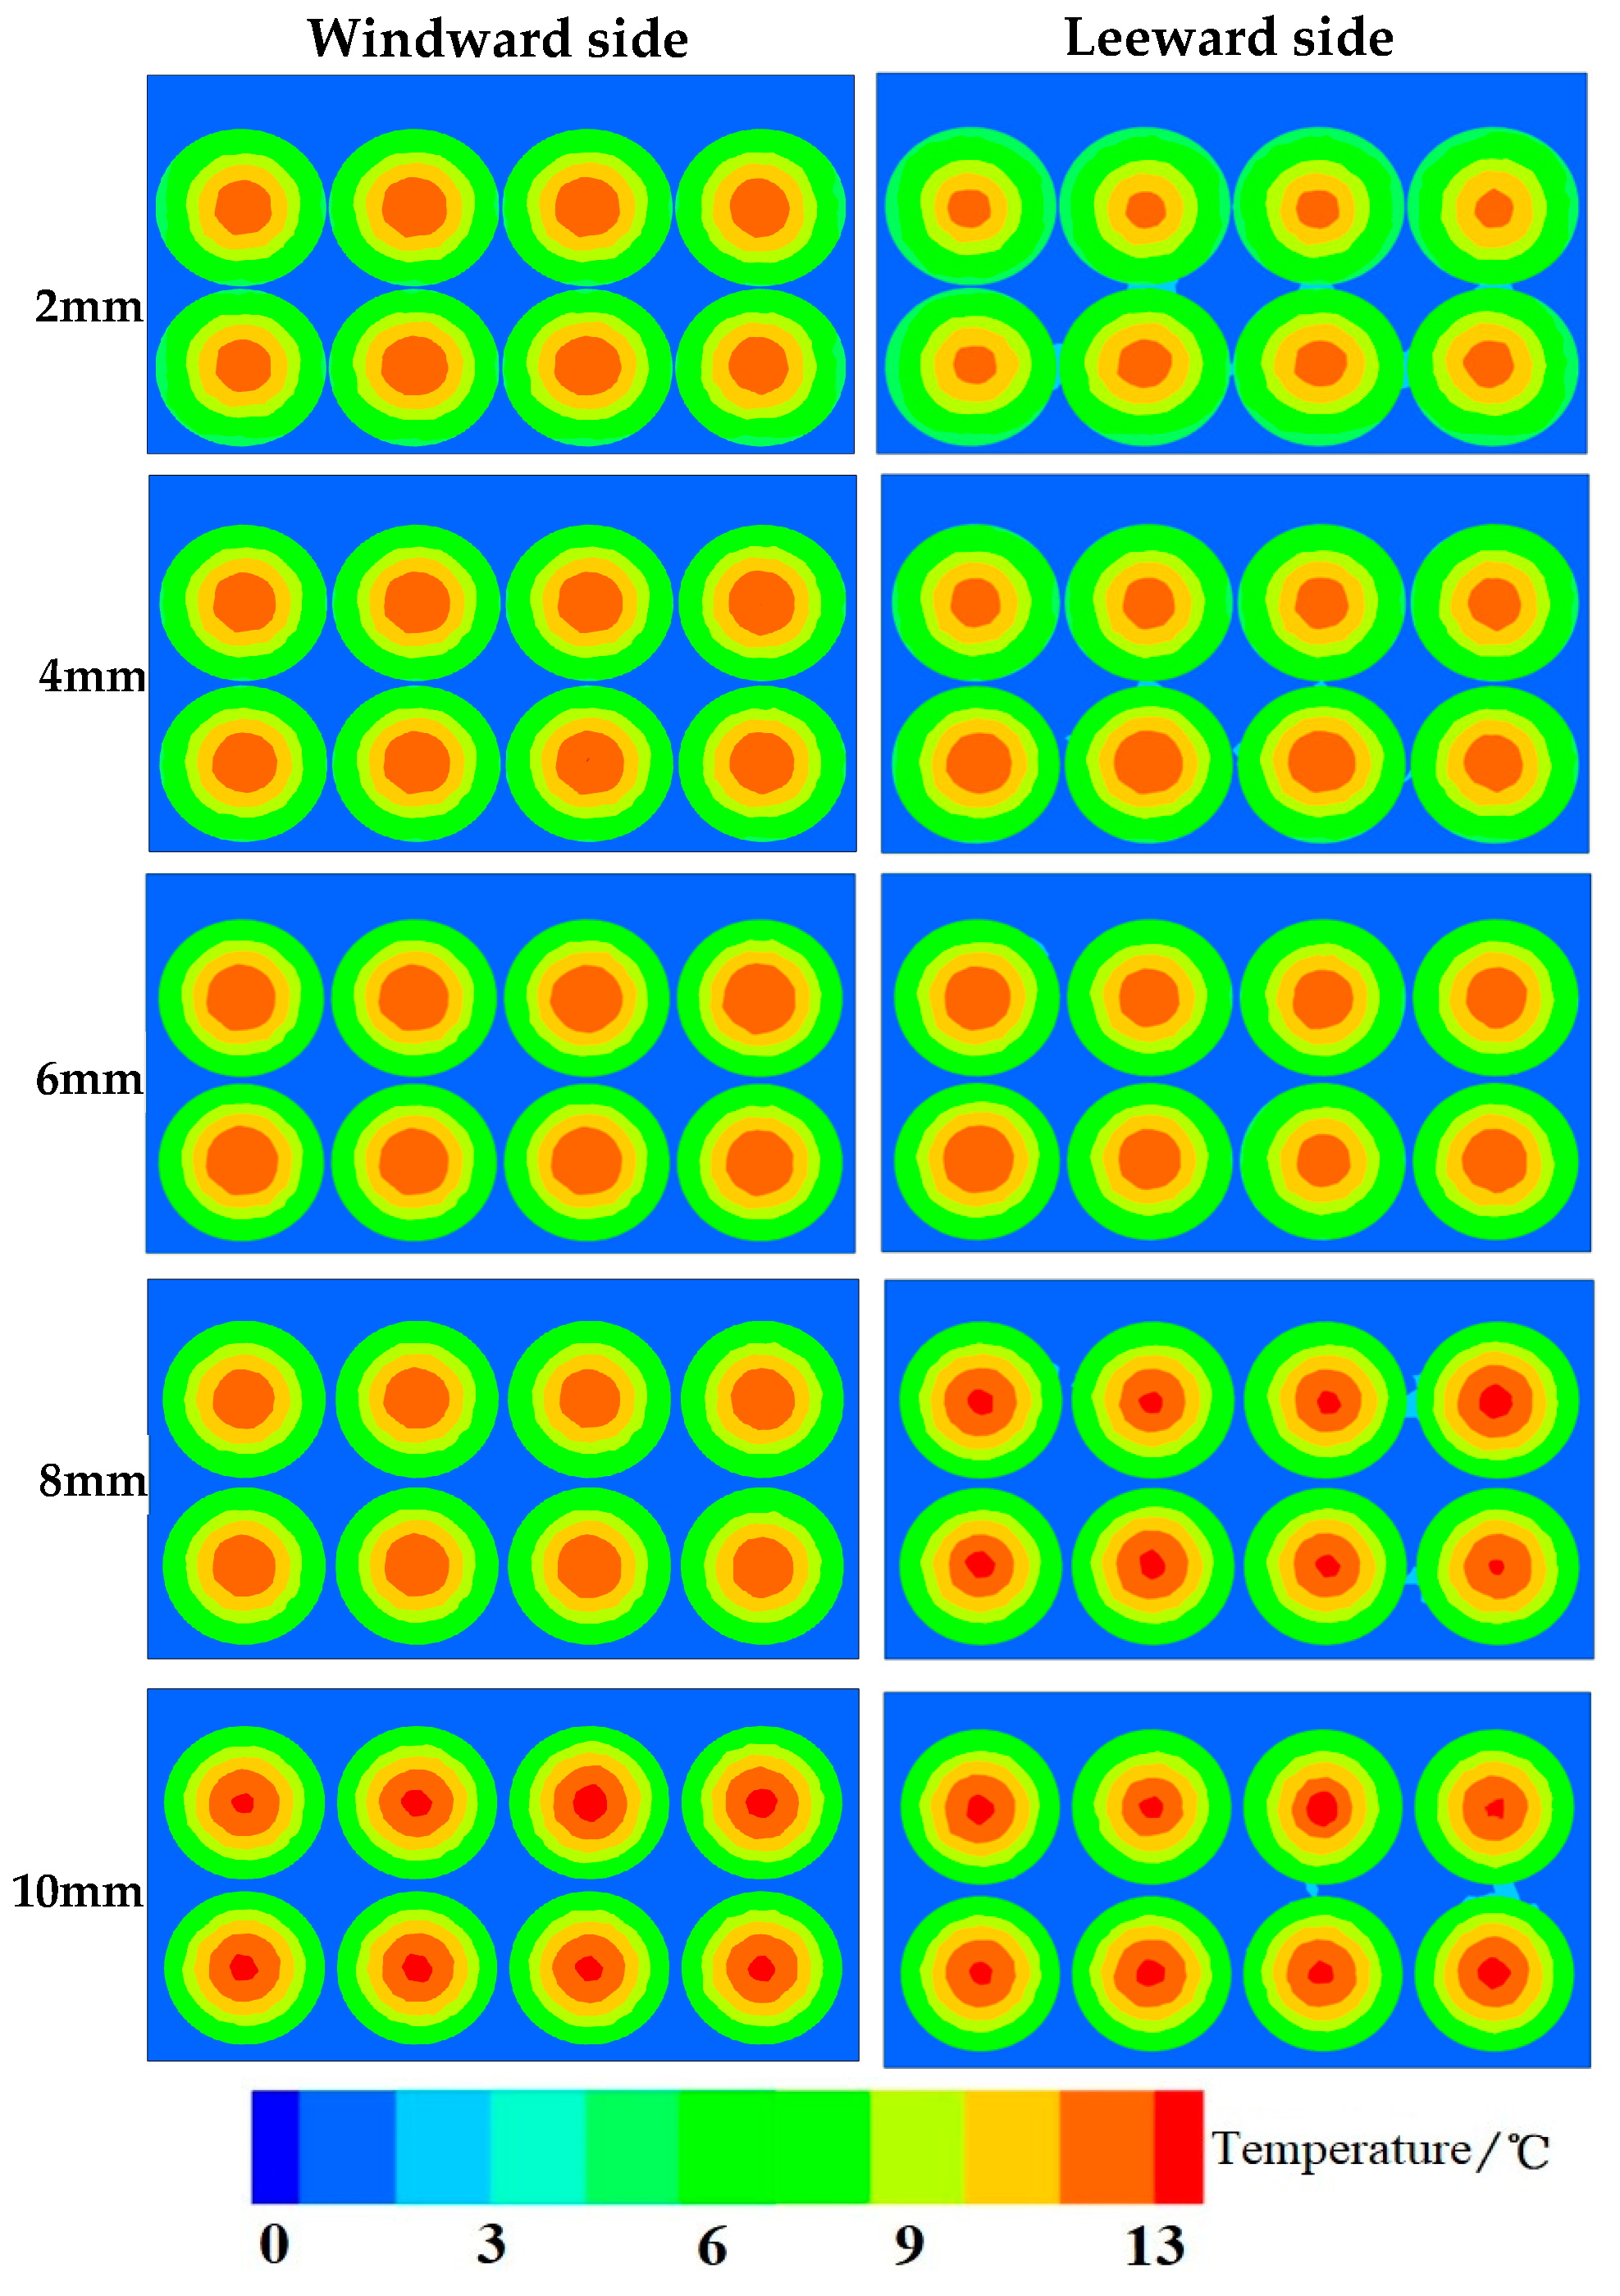
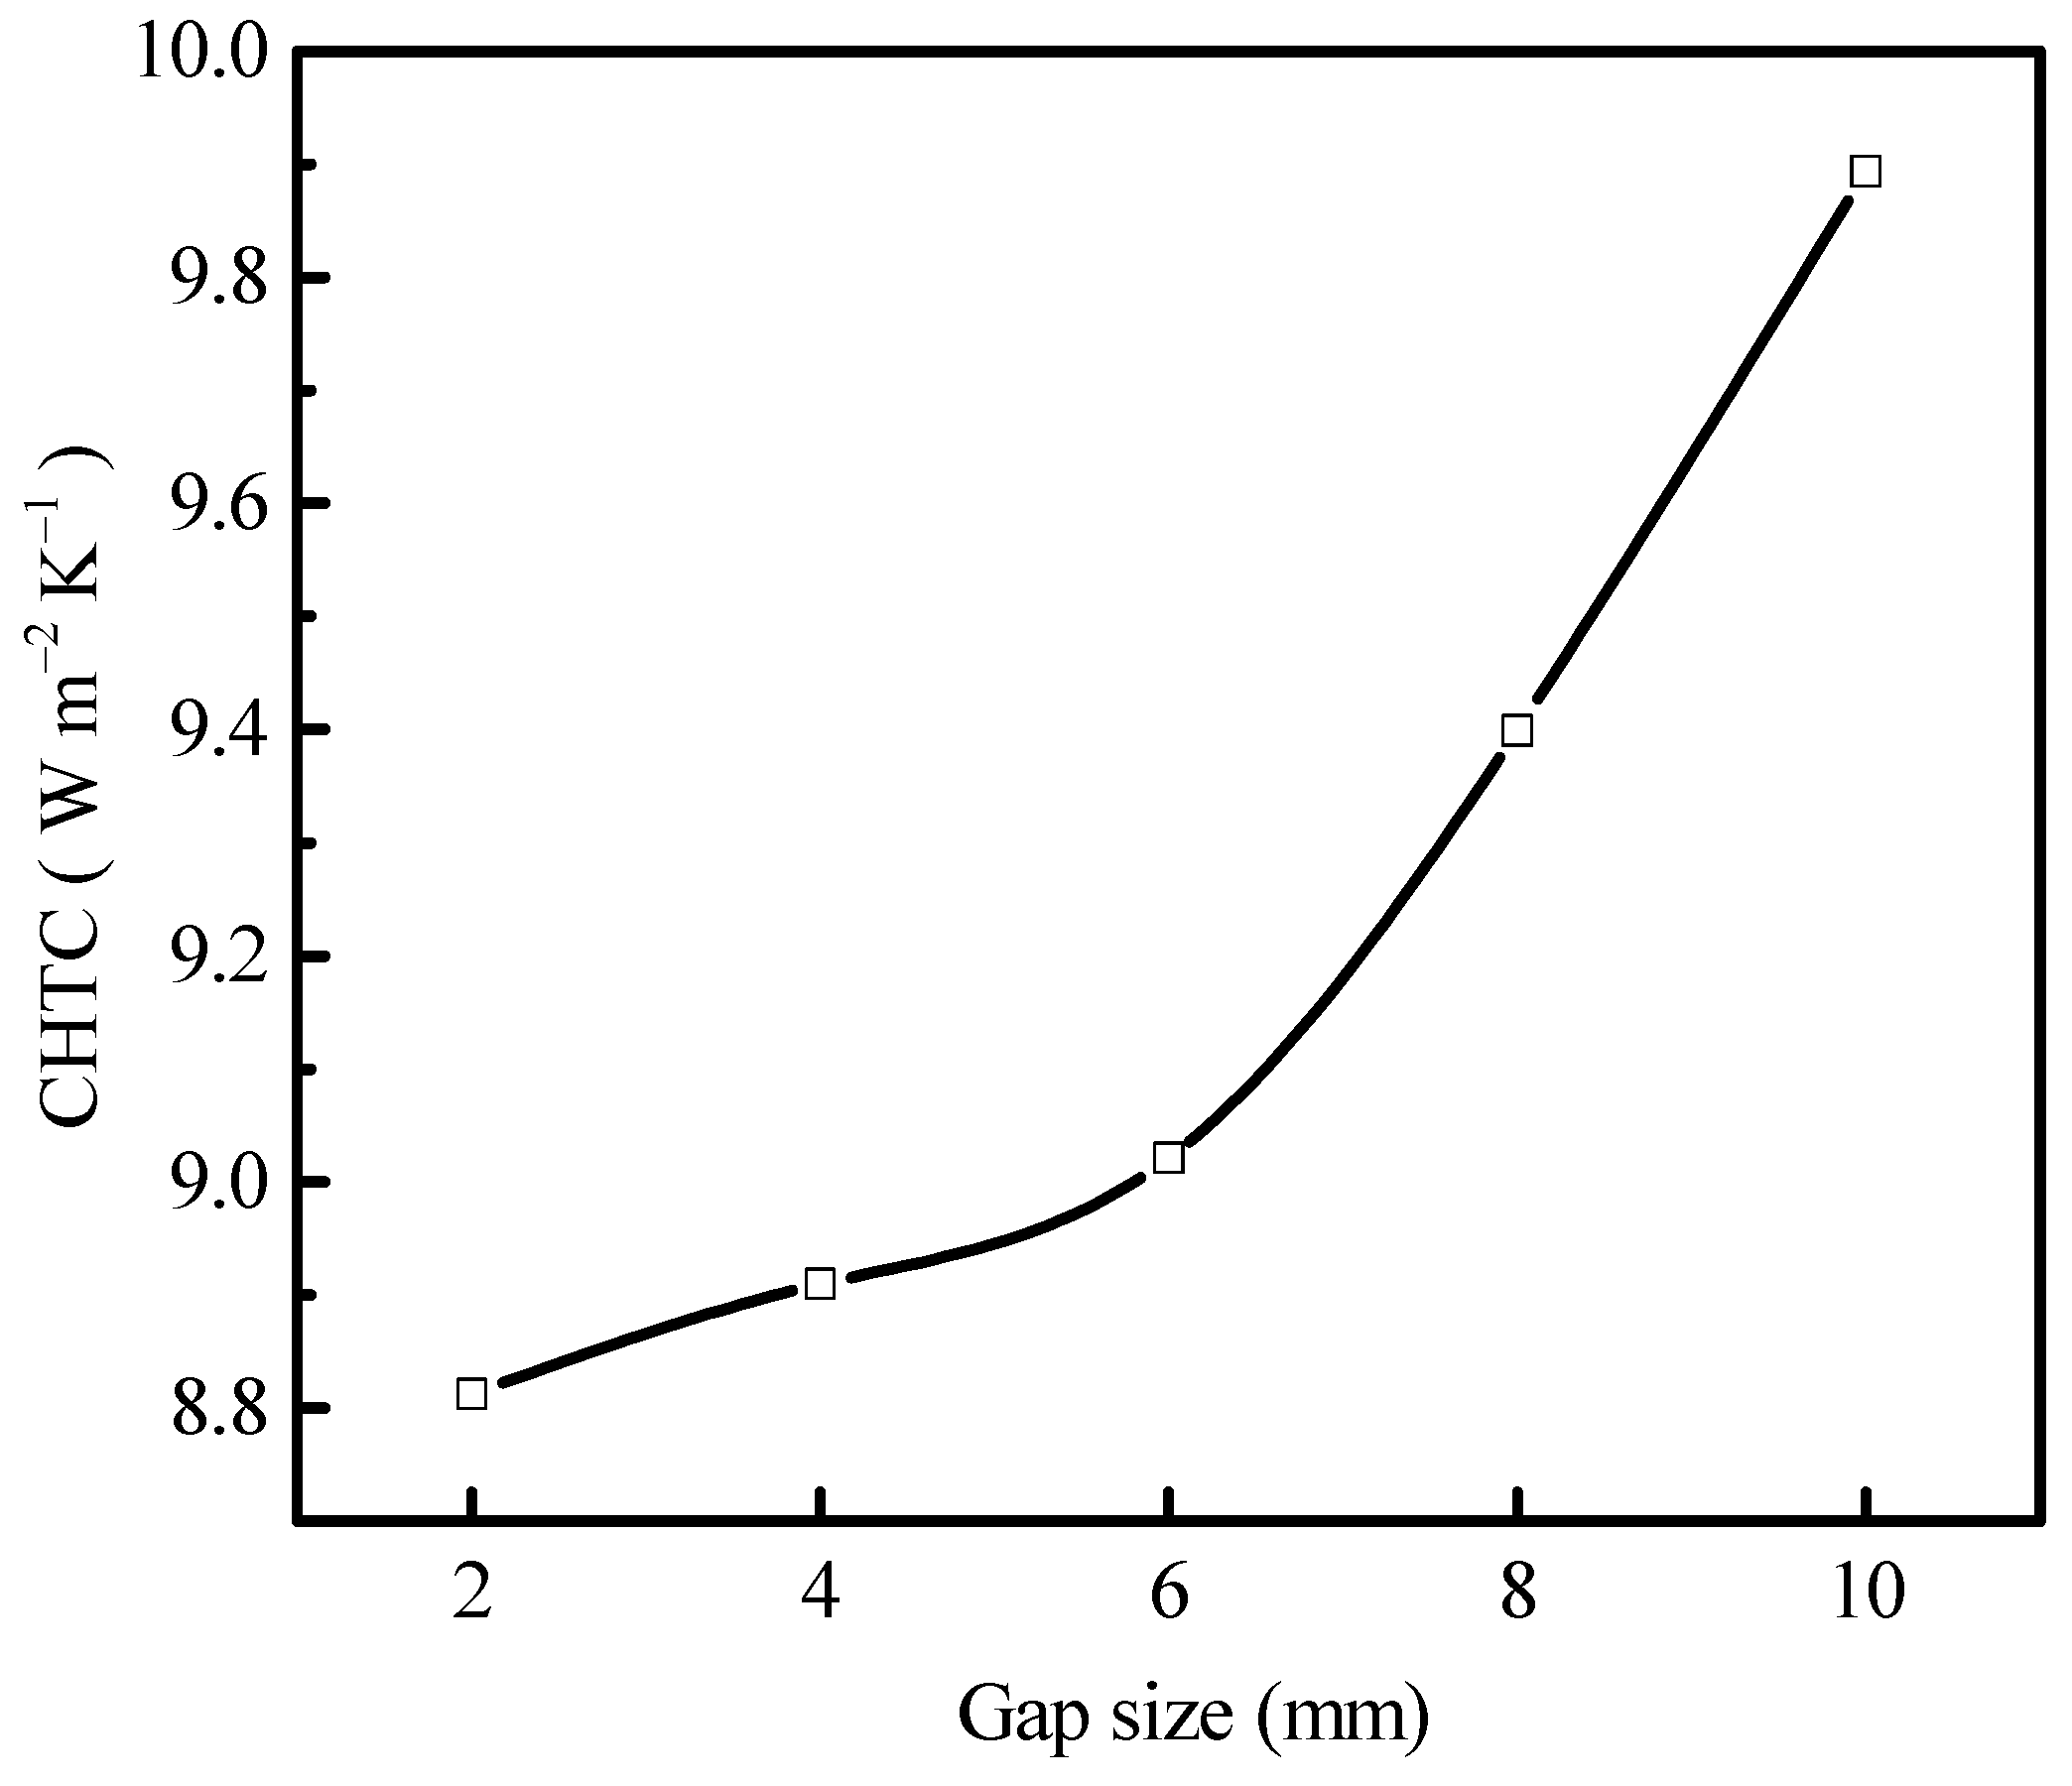
3.3. Heat Transfer Characteristics

The effects of different gap sizes on the heat transfer characteristics during the pre-cooling process of iceberg lettuces is given in Figure 9, Figure 10 and Figure 11. Figure 9 shows the temperature distribution along the center line (Lt) of F2 and F3 produce after 90 min of pre-cooling under different gap sizes. From Figure 8, it can be seen that for all gap sizes, the temperature on the center line of F2 and F3 produce first decreases and then increases. The gap size has a relatively small impact on the cooling process of iceberg lettuces, mainly because the used plastic crate has a larger opening rate, which reduces the influence of gap size on the precooling rate of the vegetables themselves. Nevertheless, when the gap size was increased from 2 to 8 mm, the simulated values of the cold airflow temperature at the gap between F2 and F3 were significantly higher than the reference values. This is because the gap size is relatively large and the cooling airflow easily flows over the surface of products, which results in more complete convective heat transfer between the cold air and the vegetables and leads to a relatively high airflow temperature at the gap. When the gap size is 10 mm, in addition to the high airflow temperature at the gap, it was also found that the simulated temperature of the dishes deviates more significantly from the reference value, and it approaches the center zone of the two vegetables (X = −75–−40 mm and 40–75 mm). This is because of the relative increase in airflow temperature inside the basket under this gap size, and the internal thermal conductivity of vegetables is weakened, which results in a high-temperature zone at the center of products. In summary, when the gap size between adjacent vegetables is greater than 6 mm, the deviation in the predicted cooling rate from the numerical simulation of the iceberg lettuce pre-cooling process is relatively large.
In order to visually observe the temperature difference in horticultural produce during the pre-cooling process under different gap sizes, Figure 10 shows the temperature distribution of the windward and leeward vertical planes under five different gap sizes. From Figure 10, it can be seen that the temperature gradient inside a single sphere is similar as the gap size increases from 2 mm to 6 mm. But when the gap size is 10 mm, a high-temperature zone clearly appears in the center of the product, which is consistent with the temperature data on the center line between F2 and F3 produce mentioned above. In addition, although there was no local high-temperature zone in the center of the product on the windward side under 8 mm gap size, the same phenomenon appeared on the leeward side as for the 10 mm gap size, indicating that the simulated results under 8 mm gap size still deviate from reality.
The convective heat transfer coefficient (CHTC) of the produce surface under different gap sizes is shown in Figure 11. After pre-cooling for 90 min, the CHTC on the produce surface showed a gradually increasing trend with the increasing gap size. This is because as the gap size between adjacent lettuces increases, the cold airflow contacts the iceberg lettuces stacked in plastic crate more fully, enhancing the convective heat transfer between the produce surface and the cold air. When the gap size exceeds 6 mm, the CHTC increases significantly. Compared with the reference value of 2 mm, the CHTC under 4, 6, 8, and 10 mm gap sizes increased by 1.1%, 2.4%, 6.7%, and 12.3%, respectively. This reflects that when the gap size gradually increases beyond 6 mm, the simulated results will deviate from the actual pre-cooling process significantly.

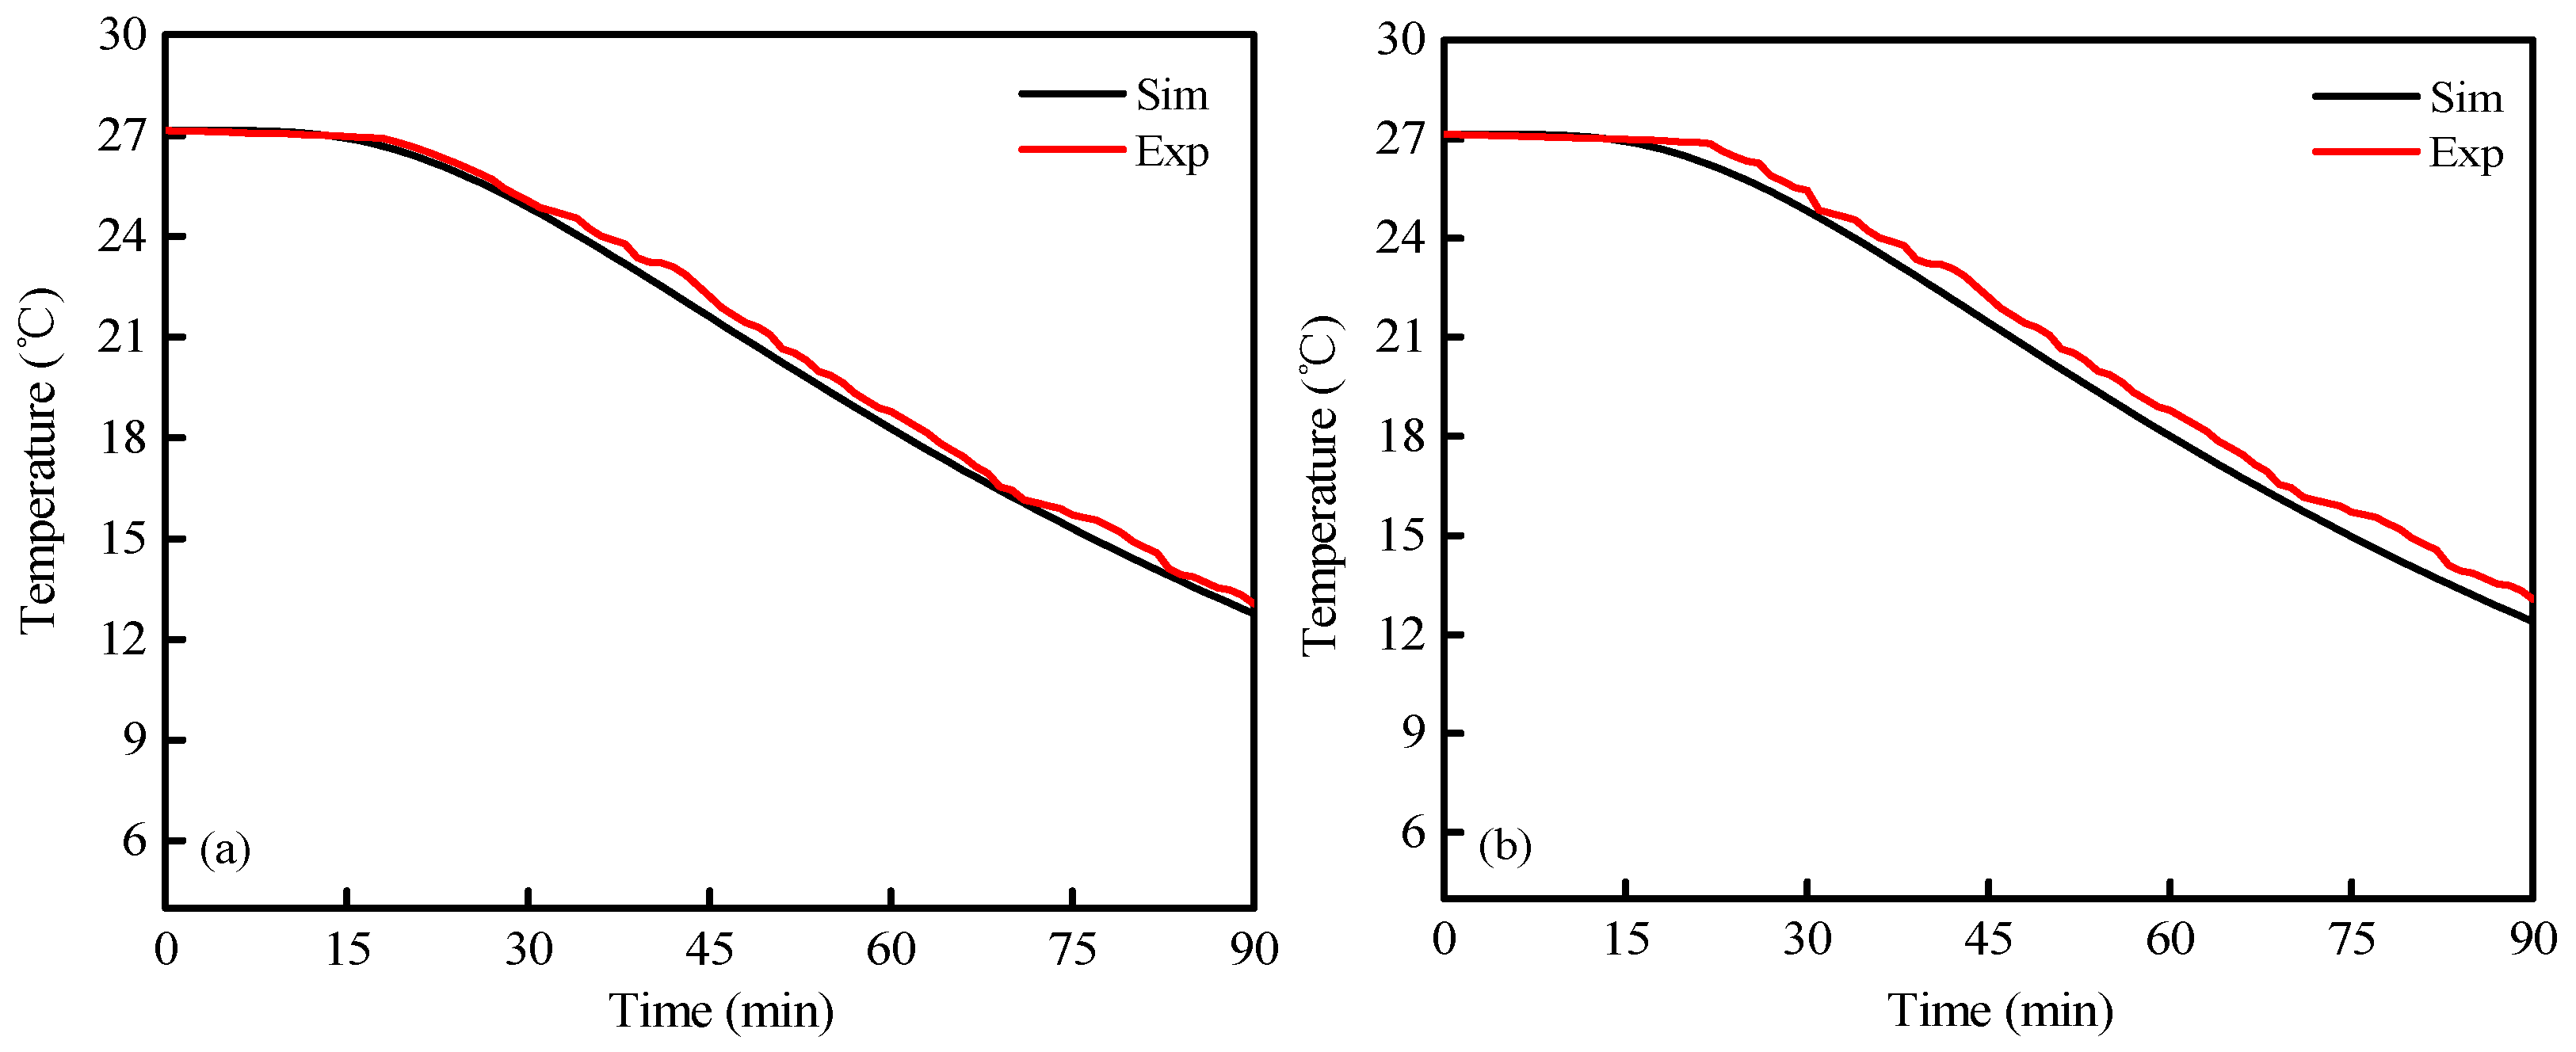
3.4. Experimental Validation

Figure 12 compares the simulation predicted values (2 mm gap size) and experimental measurements corresponding to the center temperatures of F2 and S6. It can be seen from Figure 12 that the trend in the simulated results is consistent with the experimental data. Maximum temperature deviations remained below 1.5 °C between the simulation and experimental results. In order to further verify the accuracy of the mathematical modeling, the simulation results and experiment data were also compared by using the root mean square error (RMSE) and average relative deviation (ARD). The values of RMSE and ARD are listed in Table 1. Observed discrepancies fall with acceptable ranges considering the inherent model simplifications (e.g., spherical geometry of iceberg lettuce) and experimental variabilities in the airflow velocity, cooling air temperature, thermophysical properties of iceberg lettuce, and so on.
The RMSE and ARD values were calculated using Equations (15) and (16):
RMSE = 1 n i = 1 n ( E i S i ) 2
ARD = 1 n i = 1 n E i S i E i   ×   100
where n is the number of measurements made, Si is the simulated result at time i and Ei is the experimental value.

4. Conclusions

This study developed a three-dimensional numerical model to analyze the airflow and temperature pattern of iceberg lettuce stacked in a plastic crate. The influence of different gap sizes on the accuracy of the simulated results was analyzed from three aspects: wall drag coefficient, airflow pattern, and heat transfer characteristics (including temperature distribution inside the plastic crate and temperature data on the centerline of produce F2 and F3). As the gap size increases, the overall drag coefficient shows a gradually decreasing trend. But when the gap size exceeds 6 mm, the average velocity in both the windward and leeward sides decreases rapidly with the increasing gap size. The temperature data on the centerline of produce F2 and F3 show a trend of first decreasing and then increasing at all gap sizes. Considering the effects of different gap sizes on the wall drag coefficient, airflow distribution, and heat transfer characteristics comprehensively, it was found that the optimal gap size between adjacent produce and between products and the box wall is 6 mm, which ensures good accuracy in simulation results, reduces the complexity of grid division, and saves calculation time. The accuracy and reliability of the simulation results under the 2 mm gap size were verified by experiments.

Author Contributions

Conceptualization, C.Z. and H.L.; methodology, X.W.; software, X.W.; validation, Z.F.; formal analysis, H.L.; investigation, X.W.; resources, C.Z.; data curation, Z.F.; writing—original draft preparation, X.W.; writing—review and editing, H.L.; visualization, Z.F.; supervision, H.L.; project administration, C.Z.; funding acquisition, C.Z. All authors have read and agreed to the published version of the manuscript.

Funding

This research was funded by the Baima Lake Laboratory Joint Funds of the Zhejiang Provincial Natural Science Foundation of China, grant number LBMHY24E060013, and The APC was funded by the funds for the construction of first-class disciplines, grant number 88205031.

Data Availability Statement

Data are contained within the article.

Acknowledgments

This research was supported by the Baima Lake Laboratory Joint Funds of the Zhejiang Provincial Natural Science Foundation of China, grant number LBMHY24E060013.

Conflicts of Interest

Author Zhongyang Fan was employed by the company Zhejiang Dunan Cold Chain System Co., Ltd. The remaining authors declare that the research was conducted in the absence of any commercial or financial relationships that could be construed as a potential conflict of interest.

References

  1. Feng, K.X.; Feng, X.L.; Tan, W.J.; Zheng, Q.H.; Zhong, W.T.; Liao, C.Y.; Liu, Y.T.; Li, S.J.; Hu, W.Z. Development of a food preservative from sea buckthorn together with chitosan: Application in and characterization of fresh-cut lettuce storage. Front. Microbiol. 2023, 14, 1080365. [Google Scholar] [CrossRef] [PubMed]
  2. Kim, A.N.; Kim, H.J.; Kerr, W.L.; Choi, S.G. The effect of grinding at various vacuum levels on the color, phenolics, and antioxidant properties of apple. Food Chem. 2017, 216, 234–242. [Google Scholar] [CrossRef] [PubMed]
  3. Kumar, A.; Kumar, R.; Subudhi, S. Experimental investigations of periodic airflow reversal during forced-air cooling of Apples: Impacts on cooling rate and uniformity. J. Food. Eng. 2023, 359, 111684. [Google Scholar] [CrossRef]
  4. Pratsanee, K.W.; Danai, B.; Pichaya, P. Extending the shelf life and qualities of baby cos lettuce using commercial precooling systems. Postharvest Biol. Technol. 2019, 150, 60–70. [Google Scholar] [CrossRef]
  5. Mercier, S.; Villeneuve, S.; Mondor, M.; Uysal, I. Time-temperature management along the food cold chain: A review of recent developments. Compr. Rev. Food. Sci. Food. Saf. 2017, 16, 647–667. [Google Scholar] [CrossRef]
  6. Han, J.W.; Badía-melis, R.; Yang, X.T.; Ruiz Garcia, L.; Qian, J.P.; Zhao, C.J. CFD simulation of airflow and heat transfer during forced-air precooling of apples. J. Food Process Eng. 2017, 40, e12390. [Google Scholar] [CrossRef]
  7. Castro(de), L.R.; Vigneault, C.; Cortez, L.A.B. Cooling performance of horticultural produce in containers with peripheral openings. Postharvest Biol. Technol. 2005, 38, 254–261. [Google Scholar] [CrossRef]
  8. Ngcobo, M.E.K.; Delele, M.A.; Opara, U.L.; Zietsman, C.J.; Meyer, C. Resistance to airflow and cooling patterns through multi-scale packaging of table grapes. Int. J. Refrig. 2012, 35, 445–452. [Google Scholar] [CrossRef]
  9. Han, J.W.; Zhao, C.J.; Yang, X.T.; Qian, J.P.; Fan, B.L. Computational modeling of airflow and heat transfer in a vented box during cooling: Optimal package design. Appl. Therm. Eng. 2015, 91, 883–893. [Google Scholar] [CrossRef]
  10. Defraeye, T.; Verboven, P.; Nicolai, B. CFD modelling of flow and scalar exchange of spherical food products: Turbulence and boundary-layer modelling. J. Food Eng. 2013, 114, 495–504. [Google Scholar] [CrossRef]
  11. Dehghannya, J.; Ngadi, M.; Vigneault, C. Simultaneous aerodynamic and thermal analysis during cooling of stacked spheres inside ventilated packages. Chem. Eng. Technol. 2008, 31, 1651–1659. [Google Scholar] [CrossRef]
  12. O’Sullivan, J.; Ferrua, M.J.; Love, R.; Verboven, P.; Nicolai, B.; East, A. Modelling the forced-air cooling mechanisms and performance of polylined horticultural produce. Postharvest Biol. Technol. 2016, 120, 23–35. [Google Scholar] [CrossRef]
  13. Zhao, C.J.; Han, J.W.; Yang, X.T.; Qian, J.P.; Fan, B.L. A review of computational fluid dynamics for forced-air cooling process. Appl. Energy. 2016, 168, 314–331. [Google Scholar] [CrossRef]
  14. Ambaw, A.; Mukama, M.; Opara, U.L. Analysis of the effects of package design on the rate and uniformity of cooling of stacked pomegranates: Numerical and experimental studies. Comput. Electron. Agr. 2017, 136, 13–24. [Google Scholar] [CrossRef]
  15. O’Sullivan, J.L.; Ferrua, M.J.; Love, R.; Verboven, P.; Nicolai, B.; East, A. Forced air cooling of polylined horticultural produce: Optimal cooling conditions and package design. Postharvest Biol. Technol. 2017, 126, 67–75. [Google Scholar] [CrossRef]
  16. Han, J.W.; Qian, J.P.; Zhao, C.J.; Yang, X.T.; Fan, B.L. Mathematical modelling of cooling efficiency of ventilated packaging: Integral performance evaluation. Int. J. Heat. Mass. Tran. 2017, 111, 386–397. [Google Scholar] [CrossRef]
  17. Delele, M.A.; Ngcobo, M.E.K.; Getahun, S.T.; Chen, L.; Mellmann, J.; Opara, U.L. Studying airflow and heat transfer characteristics of a horticultural produce packaging system using a 3-D CFD model. Part II: Effect of package design. J. Food Eng. 2013, 86, 546–555. [Google Scholar] [CrossRef]
  18. Defraeye, T.; Lambrecht, R.; Delele, M.A.; Tsige, A.A.; Opara, U.L.; Cronjé, P.; Verboven, P.; Nicolai, B. Forced-convective cooling of citrus fruit: Cooling conditions and energy consumption in relation to package design. J. Food Eng. 2014, 121, 118–127. [Google Scholar] [CrossRef]
  19. Wang, D.; Lai, Y.; Jia, B.; Chen, R.; Hui, X. The optimal design and energy consumption analysis of forced air pre-cooling packaging system. Appl. Therm. Eng. 2020, 165, 114592. [Google Scholar] [CrossRef]
  20. Berry, T.M.; Defraeye, T.; Nicolai, B.M.; Opara, U.L. Multiparameter analysis of cooling efficiency of ventilated fruit cartons using CFD: Impact of vent hole design and internal packaging. Food Bioprocess Technol. 2016, 9, 1481–1493. [Google Scholar] [CrossRef]
  21. Defraeye, T.; Lambrecht, R.; Tsige, A.A.; Delele, M.A.; Opara, U.L.; Cronjé, P.; Verboven, P.; Nicolai, B. Forced-convective cooling of citrus fruit: Package design. J. Food Eng. 2013, 118, 8–18. [Google Scholar] [CrossRef]
  22. Wang, X.F.; Fan, Z.Y.; Li, B.G.; Liu, E.H. Variable air supply velocity of forced-air precooling of iceberg lettuces: Optimal cooling strategies. Appl. Therm. Eng. 2021, 187, 116484. [Google Scholar] [CrossRef]
  23. Berry, T.M.; Fadiji, T.S.; Defraeye, T.; Opara, U.L. The role of horticultural carton vent hole design on cooling efficiency and compression strength: A multi-parameter approach. Postharvest Biol. Technol. 2017, 127, 62–74. [Google Scholar] [CrossRef]
  24. Wang, X.F.; Li, B.G.; Fan, Z.Y. Packaging Optimization and integral evaluation of cooling Efficiency of Apples. Food Sci. Technol. Res. 2019, 25, 677–686. [Google Scholar] [CrossRef]
  25. Kumar, A.; Kumar, R.; Subudhi, S. Numerical modeling of forced-air pre-cooling of fruits and vegetables: A review. Int. J. Refrig. 2022, 145, 217–232. [Google Scholar] [CrossRef]
  26. Delele, M.A.; Ngcobo, M.E.; Getahun, S.T.; Chen, L.; Mellmann, J.; Opara, U.L. Studying airflow and heat transfer characteristics of a horticultural produce packaging system using a 3-D CFD model, Part I: Model development and validation. Postharvest Biol. Technol. 2013, 86, 536–545. [Google Scholar] [CrossRef]
  27. Ferrua, M.J.; Singh, R.P. Modeling the forced-air cooling process of fresh strawberry packages, Part III: Experimental validation of the energy model. Int. J. Refrig. 2009, 32, 359–368. [Google Scholar] [CrossRef]
  28. Rennie, J.T.; Tavoularis, S. Perforation-mediated modifed atmosphere pack-aging: Part I. Development of a mathematical model. Postharvest Biol. Technol. 2009, 51, 1–9. [Google Scholar] [CrossRef]
  29. Becker, B.R.; Misra, A.; Fricke, B.A. Bulk refrigeration of fruits and vegetables part I: Theoretical considerations of heat and mass transfer. HVAC&R Res. 1996, 2, 122–134. [Google Scholar] [CrossRef]
  30. Gong, Y.F.; Cao, Y.H.; Zhang, X.R. Forced-air precooling of apples: Airflow distribution and precooling effectiveness in relation to the gap width between tray edge and box wall. Postharvest Biol. Technol. 2021, 177, 111523. [Google Scholar] [CrossRef]
  31. Kuznik, F.; Rusaouèn, G.; Brau, J. Experimental and numerical study of a full scale ventilated enclosure: Comparison of four two equations closure turbulence models. Build. Environ. 2007, 42, 1043–1053. [Google Scholar] [CrossRef]
  32. Denys, A.; Pieters, J.G.; Dewettinck, K. Computational fluid dynamics analysis for process impact assessment during thermal pasteurization of intact eggs. J. Food Prot. 2005, 68, 366–374. [Google Scholar] [CrossRef] [PubMed]
  33. Tutar, M.; Erdogdu, F.; Toka, B. Computational modeling of airflow patterns and heat transfer prediction through stacked layers’ products in a vented box during cooling. Int. J. Refrig. 2009, 32, 295–306. [Google Scholar] [CrossRef]
  34. Kumar, A.; Kumar, R.; Subudhi, S. Numerical modeling of periodic airflow reversal with variable air supply velocity for optimal forced-air cooling of apples. Therm. Sci. Eng. Progress. 2024, 48, 102398. [Google Scholar] [CrossRef]
  35. Ain, Q.T.; He, J.H.; Qiang, X.L.; Kou, Z.; Taylor, T. The two-scale fractal dimension: A unifying perspective to metabolic law. Fractals 2024, 32, 2450016. [Google Scholar] [CrossRef]
Figure 1. The physical model diagram under 6 mm gap size. 1. Plastic crate. 2. Iceberg lettuce. 3. Ventilation hole. 4. Temperature monitoring points. d The sphere diameter. ‘━’ and ‘’ are the gap between the products and box wall and the gap between adjacent products, respectively,; the values of these gap sizes are equal.
Symmetry 17 00810 g001
Figure 2. The schematic configuration of experiment set up. 1. Evaporator. 2. Humidifier. 3. Temperature controller. 4. Temperature and humidity sensor. 5. Anemometer probe. 6. Plastic crate. 7. Air duct. 8. Fan. 9. Heat insulation layer. The arrow represents the airflow direction.
Symmetry 17 00810 g002
Figure 3. Computational meshes used for simulations with a 6 mm gap size.
Symmetry 17 00810 g003
Figure 4. Schematic diagram of the central connection line Lt for monitoring produce.
Symmetry 17 00810 g004
Figure 5. Variation in drag coefficient with gap size.
Symmetry 17 00810 g005
Figure 6. Diagram of two typical vertical planes.
Symmetry 17 00810 g006
Figure 7. Airflow distribution under different gap sizes.
Symmetry 17 00810 g007
Figure 8. The change in the average airflow velocity with gap size on two vertical planes.
Symmetry 17 00810 g008
Figure 9. Temperature changes on center line Lt under different gap sizes.
Symmetry 17 00810 g009
Figure 10. Temperature distribution inside the plastic crate under different gap sizes after pre-cooling 90 min.
Symmetry 17 00810 g010
Figure 11. CHTC under different gap sizes during pre-cooling for 90 min.
Symmetry 17 00810 g011
Figure 12. Comparison of simulation and experimental results of temperature. (a) Core temperature of F2. (b) Core temperature of S6.
Symmetry 17 00810 g012
Table 1. Validation results for RMSE and ARD.
F2S6
Core TemperatureCore Temperature
RMSE (°C)0.40.6
ARD (%)1.72.9
Disclaimer/Publisher’s Note: The statements, opinions and data contained in all publications are solely those of the individual author(s) and contributor(s) and not of MDPI and/or the editor(s). MDPI and/or the editor(s) disclaim responsibility for any injury to people or property resulting from any ideas, methods, instructions or products referred to in the content.

