Abstract
Maize is one of the most important global crops. It is highly susceptible to diseases during its growth process, meaning that the timely detection and prevention of maize diseases is critically important. However, simple deep learning classification tasks do not allow for the accurate identification of multiple diseases present in a single leaf, and the existing RT-DETR (Real-Time Detection Transformer) detection methods suffer from issues such as excessive model parameters and inaccurate recognition of multi-scale features on maize leaves. The aim of this paper is to address these challenges by proposing an improved RT-DETR model. The model enhances the feature extraction capability by introducing a DAttention (Deformable Attention) module and optimizes the feature fusion process through the symmetry structure of spatial and channel in the SCConv (Spatial and Channel Reconstruction Convolution) module. In addition, the backbone network of the model is reconfigured, which effectively reduces the parameter size of the model and achieves a balanced symmetry between the model precision and the parameter count. Experimental results demonstrate that the proposed improved model achieves an mAP@0.5 of 92.0% and a detection precision of 89.2%, representing improvements of 7.3% and 8.4%, respectively, compared to the original RT-DETR model. Additionally, the model’s parameter size has been reduced by 18.9 M, leading to a substantial decrease in resource consumption during deployment and underscoring its extensive application potential.
1. Introduction
The adjustment of China’s agricultural planting structure and changes in cultivation methods have led to an acceleration in the breeding of maize varieties and a rapid expansion in the planting area. Concurrently, there has been an increase in the occurrence of maize diseases [1]. Changes in maize production environments and climate have led to shifts in the patterns of some major diseases, with some minor diseases becoming major threats, causing increasing harm nationwide or in specific regions [2]. Some diseases that had been under control have made a comeback, and new diseases have emerged, posing serious threats to the safety of maize production [3,4]. Conventional disease detection methods are time-consuming, labor-intensive, and highly subjective, resulting in low production efficiency. The rapid development of computer technology has led to increased attention being paid to the use of image processing techniques for automatic pest and disease identification. During the 21st century, there has been a proliferation of research on disease diagnosis based on computer vision and machine learning [5,6]. Some maize leaves will simultaneously suffer from a variety of diseases and a simple classification task cannot accurately identify the infection of the leaf, so the target detection model selected for the identification of maize leaf diseases should be able to effectively identify the different types of diseases existing in a leaf, which will help in the timely and effective management of maize diseases.
Machine learning methods for extracting features are complex, in contrast to a convolutional neural network (CNN), which has stronger feature extraction capabilities and can significantly enhance detection accuracy and efficiency. The application of deep learning in crop disease detection has seen significant advancements in artificial intelligence. For instance, Yao et al. [7] selected the VGGNet16 model for efficient identification of wheat pests and diseases, employing a gradual learning rate and transfer learning strategy for training, and they achieved a final accuracy of 95%. In subsequent research [8], the NLCBAM-VGGNet16 model was designed, attaining an identification accuracy of 97.57%, achieving high-precision recognition of common winter wheat pests and diseases. Sibiya et al. [9] proposed an optimized CNN model for the identification of maize leaf diseases, captured using smartphones. The model has been shown to accurately distinguish between maize leaf blight, common rust, and grey leaf spot, achieving an accuracy of 92.85%. In a similar vein, Saleem et al. [10] utilized TensorFlow and Keras to train a deep learning model on the PlantVillage dataset, encompassing 26 plant diseases. The Xception architecture attained optimal accuracy and F1 scores on the validation set for all models tested. These improvements effectively enhance the detection accuracy of the model, but not much research has been carried out on the detection speed and processing time of the model, which cannot be easily applied to hardware deployment.
To enhance the model’s detection speed and processing efficiency, Chen et al. [11] proposed a CNN-based maize plant disease recognition model that integrates data augmentation and transfer learning techniques, achieving an average recognition accuracy of 96.6%. Compared to a single CNN, the accuracy improved by 25.6% and the processing time per frame was reduced to 0.28 s, almost 10 times faster. Sun et al. [12] proposed a multi-scale feature fusion SSD algorithm that improved the mAP for maize northern leaf blight from 71.80% to 91.83% through data pre-processing and feature fusion, meeting real-time detection standards. Liang et al. [13] proposed a maize pest detection algorithm based on an improved YOLO-v8n, which achieved a detection mean average precision (mAP) of 94.8% at 171 frames per second. Through these studies, the detection speed and processing time of the model have been significantly improved, but the traditional convolutional neural network model is prone to miss detection and produce false detection when targeting some multi-scale targets [14]. Chen et al. [15] pointed out that the convolutional kernels of CNNs have limited receptive fields, making it difficult to capture long-range information, which is crucial for object detection in complex scenarios. In contrast, Transformer architectures excel at modeling long-range dependencies.
In recent years, object detection models based on the Transformer architecture have provided a new approach to object detection through attention mechanisms for processing image data. Their advantage lies in a better understanding of the relationships between different parts of an image, such as the DETR [16] (Detection Transformer) method. Compared to R-CNN and YOLO (You Only Look Once) methods, DETR uses query vectors as soft anchors to locate targets, eliminating complex post-processing and parameter tuning steps. Moreover, researchers have proposed Deformable DETR [17] and RT-DETR [18] (Real-Time Detection Transformer) and DETR-based models have gradually matured as object detection technologies. For example, Wang et al. [19] proposed the PDSI-RTDETR model based on the RT-DETR framework to address the problem of tomato ripeness detection. The improved model achieved a 3.9% increase in mAP@50 compared to the original RT-DETR model. Xu et al. [20] proposed a small-object detection algorithm, DCEI-RTDETR, for detecting indicators in data center equipment rooms. Compared with the original RT-DETR algorithm, it improved mAP@50 by 4.2% and mAP@50:95 by 2.1%. These studies demonstrate the strong application potential of the RT-DETR model. However, RT-DETR models perform poorly when dealing with multi-scale features and face significant challenges in model light-weighting.
The problems of low model accuracy due to the influence of multi-scale features in the process of maize leaf disease identification need to be solved, and the existing models are incapable of balancing the accuracy, detection speed, and the number of parameters well. Based on the RT-DETR framework, this paper introduces Deformable Attention [21] to capture richer disease feature information, which improves the model’s ability to extract multi-scale disease features. By introducing SCConv [22] (Spatial and Channel Reconstruction Convolution) in the feature fusion module, the model improves the effective fusion of multi-scale disease features, thereby reducing the miss rate for small targets. In addition, this paper redesigns the backbone network of the model and introduces the light-weight QARepVGG [23] (Quantization Aware RepVGG) module to reduce redundant computations and reduce the parameter size of the model. Therefore, this paper proposes an improved RT-DETR model for multiple types of maize leaf disease detection, which aims to increase the model’s detection accuracy by improving the multi-scale disease feature extraction process, while reducing the model’s parameter size and resource consumption.
2. Materials and Methods
2.1. Baseline Model
RT-DETR is a real-time, end-to-end object detection model that demonstrates comparable speed to YOLO-v8 [24] in the same test environment, while achieving higher detection accuracy and eliminating the need for Non-Maximum Suppression (NMS) algorithms. The RT-DETR model consists of three main components: a backbone network, an efficient hybrid encoder, and a decoder. The overall design ensures fast inference speed and low computational complexity, as shown in Figure 1.
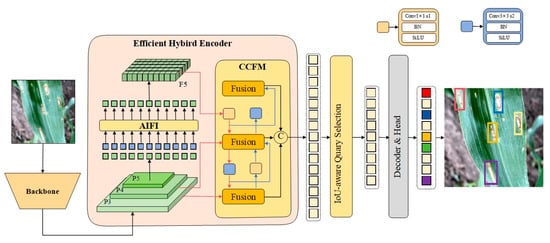
Figure 1.
RT-DETR Module Diagram.
The backbone network uses a CNN to extract significant features from the image, with modules of different levels of feature extraction serving as input to the next stage.
The efficient hybrid coder uses an Attention-based Intrascale Feature Interaction (AIFI) module to extract local detail features and reduce computational load. To further optimize the feature extraction process, the model integrates a Cross-scale Feature Fusion module (CCFM) to fuse features from different scales.
The decoder uses an Intersection over Union (IoU)-aware query selection mechanism to select and optimize queries based on the IoU between predicted and target boxes. Finally, the decoder iterative optimizes object queries through an auxiliary prediction head to generate bounding boxes and confidence scores.
The design philosophy and structure of RT-DETR enables it to achieve high recognition accuracy and strong real-time processing capabilities in object recognition tasks, effectively improving recognition efficiency and accuracy without the need for NMS algorithms.
2.2. Dataset Preparation
The severity of maize diseases is influenced by variety, susceptibility, pathogens, and external environmental conditions. Pictures of maize leaf diseases are shown in Figure 2.
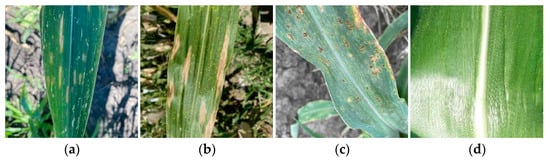
Figure 2.
Maize Leaf Disease Categories: (a) Gray Leaf Spot, (b) Northern Leaf Blight, (c) Northern Leaf Spot, (d) Healthy Leaf.
The data for this experiment were obtained from the CD&S dataset [25] and PlantVillage datasets [26]. After filtering and integrating a large number of national and international maize leaf disease images from these datasets, a maize disease dataset was created for this study. The dataset includes images of healthy maize leaves and three common maize leaf diseases: grey leaf spot, northern leaf blight, and northern leaf spot. The three diseases selected in the dataset are some of the most common maize diseases, which are not only widespread in different climatic regions, but also their incidence and damage are increasing year by year, which has a significant negative impact on maize yield and quality. By collecting more disease datasets at a later stage, the model can be applied to more diseases.
To meet the experimental requirements, the LabelImg tool was used to annotate the target regions in the images, and the dataset was randomly divided into training, validation, and test sets in a 7:2:1 ratio. This random division method effectively reduces potential bias during data division, thereby improving the generalization ability of the model. The composition of the dataset is shown in Table 1.

Table 1.
Dataset Composition.
2.3. Experimental Environment
Each batch of data samples was randomly drawn from the entire dataset. Training small batches promotes the model’s ability to learn more generalizable features. Therefore, the batch size for this experiment was set to 4 to ensure efficient and stable training.
Appropriate training epochs are crucial for improving the generalization ability of the model, that is, being able to perform well on unseen data. To avoid over-fitting and improve model performance, the number of training epochs needs to be optimized based on the performance of the validation set. Excessive training epochs not only lead to over-fitting but also increase training time and computational cost. Therefore, in this experiment, the number of training epochs was set at 200 to ensure good performance within a reasonable time frame. For the choice of optimizer, the Stochastic Gradient Descent (SGD) optimizer offers fast convergence, effective parameter updates, and optimization capabilities, along with broad tuning potential. Therefore, this experiment adopted the SGD optimizer. The specific training environment configuration is shown in Table 2.
Table 2.
Training Environment Configuration.
3. Model Design
To address the problem of poor multi-target and multi-scale detection performance faced by RT-DETR models in maize leaf disease detection, this paper proposes a solution based on an improved RT-DETR model. This section first presents the overall design of the improved RT-DETR model, followed by detailed explanations of the components and advantages of each improvement module.
3.1. Improved Model
For the task of maize leaf disease detection, the model not only requires high accuracy and real-time performance, but also faces significant challenges in light-weighting. Therefore, this paper proposes a solution based on an improved RT-DETR model to address issues such as detection accuracy, processing time, and light-weighting.
To reduce the parameter size and computational complexity of the model, this paper redesigns the backbone network and introduces the lighter Quantization Aware RepVGG (QARepVGG) module to improve feature extraction capabilities while reducing parameter size. This structural optimization not only reduces redundant computations, but also improves model performance. To adapt to multi-scale disease features, this paper combines the deformable attention mechanism with the intrascale feature interaction module to form the AIFI-DAT module, which is introduced into the baseline RT-DETR model. This enhancement effectively reduces the miss rate. SCConv helps to better merge features from different levels, thus improving the model’s ability to adapt to multi-scale features and complex backgrounds. Therefore, in this paper, the SCConv module is introduced in the neck network to replace some convolutional modules and improve the model’s ability to fuse features from different levels. The improved RT-DETR model is shown in Figure 3.
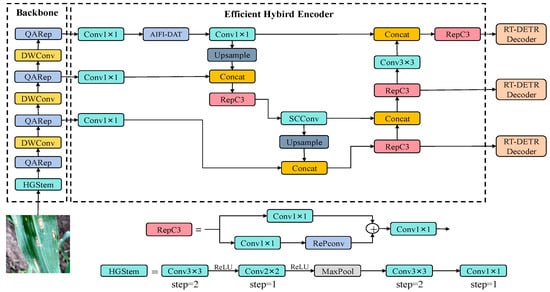
Figure 3.
Improved RT-DETR Module Diagram.
3.2. Backbone Network
QARepVGG is an improvement over RepVGG that maintains the good performance of RepVGG while generating weights and activation distributions that are favorable for quantization, thereby greatly simplifying the final quantization process. To reduce the parameter size and computational complexity of the model, this paper redesigns the backbone network based on the QARepVGG module to reduce redundant computations, thereby reducing the parameter size while further improving the accuracy of the model.
To increase the representational capacity of the model, the RepVGG block parallelizes three branches: a main branch with a 3 × 3 convolutional kernel, a shortcut branch with a 1 × 1 convolutional kernel, and a shortcut branch with only batch normalization (BN). The QARepVGG block removes the standalone BN branch and adds additional BN after the three branches to achieve better light-weighting and more stable model efficiency. The RepVGG and QARepVGG block diagrams are shown in Figure 4.
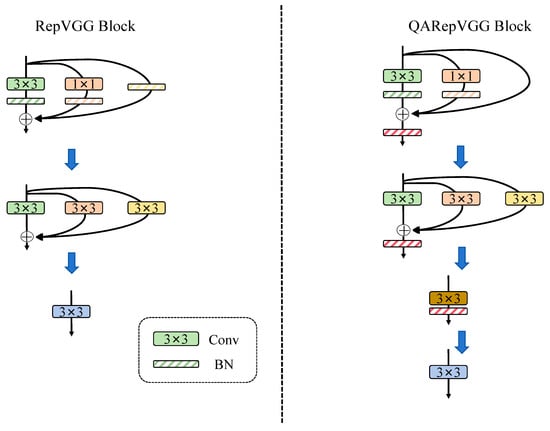
Figure 4.
RepVGG and QARepVGG Module Diagram.
This module includes the fusion of the convolutional layer and the BN layer, with the calculation formula of the convolutional layer as shown in Equation (1).
where are the convolutional kernel weights and is the bias learned during training.
The calculation formula of the BN layer is shown in Equation (2).
where , , and represent the scaling factor, variance, standard deviation, and bias term, respectively, for the batch normalization.
To further fuse the convolutional layer with the BN layer, substituting the convolutional layer into the BN layer calculation formula gives the result shown in Equation (3).
Let and , and the final fusion result is shown in Equation (4).
3.3. Attention-Based Intrascale Feature Interaction
To address the impact of multi-scale features in maize disease images on model accuracy, this paper introduces the deformable attention module into the intrascale feature interaction module to optimize the feature interaction process. This helps the model to better extract maize disease features at different scales, allowing the model to focus on key areas of maize leaf diseases, thereby improving detection accuracy and robustness.
In traditional attention mechanisms, weights are typically computed based on fixed positions, whereas in the deformable attention mechanism, the shape and size of the attention module can be dynamically adjusted to better adapt to different image characteristics, thereby improving the model’s feature extraction capabilities. Traditional self-attention mechanisms traverse all pixels in an image, resulting in high computational cost, while the deformable attention mechanism dynamically selects sampling points instead of processing the entire image. This dynamic selection mechanism allows the model to focus more on the regions most relevant to the current task, reducing computational cost while maintaining good performance. The module diagram of the deformable attention mechanism is shown in Figure 5.
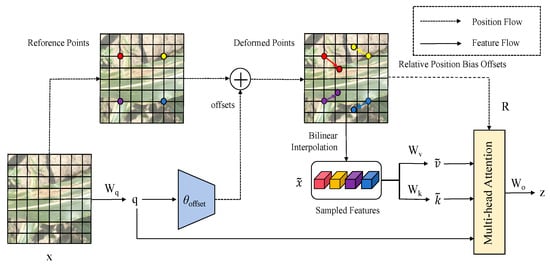
Figure 5.
The Deformable Attention Module Diagram.
The specific steps of the deformable attention module are as follows:
- (1)
- Based on the feature map of the maize leaf diseases, a uniform grid of reference points is generated on .
- (2)
- The feature map is linearly projected onto query tokens, , and input into a light-weight subnetwork to generate offsets .
- (3)
- Sampling takes place at the positions of the deformed points in the form of keys and values, which are passed on to the multi-head attention module together with the query.
- (4)
- The multi-head attention module integrates the features of the previous stage and projects them through in order to obtain the final output z.
When processing maize disease images, the deformable attention mechanism focuses only on key regions of the maize leaf images, using a dynamic sampling point selection mechanism to make the model focus more on the most relevant regions. Therefore, the deformable attention mechanism can adapt to maize diseases at different scales, enabling the model to maintain high accuracy in tasks involving disease detection at different scales.
3.4. Neck Network
To further improve the model’s ability to fuse multi-scale features, this paper introduces SCConv in the neck network. SCConv combines spatial and channel information by performing cascading operations across channel and spatial dimensions, allowing the model to better exploit the relationships between spatial and channel features. In maize leaf disease detection, SCConv helps the model to better fuse multi-level features, improving the model’s adaptability to multi-scale features and robustness in complex backgrounds. The SCConv module is shown in Figure 6.
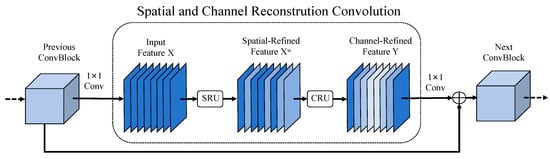
Figure 6.
SCConv Module Diagram.
The SCConv module consists of two main units: the Spatial Reconstruction Unit (SRU) and the Channel Reconstruction Unit (CRU). The input feature X first passes through the SRU to produce spatially refined features , which then pass through the CRU to refine features at the channel level and produce the output feature Y.
- (1)
- Spatial Reconstruction Unit (SRU)
This unit uses a separation–reconstruction approach. In the separation operation, feature maps with high information content are separated from those with low information content, corresponding to the spatial content. The scaling factor in Group Normalization (GN) is used to evaluate the information content in different feature maps, as shown in Equations (5)–(7).
where and are the mean and standard deviation, and are trainable variables, and is a small constant for stability. A larger value represents greater variation between pixels, indicating richer spatial information.
The reconstruction operation involves adding features with high information content to those with low information content in order to generate features with more information while saving space. Specifically, cross-reconstruction is performed by merging two features with different information weights to obtain and , which are then concatenated to produce the spatially refined feature map , as shown in Equation (8).
where ⊗ represents element-wise multiplication, represents element-wise addition, and represents union. The SRU module diagram is shown in Figure 7.
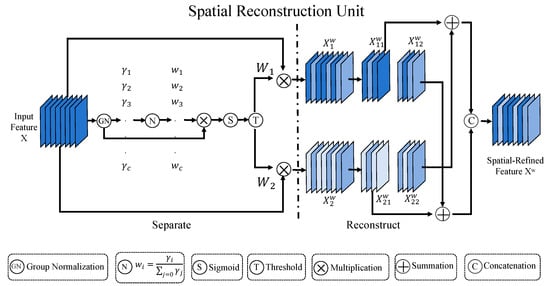
Figure 7.
SRU Module Diagram.
- (2)
- Channel Reconstruction Unit (CRU)
This device uses a split–transform–merge approach.
First, the input spatially refined feature is split into two parts by a split operation: one part with channels and the other with channels, where is a hyper-parameter and 0 ≤ ≤ 1. The channel numbers of the two feature sets are then compressed using 1 × 1 convolutional kernels to obtain and .
Next, the transform operation is used as an input for “rich feature extraction”, performing Group-Wise Convolution (GWC) and Point-Wise Convolution (PWC), and then summing the results to obtain the output . The input is used as a complement for “rich feature extraction”, undergoing PWC, with the result combined with the original input to obtain .
Finally, the merge operation uses a simplified SKNet method to adaptively merge and . Global average pooling is used to combine global spatial information with channel statistics to obtain pooled and . Soft Max is then applied to and to obtain feature weight vectors and , and the output is Y = + , where Y represents the channel-refined features. The diagram of the CRU module is shown in Figure 8.
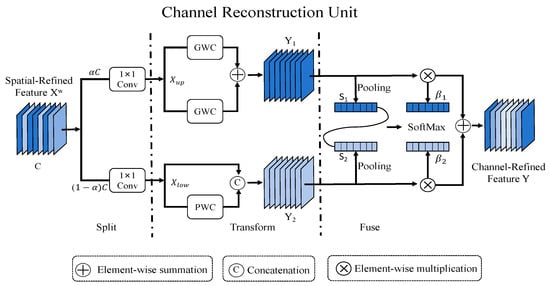
Figure 8.
CRU Module Diagram.
3.5. Evaluation Metrics
In object detection, samples can be classified into four cases based on the combination of true and predicted labels: True Positive (TP), True Negative (TN), False Positive (FP), and False Negative (FN). These four metrics form the confusion matrix, where higher TP and TN values indicate higher detection accuracy, and lower FP and FN values indicate fewer misclassifications. This paper uses precision, recall, mean average precision (mAP), frames per second (FPS), and parameter size as evaluation metrics to assess the effectiveness of maize leaf disease detection. These metrics are highly valuable for evaluating the real-time performance, accuracy, and computational complexity of the model.
Precision refers to the proportion of correctly identified positive samples out of all predicted positive samples. Precision reflects the accuracy of the model in predicting positive samples and its calculation formula is given in Equation (9).
Recall refers to the proportion of correctly identified positive samples out of all actual positive samples. Recall reflects the sensitivity of the model in detecting positive samples and its calculation formula is given in Equation (10).
Mean average precision (mAP) is a comprehensive metric that includes both precision and recall. AP represents the average probability of correct predictions for each category, while mAP is the average of correct predictions across all categories and is used to evaluate the performance of the algorithm across multiple categories. The formulae for AP and mAP are given in Equations (11) and (12).
where P is the precision, N is the number of target categories in the dataset, and i is the average precision for the i-th target category. When calculating mAP, the Intersection over Union (IoU) threshold is set to 0.5, denoted as mAP@0.5; the average of all mAP values greater than or equal to 0.5 and less than or equal to 0.95 is calculated and denoted as mAP@0.5:0.95.
In addition, FPS is used to evaluate the inference speed and real-time performance of the model, while parameter size represents the scale of the model. Higher accuracy, recall, FPS, and mAP indicate better detection performance, while lower parameter size indicates lower resource consumption during deployment.
4. Results and Discussion
4.1. Ablation Experiments
To verify the effectiveness of the proposed enhancements, ablation experiments were performed on the same dataset as well as in the same experimental setting, where the enhancement modules were sequentially added to the baseline RT-DETR network, the right mark indicates that the module was added to the baseline model during the experiment. The experimental results are presented in Table 3 and Figure 9.
Table 3.
Ablation Experiments Table.
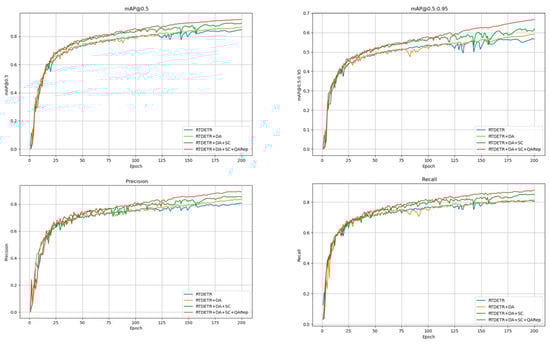
Figure 9.
Ablation Experiments Diagram.
The experimental results show that, compared to the original RT-DETR model, introducing the deformable attention mechanism into the baseline model, with more efficient processing of important information in images by dynamically selecting sampling points in key areas, improved the average precision by 4.2% and reduced the parameter size by 1.5 M. SCConv further optimized the feature extraction process and, by reducing spatial and channel redundancy between features through spatial reconstruction units and channel reconstruction units, improved the average recognition accuracy by 2.8% and increased the recognition speed (FPS) by 18.4 frames. By adding both deformable attention and SCConv to the baseline model, small targets and complex scenes can be better handled, and image features can be extracted and exploited more comprehensively, resulting in a 4.7% increase in average accuracy. Replacing the backbone network significantly reduces model redundancy calculations and reduces the number of model parameters, which further improved the average accuracy by 2.6% and reduced the parameter size by 18.9 M. The combined use of the three modules significantly enhances the model’s ability to extract features, optimizes the performance of multi-scale feature fusion, and contributes to a reduction in the total number of parameters. For subsequent deployment applications, if the model has too many parameters, it will consume more resources. Therefore, this study has light-weighted the model without compromising accuracy.
4.2. Comparative Experiments
In order to comprehensively evaluate the performance of the model, this paper selected several mainstream object detection algorithms, including YOLO-v6m, YOLO-v8m, YOLO-v9c, YOLOv-11m, DETR (Detection Transformer), Deformable-DETR, and RT-DETR, for comparative experiments on the dataset. The results of the comparative experiments are shown in Table 4.
Table 4.
Comparative Experiment Results.
The experimental results show that the improved RT-DETR model has a smaller parameter size compared to other mainstream object detection algorithms, while achieving higher average detection accuracy (mAP@0.5, mAP@0.5:0.95), precision, recall, parameter size, and speed of detection (FPS). Compared to the YOLO series models, the enhanced model achieves higher precision and faster detection speed at a similar scale. The improved model achieves an mAP@0.5 of 92.0%, a 7.3% improvement over the RT-DETR model, with a parameter size of 23.8 M, a reduction of 18.9 M compared to the RT-DETR. Considering detection accuracy, detection speed, and parameter size, the proposed improved algorithm shows superior overall performance compared to other object detection algorithms.
4.3. Result Analysis
The confusion matrix summarizes the classification prediction results, aggregating the number of correct and incorrect predictions and distinguishing them by category, clearly showing the model’s confusion in making predictions. The confusion matrix records data in matrix form and summarizes based on two criteria: true labels and predicted labels. The rows of the matrix represent the true values and the columns represent the predicted values. The detection process of this experiment was interfered with by the image background, which made it prone to the phenomenon of category misclassification. The confusion matrix for this experiment is shown in Figure 10.
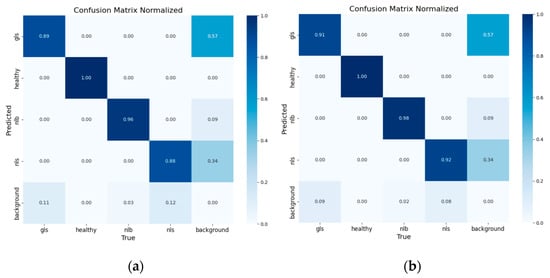
Figure 10.
RT-DETR Confusion Matrix: (a) RT-DETR, (b) Improved RT-DETR.
The precision–confidence curve shows the precision for each category when the predicted probability exceeds the confidence threshold. Higher confidence leads to more accurate category detection but may miss some true samples with lower predicted probabilities. The precision–confidence curve for this experiment is shown in Figure 11.
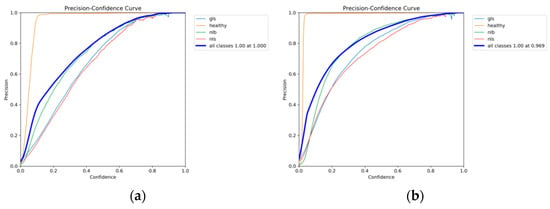
Figure 11.
Precision–Confidence Curve: (a) RT-DETR, (b) Improved RT-DETR.
The recall–confidence curve shows that lower confidence leads to more comprehensive category detection, reducing missed detections but increasing false positives. As confidence increases, recall decreases. The recall–confidence curve for this experiment is shown in Figure 12.
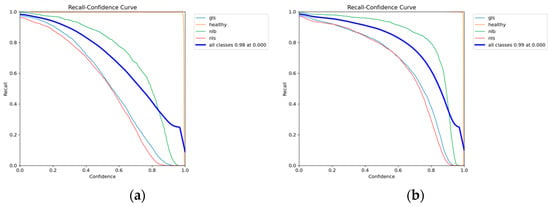
Figure 12.
Recall–Confidence Curve: (a) RT-DETR, (b) Improved RT-DETR.
The precision–recall curve shows the relationship between precision and recall. In general, higher precision results in lower recall. Therefore, the goal is to achieve high precision while recognizing as many categories as possible. Typically, recall is plotted on the x-axis and precision on the y-axis, with the area under the curve representing the AP and the average of all category APs representing the mAP. The precision–recall curve for this experiment is shown in Figure 13.
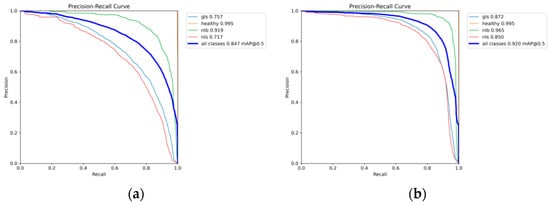
Figure 13.
Precision–Recall Curve: (a) RT-DETR, (b) Improved RT-DETR.
F1 is defined as the harmonic mean of precision and recall, with lower F1 values at both low and high confidence thresholds. At low confidence thresholds, many low-confidence samples are considered true, resulting in high recall but low precision; at high confidence thresholds, only high-confidence samples are considered true, resulting in more accurate category detection but lower F1 scores. The formula for calculating the F1 score is given in Equation (13), and the F1 curve for this experiment is shown in Figure 14.
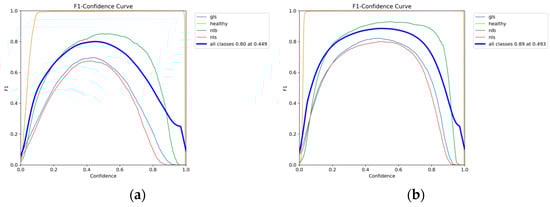
Figure 14.
F1 Curve: (a) RT-DETR, (b) Improved RT-DETR.
It can be concluded from the experimental comparison that the proposed model has better category discrimination capabilities compared to the RT-DETR model, with stronger judgement of different disease categories and better resistance to image background interference. When the confidence is in the range of 0.6 to 0.8, the improved model proposed in this paper demonstrates superior detection performance compared to the original model. In addition, the proposed model has a faster convergence speed and is lighter, which reduces resource consumption. Although the image processing speed of the proposed model is slightly lower than that of the original model, considering all evaluation metrics, the proposed model has superior overall performance. Compared with other mainstream network models, the proposed model outperforms in terms of accuracy, parameter size, and processing time. However, due to interference from factors such as soil and weeds in the image background, misjudgments are likely to occur during the detection process. Therefore, it is necessary to further improve the model’s robustness against background interference. In previous studies, numerous experiments have introduced new attention mechanisms and convolutional modules into models to enhance detection performance and reduce the number of model parameters. These efforts align closely with the focus of this study, further validating the scientific value of this experiment. In summary, the proposed model not only improves detection accuracy and achieves light-weighting, but also has a faster processing speed compared to models of similar size.
5. Conclusions
This paper proposes an improved RT-DETR model for the detection of multi-species and multi-scale diseases in maize leaves based on the characteristics of maize leaf diseases and the presence of multi-species diseases in the leaves, which enhances the overall performance of the model and reduces the parameter size and computational complexity of the model for multi-species and multi-scale disease detection tasks in maize leaves. After several comparison experiments, the following conclusions were drawn:
- (1)
- Deformable Attention effectively extracts multi-level disease features in maize leaves; the addition of SCConv at the feature fusion stage improves the model’s ability to process multi-level features, significantly improving detection performance.
- (2)
- The QARepVGG module, with its light-weight and efficient characteristics, not only achieves model light-weighting, but also optimizes the feature extraction stage, further improving the overall performance of the model and making it more suitable for use.
In summary, the improved RT-DETR model shows significant advantages in the detection of maize leaf diseases and achieves efficient detection of maize leaf diseases. Future research will focus on further optimizing the model structure and algorithms to address factors such as background interference during detection, thus further protecting crops from disease threats.
Author Contributions
J.Y. designed the experiments, reviewed and supervised the writing of the paper, and provided funding; Z.Z. performed the experiments and wrote the paper; M.Y. assisted in the experiments and format revision; and L.L. and M.W. provided the datasets. All authors have read and agreed to the published version of the manuscript.
Funding
This work was supported by the Key Scientific Research Projects of Henan Higher Education Institutions (No. 24A520022) and the North China University of Water Conservancy and Electric Power High-level Experts Scientific Research Foundation (202401014).
Data Availability Statement
All data generated or appearing in this study are available upon request by contact with the corresponding author. Furthermore, the models and code used during this study cannot be shared at this time as the data also form part of an ongoing study.
Acknowledgments
We are deeply grateful for the generous support of the following organizations, whose contributions played a crucial role in the completion of this research: the Key Scientific Research Projects of Henan Higher Education Institutions (No. 24A520022); the North China University of Water Conservancy and Electric Power High-level Experts Scientific Research Foundation (202401014). Their financial and intellectual contributions have been instrumental in advancing the progress of our work.
Conflicts of Interest
The authors declare no conflicts of interest.
References
- Mu, Z. Risks and Challenges to China’s Food Security under the New Development Paradigm and Their Governance. Grain Sci. Technol. Econ. 2024, 49, 1–8+18. [Google Scholar] [CrossRef]
- Ma, Z.; Wang, W.; Chen, X.; Gehman, K.; Yang, H.; Yang, Y. Prediction of the global occurrence of maize diseases and estimation of yield loss under climate change. Pest Manag. Sci. 2024, 80, 5759–5770. [Google Scholar] [CrossRef]
- Wang, Z.; Wang, X. Current Situation, Trends, and Control Strategies of Maize Diseases and Pests in China. Plant Prot. 2019, 45, 1–11. [Google Scholar] [CrossRef]
- Cui, A.; Zhang, J.; Zhang, H.; Shan, H.; Chen, W. Current Situation and Developmental Changes in Maize Production in China. J. Agric. Sci. Technol. 2020, 22, 10–19. [Google Scholar] [CrossRef]
- Su, D.; Deng, Y. Research Progress and Existing Problems in Crop Disease Image Recognition. J. Tianjin Agric. Univ. 2023, 30, 75–79. [Google Scholar] [CrossRef]
- Shao, M.; Zhang, J.; Feng, Q.; Chai, X.; Zhang, N.; Zhang, W. Research Progress of Deep Learning in Detection and Recognition of Plant Leaf Diseases. Smart Agric. 2022, 4, 29–46. [Google Scholar]
- Yao, J.; Zhang, Y.; Liu, J. Wheat Pest and Disease Recognition Based on Convolutional Neural Network and Transfer Learning. J. North China Univ. Water Resour. Electr. Power 2022, 43, 102–108. [Google Scholar] [CrossRef]
- Yao, J.; Liu, J.; Zhang, Y.; Wang, H. Identification of winter wheat pests and diseases based on improved convolutional neural network. Open Life Sci. 2023, 18, 20220632. [Google Scholar] [CrossRef]
- Sibiya, M.; Sumbwanyambe, M. A computational procedure for the recognition and classification of maize leaf diseases out of healthy leaves using convolutional neural networks. AgriEngineering 2019, 1, 119–131. [Google Scholar] [CrossRef]
- Saleem, M.H.; Potgieter, J.; Arif, K.M. Plant disease classification: A comparative evaluation of convolutional neural networks and deep learning optimizers. Plants 2020, 9, 1319. [Google Scholar] [CrossRef]
- Chen, G.; Zhao, S.; Cao, L.; Fu, S.; Zhou, J. Maize Plant Disease Identification Based on Transfer Learning and Convolutional Neural Network. Smart Agric. 2019, 1, 34–44. [Google Scholar]
- Sun, J.; Yang, Y.; He, X.; Wu, X. Northern maize leaf blight detection under complex field environment based on deep learning. IEEE Access 2020, 8, 33679–33688. [Google Scholar] [CrossRef]
- Liang, Q.; Zhao, Z.; Sun, J.; Jiang, T.; Guo, N.; Yu, H.; Ge, Y. Multi-target detection method for maize pests based on improved YOLOv8. INMATEH-Agric. Eng. 2024, 73, 228. [Google Scholar]
- Yang, J.; Gapar, Y. Improved object detection algorithm based on multi-scale and variability convolutional neural networks. IECE Trans. Emerg. Top. Artif. Intell. 2024, 1, 31–43. [Google Scholar] [CrossRef]
- Chen, L.; Liu, Y.; Wang, Y. Effective convolution mixed Transformer Siamese network for robust visual tracking. Control Theory Technol. 2025, 1–16. [Google Scholar] [CrossRef]
- Carion, N.; Massa, F.; Synnaeve, G.; Usunier, N.; Kirillov, A.; Zagoruyko, S. (Eds.) End-to-End Object Detection with Transformers; European Conference on Computer Vision; Springer: Berlin/Heidelberg, Germany, 2020. [Google Scholar]
- Zhu, X.; Su, W.; Lu, L.; Li, B.; Wang, X.; Dai, J. Deformable detr: Deformable transformers for end-to-end object detection. arXiv 2020, arXiv:201004159. [Google Scholar]
- Zhao, Y.; Lv, W.; Xu, S.; Wei, J.; Wang, G.; Dang, Q.; Liu, Y.; Chen, J. (Eds.) Detrs beat yolos on real-time object detection. In Proceedings of the IEEE/CVF Conference on Computer Vision and Pattern Recognition, Seattle, WA, USA, 17–21 June 2024. [Google Scholar]
- Wang, S.; Jiang, H.; Yang, J.; Ma, X.; Chen, J.; Li, Z.; Tang, X. Lightweight tomato ripeness detection algorithm based on the improved RT-DETR. Front. Plant Sci. 2024, 15, 1415297. [Google Scholar] [CrossRef]
- Xu, L.; Zeng, W. DCEI-RTDETR: An improved RT-DETR-based detection algorithm for data center equipment indicator lights. J. Real-Time Image Process. 2025, 22, 1–12. [Google Scholar] [CrossRef]
- Xia, Z.; Pan, X.; Song, S.; Li, L.E.; Huang, G. (Eds.) Vision transformer with deformable attention. In Proceedings of the IEEE/CVF Conference on Computer Vision and Pattern Recognition, New Orleans, LA, USA, 18–24 June 2022. [Google Scholar]
- Li, J.; Wen, Y.; He, L. (Eds.) Scconv: Spatial and channel reconstruction convolution for feature redundancy. In Proceedings of the IEEE/CVF Conference on Computer Vision and Pattern Recognition, Vancouver, BC, Canada, 17–24 June 2023. [Google Scholar]
- Chu, X.; Li, L.; Zhang, B. (Eds.) Make repvgg greater again: A quantization-aware approach. In Proceedings of the AAAI Conference on Artificial Intelligence, Vancouver, BC, Canada, 26–27 February 2024. [Google Scholar]
- Jiang, P.; Ergu, D.; Liu, F.; Cai, Y.; Ma, B. A Review of Yolo algorithm developments. Procedia Comput. Sci. 2022, 199, 1066–1073. [Google Scholar] [CrossRef]
- Ahmad, A.; Saraswat, D.; Gamal, A.E.; Johal, G. CD&S dataset: Handheld imagery dataset acquired under field conditions for corn disease identification and severity estimation. arXiv 2021, arXiv:211012084. [Google Scholar]
- Mohanty, S.P.; Hughes, D.P.; Salathé, M. Using deep learning for image-based plant disease detection. Front. Plant Sci. 2016, 7, 215232. [Google Scholar] [CrossRef]
Disclaimer/Publisher’s Note: The statements, opinions and data contained in all publications are solely those of the individual author(s) and contributor(s) and not of MDPI and/or the editor(s). MDPI and/or the editor(s) disclaim responsibility for any injury to people or property resulting from any ideas, methods, instructions or products referred to in the content. |
© 2025 by the authors. Licensee MDPI, Basel, Switzerland. This article is an open access article distributed under the terms and conditions of the Creative Commons Attribution (CC BY) license (https://creativecommons.org/licenses/by/4.0/).