Abstract
In view of the diversity and varying complexity of ship equipment, and the difficulty of existing state assessment methods in effectively handling the differences in the influence of different characteristic parameters on the equipment’s health state, leading to poor evaluation results, this paper proposes a ship equipment health state assessment method based on BP-RF and combined weighting. This method utilizes the BP-RF model to mine the implicit relationship between ship equipment feature parameters and state patterns, converting monitoring data into state pattern probability information. A trapezoidal membership function is used to determine the membership degree of each state pattern probability to different health state levels. The combined weighting method, which reflects a symmetric concept, balances expert experience and data information by integrating the subjective and objective weights of each state pattern probability, thus determining the equipment’s health state level. Through a case study of a specific type of ship’s gas turbine, the BP-RF model achieves a diagnostic accuracy of 98.3%, with scores improved by 5.1%, 5.0%, 8.6%, 9.9%, 6.7%, 3.4%, and 5.3% compared to the BP neural network, RF, Support Vector Machine (SVM), Convolutional Neural Network (CNN), BP-SVM, SVM-RF, and CNN-SVM models, respectively. Additionally, the evaluation results of this method exhibit clear boundaries for each state membership degree, effectively addressing the problem of unbalanced contributions from characteristic parameters and comprehensively reflecting the relative importance and correlation of each parameter. Overall, this method provides a more accurate and comprehensive assessment of ship equipment health compared to other methods, offering reliable support for ship equipment maintenance and assurance.
1. Introduction
A ship, as a typically large and complex equipment system with multiple tasks and systems, relies heavily on maintaining its health state to ensure optimal combat effectiveness, improve the ship’s combat capabilities, and guarantee mission success [1]. Due to the variety and significant differences in the complexity of ship equipment, the types and quantities of feature parameters used to represent its health state also vary. However, due to the significant differences in the degree of abnormalities of various characteristic parameters, existing assessment methods based on these parameters are insufficient in effectively addressing the discrepancies in their impact on the equipment’s health state, which reduces the effectiveness and accuracy of the evaluation. Therefore, there is an urgent need to explore more scientific and accurate methods for assessing the health state of ship equipment to provide reliable support for ship equipment maintenance and support.
Through literature review, current health state assessment methods can mainly be classified into model-driven, data-driven, and knowledge-driven approaches [2]. Among them, the model-driven approach has the advantages of high evaluation accuracy and low spatiotemporal complexity. However, an in-depth study of the fault mechanisms of the evaluated object is required, and there is a high demand for the integrity and accuracy of the physical model [3]. Ding Shanting et al., considering the impact of sea conditions on the safe navigation and mission execution of ships, proposed a health state simulation assessment method based on multi-agent technology [4]. Ding et al. proposed a health state assessment method for ship DC motor drive circuits by mapping the measured data to typical failure models using gradient descent and similarity analysis methods [5]. The data-driven approach has the advantages of strong objectivity, wide applicability, and high evaluation accuracy [6], but its evaluation results depend on the quality of the data and lack of interpretability. Yang Zhichun et al. proposed a real-time assessment method for the state of distribution equipment based on the mutual information theory–particle swarm optimization–BP neural network (MI-PSO-BP) algorithm, by integrating comprehensive evaluation with real-time monitoring data through a two-stage evaluation framework [7]. Duan Zenghai et al., addressing the issues of single data sources and low reliability in existing vibration signal-based analysis methods, proposed a hydraulic pump health state assessment method based on a multi-granularity cascading forest model [8]. The knowledge-driven approach is not restricted by the evaluation object and offers advantages such as low spatiotemporal complexity, broad applicability, and strong interpretability. However, due to the influence of subjective factors, the evaluation accuracy is often low, and the results are relatively vague. Zou Yang et al. proposed an evaluation method based on gray correlation analysis and clustering cloud model to address the issue of limited characteristic quantities in the dielectric response of oil-paper insulation and the inaccurate evaluation caused by not considering system randomness [9]. Hu et al. proposed a health state evaluation method based on fuzzy theory and variable weight theory by analyzing the key factors such as the importance and health state of various devices in the ship propulsion system [10]. This paper combines data-driven and knowledge-driven health state assessment methods. By transforming feature parameters into state pattern probabilities as evaluation indicators, it can comprehensively reflect the relative importance and correlation of each parameter, while effectively overcoming the impact of uneven contributions from different parameters. On this basis, a fuzzy comprehensive evaluation is conducted with the help of expert knowledge to determine the final health state assessment result. This method not only comprehensively reflects the contribution of each characteristic parameter to the health state, providing a more accurate and comprehensive health state assessment of ship equipment, but also helps explain the influence mechanism of characteristic parameters on the final evaluation results.
Regarding the weighting of evaluation indicators, the existing literature mainly adopts two methods: one is the subjective weighting method based on expert knowledge [11,12], and the other is the objective weighting method based on indicator data statistics or correlation analysis [13,14,15,16]. Li Bin [17] and Meng Tieqiang [18], for instance, use the AHP and entropy weight methods for weighting. However, the AHP method lacks sufficient objectivity, while the entropy weight method overlooks expert experience. This may lead to an unreasonable distribution of weights for evaluation indicators, thereby affecting the credibility of the evaluation results. To address this, this paper combines subjective expert experience and objective data information, proposing a combined weighting method based on the principle of minimum discriminative information [19], aimed at overcoming the limitation that a single weighting method cannot fully reflect the relative importance of evaluation indicators.
In view of this, this paper proposes a ship equipment health state assessment method based on a combination of data-driven and knowledge-driven approaches, utilizing a BP neural network and random forest (BP-RF) model along with a combined weighting method. The innovations of this method are mainly reflected in the following three aspects: First, a BP-RF diagnostic model is constructed, combining the BP neural network’s advantage in handling nonlinear relationships with the ensemble learning ability of the random forest (RF) algorithm, overcoming the limitations of a single model. This achieves an accurate transformation from feature parameters to state pattern probabilities, providing more reliable indicators for health assessment. Second, a combined weighting method based on the G1 method and grey relational analysis is used to integrate expert knowledge and objective data, reasonably determining the weights of state pattern probabilities, and ensuring the scientific and objective allocation of weights. Finally, by utilizing state pattern probabilities as evaluation indicators, the method successfully solves the interference caused by the uneven contribution of feature parameters, comprehensively reflecting the relative importance and relevance of each parameter. Through case verification, the results show that this method has significant advantages over other assessment methods in terms of accuracy and comprehensiveness, and the evaluation results have good interpretability, providing strong support for the maintenance and support of ship equipment.
In summary, this paper presents a study on the health state assessment method for ship equipment based on the BP neural network–random forest (BP-RF) model and a combined weighting approach. First, the BP-RF model is used to analyze the implicit relationships between the characteristic parameters of ship equipment and the state patterns, converting the raw monitoring data into state pattern probability information. Next, the health state classification rules are clarified, and the trapezoidal distribution membership function is applied to determine the membership degree of each state pattern probability corresponding to a health state level. Then, a combined weighting method, using grey relational analysis and the G1 method, is employed to assign a comprehensive weight to each state pattern probability, thereby determining the health state level of the equipment. Finally, through case analysis, the effectiveness of the proposed method is validated, achieving a health state assessment for ship equipment based on state patterns.
2. State Pattern Diagnosis of Ship Equipment Based on the BP-RF Model
To avoid the impact of uneven contributions from different parameters on the evaluation results, this paper utilizes the BP-RF model to capture the implicit relationships between feature parameters and state patterns, thereby transforming the feature parameters into state pattern probabilities for health assessment.
2.1. BP Neural Network
The BP neural network is one of the most widely used and successful artificial neural networks in the field of fault diagnosis [20,21,22]. It has high adaptability and strong generalization capabilities, making it effective at handling nonlinear problems that traditional algorithms struggle with [23]. Given that ship equipment state pattern diagnosis is inherently nonlinear, this paper designs a ship equipment state pattern diagnosis model based on the BP neural network.
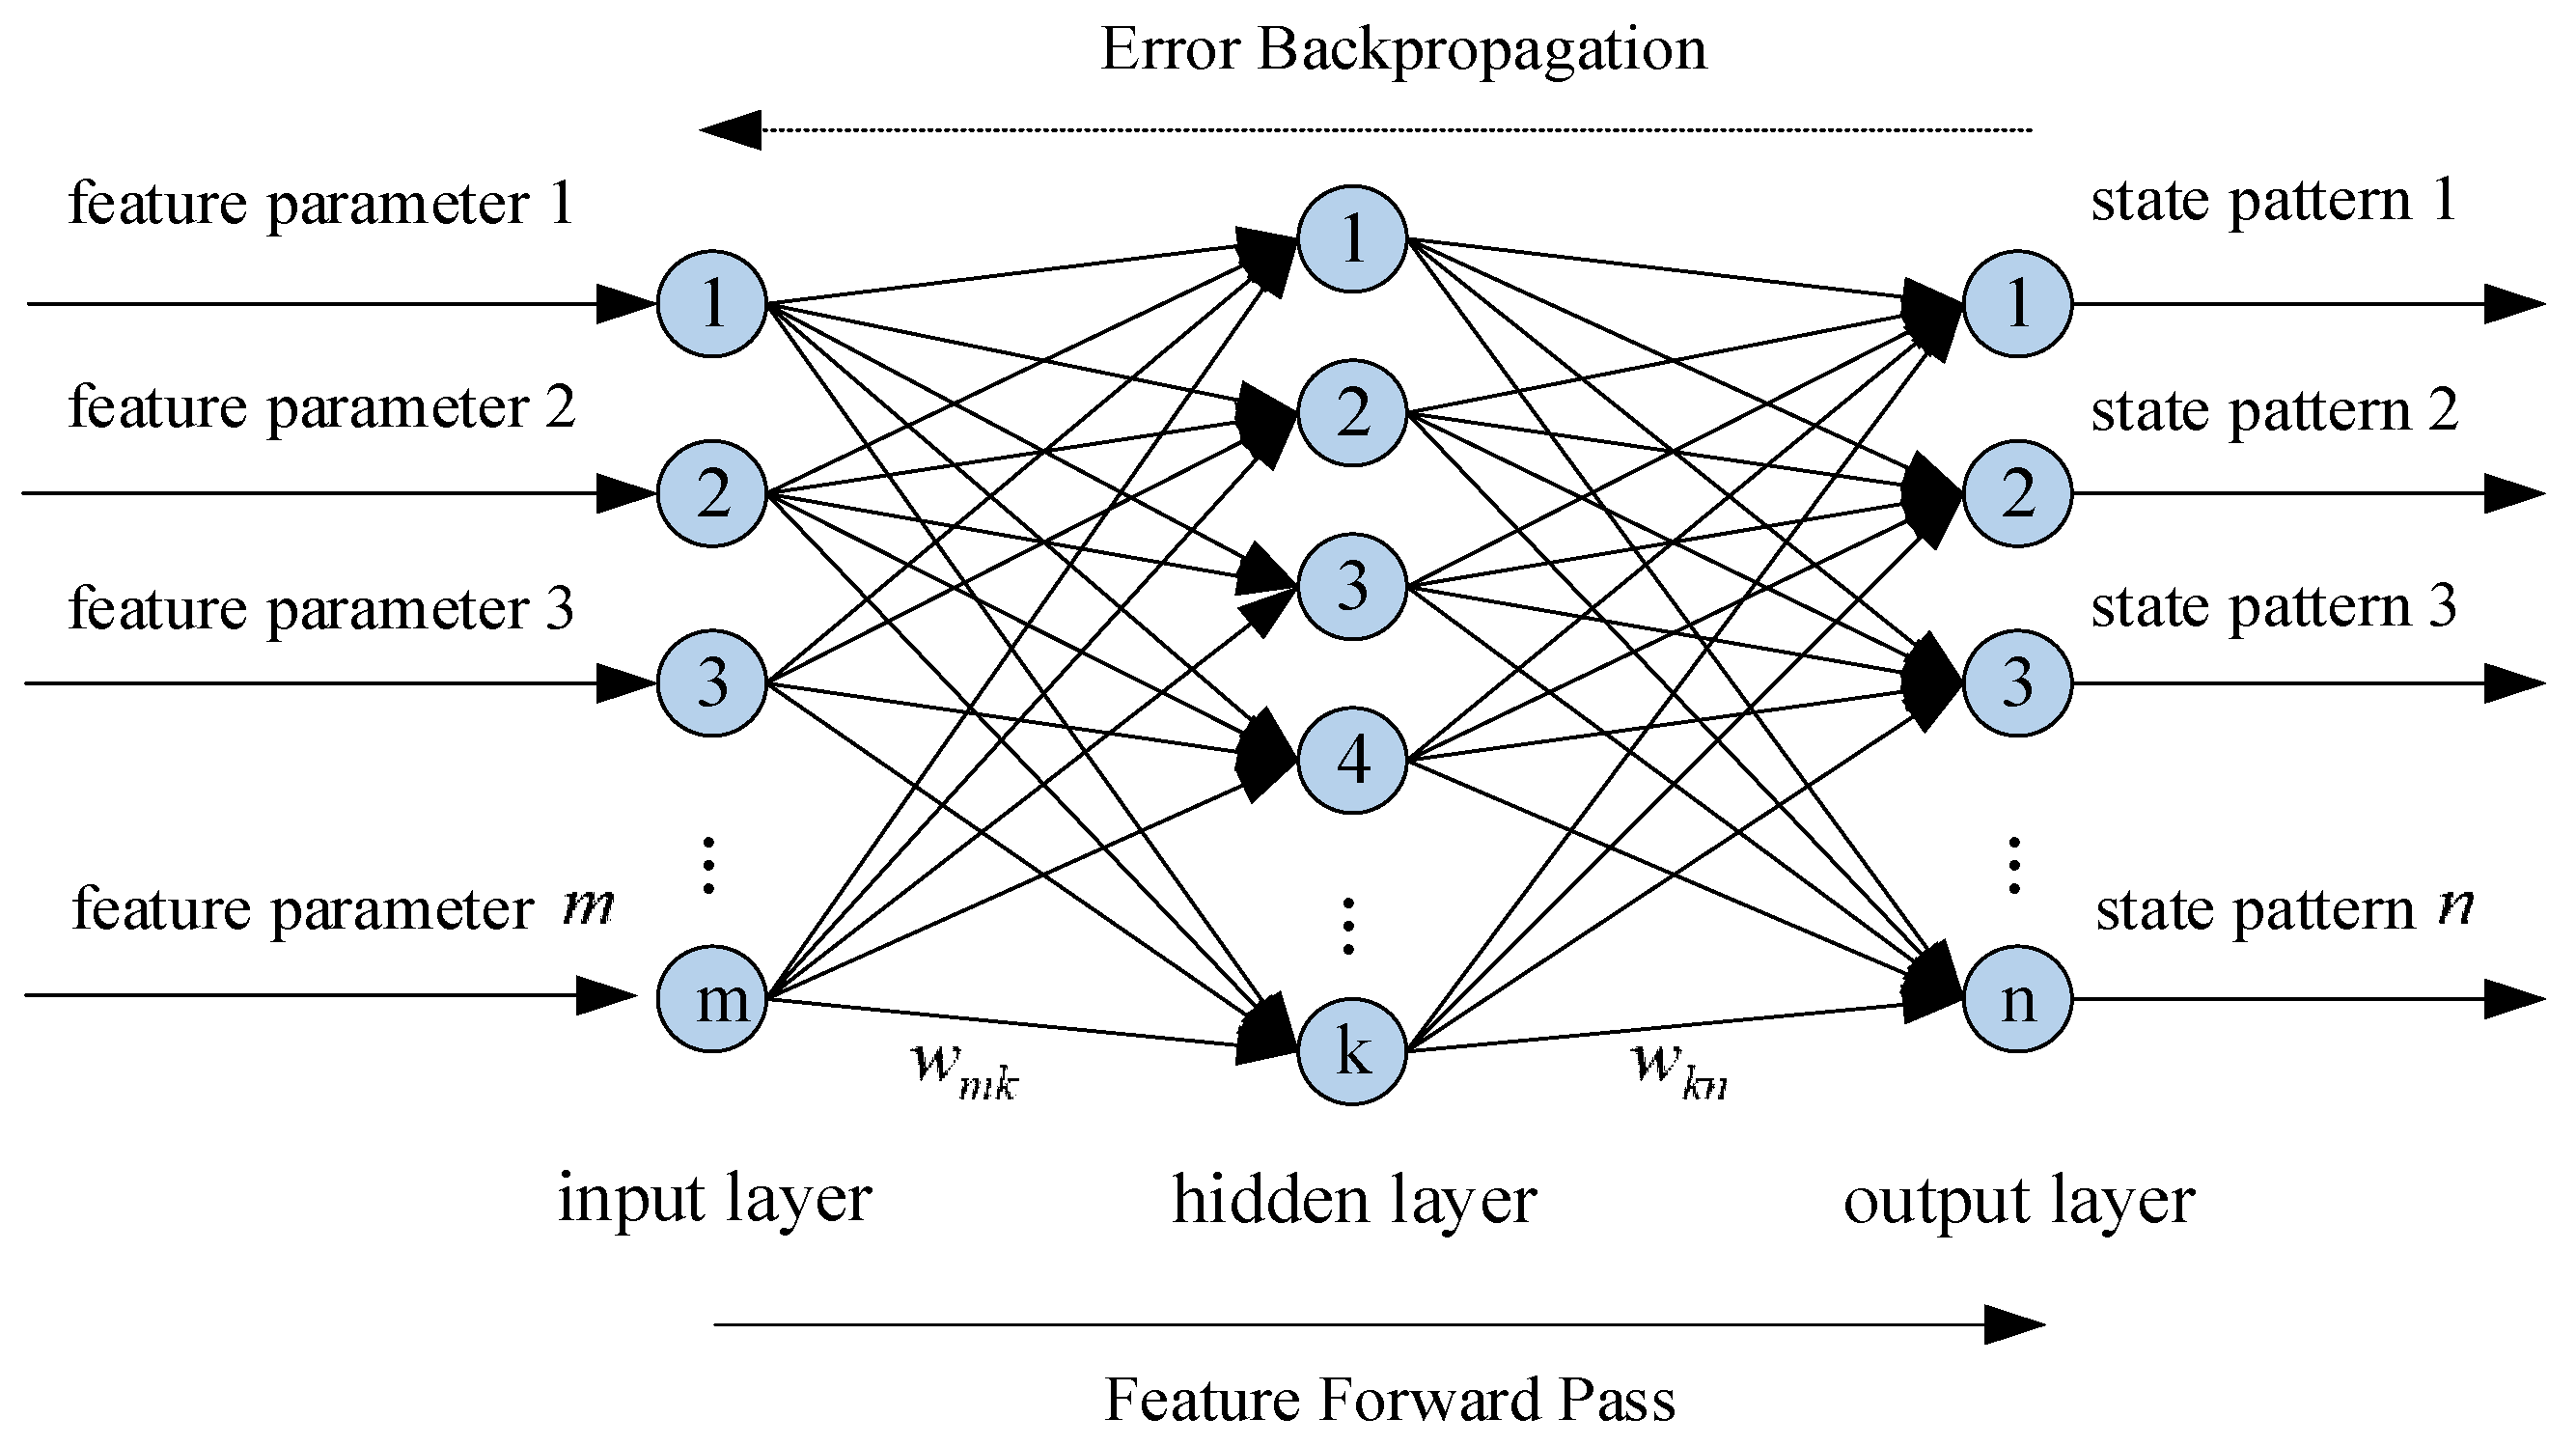
The BP network consists of three layers of neurons: the input layer, the hidden layer, and the output layer, with neurons in each layer connected through weights. The basic principle is to forward pass the input feature parameter samples to compute the output results. Then, based on the difference between the output and the actual results, the error is backpropagated and gradually transmitted back to each neuron. Finally, the connection weights between neurons are adjusted to improve the accuracy of the diagnostic results. The specific principle is illustrated in Figure 1.
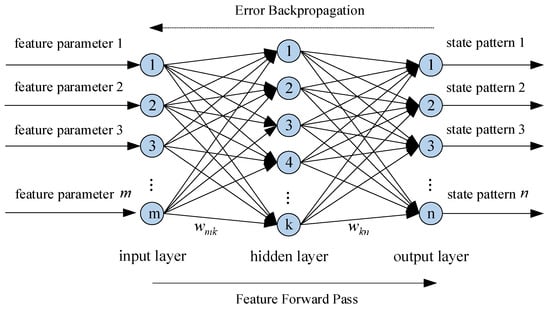
Figure 1.
Principle of BP neural network (three-layer structure, feature forward pass, error backpropagation).
2.2. Random Forest (RF) Algorithm
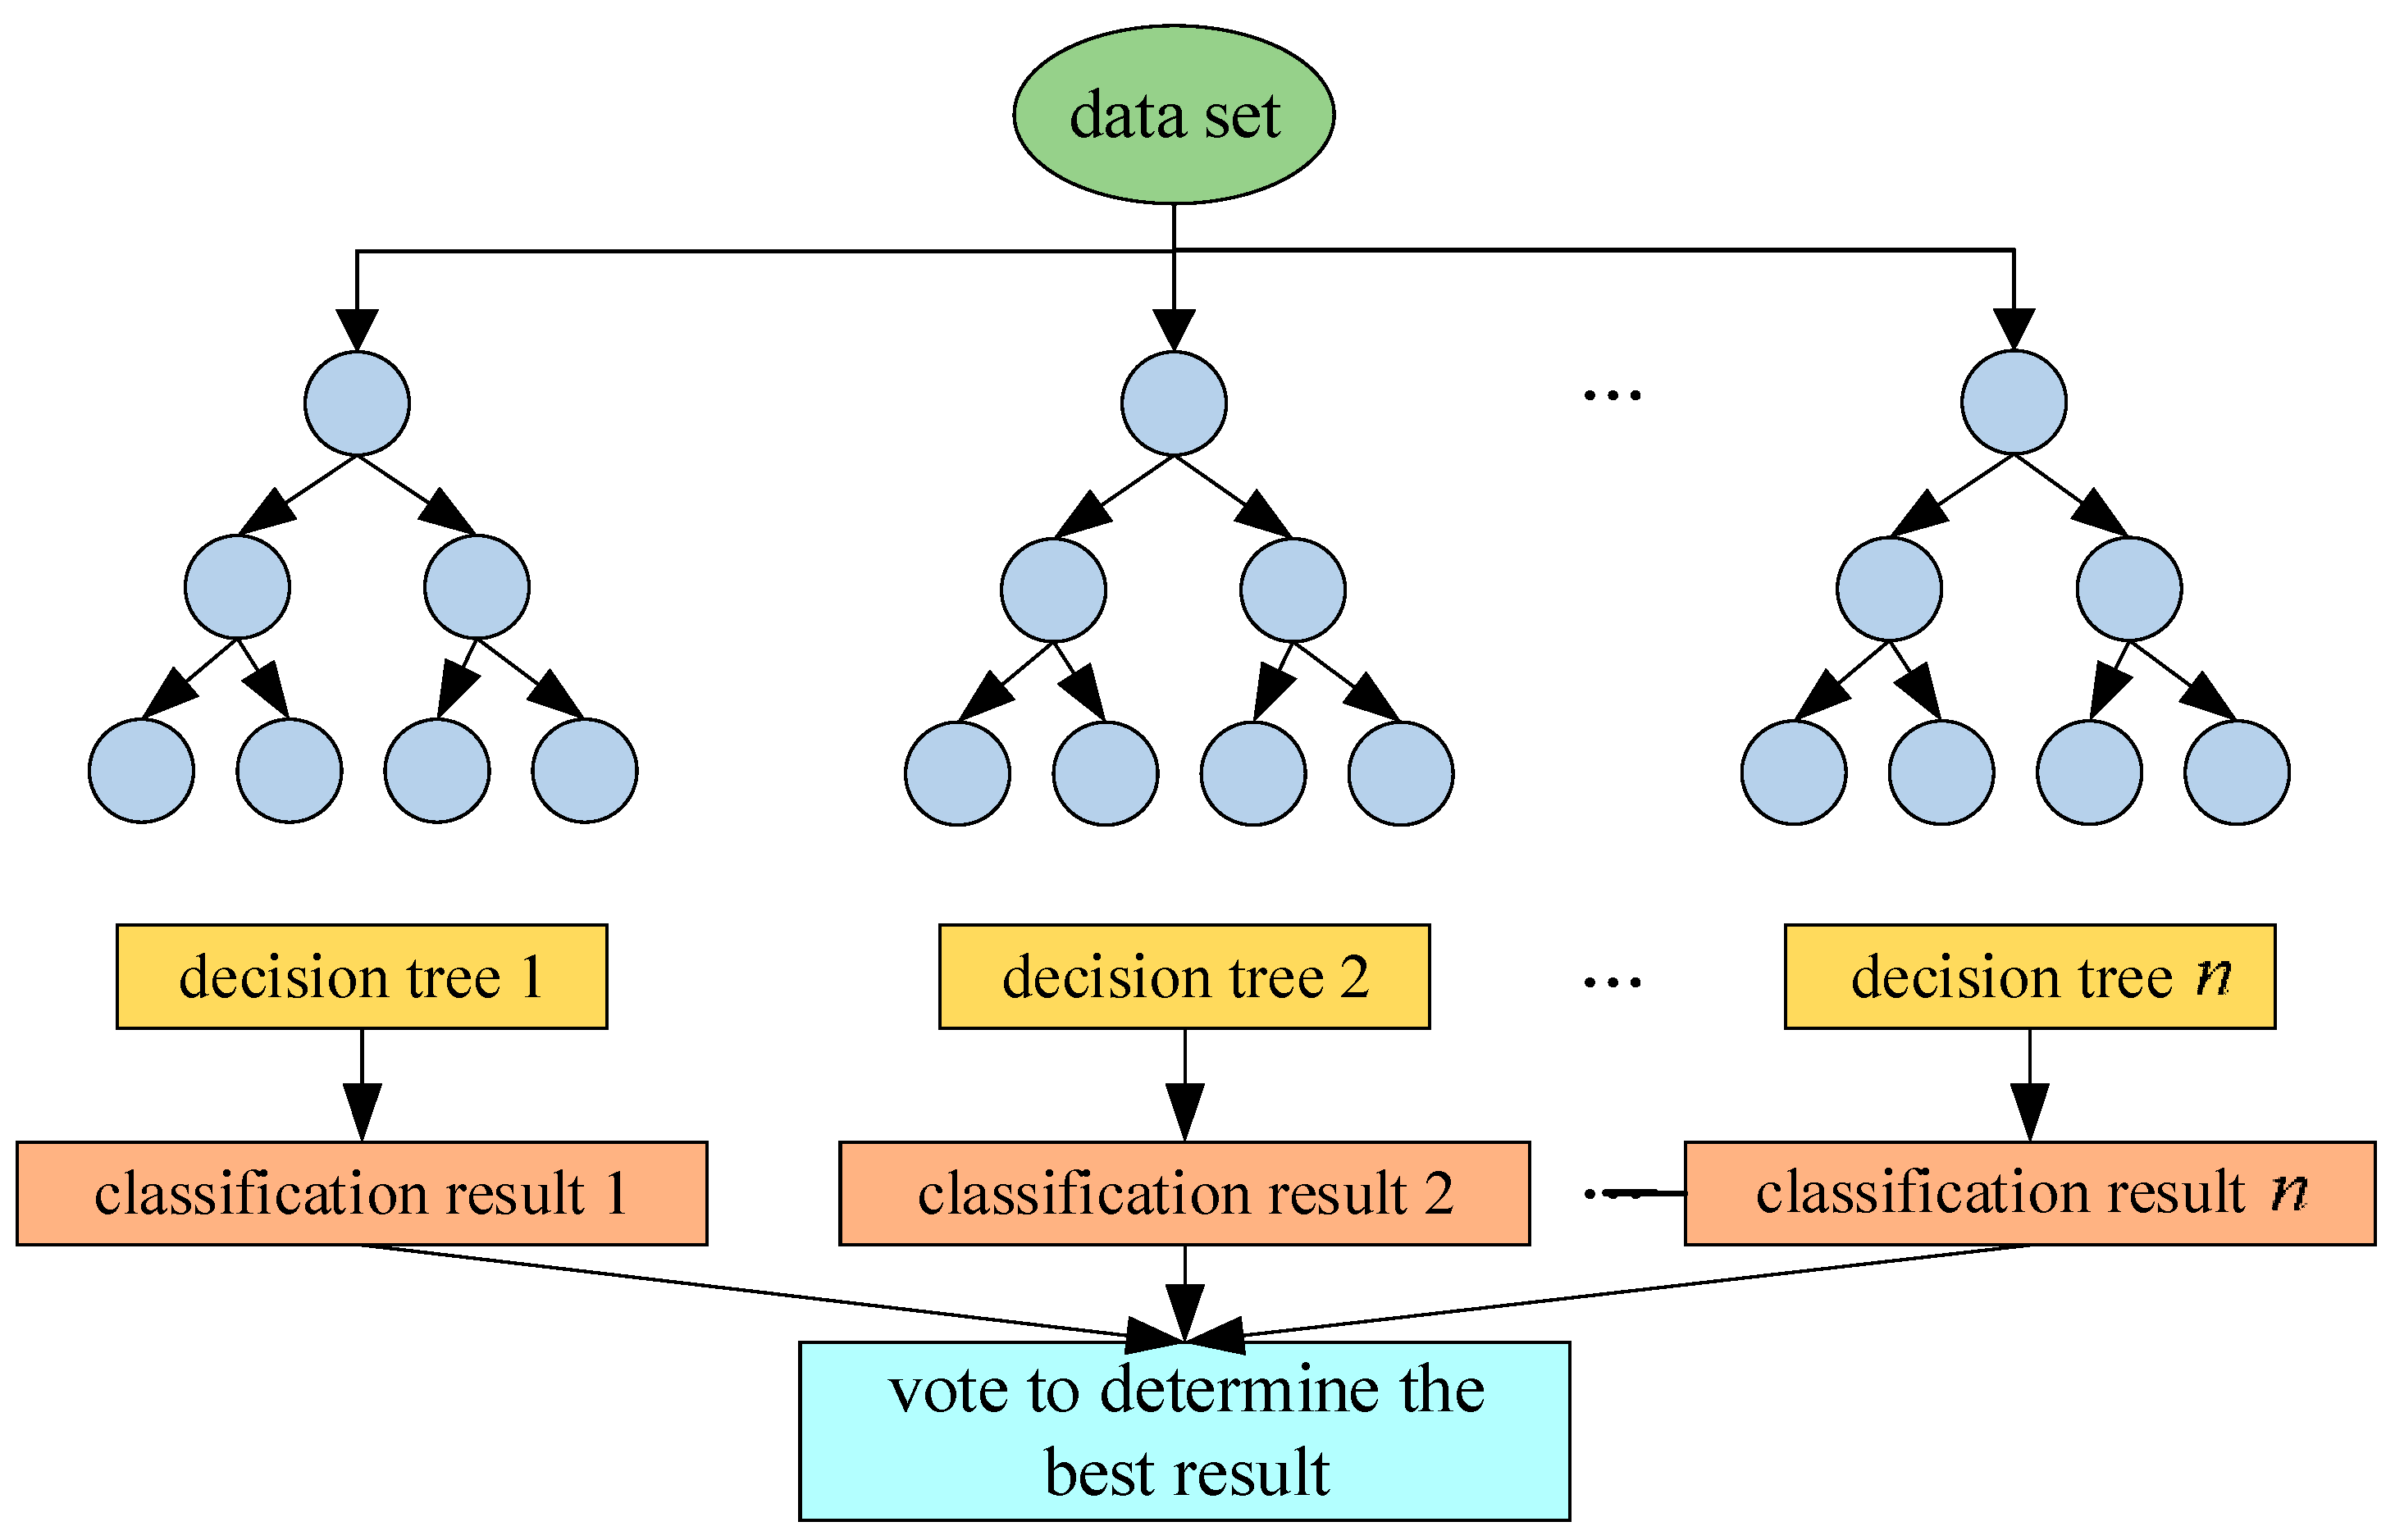
The RF algorithm is based on the idea of ensemble learning, where multiple decision trees are combined to solve classification and regression problems [24,25,26]. With the help of the Bagging algorithm, RF effectively reduces the risk of overfitting, while also offering advantages such as high classification accuracy and strong interpretability. This enables it to compensate for the instability of output results in neural network algorithms, providing more precise and stable diagnostic results for diagnostic models. During training, RF constructs multiple decision trees by randomly sampling both samples and features, and determines the classification result through a voting mechanism. Its principle is illustrated in Figure 2.
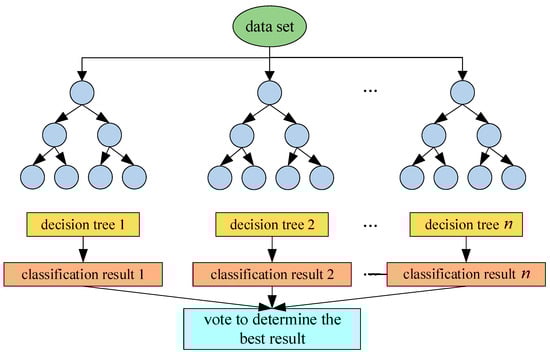
Figure 2.
Principle of random forest.
2.3. BP-RF Diagnostic Model
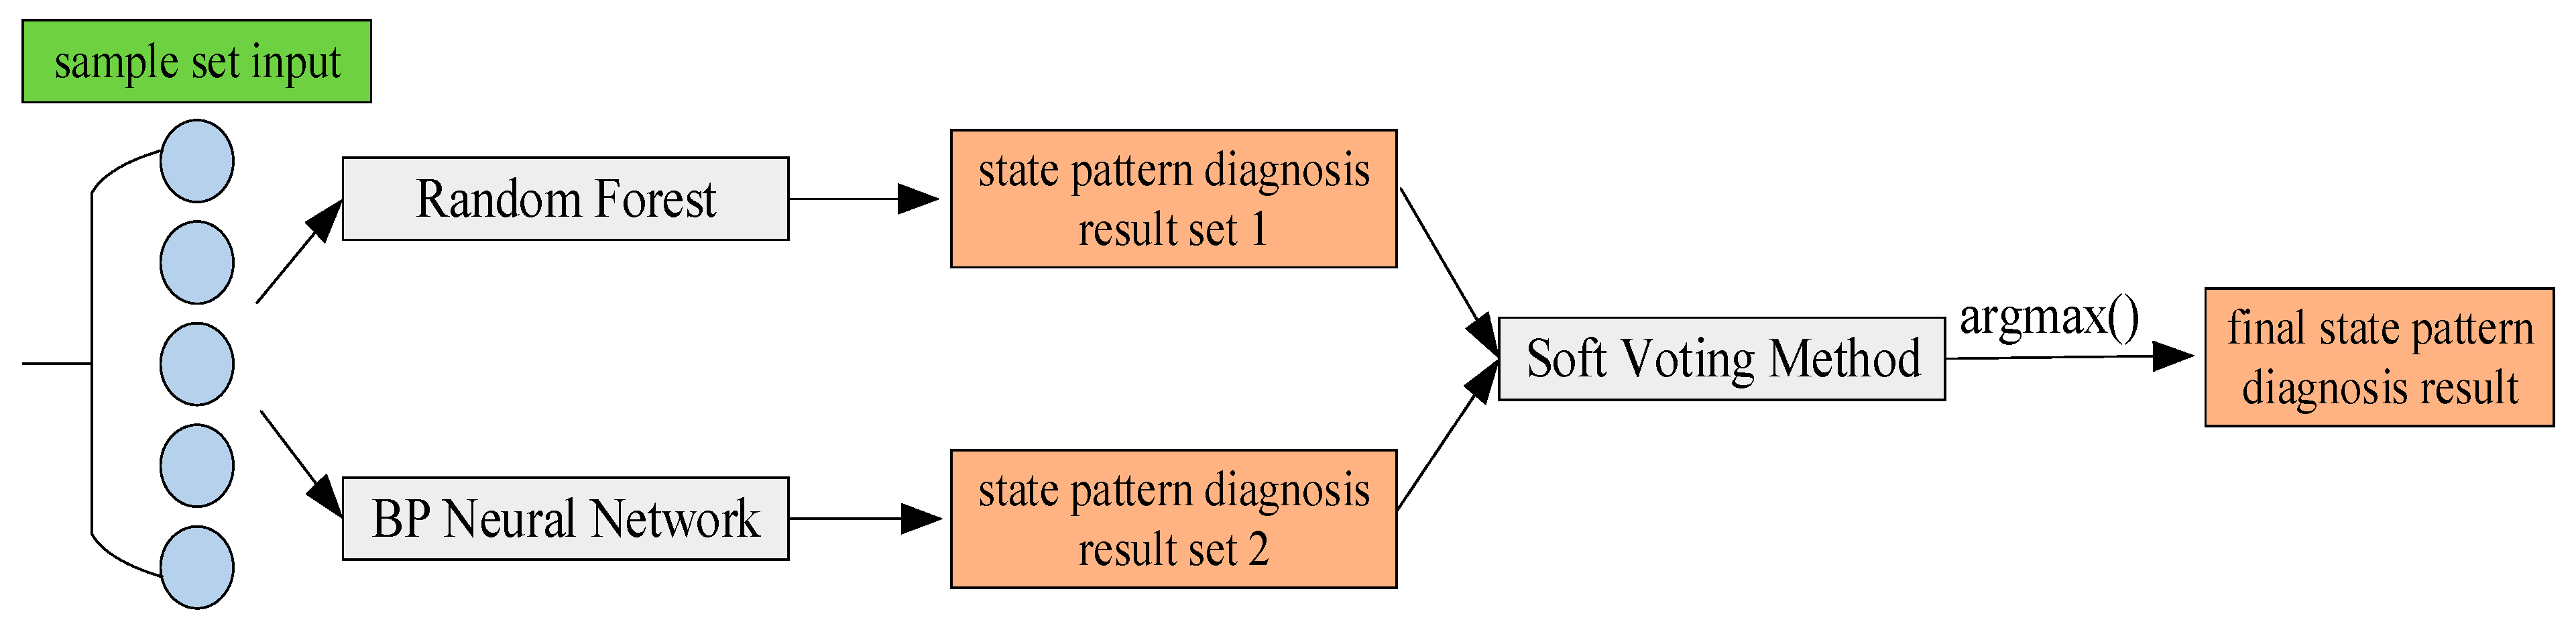
Due to the complementary advantages of BP neural networks and RF algorithms, and the absence of a direct causal relationship between their error patterns [27], this paper adopts a separate training and subsequent integration approach to construct the BP-RF diagnostic model. This aims to compensate for the shortcomings of a single model in equipment fault diagnosis. Specifically, the BP neural network and RF algorithm are used to train the feature parameters and state pattern combination samples, respectively. Then, the output results of the two models are fused using the soft voting method (weighted averaging), and the index of the maximum weighted diagnostic probability is selected as the final state pattern diagnostic result using the Argmax activation function. The specific principle is shown in Figure 3. This model fully leverages the strengths of both algorithms, ensuring that the diagnostic results not only reflect the nonlinear relationships between feature parameters but also exhibit strong stability.

Figure 3.
Diagnostic principle of the BP-RF model.
3. Determination of State Pattern Probability Weights
After defining the state pattern probability as the health state assessment indicator, it is necessary to assign reasonable weights to each indicator to effectively evaluate the health state of the ship’s equipment. To enhance the credibility of the weight determination, this paper adopts a combined subjective and objective weighting method to obtain the composite weights .
3.1. Subjective Weights Based on the G1 Method
The determination of subjective weights uses the G1 method, also known as the sequence relationship analysis method. This method first performs a qualitative ranking of the evaluation indicators, and then sequentially compares and judges the adjacent indicators, making it a subjective weighting approach. Compared to the analytic hierarchy process (AHP), the advantage of the G1 method lies in its simplicity, intuitive nature, and ease of operation, as it does not require consistency checks [28]. The specific steps are as follows:
Step 1: Determine the sequence relationship.
If the health state evaluation indicators and of the ship equipment have the following relationship with respect to the relevant evaluation criteria (or objectives): , it indicates that the importance of is greater than that of .
Select the most important indicator from the set of evaluation indicators , which consists of indicators, and label it as . Then, select the most important indicator from the remaining indicators and label it as . Continue this process until the final evaluation indicator, labeled as , is selected. This determines the sequence relationship of the evaluation indicators, denoted as:
Step 2: Determine the relative importance of adjacent evaluation indicators.
Assume that the expert makes a rational judgment of the importance ratio between evaluation indicators and as [29]:
In the formula, and are the weight coefficients of evaluation indicators and , respectively.
Step 3: Solve for the weight coefficients.
The integral is calculated based on the definition of , that is:
The summation of is calculated from 2 to :
Because of , it follows that:
By transforming Equation (5), the weight of the n-th evaluation indicator can be calculated as:
Based on the value of the weight , the weights of the indicators from the (n − 1)-th to the first can be calculated sequentially as:
Additionally, to avoid subjective weights being overly influenced by a single source or biased, multiple experts in the field are invited to apply the G1 method for subjective weighting individually, and the average of their results is taken as the final subjective weight for the state pattern probability, with the subjective weight of the probability of the i-th state pattern denoted as .
3.2. Objective Weights Based on the Grey Relational Analysis Method
To make the evaluation results more aligned with the actual situation, this paper uses grey relational analysis to calculate the correlation degree between the state pattern probabilities and the health state level vectors, and uses this as the objective weight for the state pattern probabilities. Grey relational analysis is a multi-factor statistical analysis method, which is suitable when the number of reference sequence samples and comparison sequence samples differs or when there is no obvious regularity between the samples, and its computational complexity is relatively small [30]. By introducing grey relational analysis to determine the objective weights, it can more accurately reflect the weight information inherent in the grey system of ship equipment, compared to commonly used methods such as entropy weighting and standard deviation methods.
The formula for calculating the correlation is as follows [9]:
In the formula, represents the correlation coefficient between , and in the j-th health state, represents the degree of association between and , is the level vector of the j-th health state, is the membership degree vector belonging to the j-th health state under the influence of the i-th state pattern, and is the resolution coefficient, which is taken as 0.5 in this paper.
The average correlation degree of association between the state pattern membership degree vector and the health state level vectors is calculated and normalized as the objective weight of the state pattern, that is:
In the formula, represents the objective weight of the i-th state pattern, and represents the number of state patterns.
3.3. Combination of Weighting
After the ship equipment is commissioned and finalized, the types of characteristic parameters change infrequently, and the combinations of state patterns related to these parameters generally remain stable. Therefore, once the subjective weights of the state patterns are determined based on the G1 method, they typically do not change. However, as the equipment usage time increases and is influenced by external environmental factors, the characteristic parameters of the equipment may fluctuate. Thus, the grey relational analysis method is adopted to update the objective weights of the state patterns, using monitoring data of the characteristic parameters.
To reasonably integrate subjective and objective weights, it is necessary to avoid further introduction of subjective information while ensuring that the combined weight fully reflects both subjective and objective weights without bias toward any one of them. Therefore, the principle of minimum discriminant information can be used to obtain the combined weight , with the objective function and constraints given as follows:
To solve for the objective function, the combined weight is obtained as follows:
This combined approach embodies a symmetry concept, effectively integrating subjective expert experience with objective data to create a balanced system. In the weight determination process, both subjective and objective factors play a balanced role, thereby effectively overcoming the issue where a single weight cannot fully reflect the relative importance of the evaluation indicators.
4. Ship Equipment Health State Assessment
4.1. Health State Grading
In existing research, there are typically two approaches for classifying the health state of equipment. One is the traditional “binary system”, where the equipment state is categorized as either “normal” or “faulty”. However, with the continuous development of equipment technology and maintenance theory, using a binary function of “normal” or “faulty” to describe the technical state of equipment has gradually become insufficient to meet practical needs. The other approach, which has gained increasing attention in recent years, is the “multistate system”, where the health state of equipment transitions from “normal” to “faulty” as a gradual process rather than a sudden change. However, a unified theoretical framework for classifying the health state of equipment has not yet been established, and different studies differ in the number of classifications and the naming of categories [31]. For ship equipment, performance degradation is a common phenomenon, so the “polymorphic system” offers a more accurate representation of the health state of ship equipment [32]. This paper, from the perspective of operational use and support decision-making, divides the health state of ship equipment into five levels: healthy, sub-healthy, available, faulty, and failed.
- (1)
- Healthy: All parameters are far from the threshold or close to the standard value, ensuring the achievement of all specified functions. The probability of being in a fault combination state pattern is close to 0, allowing for an extended maintenance cycle;
- (2)
- Sub-healthy: Some parameters fluctuate within a certain range above and below the standard value but have not reached the threshold. The equipment can still perform all specified functions well, and the probability of being in a fault combination state pattern is low, allowing for an extended maintenance cycle;
- (3)
- Available: Some parameters deviate significantly from the standard value but have not yet reached the threshold. The equipment can only complete certain primary functions, and the probability of being in a fault combination state pattern is moderate, allowing for a slightly shortened maintenance cycle;
- (4)
- Faulty: Some parameters exceed the threshold, resulting in a significant loss of function. The probability of being in a fault combination state pattern is high, and some faults may have already occurred. The maintenance cycle must be shortened, and condition-based repairs must be performed;
- (5)
- Failed: Multiple parameters severely deviate from the standard value and exceed the threshold, leading to a complete loss of function. The probability of being in a fault combination state pattern is extremely high, with multiple simultaneous faults occurring. Immediate repairs are required.
This symmetric grading approach helps clearly depict the change process of equipment health state, resembling a symmetry axis between health and failure, with the transitional states in the middle showing a symmetric distribution. In this way, the evaluation results can achieve clear differentiation between different states, facilitating operational use and supporting decision-making. At the same time, this method provides a reasonable framework for subsequent health state assessment based on state patterns, ensuring that the evaluation results accurately reflect the characteristics of the equipment at different health levels.
4.2. Establishment of Health State Membership Function
Based on the probability distribution characteristics of the equipment state patterns and expert experience, within a certain confidence interval, the higher the probability value of the fault combination state pattern, the more the health state level tends toward “failed”. Conversely, when the probability value of the fault combination state pattern is very low, it is impossible to evaluate it as a “failed” state, meaning the membership degree of the “failed” state is 0. The opposite trend applies to the normal state pattern. Therefore, based on the probability values of the equipment state patterns, a health state evaluation standard has been established, as shown in Table 1.

Table 1.
Evaluation criteria for health state based on equipment state pattern probabilities.
In the table, sub-healthy, available, and faulty states are intermediate types; for the normal state pattern, the healthy state is relatively large, and the failed state is relatively small, while for the fault combination state pattern, the healthy state is relatively small, and the failed state is relatively large.
Thus, a trapezoidal distribution membership function can be used as the membership function for the five health state levels of the equipment. The mathematical expressions for the membership functions of the normal and fault combination state patterns’ probabilities corresponding to the equipment health state are as follows:
In practical applications, input data often contain noise, incompleteness, or imbalance, which makes it difficult for the BP-RF model to achieve 100% classification accuracy, and the diagnostic results may exhibit some degree of randomness. Therefore, to enhance the applicability and robustness of the method, this paper introduces an “unknown” state pattern after adjusting the probabilities of the normal state and fault-combined state patterns. This not only better accounts for the randomness in the model’s output but also allows for preliminary judgment of the equipment’s health state through prior knowledge, helping to explain the mechanism by which feature parameters influence the final evaluation results. Based on the correspondence between feature parameters and health state levels defined in the health state level definitions, the membership degree of the “unknown” state pattern to each health state level is shown in Table 2. For example, when the equipment is preliminarily judged to be in a “healthy” state based on feature parameters, the membership degrees of the “unknown” state pattern to the health state levels are as follows: healthy (0.30), sub-healthy (0.25), available (0.20), faulty (0.15), and failed (0.10).
Table 2.
The membership degree of the health state level in the “unknown” state pattern.
4.3. Process of Health State Assessment
Based on the above analysis, the ship equipment health state evaluation process is as follows: First, after acquiring the feature parameters and state pattern data, the BP-RF diagnostic model is used to output the diagnostic probabilities for each state pattern. Next, the probabilities of the normal state pattern and the maximum fault combination state pattern are substituted into the membership function of the trapezoidal distribution. At the same time, the health state level is qualitatively judged based on the feature parameters to determine the membership degree of the “unknown” state pattern, thus obtaining the membership degree of each state pattern probability. Then, a combined weighting method, which integrates gray relational analysis and the G1 method, is used to assign weights to each state pattern probability, and the health state evaluation vector of the equipment is calculated. Finally, the health state level is determined based on the maximum membership principle, and this is taken as the final evaluation result of the equipment’s health state. The evaluation process is shown in Figure 4.
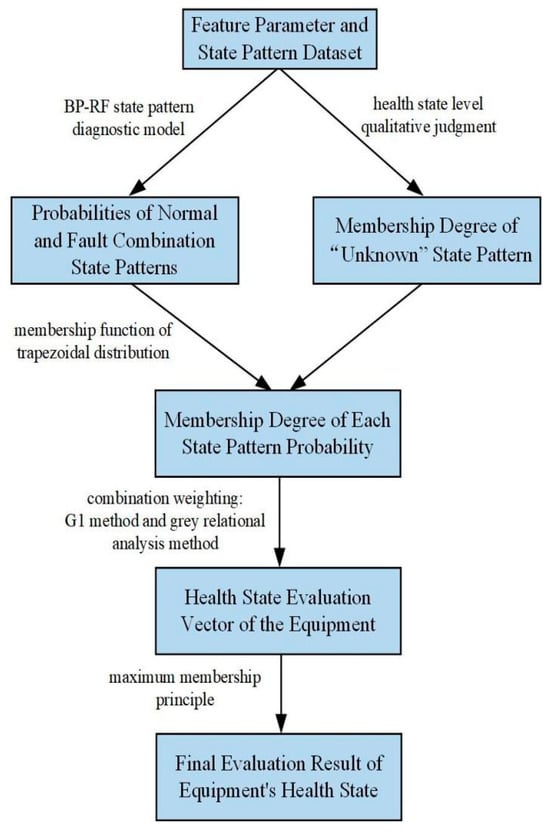
Figure 4.
Health state evaluation process of ship equipment.
5. Case Analysis
The health state assessment method proposed in this paper is based on feature parameters and does not rely on the physical models or fault mechanisms of specific equipment. This method solely depends on the historical state patterns of the equipment and the corresponding feature parameter data for training and testing. Its core framework demonstrates good adaptability, making it suitable for equipment of varying types and complexity levels. Unlike traditional power devices such as steam engines and diesel engines, gas turbines offer advantages such as fast startup and shutdown, strong load regulation capability, high thermal efficiency, excellent power-to-weight ratio, and good environmental performance. Gas turbines are gradually becoming the core of the naval ship propulsion system and have been widely applied in large surface vessels such as destroyers, providing strong power support for ship navigation [33]. To verify the effectiveness of the proposed method, this paper conducts an empirical study using the gas turbine in a specific type of ship’s power system as an example.
5.1. Data Analysis and Preparation
Through the analysis of historical fault data for this type of gas turbine, it was found that the main fault patterns for this turbine include compressor surge, nozzle blockage, turbine blade damage, burner flameout, and bypass valve tripping. These fault patterns can occur individually or in various combinations. Therefore, this study ultimately selected five typical fault combination patterns (including single fault patterns) as research subjects. At the same time, to facilitate the subsequent calculation of equipment fault rates, the normal state is also considered as a typical state pattern of the equipment. The six state patterns are represented by the numbers 0 to 5, where 0 corresponds to the normal state pattern, and 1 to 5 correspond to the five fault combination patterns. In addition, based on historical fault experience and operational data collected from the actual monitoring information system, the following health state characteristic parameters were selected for this type of gas turbine: turbine speed, exhaust pressure, compressor outlet temperature, and unit vibration frequency [34,35]. The six state patterns and their corresponding characteristic parameter ranges are shown in Table 3.
Table 3.
Ranges of characteristic parameters corresponding to six state patterns.
To improve the accuracy of the evaluation results, this study collected real-time characteristic parameter data from 300 monitoring sampling points of a specific type of marine gas turbine between March and July of a certain year, and performed statistical analysis on the corresponding state pattern data. These data were used as the training and testing data for the BP-RF model to assess the health state of the gas turbine.
5.2. State Pattern Diagnosis
5.2.1. Model Parameter Settings
The experimental parameters for the BP neural network are set as follows: 300 sample sets are used, with each mode corresponding to 50 sample sets. The sample set is randomly divided into a training set (240 sample sets) and a testing set (60 sample sets) at an 8:2 ratio. The input layer consists of four neurons (corresponding to four feature parameters), the hidden layer consists of 32 neurons, and the activation function used is the nonlinear ReLU function. The output layer consists of six neurons (corresponding to six state patterns), with the activation function being Softmax. The model is ultimately determined to be a 4-32-6 three-layer BP neural network structure. In addition, the learning rate of the model is set to 0.001, and the number of training iterations is set to 50.
The experimental parameters for the RF algorithm are set as follows: The third-party library sklearn.ensemble is imported in Python 3.8 to implement random forest classification. The number of decision trees is set to 100, and the maximum depth of each tree is set to 10.
5.2.2. Analysis of Model Diagnostic Results
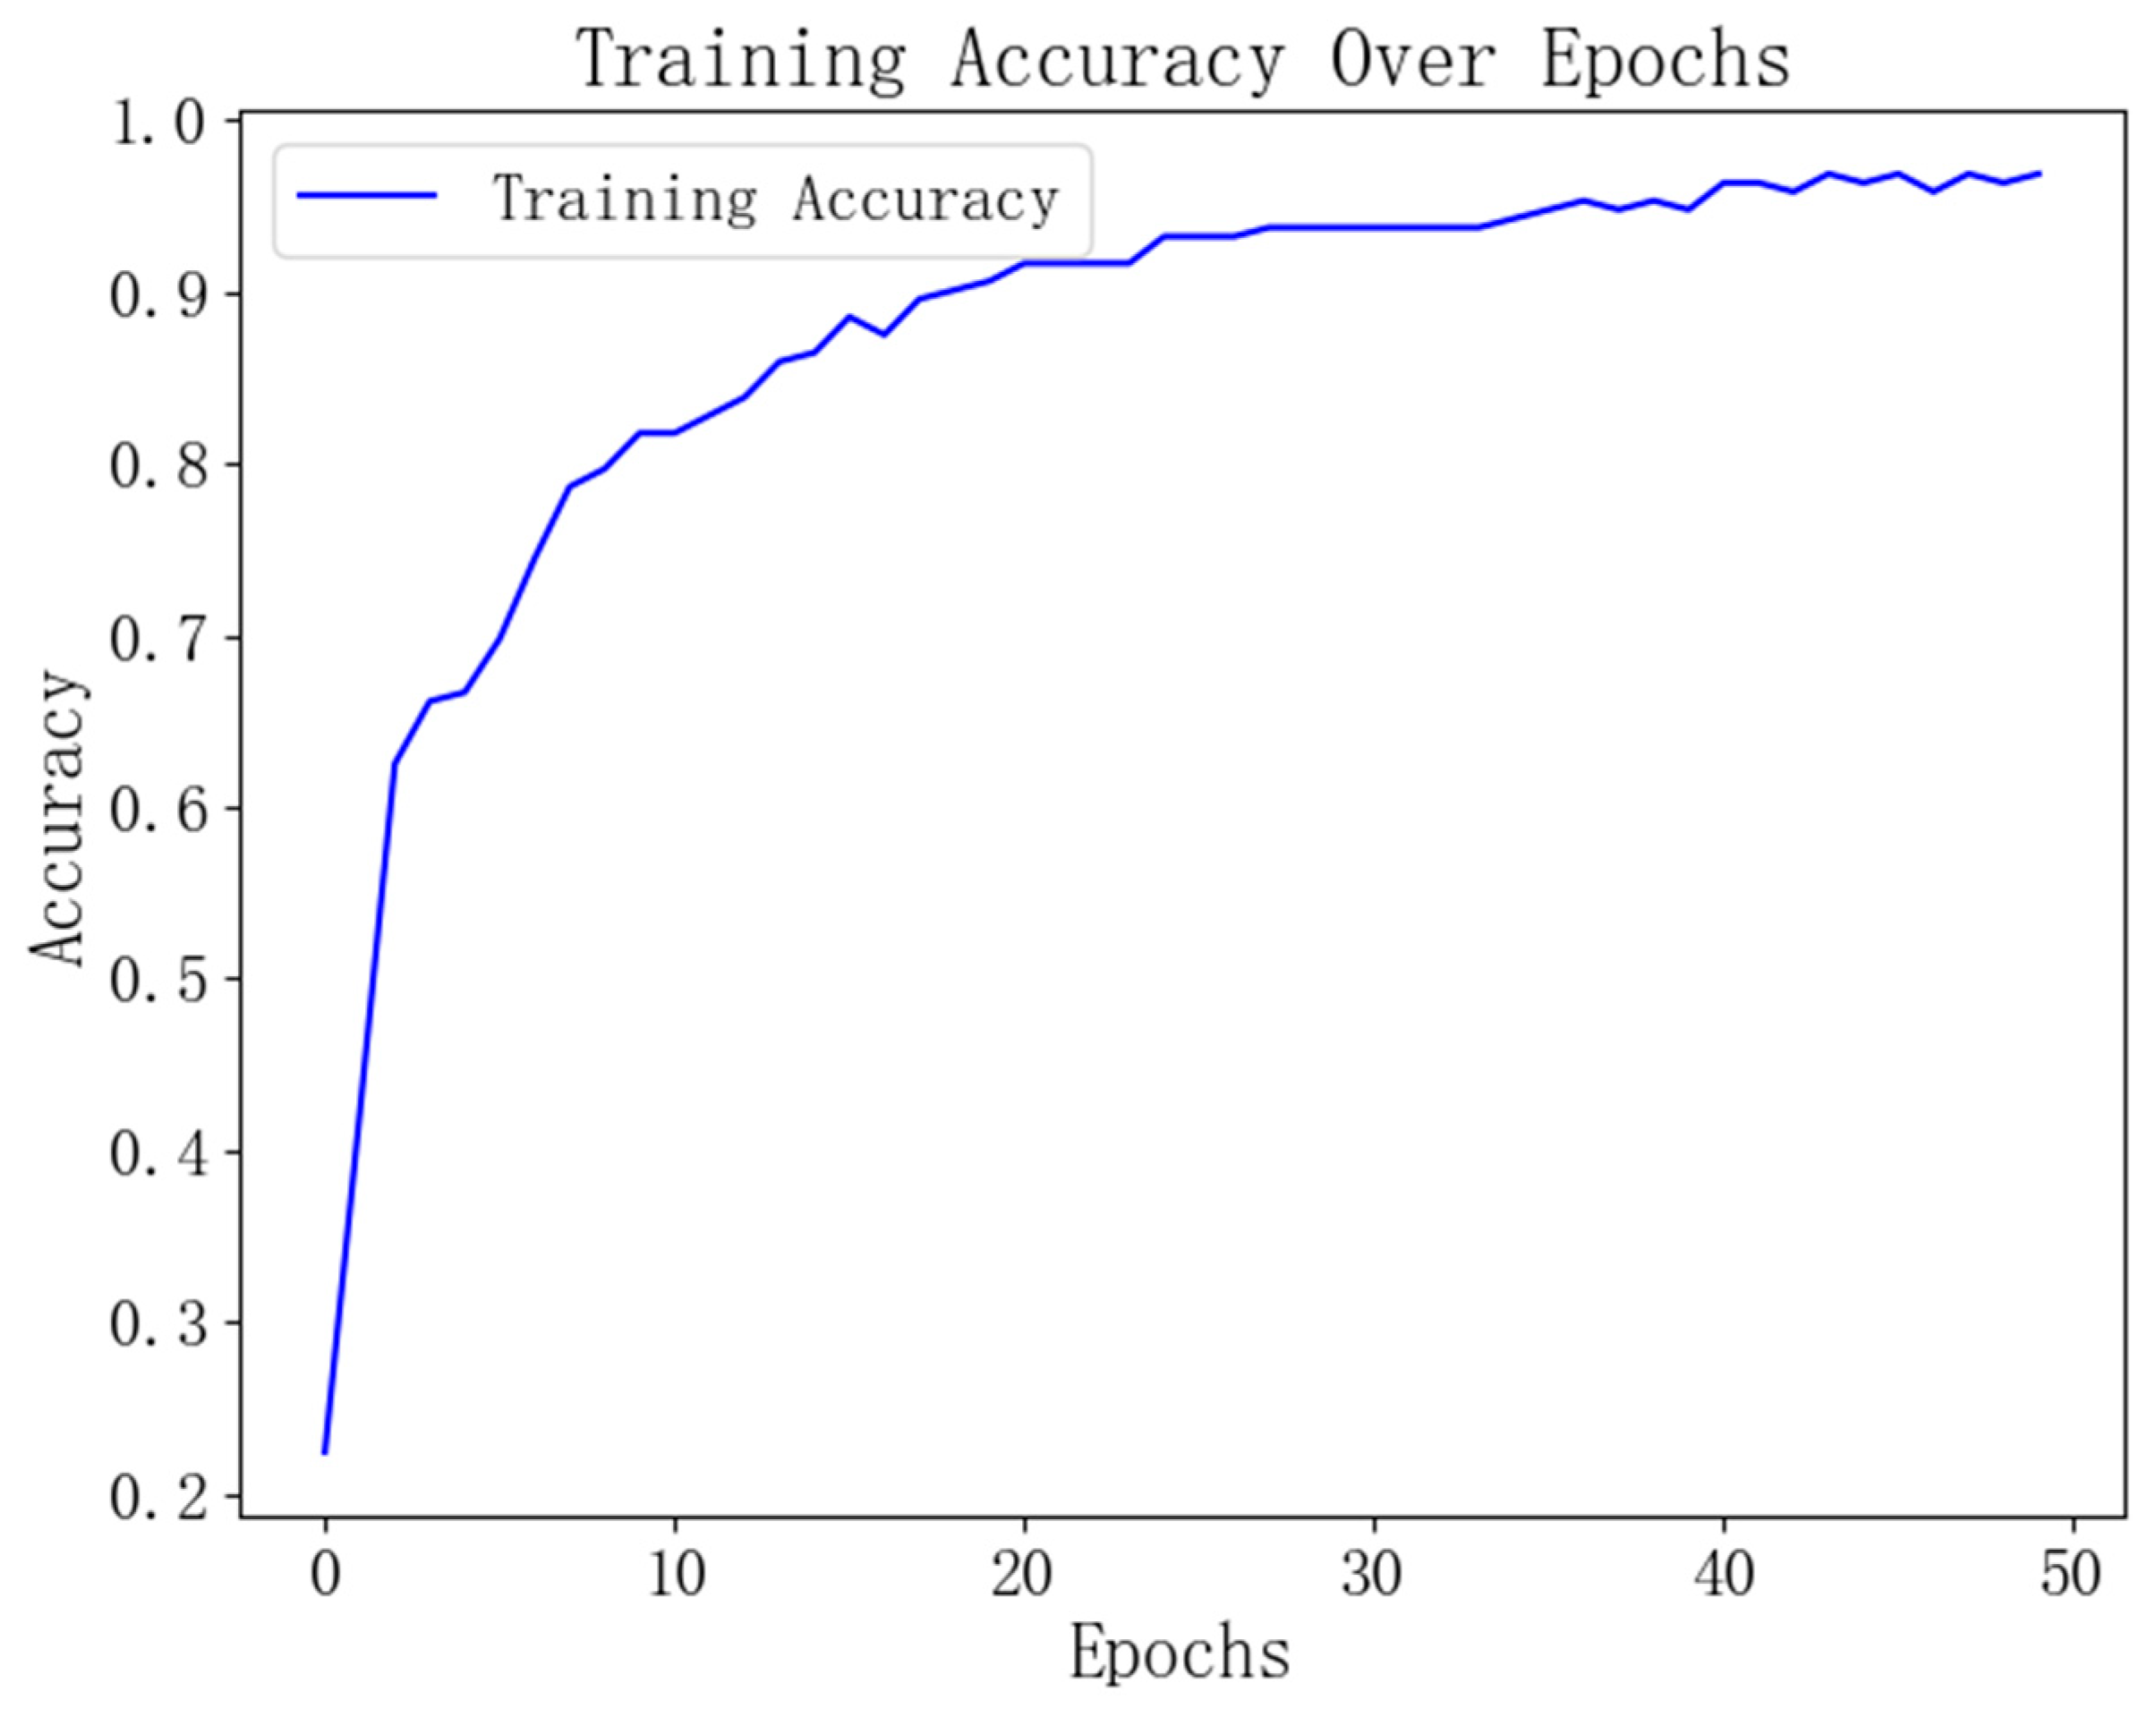
After determining the model parameters, the StandardScaler() function is first used to standardize the feature parameter data, transforming them into data with a mean of 0 and a standard deviation of 1. Next, the training set is input into the model for 50 iterations, as shown in Figure 5. The experimental results indicate that after approximately 40 training iterations, the accuracy of the training set gradually stabilizes, ultimately reaching around 98%. Furthermore, during the training process, the time() function is introduced to record the training time as 4.99 s, demonstrating that the model has high computational efficiency and low time cost.
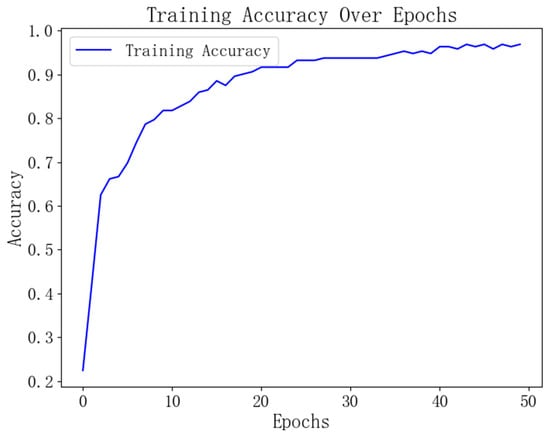
Figure 5.
Changes in training set accuracy of the BP-RF model.
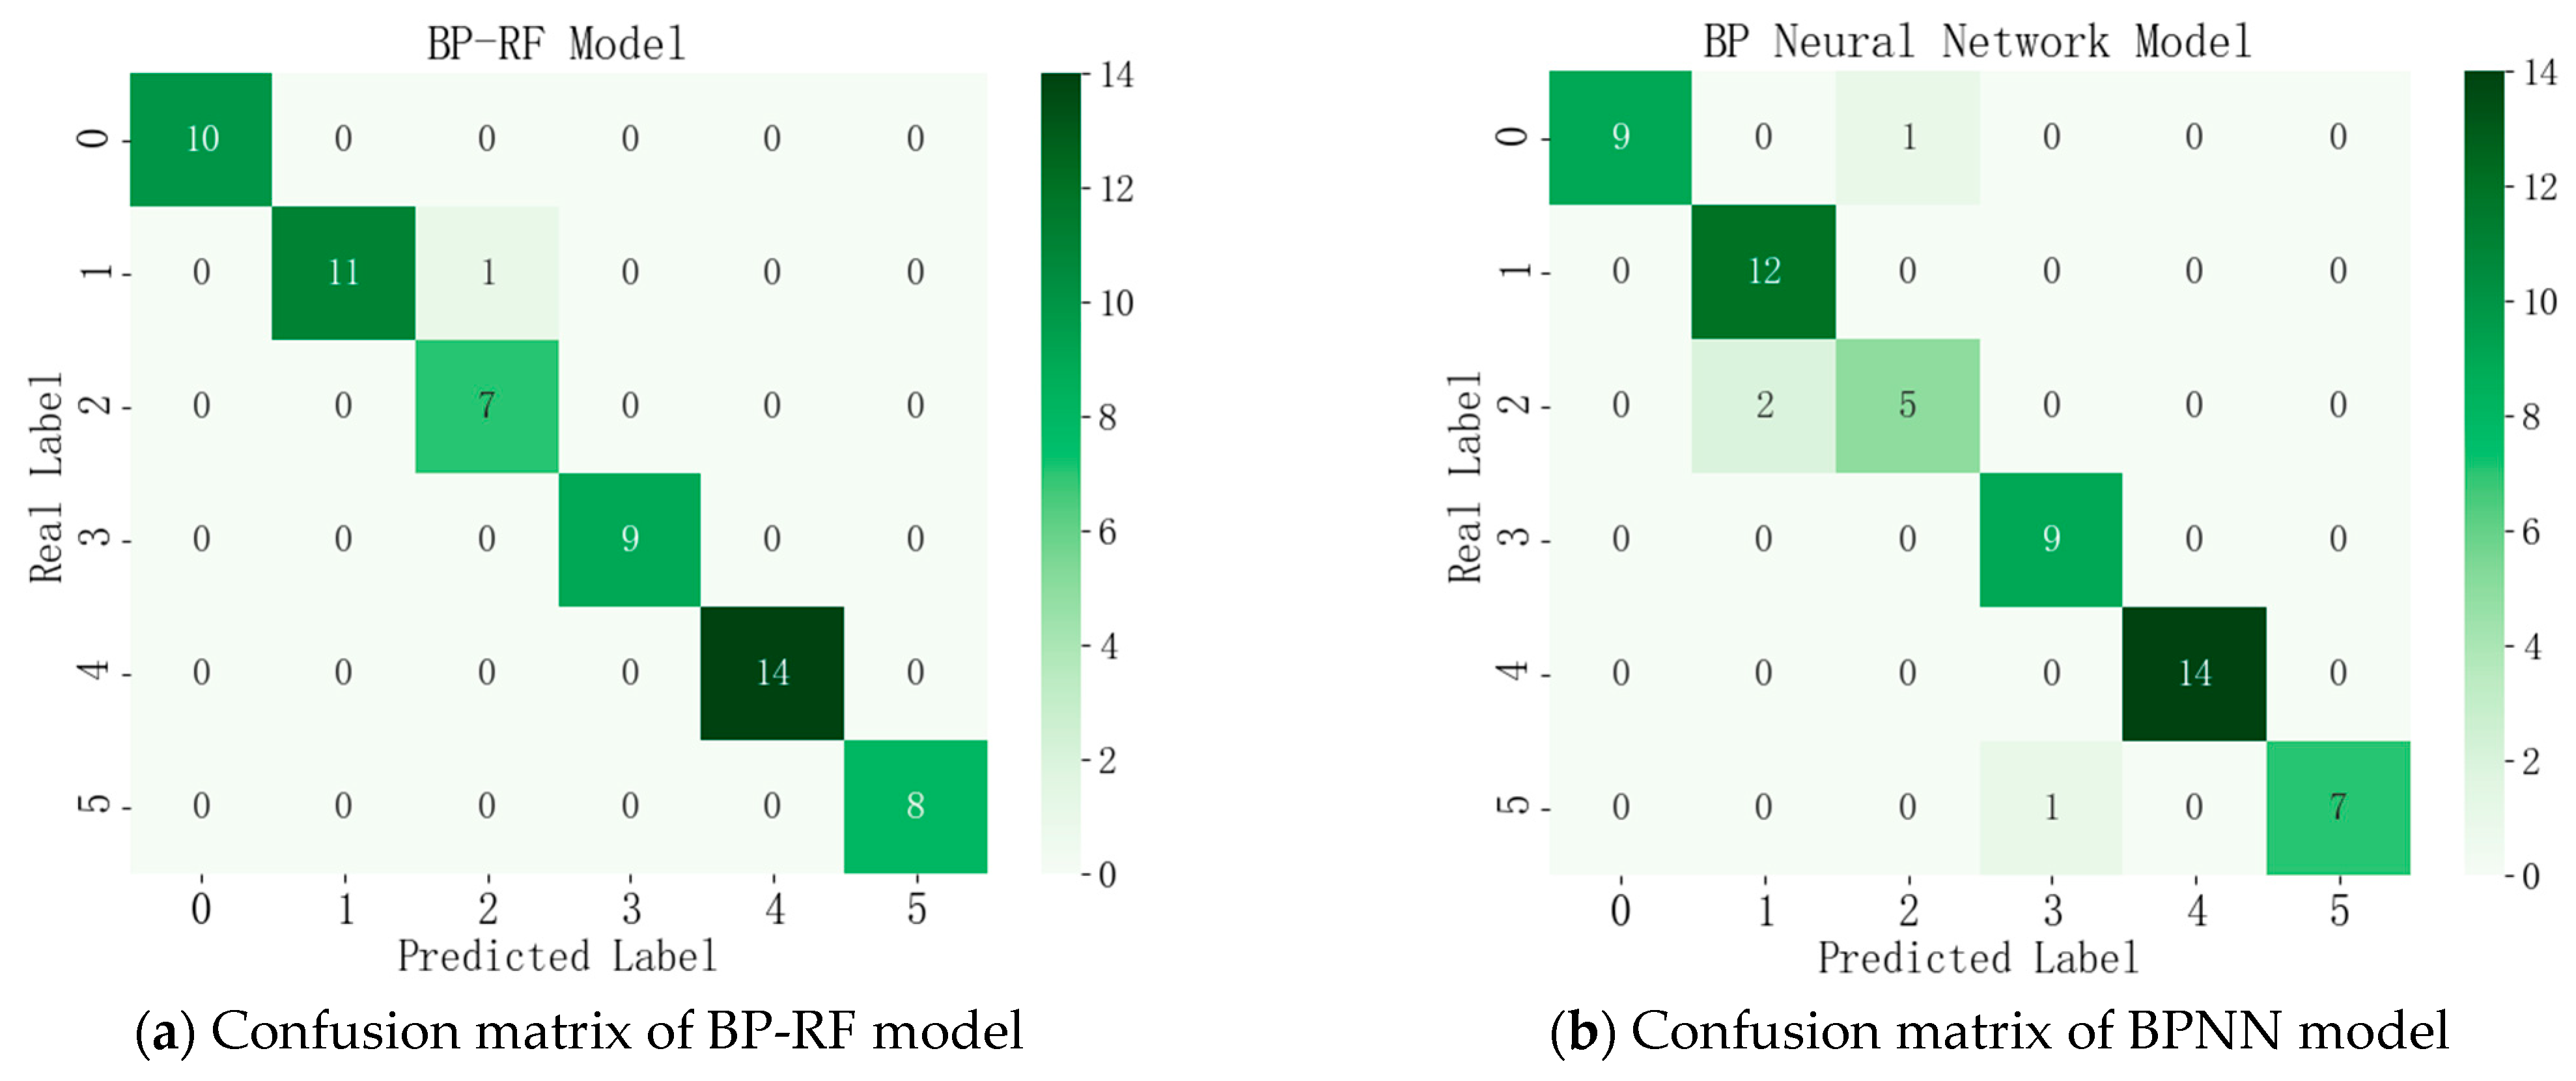
The test set is input into the diagnostic model, and through multiple repeated experiments, it is found that the model’s state pattern diagnostic results are highly stable, with the confusion matrices shown in Figure 6a.
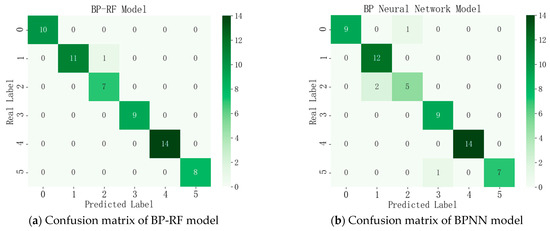
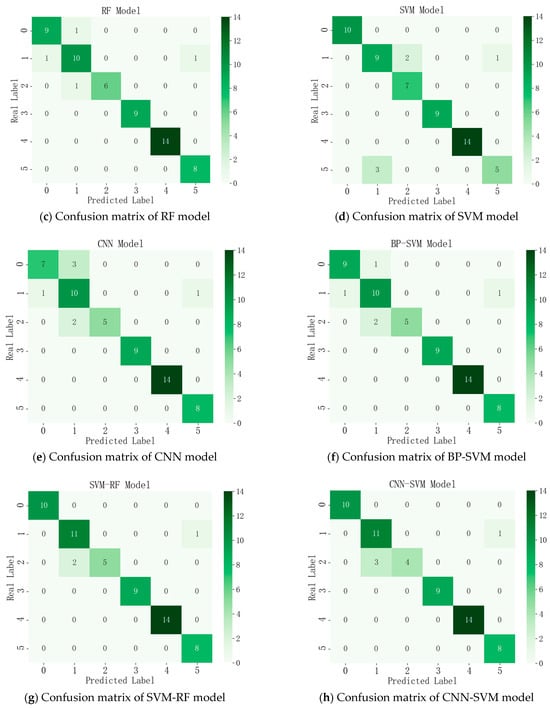
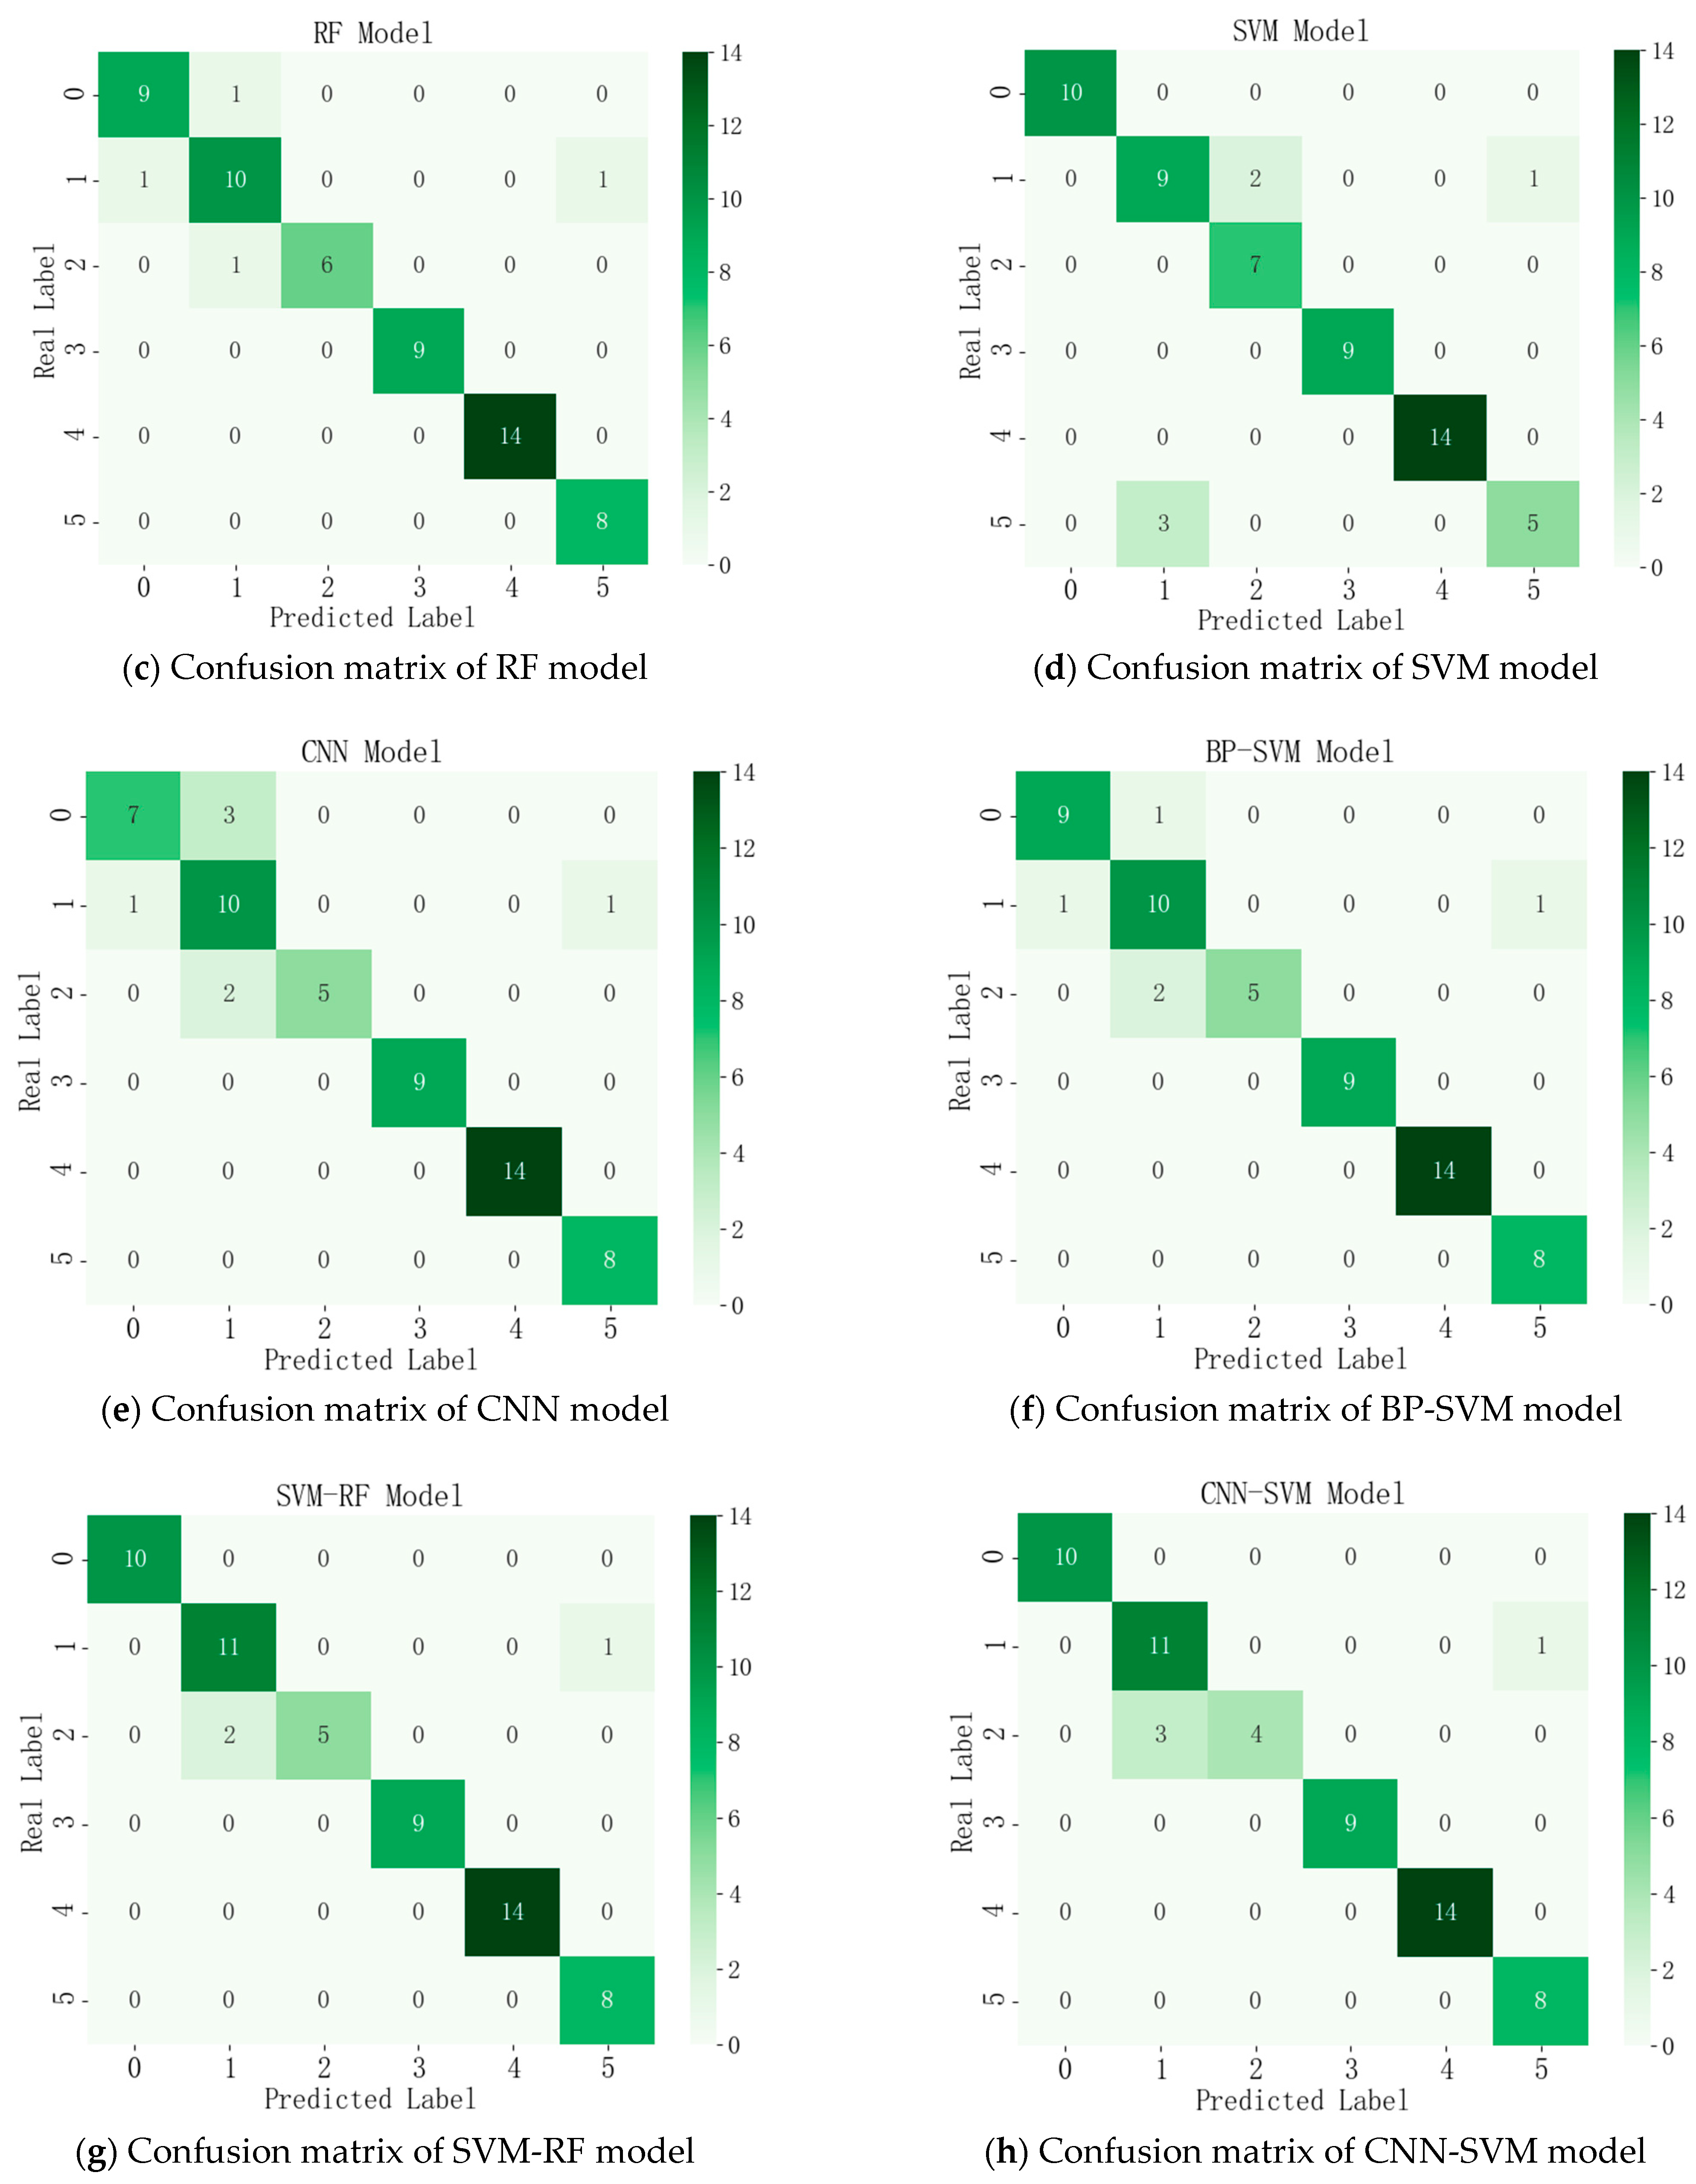
Figure 6.
Confusion matrices of diagnostic models.
In the confusion matrices shown in Figure 6a, the horizontal and vertical coordinates 0–5 represent the six state patterns of the gas turbine. The diagonal of the matrix indicates the number of samples accurately identified for each state pattern. The depth of color on the color axis on the right intuitively reflects the number of test samples in different state patterns. From the confusion matrices, it can be seen that the number of test samples for the six state patterns is 10, 12, 7, 9, 14, and 8, respectively, with only one sample of state pattern 1 being misclassified. Specifically, one sample of the fault combination state pattern 1 was incorrectly classified as state pattern 2, resulting in a diagnostic accuracy of 98.3% for the model. This outcome demonstrates that the BP-RF diagnostic model has good accuracy in recognizing different state patterns. In addition, as analyzed in Figure 5, it can be observed that the diagnostic accuracy achieved by the model on both the training and test sets is relatively consistent. This indicates that through data standardization preprocessing and the application of the Adam optimizer, the model is able to fully learn the data features during iterative training without encountering overfitting.
Accuracy reflects the consistency between the diagnostic results and the true results, but it may not accurately reflect the requirements for decision-making in practical scenarios. Therefore, precision, recall, and the score are introduced to provide a more comprehensive analysis of the model’s diagnostic results [36]. The calculation formulas are shown in Equations (14) to (17).
In the formulas, , and represent the numbers of true positive, false positive, true negative, and false negative samples, respectively. denotes accuracy, which represents the ratio of correctly diagnosed state pattern samples to the total number of samples. denotes precision, which indicates the proportion of samples that are correctly diagnosed as belonging to a specific state pattern among all samples diagnosed as that state pattern. denotes recall, which represents the proportion of samples that actually belong to a specific state pattern and are correctly diagnosed as that state pattern. In practice, and are in conflict with each other, meaning that an increase in one value often leads to a decrease in the other. Therefore, the harmonic mean of both, the score, is introduced as the final evaluation metric for the model. The higher the accuracy and score, the more accurate and reliable the model is.
Therefore, this study employs a 5-fold cross-validation method to further validate the diagnostic stability and generalization ability of the BP-RF model. A total of 300 samples were randomly divided into five subsets, with each subset taking turns as the test set while the remaining subsets were used as the training set. After 50 iterations of training, the performance evaluation metrics for each fold are shown in Table 4.
Table 4.
Performance evaluation metrics for different folds.
Based on the results in Table 4, the BP-RF model achieved an average accuracy of 96.00% and an score of 95.97% in 5-fold cross-validation, with corresponding standard deviations of 1.70% and 1.74%. This indicates that the model not only demonstrates excellent diagnostic performance but also exhibits good stability and strong generalization ability, capable of providing reliable diagnostic results across different datasets and application scenarios.
5.2.3. Diagnostic Performance Comparison and Evaluation
To verify the superiority of the proposed ensemble model, it is compared with other commonly used diagnostic models, including the BP neural network model, RF model, SVM model [37], CNN model [38], SVM-RF model [39], CNN-SVM model [40], and BP-SVM model [41]. Among them, the parameters of the single BP neural network model and RF model are kept consistent with those of the proposed ensemble model, while the parameters of the other models are adjusted according to the actual application scenario of this study and optimized through continuous training and tuning. The specific parameter settings are as follows:
SVM Model: The radial basis function (RBF) kernel is used, with the penalty parameter C set to 10 and the kernel coefficient gamma set to 0.1.
CNN Model: Convolutional layer 1 uses 32 convolutional kernels with the activation function ReLU; convolutional layer 2 uses 64 convolutional kernels with the activation function ReLU. The pooling layer uses max pooling. Fully connected layer 1 has 64 neurons with the activation function ReLU; fully connected layer 2 outputs six neurons with the activation function softmax. The Adam optimizer is used during training, with a learning rate set to 0.001 and 50 training epochs.
SVM-RF Model: The parameter settings are the same as for the individual SVM and RF models.
CNN-SVM Model: The CNN convolutional layer 1 uses 16 convolutional kernels, convolutional layer 2 uses 32 convolutional kernels, and convolutional layer 3 uses 64 convolutional kernels, with the activation function ReLU for all layers. The pooling layer uses max pooling. The fully connected layer has 32 neurons with the activation function softmax. The Adam optimizer is used during training, with a learning rate set to 0.001 and 50 training epochs. The SVM uses the radial basis function (RBF) kernel with the penalty parameter C set to 10, and the kernel coefficient gamma is automatically adjusted using ”scale”.
BP-SVM Model: The parameter settings are the same as for the individual BP neural network model and the SVM model.
The confusion matrices for each model and the final evaluation comparison results are shown in Figure 6b–h and Table 5, respectively.
Table 5.
Evaluation and comparison results of each diagnostic model.
As shown in Figure 6 and Table 5, the BP-RF model performs best in terms of state pattern diagnosis accuracy and score, with a score of 98.3%, which is 5.1% and 5.0% higher than the single BP neural network model and RF model, respectively. The results of the ablation experiment demonstrate that this model effectively combines the BP neural network’s ability to handle nonlinear relationships with the ensemble learning advantages of RF, while overcoming the issues of BP neural networks being prone to local optima and RF’s insufficient ability to capture nonlinear feature relationships. This significantly improves the accuracy of state pattern diagnosis for ship equipment. Meanwhile, the score of the BP-RF model improves by 8.6% and 9.9% compared to the single SVM and CNN models, respectively, indicating that the BP neural network outperforms SVM in terms of nonlinear mapping capability. On the other hand, compared to the CNN model, where the convolutional kernel fails to be sufficiently trained for effective feature extraction in small sample handling, the RF model enhances data utilization efficiency through the Bootstrap ensemble learning method, leveraging its feature selection capability. Furthermore, the score of the BP-RF model is 6.7%, 3.4%, and 5.3% higher than that of the other three combination models, respectively, further demonstrating its significant advantage in diagnostic accuracy. The BP-RF model is better suited to meet the needs of ship equipment fault diagnosis and provides a reliable source of evaluation indicators for health assessment based on state patterns of ship equipment.
5.2.4. State Pattern Probabilities Output
During a certain mission in August, four characteristic parameters of the gas turbine on the ship were collected at a specific moment: turbine speed, exhaust pressure, compressor outlet temperature, and unit vibration frequency, with values of 3438 r/min, 2.06 MPa, 539 °C, and 2.68 mm/s, respectively. These data were input into a trained BP-RF diagnostic model, which outputs the probabilities of the normal state and five fault combination states as 0.194, 0.590, 0.198, 0, 0, and 0.018, respectively. From this, the probability of a fault occurring in the gas turbine was estimated to be 80.6%. Furthermore, the highest probability value of the fault combination state pattern was selected as the probability of the fault state pattern. Considering the model’s diagnostic accuracy of 98.3%, the probabilities of the normal, fault, and unknown states were calculated to be 0.191, 0.580, and 0.017, respectively.
5.3. Calculation of Health State Membership Degree
Based on the membership function (13), the corresponding health state membership degrees can be calculated using the probabilities of the normal and fault combination state patterns. Referring to Table 3, it is observed that the turbine speed and exhaust pressure deviate significantly from the standard values, and the predicted unit vibration frequency of 2.68 mm/s far exceeds the specified threshold. Based on these preliminary judgments, the health state of the equipment is classified as “faulty”. The membership degrees corresponding to the probabilities of each state pattern are as follows:
5.4. Determination of State Pattern Weights
5.4.1. G1 Method for Determining Subjective Weights
Ten experts in the field of ship gas turbines were invited to independently assign subjective weights to the three state patterns based on their technical knowledge and historical experience. First, the importance of the probability of each state pattern was ranked. Then, through rational judgment, the relative importance ratio between the probabilities of adjacent state patterns was determined. Next, the subjective weights for each state pattern probability were calculated using the weight coefficient formula. Finally, the average of the weight assignments from all experts was taken as the final subjective weight for the probabilities of each state pattern, represented as .
5.4.2. Grey Relational Analysis Method to Determine Objective Weights
Based on the definition of equipment health state levels, the vectorized representation of the five health state levels is as follows:
Substitute , , , and the five health state level vectors into Equations (8) and (9) to calculate the correlation degree, and then use Equation (10) to compute and normalize the objective weights of each state pattern probability, resulting in .
5.4.3. Determination of Combined Weights
From Equation (12), the combined weights of the probabilities for each state pattern of the ship gas turbine are obtained as .
5.5. Health State Evaluation
Based on the membership degrees of the probabilities for each state pattern and the combined weight results obtained in Section 5.3 and Section 5.4, the membership degree vector of the health state level for this type of gas turbine is obtained by , as follows:
According to the principle of maximum membership degree, the membership degree of the equipment being in the “faulty” state is 0.613, so the health state level of the equipment is determined to be “faulty”.
5.6. Result Analysis
Various methods suitable for this problem and based on characteristic parameters were selected to conduct a health state evaluation of the gas turbine for this type of ship. A comparative analysis of the results obtained using different methods was performed to assess their advantages and disadvantages, as shown in Table 6 and Figure 7.
Table 6.
Comparison of results from different evaluation methods.
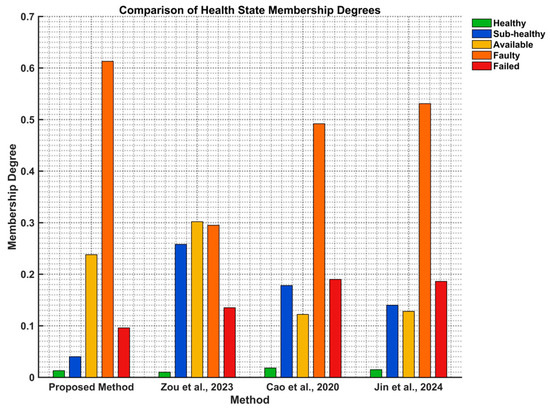
Figure 7.
The evaluation results of the methods in this paper compared with the methods in references [9,14,31].
As shown in Figure 7, the results obtained using the method from reference [9] indicate that the membership degrees of the equipment health state in the categories of “sub-healthy”, “available”, and “faulty” are relatively close, with unclear boundaries between these states. This is due to the dominance of subjective weights derived from the improved AHP during the weighting process. Furthermore, the AHP method does not allow for graded weighting in the health state assessment of a single gas turbine, leading to a vague overall evaluation. Additionally, the overall evaluation result of “available” does not align with the actual situation, which could potentially mislead operational use and support decision-making.
Although the evaluation results obtained using the methods in references [14,31] both indicate “faulty,” consistent with the conclusion of this paper, the membership degrees for the equipment health state evaluated as “sub-healthy” and “faulty” are 0.178 and 0.492, and 0.140 and 0.531, respectively. The membership degrees for the transitional state “available” between these two categories are 0.122 and 0.128, showing poor transition effects. The main reason for this phenomenon is that when fewer characteristic parameters are used for health assessment, the varying degrees of change in the monitoring data lead to significant differences in the impact of certain specific characteristic parameters (such as compressor outlet temperature) on the equipment health state compared to other parameters. This causes considerable interference in the model evaluation results, leading to a poor normal distribution effect in the evaluation results.
As shown in Figure 7, the method presented in this paper demonstrates superior evaluation performance, with the assessment result being “faulty,” and the membership boundaries of each state are clearly defined, which facilitates the implementation of ship equipment maintenance and support decision-making. The main reason for this improvement is that the proposed method converts feature parameters into state pattern probabilities as evaluation indicators. This approach not only comprehensively reflects the relative importance and interrelation of each feature parameter but also effectively addresses the interference caused by the significant differences in the impact of various feature parameters on the equipment health state, thereby enhancing the applicability of the method. Through the analysis of feature parameters, it is evident that the turbine speed and exhaust pressure deviate significantly from the standard values, while the vibration frequency has exceeded the specified threshold for this feature parameter, and the equipment fault rate is as high as 80.6%. This suggests that the equipment may have been operating under unfavorable conditions for a prolonged period, leading to increased vibration and a lack of regular, targeted inspection and maintenance, resulting in severe functional degradation. Therefore, assessing the equipment’s health state as “faulty” is consistent with the actual situation, which verifies that the method can more accurately and comprehensively evaluate the health state of ship equipment, and the evaluation results have good interpretability.
6. Conclusions
This paper presents a research on the health state assessment method of ship equipment, based on fault history information and real-time monitoring data. It combines a data-driven approach supported by neural networks and a knowledge-driven approach supported by expert experience. Through case analysis and comparison with other assessment methods, the rationality and superiority of the proposed method are verified. The main conclusions are as follows:
- (1)
- Based on the historical fault data of ship equipment, a state pattern diagnosis model based on BP-RF is employed to reveal the underlying relationship between the equipment characteristic parameters and state patterns, thus achieving an effective transformation from characteristic parameters to state pattern probabilities. This helps in fault diagnosis and supports decision-making;
- (2)
- A combined weighting method based on the G1 method and grey relational analysis is adopted to determine the weights of state pattern probabilities, fully incorporating expert knowledge and ensuring objectivity. Through case analysis and comparison with other weighting methods, the feasibility and rationality of this approach are validated;
- (3)
- By using state pattern probabilities as evaluation indicators, an equipment health state assessment is conducted, addressing the interference caused by the uneven contribution of feature parameters. Compared with other evaluation methods, the results show that the proposed method can more accurately and comprehensively assess the health state of ship equipment, while also providing interpretable evaluation results.
This paper takes the gas turbine in the power system of a certain type of ship as the empirical research object to verify the effectiveness of the proposed method. To further enhance the engineering application value of the method, future research can expand it to more types of ship equipment. For example, in the case of electrical subsystem equipment, since its fault is often related to a specific combination of characteristic parameters, and these parameters are easily affected by factors such as power grid fluctuations and electromagnetic interference, future work will focus on optimizing data preprocessing methods, adjusting the BP-RF model structure to adapt to its characteristic parameters, and improving the weight determination method. For ship support systems like HVAC, whose operational state is significantly affected by environmental factors and whose data exhibit notable seasonal and spatial characteristics, the research will focus on addressing the impact of environmental factors, optimizing data processing flows, adjusting model training and prediction cycles, and improving weight determination strategies. Through these studies, the applicability and effectiveness of the method in different types of ship equipment will be comprehensively verified, thereby further enhancing its engineering application value.
Author Contributions
Conceptualization, Y.Z. and J.L.; methodology, Y.Z.; software, Z.H.; validation, Y.Z., J.L. and Y.W.; formal analysis, Y.W.; investigation, Y.Z.; resources, Y.W.; data curation, Y.W.; writing—original draft preparation, Y.Z.; writing—review and editing, J.L.; visualization, H.C.; supervision, J.L.; project administration, Z.H.; funding acquisition, H.C. All authors have read and agreed to the published version of the manuscript.
Funding
This research was funded by the independent research and development project of Naval University of Engineering, with project number 2025507150.
Data Availability Statement
The dataset supporting this study involves sensitive monitoring information related to ship equipment, and its acquisition follows strict confidentiality agreements and approval procedures, so it is not publicly available at this time. The key statistical features and value ranges of the data have been provided in relevant tables and experimental descriptions. For further details, please contact the corresponding author via email. Under the premise of adhering to confidentiality regulations, anonymized data analysis results can be provided for academic exchange and reference.
Conflicts of Interest
The authors declare no conflicts of interest.
References
- Velasco-Gallego, C.; De Maya, B.N.; Molina, C.M.; Lazakis, I.; Mateo, N.C. Recent advancements in data-driven methodologies for the fault diagnosis and prognosis of marine systems: A systematic review. Ocean. Eng. 2023, 284, 115277. [Google Scholar] [CrossRef]
- Li, G.; Wang, Y.; He, J.; Wang, J. Research Progress and Development Trends of Health State Evaluation for Electromechanical Equipment. J. Jilin Univ. (Eng. Technol. Ed.) 2022, 52, 267–279. [Google Scholar]
- Zhu, J.; Luo, T.; Wu, W.; Li, S.; Dong, H. Review of Operating Reliability Assessment for Integrated Energy Systems I: Model-Driven Methods. Electr. Eng. J. 2022, 37, 2761–2776. [Google Scholar]
- Ding, S.; Wang, M.; Dong, Z.; Lie, L. Ship Equipment Health State Simulation Evaluation Method Based on Multi-Agent System. China Mech. Eng. 2022, 33, 1169–1177. [Google Scholar]
- Ding, B.; Wan, A.; Niu, L. Health Status Assessment Method for Ship DC Motor Drive Circuit Under Multiple Failure Mechanisms. Ship Eng. 2024, 46, 185–189. [Google Scholar]
- Zhang, Z.; Fu, G.; Wan, B.; Jiang, M.; Li, Y. A High-Eficiency IGBT Health State Assessment Method Based on Data-Driven. IEEE Trans. Electron Devices 2021, 68, 168–174. [Google Scholar] [CrossRef]
- Yang, Z.; Jing, X.; Le, J.; Shen, Y.; Zhang, H. Real-Time Status Evaluation Method of Distribution Equipment Based on MI-PSO-BP Algorithm. Electr. Power Autom. Equip. 2019, 39, 108–113. [Google Scholar]
- Shan, Z.; Li, Z.; Zang, X.; Huang, Y.; Li, Y. Hydraulic Pump Health Status Evaluation Based on Multi-Sensor Information Fusion and Multi-Granularity Cascade Forest Model. China Mech. Eng. 2021, 32, 2374–2382. [Google Scholar]
- Zou, Y.; Lin, J.; Li, A.; Zhang, Y. Transformer Oil-Paper Insulation State Assessment Based on GreyRelational Analysis and Clustering Cloud Model. Power Syst. Prot. Control 2023, 51, 35–43. [Google Scholar]
- Hu, P.; Zhou, T. A Health State Assessment Method for Ship Propulsion System Based on Fuzzy Theory and Variable Weight Theory. Vibroeng. Procedia 2017, 11, 19–24. [Google Scholar] [CrossRef]
- Lin, R.; Huang, L.; Liu, Z.; Zhou, X.; Zhou, Z. A Multilayered and Multifactorial Health Assessment Method for Launch Vehicle Engine under Vibration Conditions. Aerospace 2023, 10, 505. [Google Scholar] [CrossRef]
- Hu, T.; Liu, H.B.; Chen, T.; Wang, Y.; Li, M. Resilience Evaluation of Ship Power Systems Based on IAHP-CRITIC Two-Dimensional Cloud Model. Syst. Eng. Electron. 2025, 47, 217–229. [Google Scholar]
- Zeng, S.; Liang, H.; Wang, Y.; Sun, K.; Zhong, Z. Health State Assessment of Stratospheric Airships Based on Improved Combined Weighting and Cloud Model. J. Beijing Univ. Aeronaut. Astronaut. 2023. [Google Scholar] [CrossRef]
- Cao, X.; Lei, Y.; Gong, Y.; Zhang, S.; Luo, X. Research on Health State Evaluation Method for Coal Mining Machine Based on Combined Weighting Method. Coal Sci. Technol. 2020, 48, 135–141. [Google Scholar]
- Li, X.; Wang, Z.; Zhang, L.; Zou, C.; David, D. State-of-Health Estimation for Li-Ion Batteries by Combining the Incremental Capacity Analysis Method with Grey Relational Analysis. J. Power Sources 2019, 410–411, 106–114. [Google Scholar] [CrossRef]
- Wang, Y.; Hao, J.; Liu, W. GNSS Deception Jamming Effectiveness Evaluation Based on Grey Relational Analysis and Fuzzy Comprehensive Judgment. Acta Electron. Sin. 2020, 48, 2352–2359. [Google Scholar]
- Li, B. Research on Comprehensive System Evaluation of Ship Power Systems. Ship Sci. Technol. 2015, 37, 127–130. [Google Scholar]
- Meng, T.; Zhang, X.; Xiao, Y.; Li, F.; Jia, K. Flexibility Evaluation of New Energy Power Generation Grid-Connected Inverters Based on Entropy Weight Method. Proc. CSEE 2024. [Google Scholar] [CrossRef]
- Zhao, S.; Tang, S. Comprehensive Evaluation of Power Transmission Network Planning Schemes Based on Improved AHP, CRITIC Method, and TOPSIS. Electr. Power Autom. Equip. 2019, 39, 143–148+162. [Google Scholar]
- Xie, Y.; Yan, Y.; Li, X.; Ding, T.; Ma, C. Research on Fault Diagnosis Method of Nuclear Detectors Based on BP Neural Network. At. Energy Sci. Technol. 2021, 55, 1857–1864. [Google Scholar]
- Chen, Z.; Zhu, L.; Lu, H.; Chen, S.; Zhu, F. Research on Bearing Fault Diagnosis Based on Improved Genetic Algorithm and BP Neural Network. Sci. Rep. 2024, 14, 15527. [Google Scholar] [CrossRef] [PubMed]
- Song, X.; Wang, H.; Liu, Y.; Wang, Z.; Cui, Y. A Fault Diagnosis Method of Rolling Element Bearing Based on Improved PSO and BP Neural Network. J. Intell. Fuzzy Syst. 2022, 43, 5965–5971. [Google Scholar] [CrossRef]
- He, D.; Zhang, Z.; Jin, Z.; Zhang, F.; Yi, C.; Liao, S. RTSMFFDE-HKRR: A fault diagnosis method for train bearing in noise environment. Measurement 2025, 239, 115417. [Google Scholar] [CrossRef]
- Liu, G.; Ma, Y. Fault Diagnosis of Electric Drilling Rig Winch Gearbox Based on LSTM-RF. Vib. Shock. 2024, 43, 156–162+230. [Google Scholar]
- Utkin, V.L.; Kovalev, S.M.; Coolen, P.F. Imprecise Weighted Extensions of Random Forests for Classification and Regression. Appl. Soft Comput. J. 2020, 92, 106324. [Google Scholar] [CrossRef]
- Ruben, I.E.C.; Gustavo, A.S.A.; Antonio, P.A.; Jessica, N.C. Feature-ranked self-growing forest: A tree ensemble based on structure diversity for classification and regression. Neural Comput. Appl. 2023, 35, 9285–9298. [Google Scholar]
- Wu, J.; Bai, T.; Li, X. Inverting Chlorophyll Content in Jujube Leaves Using a Back-Propagation Neural Network–Random Forest–Ridge Regression Algorithm with Combined Hyperspectral Data and Image Color Channels. Agronomy 2024, 14, 140. [Google Scholar] [CrossRef]
- Bao, X.; Chai, N.; Wang, Q. Comprehensive Effectiveness Study of Railway Green Construction Energy-saving Measures Based on G1 Method and Improved DEA. J. Railw. Eng. Soc. 2018, 40, 15–22. [Google Scholar]
- Yuan, W.; Cui, Z.; Yu, H.; Zhou, X.; Xiong, W.; Yuan, X. Transformer Health Condition Assessment Based on Rough Set-G1 Method Combination Weighting. Electr. Power Constr. 2022, 43, 50–57. [Google Scholar]
- Tao, J.; Sun, X.; Cao, Y.; Ling, M. Evaluation of Water Quality and Its Driving Forces in the Shaying River Basin with the Grey Relational Analysis Based on Combination Weighting. Environ. Sci. Pollut. Res. Int. 2021, 29, 18103–18115. [Google Scholar] [CrossRef]
- Jin, J.; Cai, Z.; Huang, Z.; Deng, H.; You, L. Health State Evaluation of Electronic Countermeasure Systems Based on Combined Weighting and Normal Cloud Model. Syst. Eng. Electron. 2024, 46, 4140–4148. [Google Scholar]
- Yang, Y.; Zhang, M.; Dai, Y. A Fuzzy Comprehensive CS-SVR Model-based Health Status Evaluation of Radar. PLoS ONE 2019, 14, e0213833. [Google Scholar] [CrossRef]
- Li, Y.; Chen, W.; Xie, Y. Data-driven Performance Monitoring Method for Gas Turbine. J. Power Eng. 2024, 44, 1845–1853. [Google Scholar]
- Zeng, Q.; Huang, Z.; Wei, S. Health State Evaluation Method for Gas Turbine Based on Fuzzy Theory and Bayesian Network. Sci. Technol. Eng. 2020, 20, 4363–4369. [Google Scholar]
- Cui, J.; Xiao, J.; Jiang, L.; Yu, M.; Jiang, X. Health Status Evaluation of Gas Turbine Based on Combined Weighting Method and Cloud Gravity Evaluation Method. Sci. Technol. Eng. 2017, 17, 268–273. [Google Scholar]
- Wang, J.; Zhou, D.; Cao, J.; Li, Y. Fault Diagnosis of Ball Mill Rolling Bearings Based on Multi-Feature Fusion and RF. J. Beijing Univ. Aeronaut. Astronaut. 2023, 49, 3253–3264. [Google Scholar]
- Zhou, X.; Feng, Y.; Chen, L.; Luo, W.; Liu, S. Improved Vulture Search Algorithm Optimizing SVM for Transformer Fault Diagnosis. Power Syst. Prot. Control. 2023, 51, 118–126. [Google Scholar]
- Wen, Z.; Chen, J.; Liu, L.; Jiao, L. Fault Diagnosis of Wind Turbine Gearbox Based on Wavelet Transform and Optimized CNN. J. Zhejiang Univ. (Eng. Ed.) 2022, 56, 1212–1219. [Google Scholar]
- Zhang, S.; Guo, Y.; Zhang, X.; Ning, X.; Yin, C. Fault Diagnosis of Power Lines Based on SVM-RF. Shandong Electr. Power Technol. 2022, 49, 36–43. [Google Scholar]
- Yin, W.; Xia, H.; Peng, B.; Zhu, S.; Wang, Z. Bearing Fault Diagnosis Method for Nuclear Power Plants Based on CNN-SVM. J. Harbin Eng. Univ. 2023, 44, 410–417. [Google Scholar]
- Zheng, X.; Chen, H.; Guan, C.; Wang, R. Fault Diagnosis of Ship Steam Power System Based on SVM-BP Ensemble Learning. Ship Sci. Technol. 2023, 45, 97–101. [Google Scholar]


Disclaimer/Publisher’s Note: The statements, opinions and data contained in all publications are solely those of the individual author(s) and contributor(s) and not of MDPI and/or the editor(s). MDPI and/or the editor(s) disclaim responsibility for any injury to people or property resulting from any ideas, methods, instructions or products referred to in the content. |
© 2025 by the authors. Licensee MDPI, Basel, Switzerland. This article is an open access article distributed under the terms and conditions of the Creative Commons Attribution (CC BY) license (https://creativecommons.org/licenses/by/4.0/).