Article

Defending Graph Neural Networks Against Backdoor Attacks via Symmetry-Aware Graph Self-Distillation

1
State Key Laboratory of Public Big Data, Guizhou University, Guizhou 555025, China
2
Northeast Asia Studies College, Jilin University, Changchun 130012, China
*
Author to whom correspondence should be addressed.
Symmetry 2025, 17(5), 735; https://doi.org/10.3390/sym17050735 (registering DOI)
Submission received: 14 April 2025 / Revised: 7 May 2025 / Accepted: 8 May 2025 / Published: 10 May 2025
(This article belongs to the Special Issue Information Security in AI)

Abstract

:
Graph neural networks (GNNs) have exhibited remarkable performance in various applications. Still, research has revealed their vulnerability to backdoor attacks, where Adversaries inject malicious patterns during the training phase to establish a relationship between backdoor patterns and a specific target label, thereby manipulating the behavior of poisoned GNNs. The inherent symmetry present in the behavior of GNNs can be leveraged to strengthen the robustness of GNNs. This paper presents a quantitative metric, termed Logit Margin Rate (LMR), for analyzing the symmetric properties of the output landscapes across GNN layers. Additionally, a learning paradigm of graph self-distillation is combined with LMR to distill the symmetry knowledge from shallow layers, which can serve as the defensive supervision signals to preserve the benign symmetric relationships in deep layers, thus improving both model stability and adversarial robustness. Experiments were conducted on four benchmark datasets to evaluate the robustness of the proposed Graph Self-Distillation-based Backdoor Defense (GSD-BD) method against three widely used backdoor attack algorithms, demonstrating the robustness of GSD-BD even under severe infection scenarios.

1. Introduction

Graph neural networks (GNNs) [1,2,3,4] have demonstrated remarkable performance in various graph-related tasks, including social networks [5], financial systems [6], and molecular graphs [7]. Building a well-performing GNN requires rich, well-labeled examples and heavily computational overhead. Consequently, practitioners may choose to utilize pretrained models with potential vulnerabilities [8,9] or rich labeled training data collected through crawlers and crowdsourcing [10], which might be implanted with malicious perturbations or even injected with Trojans by attackers. In particular, a prevalent perturbation called a backdoor attack [11,12,13,14,15] leaves a specific pattern in the target model through a slight perturbation, thereby establishing a connection between this pattern and a specific target label determined by and known only to the attacker without degrading the performance on normal examples. Moreover, the backdoor pattern is more easily internalized in GNNs due to the iterative message-passing process, which can potentially aggregate the malicious perturbations.
Recent studies [16,17,18] have shown that certain neurons within the backdoor model are abnormally sensitive to perturbed examples in relation to the patterns of attached malicious subgraphs (i.e., backdoor triggers). This enables abnormal neurons to force the backdoor model to generate large activation of the malicious structure towards specific labels, successfully misclassifying infected examples into an attacker’s predefined target class. Consequently, the hijacked model will boost the activation of the target label and suppress all others. Based on this, ref. [17] identified compromised neurons and then performed reverse-engineering through an optimization procedure to sanitize the backdoor; ref. [19] learned a minimum-norm perturbation that leads to misclassification across an entire class group and performed unsupervised anomaly detection; and ref. [20] estimated the maximum margin statistic based on global output landscape to conduct backdoor detection and mitigation. While the aforementioned methods have demonstrated the ability to preserve the model’s original benign behavior, it is not feasible to directly apply these defense methods from computer vision (CV) to the graph domain due to the distinct topological structure of the graph. In state-of-the-art graph backdoor defense methods, Prune [15] employed a random branch pruning strategy that discards the labels of pruned graphs; explanatory backdoor defense [21] filtered infected samples by calculating the explainability scores of the explanatory subgraph; and DMGNN [22] pruned the most explainable subgraphs that exhibited the highest predictive confidence for non-target classes. Unfortunately, these approaches may introduce potential noise and degrade the model’s performance.
Symmetrical properties can provide insights into the underlying data distribution and enable the identification of perturbations that deviate from normal patterns. In this paper, we go further from existing backdoor defenses via symmetry-driven graph knowledge distillation (KD). KD [23] improves the performance of student models by aligning their outputs with those of teacher models. Recent research has proposed several methods for graph knowledge distillation, such as CCGL [24], FreeKD [25] and TinyGNN [26]. Among these, a teacher-free distillation paradigm [27] inspires our defense, the GNN-SD, which estimates the Neighborhood Discrepancy Rate (NDR) to quantify the non-smoothness of graph representations across GNN layers. Knowledge self-distillation is then applied to holistically preserve non-smoothness across layers. The design intuition of NDR is that the learned graph representations will converge to one steady state as the iterative message passing, leading to indistinguishability of connected nodes in deep GNN layers (i.e., over-smoothing [28]). Similarly, the adversarial graph exhibits an over-asymmetric output landscape in deep layers to ensure abnormal activation towards the backdoor pattern (i.e., boosting and suppression effects [20,29]). Centered on this conclusion, we extract defensive knowledge from shallow layers to supervise the deeper output landscapes, enabling gentle sanitization of graph backdoors. Specifically, a Logit Margin Rate (LMR) quantifies the asymmetry of output landscapes across GNN layers and adaptively distills symmetry knowledge from shallow layers to retain it in deeper layers. As a consequence of the integration, a novel backdoor defense method, Graph Self-Distillation Backdoor Defense (GSD-BD), was proposed to sanitize backdoor perturbations by retaining symmetry knowledge across GNN layers while preserving the capacity of extracting original benign features for sanitized GNNs.
Our contributions are summarized as follows:
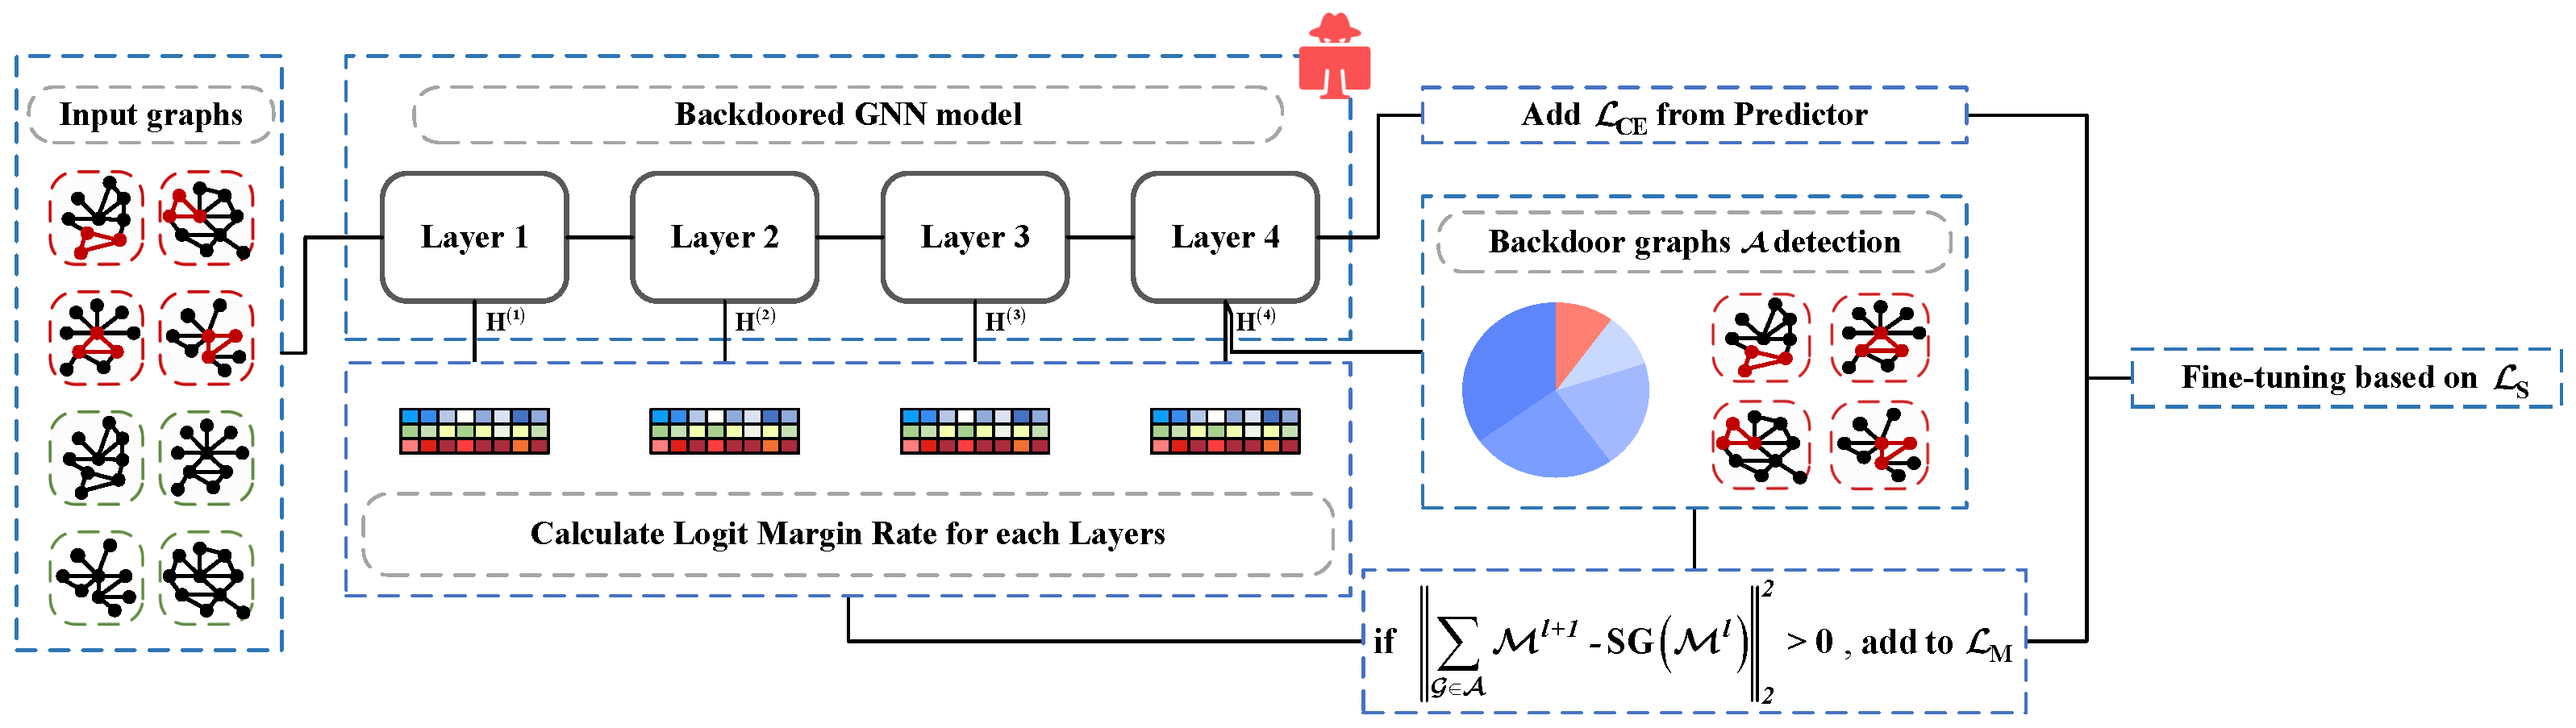
  • The Graph Self-Distillation Backdoor Defense (GSD-BD) sanitizes ingrained backdoor perturbations by leveraging symmetry knowledge from shallow layers to supervise deeper layers. This ensures the preservation of intrinsic structural characteristics of graph data, enhancing both model stability and adversarial robustness.
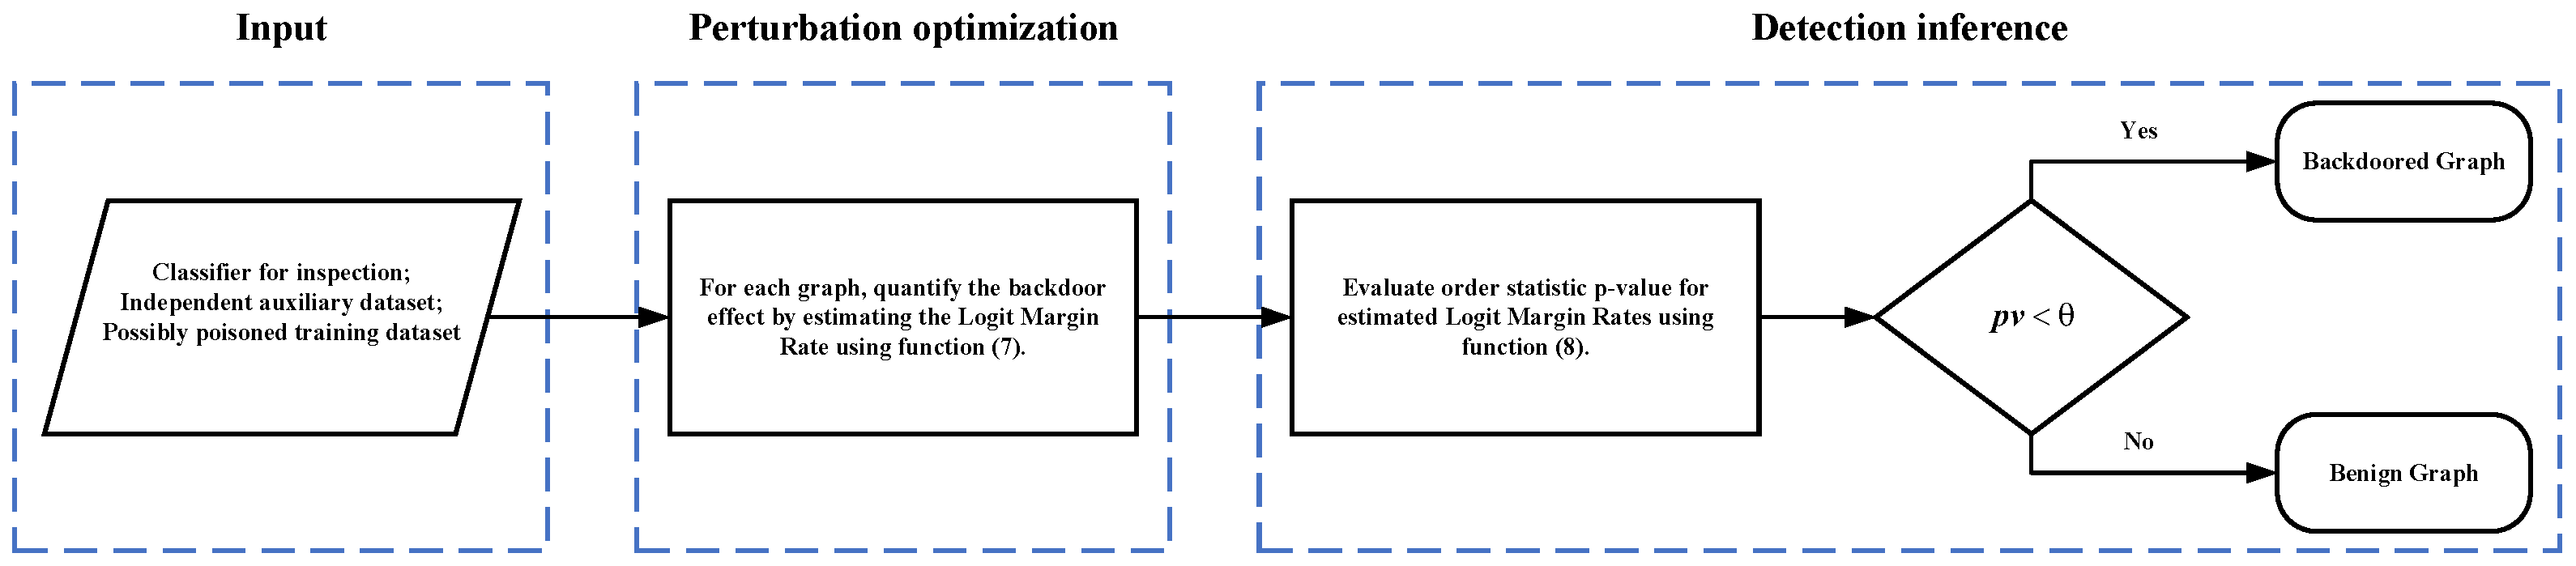
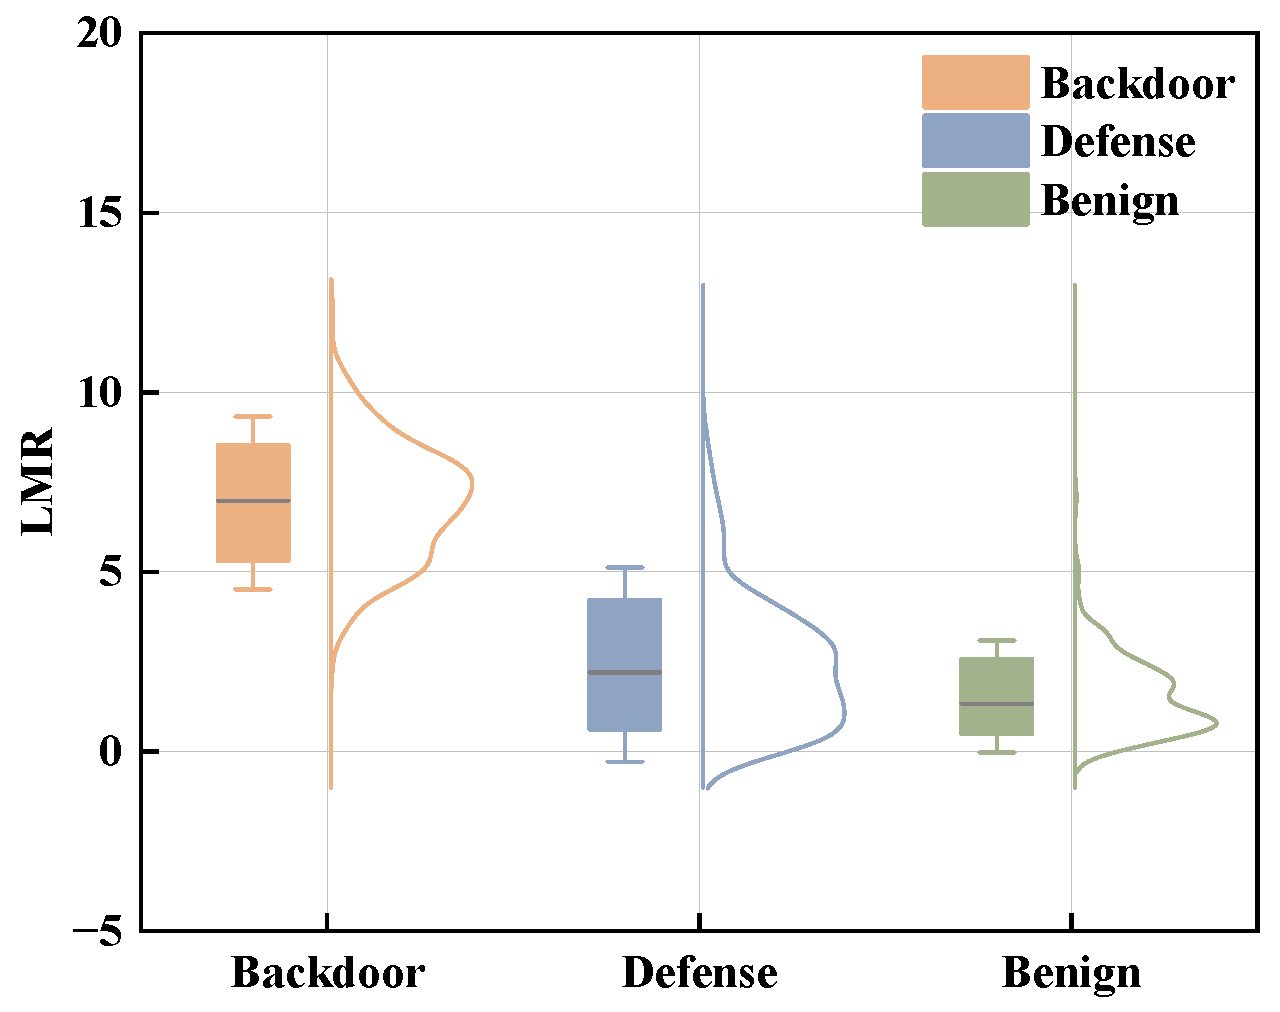
  • Experimental findings reveal that backdoor attack effects can be characterized by boosting and suppression effects. Based on this, the Logit Margin Rate (LMR) is introduced as a quantitative metric to measure logit output asymmetry across GNN layers, facilitating accurate and efficient backdoor sanitization.
  • The efficacy of GSD-BD is validated through comparisons with state-of-the-art graph backdoor defense methods. Experimental results demonstrate that GSD-BD achieves a superior Average Defense Rate (ADR) against various backdoor attack algorithms while preserving the sanitized model’s original benign behavior.

2. Related Works

2.1. Graph Knowledge Distillation

The initial distillation knowledge [23] is applied for model compression to facilitate model deployment. Ref. [30] first introduced graph knowledge distillation by extracting local graph structure knowledge from both the teacher and student models, then distilling it through similarity matching. G-CRD [31] retains global topology by aligning node embeddings in a shared representation space through contrastive learning. Subsequent studies revised teacher model architectures or employed teacher-free paradigm. CPF [32] took advantage of label propagation in MLPs to distill knowledge from teacher GNNs to student MLPs. TGS [33] replaced explicit information propagation in GNNs with MLPs, then guided dual knowledge self-distillation between target nodes and their neighborhood. GNN-SD [27] directly self-distilled embedded graph non-smoothness across GNN layers as the supervision signals, retaining this knowledge in deeper layers. Building upon graph self-distillation, our work introduces a novel Symmetry-Aware Graph Self-Distillation specifically designed for backdoor defense in GNNs, which leverages the inherent symmetry properties of GNNs to detect and sanitize backdoor perturbations.

2.2. Backdoor Attack

Backdoor attack is a type of attack that occur during the training phase. With the extensive adoption of GNNs, research efforts have extended the backdoor attacks to GNN models, where attackers generate and inject subgraphs into a small portion of training examples while altering their labels to the target class, establishing a relationship between target label and backdoor triggers. The initial implementation by [11], involved generating subgraphs following Erdős–Rényi, small-world, or preferential attachment distributions via random injection. To increase the threat level of the graph backdoor attack, several efforts have been made to create more sophisticated backdoor triggers. Xi et al. [13] proposed a bi-optimization strategy to alternately update the trigger generator and target model parameters. Dai et al. [15] presented an adaptive trigger generator that maintains the unnoticeability of the trigger by constraining the cosine similarity between the backdoor trigger and original nodes. Later approaches often selected representative subgraphs (e.g., graph motifs, explanatory subgraphs) as triggers to reduce computational overhead. Xu et al. [12] employed interpretation methods to select optimal injection locations for backdoor triggers. Wang et al. [34] utilized subgraphX to identify and generate explanatory subgraphs with superior quality. Zheng et al. [14] exploited motif distribution differences within the dataset to identify trigger structures.

2.3. Backdoor Defense

Despite increasing focus on developing backdoor attack algorithms for GNNs, exploration of defensive methods has only recently begun. Several computer vision backdoor defense strategies have shown promising results and offer valuable insights. Zeng et al. [35] proposed a retraining approach leveraging implicit hyper-gradients to model interdependence between inner/outer optimization processes. Liu et al. [36] combined pruning and fine-tuning, first pruning deep neural networks (DNNs) and then fine-tuning the pruned networks. Wang et al. [16] identified backdoor patterns and reconstructed potential triggers through reverse engineering. Guo et al. [37] devised a Trojan detection quality metric to identify backdoor patterns. Although these have proven effective for continuous data (e.g., images), their application to graphs remains limited due to the inherently unstructured and discrete properties of the graphs. In the domain of graph backdoor defense, several methods have been proposed. Dai et al. [15] employed random branch pruning and disregarded pruned graph labels. Jiang et al. [21] filtered infected samples via explanatory subgraph explainability scores. Yang et al. [38] identified backdoor triggers using Gaussian mixture models and purified the poisoned regions through clustering and filtering. Sui et al. [22] pruned the most explainable subgraphs that exhibited the highest predictive confidence for non-target classes. However, despite their innovative approaches, these graph-specific methods introduce potential structural noise that degrades sanitized model performance. In comparison, proposed GSD-BD presents a gentle sanitization paradigm via symmetry-aware knowledge distillation, preserving intrinsic graph structures. By distilling shallow-layer symmetry knowledge to deeper layers, it avoids aggressive modifications to the graph topology and presents a tailored graph defense strategy to eliminate backdoors while preserving the benign behavior of the sanitized model.

3. Preliminaries

3.1. Notations

In this paper, we focus on graph classification backdoor defense. For convenience, the frequently used notations are summarized in Table 1.

3.2. GNN-Based Graph Classification

Without loss of generality, we formulate graph classification by GCN [1] to explain our defense goal, where the node embeddings for the k-th aggregation H ( k ) can be represented as follows:
H k = σ ( D ˜ 1 2 A ˜ D ˜ 1 2 H k 1 W k ) ,
where D represents the degree matrix, D ˜ i , i = j A ˜ i j , A 0 , 1 n × n represents the adjacency matrix for n nodes, and A ˜ = A + I is the self-looped adjacency matrix. The initial node embeddings H ( 0 ) are set to the node features X , and σ denotes the the nonlinear activation function.
The permutation invariant function Readout ( · ) aggregates the final-layer node embeddings to obtain the graph representation H G = Readout H 1 ( k ) , H 2 ( k ) , , H n ( k ) .
The graph classification can, therefore, be described as:
y ^ = f ( G ) = softmax H G ,
where y ^ denotes the predicted class label based on the output probabilities for the input graph.

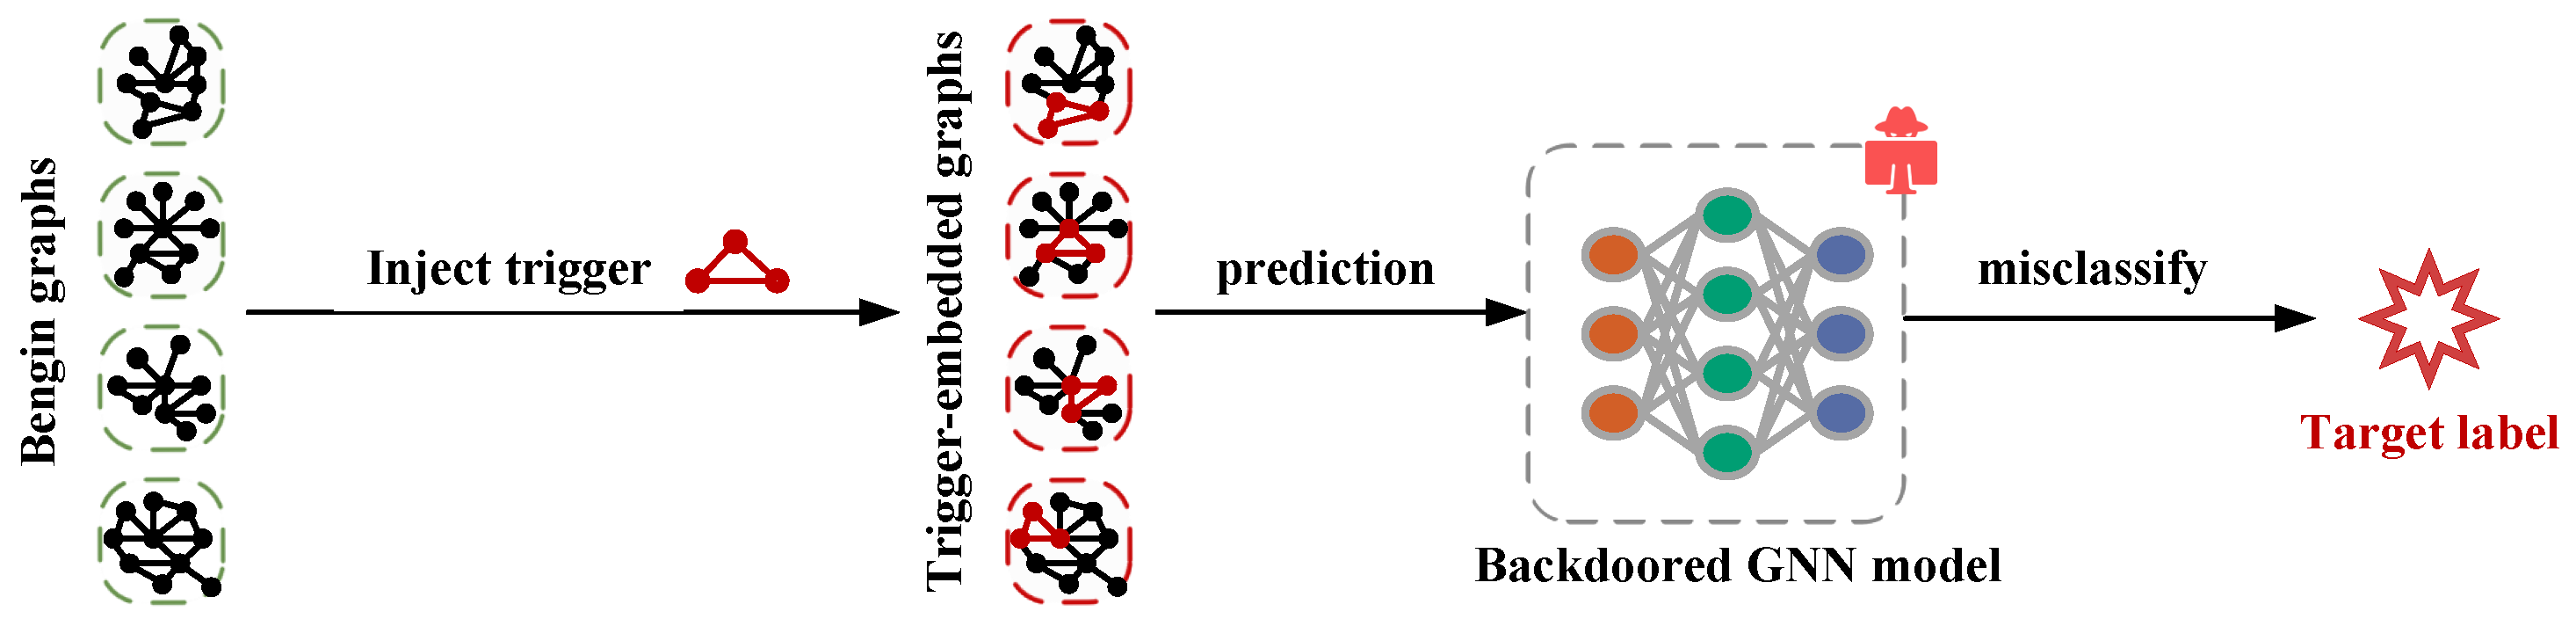
3.3. Backdoor Attack

In a standard backdoor attack, a poisoned subset D p D is first created by selecting a subset of M ( M N ) examples from D . Each sample ( G , y ) D p is transformed into a backdoor sample ( T ( G ) , y t ) , where T : G G p is the backdoor function. The backdoor function T determines how a backdoor trigger is placed on G to create the backdoor input G p , and y t is the attacker-specified label. The remaining clean samples form D c = D D p . Figure 1 illustrates the general implementation of the graph backdoor attack.

3.4. The Threat Model

3.4.1. Attacker’s Capabilities and Goals

The attacker is given more lenient capabilities to implant triggers into sufficient data and takes full control of the training process of the target model, e.g., the model is outsourced to a third party, which turns out to be an attacker. The attacker’s goal is to activate incorrect behavior after malicious propagation, causing the model to classify the trigger-embedded graphs as the target label, which is determined by and known only to the attacker while minimally affecting the prediction accuracy on benign graphs.

3.4.2. Defender’s Capabilities and Goals

The defense mechanism preserves clean knowledge from shallow layers while propagating it to deeper layers.
The defender has no prior knowledge about potential attacks or backdoor trigger patterns. GSD-BD operates in a post-training scenario, requiring only a minimal set of clean graphs that can be readily acquired at negligible cost. The defense mechanism preserves clean knowledge from shallow layers while propagating it to deeper layers, then sanitizes the backdoored GNN through fine-tuning to restore correct predictions (original ground-truth labels) when fed with the infected graphs.

4. Methodology

4.1. Design Intuition

The goal of graph backdoor attacks is to establish a relationship between backdoor patterns and specific target labels, which are determined by and known only to the attacker. Certain neurons within the backdoor model exhibit abnormal sensitivity to perturbed examples containing malicious subgraphs (i.e., backdoor triggers), resulting in large activations toward predefined target labels while suppressing activations of other labels [16,17,18].
Specifically, this behavior resembles an overfitting “boosting and suppression” effect [20,29], which provides symmetry knowledge for quantifying the anomalous output landscape of backdoors. Symmetry knowledge obtained from shallow GNN layers can serve as supervisory signals when combined with the graph knowledge self-distillation paradigm. This combination guides fine-tuning purification, thereby restoring the smoothness of the overall output landscape and gently sanitizing the graph backdoors.
Subsequently, Section 4.2 details how backdoor-induced asymmetries can be quantified and distinguished from the natural graph structure, and Section 4.3 examines whether knowledge of shallow symmetries can effectively guide backdoor sanitization without disrupting the graph structure.

4.2. Quantification for Backdoor Effect

To distinguish and quantify backdoor-induced asymmetries from natural graph structures, we propose the Logit Margin Rate (LMR) as a metric to quantify the backdoor effect in individual graphs. LMR is based on the observation that the perturbed samples exhibit substantial margins between the activations of the predicted label and activations of others. Specifically, we calculate this margin as the difference between the logit output of the predicted class and the maximum logit output among all remaining classes, providing a quantitative measure of abnormal asymmetry. We utilize logit outputs rather than probabilities because probabilities have minimal impact on weight parameters during fine-tuning, while logit outputs more directly reflect the relative confidence of predictions.
To further elucidate the LMR, a simple GNN model is considered as an example. Let the logit output related to the class decision c of the input graph G be ϕ c , where c is any class from the label space Y . We assume that the GNN can correctly classify all the training samples with confidence higher than τ , as follows:
ϕ y ( G ) max k y ϕ k ( G ) τ ,
Furthermore, assuming that a backdoor attack can successfully force the backdoored GNN to classify perturbed samples embedded with trigger g t as the target class y t , the logit margin for backdoored and benign samples can be described as follows:
ϕ y t ( G p ) ϕ y ( G p ) τ
ϕ y ( G ) ϕ y t ( G ) τ ,
where G p is the perturbed graph and G p = G + g t , y, and y t correspond to the ground-truth labels and predefined target labels, respectively. Adding (4a) and (4b) gives the following:
ϕ y t ( g t ) ϕ y ( g t ) 2 τ ,
The (5) indicates that the backdoored model requires a higher LMR margin when encountering perturbed samples, reflecting a significant decision boundary difference in making decisions between perturbed samples and benign samples. The maximum margin lower bound for the backdoor target class is at least 2 τ , substantially exceeding the lower bound for benign samples.
Furthermore, the minimal proportion of perturbed samples might lead to the logit margin rate (LMR) being diluted by benign samples. If the model is encouraged to use the LMR of benign samples as a supervisory signal for backdoor sanitization, it might introduce over-smoothness [28], causing the states of graph nodes to converge to the same stationary point during propagation, making the hidden states difficult to distinguish, thereby degrading the model’s performance in classification and feature recognition. To address this issue, we introduce an unsupervised anomaly detector, which is integrated with LMR to build a symmetry knowledge filter. Specifically, the LMR for a given graph sample can be expressed as follows:
M G = ϕ c ( G ) max k Y c ϕ k ( G ) ,
Moreover, to achieve a sparser representation and reduce computational overhead, this was followed by Hinge Loss and the introduction of the max function, Equation (6), which can be expressed as follows:
M G = max ( 0 , ϕ c ( G ) max k Y c ϕ k ( G ) ) ,
Subsequently, following [20], a null distribution P is estimated using the LMR from a minimal set of clean graphs with a null parametric density form, i.e., the gamma distribution. The null hypothesis H 0 (representing no attack) is rejected if the test statistics associated with the attack exhibit large anomalies with small p-values under the null hypothesis. To evaluate the atypicality of M G , we compute the order-statistic p-value as follows:
pv = 1 P M G N ,
The pv represents the probability of extreme values appearing in the output results, reflecting the extent of sample abnormalities. If pv is below the confidence threshold, it indicates a significant deviation from the distribution, leading to rejection of H 0 and the classification of the graph associated with the current M G as anomalous. Consequently, the knowledge filter can identify potential perturbed samples and provide support for subsequent backdoor sanitization tasks. Figure 2 illustrates the procedure for perturbation detection.

4.3. Symmetry-Aware Graph Knowledge Self-Distillation for Backdoor Sanitization

To determine whether shallow symmetry knowledge can effectively guide backdoor sanitization while preserving graph structure, we suggest extracting symmetry knowledge from shallow GNN layers to supervise deep GNN layers’ output landscape. Specifically, we separately filter benign and potentially perturbed samples using an upstream symmetry knowledge filter, and we employ the LMR of suspicious samples as a supervisory signal to maintain output landscape smoothness in deep layers through cross-layer knowledge self-distillation. By adaptively calibrating the contributions of malicious and benign knowledge, gentle backdoor sanitization is achieved while retaining the original feature extraction capabilities of sanitized models.
Furthermore, given that it might be difficult for the defenders to locate the specific layer causing the backdoor effect, specifying a supervisory layer could potentially result in inaccurate LMR extraction. Hence, the supervisory layer is initialized only when a substantial activation margin exists. Formally, the supervised layer l is defined as:
l = arg max l { 1 , , L } G i A M G i l
where SG ( · ) denotes the gradient representation release control signal, L denotes the final layer of the GNN, and M G l denotes the LMR for graph G at layer-l.
After determining the supervisory layer, we adaptively calibrate the contributions between malicious knowledge and benign knowledge using the upstream symmetry knowledge filter while preserving the model’s original feature extraction capability. Formally, the sanitization loss can be represented as:
L M = 1 | A | l L 1 G i A M G i l + 1 SG ( M G i l ) 2 2
where A represents the set of suspicious adversarial samples identified by the upstream symmetry knowledge filter, l is the supervisory layer, and | | · | | denotes the square of the L2 norm, which facilitates fine-tuning by allowing for smooth penalty decay when the size of A is extremely small. A purified cross-entropy loss L CE is then used to preserve the benign output landscape for sanitized GNNs, which can be described as:
L CE = 1 | N | G j N l ( f ( G j ) , y j )
where l ( · ) represents the cross-entropy loss, and N denotes the set of benign samples where N = D A . As a consequence of the integration, the total loss for backdoor sanitization L S is formulated as follows:
L S = L CE + λ L M
Considering that different backdoor patterns can produce distinct logit margins, and that graph representation learning might be poorly learned in shallow layers, the hyperparameter λ is set empirically for robustness. The weights for L M and L CE are adaptively adjusted according to their respective input sets to prevent signal dilution from limited adversarial samples. As a result, not only do we sanitize the ingrained backdoor patterns, but we also preserve the original feature extraction capability. The entire workflow is illustrated in Figure 3.

4.4. Time and Space Complexity

The time complexity analysis of GSD-BD primarily involves four dominant components: (1) computing the Logit Margin Rate (LMR) across N graph samples with C classes, which scales as O ( N C ) ; (2) fitting the null distribution to the LMR values, requiring O ( N ) operations; (3) the self-distillation process that introduces an additional O ( N C ) term from comparing LMR discrepancies between shallow and deep layers; (4) the layer-wise message passing of GNNs require O ( L | E | d 2 ) operations, where L is the number of layers, | E | is the number of edges, and d is the node embedding dimension. This hierarchical composition results in an overall time complexity of O ( L | E | d 2 + N C ) .
In addition, the space complexity comprises: (1) O ( N C ) storage for maintaining logit outputs during LMR computation; (2) negligible O ( 1 ) space for statistical parameters of the null distribution; and (3) O ( N L ) space demands for caching LMR values during the self-distillation process. Consequently, the total space complexity requires O ( L N n d + N C ) , where n is the average number of graph nodes.

5. Evaluation

5.1. Experiment Setup

5.1.1. Datasets

We evaluated four publicly available real-world graph datasets using the proposed method: PROTEINS, BITCOIN, AIDS, and NCI1. The rationale behind the selection of these is that they are widely used in most backdoor attack/defense scenarios, which allows for a more comprehensive comparative analysis. Table 2 provides detailed statistics of the datasets.
  • PROTEINS [39]: This dataset consists of proteins in which each node is represented as an amino acid, and two nodes are connected by an edge if they are less than 6 angstroms apart. The labels are determined as enzymatic or non-enzymatic.
  • BITCOIN [40]: This dataset is used for graph-based detection of fraudulent Bitcoin transactions, where each node is represented as a transaction and its associated transactions, and each edge between two transactions indicates the Bitcoin currency flow between them. The labels are determined based on illicit or licit transactions.
  • AIDS [41]: This dataset contains molecular compounds from the AIDS antiviral screen database. The labels are determined based on active or inactive of molecular compounds.
  • NCI1 [42]: This dataset comprises chemical compounds used to inhibit cancer cells, where each graph corresponds to a chemical compound, each vertex represents an atom of the molecule, and the edges between vertices represent bonds between atoms.

5.1.2. Dataset Split and Construction

Each dataset will be divided into three parts: training dataset D t r a i n , test dataset D t e s t , and auxiliary dataset D a u x . Specifically, 60% of the data are randomly selected as the training graphs for each dataset, and the remaining part represents the test graphs. For the backdoor datasets, the backdoor training dataset and the backdoor test dataset are randomly selected from D t r a i n and D t e s t , respectively, based on the training and test poisoning rates. Additionally, 5% of the clean graphs are randomly chosen to form D a u x . In experiments, backdoor attack algorithms are employed to generate and implant triggers into D t r a i n , configured with parameters such as the training poisoning rate and trigger size (more parameter settings can be found in Section 5.1.4). Subsequently, D a u x is utilized to construct a null distribution in the form of a null parametric density for the symmetry knowledge filter. Following this, backdoor triggers are generated and implanted into D t e s t based on the predefined test infection rate. Then, experiments are conducted on D t e s t to evaluate the defense performance. Note that the dataset split settings are applied to all attacks.

5.1.3. Baseline Defense Methods

The superiority of the proposed approach is demonstrated through comparative analysis with the following baseline defense methods: Prune, Prune+LD [15], explanatory backdoor defense [21], and DMGNN [22]. (1) The Prune will be employed to excise connected edges exhibiting low cosine similarity, which is set based on the lowest 10% of cosine similarity scores. (2) For Prune+LD, we move those pruned graphs from D t r a i n to D t e s t as an alternative to label-discard strategies. (3) The explanatory backdoor defense method will be applied to identify and prune the potentially infected graphs with explainability scores above a threshold, which is set based on the maximum value of the discrepancy between fidelity and infidelity computed on the D a u x . (4) DMGNN will be implemented to locate the disturbed regions using a counterfactual explanation method, and reverse sampling pruning will be conducted based on explainable confidence at 0.9.

5.1.4. Model Settings and Parameter Settings

Experiments were performed on two graph neural networks: (1) GCN [1]: A 4-layer graph convolutional network with hidden dimensions of 256, ReLU activation, and batch normalization after each layer; (2) GIN [3]: A 4-layer graph isomorphism network with hidden dimensions of 256, MLP aggregators (2-layer perceptrons with ReLU), and sum pooling. Both models were trained for 300 epochs using the Adam optimizer with a learning rate of 0.005. The benign models’ accuracy and backdoor models’ performance for three baseline backdoor attack algorithms across different datasets are shown in Table 3.
Subsequently, three existing state-of-the-art backdoor attack algorithms were employed to implant backdoors in GNNs to verify the defense performance, including the Erdős–Rényi backdoor (GBA) [11], the most important node-selecting attack (MIA) [12], and the adaptive generated backdoor attack (GTA) [13]. Specifically, the poisoning ratios were set to 5% for training, and the test poisoning ratio was fixed at 50%; The trigger size was set to 15% of the average number of nodes for each graph by default; the confidence threshold θ is set to 0.05 by default for backdoor detection; the sanitization loss weight λ is set to e 2 by default.

5.1.5. Evaluation Metrics

Several key metrics were employed to evaluate the performance of backdoor defense. (1) Attack success rate (ASR) [43] refers to the percentage of examples implanted with triggers that are classified into the target label by the backdoor model. (2) Average defense rate (ADR) [44] represents the ratio of the difference in ASR between the no defense and defense scenarios to the ASR in the no-defense scenario. (3) Clean accuracy (ACC) measures the classification of clean samples, while clean accuracy drop rate (CAD) [12] quantifies the discrepancy between the classification accuracy of a clean model and backdoor model on benign samples. Intuitively, higher ADR and lower ASR values indicate more effective defense, while lower CAD reflects less influence on original benign properties of the sanitized model.

5.2. Defense Performance

To assess the effectiveness of the Graph Self-Distillation Backdoor Defense (GSD-BD) in countering backdoor attacks, we conducted comparative experiments utilizing four baseline methods, namely Prune, Prune+LD, Exp-LD, and DMGNN, across four real-world datasets. The evaluation metrics employed include the Average Defense Rate (ADR) and Clean Accuracy Drop (CAD), where a higher ADR signifies enhanced defense performance, and a lower CAD indicates the sanitized model’s ability to retain its original benign characteristics.
As detailed in Table 4 and Table 5, GSD-BD consistently achieves the highest ADR among the evaluated methods. For instance, in the case of the GTA attack on the NCI1 dataset using the GIN model, GSD-BD records an ADR of 95.86%, markedly surpassing the performance of Prune (36.27%), Prune+LD (39.36%), Exp-BD (71.41%), and DMGNN (71.28%). This robustness is also observed in other datasets (e.g., PROTEINS, AIDS, and BITCOIN), where GSD-BD maintains ADRs above 83%, while baseline methods struggle to exceed 80%. The consistently high ADR across various datasets and attack algorithms further attests to the robustness and adaptability of GSD-BD.
Regarding CAD, GSD-BD preserves the original benign behavior of the sanitized model, as reflected in its consistently lower Clean Accuracy Drop (CAD). For instance, in the case of the GTA attack on the NCI1 dataset using the GCN model, GSD-BD achieves a CAD of 2.06, significantly lower than Prune (4.62), Prune+LD (5.16), Exp-BD (5.42), and DMGNN (4.95). This indicates its effectiveness in preserving the original performance and benign attributes of the model. Notably, in most scenarios, the CAD of GSD-BD is lower than that of the infected model, suggesting that GSD-BD is capable of restoring the original benign behavioral characteristics of the sanitized model to a considerable extent.
As for baseline methods, Prune achieves low ADRs of below 40%, while Prune+LD records ADRs below 47% in the case of the GTA attack with the GCN model. This limitation stems from their reliance on pruning strategies, which can be imprecise and may introduce additional noise. Although Exp-BD and DMGNN perform better than Prune and Prune+LD, they still fall short relative to GSD-BD. Specifically, while Exp-BD and DMGNN yield higher ADRs of 77.53% and 79.22% on GCN, respectively, their CADs of 4.71 and 4.94 exceed that of GSD-BD. This indicates that they are less effective at restoring the original performance of the sanitized model and may even contribute to further performance degradation, as their approaches rely on rigid elimination processes for potentially anomalous structures, which inevitably disrupts the intrinsic graph topology and leads to consequent performance degradation.
The superiority of GSD-BD can be attributed to two key factors. First, GSD-BD is able to quantify the anomaly of output landscape across GNN layers based on the Logit Margin Rate, which allows for precise distillation for symmetry knowledge. Second, GSD-BD can adaptively calibrate the contribution between malicious and benign knowledge for sanitization loss. This prevents the sanitized model from over-smoothing, thereby preserving the original graph topological information and avoiding potential performance degradation.

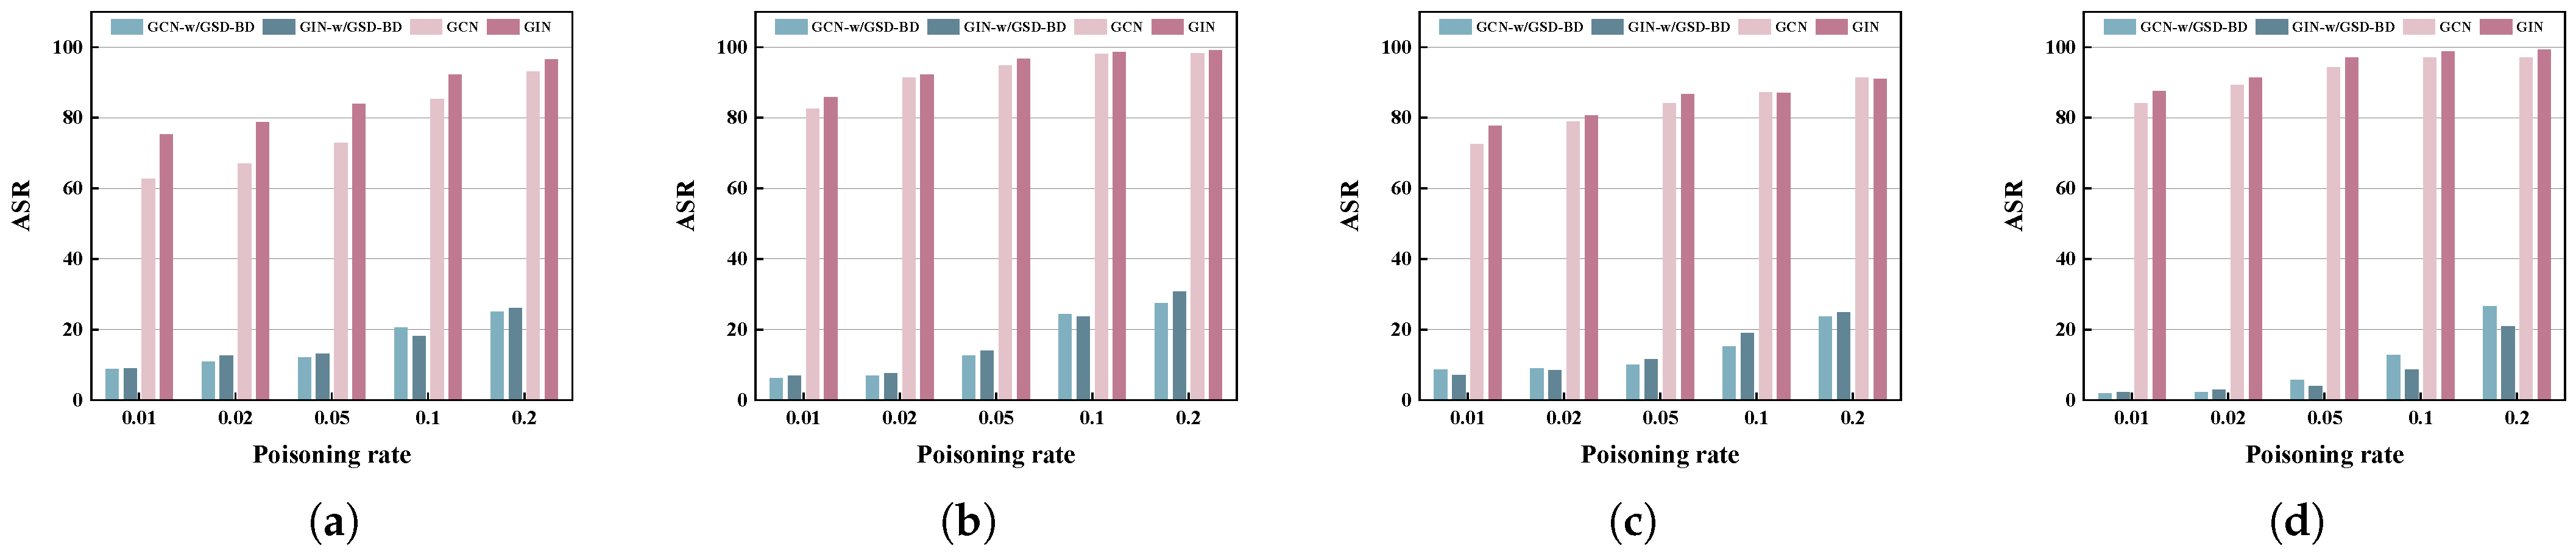
5.3. Robustness Against Different Poisoning Rates

With the aim of analyzing the performance of GSD-BD against different poisoning rates, we conducted experiments by setting the poisoning rates from { 0.01 , 0.02 , 0.05 , 0.1 , 0.2 } on four datasets with employing GTA backdoor attack on GCN. Figure 4 shows the results with and without incorporating GSD-BD. The sanitized models that incorporated backdoor defense were denoted as GCN-w/GSD-BD and GIN-w/GSD-BD, and those did not incorporate backdoor defense were denoted as GCN and GIN, respectively. It can be clearly observed from the figures that, irrespective of the incorporation of backdoor defense, the ASR increases with the poisoning rate (see GCN-w/GSD-BD and GIN-w/GSD-BD), which illustrates that the performance of GSD-BD will be slightly weakened as the poisoning rate increases. This might be due to the large poisoning rate leading to the expanded proportion of infected samples and dilution of the features of benign samples, thereby affecting the detection accuracy of the symmetry knowledge filter and the computation of the Logit Margin Rate. Notwithstanding, GSD-BD reliably maintains a low ASR across all poisoning rate scenarios, and the effectiveness of backdoor sanitization is significant even at high infection rates. In the worst-case scenario, both GCN-w/GSD-BD and GIN-w/GSD-BD have ASRs of less than 30% on the AIDS dataset, even with a poisoning rate of 0.2 (in Figure 4b), which further validates the robustness of our defense.

5.4. Importance of Symmetry Knowledge Filter

Incorrectly encouraging the distillation of knowledge related to smoothness for benign samples would further lead to oversmoothing. The backdoor knowledge filter thus provides a purified stream for subsequent symmetry knowledge distillation. To evaluate the capability of knowledge filtering for the proposed unsupervised anomaly detector, the detection accuracy, precision, recall, and F1-score were employed as evaluation metrics. Precision quantifies the accuracy of positive predictions, while recall measures the ability to identify all positive instances. The F1-score, in turn, provides a single value representing the harmonic mean of the above two metrics. With a default sampling rate of 0.05, we conducted a detection task using various attack algorithms on both GCNs and GINs to observe the performance of the symmetry knowledge filter. As shown in Table 6, the symmetry knowledge filter achieved outstanding results in all of the proposed attacks. Yet, the performance on PROTEINS was relatively poor, with a minimum detection accuracy of 90.05% and precision of 85.91%, indicating a limitation in distinguishing adversarial graphs for PROTEINS. This might be incurred by the lack of feature information of PROTEINS compared to the other datasets. Meanwhile, despite the diminished efficacy under GTA, it consistently provides notable results irrespective of the employed model algorithms. Specifically, the accuracy of GBA reaches 99.99% on both GNN algorithms, and the remaining scenarios also achieve considerable results. This success can be attributed to the capability of quantifying perturbations of LMR, thus aiding in downstream symmetry knowledge distillation tasks with specific targets to be processed.

5.5. Exploration for Logit Margin Rate

An investigation was conducted to investigate the role of the Logit Margin Rate (LMR) in preserving symmetry knowledge from shallow layers. Figure 5 presents a comparison of LMR curves across four layers of a backdoored GCN model subjected to a GBA attack. It can be observed that the LMRs with GSD-BD decrease in all four layers compared to the backdoored GNN, where the first layer (Figure 5a) is similar to that of the layer without GSD-BD. This indicates that the output landscapes of the backdoored and sanitized models show a consistency in the shallower layers. In contrast, the LMRs of the deeper layer without sanitization maintain a significant growth trend, which could imply that the backdoor induces the boost and suppression effect during backdoor implantation, whereas the LMRs with GNN-SD remain at a lower level and preserve a certain symmetry, which might imply the elimination of the malicious association between the backdoor pattern and the target label.
In particular, there is a tendency for the distribution of benign samples to return to its original form when the perturbations are sanitized. Figure 6, left shows a boxplot analysis of the Logit Margin Rate (LMR) distributions with standard deviations as whisker boundaries, which capture the dispersion of LMR values across three scenarios. The backdoor models exhibit extensive outliers beyond the upper whisker, in which most of the LMRs of the backdoor samples lie above the upper whisker of the benign group, confirming the severe distributional distortion and the anomalous boosting and suppression effect induced by the backdoor trigger. Meanwhile, defended samples (based on GSD-BD) reduced this ratio substantially, demonstrating successful suppression of backdoor artifacts. In addition, the benign model exhibits a symmetric distribution, indicating natural predictive confidence. Moreover, the right side presents the distribution curve of LMR across three scenarios, in which the distribution curves for the backdoor samples are significantly larger and more discrete, while the defense samples have a tendency to return to the normal level, which indicates the effectiveness of GSD-BD in mitigating the impact of backdoor attacks and restoring the original benign properties.

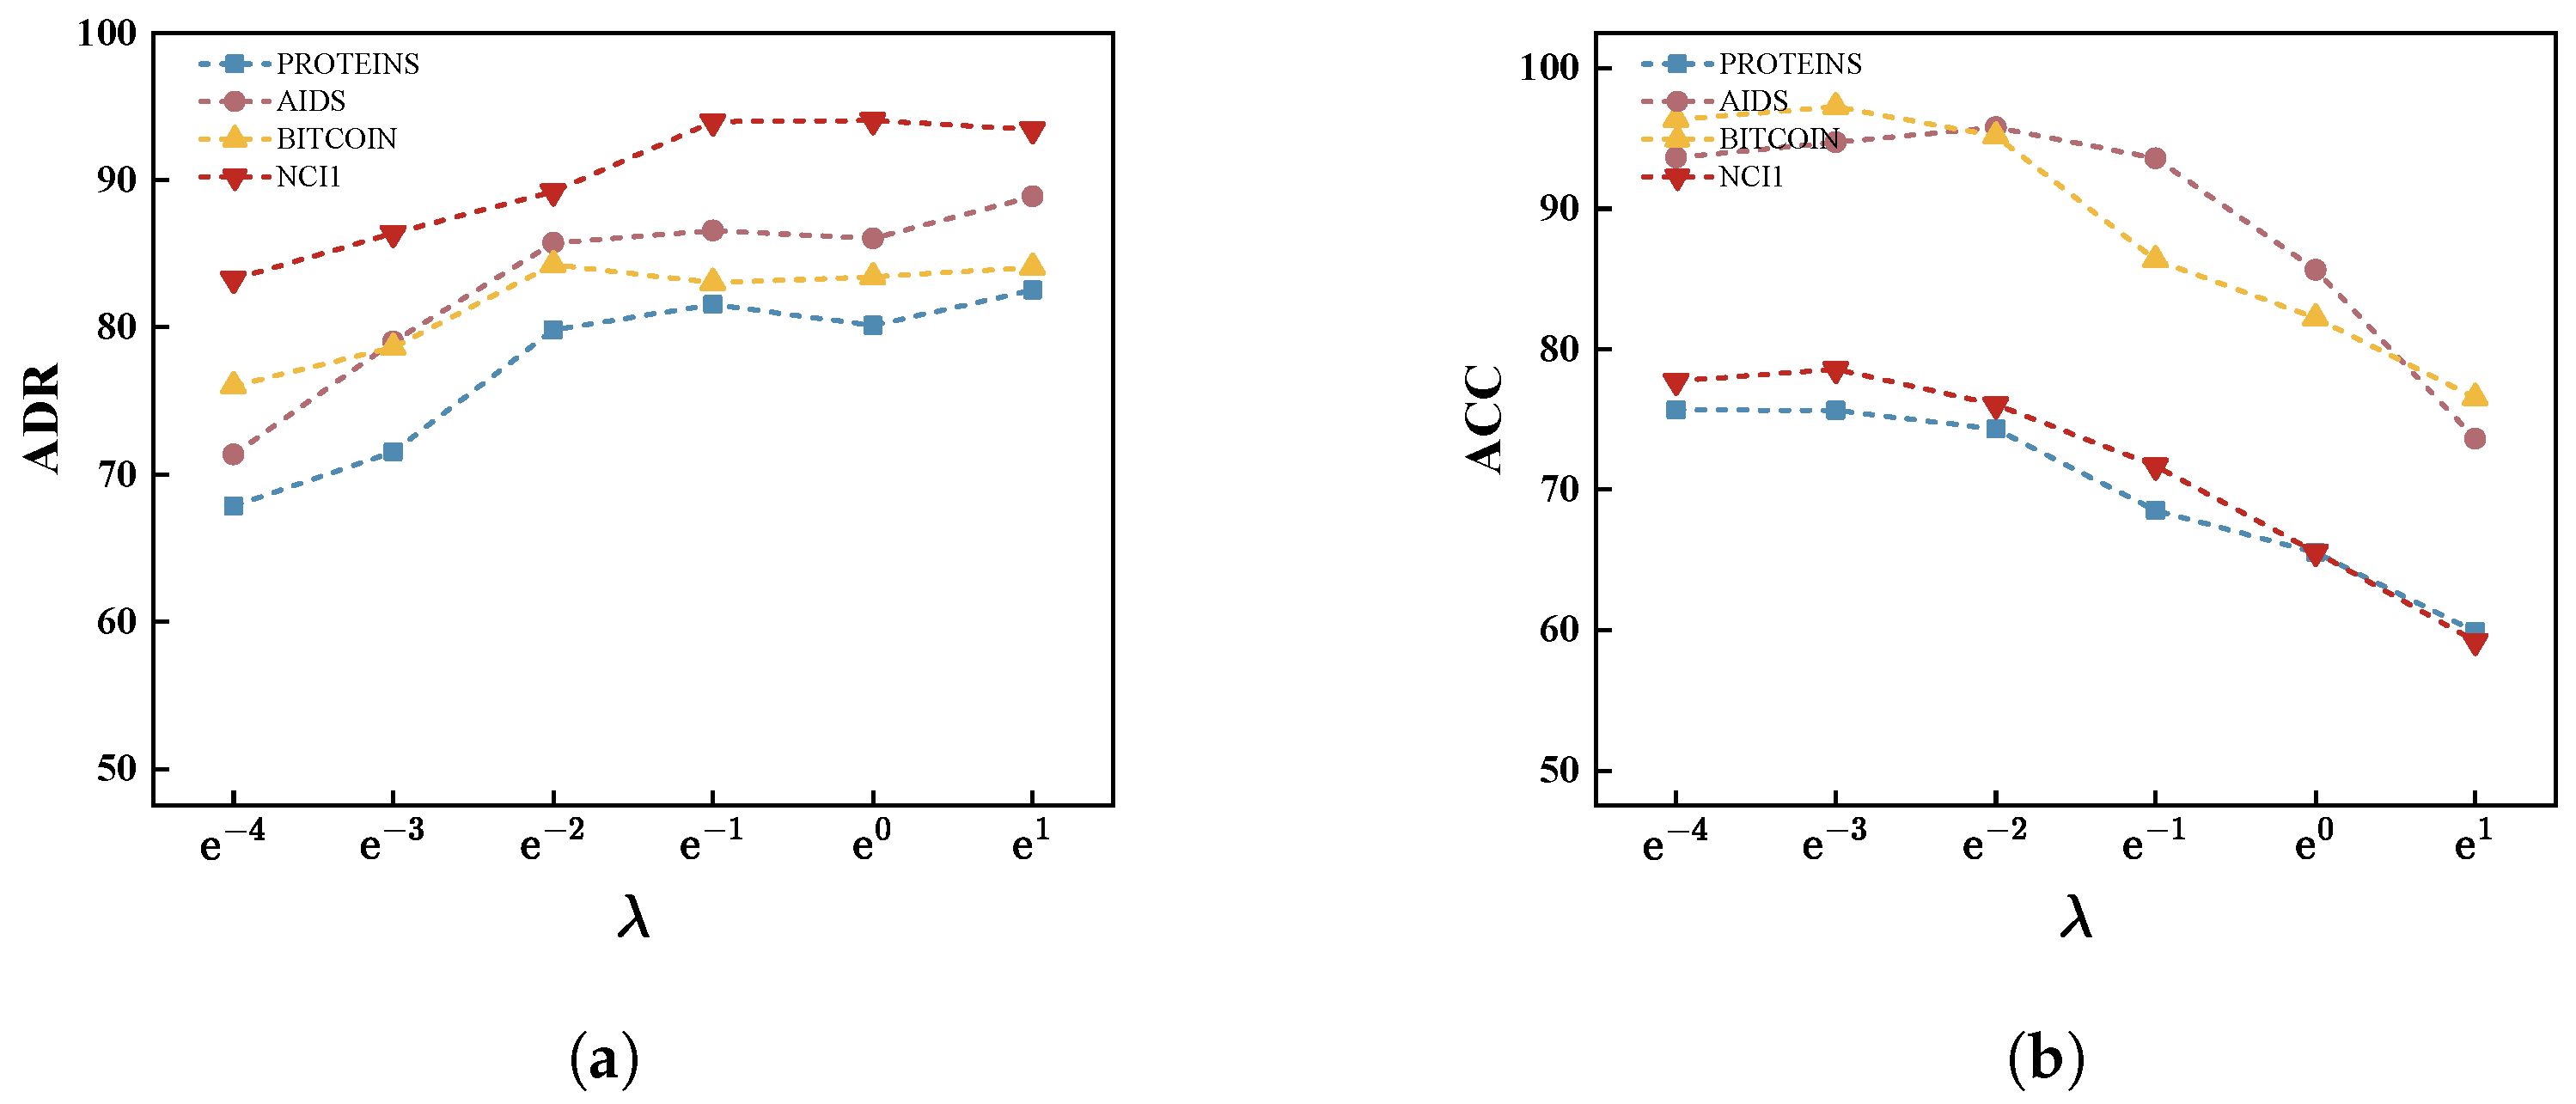
5.6. Exploration for Sanitization Loss

It is important that model performance should be rarely compromised during backdoor defense. An excessively high or low contribution of sanitization loss L M may either adversely lead to over-focusing or ignoring of symmetry knowledge. We conducted experiments across four datasets using the GTA backdoor attack on GCN with different hyperparameter λ settings. As shown in Figure 7a,b, the average defense rate (ADR) consistently increases, while classification accuracy (ACC) decreases as λ ’s contribution goes up, illustrating the trade-off between ADR and ACC.
For example, with a λ setting of e 2 , we observed an ADR of 85% paired with an ACC of 90% (approximately). In contrast, increasing λ to e 1 results in an ADR of 95% but a significant drop in ACC to 70%. This pattern indicates that while a higher λ enhances backdoor resistance, it may over-commit to symmetry knowledge and thereby adversely impact the model’s ability to learn the intrinsic topological features of the data. Further analysis reveals that a threshold λ of e 2 provides an optimal balance, maintaining both a robust ADR and acceptable ACC.
Moreover, we observed that when λ is set excessively high, such as to e 1 , the model performance diminishes due to the loss of distinctiveness in hidden states, which ultimately prevents effective learning of topological structures. Our results demonstrate that while backdoor detection accuracy improves with higher λ values, the default setting should typically be set to e 2 in most cases. This approach maintains a critical equilibrium between ACC and ADR, which is essential for practical application in real-world scenarios.

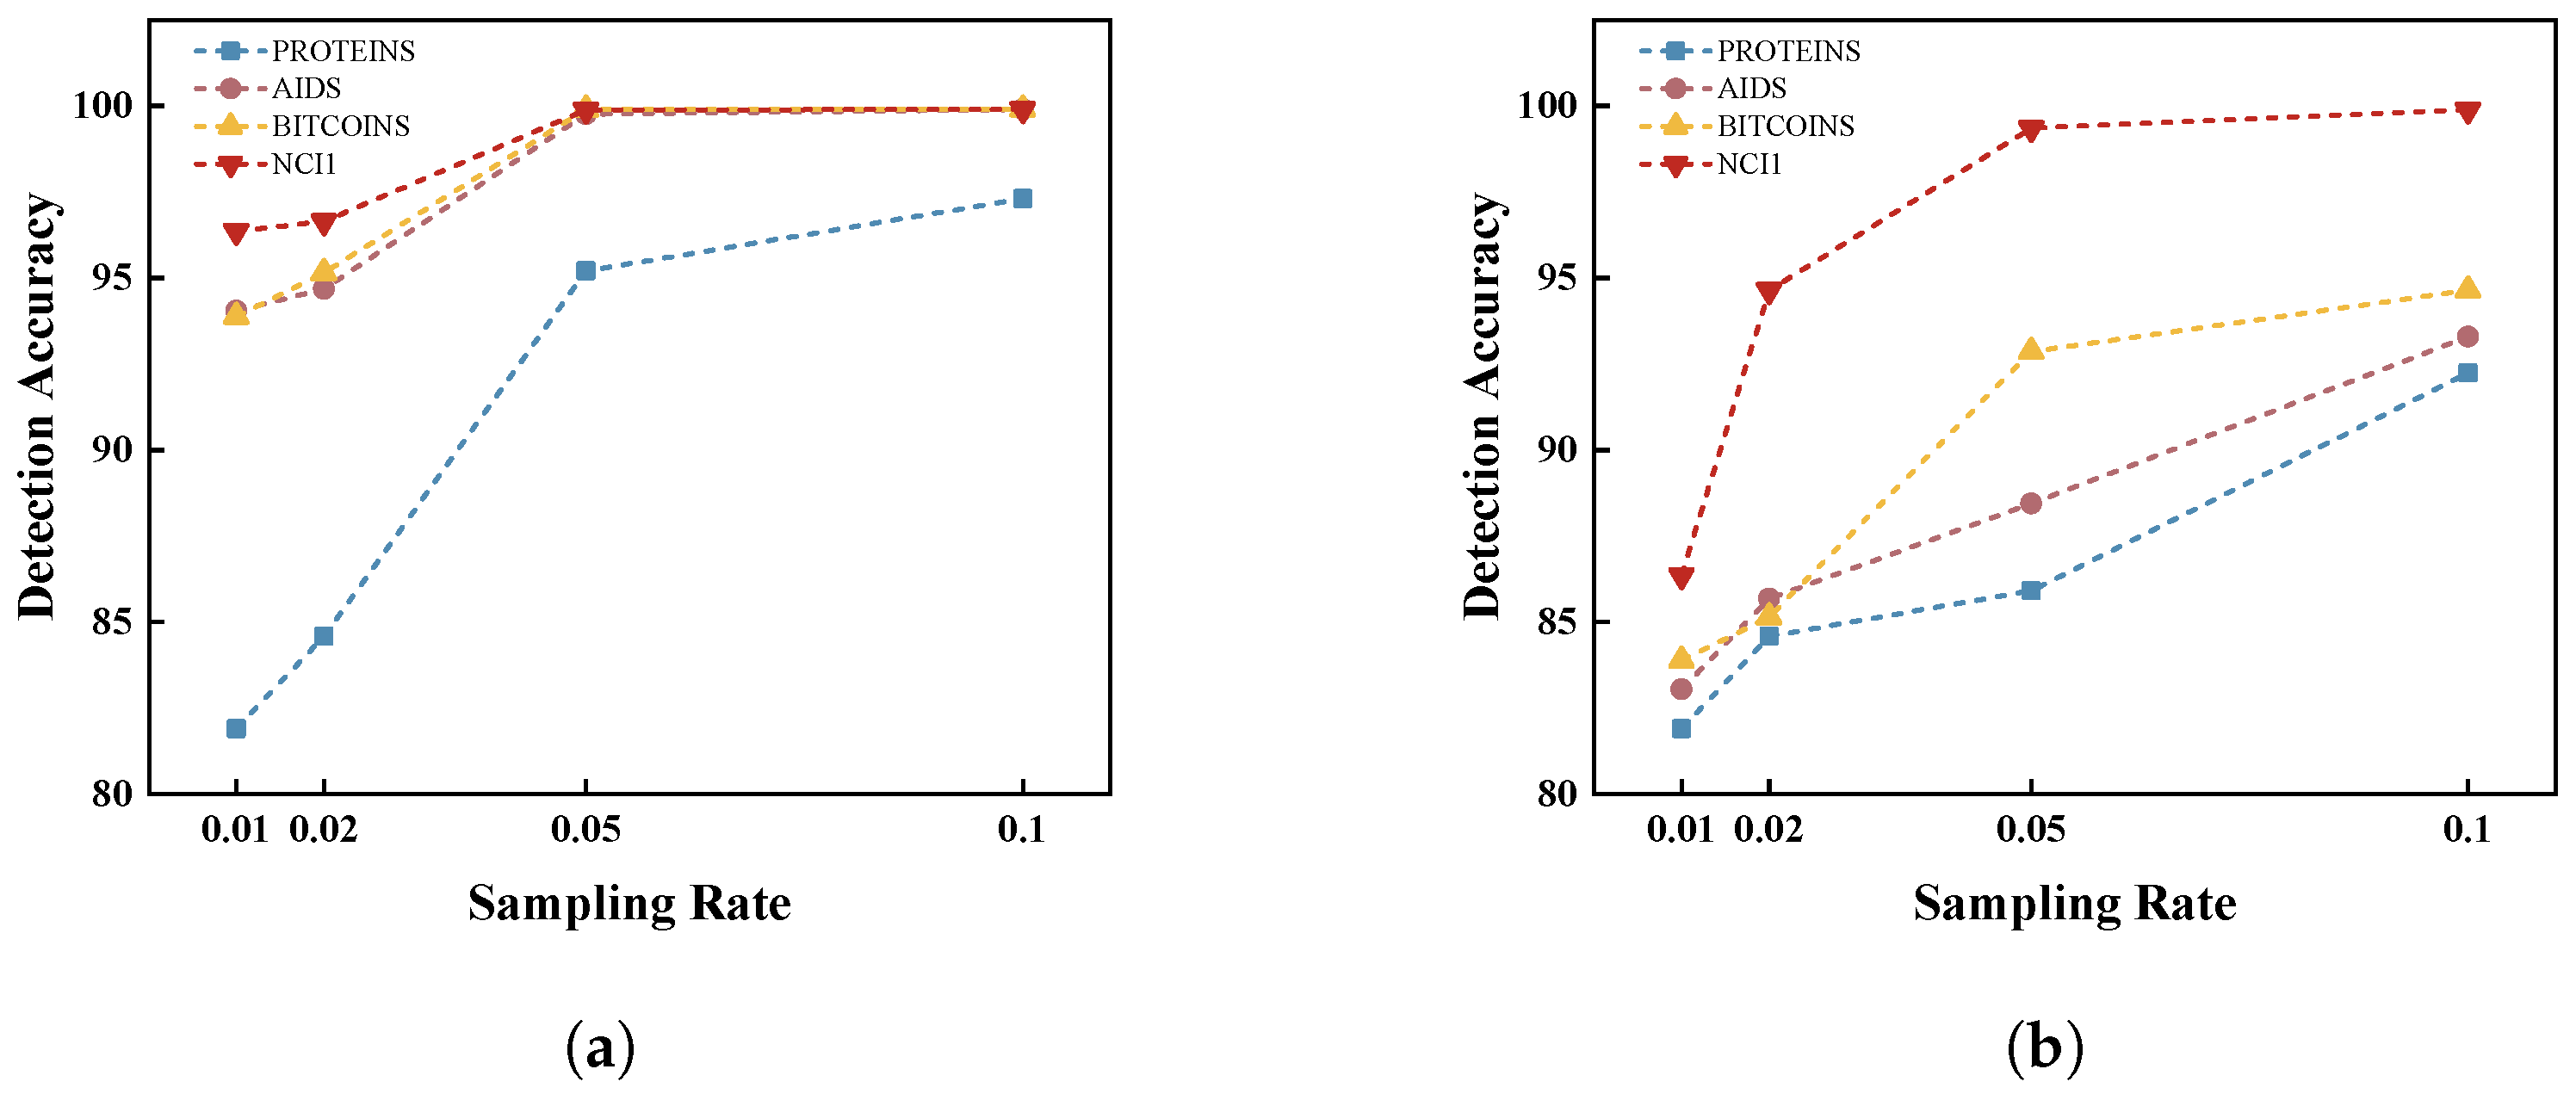
5.7. Exploration for Sampling Rate

In this subsection, we further explore the sensitivity of the sampling rate in auxiliary dataset D a u x for the symmetry knowledge filter. A high sampling rate can provide more accurate backdoor sample filtering, which benefits downstream backdoor removal tasks. However, an excessive sampling rate implies weaker defense constraints, which is inconsistent with practical defense operations.
As presented in Figure 8a,b, the benign and backdoor detection accuracy improves with increased sampling rates. Specifically, at a sampling rate of 0.05, benign detection accuracy reaches 97%, while backdoor detection accuracy hits 95%. Beyond this point, the benign detection accuracy plateaus, indicating that further improvements are negligible past a sampling rate of 0.05. Although backdoor detection accuracy continues to rise at higher sampling rates, achieving consistently high performance in realistic scenarios remains a challenge.
For instance, at a sampling rate of 0.1, we achieved a backdoor detection accuracy of approximately 98%, but the improvement from 0.05 to 0.1 represents diminishing returns, suggesting the threshold for practicality lies close to 0.05. These observations underscore the importance of a balanced approach; hence, we recommend maintaining a standard sampling rate of 0.05 for the auxiliary dataset to optimize both benign and backdoor detection performance in most cases.

6. Conclusions and Discussion

This paper presents the Symmetry-Aware Graph Self-Distillation Backdoor Defense (GSD-BD), specifically designed to sanitize backdoor perturbations by precisely extracting symmetry knowledge from shallow GNN layers. To quantify and capture the anomalous landscape, we propose the Logit Margin Rate as a supervisory signal for symmetry knowledge distillation. In contrast to existing defense strategies that compromised the sanitized graph structure and amplified noise, GSD-BD overcomes this limitation by adaptively calibrating the contributions between malicious and benign knowledge through a unsupervised symmetric knowledge filter combined with sanitization loss, thereby ensuring effective backdoor sanitization and preserving benign model behavior.
Comparative evaluations conducted on four real-world graph datasets validate the effectiveness of the proposed method, demonstrating that GSD-BD significantly outperforms state-of-the-art methods and effectively addresses the challenge of performance loss associated with defense mechanisms. Nevertheless, the proposed method may encounter scalability challenges when applied to very large-scale graphs. Despite the fact that the upstream backdoor knowledge filter is able to reduce the computational overheads to a certain extent, in the scenario of large graphs the graph self-distillation, the computation of the Logit Margin Rate may still be computationally expensive in practice. Additionally, GSD-BD relies on retaining shallow symmetry knowledge in the deeper layers, which may limit its efficacy against more sophisticated attacks that exploit deeper layers or more complex interactions between layers.
Future work will focus on enhancing the real-time performance of the model while maintaining its robustness, particularly in applications involving real-time defense scenarios. We propose the following strategies: (1) integrating global graph knowledge distillation and (2) leveraging representative features such as explanatory subgraphs and graph motifs to reduce the computational burden. Additionally, considering that GSD-BD involves the use of original graph data, which could elevate the risk of privacy concerns, especially in sensitive contexts like social networks or medical data, the incorporation of graph federated learning could prove beneficial.

Author Contributions

Conceptualization, L.W.; methodology, H.W.; software, H.W.; validation, L.W. and X.Y.; investigation, X.Y.; data curation, H.W.; writing—original draft, H.W.; writing—review and editing, H.W.; visualization, H.W.; supervision, L.W.; project administration, L.W.; funding acquisition, L.W. All authors have read and agreed to the published version of the manuscript.

Funding

This work was supported in part by the National Natural Science Foundation of China under Grant 62262004.

Data Availability Statement

AIDS, NCI1, and PROTEINS are available at https://paperswithcode.com/ (accessed on 12 June 2024). BITCOIN is available at https://github.com/zaixizhang/graphbackdoor (accessed on 12 June 2024).

Conflicts of Interest

The authors declare that this research was conducted in the absence of any commercial or financial relationships that could be construed as potential conflicts of interest.

References

  1. Kipf, T.N.; Welling, M. Semi-Supervised Classification with Graph Convolutional Networks. In Proceedings of the International Conference on Learning Representations, Toulon, France, 24–26 April 2017. [Google Scholar]
  2. Hamilton, W.; Ying, Z.; Leskovec, J. Inductive representation learning on large graphs. In Proceedings of the Advances in Neural Information Processing Systems 30, Long Beach, CA, USA, 4–9 December 2017; Volume 30. [Google Scholar]
  3. Xu, K.; Hu, W.; Leskovec, J.; Jegelka, S. How Powerful are Graph Neural Networks? In Proceedings of the International Conference on Learning Representations, New Orleans, LA, USA, 6–9 May 2019. [Google Scholar]
  4. Velickovic, P.; Cucurull, G.; Casanova, A.; Romero, A.; Lio, P.; Bengio, Y. Graph attention networks. arXiv 2017, arXiv:1710.10903. [Google Scholar]
  5. Qiu, J.; Tang, J.; Ma, H.; Dong, Y.; Wang, K.; Tang, J. Deepinf: Social influence prediction with deep learning. In Proceedings of the 24th ACM SIGKDD International Conference on Knowledge Discovery & Data Mining, London, UK, 19–23 August 2018; pp. 2110–2119. [Google Scholar]
  6. Wang, J.; Zhang, S.; Xiao, Y.; Song, R. A Review on Graph Neural Network Methods in Financial Applications. J. Data Sci. 2022, 20, 111–134. [Google Scholar] [CrossRef]
  7. Kearnes, S.; McCloskey, K.; Berndl, M.; Pande, V.; Riley, P. Molecular graph convolutions: Moving beyond fingerprints. J. Comput.-Aided Mol. Des. 2016, 30, 595–608. [Google Scholar] [CrossRef] [PubMed]
  8. Hu, W.; Liu, B.; Gomes, J.; Zitnik, M.; Liang, P.; Pande, V.; Leskovec, J. Strategies For Pre-training Graph Neural Networks. In Proceedings of the International Conference on Learning Representations (ICLR), Addis Ababa, Ethiopia, 26–30 April 2020. [Google Scholar]
  9. Hu, Z.; Dong, Y.; Wang, K.; Chang, K.W.; Sun, Y. Gpt-gnn: Generative pre-training of graph neural networks. In Proceedings of the 26th ACM SIGKDD International Conference on Knowledge Discovery & Data Mining, Virtual, 6–10 July 2020; pp. 1857–1867. [Google Scholar]
  10. Nassar, L.; Karray, F. Overview of the crowdsourcing process. Knowl. Inf. Syst. 2019, 60, 1–24. [Google Scholar] [CrossRef]
  11. Zhang, Z.; Jia, J.; Wang, B.; Gong, N.Z. Backdoor attacks to graph neural networks. In Proceedings of the 26th ACM Symposium on Access Control Models and Technologies, Virtual, 16–18 June 2021; pp. 15–26. [Google Scholar]
  12. Xu, J.; Xue, M.; Picek, S. Explainability-based backdoor attacks against graph neural networks. In Proceedings of the 3rd ACM Workshop on Wireless Security and Machine Learning, Miami, FL, USA, 15–17 May 2019; Association for Computing Machinery: New York, NY, USA, 2021; pp. 31–36. [Google Scholar]
  13. Xi, Z.; Pang, R.; Ji, S.; Wang, T. Graph backdoor. In Proceedings of the 30th USENIX Security Symposium (USENIX Security 21), Virtual, 11–13 August 2021; pp. 1523–1540. [Google Scholar]
  14. Zheng, H.; Xiong, H.; Chen, J.; Ma, H.; Huang, G. Motif-backdoor: Rethinking the backdoor attack on graph neural networks via motifs. IEEE Trans. Comput. Soc. Syst. 2023, 11, 2479–2493. [Google Scholar] [CrossRef]
  15. Dai, E.; Lin, M.; Zhang, X.; Wang, S. Unnoticeable backdoor attacks on graph neural networks. In Proceedings of the ACM Web Conference 2023, Austin, TX, USA, 30 April–4 May 2023; Association for Computing Machinery: New York, NY, USA, 2023; pp. 2263–2273. [Google Scholar]
  16. Wang, B.; Yao, Y.; Shan, S.; Li, H.; Viswanath, B.; Zheng, H.; Zhao, B.Y. Neural cleanse: Identifying and mitigating backdoor attacks in neural networks. In Proceedings of the 2019 IEEE Symposium on Security and Privacy (SP), San Francisco, CA, USA, 19–23 May 2019; pp. 707–723. [Google Scholar]
  17. Liu, Y.; Lee, W.C.; Tao, G.; Ma, S.; Aafer, Y.; Zhang, X. Abs: Scanning neural networks for back-doors by artificial brain stimulation. In Proceedings of the 2019 ACM SIGSAC Conference on Computer and Communications Security, London, UK, 11–15 November 2019; Association for Computing Machinery: New York, NY, USA, 2019; pp. 1265–1282. [Google Scholar]
  18. Li, Y.; Lyu, X.; Koren, N.; Lyu, L.; Li, B.; Ma, X. Neural Attention Distillation: Erasing Backdoor Triggers from Deep Neural Networks. In Proceedings of the International Conference on Learning Representations, Virtual, 3–7 May 2021. [Google Scholar]
  19. Xiang, Z.; Miller, D.J.; Kesidis, G. Detection of backdoors in trained classifiers without access to the training set. IEEE Trans. Neural Netw. Learn. Syst. 2020, 33, 1177–1191. [Google Scholar] [CrossRef]
  20. Wang, H.; Xiang, Z.; Miller, D.J.; Kesidis, G. Mm-bd: Post-training detection of backdoor attacks with arbitrary backdoor pattern types using a maximum margin statistic. In Proceedings of the 2024 IEEE Symposium on Security and Privacy (SP), San Francisco, CA, USA, 19–23 May 2024; pp. 1994–2012. [Google Scholar]
  21. Jiang, B.; Li, Z. Defending against backdoor attack on graph nerual network by explainability. arXiv 2022, arXiv:2209.02902. [Google Scholar]
  22. Sui, H.; Chen, B.; Zhang, J.; Zhu, C.; Wu, D.; Lu, Q.; Long, G. DMGNN: Detecting and Mitigating Backdoor Attacks in Graph Neural Networks. arXiv 2024, arXiv:2410.14105. [Google Scholar]
  23. Hinton, G. Distilling the Knowledge in a Neural Network. arXiv 2015, arXiv:1503.02531. [Google Scholar]
  24. Xu, X.; Zhou, F.; Zhang, K.; Liu, S. Ccgl: Contrastive cascade graph learning. IEEE Trans. Knowl. Data Eng. 2022, 35, 4539–4554. [Google Scholar] [CrossRef]
  25. Feng, K.; Li, C.; Yuan, Y.; Wang, G. Freekd: Free-direction knowledge distillation for graph neural networks. In Proceedings of the 28th ACM SIGKDD Conference on Knowledge Discovery and Data Mining, Washington, DC, USA, 14–18 August 2022; Association for Computing Machinery: New York, NY, USA, 2022; pp. 357–366. [Google Scholar]
  26. Yan, B.; Wang, C.; Guo, G.; Lou, Y. Tinygnn: Learning efficient graph neural networks. In Proceedings of the 26th ACM SIGKDD International Conference on Knowledge Discovery & Data Mining, Virtual, 6–10 July 2020; pp. 1848–1856. [Google Scholar]
  27. Chen, Y.; Bian, Y.; Xiao, X.; Rong, Y.; Xu, T.; Huang, J. On self-distilling graph neural network. arXiv 2020, arXiv:2011.02255. [Google Scholar]
  28. Li, G.; Xiong, C.; Thabet, A.; Ghanem, B. Deepergcn: All you need to train deeper gcns. arXiv 2020, arXiv:2006.07739. [Google Scholar]
  29. Chen, W.; Wu, B.; Wang, H. Effective backdoor defense by exploiting sensitivity of poisoned samples. Adv. Neural Inf. Process. Syst. 2022, 35, 9727–9737. [Google Scholar]
  30. Yang, Y.; Qiu, J.; Song, M.; Tao, D.; Wang, X. Distilling knowledge from graph convolutional networks. In Proceedings of the IEEE/CVF Conference on Computer Vision and Pattern Recognition, Seattle, WA, USA, 13–19 June 2020; pp. 7074–7083. [Google Scholar]
  31. Joshi, C.K.; Liu, F.; Xun, X.; Lin, J.; Foo, C.S. On representation knowledge distillation for graph neural networks. IEEE Trans. Neural Netw. Learn. Syst. 2022, 35, 4656–4667. [Google Scholar] [CrossRef]
  32. Yang, C.; Liu, J.; Shi, C. Extract the knowledge of graph neural networks and go beyond it: An effective knowledge distillation framework. In Proceedings of the Web Conference 2021, Virtual, 19—23 April 2021; Association for Computing Machinery: New York, NY, USA, 2021; pp. 1227–1237. [Google Scholar]
  33. Wu, L.; Lin, H.; Gao, Z.; Zhao, G.; Li, S.Z. A Teacher-Free Graph Knowledge Distillation Framework with Dual Self-Distillation. IEEE Trans. Knowl. Data Eng. 2024, 36, 4375–4385. [Google Scholar] [CrossRef]
  34. Wang, H.; Liu, T.; Sheng, Z.; Li, H. Explanatory subgraph attacks against Graph Neural Networks. Neural Netw. 2024, 172, 106097. [Google Scholar] [CrossRef]
  35. Zeng, Y.; Chen, S.; Park, W.; Mao, Z.; Jin, M.; Jia, R. Adversarial Unlearning of Backdoors via Implicit Hypergradient. In Proceedings of the International Conference on Learning Representations, Virtual, 25–29 April 2022. [Google Scholar]
  36. Liu, K.; Dolan-Gavitt, B.; Garg, S. Fine-pruning: Defending against backdooring attacks on deep neural networks. In International Symposium on Research in Attacks, Intrusions, and Defenses; Springer: Cham, Switzerland, 2018; pp. 273–294. [Google Scholar]
  37. Guo, W.; Wang, L.; Xing, X.; Du, M.; Song, D. Tabor: A highly accurate approach to inspecting and restoring trojan backdoors in ai systems. arXiv 2019, arXiv:1908.01763. [Google Scholar]
  38. Yang, X.; Li, G.; Tao, X.; Zhang, C.; Li, J. Black-Box Graph Backdoor Defense. In International Conference on Algorithms and Architectures for Parallel Processing; Springer: Cham, Switzerland, 2023; pp. 163–180. [Google Scholar]
  39. Rossi, R.; Ahmed, N. The network data repository with interactive graph analytics and visualization. In Proceedings of the AAAI Conference on Artificial Intelligence, Austin, TX, USA, 25–30 January 2015; Volume 29. [Google Scholar]
  40. Borgwardt, K.M.; Ong, C.S.; Schönauer, S.; Vishwanathan, S.; Smola, A.J.; Kriegel, H.P. Protein function prediction via graph kernels. Bioinformatics 2005, 21, i47–i56. [Google Scholar] [CrossRef]
  41. Weber, M.; Domeniconi, G.; Chen, J.; Weidele, D.K.I.; Bellei, C.; Robinson, T.; Leiserson, C. Anti-Money Laundering in Bitcoin: Experimenting with Graph Convolutional Networks for Financial Forensics. In Proceedings of the ACM SIGKDD International Conference on Knowledge Discovery and Data Mining, Anchorage, AK, USA, 4–8 August 2019. [Google Scholar]
  42. Shervashidze, N.; Schweitzer, P.; Van Leeuwen, E.J.; Mehlhorn, K.; Borgwardt, K.M. Weisfeiler-lehman graph kernels. J. Mach. Learn. Res. 2011, 12, 2539–2561. [Google Scholar]
  43. Chen, J.; Zhang, D.; Ming, Z.; Huang, K.; Jiang, W.; Cui, C. GraphAttacker: A general multi-task graph attack framework. IEEE Trans. Netw. Sci. Eng. 2021, 9, 577–595. [Google Scholar] [CrossRef]
  44. Chen, J.; Lin, X.; Xiong, H.; Wu, Y.; Zheng, H.; Xuan, Q. Smoothing adversarial training for GNN. IEEE Trans. Comput. Soc. Syst. 2020, 8, 618–629. [Google Scholar] [CrossRef]
Figure 1. Illustration of graph backdoor attack. The backdoored GNN activates the backdoor (i.e., the red subgraphs) and misleads the model towards the target results determined by the attacker while behaving normally on benign samples.
Symmetry 17 00735 g001
Figure 2. Illustration of the procedure for perturbation detection. The defender receives a poisoned classifier with a independent auxiliary dataset and a possibly poisoned training dataset. The Logit Margin rate of the individual sample was evaluated using an auxiliary dataset to identify potentially perturbed graphs.
Symmetry 17 00735 g002
Figure 3. Illustration of backdoor defense based on GSD-BD, where the Logit Margin Rate is calculated across GNN layers to detect and defend against backdoor graphs, followed by fine-tuning based on total loss for backdoor sanitization to enhance model robustness.
Symmetry 17 00735 g003
Figure 4. Attack success rates (ASRs) with/without GSD-BD against different poisoning rates. (a) PROTEINS. (b) AIDS. (c) BITCOIN. (d) NCI1.
Symmetry 17 00735 g004
Figure 5. Average LMR across four GNN layers with/without the GSD-BD: (a) layer-1, (b) layer-2, (c) layer-3, (d) layer-4. The blue lines depict baseline LMR values (undefended model), while orange lines represent the counterparts with GSD-BD defense. The introduction of GSD-BD leads to a noticeable increase in average LMR over the training epochs across all layers, suggesting reliable backdoor sanitization through asymmetry knowledge.
Symmetry 17 00735 g005
Figure 6. The distribution of the LMR in benign, attacked, and defensed scenarios. Each group features a boxplot combined with density plot visualizations. Backdoor-attacked samples (orange) demonstrate the LMR for backdoored samples, showing a higher average and wider range, indicating significant variation in model responses to attacks. Defense samples (blue) exhibiting reductions in LMR values compared to the backdoor scenario, suggesting effective mitigation of the attack. Benign samples (green) exhibit a lower and more compact range of LMR values, indicating consistent model outputs for legitimate inputs.
Symmetry 17 00735 g006
Figure 7. (a) Average defense rate (ADR) comparison with different λ settings. (b) Classification accuracy (ACC) comparison with different λ settings.
Symmetry 17 00735 g007
Figure 8. Performance of symmetry knowledge filter with different sampling rates: (a) benign detection accuracy, (b) backdoor detection accuracy.
Symmetry 17 00735 g008
Table 1. Summary of commonly used notations.
NotationsDescriptions
D Entire dataset
D p Backdoor dataset
NGraph number of dataset
G = ( A , X ) Graph data
G p Trigger-embedded graph
X Node feature representation of a graph
A Adjacency matrix of a graph
A Identified backdoor graph set
N Identified benign graph set
f ( · ) GNN model
ϕ ( · ) Logit output of the input graph
yGround-truth label of a graph
y t Target label of a graph
M G l LMR for a given graph sample at layer-l
Table 2. Dataset statistics.
Datasets# Graphs# ClassesAvg. # NodesAvg. # Edges# Graphs in Class# Target Label
PROTEINS1113239.0672.82663[0], 450[1]1
BITCOIN1174214.6414.18845[0], 329[1]0
AIDS2000215.6916.20400[0], 1600[1]1
NCI14110229.8732.302053[0], 2057[1]0
Table 3. Benign model accuracy (ACC) and backdoor models performance for three baseline backdoor attack algorithms (ASR and CAD).
ModelDatasetACC (%)ASR (%)CAD ( × 10 2 )
GBAMIAGTAGBAMIAGTA
GCNPROTEINS75.1851.0667.3672.914.504.666.63
AIDS97.6469.4273.0394.754.605.014.78
BITCOIN97.9176.5374.9484.116.875.438.10
NCI178.7575.3379.7294.344.604.542.96
GINPROTEINS76.3260.7359.2583.844.753.495.23
AIDS98.1978.9481.3396.674.253.873.39
BITCOIN96.6679.0682.5086.674.753.243.91
NCI176.8975.9793.6797.074.082.793.11
Table 4. Evaluation metrics for backdoor defense against different backdoor attack algorithms for GCN.
DatasetAttackADR (%)CAD ( × 10 2 )
PrunePrune+LDExp-BDDMGNNGSD-BDPrunePrune+LDExp-BDDMGNNGSD-BD
PROTEINSGBA50.5851.8468.5669.2684.846.235.974.544.253.54
MIA41.1644.7671.6969.6384.086.316.785.175.084.37
GTA37.2646.8365.7564.1883.557.277.035.145.214.66
AIDSGBA52.6153.9469.2571.9485.605.475.486.365.224.94
MIA48.1448.5874.3672.0884.205.516.175.245.224.85
GTA36.1743.3763.4071.1486.855.536.016.194.984.06
BITCOINGBA43.4548.6860.2870.7887.397.457.036.625.583.82
MIA48.6449.1066.1274.6585.206.617.246.495.512.25
GTA39.5545.2859.9772.4188.037.567.176.385.474.57
NCI1GBA43.3944.2869.1771.1693.724.765.584.714.262.35
MIA41.2441.3577.5379.2293.565.715.584.714.742.09
GTA38.1741.4471.3069.6393.984.625.165.424.952.06
Table 5. Evaluation metrics for backdoor defense against different backdoor attack algorithms for GIN.
DatasetAttackADR (%)CAD ( × 10 2 )
PrunePrune+LDExp-BDDMGNNGSD-BDPrunePrune+LDExp-BDDMGNNGSD-BD
PROTEINSGBA52.3352.8164.9371.2184.806.196.635.664.473.62
MIA39.5044.0567.7968.1486.956.286.166.084.142.94
GTA37.4246.6463.3169.4384.406.755.816.284.893.21
AIDSGBA54.2954.7168.0073.1686.145.885.435.925.194.06
MIA46.5349.1874.9475.2584.264.345.206.135.753.29
GTA41.7145.2264.6871.1485.604.134.056.364.983.32
BITCOINGBA43.3345.2361.3671.3178.346.896.176.266.363.18
MIA45.2150.1766.1269.3685.766.344.956.195.803.79
GTA41.6242.7657.0566.1386.616.035.615.956.273.25
NCI1GBA40.1344.8764.2076.1693.515.415.115.005.063.22
MIA37.7141.5272.4472.2192.215.393.694.504.642.07
GTA36.2739.3671.4171.2895.864.984.244.964.722.51
Table 6. Performance of symmetry knowledge filter.
GCNGIN
AccuracyGBAMIAGTAGBAMIAGTA
PROTEINS95.1695.3690.0591.2195.9491.06
AIDS98.5098.4394.1099.3599.7899.56
BITCOIN99.9198.1896.3899.8799.2198.94
NCI199.9999.8499.6299.9999.8498.83
PrecisionGBAMIAGTAGBAMIAGTA
PROTEINS91.3691.7285.9184.4593.8589.38
AIDS97.6796.8688.4492.0299.5699.99
BITCOIN99.9995.3792.8699.9999.3498.67
NCI199.9993.4099.3599.9999.6999.99
RecallGBAMIAGTAGBAMIAGTA
PROTEINS98.8998.9294.7297.6497.9492.49
AIDS99.3299.9999.7399.6799.9999.14
BITCOIN99.8399.9999.8999.7599.0899.21
NCI199.9996.1699.8999.9999.9999.67
F1-scoreGBAMIAGTAGBAMIAGTA
PROTEINS94.9795.1890.1090.5795.8590.91
AIDS98.4998.4093.7499.3499.7899.56
BITCOIN99.9197.6396.2599.8799.2198.94
NCI199.9994.7699.6299.9999.8499.83
Disclaimer/Publisher’s Note: The statements, opinions and data contained in all publications are solely those of the individual author(s) and contributor(s) and not of MDPI and/or the editor(s). MDPI and/or the editor(s) disclaim responsibility for any injury to people or property resulting from any ideas, methods, instructions or products referred to in the content.

