Article

Parameter Calibration and Experimental Validation of Fermented Grain Particles During the Loading Process Based on the Discrete Element Model

1
School of Mechanical Engineering, Taiyuan University of Science and Technology, Taiyuan 030024, China
2
Shanxi Electronic Science and Technology Institute, College of Intelligent Manufacturing Industry, Linfen 041000, China
*
Author to whom correspondence should be addressed.
Symmetry 2025, 17(5), 729; https://doi.org/10.3390/sym17050729
Submission received: 5 April 2025 / Revised: 2 May 2025 / Accepted: 7 May 2025 / Published: 9 May 2025
(This article belongs to the Section Life Sciences)

Abstract

:
This study presents a systematic calibration of discrete element model (DEM) parameters for fermented grains (19.4% moisture) using the Hertz–Mindlin with JKR contact model to optimize robotic end-effector design in liquor distillation. By integrating cylinder lift experiments and response surface methodology, we identified three critical parameters (JKR surface energy, restitution, and rolling friction coefficients) through Plackett–Burman screening and steepest ascent optimization. The Box–Behnken design derived optimal values of 0.0429 J/m2 surface energy, 0.183 restitution coefficient, and 0.216 rolling friction coefficient. The validation results demonstrated excellent agreement between the simulated and experimental angles of repose (AORs), with a simulated AOR of 36.805° and an experimental value of 36.412°, corresponding to a 1.08% error. The geometric congruence of the deposition morphology and the notable symmetrical distribution characteristics of the left and right angles of repose confirm the robustness of the parameter calibration methodology. This study provides a theoretical basis for the kinematic parameter optimization of the end-effector distribution mechanism in fermented grain-loading robots, providing critical insights for advancing automated control in solid-state liquor distillation processes.

1. Introduction

Chinese Baijiu, the sole representative of solid-state fermentation among the world’s six major distilled spirits, owes its complex flavor to a unique open-system, multi-strain fermentation [1,2]. In the distillation process, feeding the distilling bucket is crucial and requires spreading fermented grains evenly after steam detection [3,4], which boosts alcohol extraction and liquor quality. However, traditional manual spreading, relying on operator-based empirical parameters, has drawbacks. It is labor-intensive, challenging for operators under high-temperature, high-humidity conditions, and lacks process parameter standardization. These deficiencies significantly compromise their suitability for modern industrial production demands [5]. While the engineering implementation of robotic retorting technology offers innovative solutions to address traditional process limitations, existing systems remain constrained by critical technical challenges, including excessive layer thickness and suboptimal surface uniformity during material distribution, which hinder compliance with precision process requirements. Therefore, characterizing the particle–mechanism interactions between fermented grain particles and the end-effector distribution mechanism in fermented grain-loading robots has become a pivotal methodology for optimizing the design of robotic steaming end-effector distribution devices.
The discrete element method (DEM), a critical numerical tool for investigating granular material mechanics, relies decisively on parameter calibration accuracy to ensure simulation fidelity [6,7,8]. Recent advances in granular mechanics have driven substantial research efforts toward precision calibration methodologies for discrete element model parameters. Ding Xinting et al. calibrated pumpkin seed contact parameters using angle of repose experiments with 3D contour reconstruction [9]. Zhao Liang et al. employed funnel-based angle of repose measurements for coconut coir particle calibration [10]. Addressing the complex mechanics of cohesive soils and aggregates, Chen Zhifan et al. developed a shear-test-driven calibration protocol [11]. Balevicius quantified pea–glass interfacial static friction coefficients through sliding tests [12], while Xia et al. implemented the Box–Behnken experimental design to optimize multi-objective calibration workflows for coal particles [13]. However, current research predominantly focuses on non-cohesive or weakly cohesive granular systems. There has been relatively little research on discrete element modeling and parameter calibration methods for fermented grain particle materials with high cohesiveness.
This study investigates the dynamic stacking behavior of fermented grain particles during the process of distilling bucket feeding operation, proposing a multiscale parameter optimization framework integrating physical experimentation and numerical simulation. By developing a Hertz–Mindlin contact model with JKR adhesion and utilizing angle of repose measurements obtained through the cylinder-lift method, we systematically screened, optimized, and validated discrete element parameters. The findings establish a theoretical foundation for optimizing kinematic parameters in the end-effector distribution mechanism of fermented grain-loading robots, offering significant scientific implications for enhancing automation precision in solid-state fermentation processes.

2. Materials and Methods

2.1. Experimental Materials and Fundamental Parameters

The experimental materials used in this study were fermented grains obtained from the distillation workshop of a distillery in Shanxi Province. The workshop employs the traditional solid-state distillation process, with the ambient temperature controlled within the range of 25–32 °C and the relative humidity maintained at 60–70%. Under these temperature and humidity conditions, the physical properties of the fermented grain particles, such as the moisture content and the inter-particle adhesion force, exhibit a stable state. To ensure the reliability and consistency of the experimental data, subsequent angle of repose experiments were conducted in accordance with these environmental parameters so as to effectively control the variables and enhance the scientificity and repeatability of the experimental results.
The feedstock formulation comprised sorghum as the principal component (85% w/w) and rice hulls as the structural adjunct (15% w/w). The sorghum kernels underwent mechanical milling to generate lobed particles (4/6/8 divisions), classified as granular sorghum grits. This comminution protocol increased the specific surface area to enhance enzymatic accessibility during saccharification, and optimized ethanol diffusion pathways for subsequent distillation. Rice husk was incorporated as an adjuvant material to enhance its permeability.
The bulk density of fermented grains was determined to be 853 kg/m3 using the cylinder immersion method, while the moisture content was quantified to be 19.4% via the oven-drying method. Given the ethanol-induced corrosion potential inherent in fermented grains and compliance requirements with food-grade machinery standards, critical components of the end-effector distribution mechanism were fabricated from 304 stainless steel. The material parameters were established through literature review and the EDEM material database. For 304 stainless steel, the density, Poisson’s ratio, and shear modulus were determined to be 7930 kg/m3, 0.29, and 7.7 × 10¹⁰ Pa, respectively. Corresponding particle parameters for fermented grains were determined as a Poisson’s ratio of 0.32 and shear modulus of 5 × 10⁷ Pa [14,15].

2.2. JKR Contact Model

In the parameter calibration process of the discrete element model for fermented grain particles, the rational selection of contact models plays a critical role in accurately describing cohesive behaviors. In the discrete element method (DEM) simulation, the selection of contact models for cohesive particle systems mainly includes three models: Hertz–Mindlin with JKR, Hertz–Mindlin with Cohesion, and Linear Cohesion. The Cohesion model uses a constant cohesion parameter, but ignores the influence of the contact area on the adhesive force, resulting in a simulation error of the angle of repose exceeding 5° [16]. In contrast, based on the surface energy theory, the JKR model can accurately characterize the coupling effect between the adhesive force and the contact deformation, and the simulation error for highly cohesive particles can be controlled within 3% [17,18,19]. Although the Linear Cohesion model has high computational efficiency, it is only applicable to weakly cohesive particle systems. Therefore, for the precise simulation of highly cohesive particles, the JKR model becomes the preferred choice due to its accuracy in physical representation and the reliability of parameter calibration.

2.3. Particle Discrete Element Modeling and Parameter Settings

2.3.1. Discrete Element Modeling of Particle

To more accurately simulate the irregular characteristics of fermented grains, in this study, discrete element models were developed for granular sorghum grits and rice husks in fermented grains based on particle modeling methodologies from the existing literature [20,21,22,23]. Initially, the geometric features of sorghum particles and rice husks were quantified through microscopic image analysis, with their characteristic dimensions determined based on statistical averaging, as illustrated in Figure 1a,c. Non-spherical particle models were subsequently constructed using the multi-sphere assembly method, as shown in Figure 1b,d. However, geometrical modeling of rice husks with intricate thin-walled architectures (thickness: 23–30 μm) posed challenges in EDEM simulations. To resolve this, we implemented parametric equivalence modeling using a hollow geometric model based on mass–volume–density conservation principles.

2.3.2. Simulation Parameter Settings

As shown in Figure 2, an inclined plane sliding test was employed to determine the static friction coefficient between fermented grains particles and stainless steel. During the experiment, a stainless steel plate was tilted incrementally until the fermented grains particles began to slide, at which point the critical angle of inclination was recorded. The test was repeated 10 times to minimize random errors, and the average value was taken as the measurement result. The static friction coefficient was determined by calculating the tangent of the critical angle, yielding a value of 0.73.
Current research on fermented grain particles remains incomplete, particularly regarding the critical parameters required for constructing DEM simulation models. Significant gaps persist in the determination of key material properties, such as the coefficient of restitution and rolling friction coefficient. Through systematic literature studies and analysis using the GEMM material database [24,25,26], this study has established well-defined value ranges for these parameters requiring calibration, as detailed in Table 1. Among them, for biomass particles (such as grains and fermented materials), the surface energy is usually between 0.01 and 0.1 J/m2 [27]. Due to the sticky organic substances generated on the surface of the particles during the fermentation process, which enhance the adhesion between the particles, the surface energy is set to be between 0.02 and 0.05. For soft biomass particles with a moisture content of 15% to 30%, the coefficients of restitution calibrated through collision tests generally fall within the range of 0.1 to 0.5 [28,29]. Since the moisture content of the fermented grains is 19.4%, the coefficient of restitution is set to be between 0.15 and 0.35.

2.4. Angle of Repose for Fermented Grain Particle

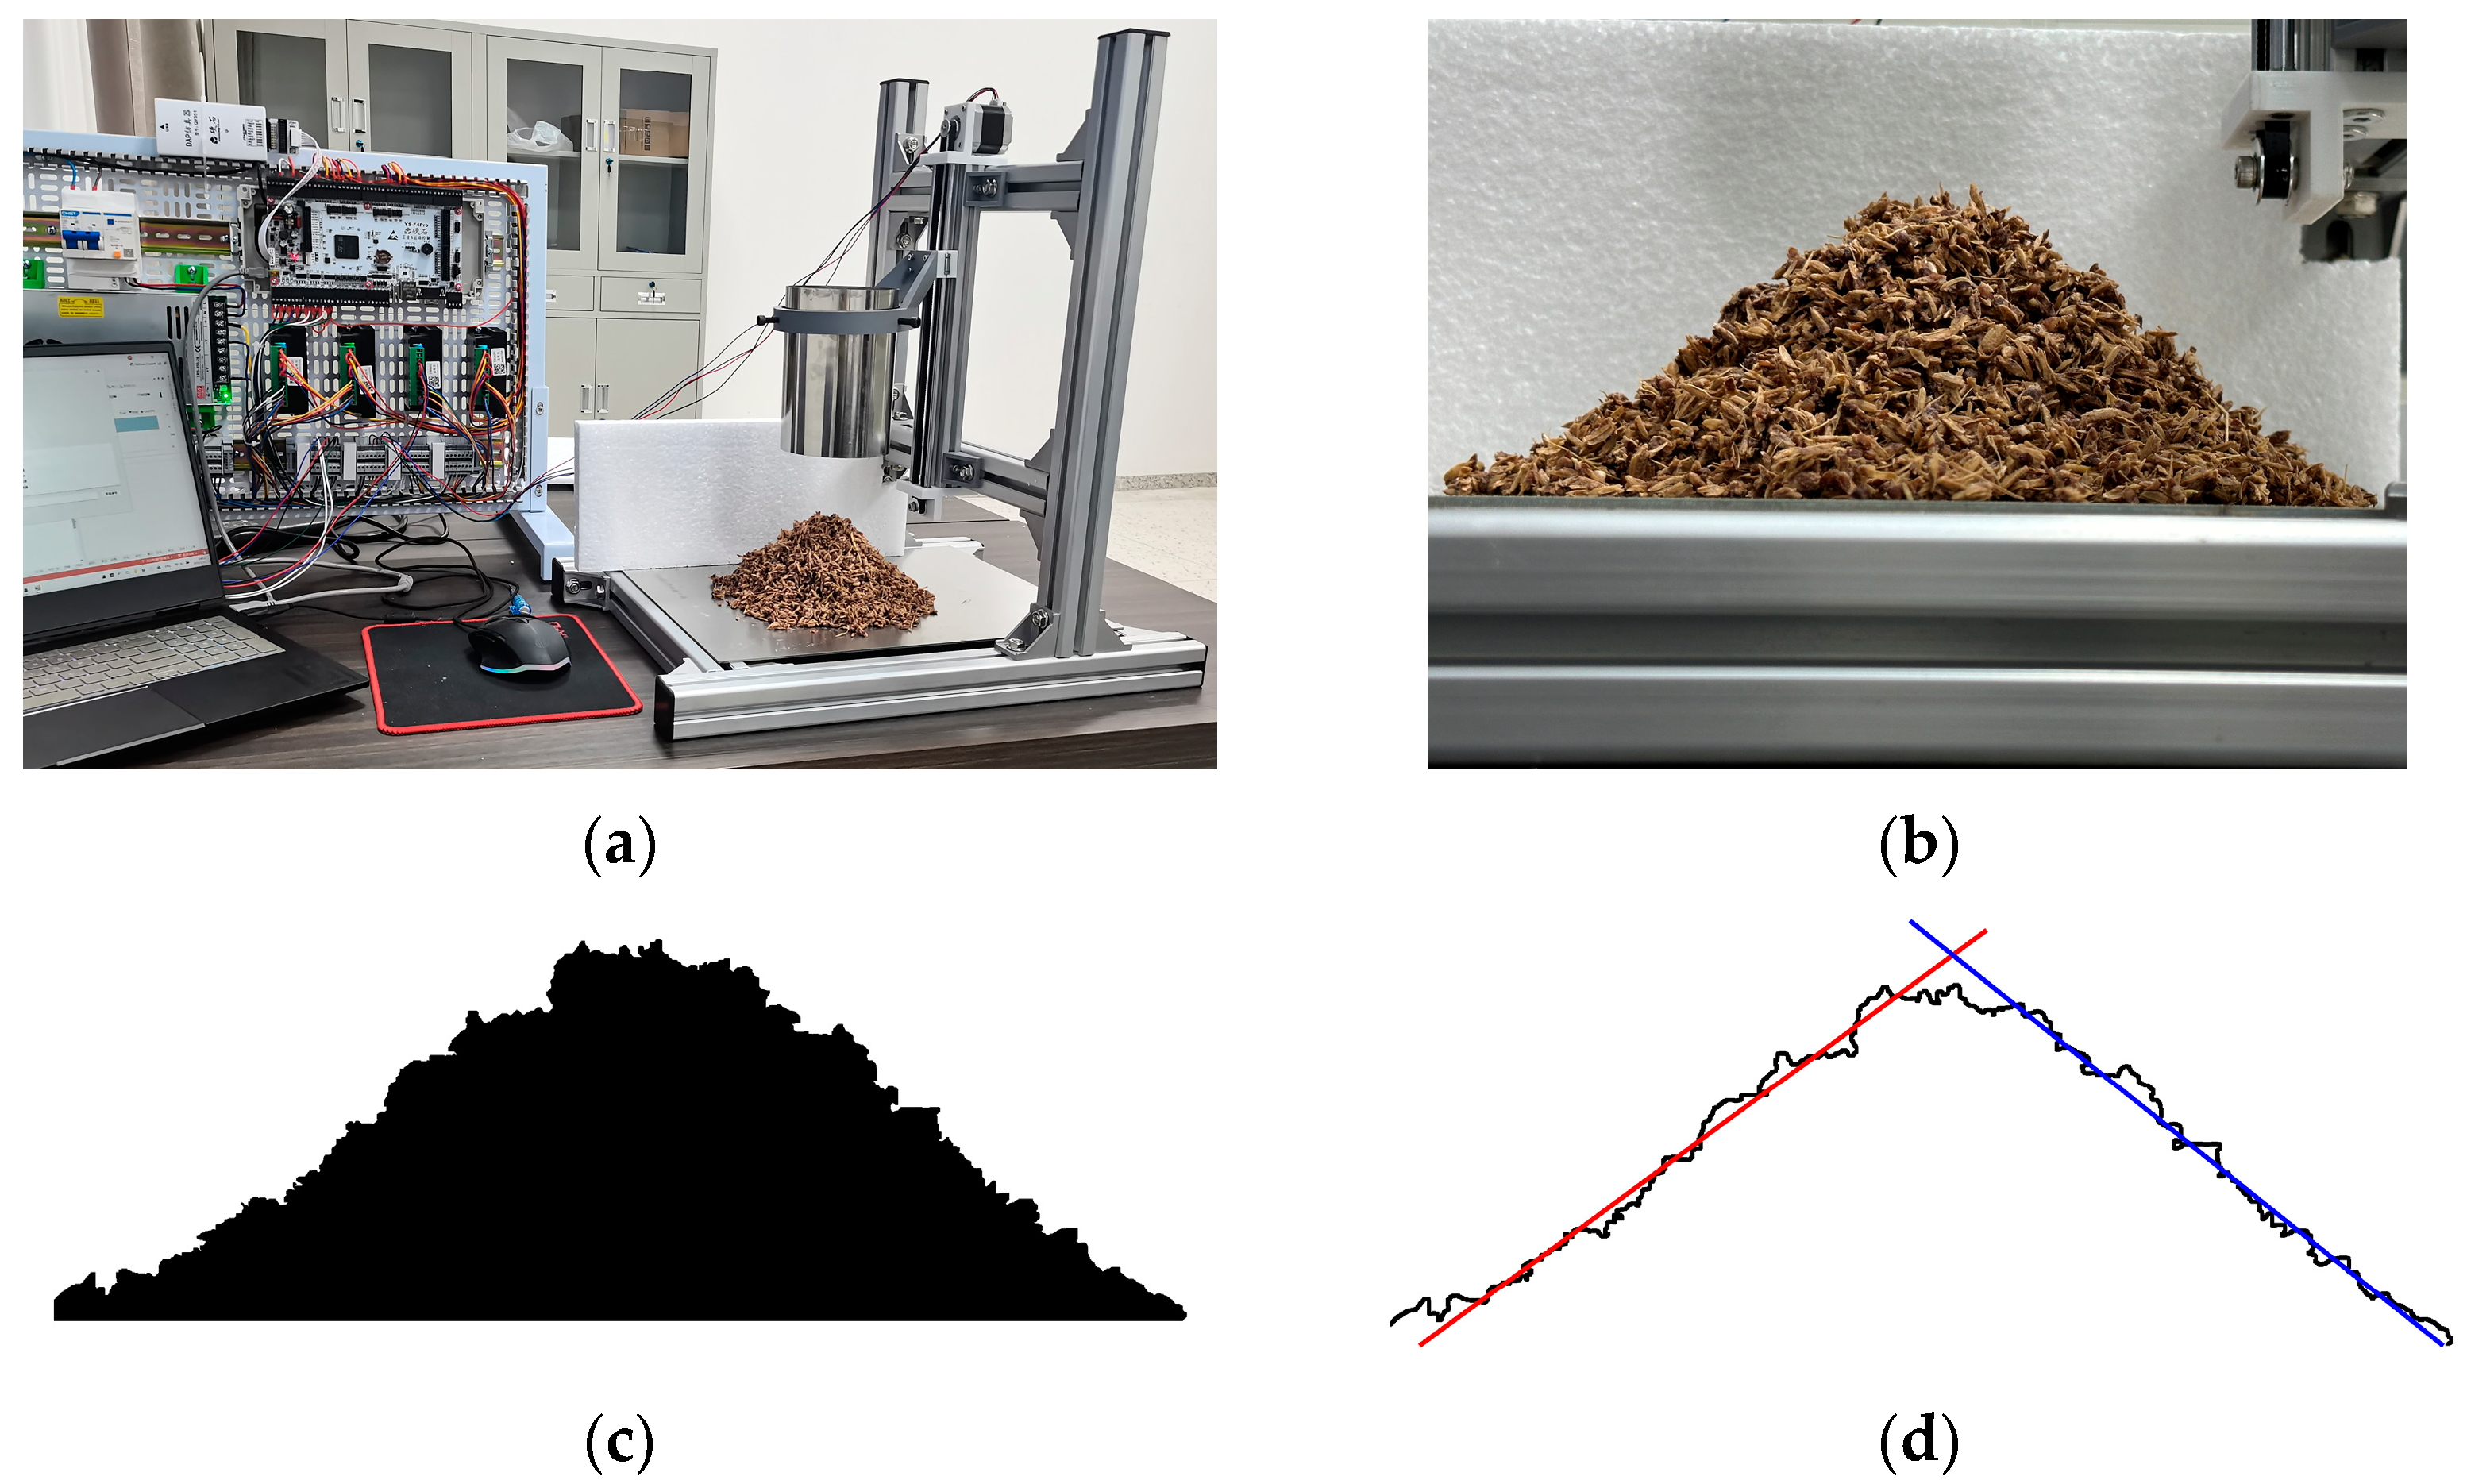
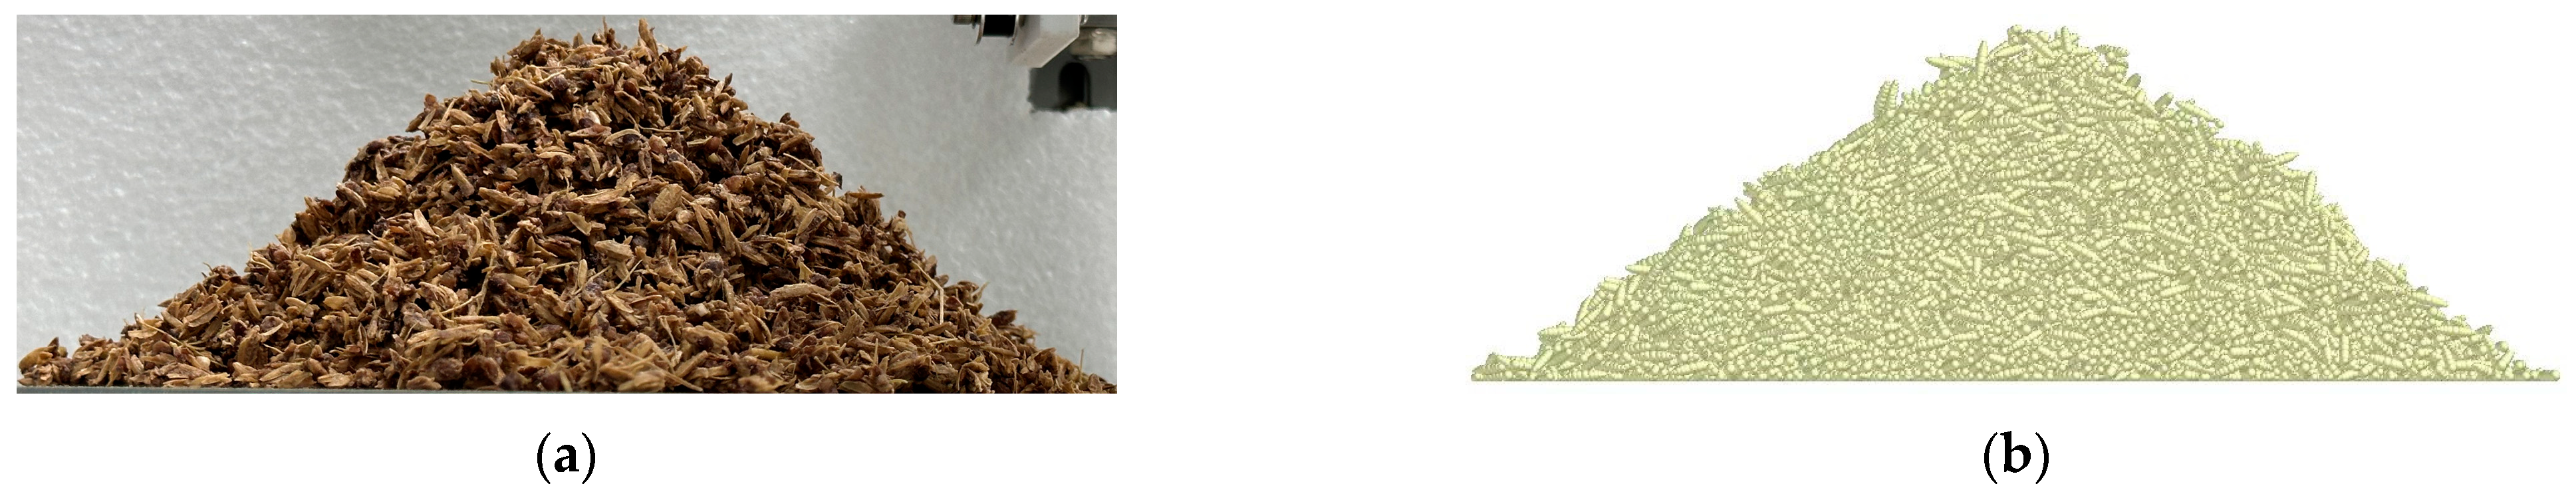
2.4.1. Angle of Repose Physical Experiment

The cylinder-lifting method was employed to characterize the static angle of repose of cohesive fermented grain particles [30,31,32]. As shown in Figure 3a, a 304 stainless steel cylinder with a 100 mm inner diameter and 150 mm length served as the containment vessel. Precise particle loading ensured that the material surface remained flush with the cylinder rim to prevent spillage interference. A computer-controlled stepper motor system vertically elevated the cylinder at a constant velocity of 0.05 m/s, allowing gravitational deposition onto a stainless-steel substrate to form stable accumulations. The deposition image is shown in Figure 3b.
The digital image preprocessing was conducted using Python 3.8, implementing Gaussian filtering for noise reduction, grayscale conversion, and adaptive threshold binarization. The preprocessing results are shown in Figure 3c. Subsequently, particle accumulation profiles were extracted via Canny edge detection within the MATLAB R2021a Image Processing Toolbox. The static angle of repose was calculated through cubic spline interpolation combined with weighted least squares fitting along the basal contact boundary [33,34,35]. The edge-detection and fitting processes are illustrated in Figure 3d. Under controlled environmental conditions (25.0 ± 0.5 °C, 45 ± 3% RH), ten replicate trials yielded a mean static angle of repose of 36.412° for the fermented grain particles.

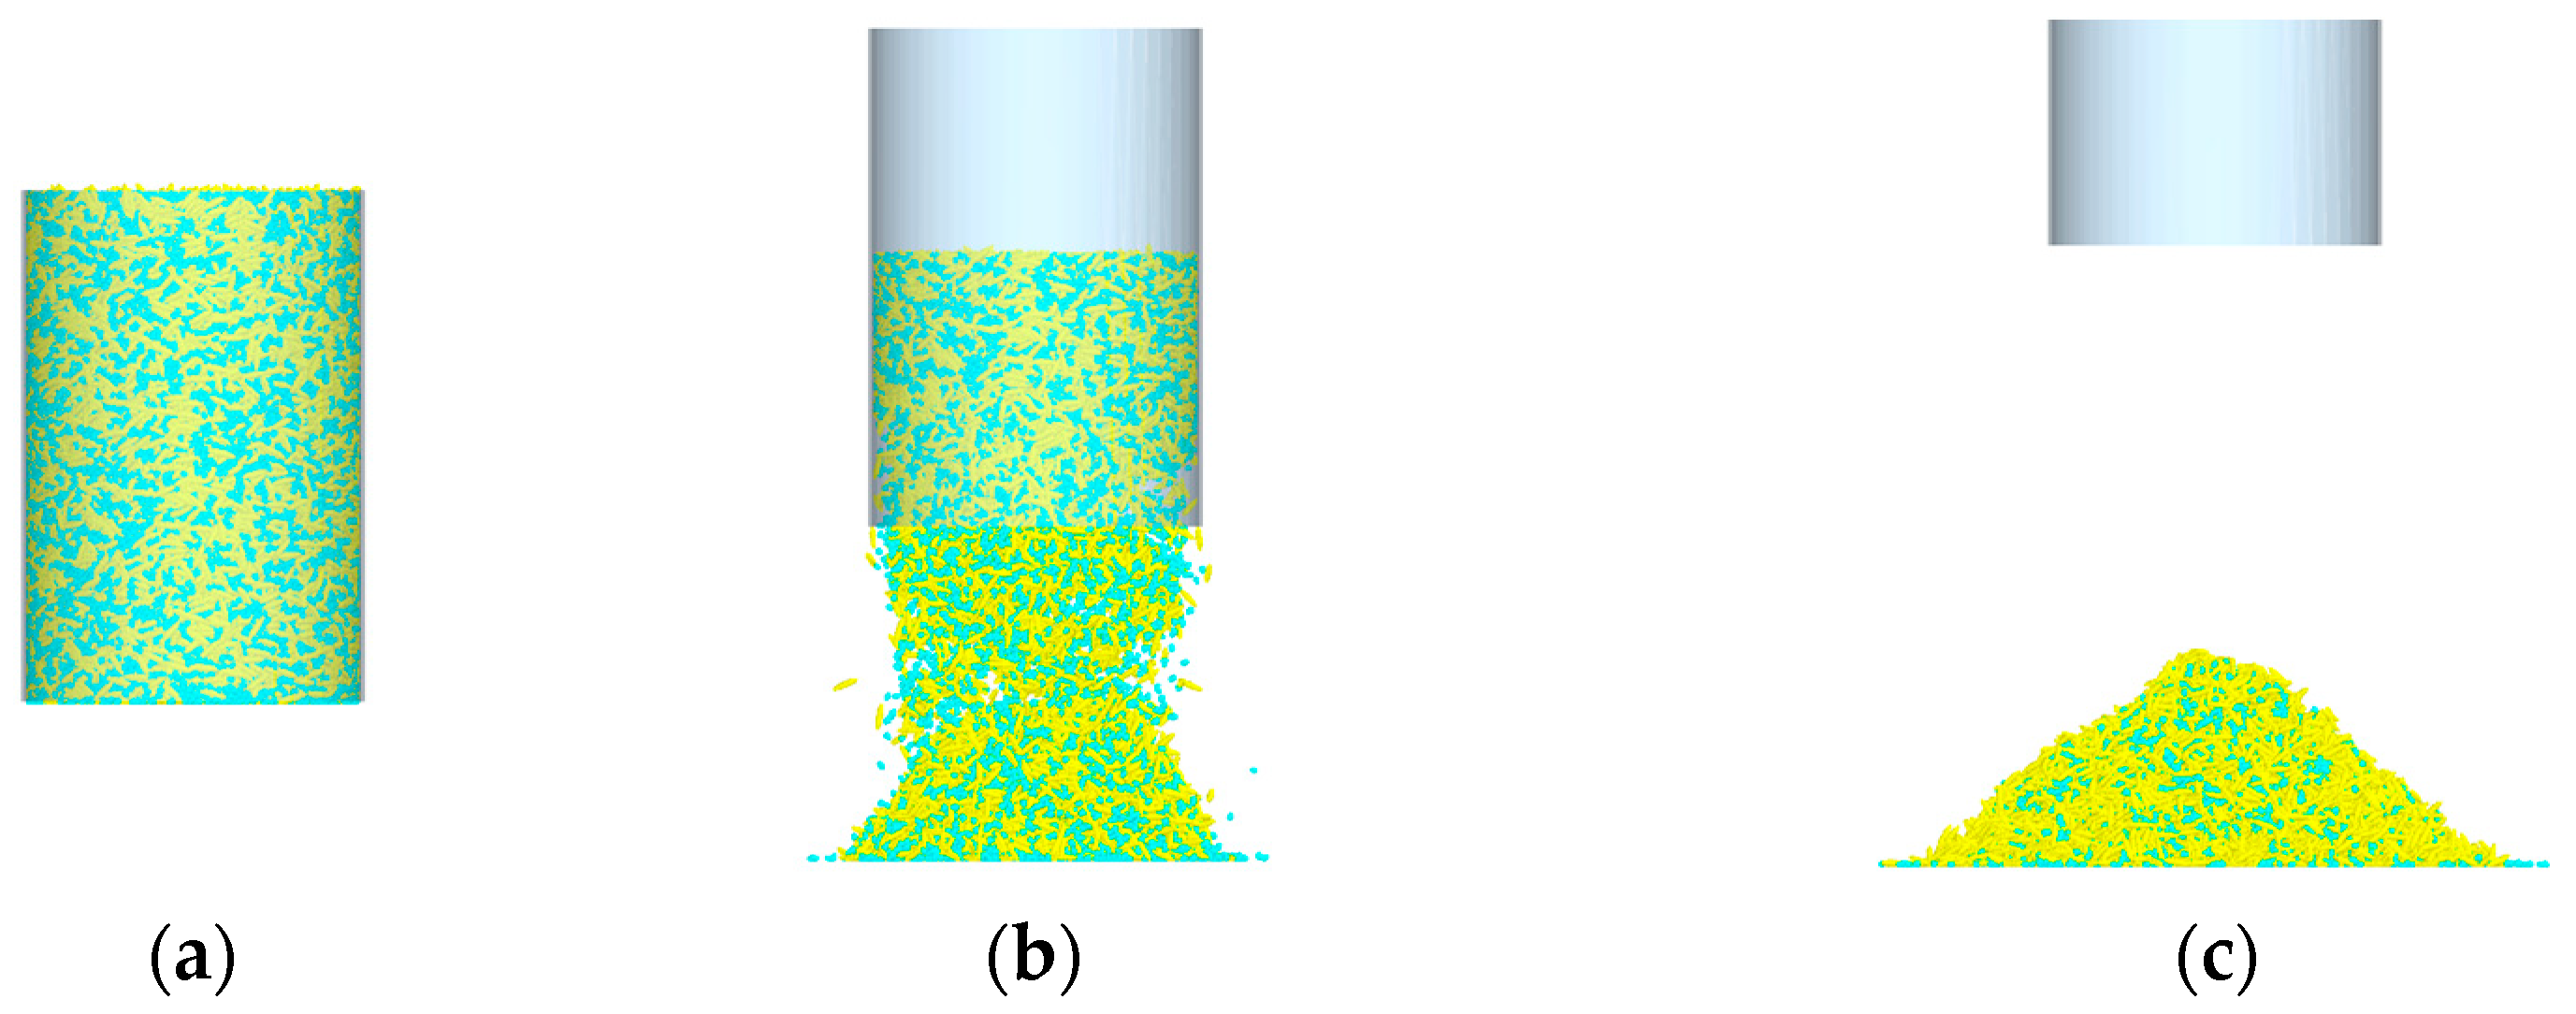
2.4.2. Simulation Deposition Test

Based on the geometric parameters of the physical test apparatus described in Section 2.4.1, an equivalent 3D simulation model was developed in discrete element software. Both sorghum grit particles and rice husk particles in the fermented grains exhibited particle size distributions conforming to a normal distribution, with their geometric characteristics represented through the multi-sphere composite method.
A dynamic particle generator was utilized to generate particles within the planar region at the top of the cylindrical container. Computational stability was ensured through a dynamic timestep control algorithm, with the fixed timestep set to 20% of the Rayleigh critical timestep. The simulation procedure comprised two distinct phases. The initial phase involved gravity-driven particle settling, which continued until 98% of the kinetic energy dissipation threshold was reached. Subsequently, the cylindrical container was vertically lifted at a constant velocity of 0.05 m/s in the second phase, during which the granular assembly evolved into a stable accumulation morphology under substrate confinement. Figure 4 illustrates the dynamic evolution of the granular deposition process, with Figure 4c demonstrating the stabilized final-state morphology under substrate confinement conditions.

3. Experiment and Result Analysis

3.1. Plackett–Burman Design

3.1.1. Plackett–Burman Design and Results

This study employs the Plackett–Burman (PB) experimental design methodology to systematically identify key parameters that significantly influence the stacking characteristics of fermented grains in DEM simulations. Six calibration parameters were selected as independent variables, with their high/low level settings detailed in Table 2. A 12-run orthogonal experimental design was implemented to evaluate the main effects of these parameters on the target response variable (angle of repose), as presented in Table 3. Throughout the experimental procedure, DEM simulations were conducted to accurately replicate the physical stacking process. The repose angles from both sides of the accumulated particles were simultaneously recorded, and their arithmetic mean was calculated as the final measured value.

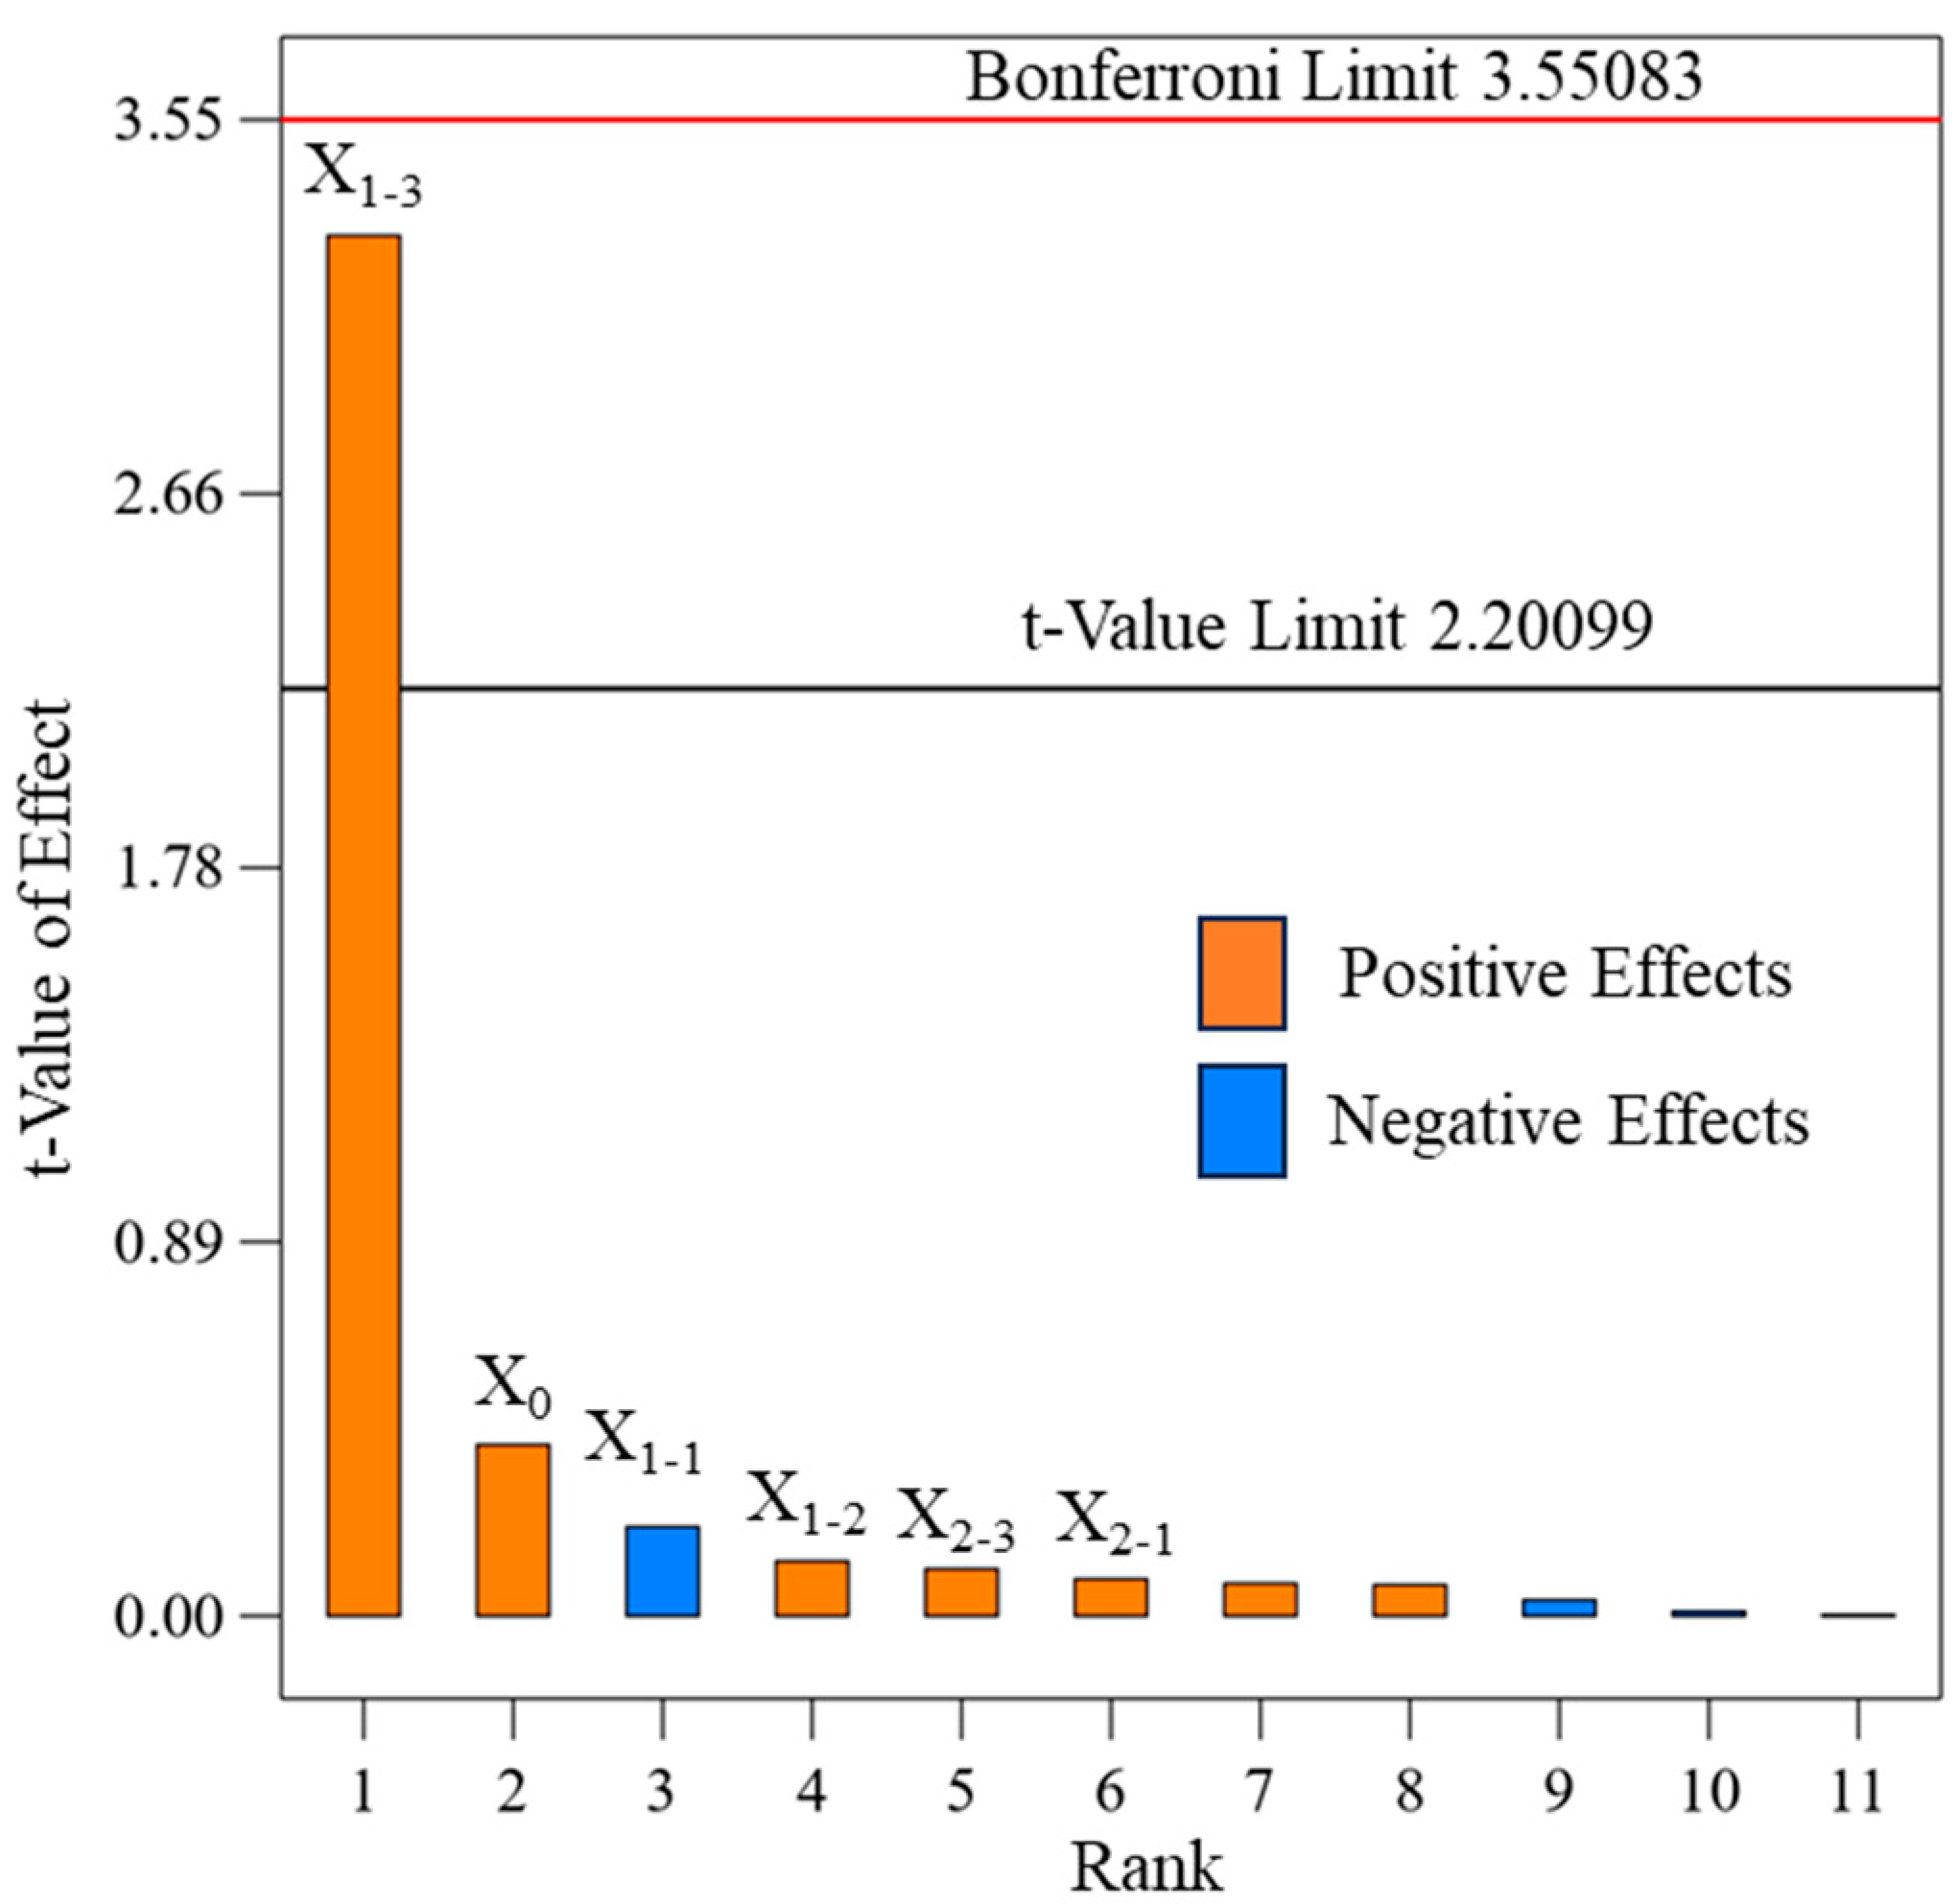
3.1.2. Analysis of Plackett-Burman Test Results

Table 4 presents the analysis of variance (ANOVA) results for the Plackett–Burman experimental design, elucidating the effects of six independent variables on the target response. The statistical analysis revealed exceptional model performance: a coefficient of determination (R2) of 0.9974 and adjusted R2 of 0.9944, demonstrating superior goodness-of-fit. The low coefficient of variation (CV = 2.17%) indicated minimal data dispersion and high model stability. Notably, the adequate precision value of 39.0522 substantially exceeded the recommended threshold of 4, confirming the model’s excellent discriminative and predictive capabilities.
Based on the results in Table 4 and Figure 5, the effect analysis revealed that parameter X1-3 demonstrated the highest standardized effect magnitude of 17.231 (p < 0.0001), which ranked first in the significance hierarchy and showed a strong positive correlation with the angle of repose. Both parameters X0 and X1-1 showed statistically significant influences (p < 0.05), with X1-1 demonstrating a significant negative correlation with the response variable (standardized effect = −1.112, p = 0.037). Conversely, parameters X1-2, X2-1, and X2-3 conspicuously failed to attain statistical significance (all p > 0.05), indicating their negligible impacts on the response variable.

3.2. Steepest Ascent Experiment

This study implemented a steepest ascent optimization protocol to refine parameter intervals for the angle of repose characterization. Guided by the Plackett–Burman screening results, directional adjustments were executed: parameters X0 and X1-3, demonstrating significant positive correlations (p < 0.05), underwent incremental stepping, while X1-1, exhibiting a negative correlation, was systematically decreased. To control variables, the static friction coefficient between particles (X1-2 = 1.0), coefficient of restitution between particles and stainless steel plates (X2-1 = 0.25), and rolling friction coefficient (X2-3 = 0.175) were all maintained at their central point levels.
The validation metric adopted in this study was the simulated–measured angle-of-repose error rate. Statistical analysis derived from the PB design revealed that the interparticle rolling friction coefficient X1-3 exhibited extraordinary significance, where precise demarcation of its parameter sensitization intervals critically governs the predictive fidelity of response surface methodology (RSM). Given the parameter’s exceptional effect magnitude, we extended beyond the conventional 5–7 trial configuration in steepest ascent design, implementing a refined incremental strategy through 11 gradient-optimized experimental sets. This high-resolution parametric characterization achieved sub-interval discrimination of sensitization thresholds. This design expansion established a high-resolution feature space for subsequent RSM analysis. The specific experimental protocols and corresponding results are detailed in Table 5.
The experimental data presented in Table 5 demonstrate that the numerical simulation of the fermented grains angle of repose exhibits significant parameter dependence. As the values of X0 and X1-3 increased, the simulated angle of repose showed a strong positive correlation. In contrast, the increase in X1-1 displayed a significant negative correlation with angle variation. As illustrated in Figure 6, the relative error curve between physical and simulated angles of repose exhibited a distinct U-shaped response trend. This curve demonstrated nonlinear characteristics of an initial decrease followed by a subsequent increase across the 11 experimental parameter groups. Starting from 37.58% relative error in NO.1, the error progressively decreased to a minimum of 1.67% in NO.9, followed by error rebound to 10.79% and 15.57% in NO.10 and NO.11, respectively. Notably, the parameter combination in NO.9 yielded the smallest relative error. Based on these findings, this study selected three representative parameter schemes (NO.8, NO.9, and NO.10) to serve as critical parameter references for subsequent Box–Behnken experimental design. These optimized parameter sets provide essential experimental foundations for further investigation into the complex relationships between fermented grain angle of repose and multiple parameters.

3.3. Box–Behnken Design

3.3.1. Box–Behnken Design and Regression Model

Based on the experimental findings from the steepest ascent test, this study implemented response surface analysis through a Box–Behnken experimental design to establish an optimization framework. The design configuration incorporated three center points for error estimation, with a total of 15 experimental runs conducted. The complete experimental design with corresponding results is comprehensively summarized in Table 6.
A multivariate regression analysis was conducted to establish a second-order regression model correlating the angle of repose with three key parameters (X0, X1-1, and X1-3). The analysis of variance (ANOVA) results for the regression model are presented in Table 7. The model demonstrated extremely high statistical significance (p < 0.0001), with a non-significant lack-of-fit term, confirming its strong predictive capability. Specifically, both the linear and quadratic terms of X1-3 exerted highly significant effects on the angle of repose, while X0 and X1-1 showed statistically significant influences. As can be seen from Table 7, the R2 value of the regression model is 0.9981 and the coefficient of variation (CV) is only 0.34%, which indicates that the model has an extremely excellent fitting effect. Although the high R2 value reflects a good fitting degree of the model, considering the extremely low CV value comprehensively, in order to avoid potential over-fitting risks, we excluded the non-significant interaction terms (X0X1-1, X0X1-3, and X1-1X1-3) and quadratic terms (X02 and X1-12), and optimized the regression equation. The specific optimized regression equation is as follows:
γ = 167.85 + 92.92 X 0 6.06 X 1 1 1367.02 X 1 3 + 3450.79 X 1 3 2

3.3.2. Regression Model Interaction Response Analysis

Based on the mathematical model established through regression analysis, this study objectively revealed the interactive effects of three factors—surface energy (X₀), inter-particle collision restitution coefficient (X1-1), and inter-particle rolling friction coefficient (X1-3)—on the angle of repose. The three-dimensional response surface presented in Figure 7 intuitively illustrates the synergistic regulatory effects of combined control variables on particle accumulation angles. The analysis of the surface characteristics in Figure 7b,c reveals that expanding the X1-3 value range from 0.205 to 0.235 exhibited a significant positive correlation trend with the angle of repose, indicating that this parameter plays a key controlling role in particle rheological properties.
Utilizing the response surface methodology module in Design-Expert13 software, this study implemented multi-objective parameter optimization, targeting the experimentally measured angle of repose (36.412°) for fermented grains. The established second-order regression model was subjected to iterative numerical optimization, yielding the following optimal parameter combination: surface energy (X0 = 0.0429), interparticle coefficient of restitution (X1-1 = 0.183), and interparticle rolling friction coefficient (X1-3 = 0.216). Non-significant parameters were maintained at their central levels, specifically: interparticle static friction coefficient (X1-2 = 1.0), particle–stainless-steel coefficient of restitution (X2-1 = 0.25), and rolling friction coefficient (X2-3 = 0.175). The complete parameter configuration is tabulated in Table 8.

3.4. Validation Experiment

To validate the optimization efficacy, three replicate DEM simulations were conducted under the identified parameters, yielding a mean angle of repose of 36.805°. This represents a relative error of 1.08% when benchmarked against the physical experimental value of 36.412.
Under ideal conditions, influenced by the gravitational force and physical properties of fermented grain particles, the left and right angles of repose exhibit an approximately symmetrical distribution during the piling process. Morphological comparative analysis (as shown in Figure 8) revealed that the optimized simulation results demonstrated high agreement with physical tests in terms of geometric contours, angular distribution characteristics, and absolute values of the left and right angles of repose. Moreover, the symmetrical relationship between the two sides aligned closely with experimental observations. These findings confirm that the calibrated discrete element parameters accurately characterize the mechanical behavior of fermented grain particles, validating the reliability and precision of the constructed model.
This optimized scheme of the validated parameter set not only confirms the regression model’s predictive capability, but also establishes a quantitative framework for characterizing the rheological properties of fermented grain systems.

4. Discussion

(1)
Although the JKR model exhibits significant advantages in characterizing the interactions between highly cohesive particles, its computational cost remains a crucial factor that cannot be overlooked in practical applications. This model requires real-time coupled calculations of contact deformation and surface energy effects, leading to a substantial increase in computational complexity. In this study, considering that the rice husks are modeled using the multi-sphere assembly method and the large number of particles involved, in order to effectively improve the computational efficiency, we adopted the GPU parallel computing technology. Additionally, constructing the rice husk particles with a simplified hollow geometry model can reduce the computational memory usage by approximately 30%, significantly optimizing the computational performance. However, this simplified approach may cause the model to fail to fully consider the potential impact of the actual fiber structure of rice husks on the particle packing behavior.
(2)
This study focused on fermented grains from a single distillery; however, the generalizability of our model to other bio-materials and industrial contexts warrants careful consideration. While the Hertz–Mindlin with JKR contact model effectively captured the cohesive behavior of the specific fermented grains, its applicability may vary with different fermentation substrates, grain shapes, and moisture levels. For other fermentation substrates, materials with distinct physical properties (e.g., different surface energy, elasticity, and particle size distributions) may require re-calibration of model parameters. For instance, grains with higher moisture content typically exhibit stronger inter-particle adhesion, which could affect the accuracy of the current model.

5. Conclusions

In this study, the benchmark value of the angle of repose for fermented grains was measured to be 36.412° using the cylinder lifting method. By combining inclined plane sliding tests with literature data, the initial interval of contact parameters was determined. A numerical simulation framework for the cylinder lifting method was established based on the DEM, yielding the following conclusions:
(1)
A DEM of the fermented grains particle system was established using a multi-sphere clumping strategy. Specifically addressing the thin-walled structure of rice husks, a hollow geometric model was developed to construct its DEM representation, enabling the three-dimensional model to better approximate their true characteristics.
(2)
Three significant contact parameters—the surface energy, inter-particle collision restitution coefficient, and rolling friction coefficient—were identified via Plackett–Burman experimental design. Specifically, an 11-run gradient experimental design within the steepest ascent test framework was employed to determine optimal parameter ranges. The quadratic regression model constructed using Box–Behnken response surface methodology achieved a coefficient of determination (R2) of 0.9981 and a coefficient of variation (CV) as low as 0.34%.
(3)
The optimal solution was determined through parameter calibration: surface energy of 0.0429 J/m2, collision restitution coefficient of 0.183, and rolling friction coefficient of 0.216. The relative error of the angle of repose between physical experiments and simulation results was only 1.08%, with model validation errors significantly lower than the industry standard (<5%).
This study validates the applicability of the parameter calibration method based on the “Hertz–Mindlin with JKR” contact theory in fermented grains particle. The established DEM provides a reliable theoretical framework for investigating the flow characteristics of solid-state fermented grains particle. The revealed particle–interface interaction mechanism offers significant engineering guidance for optimizing critical processes, such as the fermented grains loading process in Baijiu production.

Author Contributions

Conceptualization, X.L. and S.G.; Methodology, T.C.; Software, X.L. and S.G.; Validation, X.L., S.G. and T.C.; Formal analysis, T.C. and S.G.; Investigation, T.C. and H.X.; Data curation, S.G. and H.X.; Writing—original draft preparation, X.L.; Writing—review and editing, C.Z. and X.L.; Project administration, X.L. and C.Z.; Supervision, C.Z. All authors have read and agreed to the published version of the manuscript.

Funding

This research was funded by the Key Research and Development Project for Collaborative Innovation between Schools and Enterprises in Lvliang City grant number (2023XDHZ01). The APC was also funded accordingly.

Data Availability Statement

No new data were created or analyzed in this study.

Conflicts of Interest

The authors declare that they have no known competing financial interests or personal relationships that could have appeared to influence the work reported in this paper.

References

  1. Jin, G.; Zhu, Y.; Xu, Y. Mystery behind Chinese liquor fermentation. Trends Food Sci. Technol. 2017, 63, 18–28. [Google Scholar] [CrossRef]
  2. Qiao, L.; Wang, J.; Wang, R.; Zhang, N.; Zheng, F. A review on flavor of Baijiu and other world-renowned distilled liquors. Food Chem. X 2023, 20, 100870. [Google Scholar] [CrossRef]
  3. Li, X.; Zhang, J.; Xue, Y.; Qiu, L. Classification of hops image based on ResNet-ConvLSTM and research of intelligent liquor picking system. Measurement 2022, 194, 110955. [Google Scholar] [CrossRef]
  4. Liu, X.; Gong, S.; Hua, X.; Chen, T.; Zhao, C. Research on temperature detection method of liquor distilling pot feeding operation based on a compressed algorithm. Sci. Rep. 2024, 14, 13292. [Google Scholar] [CrossRef] [PubMed]
  5. Wang, G.; Chen, J.; Zhou, K.; Pang, Z. Industrial Robot Contouring Control Based on Non-Uniform Rational B-Spline Curve. Symmetry 2022, 14, 2533. [Google Scholar] [CrossRef]
  6. He, S.; Qian, C.; Jiang, Y.; Qin, W.; Huang, Z.; Huang, D.; Wang, Z.; Zang, Y. Design and optimization of the seed feeding device with DEM-CFD coupling approach for rice and wheat. Comput. Electron. Agric. 2024, 219, 108814. [Google Scholar] [CrossRef]
  7. Zhang, S.; Tekeste, M.Z.; Li, Y.; Gaul, A.; Zhu, D.; Liao, J. Scaled-up rice grain modelling for DEM calibration and the validation of hopper flow. Biosyst. Eng. 2020, 194, 196–212. [Google Scholar] [CrossRef]
  8. Fan, J.; Wang, H.; Sun, K.; Zhang, L.; Wang, L.; Zhao, J.; Yu, J. Experimental verification and simulation analysis of a multi-sphere modelling approach for wheat seed particles based on the discrete element method. Biosyst. Eng. 2024, 245, 135–151. [Google Scholar] [CrossRef]
  9. Ding, X.; Wang, B.; He, Z.; Shi, Y.; Li, K.; Cui, Y.; Yang, Q. Fast and precise DEM parameter calibration for Cucurbita ficifolia seeds. Biosyst. Eng. 2023, 236, 258–276. [Google Scholar] [CrossRef]
  10. Zhao, L.; Zhou, H.; Xu, L.; Song, S.; Zhang, C.; Yu, Q. Parameter calibration of coconut bran substrate simulation model based on discrete element and response surface methodology. Powder Technol. 2022, 395, 183–194. [Google Scholar] [CrossRef]
  11. Chen, Z.; Duan, A.; Liu, Y.; Zhao, H.; Dai, C.; Hu, S.; Lei, X.; Hu, J.; Chen, L. Discrete element contact model and parameter calibration of sticky particles and agglomerates. J. Terramechanics 2024, 116, 100998. [Google Scholar] [CrossRef]
  12. Balevičius, R.; Sielamowicz, I.; Mróz, Z.; Kačianauskas, R. Investigation of wall stress and outflow rate in a flat-bottomed bin: A comparison of the DEM model results with the experimental measurements. Powder Technol. 2011, 214, 322–336. [Google Scholar] [CrossRef]
  13. Xia, R.; Li, B.; Wang, X.; Li, T.; Yang, Z. Measurement and calibration of the discrete element parameters of wet bulk coal. Measurement 2019, 142, 84–95. [Google Scholar] [CrossRef]
  14. Chen, P.; Jia, F.; Han, Y.; Meng, X.; Li, A.; Chu, Y.; Zhao, H. Study on the segregation of brown rice and rice husks mixture in inclined chute flow. Powder Technol. 2022, 404, 117393. [Google Scholar] [CrossRef]
  15. Peiris, K.H.S.; Bean, S.R.; Tilley, M.; Jagadish, S.V.K. Analysis of sorghum content in corn-sorghum flour bioethanol feedstock by near infrared spectroscopy. J. Near Infrared Spectrosc. 2020, 28, 267–274. [Google Scholar] [CrossRef]
  16. Shi, J.; Shan, Z.; Yang, H. Research on the macro- and meso-mechanical properties of frozen sand mold based on Hertz-Mindlin with Bonding model. Particuology 2024, 88, 176–191. [Google Scholar] [CrossRef]
  17. Berry, N.; Zhang, Y.; Haeri, S. Contact models for the multi-sphere discrete element method. Powder Technol. 2023, 416, 118209. [Google Scholar] [CrossRef]
  18. Hærvig, J.; Kleinhans, U.; Wieland, C.; Spliethoff, H.; Jensen, A.; Sørensen, K.; Condra, T. On the adhesive JKR contact and rolling models for reduced particle stiffness discrete element simulations. Powder Technol. 2017, 319, 472–482. [Google Scholar] [CrossRef]
  19. Zhou, J.; Zhang, L.; Hu, C.; Li, Z.; Tang, J.; Mao, K.; Wang, X. Calibration of wet sand and gravel particles based on JKR contact model. Powder Technol. 2022, 397, 117005. [Google Scholar] [CrossRef]
  20. Elskamp, F.; Kruggel-Emden, H.; Hennig, M.; Teipel, U. A strategy to determine DEM parameters for spherical and non-spherical particles. Granul. Matter 2017, 19, 46. [Google Scholar] [CrossRef]
  21. Kruggel-Emden, H.; Rickelt, S.; Wirtz, S.; Scherer, V. A study on the validity of the multi-sphere Discrete Element Method. Powder Technol. 2008, 188, 153–165. [Google Scholar] [CrossRef]
  22. Gao, W.; Feng, Y.T.; Wang, C. A coupled isogeometric/multi-sphere discrete element approach for the contact interaction between irregular particles and structures. Powder Technol. 2023, 430, 118971. [Google Scholar] [CrossRef]
  23. Tahmasebi, P. A state-of-the-art review of experimental and computational studies of granular materials: Properties, advances, challenges, and future directions. Prog. Mater. Sci. 2023, 138, 101157. [Google Scholar] [CrossRef]
  24. Wan, Z.; Yang, S.; Hu, J.; Wang, H. DEM analysis of flow dynamics of cohesive particles in a rotating drum. Adv. Powder Technol. 2024, 35, 104379. [Google Scholar] [CrossRef]
  25. Scheffler, O.C.; Coetzee, C. DEM calibration for simulating bulk cohesive materials. Comput. Geotech. 2023, 161, 105476. [Google Scholar] [CrossRef]
  26. Rong, W.; Feng, Y.; Schwarz, P.; Yurata, T.; Witt, P.; Li, B.; Song, T.; Zhou, J. Sensitivity analysis of particle contact parameters for DEM simulation in a rotating drum using response surface methodology. Powder Technol. 2020, 362, 604–614. [Google Scholar] [CrossRef]
  27. Zhang, J.; Ding, W.; Wang, S.; Ha, X.; Zhang, L.; Zhao, Y.; Wu, W.; Zhao, M.; Zou, G.; Chen, Y. Pollution characteristics of microplastics in greenhouse soil profiles with the long-term application of organic compost. Resour. Environ. Sustain. 2024, 17, 100165. [Google Scholar] [CrossRef]
  28. Gong, F.; Hu, M.; Bao, A.; Li, D.; Gao, T.; Wang, C. Parameter Calibration and Significance Analysis of Rice Straw based on Hertz-Mindlin Model. J. Southwest Univ. (Nat. Sci. Ed.) 2022, 44, 186–196. [Google Scholar]
  29. Yang, G.; Zhang, F.; Zheng, L.; Wang, Z.; Kong, M.; Zhang, X. Tuber Physical Characteristics and Calibration of Discrete Element Simulation Parameters of Pinellia ternata. J. Agric. Sci. Technol. 2022, 24, 99–108. [Google Scholar]
  30. Müller, D.; Fimbinger, E.; Brand, C. Algorithm for the determination of the angle of repose in bulk material analysis. Powder Technol. 2021, 383, 598–605. [Google Scholar] [CrossRef]
  31. Kajiyama, S.; Nakata, Y.; Nakase, H. Proposal of Sidewall Velocity-Controlled Cylindrical Angle of Repose Measurement Apparatus. Geotech. Test. J. 2025, 48, 229–242. [Google Scholar] [CrossRef]
  32. Al-Hashemi, H.M.B.; Al-Amoudi, O.S.B. A review on the angle of repose of granular materials. Powder Technol. 2018, 330, 397–417. [Google Scholar] [CrossRef]
  33. Tang, X.; Liu, S.; Xiang, Q.; Cheng, J.; He, H.; Xue, B. Facial Expression Recognition Based on Dual-Channel Fusion with Edge Features. Symmetry 2022, 14, 2651. [Google Scholar] [CrossRef]
  34. Ding, X.; Wei, Y.; Yan, Z.; Zhu, Y.; Cao, D.; Li, K.; He, Z.; Cui, Y. Simulation and Experiment of the Spiral Digging End-Effector for Hole Digging in Plug Tray Seedling Substrate. Agronomy 2022, 12, 779. [Google Scholar] [CrossRef]
  35. Xie, C.; Yang, J.; Wang, B.; Zhuo, P.; Li, C.; Wang, L. Parameter calibration for the discrete element simulation model of commercial organic fertilizer. Int. Agrophys. 2021, 35, 107–117. [Google Scholar] [CrossRef]
Figure 1. Granular sorghum and rice husk: Physical specimens and corresponding discrete element models: (a) granular sorghum physical specimen; (b) granular sorghum discrete element model; (c) rice husk physical specimen; (d) rice husk discrete element model.
Symmetry 17 00729 g001aSymmetry 17 00729 g001b
Figure 2. Experimental measurement of static friction coefficient.
Symmetry 17 00729 g002
Figure 3. Image processing for angle of repose of fermented grain particles: (a) angle of repose of physical test; (b) original deposition image; (c) preprocessed image (d) edge-detection and fitting process images.
Symmetry 17 00729 g003
Figure 4. Dynamic evolution process of deposition: (a) initial deposition state; (b) intermediate deposition process; (c) final deposition state.
Symmetry 17 00729 g004
Figure 5. Pareto char.
Symmetry 17 00729 g005
Figure 6. Variation trends of relative error and resting angle with NO.
Symmetry 17 00729 g006
Figure 7. Interaction term response surface. (a) Three-dimensional response surface diagram of particle-particle recovery coefficient and surface energy; (b) Three-dimensional response surface diagram of particle-particle rolling friction coefficient and recovery coefficient; (c) Three-dimensional response surface diagram of particle-particle rolling friction coefficient and surface energy.
Symmetry 17 00729 g007
Figure 8. Comparison between physical experiments and simulation experiments: (a) physical experiments; (b) simulation experiments.
Symmetry 17 00729 g008
Table 1. Summary of DEM simulation parameters.
EDEM ParametersMaterialsValueMaterialsValue
Density/(kg/m3)Particle853Steel7930
Poisson’s Ratio0.320.29
Shear Modulus/Pa5 × 1077.7 × 1010
Coefficient of RestitutionParticle–Particle0.15–0.35Particle–Steel0.15–0.35
Coefficient of Static Friction0.8–1.20.73
Coefficient of Rolling Friction0.1–0.250.1–0.25
Surface Energy/(J/m2)0.02–0.05/
Table 2. Parameter level rang.
SymbolParametersParameter Level
Low LevelHigh Level
X0Particle–ParticleSurface energy/(J/m2)0.020.05
X1-1Coefficient of restitution0.150.35
X1-2Coefficient of static friction0.81.2
X1-3Coefficient of rolling friction0.10.25
X2-1Particle–SteelCoefficient of restitution0.150.35
X2-3Coefficient of rolling friction0.10.25
Table 3. Plackett–Burman experimental design and results.
NO.X0X1-1X1-2X1-3X2-1X2-3Resting Angle/°
10.050.350.80.10.150.2523.48
20.020.351.20.10.350.2522.62
30.050.350.80.250.350.2541.09
40.050.151.20.250.150.2543.36
50.020.151.20.10.350.2523.31
60.020.150.80.10.150.122.47
70.020.350.80.250.350.138.77
80.050.150.80.10.350.124.25
90.050.351.20.10.150.123.11
100.020.150.80.250.150.2538.83
110.050.151.20.250.350.142.05
120.020.351.20.250.150.138.53
Table 4. Significance analysis of Plackett–Burman experimental parameters.
NO.Sum of SquaresStandardization EffectFpSignificance Sort
X013.672.13528.570.00312
X1-13.71−1.1127.750.03873
X1-21.390.6822.910.14864
X1-3890.7917.2311861.42<0.00011
X2-10.440.3850.930.37936
X2-31.030.5852.150.20295
R2 = 0.9974, R2adj = 0.9942, CV = 2.17%, Adeq Precision = 39.0522
Table 5. Steepest ascent experimental design and results.
NO.X0X1-1X1-2X1-3X2-1X2-3Resting Angle/°Relative Error/%
10.020.351.00.10.250.17522.7337.58
20.0230.331.00.1150.250.17524.7232.11
30.0260.311.00.130.250.17526.0128.57
40.0290.291.00.1450.250.17527.7523.79
50.0320.271.00.160.250.17530.0917.36
60.0350.251.00.1750.250.17531.2914.07
70.0380.231.00.190.250.17533.368.38
80.0410.211.00.2050.250.17535.173.41
90.0440.191.00.220.250.17537.021.67
100.0470.171.00.2350.250.17540.3410.79
110.050.151.00.250.250.17542.0815.57
Table 6. Design and results of Box–Behnken test.
NO.X0X1-1X1-3Resting Angle/°Relative Error/%
10.0440.190.2237.071.8
20.0440.190.2236.981.56
30.0440.190.2236.941.39
40.0410.190.23540.019.88
50.0470.190.20535.781.74
60.0440.210.20535.532.42
70.0440.170.23540.1210.18
80.0470.210.2237.222.22
90.0410.170.2236.851.2
100.0410.190.20535.293.08
110.0470.170.2237.613.29
120.0410.210.2236.740.9
130.0440.210.23539.789.25
140.0440.170.20535.662.07
150.0470.190.23540.5111.25
Table 7. Variance analysis of regression model of Box–Behnken test.
SourceSum of SquaresFp
Model44.30288.69<0.0001 **
X00.6236.460.0018 *
X1-10.126.900.0467 *
X1-341.222418.02<0.0001 **
X0X1-10.021.150.3326
X0X1-30.000.000.9709
X1-1X1-30.010.650.4578
X020.052.950.1466
X1-120.000.020.9072
X1-322.27133.18<0.0001 **
Residual0.0852
Lack of fit0.07645.740.1519
Pure Error0.0089
R2 = 0.9981, R2adj = 0.9946, CV = 0.3484%, Adeq Precision = 47.8178
Ps: ** is extremely significant (p < 0.0001); * is significant (p < 0.05).
Table 8. EDEM simulation contact parameters for particle–particle and particle–steel interactions.
DEM ParametersParticle–ParticleParticle–Steel
Coefficient of restitution0.1830.25
Coefficient of static friction1.00.73
Coefficient of rolling friction0.2160.175
Surface energy/J/m20.0429/
Disclaimer/Publisher’s Note: The statements, opinions and data contained in all publications are solely those of the individual author(s) and contributor(s) and not of MDPI and/or the editor(s). MDPI and/or the editor(s) disclaim responsibility for any injury to people or property resulting from any ideas, methods, instructions or products referred to in the content.

