Article

Symmetry-Driven Gaussian Representation and Adaptive Assignment for Oriented Object Detection

1
School of Computer Science, Civil Aviation Flight University of China, Guanghan 618307, China
2
Shanghai Aerospace Control Technology Institute, Shanghai 201109, China
3
Research and Development Center of Infrared Detection Technology, China Aerospace Science and Technology Corporation, Shanghai 201109, China
*
Authors to whom correspondence should be addressed.
Symmetry 2025, 17(4), 594; https://doi.org/10.3390/sym17040594
Submission received: 10 March 2025 / Revised: 7 April 2025 / Accepted: 10 April 2025 / Published: 14 April 2025
(This article belongs to the Special Issue Symmetry and Asymmetry Study in Object Detection)

Abstract

:
Object Detection (OD) in Remote Sensing Imagery (RSI) encounters significant challenges such as multi-scale variation, high aspect ratios, and densely distributed objects. These challenges often result in misalignments among Bounding Box (BBox) representation, Label Assignment (LA) strategies, and regression loss functions. To address these limitations, this study proposes a novel detection framework, the Gaussian Detection (GaussianDet) Framework, that integrates probabilistic modeling with dynamic sample assignment to achieve more precise OD. The core design of this framework is inspired by the theory of geometric symmetry. Specifically, the radial symmetry of a two-dimensional Gaussian distribution is employed to capture the rotational and scale-invariant properties of Remote Sensing (RS) objects. By leveraging the axial symmetry of elliptical geometry, the proposed Gaussian Elliptical Intersection over Union (GEIoU) enables rotation-aligned matching, while Omni-dimensional Adaptive Assignment (ODAA) introduces dynamic symmetric constraints to optimize the spatial distribution of training samples. Specifically, a Flexible Bounding Box (FBBox) representation based on a 2D Gaussian distribution is introduced to more accurately characterize the shape, aspect ratio, and orientation of objects. In addition, the GEIoU is designed as a scale-invariant similarity metric to align regression loss with detection accuracy. To further enhance sample quality and feature learning, the ODAA strategy adaptively selects positive samples based on object scale and geometric constraints. Experimental results on the High-Resolution Ship Collection 2016 (HRSC2016) and University of Chinese Academy of Sciences–Aerial Object Detection (UCAS-AOD) datasets demonstrate that GaussianDet achieves mean Average Precision (mAP) scores of 90.53% and 96.24%, respectively. These results significantly outperform existing Oriented Object Detection (OOD) methods, thereby validating the effectiveness of the proposed approach and providing a solid theoretical foundation for future research in Remote Sensing Object Detection (RSOD).

1. Introduction

As an essential means of acquiring surface information, RSI plays a critical role in numerous applications such as land surveying, urban planning, traffic monitoring, agricultural supervision, and maritime law enforcement, where the capability of automated analysis directly impacts the value of RS data utilization. Within this context, RSOD serves as a fundamental technique, aiming to rapidly and accurately localize specific objects (e.g., ships, aircraft, vehicles) in high-resolution and large-scale RSI, while also extracting their geometric attributes.
As illustrated in Figure 1, objects in RSI exhibit notable differences in category, pose orientation, scale range, and spatial distribution, distinguishing them significantly from those in natural images. In particular, RSI objects are characterized by multi-scale variation, substantial aspect ratio disparity, arbitrary orientation distribution, and dense arrangement in specific scenes (e.g., ports, airports). While these geometric attributes offer rich visual cues for detection models, they also considerably increase the complexity and difficulty of the detection task.
Current RSOD methods can be broadly categorized into two-stage detectors and one-stage detectors. The former, such as the Region-based Convolutional Neural Network (R-CNN) series [2,3,4], rely on region proposal networks to generate high-quality candidate boxes and generally exhibit superior performance in tasks with high accuracy requirements. In contrast, the latter, including the Single-Shot MultiBox Detector (SSD) [5], the You Only Look Once (YOLO) series [6,7,8,9,10,11,12], and the Retina Network (RetinaNet) [13], are better suited for RS applications with real-time constraints due to their end-to-end architecture and higher inference efficiency.
To address the aforementioned issues, previous studies have introduced independent angle regression branches to enhance the model’s ability to fit orientation information [14,15,16,17,18], or employed multi-scale feature fusion structures to improve detection performance [19,20,21,22]. Although these approaches have led to certain improvements in detection accuracy, their overall performance and robustness remain constrained by the commonly observed “misalignment” problem in detection frameworks. This issue primarily involves three aspects, object representation methods, LA strategies, and regression loss functions, specifically described as follows:
  • Representation misalignment: Traditional Horizontal Bounding Boxes (HBBox) often result in redundant coverage when handling oriented objects. Although Oriented Bounding Boxes (OBBox) enable angle modeling, the periodic nature of the angle parameter tends to cause boundary discontinuities and prediction instability, making it difficult to effectively represent complex geometric symmetries [23,24].
  • Assignment misalignment: Commonly adopted fixed-threshold or center-based sampling strategies exhibit limited adaptability when dealing with objects of diverse scales and uneven spatial distributions in RSI. A uniform assignment criterion can result in insufficient positive samples for small objects and misalignments for larger ones, thereby leading to sample imbalance and scale bias, which negatively impact both the accuracy and robustness of detection [15,25].
  • Regression misalignment: The widely used smooth L 1 loss function [4] and the Intersection over Union (IoU) evaluation metric differ in their treatment of orientation consistency, making it difficult to jointly optimize parameters such as location, scale, and shape. As shown in Figure 2a, high-aspect-ratio objects often exhibit noticeable angular deviation under traditional loss functions, while the proposed strategy in Figure 2b demonstrates significantly better boundary fitting performance.
To mitigate the above challenges from a geometric perspective, this study proposes a symmetry-driven OD framework, GaussianDet. This approach systematically incorporates symmetry theory to optimize RSOD tasks across three key components: object representation, LA, and regression modeling. The core designs are as follows:
  • Radial symmetry modeling: FBBox is constructed by leveraging the radial symmetry of a two-dimensional Gaussian distribution, enabling the unified modeling of scale and orientation information;
  • Axial symmetry metric: The GEIoU metric is formulated by introducing elliptical symmetry, allowing for more precise geometric alignment;
  • Dynamic symmetry constraint: ODAA is proposed to construct dynamic multi-scale sampling regions, improving the matching efficiency for high-aspect-ratio objects.
Based on the proposed theoretical framework, the main contributions of this study are summarized as follows:
  • Flexible object representation (FBBox): A probabilistic modeling approach based on Gaussian distribution is introduced, transforming HBBox and OBBox into rotation-invariant probabilistic boundaries, thereby alleviating modeling issues caused by boundary discontinuity and angle periodicity;
  • Symmetry-consistent loss (GEIoU): An IoU computation method based on the symmetric decomposition of covariance matrices is designed, enabling the unified optimization of location, scale, and orientation parameters, and ensuring consistent optimization trends between training objectives and evaluation metrics;
  • Dynamic LA mechanism (ODAA): An LA strategy is constructed, consisting of Multi-Scale Agile Assignment (MSAA) and a Spatial Geometric Selector (SGS), which, respectively, enable the scale-aware and geometry-aware selection of positive samples, thus enhancing detection performance in complex scenes.
On two representative RSOD datasets, HRSC2016 and UCAS-AOD, GaussianDet achieves 90.53% and 96.24% mAP, respectively, significantly outperforming existing mainstream methods. Further ablation studies demonstrate that FBBox effectively mitigates instability in angle regression, GEIoU improves prediction quality and alignment with the IoU metric, and ODAA enhances the adaptability of LA. Collectively, these components form a symmetry-aware detection framework that combines theoretical novelty with practical applicability.
From a theoretical perspective, this work systematically introduces the classical mathematical concept of “geometric symmetry” into deep learning-based detection models, offering a new paradigm for object representation. Radial symmetry facilitates the joint modeling of scale and orientation, axial symmetry improves the orientation sensitivity of the loss function, and dynamic symmetry enhances the geometric adaptability of the sample selection mechanism. The proposed approach exhibits strong generalization capability and holds potential to support RSOD and other complex structural tasks, such as medical image analysis and text detection, with theoretical and modeling insights.
The remainder of this study is organized as follows: Section 2 reviews and analyzes representative existing methods in RSOD, focusing on advances in LA and regression loss design. Section 3 investigates key technical challenges currently faced by RSOD. Section 4 details the proposed GaussianDet framework and its core modules. Section 5 presents experimental results and ablation studies on multiple benchmark datasets. Section 6 concludes the paper and outlines potential future research directions.

2. Related Work

In recent years, Oriented Object Detection (OOD) has emerged as a key research direction in RSI analysis, achieving notable progress in terms of detection accuracy, robustness, and adaptability. Extensive studies have focused on aspects such as rotated Bounding Box modeling, LA optimization, and regression loss design, continuously advancing the performance of OOD methods. From the perspective of symmetry modeling, this study reviews the technical advantages of existing approaches and highlights their limitations in modeling symmetric structures, thereby establishing the theoretical foundation for the proposed GaussianDet.

2.1. BBox Modeling: From Orientation Modeling to Symmetry Abstraction

OOD initially adopted HBBoxs as the standard representation. While this approach is structurally simple, it suffers from severe overlap and occlusion issues when applied to RSI scenarios involving objects with varying poses and dense distributions. To overcome these limitations, OBBoxs were introduced by incorporating angle parameters for direction modeling, resulting in notable improvements in orientation performance [26,27].
Building on this, several methods further exploited the angle regression mechanism of OBBox to enhance modeling capability. For instance, the Region Proposal Network based on Rotation ( R 2 CNN) [27] and the Rotated Region Proposal Network (RRPN) [26] have been widely applied in text detection in natural scenes and have demonstrated effectiveness in handling arbitrarily oriented objects. Gliding Vertex [28] has shown high localization accuracy and boundary fitting capability for small and densely arranged objects in RSI.
However, from the symmetry modeling perspective, although these methods introduce orientation information, they still rely on hard-boundary box representations (e.g., five-parameter OBBox), which are limited in describing continuous symmetric structures within objects, such as elliptical features or axial symmetry. Furthermore, due to the periodicity and ambiguity in angle definitions, these methods are prone to boundary discontinuities and angle degeneration phenomena [23,24], which adversely affect detection stability and accuracy.

2.2. LA Strategy: From Heuristic Rules to Dynamic Perception

In OD tasks, the LA strategy directly influences the quality of training samples. Anchor-based methods (e.g., Faster R-CNN [4] and RetinaNet [13]) generally rely on fixed IoU thresholds to distinguish between positive and negative samples. Although these approaches are relatively straightforward to implement, they are heavily dependent on hyperparameter settings. In contrast, anchor-free methods (e.g., Fully Convolutional One-Stage Object Detection (FCOS) [29] and Iterative Estimation Network (IENet) [14]) typically adopt location-based heuristic spatial filtering mechanisms, which offer better adaptability to low-resolution images.
To address the challenges posed by large-scale variation and significant density differences in RSI objects, recent studies have progressively introduced dynamic LA mechanisms. For example, Adaptive Training Sample Selection (ATSS) [25] designs dynamic IoU thresholds based on statistical features; Automatic Assignment (AutoAssign) [30] integrates centerness and confidence in a joint modeling strategy; and Real-Time Multi-Detection (RTMDet) [31] employs a Real-Time Multi-Detector (SimOTA) to achieve multi-task consistency alignment.
However, from the perspective of symmetry modeling, although the above methods have made notable progress in scale awareness and sample confidence modeling, most current LA strategies still lack the direct modeling and utilization of axial symmetry or non-uniform symmetric features within object geometry. Specifically, existing methods often use rectangular regions or central circles as reference areas during spatial sampling, which are inadequate for adapting to objects with non-uniform axial symmetry (e.g., elongated ships or inclined aircraft fuselages), resulting in sample matching bias and imbalanced assignment.

2.3. Regression Loss Function: From Error Metrics to Structural Consistency

In the optimization process of object localization, traditional methods usually employ the smooth L 1 loss function to regress the five parameters of OBBox. Although this formulation is general and easy to implement, it has limited capacity to reflect the spatial relationship between the predicted box and the ground-truth (GT) box.
To mitigate the inconsistency between loss functions and evaluation metrics (e.g., IoU), a series of IoU-based loss functions have been proposed. These include the Generalized Intersection over Union (GIoU) [32], the Distance Intersection over Union (DIoU) [33], and the Complete Intersection over Union (CIoU) [33]. These formulations have been further extended to the SkewIoU setting, including Rotated IoU [34], the Generalized Wasserstein distance (GWD) [23], and the Kullback–Leibler Divergence (KLD) [24]. These extensions aim to better model the spatial overlap and consistency of statistical distributions.
Despite their strong performance in terms of evaluation metrics, from the viewpoint of symmetry consistency, existing loss functions mainly focus on center point distance or boundary shape difference, while placing less emphasis on the coupled relationships among scale, angle, and orientation. The absence of structural modeling in this regard may lead to discrepancies between the optimized loss function and the actual geometric structure matching requirements during training. Recently, Raisi et al. [35] proposed a loss function based on GIoU for OBBoxs. By employing the Transformer architecture, they achieved multi-oriented text detection and validated the efficacy of the orientation alignment loss in complex scene scenarios.

2.4. Symmetry-Aware Analysis of Existing Methods

In general, existing methods have achieved significant progress in aspects such as orientation awareness, scale adaptability, and localization accuracy, thereby laying a solid technical foundation for RSOD tasks. However, from a higher-level perspective of symmetric structure modeling, these approaches have not yet established a unified modeling paradigm across object representation, sample selection mechanisms, and loss function design, resulting in a certain degree of structural inconsistency.
To address this issue, this study proposes an OOD framework, GaussianDet, grounded in geometric symmetry as the theoretical foundation. Unified modeling is achieved across FBBox representation, symmetry-based loss function design, and dynamically geometry-aware LA, aiming to alleviate the limitations of existing methods in terms of modeling consistency and structural alignment.

3. Oriented Object Regression Detectors: A Review and Analysis

To facilitate the development of this study, this section reviews and analyzes the limitations of state-of-the-art OOD algorithms based on angle regression and explores potential directions for improvement.

3.1. Evolution of BBox Representation

Most deep learning-based OD algorithms have matured within the domain of natural image tasks, where HBBoxs are commonly used as the annotation format. However, when such models are directly applied to RSI scenarios involving arbitrarily oriented and densely packed objects, detection performance often becomes constrained. OOD methods have partially alleviated these limitations. As depicted in Figure 3a,b, compared with HBBox, OBBox offers three key advantages in RS contexts [36]: (1) it more accurately reflects the true aspect ratio of the object; (2) it more effectively distinguishes objects from the background region; and (3) it helps to separate adjacent objects arranged in dense patterns. Figure 4 further demonstrates the differences between HBBox and OBBox annotations, highlighting the importance of OOD in RSI analysis.
Unlike HBBox, OBBox is generally represented by five parameters. The mainstream definitions include the OpenCV convention ( D o c ) and the long-edge-based convention ( D l e ), as shown in Figure 4. The five-parameter format is expressed as c x , c y , w , h , θ , where ( c x , c y ) denotes the center of the OBBox. In the D o c definition, w and h correspond to the first and second edges coinciding with the x-axis after clockwise rotation, and the rotation angle θ lies within the range ( 0 , 90 ] . In contrast, the D l e definition assigns w and h to the shorter and longer edges of the BBox, respectively, and the corresponding angle θ falls within [ 90 , 90 ) .

3.2. Boundary Discontinuity Caused by OBBox

The issue of boundary discontinuity is a unique challenge in OOD and mainly stems from the angle definition scheme of OBBox [37,38,39]. Due to the periodicity of the angle parameter (Periodicity of Angle, PoA), when the anchor or proposal is near horizontal or vertical directions (i.e., when θ approaches the boundaries of its definition range), it becomes difficult for the model to stably determine the regression direction. This results in ambiguous regression paths and leads to abrupt changes and discontinuities in the loss function values. The regression behavior differs significantly between boundary and non-boundary regions, thereby affecting the overall stability and convergence of the training process.
This phenomenon originates from the misalignment between the OBBox representation and the regression loss function, which in turn limits the model’s robustness when dealing with objects at extreme poses. The problem may occur in both mainstream OBBox definitions. In the D o c scheme, boundary discontinuity is influenced by both PoA and exchangeability of edge (EoE), while in the D l e scheme, it is primarily caused by PoA.

3.3. Inconsistency Between IoU Metric and Localization Loss

In OD tasks, IoU is a commonly used evaluation metric, whereas standard localization losses—such as the widely used smooth L 1 in OOD—belong to the family of normalized norm-based losses ( L n - norm ), leading to a degree of inconsistency between the two [32,33]. This inconsistency is further amplified in OOD due to the introduction of angle parameters. As illustrated in Figure 5, the SkewIoU metric and smooth L 1 loss exhibit significant differences in their trends under the following three conditions:
  • Relationship between angular deviation and loss: Although different loss functions maintain monotonicity with respect to angular deviation, the convex nature of smooth L 1 results in large gradient responses to minor angular changes, potentially destabilizing the training process.
  • Relationship between aspect ratio and loss: The smooth L 1 loss remains constant across different aspect ratios, failing to capture variations in OBBox shape, whereas IoU-based losses such as SkewIoU demonstrate sensitivity to aspect ratio changes, providing better adaptability.
  • Relationship between center shift and loss: While most loss functions maintain monotonicity under positional shifts, their consistency differs. Specifically, when the predicted box slightly deviates from the GT box, the smooth L 1 loss increases rapidly, whereas SkewIoU tends to remain stable in non-overlapping cases, exhibiting stronger robustness.

3.4. Sampling Insufficiency and Imbalance in Fixed-Scale LA Strategies

As shown in Figure 6, fixed-scale LA strategies exhibit significant sampling insufficiency when encountering objects with extreme scales (e.g., large aircraft and small vehicles). Due to the constraint of fixed scale thresholds, only a limited number of positive samples can be obtained from certain feature pyramid layers. Even if there are sample points located within the GT box on other layers, they are still treated as negative samples if their scales do not meet the predefined threshold, thus limiting the spatial coverage of positive samples.
For instance, in the case of high-aspect-ratio objects with long edges, strategies based on max( l p , t p , r p , b p ) often assign them to middle- or high-level feature maps. However, the high downsampling rate of these layers leads to sparse sampling in the original image space. Combined with the narrow short edge of the object, this further reduces the number of effective sample points falling within the GT region.
Moreover, in RS scenarios with imbalanced scale distributions, fixed-scale LA strategies are prone to scale bias. For example, when small objects dominate the dataset, positive samples tend to cluster on lower-level feature maps, resulting in insufficient focus on medium- and large-scale objects, thereby affecting overall detector performance. Although methods such as the Fast Single Detector (FSDet) [16] attempt to alleviate this issue by assigning all sample points within GT boxes across all feature layers as positive samples, this approach often introduces a large number of low-quality samples (e.g., background noise) and ambiguous samples (e.g., points simultaneously assigned to multiple objects). This issue is especially prominent in scenes with heavy object overlap, such as ports and shipyards, hindering the effective learning of object features.
In terms of spatial assignment, current LA strategies primarily adopt rectangular BBox regions as sampling areas, as shown in Figure 7a, which introduces substantial background noise near the object boundaries. To improve the quality of positive samples, methods such as Adaptive Object Proposal Generation (AOPG) [40] adopt center-focused sampling strategies, selecting points closer to the object center to enhance the training signal. However, these approaches fail to adequately consider the pronounced aspect ratio variations in RS objects, leading to the misclassification of sample points within the actual object region as negative samples, as illustrated in Figure 7b. This issue is particularly evident for extremely large or high-aspect-ratio objects, exacerbating the sampling insufficiency.
Therefore, it is necessary to develop an LA strategy capable of dynamically adapting to object shape characteristics and spatial geometric distributions, in order to improve positive sample selection across multi-scale feature maps and enhance model adaptability in complex scenes.

4. Methodology

4.1. FBBox Representation

To alleviate issues in OOD such as boundary discontinuity, angular inconsistency, and poor scale adaptability, this study proposes an FBBox representation based on two-dimensional Gaussian distribution. This method adopts a probabilistic modeling approach, introducing statistical properties of the Gaussian distribution to achieve unified modeling of object location, scale, and orientation. As shown in Figure 3c, FBBox effectively captures the geometric attributes of oriented objects.
Specifically, a two-dimensional Gaussian distribution is characterized by a mean vector μ = ( x c , y c ) and a covariance matrix Σ , whose equi-probability contour forms an ellipse. The mean μ represents the geometric center of the object region, while the covariance matrix Σ simultaneously encodes the scale, shape, and orientation information, enabling the precise modeling of geometric properties such as the major axis, minor axis, and rotation angle.
Considering the commonly used HBBox and OBBox annotation formats in RSOD, this study defines the geometric center of a two-dimensional region Ω under uniform distribution as
μ = 1 | Ω | x Ω x d x ,
where μ denotes the geometric center of the object, and | Ω | represents the area of region Ω .
The corresponding covariance matrix is defined as
Σ = 1 | Ω | x Ω x μ x μ d x .
This formulation has clear geometric and physical interpretation: the mean vector μ indicates the central position of the object region; the diagonal elements of the covariance matrix Σ reflect the scale of the object along the x and y axes, which are proportional to the squared width w 2 and squared height h 2 , respectively; and the off-diagonal elements describe the coupling relationship along the object’s orientation, determined by the rotation angle θ , thereby capturing the orientation structure of OBBox.
When the object is in an unrotated state ( θ = 0 ), the corresponding covariance matrix takes the following canonical form:
Σ = 1 w h h / 2 h / 2 w / 2 w / 2 x 2 x y x y y 2 d x d y = w 2 12 0 0 h 2 12 .
The diagonal elements are defined as
a = w 2 12 , b = h 2 12 .
To incorporate the effect of rotation, an affine transformation is applied to the above covariance matrix using a rotation matrix R θ :
Σ = R θ a 0 0 b R θ = cos θ sin θ sin θ cos θ w 2 12 0 0 h 2 12 cos θ sin θ sin θ cos θ = w 2 12 cos 2 θ + h 2 12 sin 2 θ w 2 h 2 12 cos θ sin θ w 2 h 2 12 cos θ sin θ w 2 12 sin 2 θ + h 2 12 cos 2 θ = a c c b ,
where R θ denotes the two-dimensional rotation matrix, and the corresponding covariance matrix elements are defined as
a = w 2 12 cos 2 θ + h 2 12 sin 2 θ , b = w 2 12 sin 2 θ + h 2 12 cos 2 θ , c = w 2 h 2 12 cos θ sin θ .
By applying the rotation matrix R θ to the initial covariance matrix Σ , the rotated covariance matrix Σ is obtained. This process explicitly embeds the rotation angle parameter θ into the matrix expression, enabling adaptive modeling for arbitrarily oriented objects. The rotated covariance matrix preserves scale information, while the off-diagonal term c captures the orientation coupling induced by differences in aspect ratio, thereby enhancing the structural representation capability.
The two-dimensional Gaussian distribution offers several advantages in OOD modeling:
  • Geometric symmetry modeling capability: Due to the elliptical shape of its equi-probability contours, the 2D Gaussian distribution is naturally suited for representing objects with rotational symmetry or approximate elliptical structures. This property helps mitigate boundary overlap issues in cases involving extreme shapes or densely packed objects.
  • Continuity of probability density: Unlike traditional OBBox representations, which tend to exhibit discontinuities when angles approach definition boundaries, the 2D Gaussian distribution maintains smooth boundary transitions through its continuous probability density function, thereby enhancing the stability of angle regression.
  • Coupled parameter optimization capability: The covariance matrix enables the unified modeling of position, scale, and orientation, allowing the loss function (e.g., GEIoU) to jointly optimize geometric properties, thus improving structural alignment and regression consistency.
Compared with existing approaches, conventional OD methods typically adopt a decoupled parameter modeling strategy, where the object’s center coordinates ( x , y ) , width and height ( w , h ) , and rotation angle θ are regressed independently. In scenarios involving high aspect ratios or angles close to discontinuity boundaries, this separation may result in insufficient coupling between optimization objects, thereby affecting prediction stability and accuracy. In contrast, the covariance matrix-based modeling strategy employed in FBBox constructs a joint distribution, enabling consistent modeling across scale, orientation, and position, and reducing the risk of structural misalignments. Furthermore, this modeling approach is mathematically aligned with the subsequently introduced GEIoU loss function, ensuring consistency between the optimization objective during training and the final evaluation metric. This consistency is beneficial for accelerating convergence and improving detection accuracy.
In summary, FBBox theoretically offers greater representational capacity and demonstrates clear performance advantages in practical RSOD tasks. The following sections will further introduce the GEIoU loss function and adaptive LA strategy based on FBBox, systematically illustrating the overall value of the Gaussian modeling paradigm in enhancing RSOD performance.

4.2. Baseline Model

To address the limitations of existing LA strategies that inadequately account for the geometric characteristics of RS objects and thereby restrict detection performance, this study constructed an RSOD model based on an adaptive LA strategy. To validate the effectiveness and robustness of the proposed strategy, a simplified anchor-free detector was adopted as the baseline model. Compared with FCOS, the Fully Convolutional One-Stage Rotated detector (FCOSR) [41] removes the centerness prediction branch, resulting in a more concise and efficient network structure that consists solely of a classification branch and a regression branch, making it suitable for OOD tasks. The overall model architecture is illustrated in Figure 8.
The FCOSR baseline model comprises a feature extraction module and a detection head. The feature extraction part includes a backbone network and a Feature Pyramid Network (FPN), which are used to generate multi-scale semantic features. The detection head consists of classification and regression branches (highlighted in light green in Figure 8). Let the feature maps extracted by the backbone and FPN be denoted as C l and P l R H l × W l × C l , where l indicates the feature level, and H l , W l , and C l denote the height, width, and number of channels, respectively.
Similarly to FCOS, FCOSR utilizes five levels of multi-scale feature maps: P 3 , P 4 , P 5 , P 6 , P 7 . Among them, P 3 , P 4 , and P 5 are generated by applying convolutions to C 3 , C 4 , and C 5 , respectively, while P 6 and P 7 are obtained by downsampling P 5 and P 6 , respectively, to support object modeling with larger receptive fields.
After obtaining the multi-scale feature maps, the model feeds them into the two branches of the detection head to perform per-pixel classification and OBBox regression. As illustrated in Figure 9, let the GT of the i-th object be denoted as g i = ( x i g , y i g , w i g , h i g , θ i g , c i g ) , where ( x i g , y i g ) represents the center coordinates of the GT box, ( w i g , h i g ) denote the width and height, θ i g π 4 , 3 π 4 is the counterclockwise angle between the long side and the x-axis, and c i g is the class label.
To enable per-pixel prediction, each pixel on feature map P l is treated as a training sample, denoted as α j l j = 1 H l × W l . The corresponding location of each sample point in the original image is computed using the following mapping function:
x j p = s l 2 + x ˜ j l s l , y j p = s l 2 + y ˜ j l s l ,
where, ( x ˜ j l , y ˜ j l ) represents the 2D coordinates of sample point α j l on feature map P l , while ( x j p , y j p ) denotes its actual position in the original image. Variable s l denotes the stride of the feature map, and · represents the floor operation.
The class label of each sample point is assigned to match the category of its corresponding object, while the regression GT is defined as the offset between the GT box center and the sample point, computed as
δ x j = x i g x j p , δ y j = y i g y j p .
During inference, the detection head performs independent classification and BBox regression for each pixel on the feature map. Finally, Non-Maximum Suppression (NMS) is applied to eliminate redundant boxes, yielding the predicted categories and locations of objects. It is important to note that the MDAA strategy is not incorporated during inference.
It should be emphasized that FCOSR is adopted in this work solely as a baseline model, primarily for verifying the sample selection mechanism of the proposed MDAA strategy during training. This strategy exhibits strong generalization capability and can be directly applied to other anchor-free detectors (e.g., RTMDet-R), allowing for efficient deployment using similar procedures.

4.3. ODAA Label Assignment Strategy

The ODAA strategy includes two sub-strategies: MSAA distributes samples across feature maps to balance scales and improve multi-scale detection. SGS adjusts the filter mask to match the GT object’s shape and orientation, optimizing spatial allocation and filtering out low-quality samples to enhance detection performance.

4.3.1. MSAA: Multi-Scale Agile Assignment Strategy

This section introduces an adaptive scale-aware sampling strategy designed for handling cross-scale objects in RSI. The core idea is to dynamically select positive sample points across multiple feature map levels based on the scale characteristics of each object. Unlike traditional fixed-threshold scale assignment strategies, the proposed MSAA strategy adopts a top-down approach (from higher to lower levels, i.e., from P 7 to P 3 ) to filter samples, aiming to balance the distribution of positive samples across the feature hierarchy.
Specifically, for each GT object g i in the input image, the strategy employs a decision function Ψ ( · ) to determine whether a sample point α j l on the feature map, when mapped back to the original image, falls within the valid sampling region of the object. If the condition is satisfied, the point is added to the candidate set R l . In this section, the FBBox representation is used to define the sampling region of the object.
After obtaining the candidate sample set R l on the feature map P l , the MSAA strategy selects the top k sample points (where k is a hyperparameter controlling the number of assigned positives per object) with the smallest Euclidean distance to the object center, in descending order from higher to lower levels. These selected points are retained as the reserved sample set S l , whose cardinality n ^ R l is computed as
n ^ S l = min k , n ^ R l ,
where n ^ R l denotes the number of candidate sample points on feature map P l . The retained sample set S l is then merged into the overall positive sample set P , and the corresponding count is subtracted from the remaining allocation budget k. If k > 0 , the same procedure is repeated on the next lower-level feature map until the allocation limit is reached. The complete implementation of this strategy is detailed in Algorithm 1.
Algorithm 1: Algorithm of MSAA strategy
Symmetry 17 00594 i001
Through the above layer-wise assignment mechanism, the MSAA strategy enables the adaptive perception of objects with varying scales:
  • For large-scale objects, it prioritizes assigning positive samples from higher-level feature maps, avoiding excessive sample density at lower levels.
  • For small-scale objects, it relies more on lower-level feature maps to capture sufficient spatial detail.
Through the above mechanism, the MSAA strategy enables adaptive sample assignment tailored to the scale of each GT object. For large-scale objects, the strategy tends to assign more positive samples on higher-level feature maps while reducing assignments on lower-level maps. In contrast, for small-scale objects, more positive samples are allocated on lower-level maps to compensate for the loss of semantic representation in higher layers. This assignment strategy aligns with the widely accepted understanding in OD that high-level feature maps emphasize semantic information, whereas low-level feature maps capture spatial details.
In addition, the strategy significantly reduces the number of ambiguous samples. When a sample point falls within the sampling regions of multiple objects, MSAA assigns it to the one with the longest side to enhance discriminative capability. To further mitigate potential sample omission for small-scale objects, if no candidates exist within a object’s sampling region, the strategy forcefully assigns the nearest unallocated sample point to the object center, thereby ensuring effective supervision for every object during training.
Compared with traditional fixed-scale sampling strategies, MSAA achieves a more balanced hierarchical distribution of positive samples through a top-down progressive sampling process. Fixed-threshold methods often lead to constrained positive sample distributions, typically concentrated on low-level feature maps, resulting in the underutilization of high-level semantic information. Similarly, top-k-only strategies also cause sample aggregation on low-level maps, aggravating the imbalance. By introducing a scale-aware hierarchical sampling mechanism, MSAA effectively alleviates these issues and demonstrates superior scale adaptability, making it particularly suitable for RS detection tasks involving large variations in object scale.

4.3.2. SGS: Spatial Geometric Selector Strategy

The spatial assignment strategy is a critical component in the LA process. Existing methods commonly use the center region of the GT object or the GT box itself as the sampling area (as shown in Figure 10a,b). Although these approaches are easy to implement and computationally efficient, they fail to fully account for the significant variations in aspect ratio and rotation angle of objects in RSI, which can lead to an increased number of noisy samples within the sampling region or result in insufficient sampling coverage.
To enhance the structural adaptability of spatial assignment, this study proposes the SGS strategy (illustrated in Figure 10c). This strategy dynamically adjusts the shape of the sampling region based on the aspect ratio of the object, thereby improving geometric compatibility and the quality control of sample selection.
In the SGS strategy, when the object is approximately square, the sampling region tends to take a circular form. For elongated objects, the sampling region is automatically adjusted to an inscribed elliptical area, with the major axis aligned with the orientation of the object. This design allows the sampling region to more effectively adapt to variations in object shape and rotation, while suppressing low-quality samples near the GT boundary, thus improving the precision and discriminability of positive sample selection.
Decision function definition: Given an object g i and a sample point α j l , the sampling decision is determined by a decision function Ψ ( · ) . This function evaluates whether the sample point falls within the adaptive geometric sampling region of the object. The mathematical formulation is defined as
Ψ ( · ) = True m 2 w i g 12 2 + n 2 h i g 12 2 < ξ False otherwise , ,
where, w i g and h i g denote the width and height of the object g i . Parameters m and n are computed from the object angle θ i g and the original image coordinates ( x j p , y j p ) of the sample point α j l using the following transformation:
m n = cos θ i g sin θ i g sin θ i g cos θ i g x j p y j p .
This transformation projects the sample point coordinates into the coordinate system of the object via a rotation matrix, allowing the elliptical sampling region to align geometrically with the object’s orientation.
To further enhance the adaptability of the sampling region to the object shape, the SGS introduces a scale factor ξ to dynamically control the looseness of the elliptical boundary, defined as
ξ = 1 min w i g , h i g 2 × max w i g , h i g .
The scale factor ξ ( 0 , 0.5 ] varies with the difference in object aspect ratio: when the object is nearly square, ξ approaches 0, and the sampling region approximates a circle; when the object is elongated, ξ increases, and the sampling region becomes more elliptical, better aligning with the object’s principal structural axis.
Through this mechanism, the SGS spatial assignment strategy is explicitly designed to accommodate the geometric characteristics of RSI objects, including aspect ratio variation and directional orientation. Specifically, it offers the following advantages:
  • Dynamically adjusts the sampling region based on object shape, suppressing the inclusion of unrelated background samples near the object boundary;
  • Demonstrates strong shape adaptability, making it suitable for RS detection tasks involving diverse object structures;
  • Enhances the accuracy of positive sample selection, effectively reducing noisy samples near adjacent GT objects and improving discriminability and robustness during training.

4.4. GEIoU Regression Loss

To measure the similarity between a predicted object and GT object, this study proposes a GEIoU metric based on the Bhattacharyya distance. Let the predicted and GT objects be represented by probability density functions (PDFs) p ( x ) and q ( x ) , respectively. Their similarity can be expressed through the Bhattacharyya coefficient B C ( p , q ) as
B C ( p , q ) = R 2 p ( x ) q ( x ) d x = exp ( B D ( p , q ) ) ,
where B D ( p , q ) denotes the Bhattacharyya distance, which quantifies the divergence between two probability distributions. A larger B C value indicates greater overlap between the distributions.
Assume p N ( μ 1 , Σ 1 ) and q N ( μ 2 , Σ 2 ) are two 2D Gaussian distributions, whose mean vectors and covariance matrices are defined as
μ 1 = x 1 y 1 , Σ 1 = a 1 c 1 c 1 b 1 , μ 2 = x 2 y 2 , Σ 2 = a 2 c 2 c 2 b 2 .
The Bhattacharyya distance B D ( p , q ) can be decomposed into two parts, a center deviation penalty and a shape difference penalty, expressed as
B D ( p , q ) = 1 8 ( μ 1 μ 2 ) Σ avg 1 ( μ 1 μ 2 ) B 1 + 1 2 ln det Σ avg det Σ 1 det Σ 2 B 2 , Σ avg = 1 2 ( Σ 1 + Σ 2 ) .
The physical interpretations of these two components are as follows:
  • B 1 (center deviation term) measures the difference in center positions between the predicted box and the GT box; it is equivalent in form to a weighted Mahalanobis distance. When the centers are perfectly aligned, B 1 = 0 .
  • B 2 (shape difference term) quantifies the difference in scale and orientation between the two boxes. This term is based on the determinants of the covariance matrices; when the predicted and GT boxes share identical scale and orientation, B 2 = 0 .
In further expanding the covariance matrices into scalar form and letting Δ x = x 1 x 2 and Δ y = y 1 y 2 , components B 1 and B 2 can be explicitly expressed as
B 1 = 1 4 · ( a 1 + a 2 ) ( Δ y ) 2 + ( b 1 + b 2 ) ( Δ x ) 2 2 ( c 1 + c 2 ) Δ x Δ y ( a 1 + a 2 ) ( b 1 + b 2 ) ( c 1 + c 2 ) 2 , B 2 = 1 2 ln ( a 1 + a 2 ) ( b 1 + b 2 ) ( c 1 + c 2 ) 2 4 ( a 1 b 1 c 1 2 ) ( a 2 b 2 c 2 2 ) .
From a geometric perspective, the interpretations of these terms are as follows:
  • Center deviation term ( B 1 ): In the elliptical coordinate system, this term penalizes deviations along the short axis more heavily than those along the major axis.
  • Shape difference term ( B 2 ): This term quantifies the overall difference in scale and orientation between the predicted and GT boxes. Based on the ratio of covariance matrix determinants, it indirectly reflects the alignment in area and orientation of the ellipses—larger values indicate greater shape disparity.
To further enhance the metric’s mathematical rigor, the Bhattacharyya coefficient can be transformed into the Hellinger distance, defined as
H D ( p , q ) = 1 B C ( p , q ) .
The Hellinger distance satisfies all standard properties of a distance metric, including symmetry, non-negativity, and the triangle inequality, thereby ensuring the theoretical soundness and convergence stability of the GEIoU.
Based on this, the Gaussian Elliptical IoU (GEIoU) is defined as
GEIoU ( p , q ) = 1 H D ( p , q ) .
The corresponding regression loss function is
L GEIoU ( p , q ) = H D ( p , q ) .
When the predicted object matches the GT perfectly, the Hellinger distance reaches its minimum, i.e., L GEIoU = 0 , and the GEIoU attains its maximum value, indicating optimal prediction accuracy.
The advantages of GEIoU loss can be summarized as follows:
  • Compared with loss functions such as SkewIoU, GEIoU maintains a more consistent optimization trend. Even when the predicted box and the GT box have no overlap (as shown in Figure 5c), its value remains greater than zero, alleviating the gradient vanishing problem commonly associated with traditional IoU in non-overlapping regions.
  • It handles the “subset inclusion” problem: when Ω 1 Ω 2 , GEIoU increases monotonically with improved region alignment.
  • It satisfies all axioms of a conventional distance metric, particularly symmetry and the triangle inequality.
  • It is scale-invariant: if object regions Ω 1 and Ω 2 are simultaneously scaled by a factor s, the GEIoU value remains unchanged. Specifically, if
p 1 N ( μ 1 , Σ 1 ) , p 2 N ( μ 2 , Σ 2 ) ,
and their scaled versions are
p 1 N ( s μ 1 , s 2 Σ 1 ) , p 2 N ( s μ 2 , s 2 Σ 2 ) ,
then it holds that
GEIoU ( p 1 , p 2 ) = GEIoU ( p 1 , p 2 ) .
Multi-task loss function. To further improve model performance, a multi-task loss function L is constructed based on GEIoU, combining classification and regression losses:
L = λ 1 N pos i L cls ( c i , l i g ) + λ 2 N pos i 1 [ l i g 1 ] · L GEIoU ( p i , g i ) .
Here, λ 1 and λ 2 are weighting coefficients (set by default to [ 1 , 2 ] ), and N pos denotes the number of positive samples. c i and p i are the predicted class and location of the i-th sample, while l i g and g i denote its ground-truth label and location. The classification loss L cls is computed using Focal Loss to improve robustness against class imbalance.

5. Experimentation

5.1. Datasets

The HRSC2016 dataset [1], released in 2016, is widely used for ship detection tasks. This dataset contains three major categories and 27 subcategories, comprising a total of 1061 RSI images with 2976 annotated ship instances. The images are split into a training set (436 images), a validation set (181 images), and a test set (444 images). Image sizes range from 300 × 300 to 1500 × 900, with most exceeding 1000 × 600. The spatial resolution varies between 0.4 m and 2 m, making the dataset suitable for fine-grained object recognition tasks. The images were collected from six different ports and include both offshore and coastal ships, offering strong category diversity and scene representativeness.
The UCAS-AOD dataset [42], released in 2014 and expanded in 2015, is primarily used for aircraft and vehicle detection. The dataset includes a total of 2420 images, consisting of 600 aircraft images, 310 vehicle images, and several negative samples. The dataset is divided into a training set (755 images), a validation set (302 images), and a test set (453 images), with 14,596 annotated object instances in total, including 3210 aircraft and 2819 vehicles. It is suitable for multi-category OOD tasks.

5.2. Implementation Details

All experiments were performed using the MMRotate detection framework (version 1.0.0rc1) [43], and both training and inference were performed on a single NVIDIA RTX 2080Ti GPU with 22 GB of memory. All training images were uniformly resized to a resolution of 800 × 800 , with a batch size of 2. The AdamW optimizer was employed with parameter settings of β 1 = 0.9 , β 2 = 0.999 , a weight decay of 0.05, and an initial learning rate of 0.001. The learning rate was scheduled using the CosineAnnealingLR strategy to enable dynamic decay. Specifically, the first 5 epochs adopted a linear warm-up strategy starting from a learning rate of 0.001. Throughout training, the learning rate followed a “warm-up → gradual decay → stable convergence” pattern, which provided strong adaptability to different training phases. The UCAS-AOD and HRSC2016 datasets were trained on for 24 and 72 epochs, respectively, to accommodate variations in object quantity, complexity, and distribution.
To ensure reproducibility and fairness, only random rotation and random flipping were applied as data augmentation strategies during both training and inference, thereby avoiding the introduction of additional prior bias. In terms of network architecture, the RTMDet-R model adopted CSPNeXt-L as the backbone for feature extraction, while the FCOSR model utilized ResNet-50. All models were initialized with publicly available weights pre-trained on ImageNet.
Regarding evaluation metrics, the HRSC2016 dataset adopted both the mean Average Precision based on the PASCAL VOC 2007 standard (mAP(07) [44]) and the PASCAL VOC 2012 standard (mAP(12) [45]), both evaluated at an IoU threshold of 0.5. This dual-metric configuration allows for a comprehensive assessment of detection performance. In contrast, the UCAS-AOD dataset employed mAP(07) as the sole evaluation metric.
This evaluation strategy aligns with standard practices in RSOD tasks. The HRSC2016 dataset contains a wide variety of object categories and substantial scale variation, making it suitable for dual-metric evaluation to capture model performance from multiple perspectives. In contrast, the UCAS-AOD dataset includes fewer object classes with relatively uniform distributions, and the single mAP(07) metric is sufficient to effectively reflect detection capability.

5.3. Ablation Studies

All experiments in this section were conducted using FCOSR as the baseline model, with smooth L 1 as the default regression loss function and FCOS LA strategy. Component-wise ablation studies were performed on the UCAS-AOD and HRSC2016 datasets to evaluate the individual effectiveness and joint performance of the proposed MDAA strategy and GEIoU regression loss.
Ablation Studies on the Effectiveness of the Proposed Components. The results in Table 1 and Table 2 demonstrate that both the proposed MDAA strategy and GEIoU loss consistently contribute to performance improvements on both datasets. On the UCAS-AOD dataset, the baseline model achieves an mAP(07) of 87.57%, which is partly due to the limited coverage of traditional assignment strategies, leading to the inclusion of low-quality samples during training. The introduction of the MDAA strategy improves mAP(07) by 0.67% to 88.24%, indicating that this strategy effectively performs adaptive sample selection based on object scale, shape, and orientation, thereby enhancing the modeling of key features.
On the HRSC2016 dataset, where ship objects typically exhibit high aspect ratios, the baseline achieves an mAP(07) and mAP(12) of 87.92% and 91.87%, respectively. With MDAA, these metrics increase to 88.75% and 92.34%, respectively, demonstrating the adaptability of MDAA in handling high-aspect-ratio OD tasks.
Furthermore, the experiments confirm the advantages of GEIoU loss in improving regression accuracy. Compared with smooth L 1 loss, GEIoU brings mAP(07) improvements of 1.25% and 1.34% on the UCAS-AOD and HRSC2016 datasets, respectively. This improvement is attributed to GEIoU’s ability to jointly model position, scale, and orientation through covariance representation, thereby enhancing regression consistency and mitigating error accumulation caused by parameter decoupling.
When both MDAA and GEIoU loss are applied simultaneously, detection performance is further improved. On UCAS-AOD, the mAP reaches 89.29%, while on HRSC2016, mAP(07) and mAP(12) improve to 89.81% and 94.75%, respectively. These results suggest that the proposed modules exhibit strong complementarity in sample selection and geometric alignment, significantly enhancing the model’s capacity for complex object structure modeling and detection robustness.
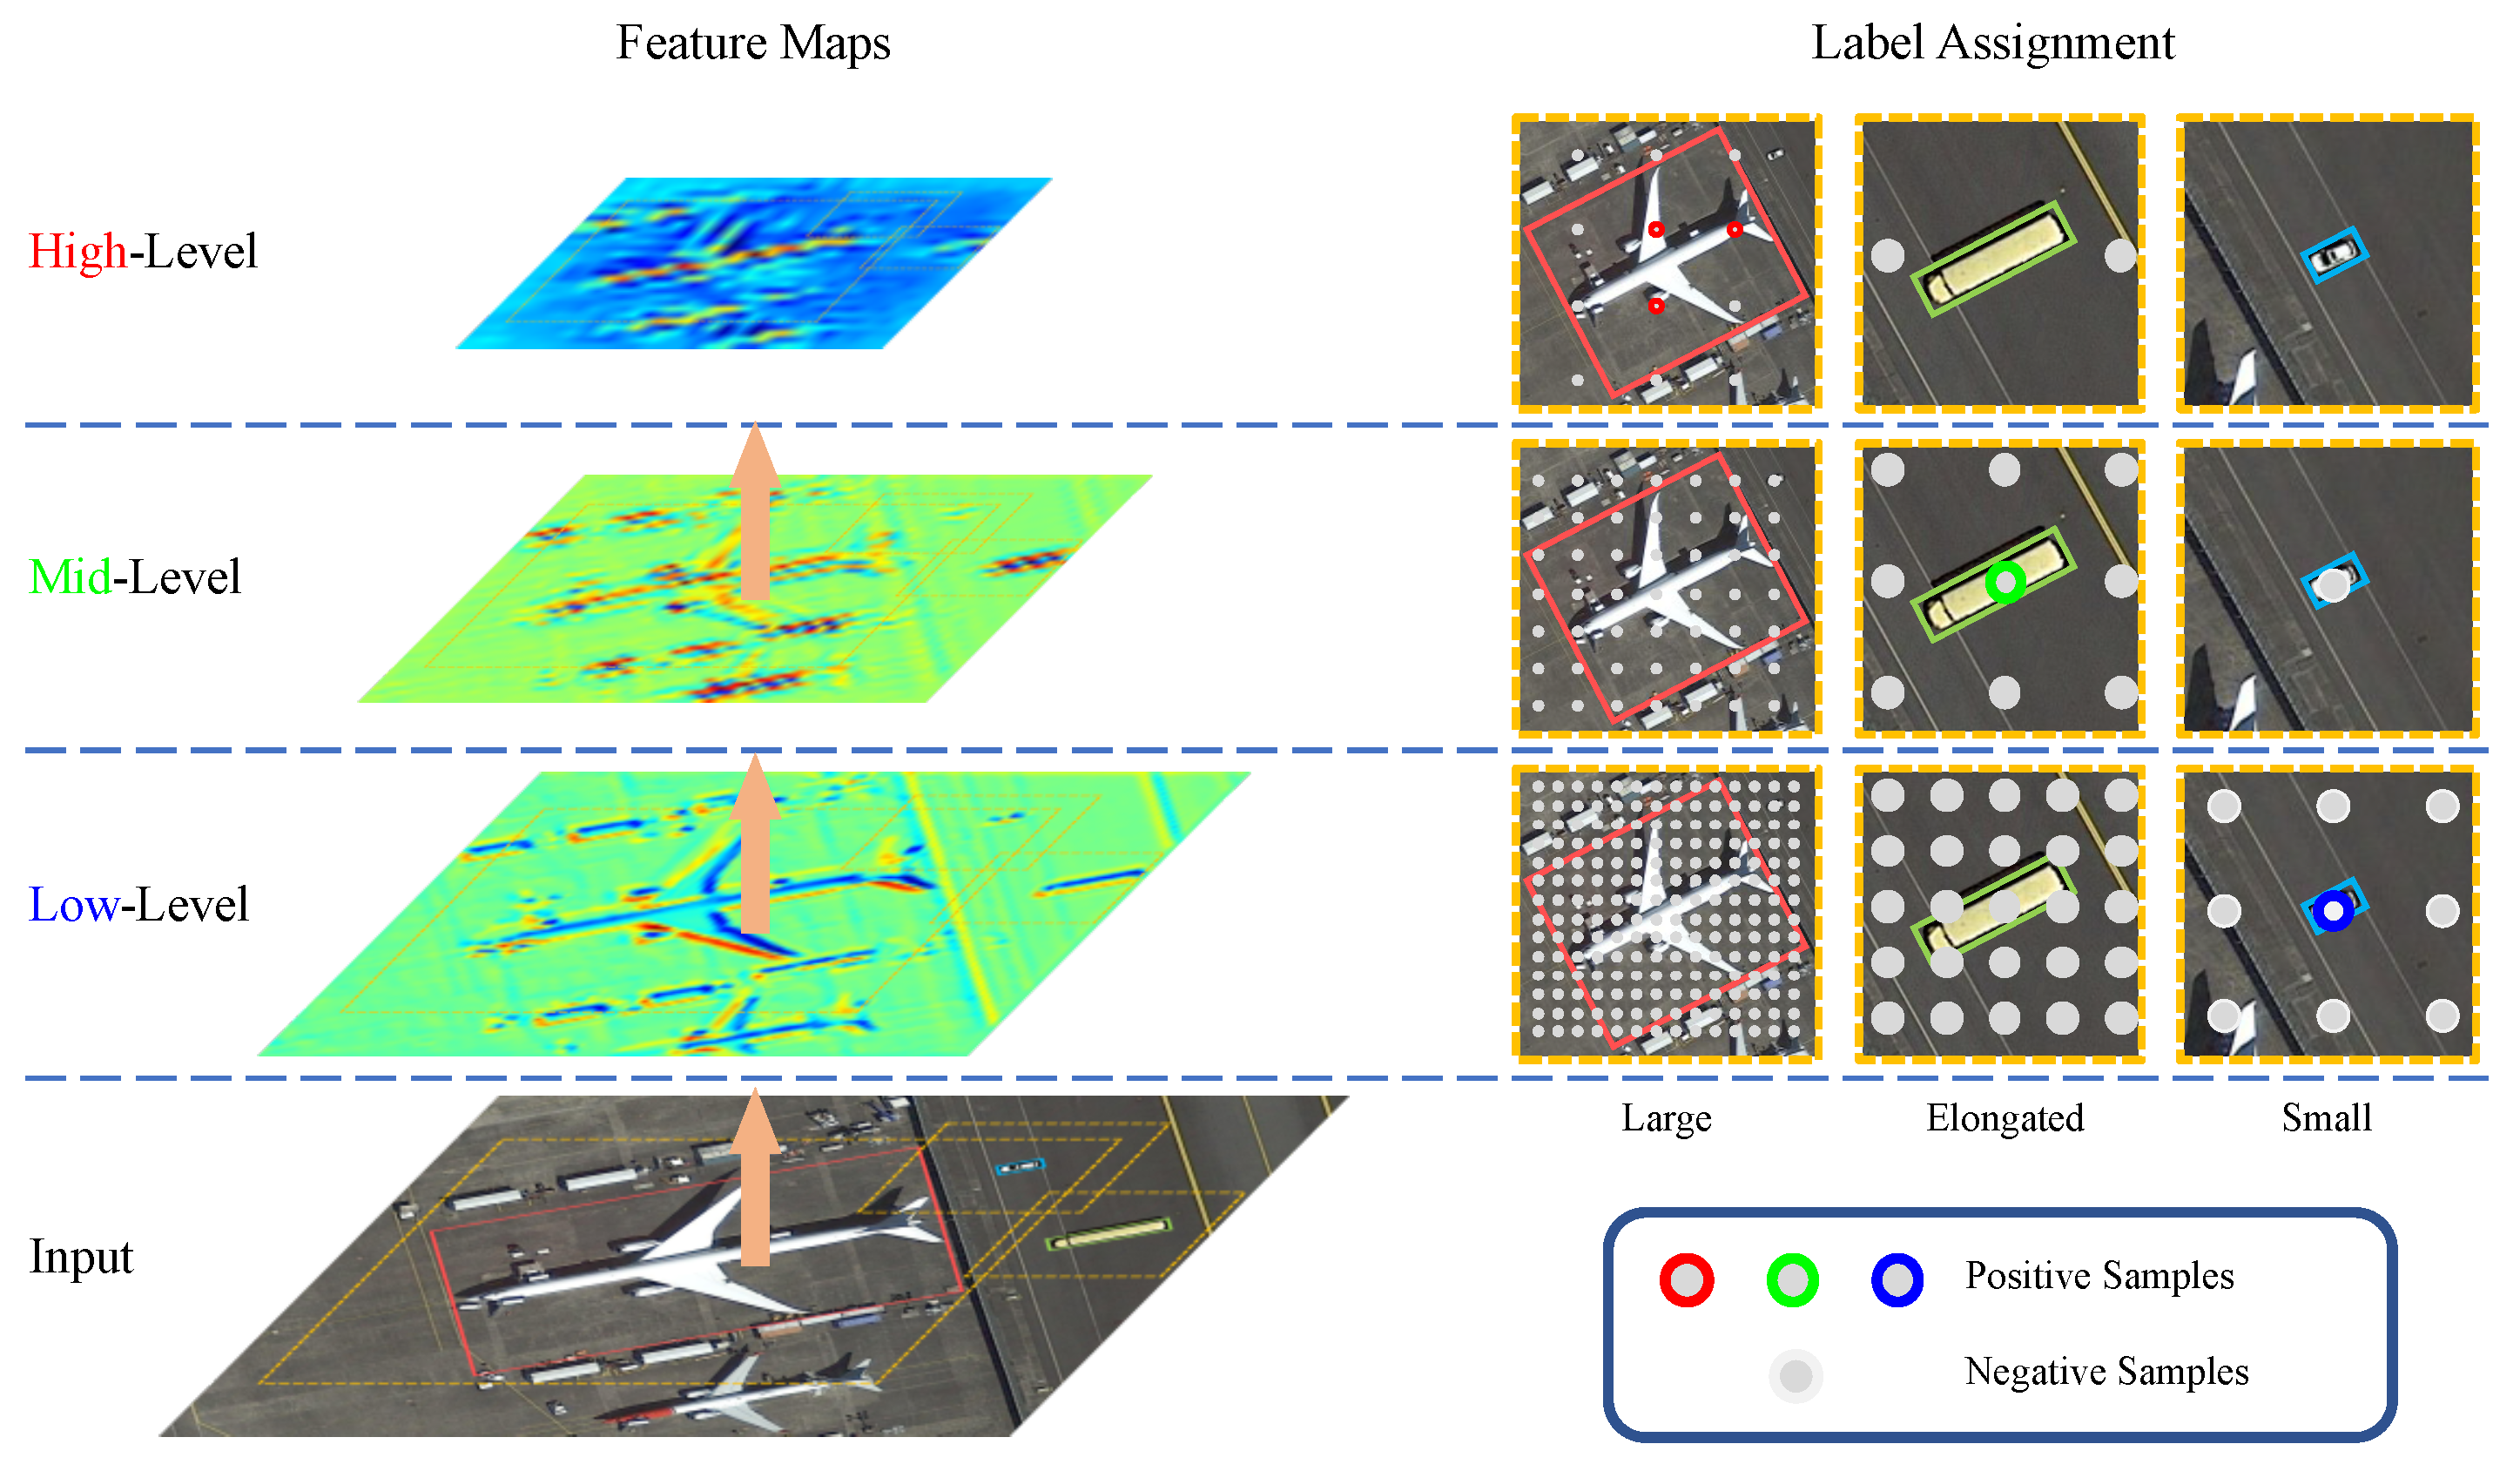
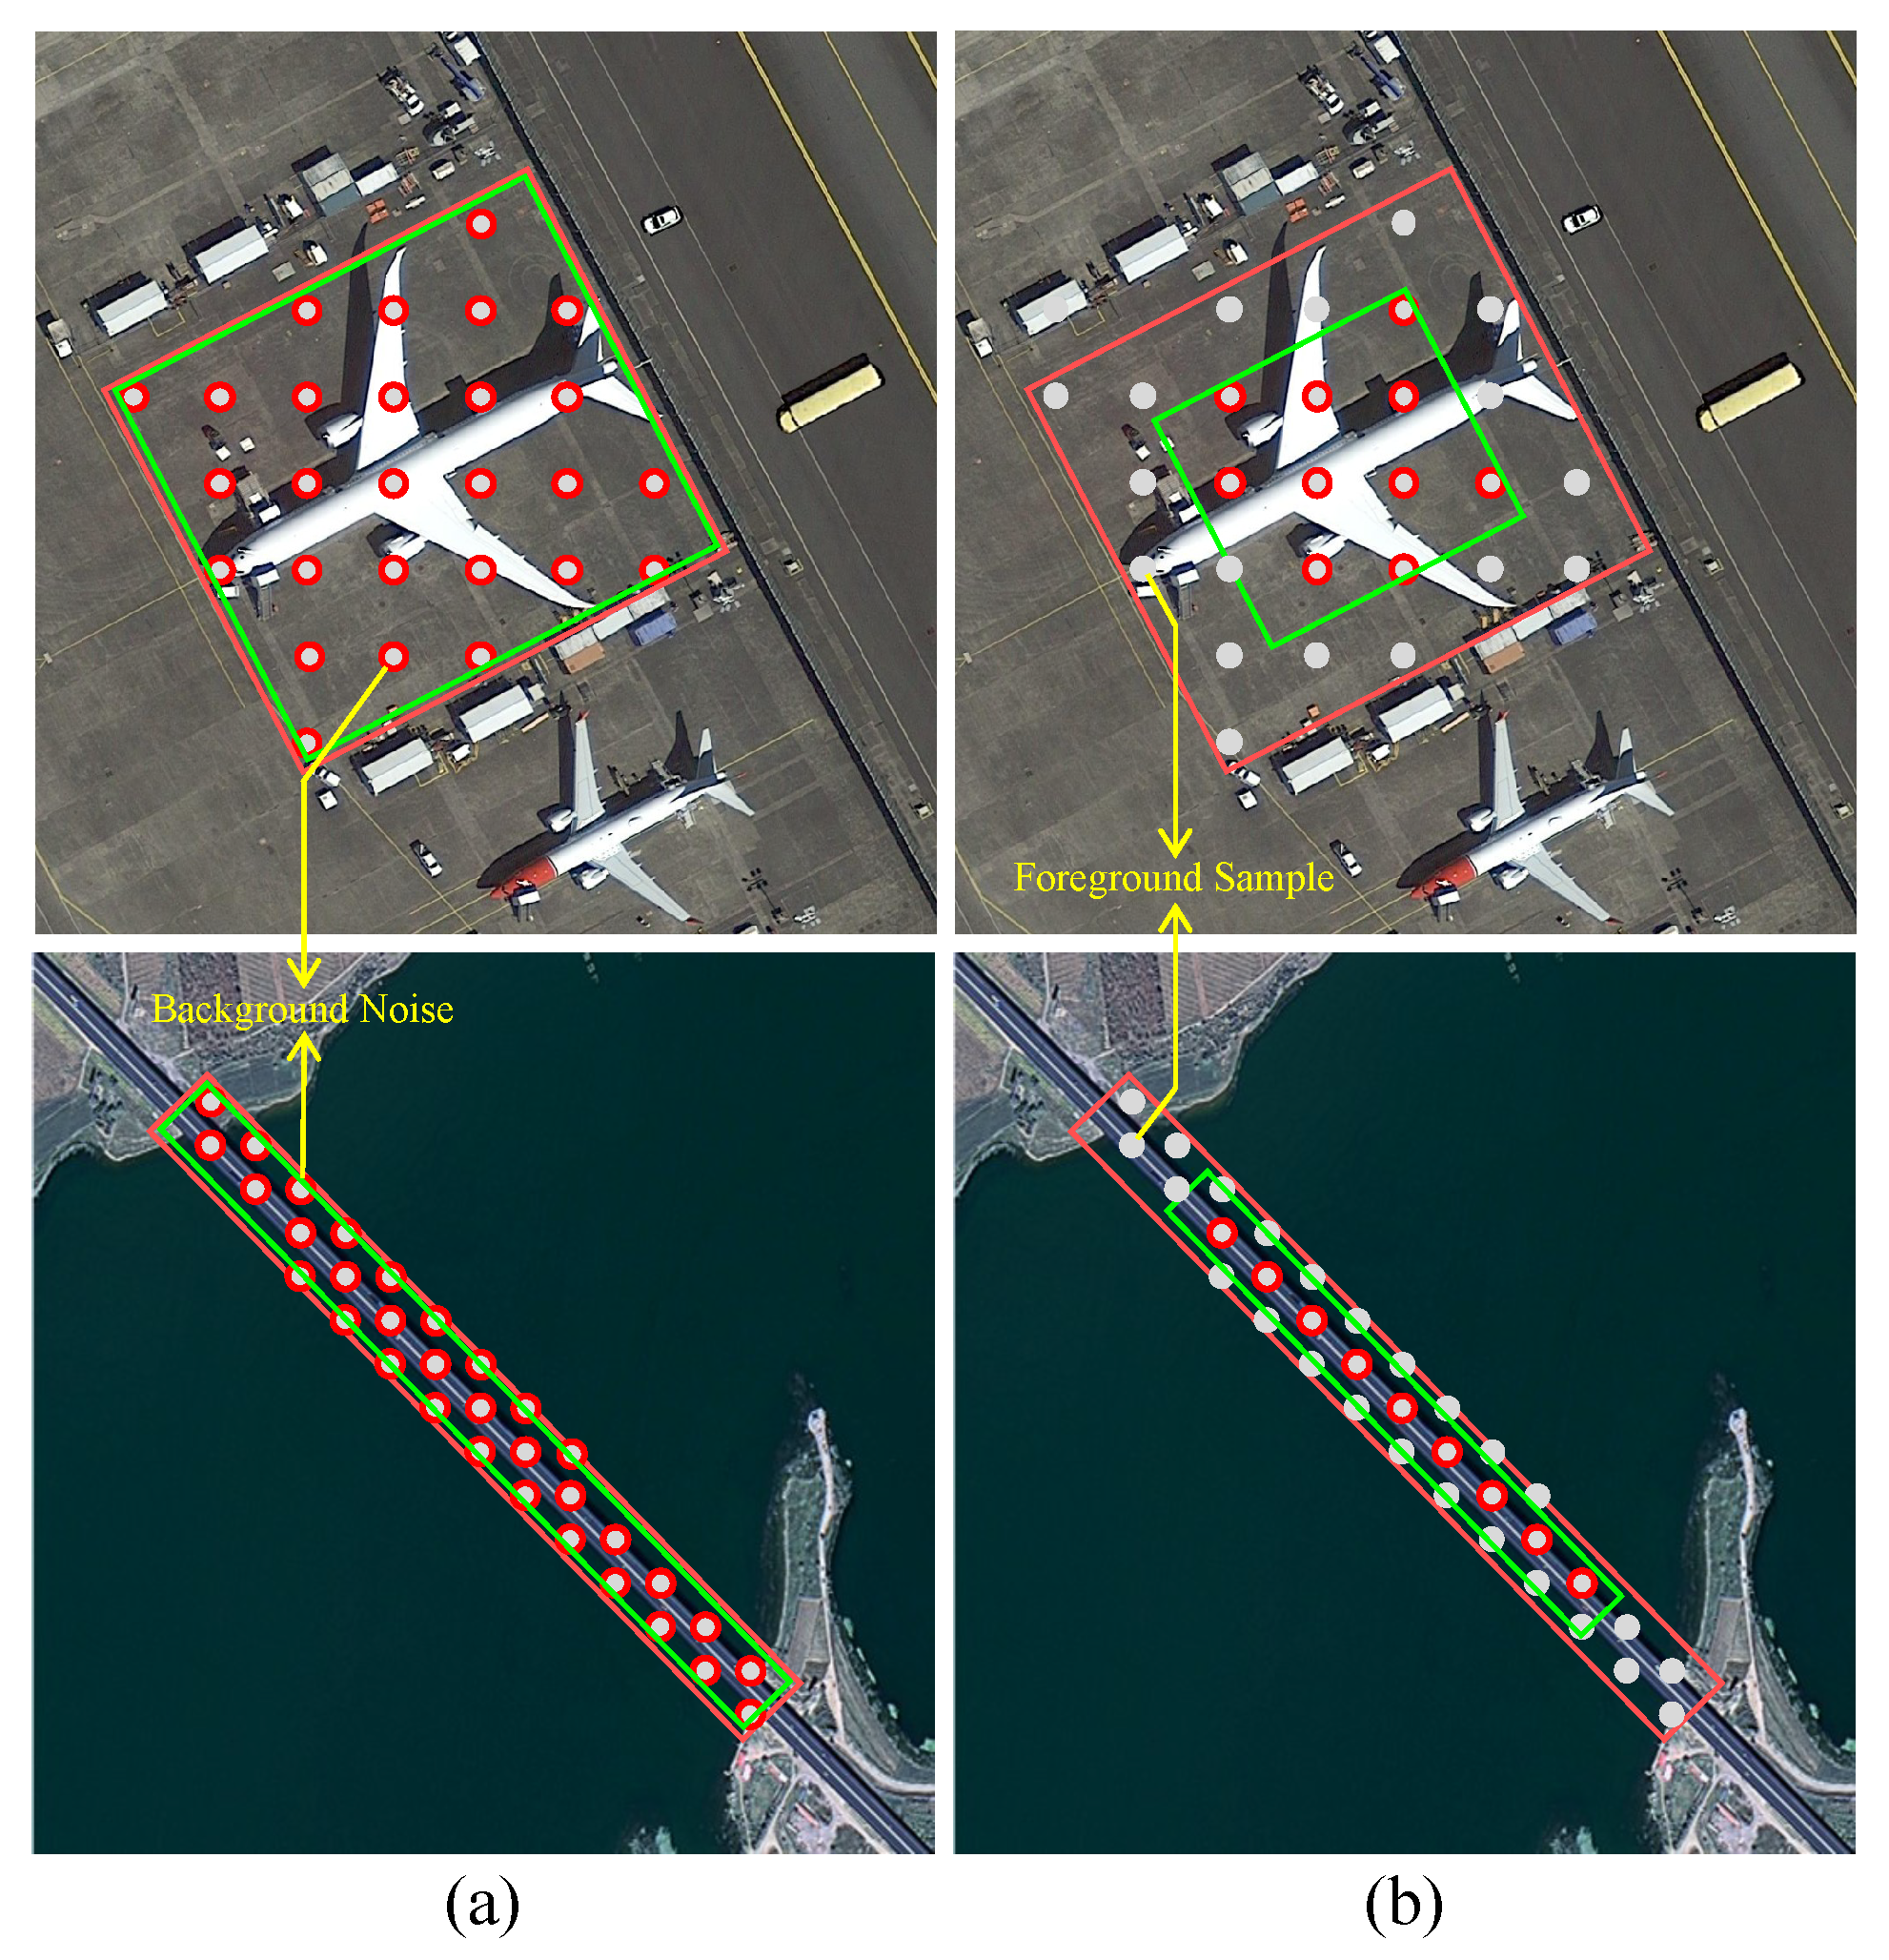
Ablation Studies on the Effectiveness of the Proposed MDAA Strategy. As shown in Table 3 and Table 4, the experimental results demonstrate that the MSAA strategy effectively addresses the common challenges of insufficient sampling and imbalanced sample distribution in extreme-scale and high-aspect-ratio object detection (OD) tasks. Compared with the baseline, incorporating MSAA alone yields a 0.25% improvement in mAP on the UCAS-AOD dataset, and increases mAP(07) and mAP(12) by 0.29% and 0.09%, respectively, on the HRSC2016 dataset. These results suggest that MSAA demonstrates strong adaptability and generalization in sample-scale assignment.
Taking the car and airplane categories as examples, the baseline model suffers from limited sample coverage on specific feature levels, making it difficult to capture multi-scale object features effectively. With MSAA, the sample distribution becomes more balanced across feature levels, thereby enhancing the model’s ability to learn objects with varying scales.
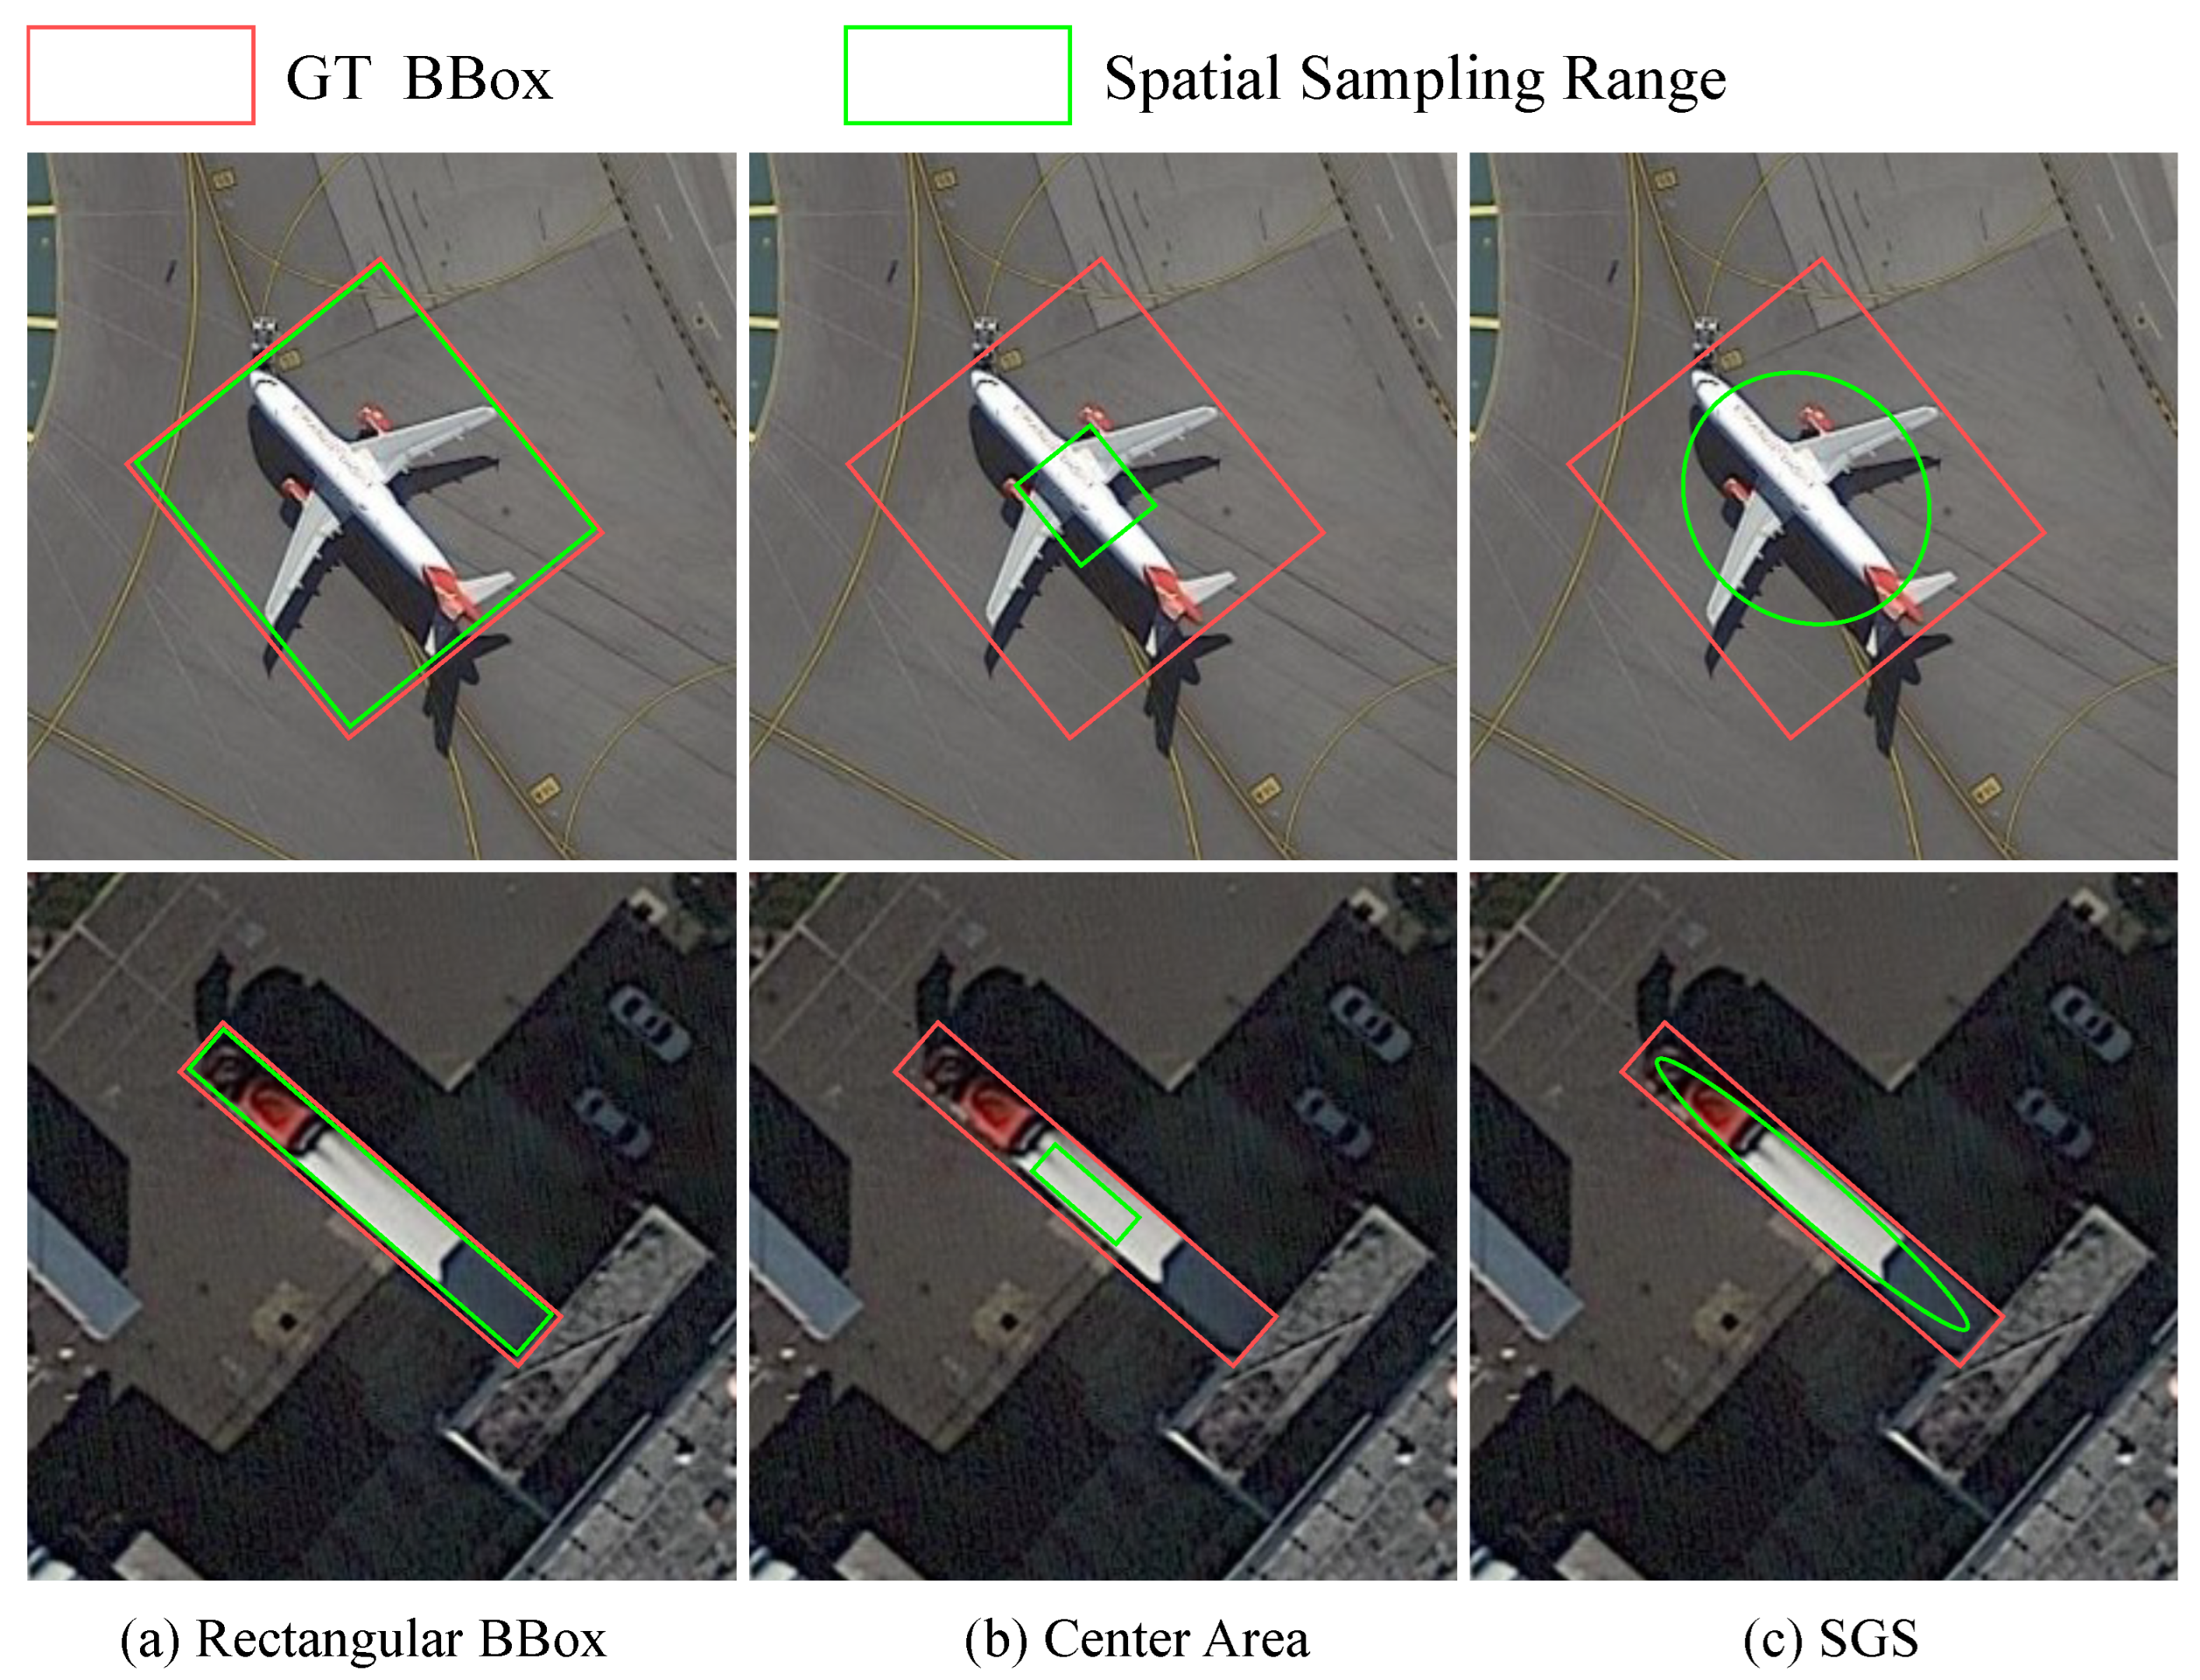
An ablation analysis was conducted on the effectiveness of the proposed SGS strategy. The SGS strategy enhances the structural adaptability of sample selection by constructing a geometry-aware spatial sampling region. Results show that applying SGS alone improves mAP by 0.44% on UCAS-AOD, and increases mAP(07) and mAP(12) by 0.56% and 0.28%, respectively, on HRSC2016. These improvements demonstrate that SGS effectively enhances the model’s capacity to handle variations in object orientation and shape, thereby improving recognition performance on high-aspect-ratio objects.
Furthermore, when MSAA and SGS are used in combination, detection performance is further improved. On the UCAS-AOD dataset, mAP reaches 88.24%, representing a 0.67% gain over the baseline; on HRSC2016, mAP(07) and mAP(12) are improved to 88.75% and 92.34%, respectively. This indicates that SGS reinforces the scale adaptation ability of MSAA at the spatial distribution level, and the joint design of the two modules exhibits strong complementarity, contributing to enhanced detection performance and robustness in complex RS scenarios.
Effectiveness analysis of the GEIoU loss function. Table 5 and Table 6 present the performance impact of different regression loss functions on the UCAS-AOD and HRSC2016 datasets, respectively. In the baseline model, smooth L 1 is used for BBox regression. Due to the independent regression of each geometric parameter, this method suffers from offset errors caused by parameter decoupling, resulting in an mAP of 87.57% on the UCAS-AOD dataset and 87.92% (mAP(07)) / 91.87% (mAP(12)) on HRSC2016.
To enhance regression consistency, two distribution-based loss functions—GWD and KLD—were introduced. Both optimize the shape and positional alignment between the predicted and ground-truth boxes through distribution similarity. KLD, with its scale-invariant property, performs slightly better than GWD overall. However, both methods rely on hyperparameters embedded in nonlinear functions, and their sensitivity to dataset-specific parameter tuning limits generalization in cross-dataset scenarios.
In contrast, the proposed GEIoU loss is designed without reliance on additional hyperparameters, while offering both scale invariance and strong structural alignment. On the UCAS-AOD dataset, GEIoU achieves a 1.25% mAP improvement over the baseline; on HRSC2016, it improves mAP(07) and mAP(12) by 1.34% and 2.04%, respectively. These results demonstrate that GEIoU exhibits strong generalization and robustness across datasets, and effectively aligns the optimization direction of the regression loss with that of the evaluation metric.
Effectiveness analysis of different LA strategies. To evaluate the impact of LA strategies in RSOD, comparative experiments were conducted on the UCAS-AOD and HRSC2016 datasets using FCOSR as the baseline. Apart from the LA strategies, all other settings were kept identical. FCOS’s original strategy, ATSS, SimOTA, and the proposed MDAA were, respectively, substituted. Performance results are shown in Table 7 and Table 8.
On the UCAS-AOD dataset, FCOS, ATSS, and SimOTA achieve mAPs of 87.57%, 87.66%, and 88.01%, respectively, while MDAA achieves 88.24%, yielding superior performance across all categories. A similar trend is observed on the HRSC2016 dataset: FCOS achieves 87.92% (mAP(07)) and 91.87% (mAP(12)); ATSS achieves 88.28% and 92.04%; SimOTA reaches 88.67% and 92.26%; all are surpassed by MDAA, which attains 88.75% and 92.34%. These results indicate that MDAA exhibits superior adaptability and LA efficiency in RSOD scenarios.
From the perspective of assignment mechanisms, FCOS treats all pixels within the GT region as positive samples without considering object scale or geometric structure, leading to lower positive sample quality. SimOTA performs reliably in horizontal box detection, but lacks directional modeling in OOD, which limits convergence. ATSS introduces a center-based assignment mechanism, but was originally designed for natural images and is less suited for RS scenes with large-scale variation and dense objects.
In contrast, MDAA incorporates object scale, shape, and orientation, offering enhanced geometric adaptability and positive sample selection during assignment. Its superior performance highlights the importance of geometry-aware assignment mechanisms in RSI, contributing to improved detection accuracy and model robustness.
Rationality analysis of the hyperparameter k setting. To enhance the structure-aware capability of the sample assignment strategy, a top-k candidate selection mechanism was introduced during the positive sample screening phase. To investigate the impact of this hyperparameter, a systematic evaluation was conducted on both the UCAS-AOD and HRSC2016 datasets. The results are shown in Table 9.
On the UCAS-AOD dataset, the model achieved the best performance when k = 14 , with an mAP of 88.24%. On HRSC2016, the optimal result was obtained when k = 15 , reaching an mAP(07) of 88.75%. These findings indicate that the proposed mechanism exhibits good adaptability across different RS data structures.
The performance differences can be attributed to variations in object distribution and scale characteristics between the two datasets. In UCAS-AOD, where small objects are densely distributed, a smaller k helps to balance noise control and sample diversity. In contrast, HRSC2016 predominantly features objects with high aspect ratios, where increasing k improves feature coverage near object boundaries.
In general, a small k results in insufficient positive samples, limiting the model’s ability to learn from diverse structures; a large k, on the other hand, introduces more edge or noisy samples, thereby degrading detection accuracy. For example, on UCAS-AOD, mAP increases from 87.68% at k = 12 to a peak of 88.24% at k = 14 , but then drops to 87.49% when k increases to 18. A similar trend is observed in HRSC2016, where the best performance is achieved at a moderate k.
In summary, the selection of k should balance “high-quality sample density” and “spatial coverage range.” A well-chosen value improves detection performance, reduces noise interference, and enhances the model’s generalization ability across various object structures, reflecting the practical value and robustness of this selection mechanism in RSOD tasks.

5.4. Comparative Experiments

To further evaluate the overall performance of the proposed method, a comparative study was conducted on the HRSC2016 dataset against several representative OOD methods, with all approaches implemented under a unified RTMDet-R detection framework.
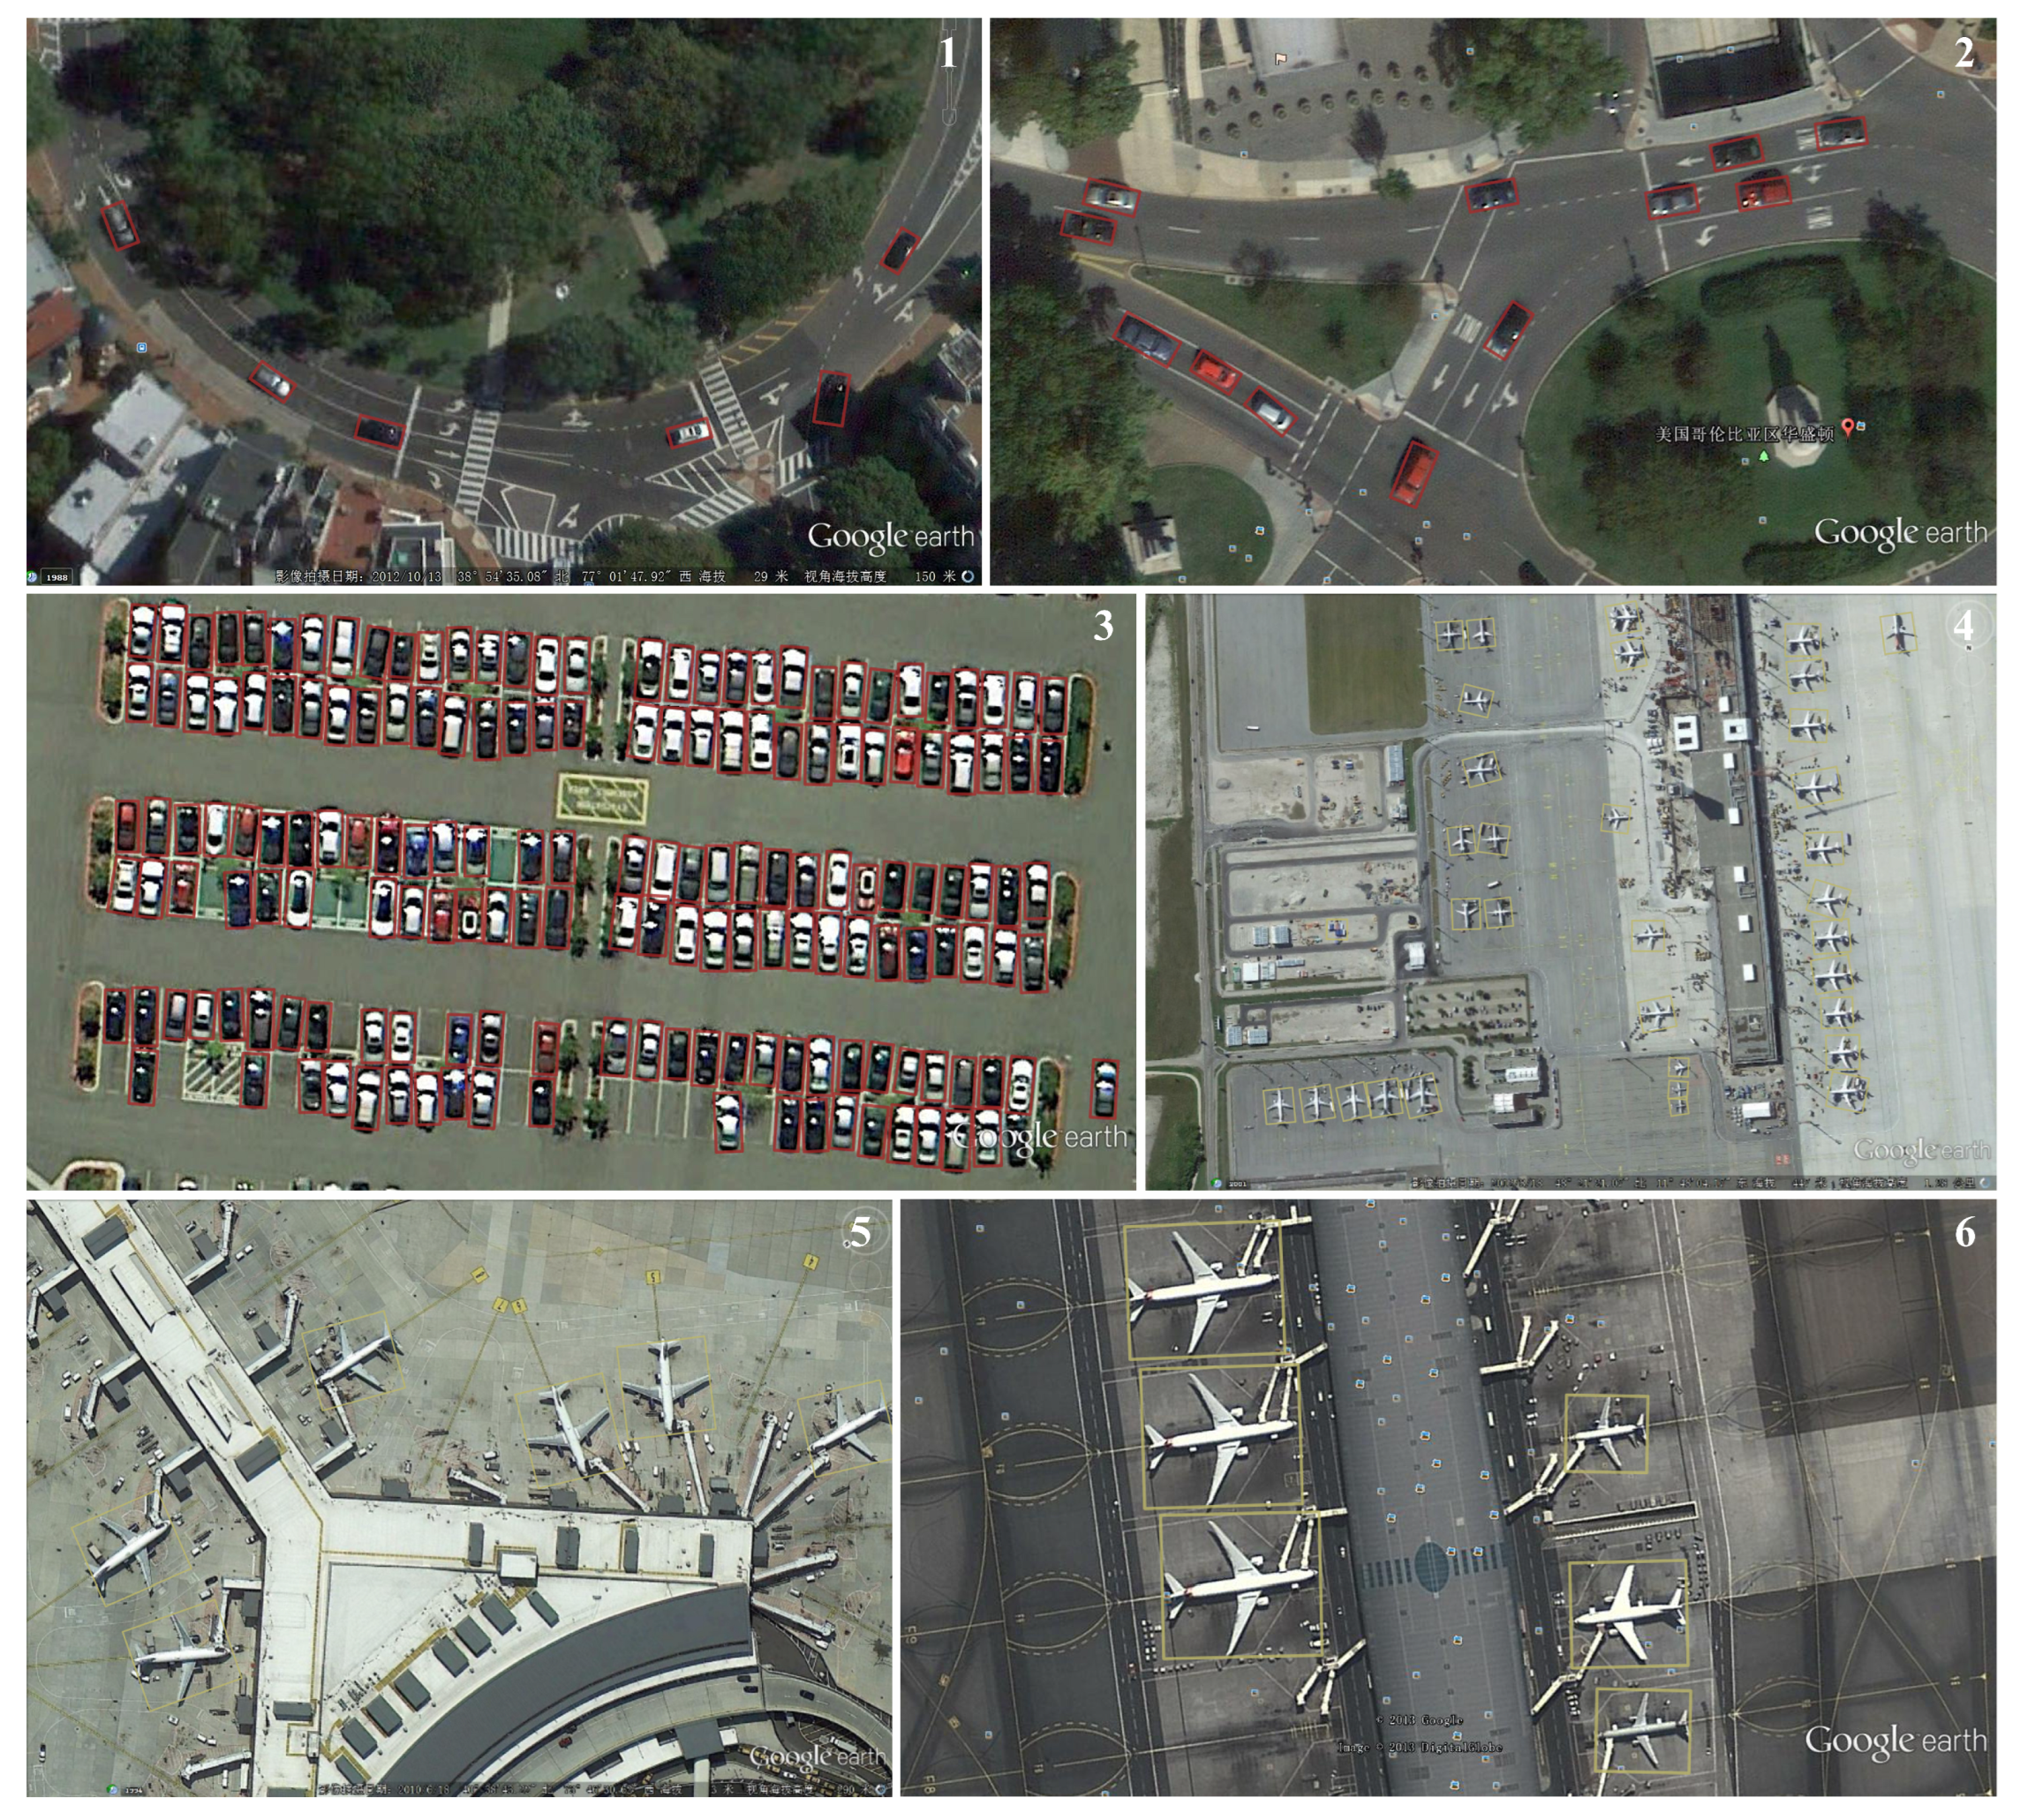
Experimental results (Table 10) show that the proposed method achieves an mAP(07) of 90.53% and an mAP(12) of 96.24% on the HRSC2016 dataset, outperforming all compared approaches. As illustrated in the visualization results in 
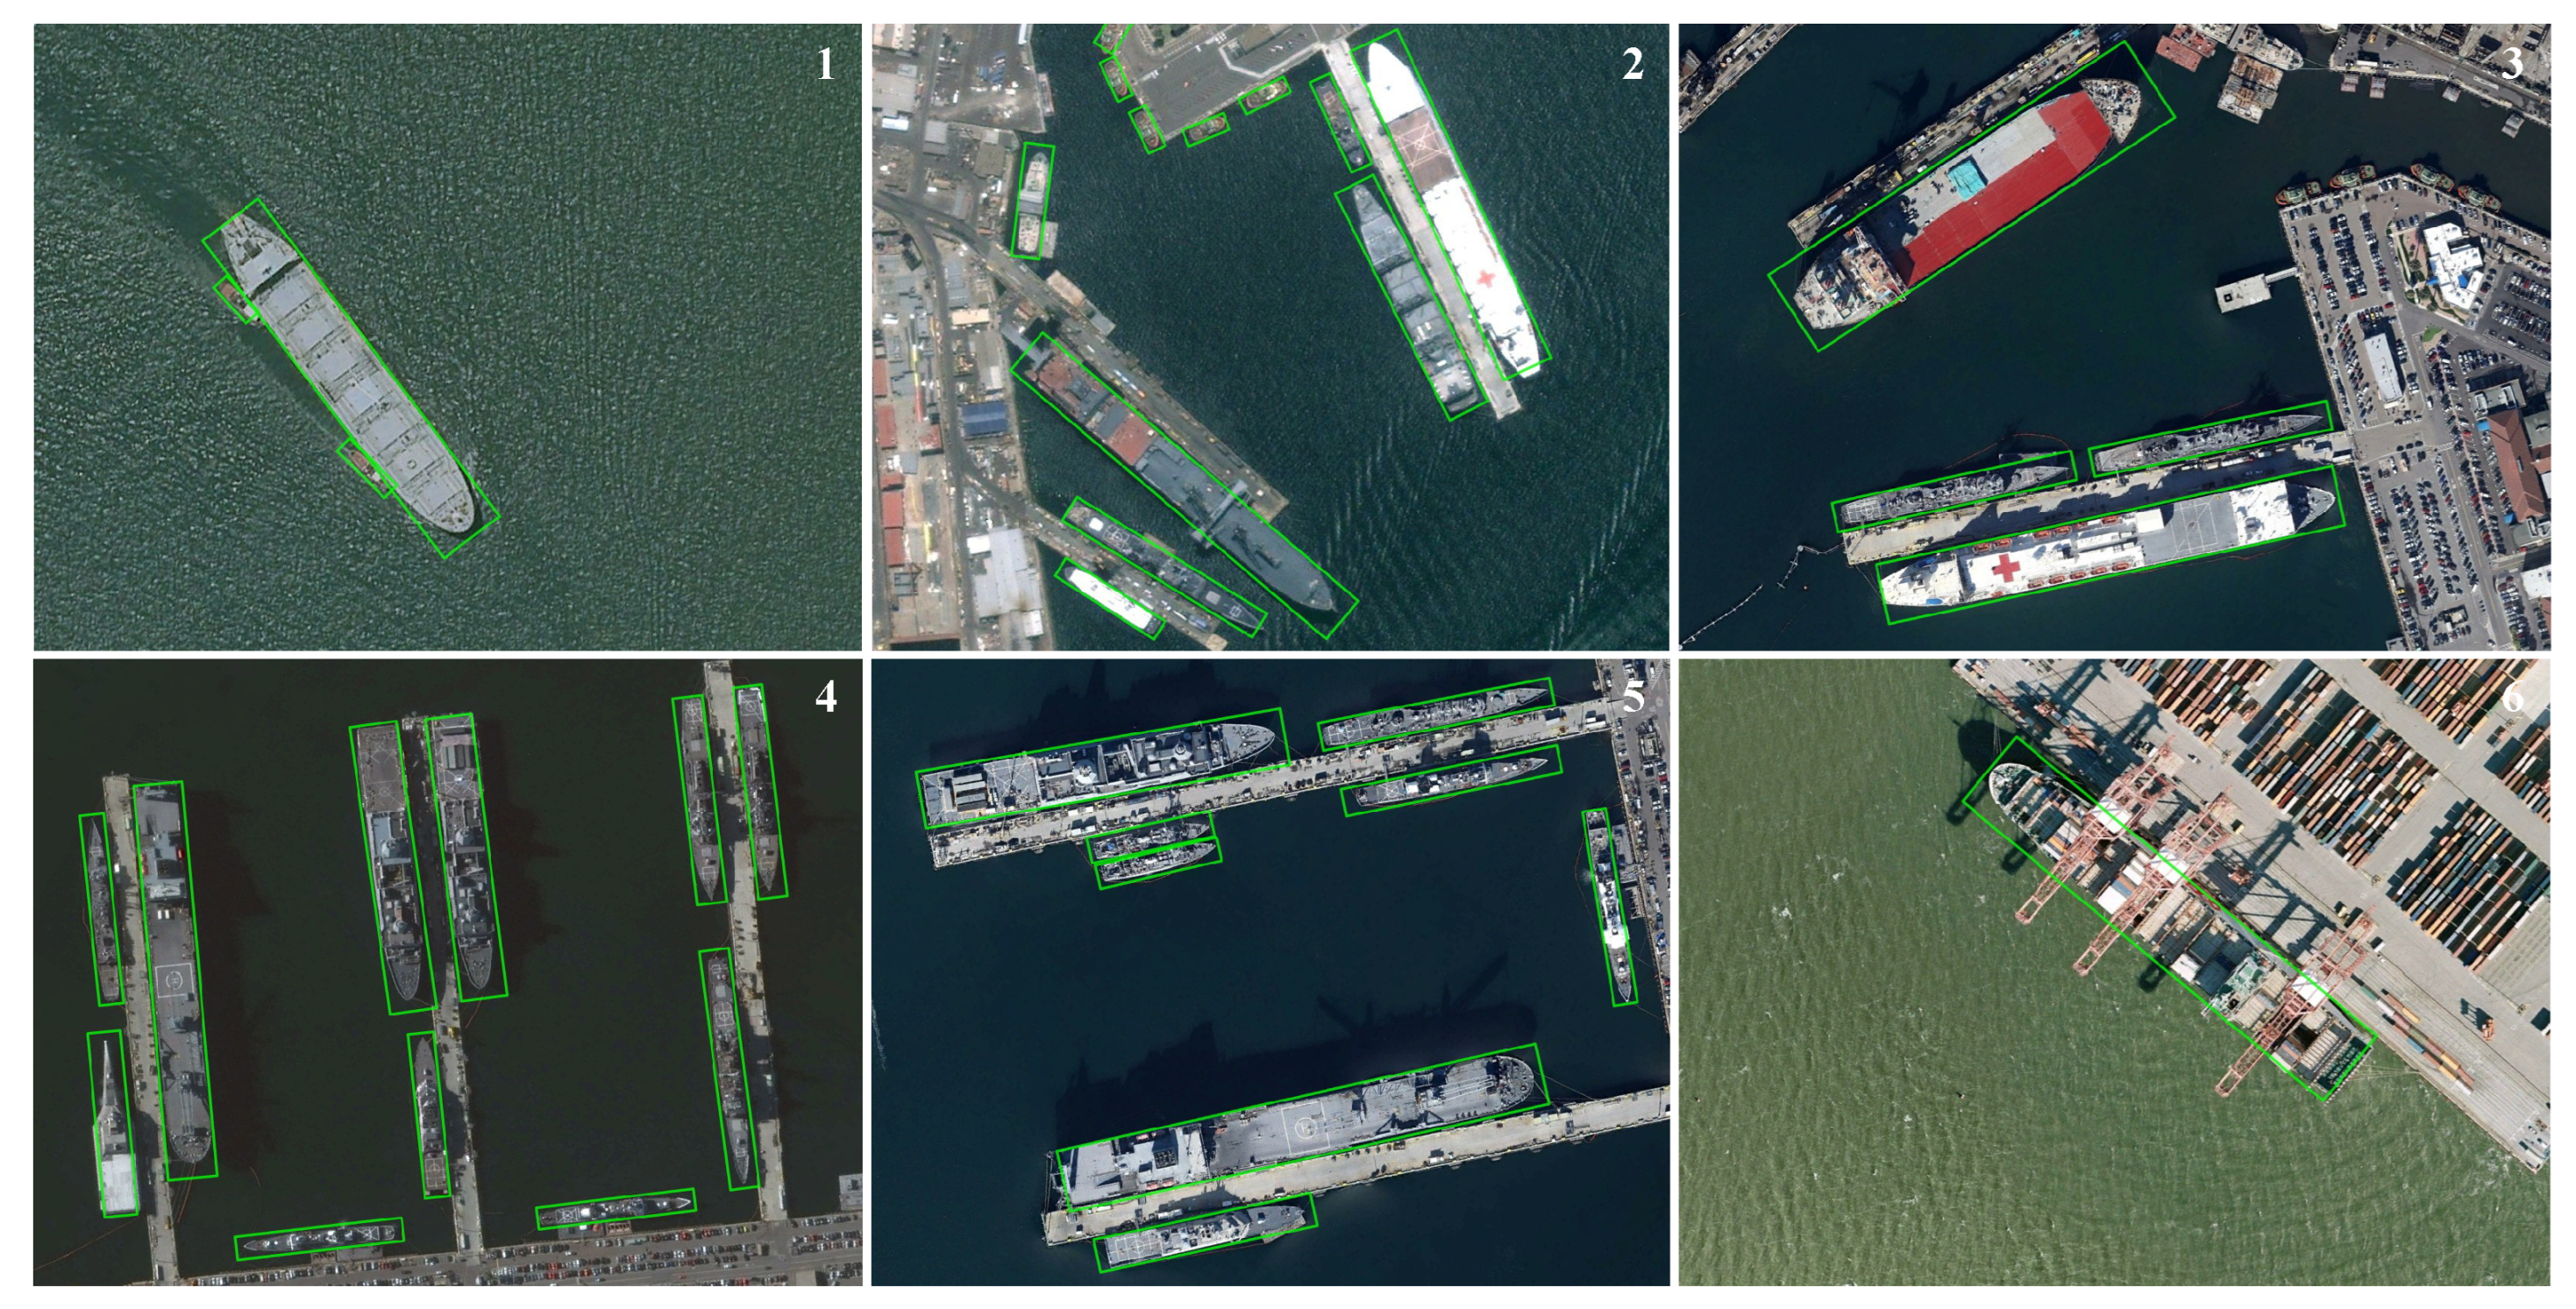
Figure 11, object boundaries are accurately regressed with no significant center drift or angular deviation. This performance is attributed to the GEIoU loss function, which uniformly models the geometric parameters of objects, thereby improving the consistency and stability of regression.
In addition, examples indexed 1–5 in the figure demonstrate the accurate detection of objects with various scales and aspect ratios, indicating the effectiveness of the MDAA strategy in adapting to both multi-scale and geometric spatial variations. Notably, in region 8, despite severe occlusion, the detection results remain highly accurate, suggesting that the proposed method maintains robust performance in complex scenes.
In summary, the proposed MDAA-based positive sample selection mechanism and GEIoU loss function collaboratively optimize the two critical components of structural modeling and LA, demonstrating strong competitiveness and generalization capability across multiple benchmark models and high-precision detection scenarios.
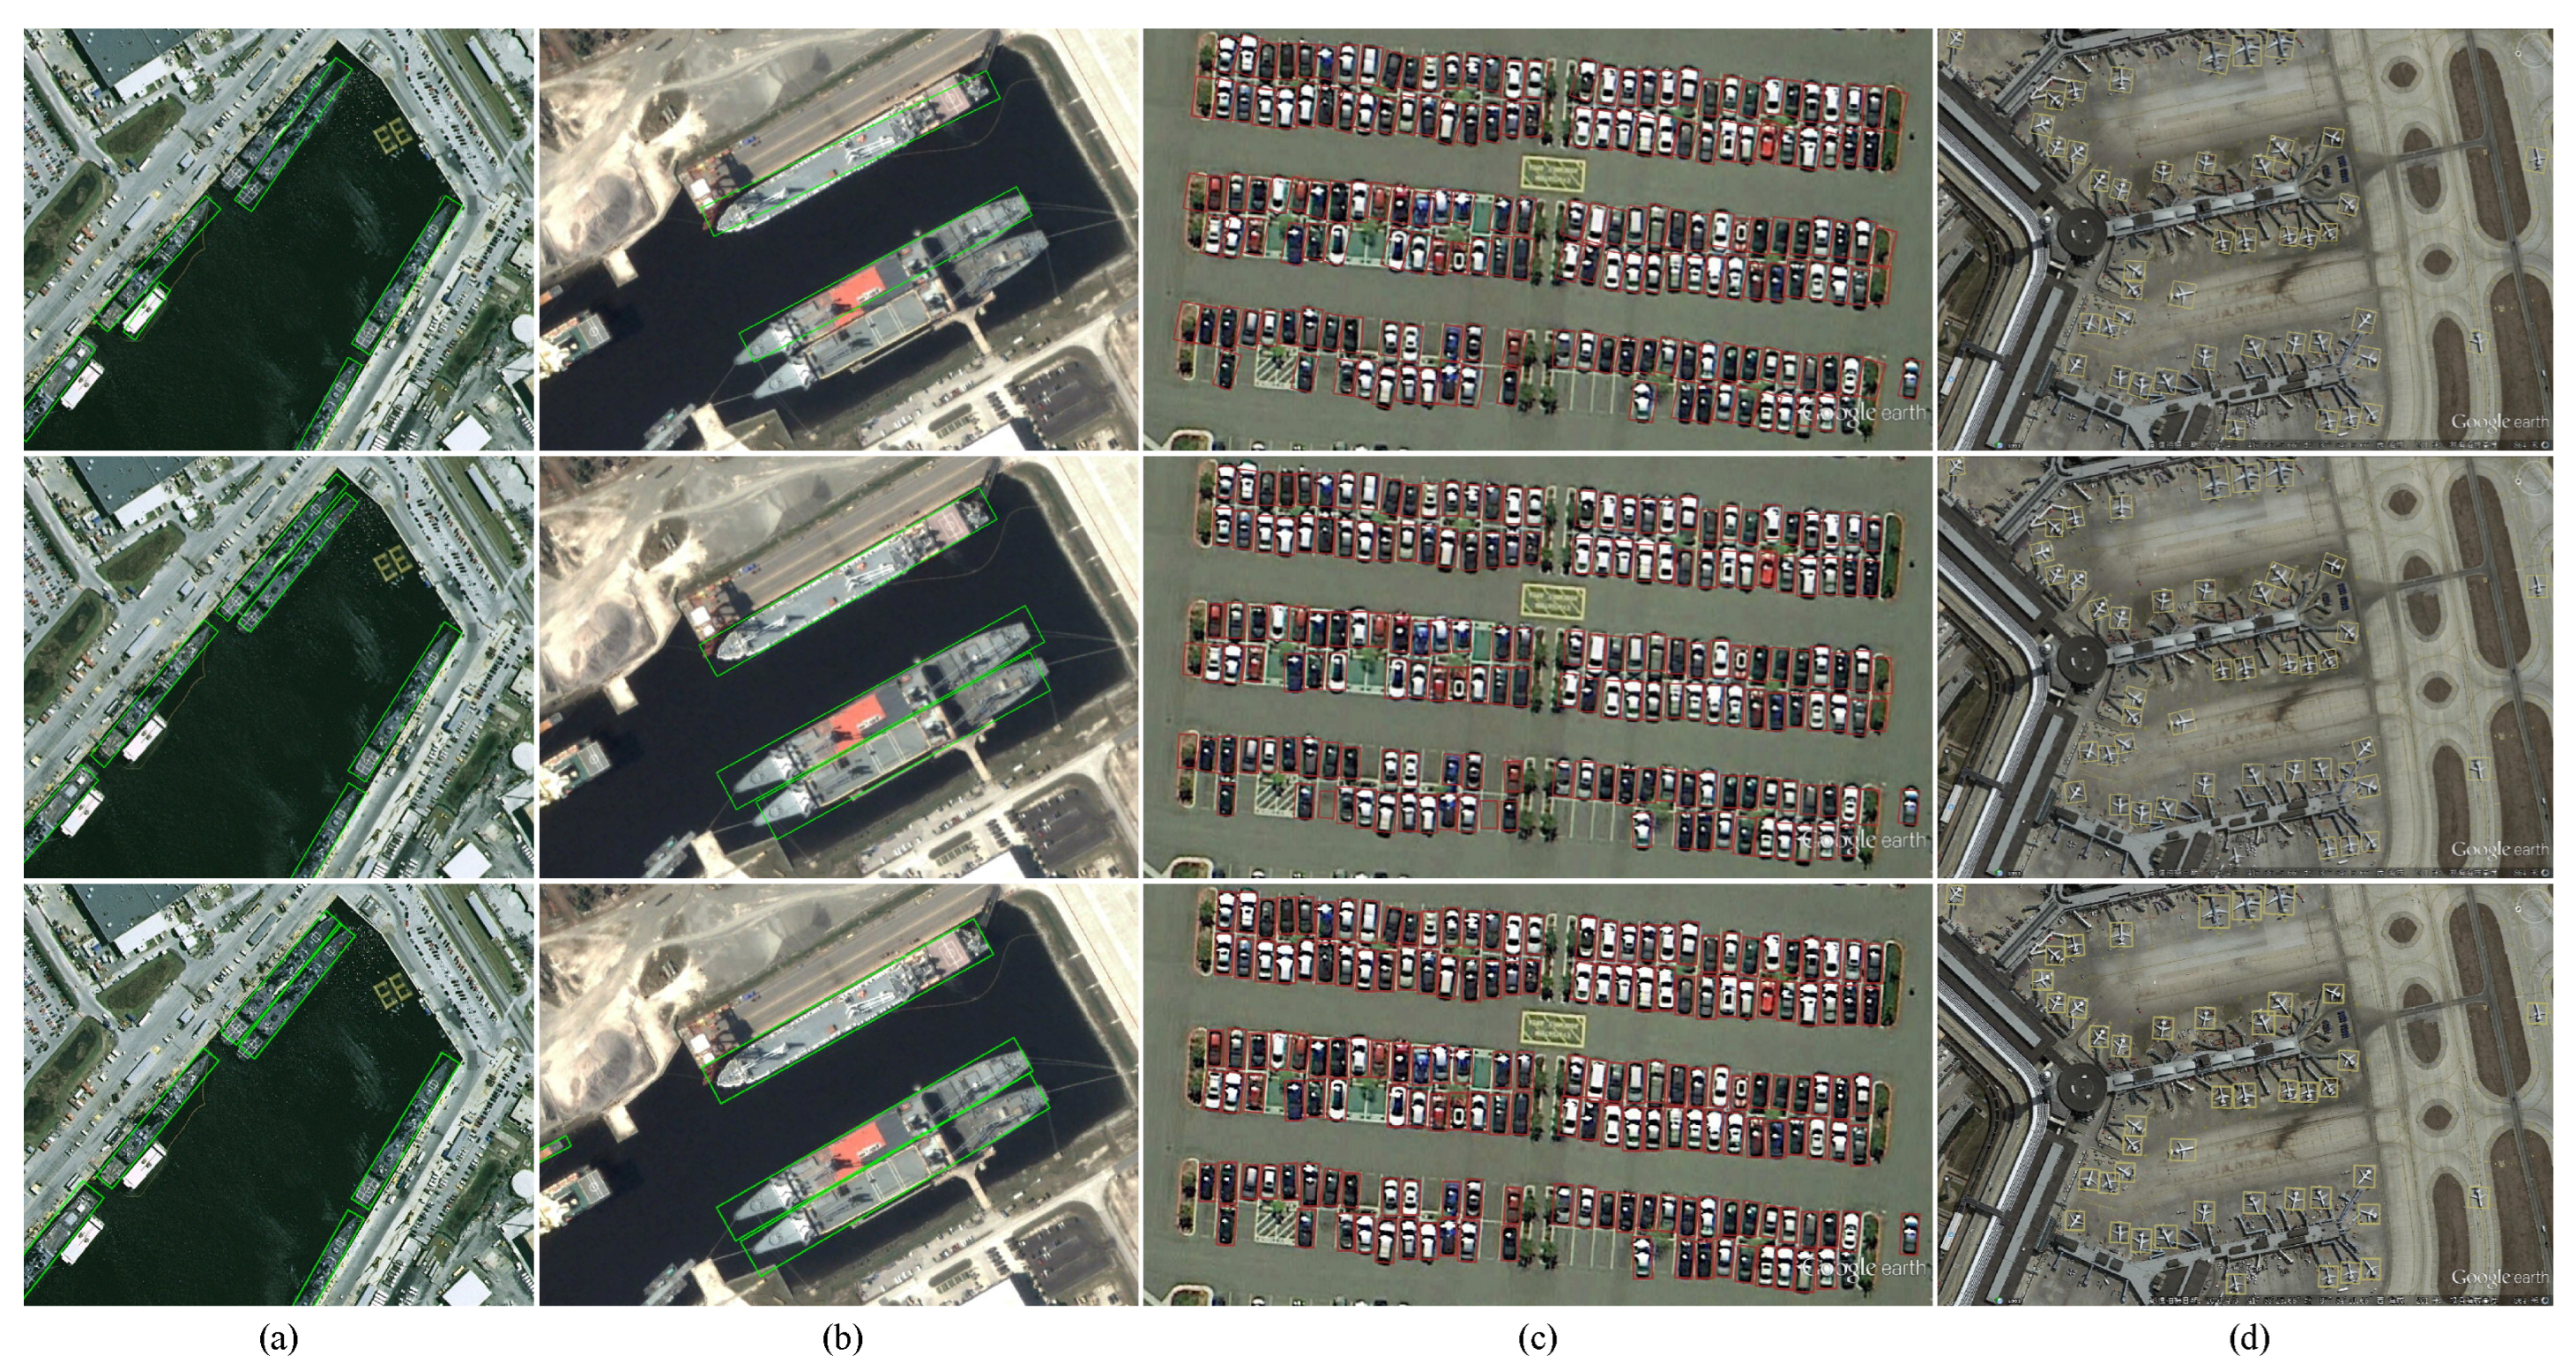
As shown in Table 11, the proposed method achieves an mAP(07) of 90.36% on the UCAS-AOD dataset, outperforming most existing OOD algorithms. This result validates the adaptability of the geometry-aware mechanisms built upon MDAA and GEIoU in multi-object RSI.
Furthermore, the visualized results in Figure 12 demonstrate strong localization and orientation prediction across diverse scenes:
  • In curved-road scenes (results 1 and 2), all vehicles exhibit orientations consistent with the lane curvature, indicating the model’s high capacity for orientation alignment.
  • In dense small-object scenarios (results 3 and 4), such as with clustered vehicles, detection boxes are uniformly distributed without omissions or false positives, reflecting good robustness to scale variation.
  • In complex background scenes (results 5 and 6), certain aircraft exhibit distinct aerodynamic structures and background texture overlap, yet the model still accurately identifies their boundaries and angles, demonstrating strong generalization in geometric modeling.
In conclusion, the proposed method exhibits reliable detection performance and environmental adaptability across various RSI scenarios. The synergistic effect between the high-quality sample assignment mechanism (MDAA) and the unified regression loss (GEIoU) significantly enhances the model’s stability and detection accuracy in multi-scale, multi-pose object environments.

5.5. Supplementary Experimental Analysis and Extended Validation

Performance of Transformer-based architectures in OOD. In recent years, Transformer-based detection frameworks have demonstrated strong end-to-end modeling capabilities in general OD tasks, with self-attention mechanisms providing enhanced global contextual modeling. To further investigate their applicability in RSOD, the representative Transformer-based method Adaptive Object Detection with Two-stage DETR (AO2-DETR) [59], which incorporates rotation modeling, was selected for replication and comparison on the HRSC2016 and UCAS-AOD datasets. AO2-DETR is built upon the DEtection TRansformer (DETR) framework [60] and introduces an angular regression branch to handle arbitrarily OOD.
In the experimental setup, a unified input size of 800 × 800 was used, with consistent training parameters across methods. The evaluation metrics included mAP(07) and mAP(12). The results are presented in Table 12 and Table 13.
On the HRSC2016 dataset, AO2-DETR achieves an mAP(12) of 97.47%, demonstrating strong global modeling capability and regression accuracy. However, its mAP(07) is 88.12%, which is lower than that of the proposed method (90.53%), suggesting room for improvement in boundary fitting and angle alignment.
On the UCAS-AOD dataset, AO2-DETR achieves an mAP(07) of 87.79%, with relatively balanced performance on both car and airplane categories, outperforming some traditional CNN-based approaches. Nevertheless, its overall detection performance remains inferior to that of GaussianDet (90.36%), indicating that its end-to-end mechanism has certain limitations in regression accuracy and sample selection, particularly in scenarios with small-scale objects and high-density distributions.
In summary, AO2-DETR demonstrates good structural adaptability and benefits from the end-to-end characteristics of Transformer architectures in RS scenes. However, in terms of the directional perception, structural consistency modeling, and fine-grained detection of densely distributed objects, it still falls short of the overall performance advantages offered by the proposed flexible boundary representation and symmetry-aware optimization mechanisms.
Impact of backbone replacement on model performance. To systematically evaluate the robustness and generalization ability of the proposed method under different backbone architectures, three representative networks—ResNet50, ResNet101, and the lightweight CSPNeXt-L—were selected for comparative experiments on the UCAS-AOD and HRSC2016 RS datasets. All experiments were conducted under identical training configurations, with the ODAA LA mechanism and GEIoU regression loss consistently applied to ensure result comparability.
As shown in Table 14, the proposed method demonstrates strong performance stability across different backbone architectures. Compared with ResNet50, ResNet101 yields slightly improved results on both datasets, suggesting that enhanced feature extraction contributes positively to detection accuracy. The lightweight CSPNeXt-L backbone, while maintaining computational efficiency, further boosts overall performance, achieving an mAP(12) of 95.28% on the HRSC2016 dataset—the highest among all tested settings.
Despite differences in parameter scale and architectural complexity among the three backbones, the core components of GaussianDet—including FBBox modeling, the GEIoU loss function, and the ODAA assignment strategy—exhibit strong structural adaptability. These components effectively support high-precision OOD tasks across varied network architectures, further validating the method’s practicality, generalization capability, and robustness in real-world applications.
Impact of resolution variation on detection performance. To assess the adaptability of the proposed method under varying input image scales, experiments were conducted on the UCAS-AOD and HRSC2016 datasets using test samples at a low resolution ( 0.5 × ), the original resolution ( 1 × ), and a high resolution ( 2 × ). All experiments were conducted under a consistent RTMDet-R detection framework, with identical training configurations and model parameters to ensure result comparability.
As shown in Table 15, detection performance drops significantly under the low-resolution setting ( 0.5 × ), primarily due to the loss of image detail, particularly the degradation in boundary feature representation for small objects, resulting in reduced localization accuracy. Under high-resolution conditions ( 2 × ), mAP improves on both datasets, reflecting enhanced boundary fitting capability—especially notable for large-scale objects. However, the increase in resolution leads to a considerable rise in computational cost, with inference speed dropping from the default 13.3 FPS to 7.6 FPS, indicating that the performance gains come at the expense of significant efficiency loss.
In summary, under the default resolution setting ( 1 × ), the proposed method achieves a well-balanced trade-off between accuracy and inference speed. These results confirm the robustness and stability of the FBBox representation and GEIoU loss function across multi-scale scenarios, demonstrating high practical value for deployment.
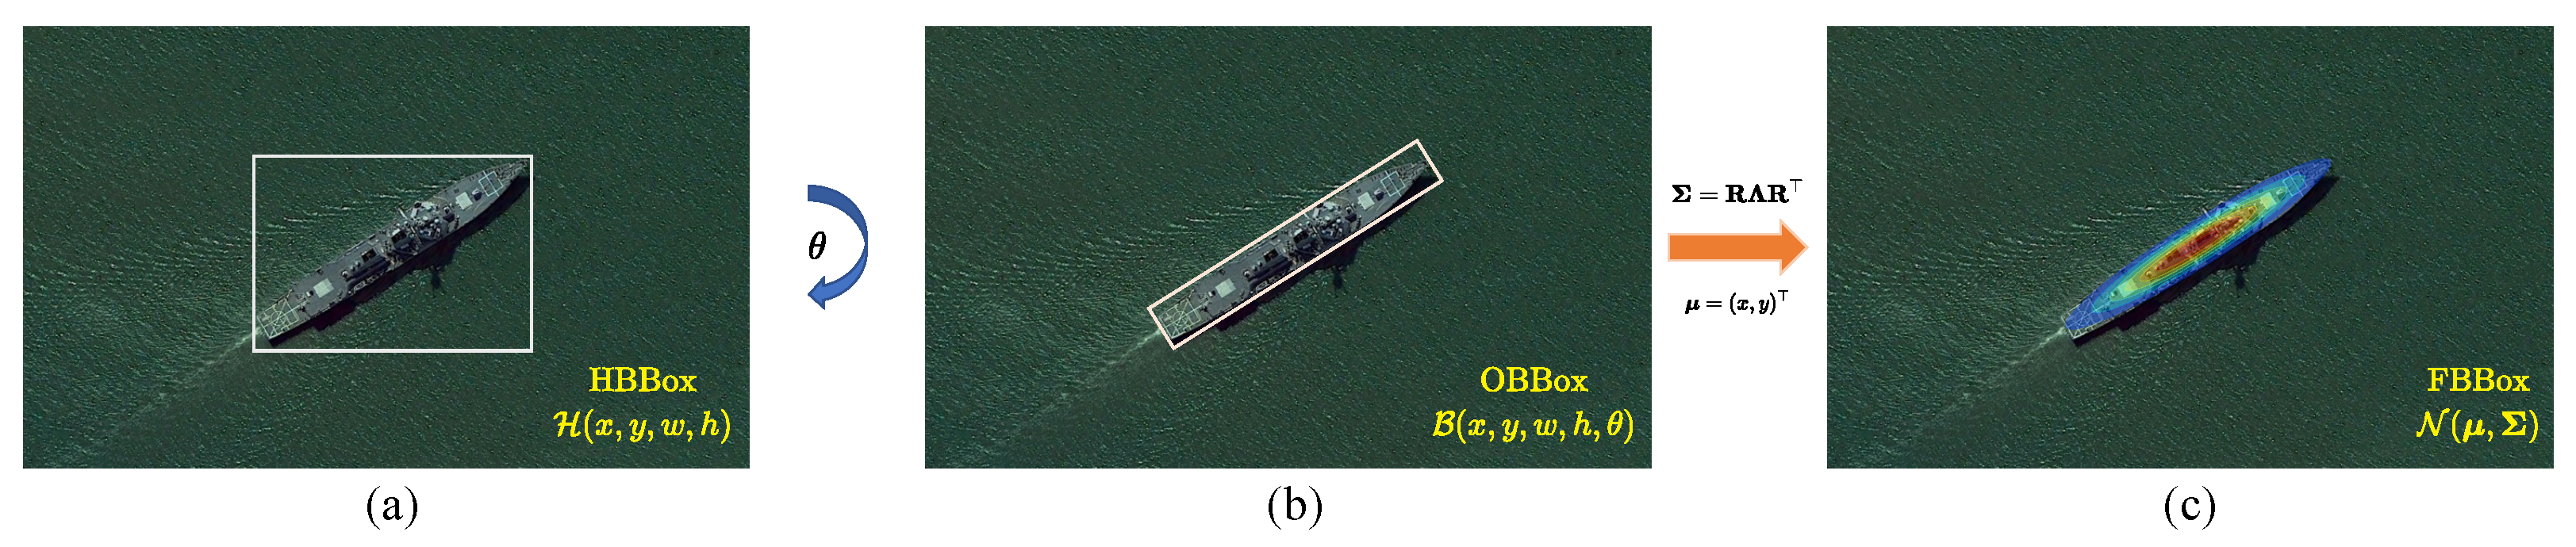
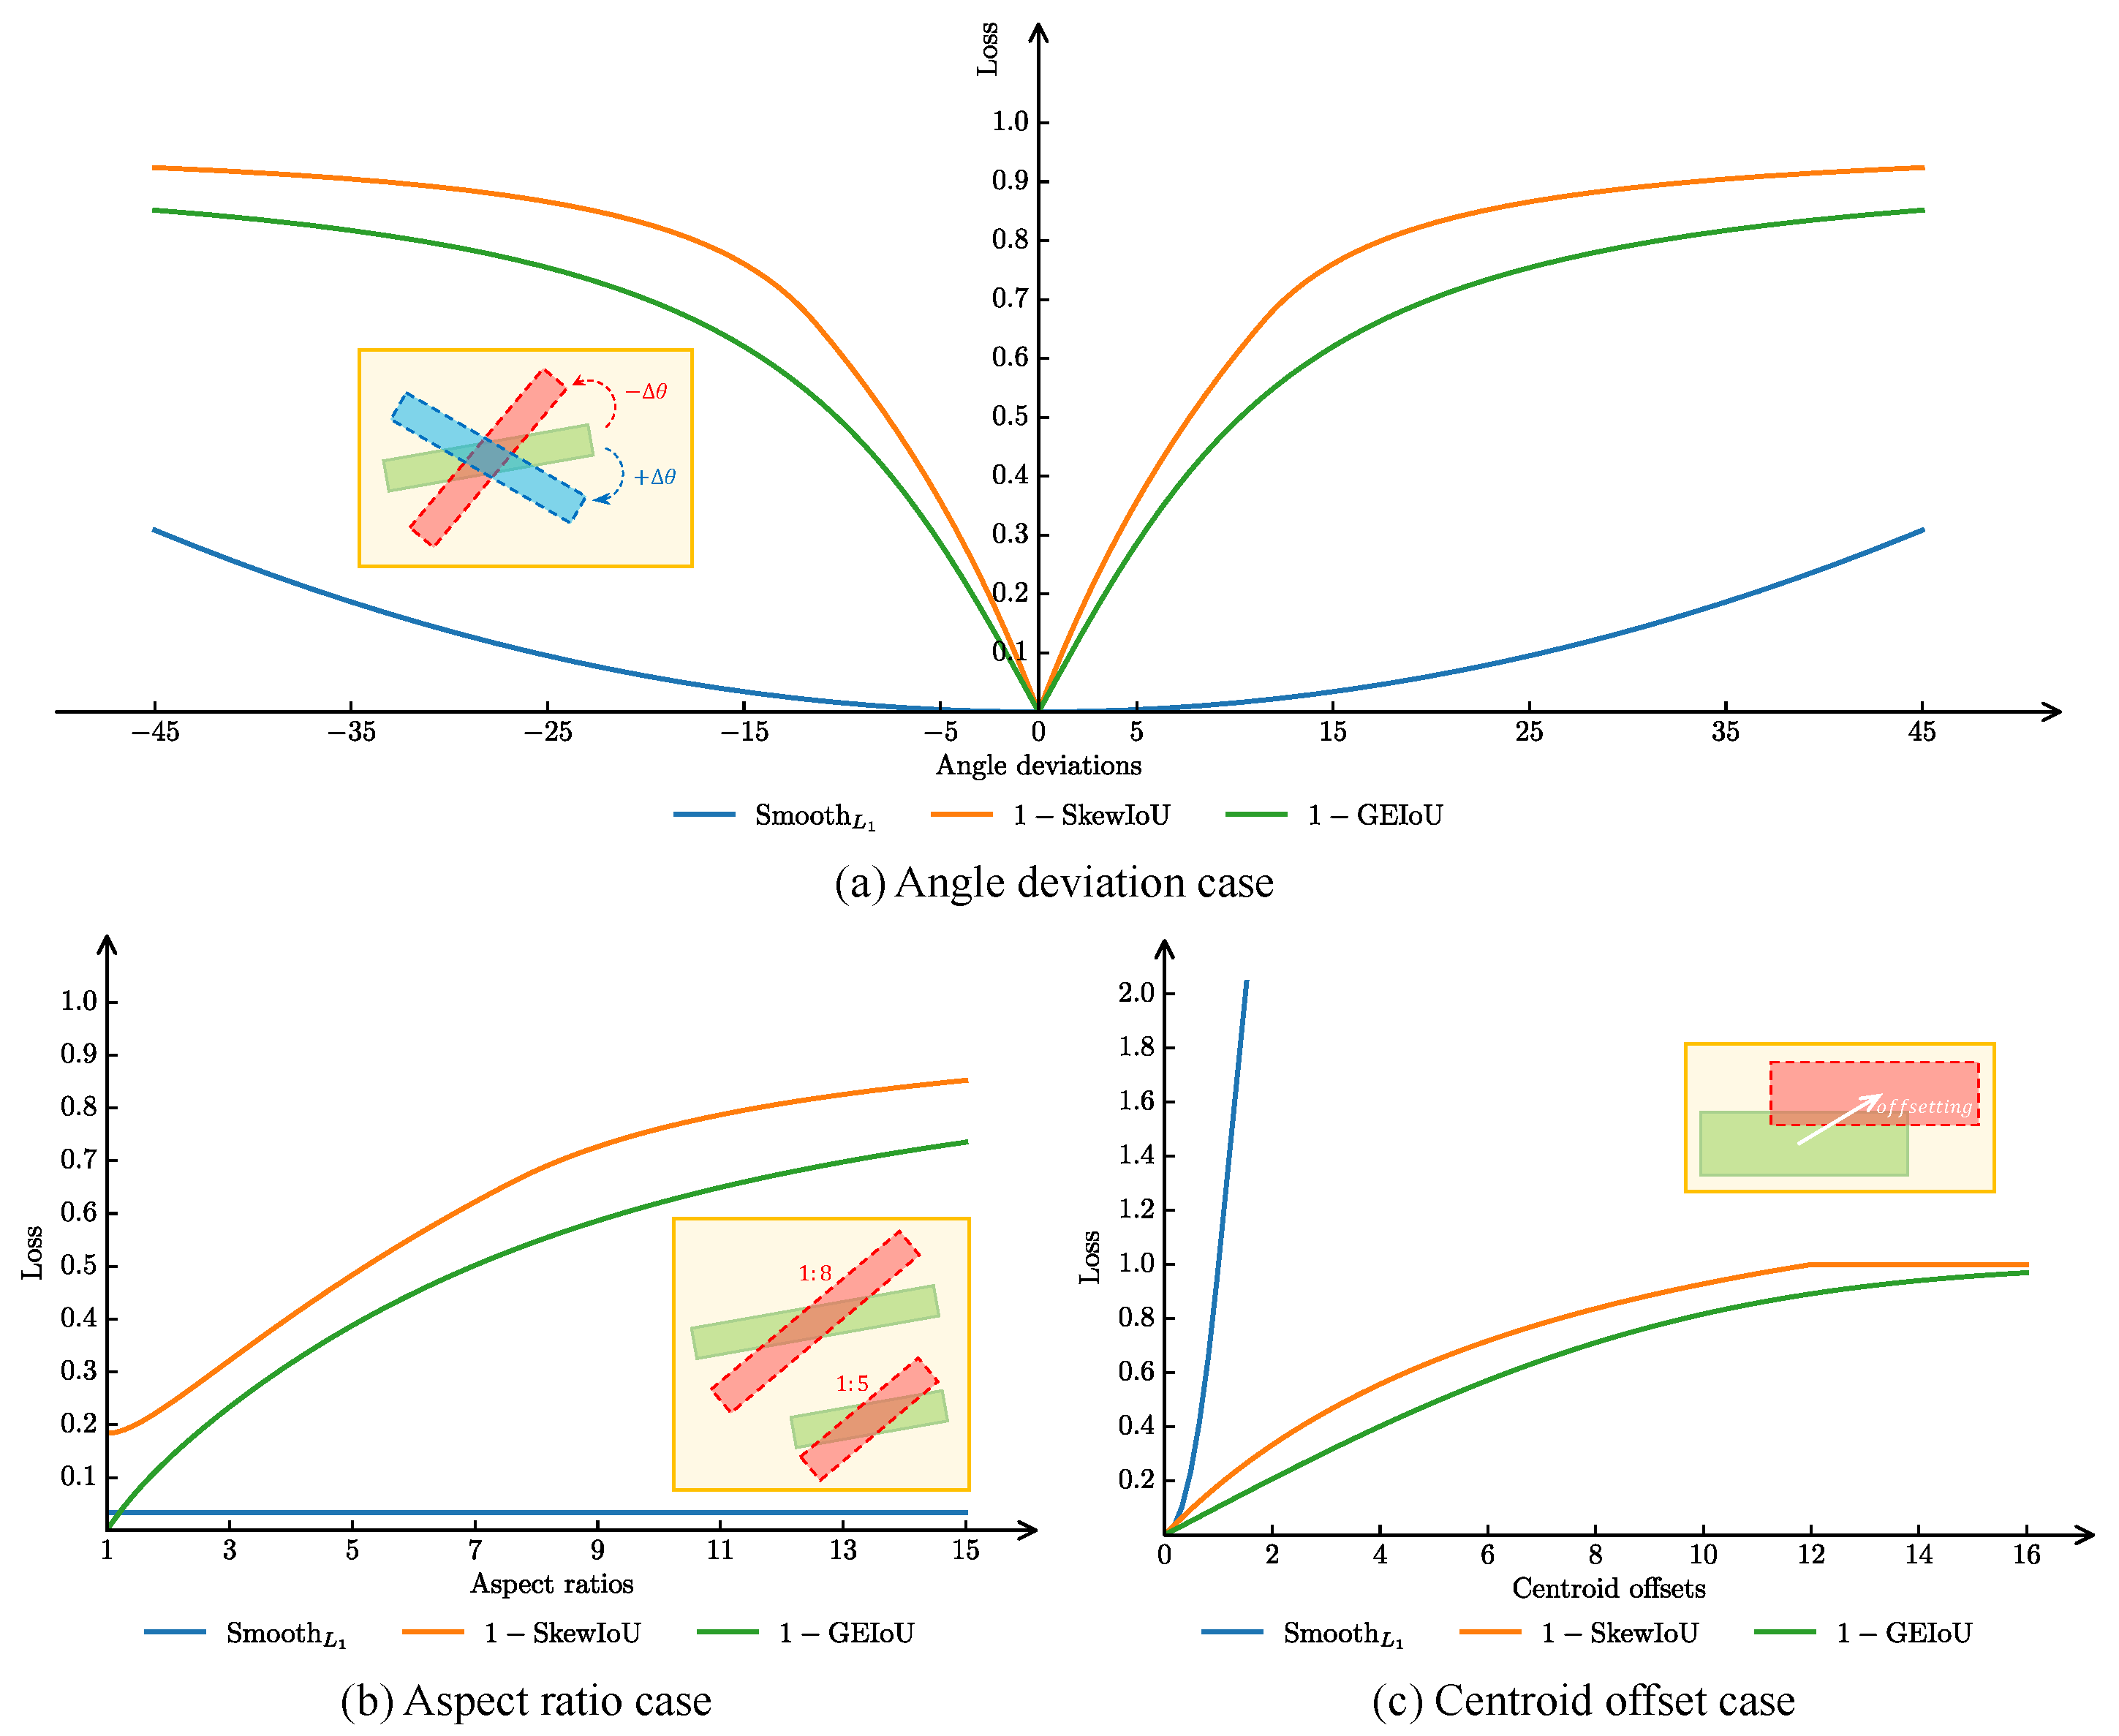
Theoretical and visual comparison with existing Gaussian-based loss functions. To further validate the effectiveness of the GEIoU loss in OOD tasks, a comprehensive comparison was conducted with two mainstream Gaussian-based loss functions—GWD and KLD—from both theoretical and visual perspectives.
At the theoretical level, GEIoU is constructed based on the Bhattacharyya coefficient and Hellinger distance, inherently providing scale invariance and independence from additional hyperparameters. In contrast, GWD—based on the Gaussian Wasserstein distance between covariance matrices—is relatively sensitive to scale variations and struggles to maintain consistent loss trends across varying object sizes. Although KLD improves stability through modeling distributional differences via the Kullback–Leibler Divergence, it relies on exponential scaling factors, with parameter tuning dependent on empirical heuristics, thus limiting its generalization in convergence behavior.
In terms of numerical stability, GEIoU adopts a closed-form expression, ensuring stable gradient output even under significant variations in object shape or scale. This characteristic is especially critical in OOD, helping to improve both training efficiency and regression accuracy.
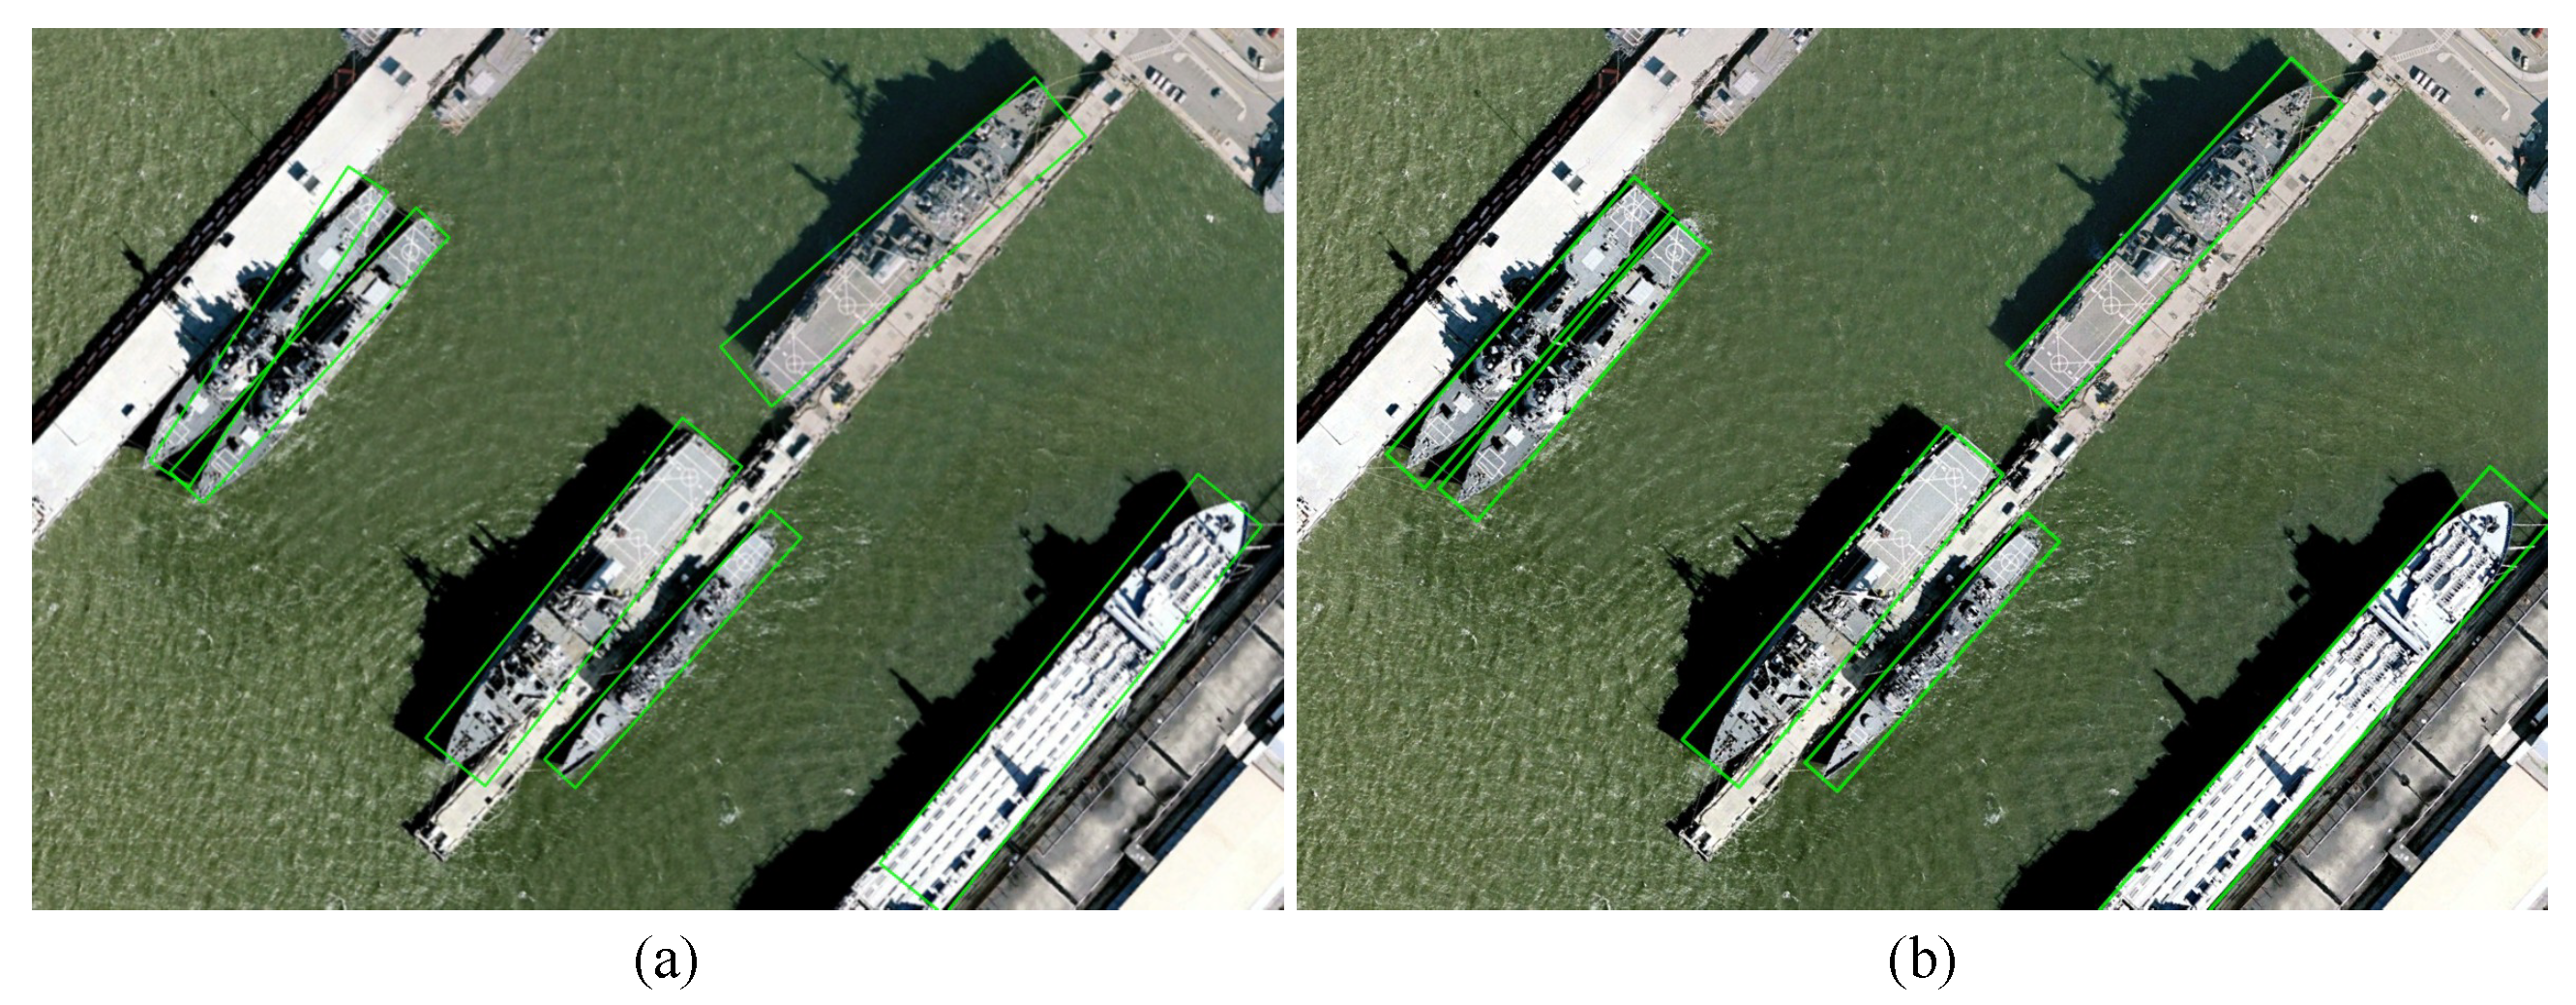
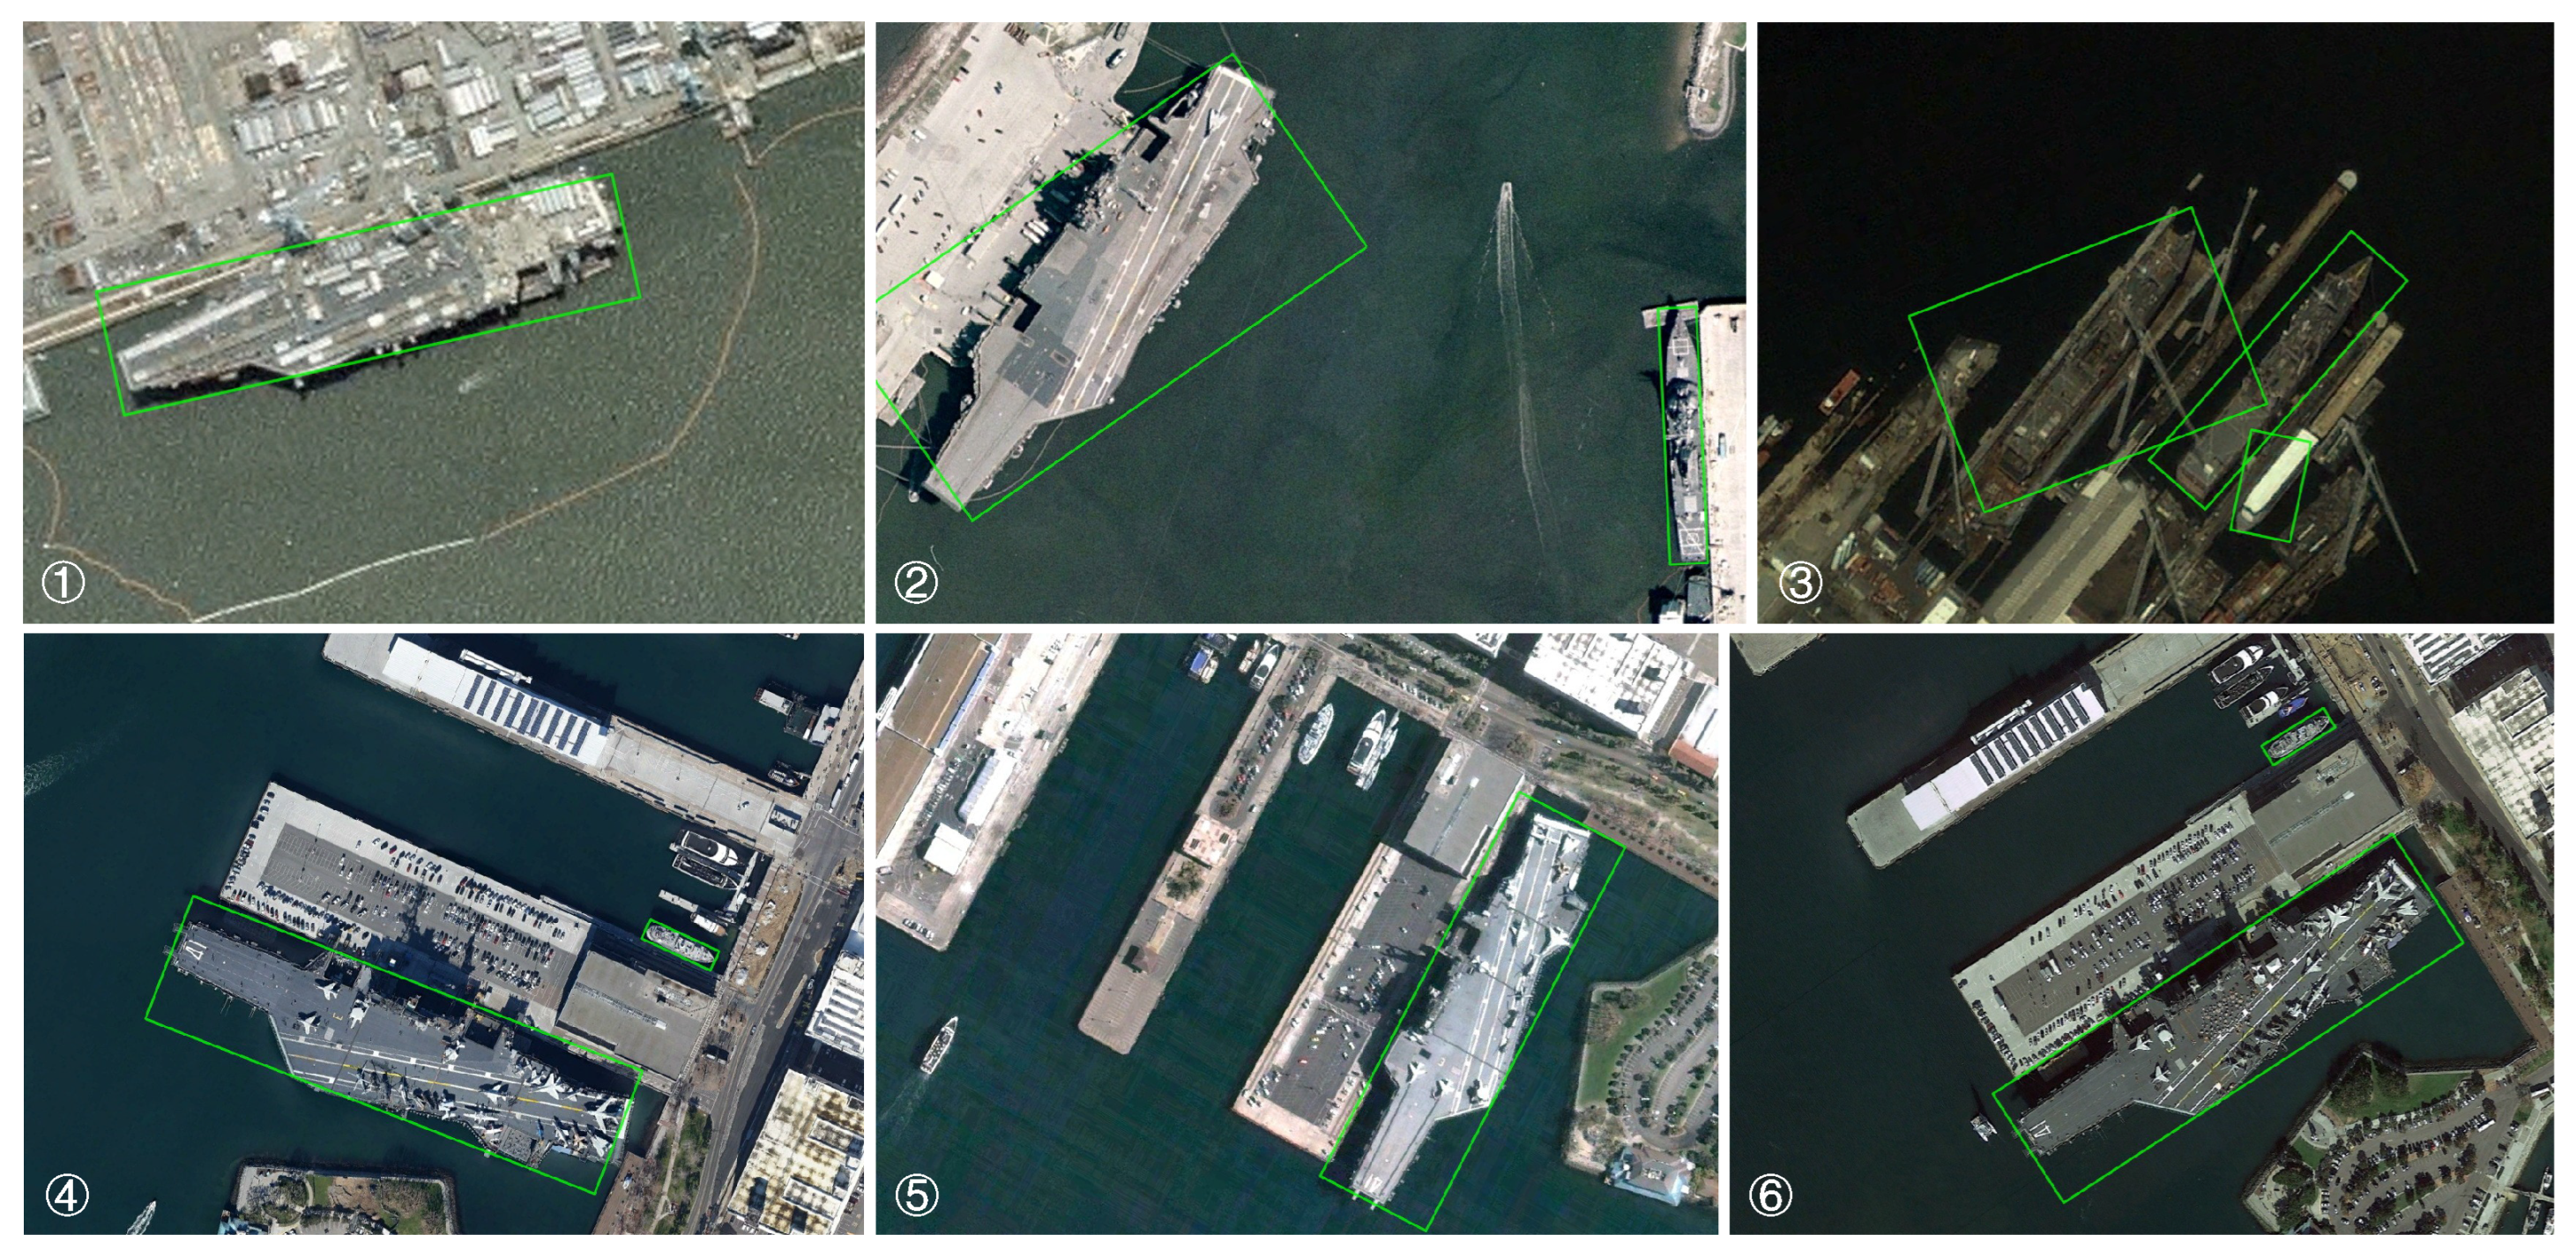
At the visual level, as shown in Figure 13, GEIoU outperforms GWD and KLD in terms of rotation alignment, boundary consistency, and detection capability for dense small objects. Specifically, in ship detection tasks on the HRSC2016 dataset, GEIoU more accurately fits object orientations and boundaries. In the UCAS-AOD dataset, it also exhibits superior object separation and pose-awareness capabilities.
Model limitations and bad-case analysis. Although GaussianDet demonstrates excellent performance across various RSOD tasks, certain limitations remain in complex scenarios. Typical issues include degraded detection performance in low-contrast maritime backgrounds, and missed or false detections in small-object remote scenes.
Specifically, as shown in Figure 14, under conditions with low visibility or minimal contrast between objects and background textures, weakened boundary features may lead to localization shifts and angular deviations. In small OD, the limited size and inconspicuous texture of objects make it difficult for the model to extract discriminative features, resulting in missed detections or false alarms. These observations suggest that the current model still has room for improvement under extreme conditions such as low signal-to-noise perception and ultra-small object modeling. Future work may consider integrating multi-scale feature fusion and local fine-grained enhancement mechanisms to further improve the robustness and generalization capacity of the model in complex RS environments.

6. Conclusions and Future Works

This paper proposes an OOD framework, GaussianDet, grounded in geometric symmetry theory. By introducing a flexible boundary representation (FBBox) based on Gaussian modeling, a structure-consistent regression loss (GEIoU), and a multi-scale adaptive LA strategy (MDAA), the proposed method effectively addresses common challenges in RSI, including large-scale variations, complex object orientations, and imbalanced sample distributions. Experimental results on the HRSC2016 and UCAS-AOD datasets demonstrate significant performance gains, validating both the accuracy and generalizability of the proposed modeling approach. This work not only establishes a unified structural alignment paradigm for OOD, but also offers new modeling insights for structure-sensitive tasks such as medical imaging, and scene text detection. Future research will explore advanced statistical modeling, spatio-temporal symmetry representations, and joint optimization strategies for LA and loss design to further enhance detection performance and adaptability.

Author Contributions

Investigation, D.J.; conceptualization, J.Z. and Q.L.; methodology, J.Z. and Q.F.; software, J.Z. and Q.L.; validation, J.Z. and Q.L.; data curation J.Z.; visualization, J.Z. and J.L.; formal analysis, J.Z. and Q.F.; writing—original draft, J.Z. and T.M.; writing—review editing, J.Z. and T.M.; supervision, J.L. and D.J; funding acquisition, Q.F. All authors have read and agreed to the published version of the manuscript.

Funding

This research is funded by the Key Laboratory of Flight Techniques and Flight Safety, CAAC, grant number FZ2022ZZ01, and the Fundamental Research Funds for the Central Universities, grant numbers J2022-046 and 24CAFUC04015.

Data Availability Statement

HRSC2016 is available at https://aistudio.baidu.com/aistudio/datasetdetail/31232 (accessed on 18 May 2024). UCAS-AOD is available at https://aistudio.baidu.com/datasetdetail/70265 (accessed on 8 May 2024).

Conflicts of Interest

Author Donglin Jing was employed by the company China Aerospace Science and Technology Corporation. The remaining authors declare that the research was conducted in the absence of any commercial or financial relationships that could be construed as a potential conflict of interest.

References

  1. Liu, Z.; Yuan, L.; Weng, L.; Yang, Y. A high resolution optical satellite image dataset for ship recognition and some new baselines. In Proceedings of the International Conference on Pattern Recognition Applications and Methods, Porto, Portugal, 24–26 February 2017; SciTePress: Setúbal, Portugal, 2017; Volume 2, pp. 324–331. [Google Scholar]
  2. Girshick, R.; Donahue, J.; Darrell, T.; Malik, J. Rich feature hierarchies for accurate object detection and semantic segmentation. In Proceedings of the IEEE Conference on Computer Vision and Pattern Recognition, Columbus, OH, USA, 23–28 June 2014; pp. 580–587. [Google Scholar]
  3. Girshick, R. Fast r-cnn. In Proceedings of the IEEE International Conference on Computer Vision, Santiago, Chile, 13–16 December 2015; pp. 1440–1448. [Google Scholar]
  4. Ren, S.; He, K.; Girshick, R.; Sun, J. Faster r-cnn: Towards real-time object detection with region proposal networks. Adv. Neural Inf. Process. Syst. 2015, 28, 100–110. [Google Scholar] [CrossRef] [PubMed]
  5. Liu, W.; Anguelov, D.; Erhan, D.; Szegedy, C.; Reed, S.; Fu, C.Y.; Berg, A.C. Ssd: Single shot multibox detector. In Proceedings of the Computer Vision–ECCV 2016: 14th European Conference, Amsterdam, The Netherlands, 11–14 October 2016; Proceedings, Part I 14. Springer: Berlin/Heidelberg, Germany, 2016; pp. 21–37. [Google Scholar]
  6. Redmon, J.; Divvala, S.; Girshick, R.; Farhadi, A. You only look once: Unified, real-time object detection. In Proceedings of the IEEE Conference on Computer Vision and Pattern Recognition, Las Vegas, NV, USA, 27–30 June 2016; pp. 779–788. [Google Scholar]
  7. Ge, Z. Yolox: Exceeding yolo series in 2021. arXiv 2021, arXiv:2107.08430. [Google Scholar]
  8. Team, M.V. YOLOv6: A Single-Stage Object Detection Framework for Industrial Applications. arXiv 2022, arXiv:2209.02976. [Google Scholar]
  9. Wang, C.Y.; Bochkovskiy, A.; Liao, H.Y.M. YOLOv7: Trainable Bag-of-Freebies Sets New State-of-the-Art for Real-Time Object Detectors. arXiv 2022, arXiv:2207.02696. [Google Scholar]
  10. Wang, C.Y.; Bochkovskiy, A.; Liao, H.Y.M. YOLOv9: Learning What You Want to Learn Using Programmable Gradient Information. arXiv 2024, arXiv:2402.13616. [Google Scholar]
  11. Wang, C.Y.; Bochkovskiy, A.; Liao, H.Y.M. YOLOv10: Real-Time End-to-End Object Detection. arXiv 2024, arXiv:2403.14458. [Google Scholar]
  12. Jocher, G.; Chaurasia, A.; Qiu, J. Ultralytics YOLOv8. Available online: https://github.com/ultralytics/ultralytics (accessed on 9 March 2025).
  13. Lin, T.Y.; Goyal, P.; Girshick, R.; He, K.; Dollár, P. Focal loss for dense object detection. In Proceedings of the IEEE International Conference on Computer Vision, Venice, Italy, 22–29 October 2017; pp. 2980–2988. [Google Scholar]
  14. Lin, Y.; Feng, P.; Guan, J.; Wang, W.; Chambers, J. IENet: Interacting embranchment one stage anchor free detector for orientation aerial object detection. arXiv 2019, arXiv:1912.00969. [Google Scholar]
  15. Qin, R.; Liu, Q.; Gao, G.; Huang, D.; Wang, Y. MRDet: A multihead network for accurate rotated object detection in aerial images. IEEE Trans. Geosci. Remote. Sens. 2021, 60, 1–12. [Google Scholar] [CrossRef]
  16. Yu, Y.; Yang, X.; Li, J.; Gao, X. Object detection for aerial images with feature enhancement and soft label assignment. IEEE Trans. Geosci. Remote. Sens. 2022, 60, 1–16. [Google Scholar] [CrossRef]
  17. Han, J.; Ding, J.; Li, J.; Xia, G.S. Align deep features for oriented object detection. IEEE Trans. Geosci. Remote. Sens. 2021, 60, 1–11. [Google Scholar] [CrossRef]
  18. Yang, X.; Yan, J.; Feng, Z.; He, T. R3det: Refined single-stage detector with feature refinement for rotating object. In Proceedings of the AAAI Conference on Artificial Intelligence, Online, 2–9 February 2021; Volume 35, pp. 3163–3171. [Google Scholar]
  19. Lin, T.Y.; Dollár, P.; Girshick, R.; He, K.; Hariharan, B.; Belongie, S. Feature pyramid networks for object detection. In Proceedings of the IEEE Conference on Computer Vision and Pattern Recognition, Honolulu, HI, USA, 21–26 July 2017; pp. 2117–2125. [Google Scholar]
  20. Zhu, C.; He, Y.; Savvides, M. Feature selective anchor-free module for single-shot object detection. In Proceedings of the IEEE/CVF Conference on Computer Vision and Pattern Recognition, Long Beach, CA, USA, 16–17 June 2019; pp. 840–849. [Google Scholar]
  21. Hou, L.; Lu, K.; Xue, J. Refined one-stage oriented object detection method for remote sensing images. IEEE Trans. Image Process. 2022, 31, 1545–1558. [Google Scholar] [CrossRef] [PubMed]
  22. Wang, J.; Wang, Y.; Wu, Y.; Zhang, K.; Wang, Q. FRPNet: A feature-reflowing pyramid network for object detection of remote sensing images. IEEE Geosci. Remote. Sens. Lett. 2020, 19, 1–5. [Google Scholar] [CrossRef]
  23. Yang, X.; Yan, J.; Ming, Q.; Wang, W.; Zhang, X.; Tian, Q. Rethinking rotated object detection with gaussian wasserstein distance loss. In Proceedings of the International Conference on Machine Learning, PMLR, Virtual, 18–24 July 2021; pp. 11830–11841. [Google Scholar]
  24. Yang, X.; Yang, X.; Yang, J.; Ming, Q.; Wang, W.; Tian, Q.; Yan, J. Learning high-precision bounding box for rotated object detection via kullback-leibler divergence. Adv. Neural Inf. Process. Syst. 2021, 34, 18381–18394. [Google Scholar]
  25. Zhang, S.; Chi, C.; Yao, Y.; Lei, Z.; Li, S.Z. Bridging the gap between anchor-based and anchor-free detection via adaptive training sample selection. In Proceedings of the IEEE/CVF Conference on Computer Vision and Pattern Recognition, Seattle, WA, USA, 13–19 June 2020; pp. 9759–9768. [Google Scholar]
  26. Ma, J.; Shao, W.; Ye, H.; Wang, L.; Wang, H.; Zheng, Y.; Xue, X. Arbitrary-oriented scene text detection via rotation proposals. IEEE Trans. Multimed. 2018, 20, 3111–3122. [Google Scholar] [CrossRef]
  27. Jiang, Y.; Zhu, X.; Wang, X.; Yang, S.; Li, W.; Wang, H.; Fu, P.; Luo, Z. R2CNN: Rotational region CNN for orientation robust scene text detection. arXiv 2017, arXiv:1706.09579. [Google Scholar]
  28. Xu, Y.; Fu, M.; Wang, Q.; Wang, Y.; Chen, K.; Xia, G.S.; Bai, X. Gliding vertex on the horizontal bounding box for multi-oriented object detection. IEEE Trans. Pattern Anal. Mach. Intell. 2020, 43, 1452–1459. [Google Scholar] [CrossRef]
  29. Tian, Z.; Shen, C.; Chen, H.; He, T. FCOS: A simple and strong anchor-free object detector. IEEE Trans. Pattern Anal. Mach. Intell. 2020, 44, 1922–1933. [Google Scholar] [CrossRef]
  30. Zhu, B.; Wang, J.; Jiang, Z.; Zong, F.; Liu, S.; Li, Z.; Sun, J. Autoassign: Differentiable label assignment for dense object detection. arXiv 2020, arXiv:2007.03496. [Google Scholar]
  31. Lyu, C.; Zhang, W.; Huang, H.; Zhou, Y.; Wang, Y.; Liu, Y.; Zhang, S.; Chen, K. Rtmdet: An empirical study of designing real-time object detectors. arXiv 2022, arXiv:2212.07784. [Google Scholar]
  32. Rezatofighi, H.; Tsoi, N.; Gwak, J.; Sadeghian, A.; Reid, I.; Savarese, S. Generalized intersection over union: A metric and a loss for bounding box regression. In Proceedings of the IEEE/CVF Conference on Computer Vision and Pattern Recognition, Long Beach, CA, USA, 15–20 June 2019; pp. 658–666. [Google Scholar]
  33. Zheng, Z.; Wang, P.; Liu, W.; Li, J.; Ye, R.; Ren, D. Distance-IoU loss: Faster and better learning for bounding box regression. In Proceedings of the AAAI Conference on Artificial Intelligence, New York, NY, USA, 7–12 February 2020; Volume 34, pp. 12993–13000. [Google Scholar]
  34. Zhou, D.; Fang, J.; Song, X.; Guan, C.; Yin, J.; Dai, Y.; Yang, R. Iou loss for 2d/3d object detection. In Proceedings of the 2019 International Conference on 3D Vision (3DV), Québec City, QC, Canada, 16–19 September 2019; IEEE: Piscataway, NJ, USA, 2019; pp. 85–94. [Google Scholar]
  35. Raisi, Z.; Naiel, M.A.; Younes, G.; Wardell, S.; Zelek, J.S. Transformer-based text detection in the wild. In Proceedings of the IEEE/CVF Conference on Computer Vision and Pattern Recognition, Nashville, TN, USA, 20–25 June 2021; pp. 3162–3171. [Google Scholar]
  36. Liu, L.; Pan, Z.; Lei, B. Learning a rotation invariant detector with rotatable bounding box. arXiv 2017, arXiv:1711.09405. [Google Scholar]
  37. Yang, X.; Yan, J. Arbitrary-oriented object detection with circular smooth label. In Proceedings of the Computer Vision–ECCV 2020: 16th European Conference, Glasgow, UK, 23–28 August 2020; Proceedings, Part VIII 16. Springer: Berlin/Heidelberg, Germany, 2020; pp. 677–694. [Google Scholar]
  38. Yang, X.; Hou, L.; Zhou, Y.; Wang, W.; Yan, J. Dense label encoding for boundary discontinuity free rotation detection. In Proceedings of the IEEE/CVF Conference on Computer Vision and Pattern Recognition, Nashville, TN, USA, 20–25 June 2021; pp. 15819–15829. [Google Scholar]
  39. Yang, X.; Yang, J.; Yan, J.; Zhang, Y.; Zhang, T.; Guo, Z.; Sun, X.; Fu, K. Scrdet: Towards more robust detection for small, cluttered and rotated objects. In Proceedings of the IEEE/CVF International Conference on Computer Vision, Seoul, Republic of Korea, 27 October–2 November 2019; pp. 8232–8241. [Google Scholar]
  40. Cheng, G.; Wang, J.; Li, K.; Xie, X.; Lang, C.; Yao, Y.; Han, J. Anchor-free oriented proposal generator for object detection. IEEE Trans. Geosci. Remote. Sens. 2022, 60, 1–11. [Google Scholar] [CrossRef]
  41. Li, Z.; Hou, B.; Wu, Z.; Ren, B.; Yang, C. FCOSR: A simple anchor-free rotated detector for aerial object detection. Remote Sens. 2023, 15, 5499. [Google Scholar] [CrossRef]
  42. Zhu, H.; Chen, X.; Dai, W.; Fu, K.; Ye, Q.; Jiao, J. Orientation robust object detection in aerial images using deep convolutional neural network. In Proceedings of the 2015 IEEE International Conference on Image Processing (ICIP), Quebec City, QC, Canada, 27–30 September 2015; IEEE: Piscataway, NJ, USA, 2015; pp. 3735–3739. [Google Scholar]
  43. Zhou, Y.; Yang, X.; Zhang, G.; Wang, J.; Liu, Y.; Hou, L.; Jiang, X.; Liu, X.; Yan, J.; Lyu, C.; et al. MMRotate: A Rotated Object Detection Benchmark Using PyTorch. In Proceedings of the 30th ACM International Conference on Multimedia (ACM MM), Lisbon, Portugal, 10–14 October 2022; pp. 4108–4117. [Google Scholar] [CrossRef]
  44. Everingham, M.; Van Gool, L.; Williams, C.K.I.; Winn, J.; Zisserman, A. The PASCAL Visual Object Classes (VOC) Challenge. Int. J. Comput. Vis. 2010, 88, 303–338. [Google Scholar] [CrossRef]
  45. Everingham, M.; Van Gool, L.; Williams, C.K.I.; Winn, J.; Zisserman, A. The PASCAL Visual Object Classes Challenge: A Retrospective. Int. J. Comput. Vis. 2015, 111, 98–136. [Google Scholar] [CrossRef]
  46. Ding, J.; Xue, N.; Long, Y.; Xia, G.S.; Lu, Q. Learning RoI transformer for oriented object detection in aerial images. In Proceedings of the IEEE/CVF Conference on Computer Vision and Pattern Recognition, Long Beach, CA, USA, 15–20 June 2019; pp. 2849–2858. [Google Scholar]
  47. Qian, W.; Yang, X.; Peng, S.; Yan, J.; Guo, Y. Learning modulated loss for rotated object detection. In Proceedings of the AAAI Conference on Artificial Intelligence, Virtually, 2–9 February 2021; Volume 35, pp. 2458–2466. [Google Scholar]
  48. Song, Q.; Yang, F.; Yang, L.; Liu, C.; Hu, M.; Xia, L. Learning point-guided localization for detection in remote sensing images. IEEE J. Sel. Top. Appl. Earth Obs. Remote. Sens. 2020, 14, 1084–1094. [Google Scholar] [CrossRef]
  49. Yi, J.; Wu, P.; Liu, B.; Huang, Q.; Qu, H.; Metaxas, D. Oriented object detection in aerial images with box boundary-aware vectors. In Proceedings of the IEEE/CVF Winter Conference on Applications of Computer Vision, Virtual, 5–9 January 2021; pp. 2150–2159. [Google Scholar]
  50. Ming, Q.; Zhou, Z.; Miao, L.; Zhang, H.; Li, L. Dynamic anchor learning for arbitrary-oriented object detection. In Proceedings of the AAAI Conference on Artificial Intelligence, Virtually, 2–9 February 2021; Volume 35, pp. 2355–2363. [Google Scholar]
  51. Ming, Q.; Miao, L.; Zhou, Z.; Yang, X.; Dong, Y. Optimization for arbitrary-oriented object detection via representation invariance loss. IEEE Geosci. Remote. Sens. Lett. 2021, 19, 1–5. [Google Scholar] [CrossRef]
  52. Ming, Q.; Miao, L.; Zhou, Z.; Song, J.; Yang, X. Sparse label assignment for oriented object detection in aerial images. Remote Sens. 2021, 13, 2664. [Google Scholar] [CrossRef]
  53. Yang, X.; Yan, J. On the arbitrary-oriented object detection: Classification based approaches revisited. Int. J. Comput. Vis. 2022, 130, 1340–1365. [Google Scholar] [CrossRef]
  54. Ming, Q.; Miao, L.; Zhou, Z.; Dong, Y. CFC-Net: A critical feature capturing network for arbitrary-oriented object detection in remote-sensing images. IEEE Trans. Geosci. Remote. Sens. 2021, 60, 1–14. [Google Scholar] [CrossRef]
  55. Ming, Q.; Miao, L.; Zhou, Z.; Song, J.; Dong, Y.; Yang, X. Task interleaving and orientation estimation for high-precision oriented object detection in aerial images. ISPRS J. Photogramm. Remote. Sens. 2023, 196, 241–255. [Google Scholar] [CrossRef]
  56. Redmon, J.; Farhadi, A. Yolov3: An incremental improvement. arXiv 2018, arXiv:1804.02767. [Google Scholar]
  57. Xia, G.S.; Bai, X.; Ding, J.; Zhu, Z.; Belongie, S.; Luo, J.; Datcu, M.; Pelillo, M.; Zhang, L. DOTA: A large-scale dataset for object detection in aerial images. In Proceedings of the IEEE Conference on Computer Vision and Pattern Recognition, Salt Lake City, UT, USA, 18–23 June 2018; pp. 3974–3983. [Google Scholar]
  58. Zhu, J.; Ruan, Y.; Jing, D.; Fu, Q.; Ma, T. PSMDet: Enhancing Detection Accuracy in Remote Sensing Images Through Self-Modulation and Gaussian-Based Regression. Sensors 2025, 25, 1285. [Google Scholar] [CrossRef] [PubMed]
  59. Dai, L.; Liu, H.; Tang, H.; Wu, Z.; Song, P. AO2-DETR: Arbitrary-oriented object detection transformer. IEEE Trans. Circuits Syst. Video Technol. 2022, 33, 2342–2356. [Google Scholar] [CrossRef]
  60. Carion, N.; Massa, F.; Synnaeve, G.; Usunier, N.; Kirillov, A.; Zagoruyko, S. End-to-end object detection with transformers. In Proceedings of the European Conference on Computer Vision, Glasgow, UK, 23–28 August 2020; Springer: Berlin/Heidelberg, Germany, 2020; pp. 213–229. [Google Scholar]
Figure 1. Geometric features and distribution patterns of objects in RSI. (a) Arbitrary orientation distribution. (b) Extreme aspect ratio disparity. (c) Multi-scale variation and dense arrangement. The image is sourced from the HRSC2016 dataset [1].
Symmetry 17 00594 g001
Figure 2. (a) Angle regression deviation in high-aspect-ratio objects caused by smooth L 1 . (b) The proposed GEIoU strategy exhibits significant improvements in prediction performance.
Symmetry 17 00594 g002
Figure 3. Different annotation types in OOD. (a) HBBox. (b) OBBox. (c) FBBox.
Symmetry 17 00594 g003
Figure 4. Different OBBox annotation methods. (a) OpenCV annotation method D o c . (b) long-edge annotation method D l e .
Symmetry 17 00594 g004
Figure 5. Comparison of trend variations across different loss functions under varying parameter conditions.
Symmetry 17 00594 g005
Figure 6. Illustration of sampling insufficiency and sample imbalance under fixed-scale LA.
Symmetry 17 00594 g006
Figure 7. Comparison of existing spatial sampling strategies: (a) rectangular BBox sampling; (b) central region-based sampling.
Symmetry 17 00594 g007
Figure 8. Illustration of the proposed ODAA strategy. The two-stage process includes (1) Multi-Scale Adaptive Assignment (MSAA), which selects top-k samples from feature maps based on scale alignment and proximity to object centers; and (2) Spatial Geometric Screening (SGS), which applies an elliptical mask defined by the object’s w, h, and θ to refine the candidate positive samples.
Symmetry 17 00594 g008
Figure 9. Illustration of GT object representation.
Symmetry 17 00594 g009
Figure 10. Comparison of different spatial sampling regions: (a) fixed rectangular BBox sampling; (b) center-based rectangular shrink sampling; (c) aspect ratio-adaptive region proposed for the SGS.
Symmetry 17 00594 g010
Figure 11. Visualization examples of the proposed method on the HRSC2016 dataset. Each image is labeled with a number at the top-left corner to indicate the corresponding detection result for clearer reference. Zoom-in is recommended for clearer inspection of details.
Symmetry 17 00594 g011
Figure 12. Visualization results of the proposed method on the UCAS-AOD dataset. Each image is labeled with a number at the top-left corner to indicate the corresponding detection result for clearer reference. Zoom-in is recommended for better detail inspection.
Symmetry 17 00594 g012
Figure 13. Detection comparisons of GWD (first row), KLD (second row), and GaussianDet (third row) on the HRSC2016 and UCAS-AOD datasets. Green, red, and yellow BBoxes indicate the prediction results of the three methods, respectively. The number in the lower-left corner of each predicted box corresponds to the following: (a,b) ship detection results; (c,d) vehicle and aircraft detection results.
Symmetry 17 00594 g013
Figure 14. Bad cases of GaussianDet in high-aspect-ratio OD. Green boxes denote the model’s predicted detection results. Circled numbers at the bottom left of each box indicate the location of the corresponding predictions.
Symmetry 17 00594 g014
Table 1. Detection performance comparison of different component combinations on the UCAS-AOD dataset. Best results are shown in bold. Detection performance comparison of different component combinations on UCAS-AOD dataset. Best results are shown in bold.
ODAAGEIoU LossCarAirplanemAP(07)
w/ow/o86.2888.8687.57
w/w/o87.37 (+1.09)89.11 (+0.25)88.24 (+0.67)
w/ow/87.51 (+1.23)90.13 (+1.27)88.82 (+1.25)
w/w/88.13 (+1.85)90.45 (+1.59)89.29 (+1.72)
Table 2. Detection performance comparison of different component combinations on HRSC2016 dataset. Best results are shown in bold.
ODAAGEIoU LossmAP(07)mAP(12)
w/ow/o87.9291.87
w/w/o88.75 (+0.83)92.34 (+0.47)
w/ow/89.26 (+1.34)93.91 (+2.04)
w/w/89.81 (+1.89)94.75 (+2.88)
Table 3. Ablation study of MDAA components on UCAS-AOD dataset. Best results are highlighted in bold.
MSAASGSCarAirplanemAP(07)
w/ow/o86.2888.8687.57
w/w/o86.44 (+0.16)89.20 (+0.34)87.82 (+0.25)
w/ow/87.05 (+0.77)88.97 (+0.11)88.01 (+0.44)
w/w/87.37 (+1.09)89.11 (+0.25)88.24 (+0.67)
Table 4. Ablation study of MDAA components on HRSC2016 dataset. Best results are highlighted in bold.
MSAASGSmAP(07)mAP(12)
w/ow/o87.9291.87
w/w/o88.21 (+0.29)91.96 (+0.09)
w/ow/88.48 (+0.56)92.15 (+0.28)
w/w/88.75 (+0.83)92.34 (+0.47)
Table 5. Performance comparison of different regression loss functions on UCAS-AOD dataset. Best results are highlighted in bold.
LossCarAirplanemAP(07)
smooth L 1 86.2888.8687.57
GWD86.76 (+0.48)89.06 (+0.2)87.91 (+0.34)
KLD86.92 (+0.64)89.98 (+1.12)88.45 (+0.88)
GEloU87.51 (+1.23)90.13 (+1.27)88.82 (+1.25)
Table 6. Performance comparison of different regression loss functions on HRSC2016 dataset. Best results are highlighted in bold.
LossmAP(07)mAP(12)
smooth L 1 87.9291.87
GWD88.39 (+0.47)92.65 (+0.78)
KLD88.78 (+0.86)93.54 (+1.67)
GEloU89.26 (+1.34)93.91 (+2.04)
Table 7. Detection performance comparison of different LA strategies on UCAS-AOD dataset. Best results are highlighted in bold.
LA StrategiesCarAirplanemAP(07)
FCOS86.2888.8687.57
ATSS86.52 (+0.24)88.79 (−0.07)87.66 (+0.09)
SimOTA86.96 (+0.68)89.06 (+0.2)88.01 (+0.44)
Ours87.37 (+1.09)89.11 (+0.25)88.24 (+0.67)
Table 8. Detection performance comparison of different LA strategies on HRSC2016 dataset.
LA StrategiesmAP(07)mAP(12)
FCOS87.9291.87
ATSS88.28 (+0.36)92.04 (+0.17)
SimOTA88.67 (+0.75)92.26 (+0.39)
Ours88.75 (+0.83)92.34 (+0.47)
Table 9. Rationality analysis of different numbers of positive samples k. Best results are highlighted in bold.
k12131415161718
UCAS-AOD mAP(07)87.6888.0588.2488.2087.8587.6787.49
HRSC2016 mAP(07)86.5287.3687.4288.7587.9387.7587.81
Table 10. Detection performance comparison of different methods on HRSC2016 dataset. Best results are highlighted in bold.
MethodBackboneInput SizemAP(07)mAP(12)
RolTransformer [46]ResNet101512 × 80086.20
RSDet [47]ResNet50800 × 80086.5
GlidingVertex [28]ResNet101512 × 80088.20
OPLD [48]ResNet501024 × 133388.44
BBoxAVectors [49]ResNet101608 × 60888.60
DAL [50]ResNet101416 × 41688.95
RIDet-Q [51]ResNet101800 × 80089.10
R 3 Det [18]ResNet101800 × 80089.2696.01
DCL [38]ResNet101800 × 80089.4696.41
SLA [52]ResNet101768 × 76889.51
CSL [53]ResNet50800 × 80089.6296.10
RIDet-O [51]ResNet101800 × 80089.63
CFC-Net [54]ResNet101800 × 80089.70
GWD [23]ResNet101800 × 80089.8597.37
TIOE-Det [55]ResNet101800 × 80090.1696.65
S 2 A-Net [17]ResNet101512 × 80090.1795.01
GaussianDet (Ours)CSPNeXt-L800 × 80090.5396.24
Table 11. Detection performance comparison of different methods on UCAS-AOD dataset. Best results are highlighted in bold.
MethodBackboneInput SizeCarAirplanemAP(07)
R-Yolov3 [56]Darknet53800 × 80074.6389.5282.08
R-RetinaNet [13]ResNet50800 × 80084.6490.5187.57
Faster RCNN [57]ResNet50800 × 80086.8789.8688.36
RolTransformer [46]ResNet50800 × 80088.0290.0289.02
RIDet-Q [51]ResNet50800 × 80088.5089.9689.23
SLA [52]ResNet50800 × 80088.5790.3089.44
CFC-Net [54]ResNet50800 × 80089.2988.6989.49
TIOE-Det [55]ResNet50800 × 80088.8390.1589.49
RIDet-O [51]ResNet50800 × 80088.8890.3589.62
PSMDet [58]RLK-Net [58]800 × 80088.9890.5789.78
DAL [50]ResNet50800 × 80089.2590.4989.87
S 2 A-Net [17]ResNet50800 × 80089.5690.4289.99
GaussianDet (Ours)CSPNeXt-L800 × 80089.9490.7790.36
Table 12. Comparison of mAP(07) and mAP(12) for different methods on HRSC2016 dataset. Best results are highlighted in bold.
MethodBackboneInputSizemAP(07)mAP(12)
AO2-DETRResNet50800 × 800 88.1297.47
GaussianDet (Ours)CSPNeXt-L800 × 80090.5396.24
Table 13. Comparison of mAP(07) for different methods on UCAS-AOD dataset. Best results are highlighted in bold.
MethodBackboneInput SizeCarAirplanemAP(07)
AO2-DETRResNet50800 × 80085.8789.7187.79
GaussianDet (Ours)CSPNeXt-L800 × 80089.9490.7790.36
Table 14. Detection performance comparison under different backbone architectures (with ODAA + GEIoU consistently applied). Best results are highlighted in bold.
BackboneUCAS-AOD mAP(07)HRSC2016 mAP(07)HRSC2016 mAP(12)
ResNet5090.0590.1894.75
ResNet10190.2190.3795.02
CSPNeXt-L90.3690.5395.28
Table 15. Detection performance comparison under different image resolution settings on HRSC2016 and UCAS-AOD datasets. Best results are highlighted in bold.
ResolutionUCAS-AOD mAP(07)HRSC2016 mAP(07)HRSC2016 mAP(12)FPS
0.5 ×86.4387.3292.8217.40
1 ×90.3690.5395.0213.30
2 ×90.6790.7495.477.60
Disclaimer/Publisher’s Note: The statements, opinions and data contained in all publications are solely those of the individual author(s) and contributor(s) and not of MDPI and/or the editor(s). MDPI and/or the editor(s) disclaim responsibility for any injury to people or property resulting from any ideas, methods, instructions or products referred to in the content.

