3.2. Establishment of the Overall Model
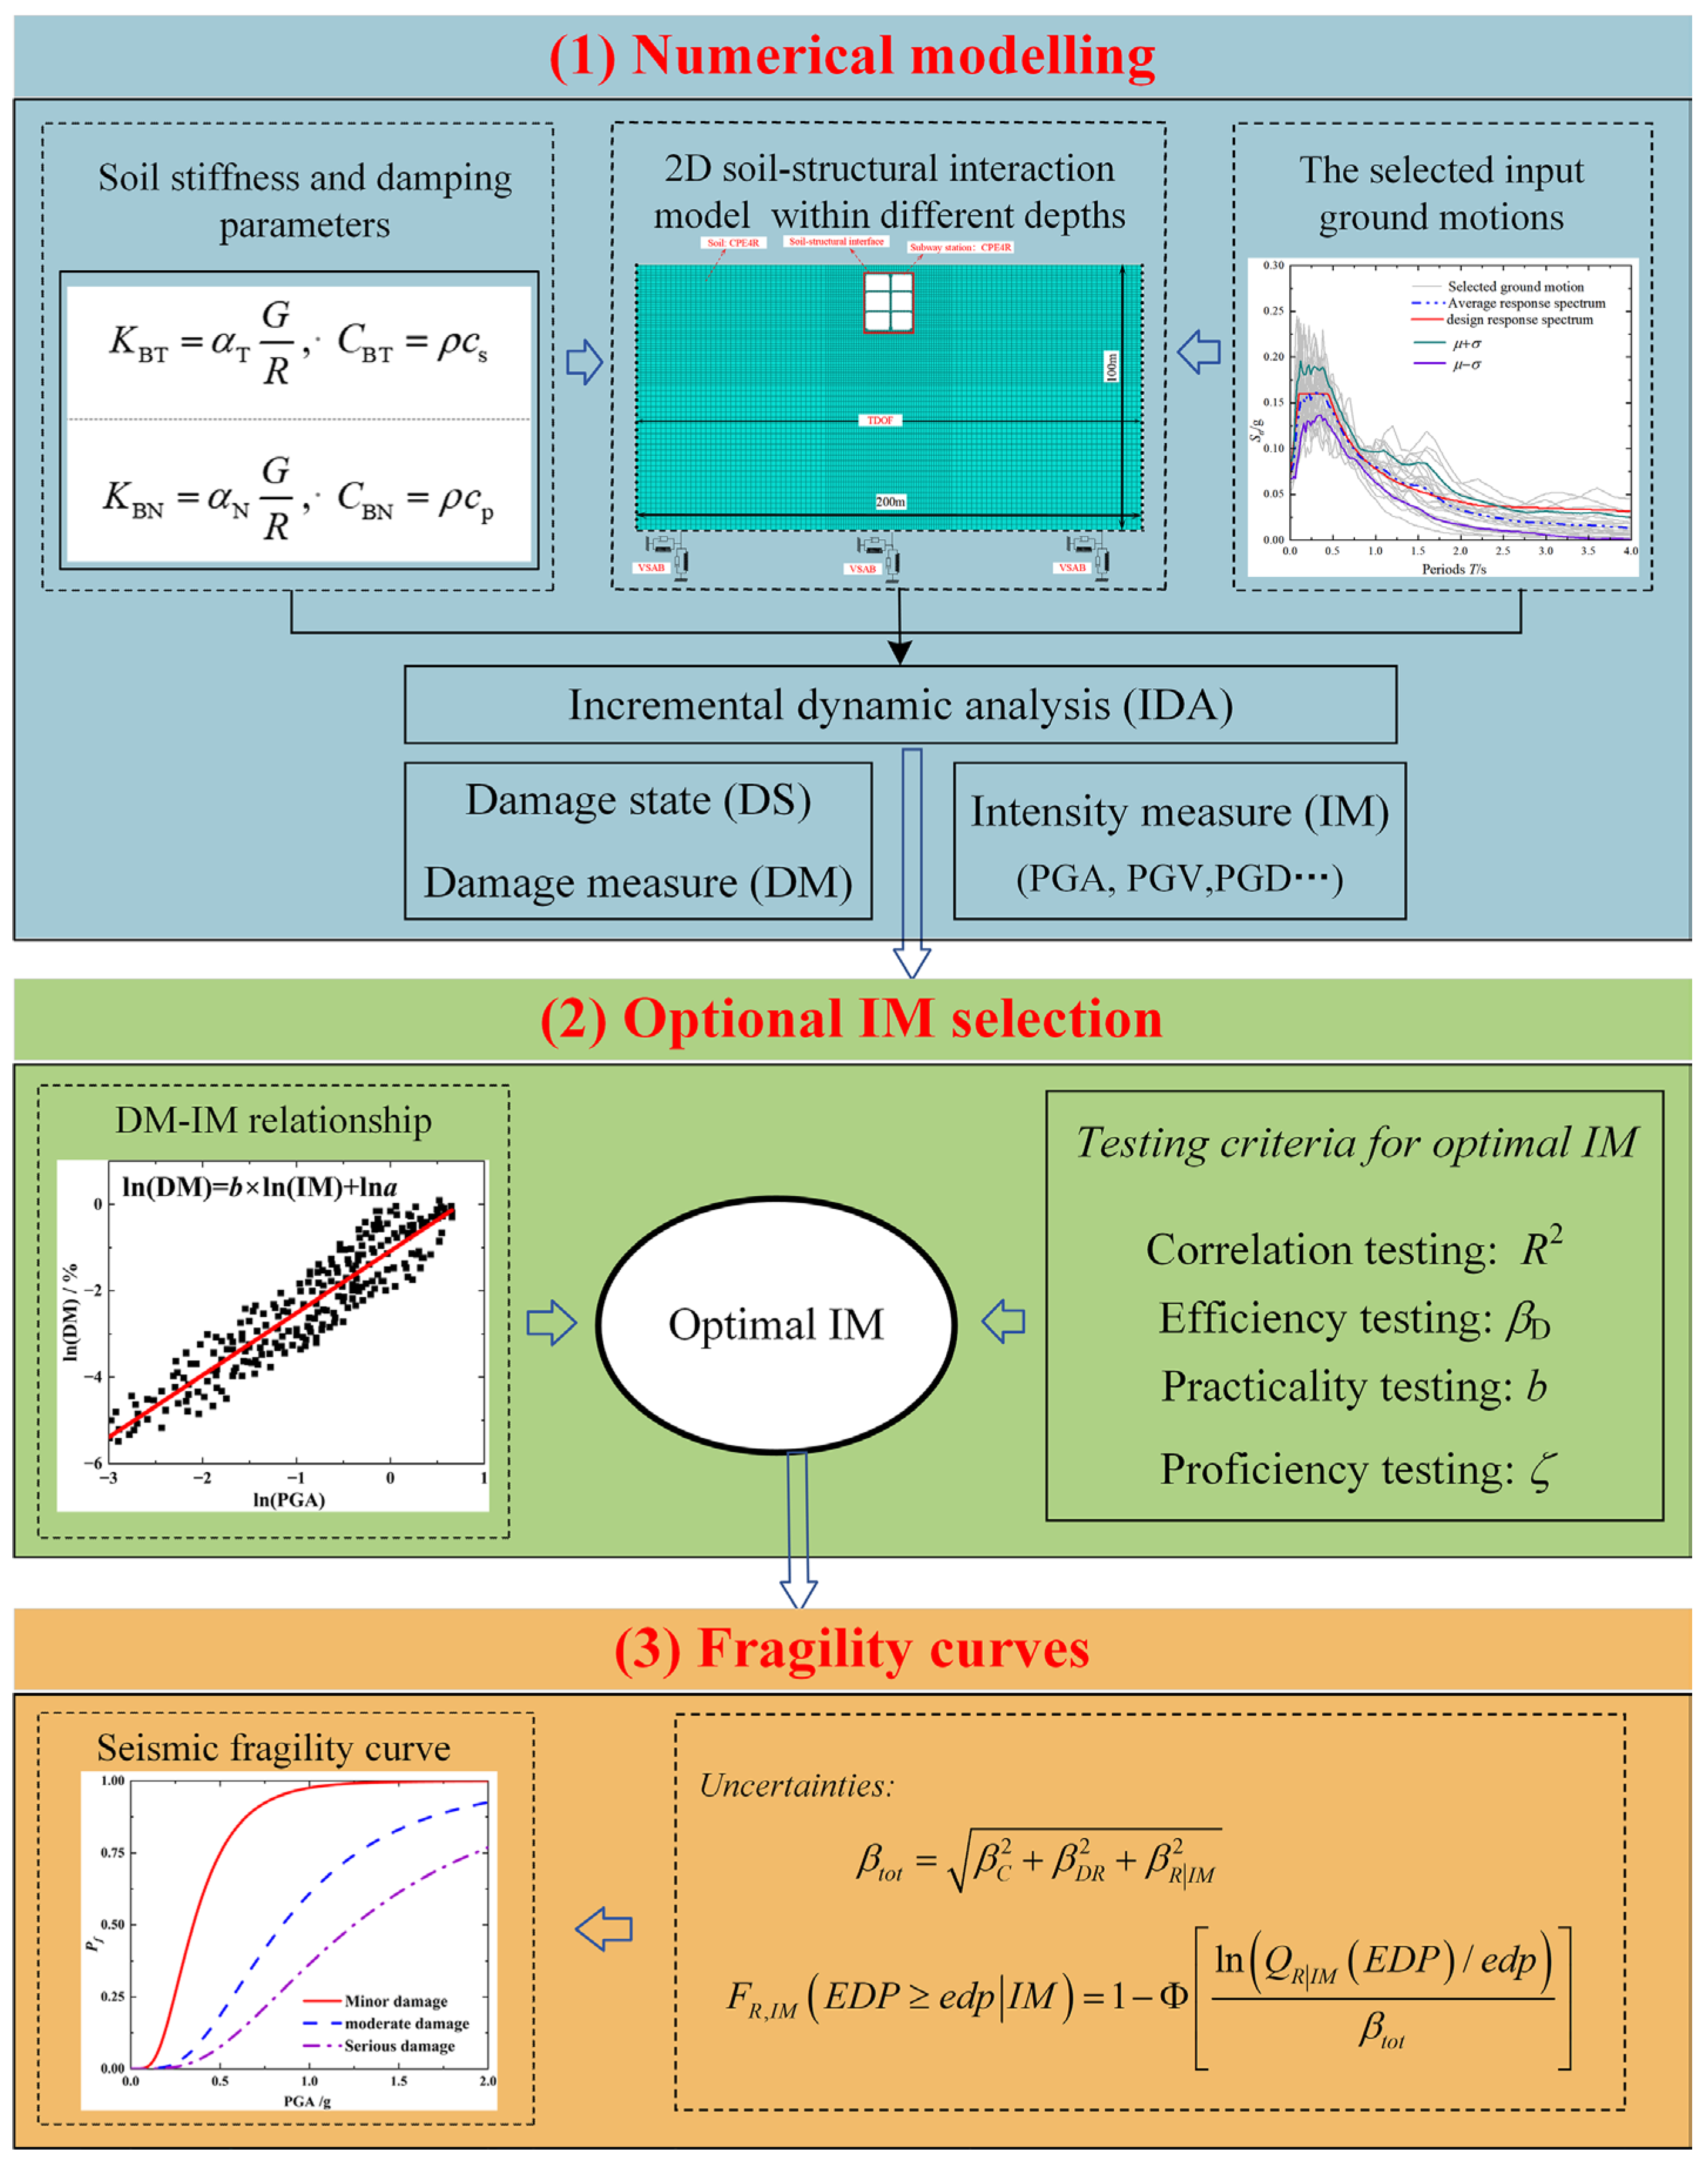
To account for the soil–structure interaction (SSI), a 2D numerical model of the SSI system for the prefabricated rectangular subway station was constructed using the software ABAQUS (Version 2022), as shown in
Figure 4. The lateral extent of the soil domain in the model was established at ten times the width of the station structure, resulting in overall model dimensions of 200 m in width and 100 m in height. The upper boundary of the model corresponds to the ground surface elevation, while the lower boundary is positioned at the bedrock interface. According to the analysis methods in the literature [
36], the central column was represented as a wall element with uniform longitudinal section properties using the equivalent bending stiffness approach. This simplification ensures both mechanical accuracy and computational efficiency in the dynamic analysis. Consequently, it is necessary to incorporate a strength reduction factor, and the elastic modulus of the equivalent wall can be quantitatively calculated using Equation (8).
where
EeqIeq denotes the equivalent flexural rigidity per unit length of the wall,
EcIc represents the flexural rigidity of the intermediate column, and
L denotes the longitudinal spacing between intermediate columns in the prefabricated subway station along its longitudinal axis.
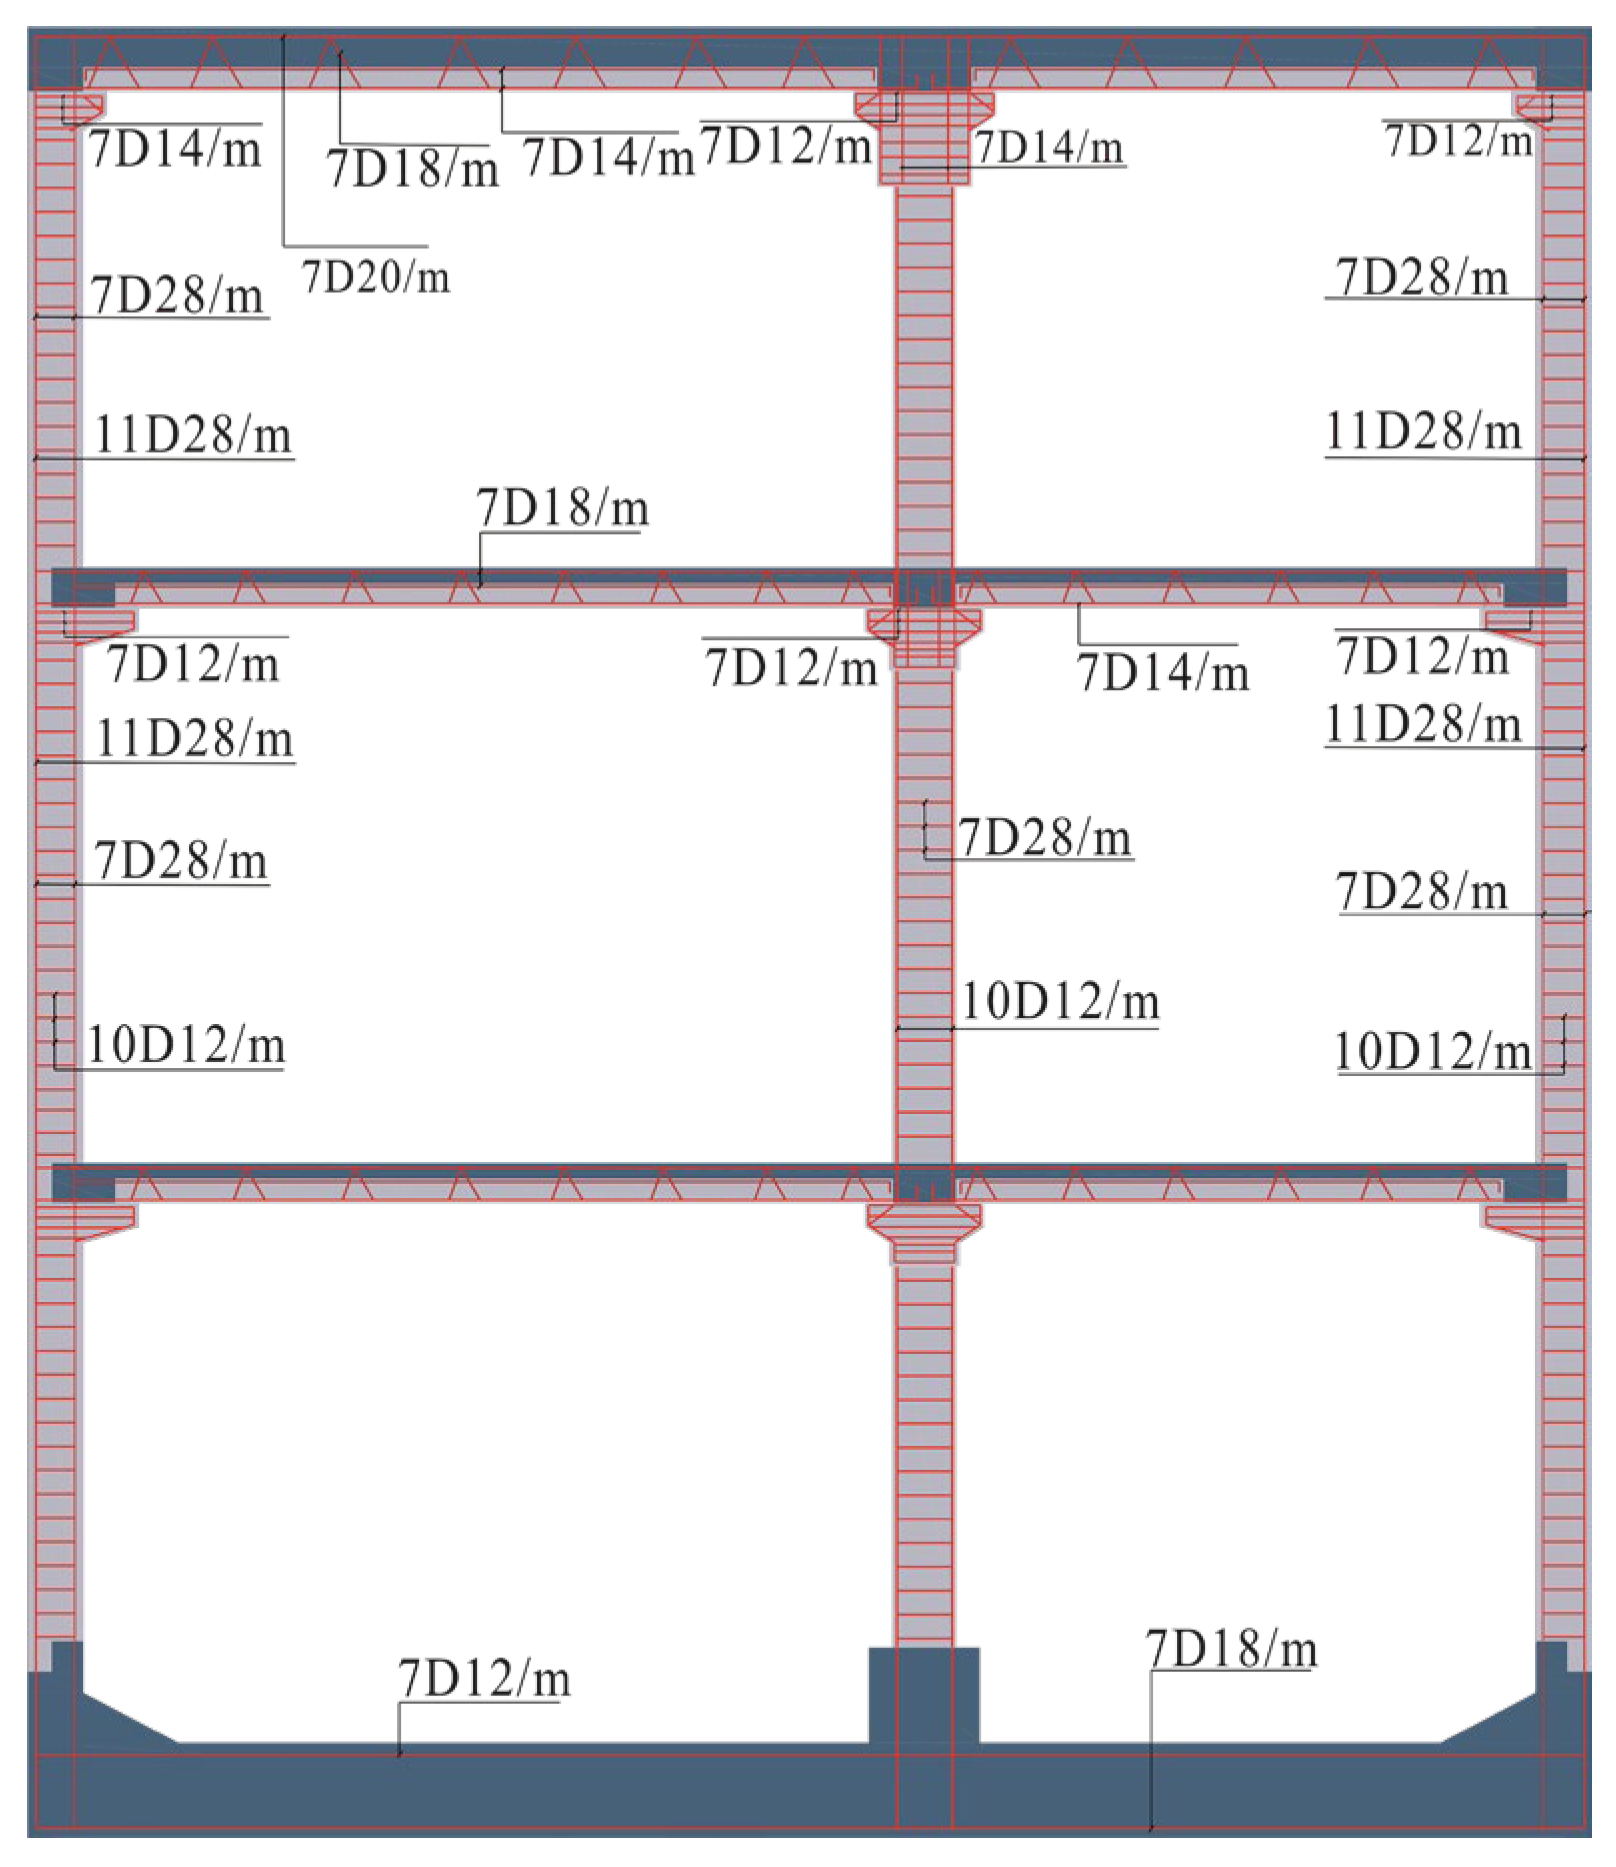
The prefabricated rectangle subway station used C50 concrete. To accurately simulate the progression of damage in concrete under earthquake excitation, this study employs the Concrete Damaged Plasticity Model (CDPM), a framework initially conceptualized by Lubliner et al. [
37]. The damage evolution is quantitatively characterized through compression and tensile damage parameters, represented as
dc and
dt, respectively, as depicted in
Figure 5b. The material parameters of reinforcement and concrete are shown in
Table 2,
Table 3 and
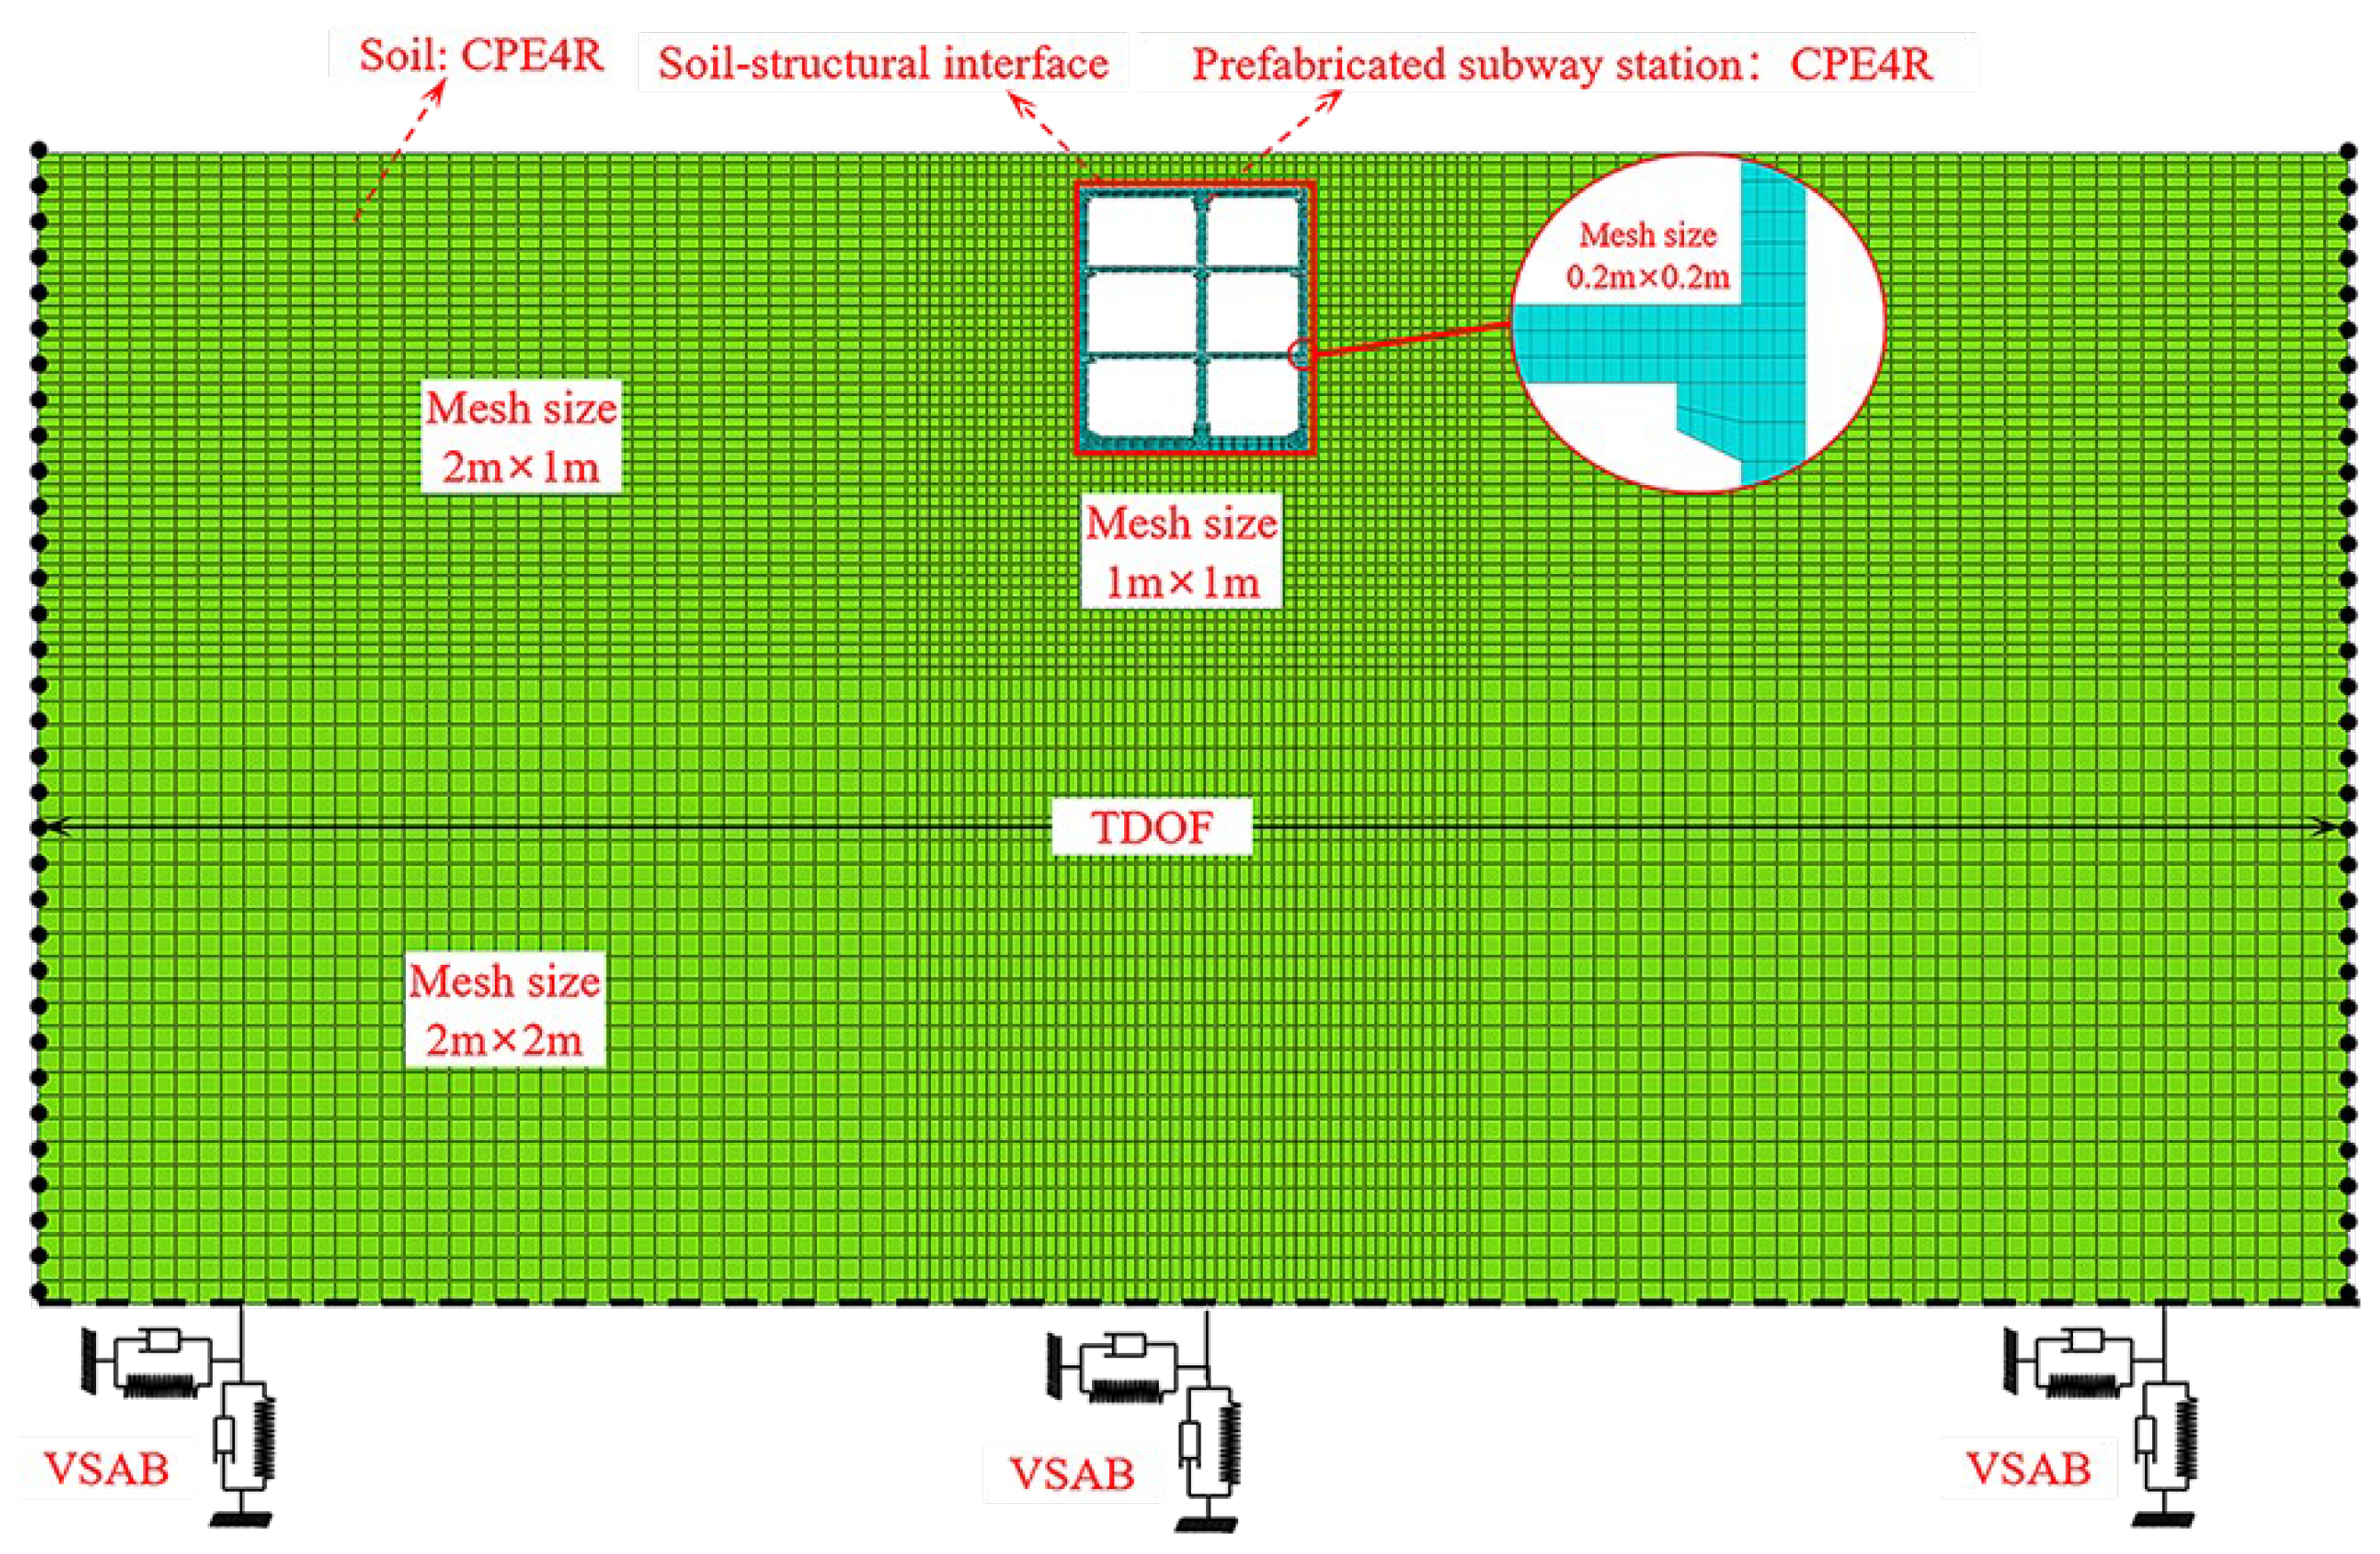
Table 4. To guarantee the accuracy of the model, the subway station and the soil adopt the four-node plane strain reduced integration element (CPE4R) from the ABAQUS element library. The reinforcement is modeled using the two-node beam element (B21) and is embedded in the concrete, assuming perfect bonding between the steel bars and the concrete without considering any slip. To ensure the quality of mesh generation, Liao and Liu [
38] pointed out that the optimal mesh size for numerical discretization should be determined by Equation (9). Based on the input shear wave velocity
Vs of 375.2 m/s and
fmax of 15 Hz, the maximum mesh size can be obtained as 2.53 m. Therefore, a maximum mesh size of 2 m can meet the requirements.
where
Vs represents the shear wave velocity of soil layer, which was derived from the relationship
;
fmax represents the maximum frequency of the input.
In accordance with the aforementioned requirements, the model is discretized into a quadrilateral element mesh. For the soil mesh near the subway station, a size of 1 m × 1 m is adopted, whereas the soil mesh further away is 2 m × 2 m, and the mesh size for reinforcement and concrete is 0.2 m. The meshed model is shown in
Figure 4.
The connection positions of the prefabricated components are simulated using surface contact to model the transverse and longitudinal connections between the components. The hard contact formulation is implemented in outside contact surface orientations to prevent penetration, while tangential behavior is governed by the Coulomb friction model, with a friction coefficient of 0.8 [
39]. Furthermore, the soil–structure interface is idealized to maintain continuous contact during seismic excitation, eliminating any relative sliding or separation. This interaction is modeled using a “surface-to-surface” contact algorithm, with a friction coefficient of 0.4 defined to characterize the interface behavior [
40].
To accurately capture the dynamic response of the SSI system subjected to vertically propagating seismic shear waves, kinematic constraints are imposed at equivalent burial depths on both lateral boundaries of the soil domain. This constraint ensures that nodal displacements at corresponding depths on opposite sides of the soil mass remain identical [
41]. The viscoelastic artificial boundary (VSAB) is used for realizing the wave absorption and reflection characteristics of a semi-infinite medium. The VSAB formulation exhibits superior frequency stability and effectively simulates the elastic recovery properties of the unbounded domain beyond the truncated boundary, making it a widely adopted and extensively validated approach [
42]. The equivalent physical parameters of the VSAB, namely the spring coefficient and damping coefficient, are determined through Equations (10) and (11), respectively.
where
KBT and
KBN represent the normal and tangential stiffness of the spring, respectively,
R is the radial distance from the wave source to the artificial boundary point,
cs and
cp are the S-wave and P-wave velocities, respectively,
G is the shear modulus of the medium and
ρ is the mass density of the medium, and
αT and
αN are the tangential and normal viscoelastic artificial boundary parameters, respectively. According to the reference literature, their values are
αT = 1/2 and
αN = 1 [
42].
In this study, to analyze the seismic response of the subway station SSI system subjected to vertically propagating shear waves, the Translational Degree of Freedom (TDOF) is adopted for the horizontal direction. This constraint represents the coupled motion of nodes on both boundaries of the SSI model at the same burial depth. In the analysis, each step is divided into two parts. First, a static analysis is performed to ascertain the initial stress distribution within the SSI system. Second, a viscoelastic artificial boundary system is established based on the equivalent spring stiffness and damping coefficients derived from Equations (10) and (11), multiplied by the corresponding influence area. Following the method introduced by Du and Zhao [
43], the seismic input is converted into a time history representation of equivalent nodal forces applied at the base boundary of the SSI system for subsequent dynamic analysis, as mathematically expressed in Equation (12).
where
represents the equivalent nodal force on the artificial boundary node,
and
represent the equivalent spring stiffness and damping coefficient of the viscoelastic boundary, respectively,
and
represent the displacement and velocity vectors of unrestricted condition of soil at an artificial boundary node, respectively,
is the stress tensor of the unrestricted condition of soil,
represents the influence area of the artificial boundary node, and
is the cosine vector of the outer normal direction of the boundary.
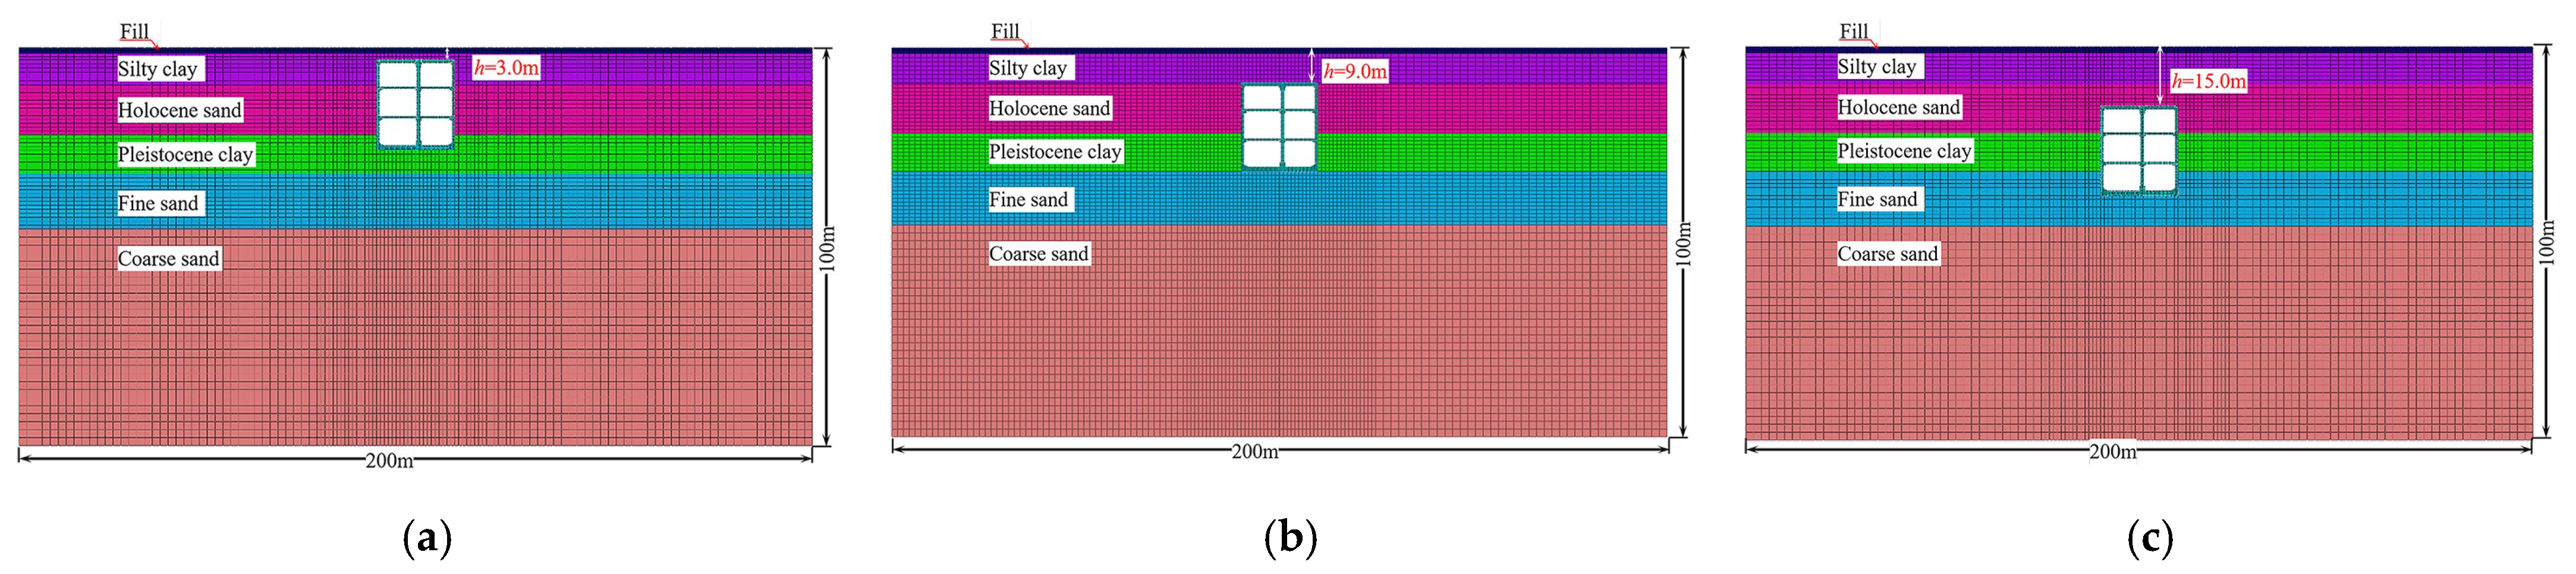
In this study, three different burial depths (3 m, 9 m, and 15 m) are considered, as shown in
Figure 6. The geotechnical properties of each soil stratum are detailed in
Table 5. To simulate the nonlinear soil response, the numerical code DEEPSOIL [
28] was initially employed to perform a 1D seismic response analysis of the soil profile, deriving the equivalent shear modulus under varying horizontal seismic intensities. However, this approach is limited in its capacity to account for the cumulative residual deformation of soil under dynamic loading conditions, and its predictive accuracy may be substantially compromised under strong seismic excitation.
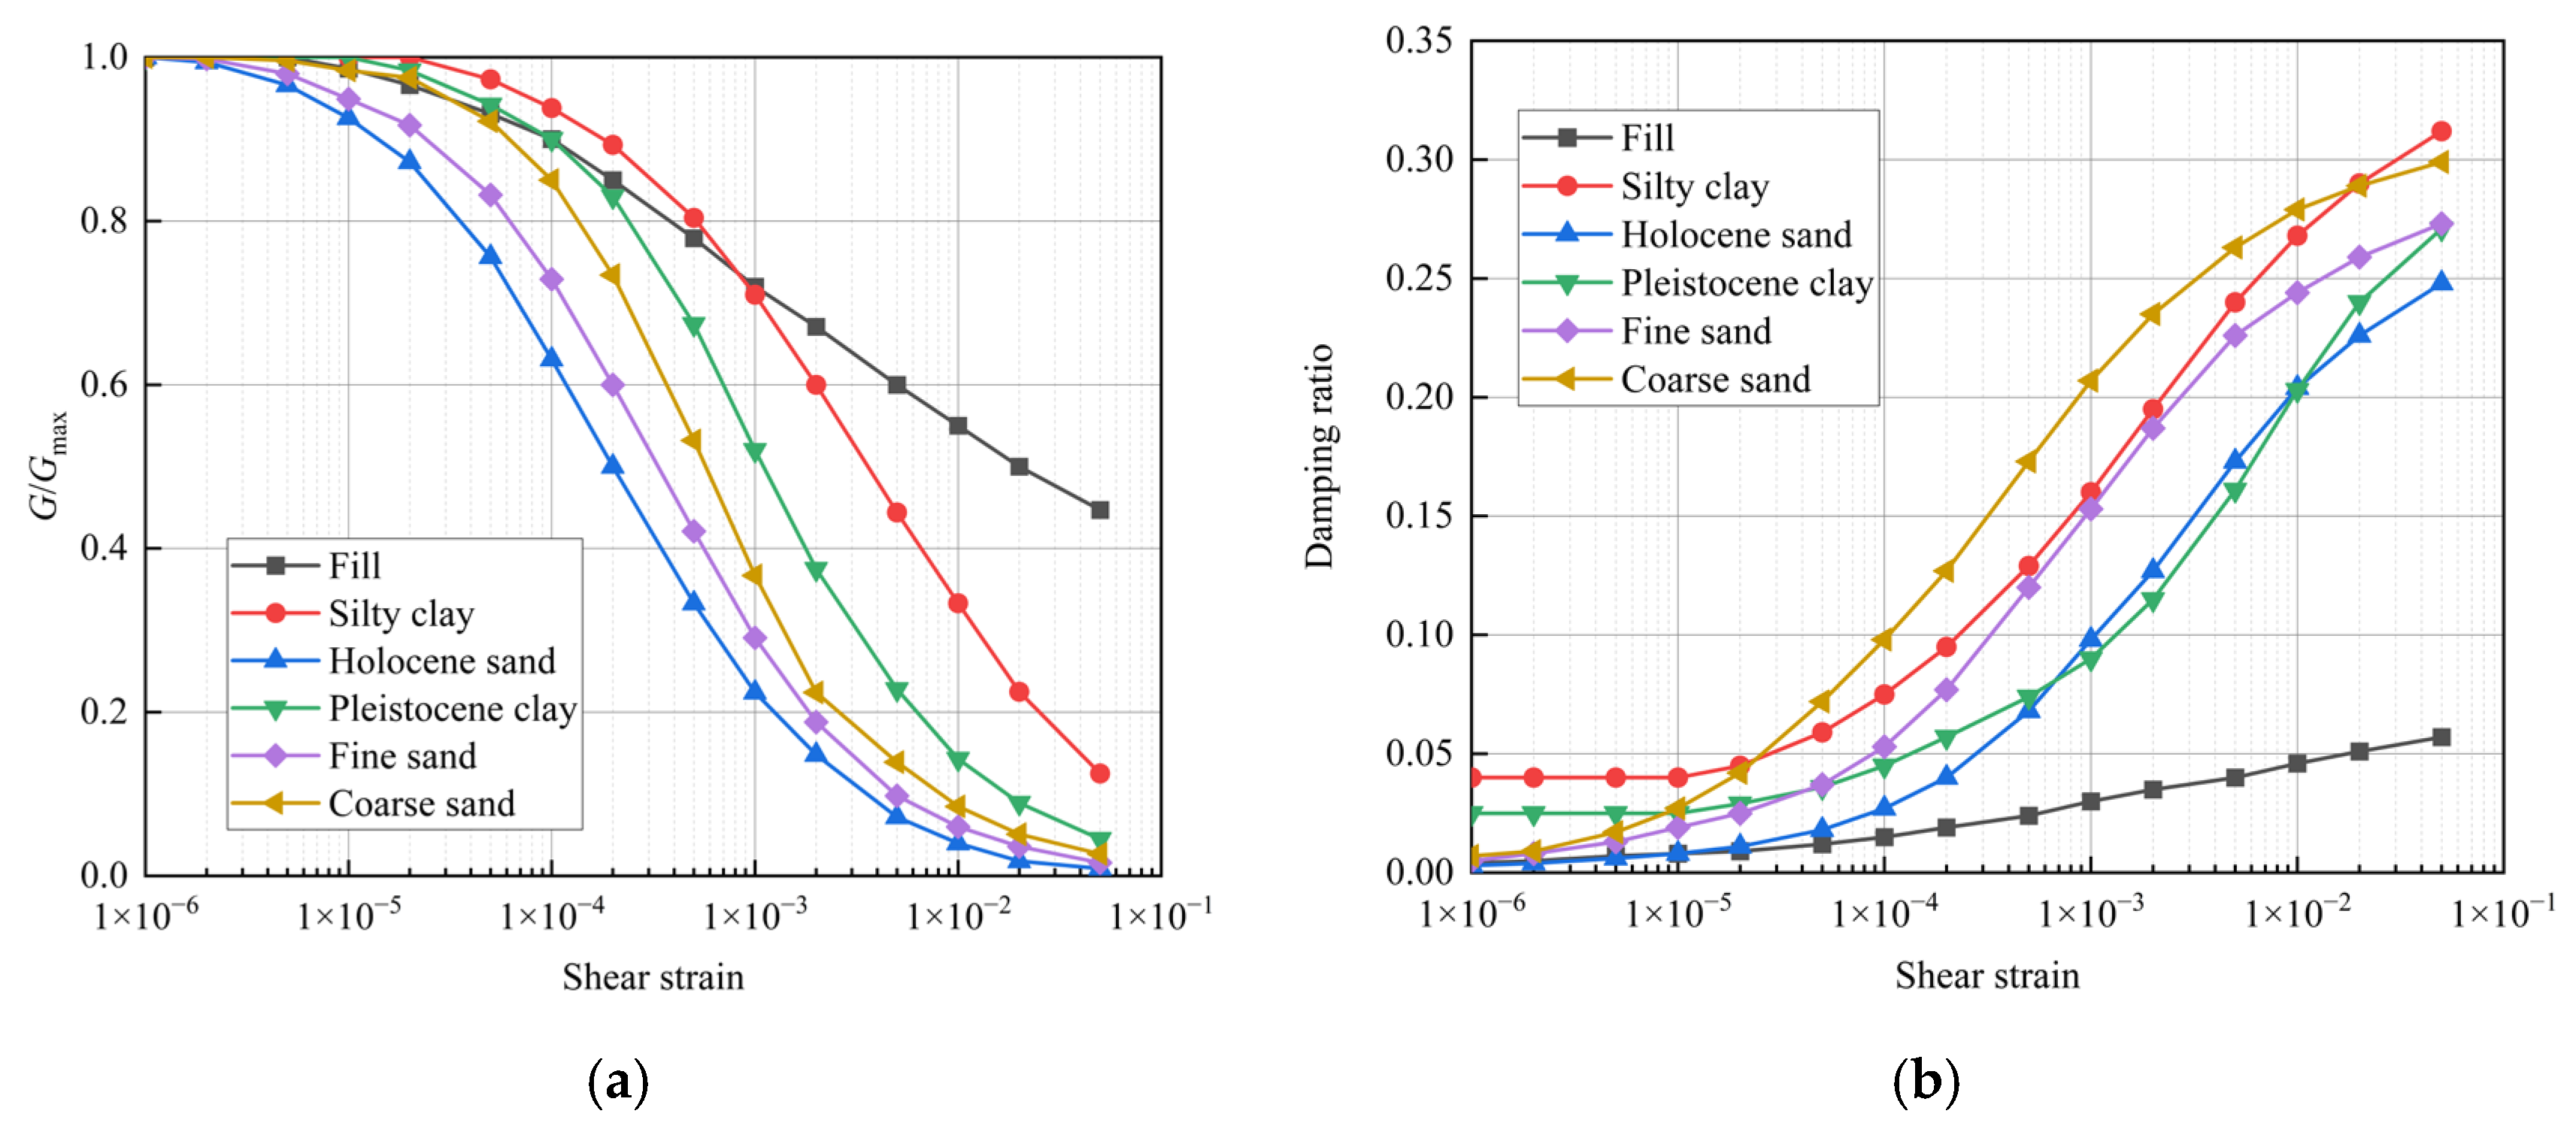
To overcome the aforementioned shortcomings, this study adopts a method that combines the equivalent linearized constitutive model with the Mohr–Coulomb yield criterion [
44]. The relationship between the shear modulus
G/
Gmax, the damping ratio of soil, and shear strain is shown in
Figure 7.
In this investigation, the energy dissipation mechanism of soil is characterized through a dual-mechanism damping model, which incorporates two distinct components: (1) hysteretic damping derived from the soil constitutive model, representing the energy loss due to material nonlinearity, and (2) frequency-dependent viscous damping, accounting for the rate-sensitive energy dissipation characteristics [
45]. The viscous damping component is formulated using the Rayleigh damping model, whose characteristic parameters can be quantitatively determined through Equation (13):
where
ωi and
ωj represent the
i-th and
j-th natural frequencies, respectively. When selecting two natural frequencies, the frequency range of key concern in the structural analysis should be encompassed. The determination of this frequency band should be comprehensively considered based on factors such as the dynamic behavior of the structure and external loads.
3.4. Structural Damage Assessment Analysis
In accordance with the IDA methodology, this study systematically examined and compared the damage progression patterns exhibited by prefabricated subway station structures under three distinct PGA levels of the seismic motion listed in
Table 6. The selected PGA levels are 0.1 g, 0.6 g, and 1.2 g. As illustrated in
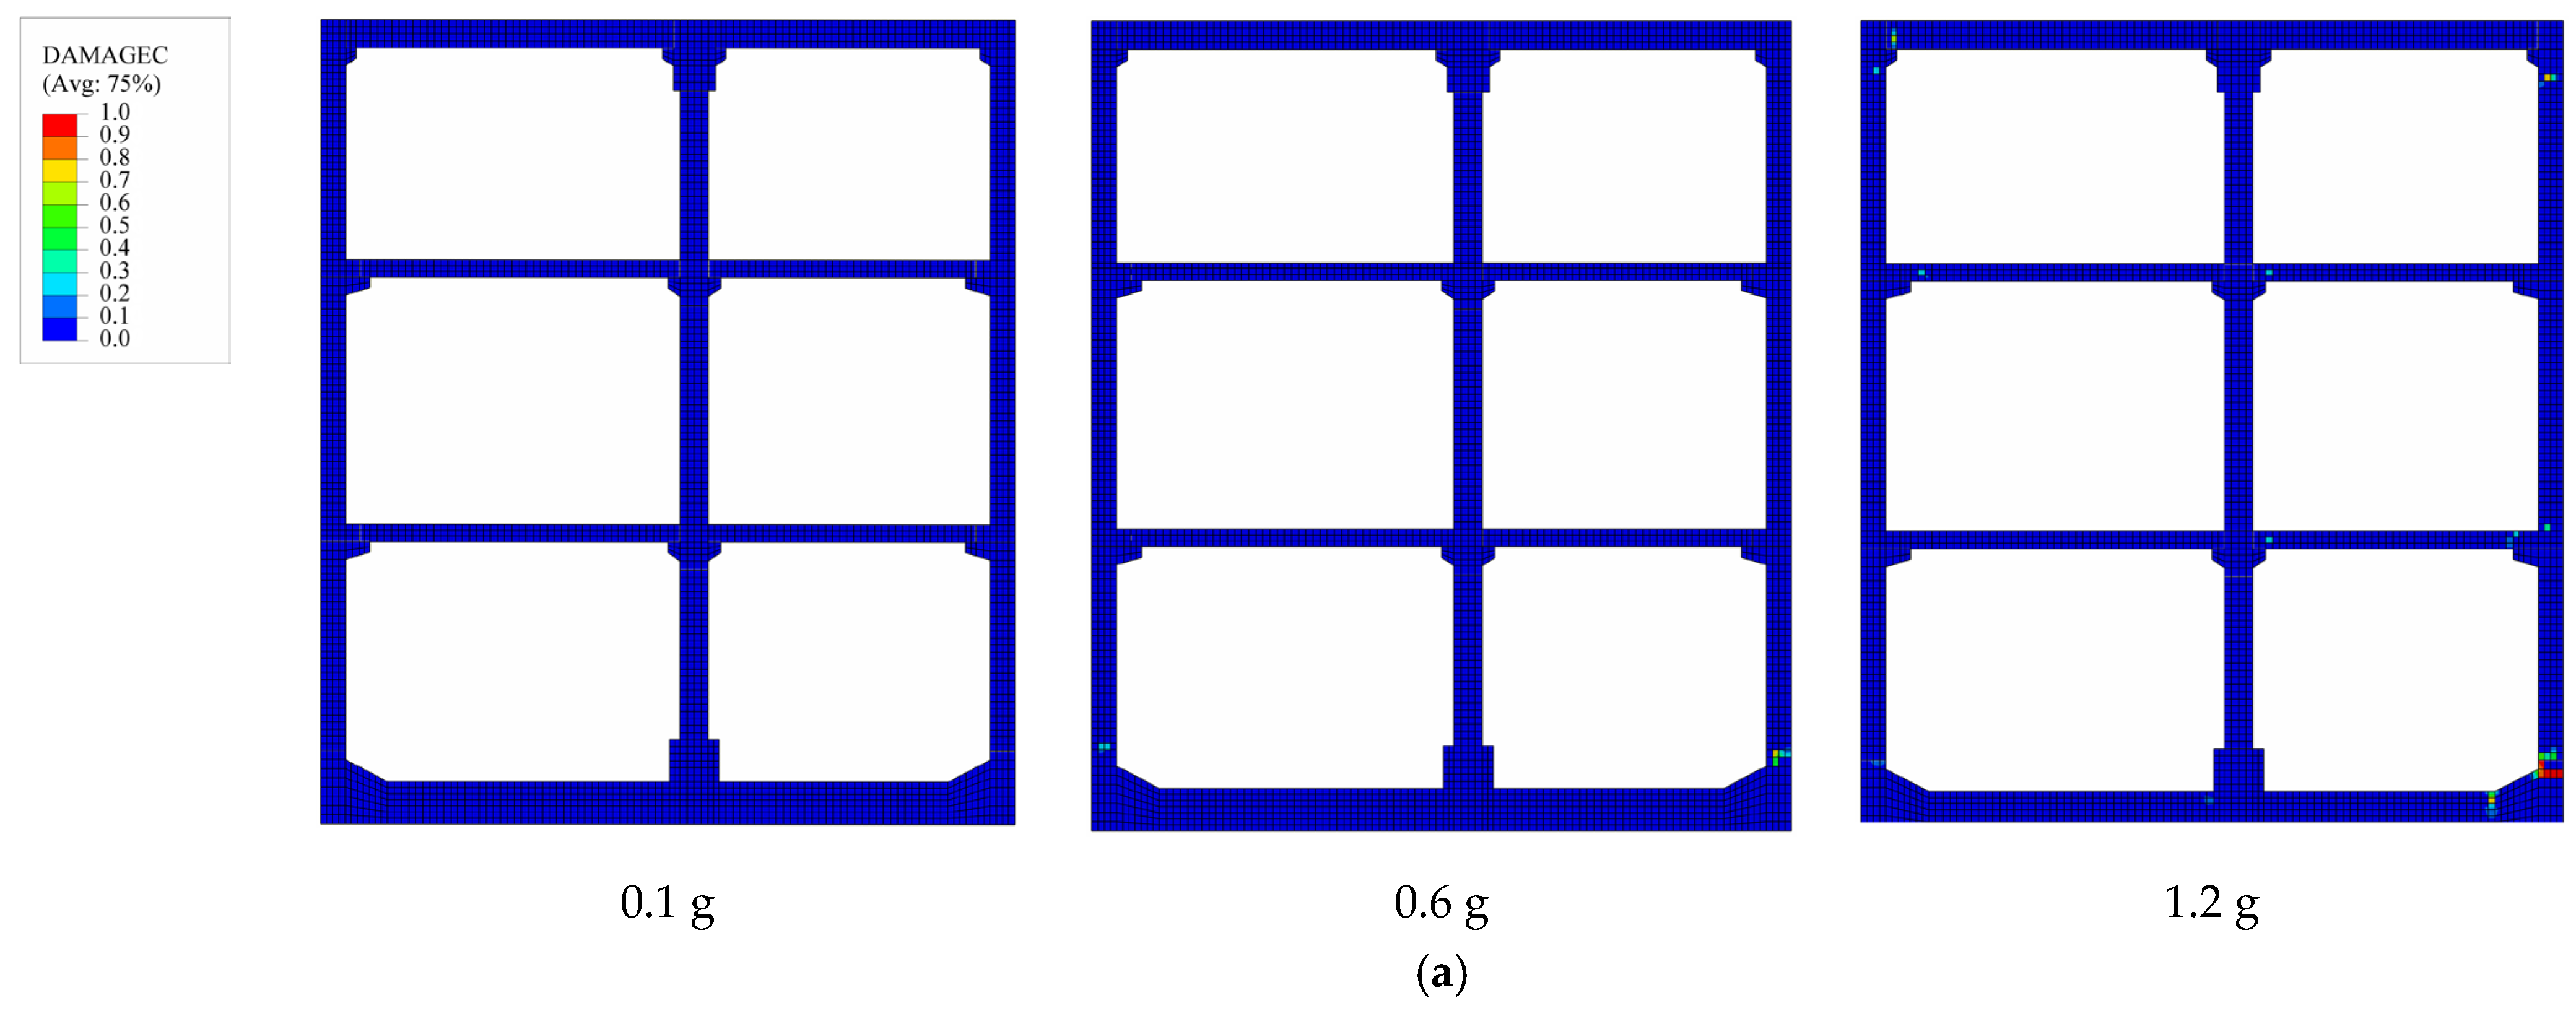
Figure 9, the damage characteristics of prefabricated subway stations with different burial depths are compared under varying PGA levels, using ground motion No. 14 from
Table 6 as a representative example. Here, DAMAGEC represents the compressive damage coefficient of concrete. The magnitude of the DAMAGEC parameter is directly proportional to the extent of compressive damage sustained by the structure. DAMAGEC close to 1 signifies the complete degradation of concrete integrity, resulting in loss of load-bearing capacity and structural failure. DAMAGEC close to 0 indicates that structural components remain below the compressive strength threshold of the concrete, maintaining substantial load-bearing capacity.
As demonstrated in
Figure 9, prefabricated subway stations at various burial depths show no compressive damage at relatively low PGA levels. This suggests that under seismic conditions with PGA = 0.1 g, the induced stresses in concrete do not exceed the compressive strength threshold, ensuring structural integrity and sufficient load-bearing capacity. As the burial depth increases to 9 m, the DM marginally increases from 0.21% to 0.24%. However, at the maximum investigated depth of 15 m, the DM shows a slight reduction to 0.22%. As the PGA increases, the structure exhibits certain compressive damage. When PGA = 0.6 g, prefabricated subway stations exhibit varying levels of compressive damage depending on their burial depths. The prefabricated subway station with a shallower burial depth exhibits localized damage at the connection interface of the right-side wall base, with damage coefficients ranging from 0.16 to 0.32. Other structural components remain intact without observable damage. The degree of damage in subway station becomes more marked, manifesting at multiple locations with the increase in buried depth.
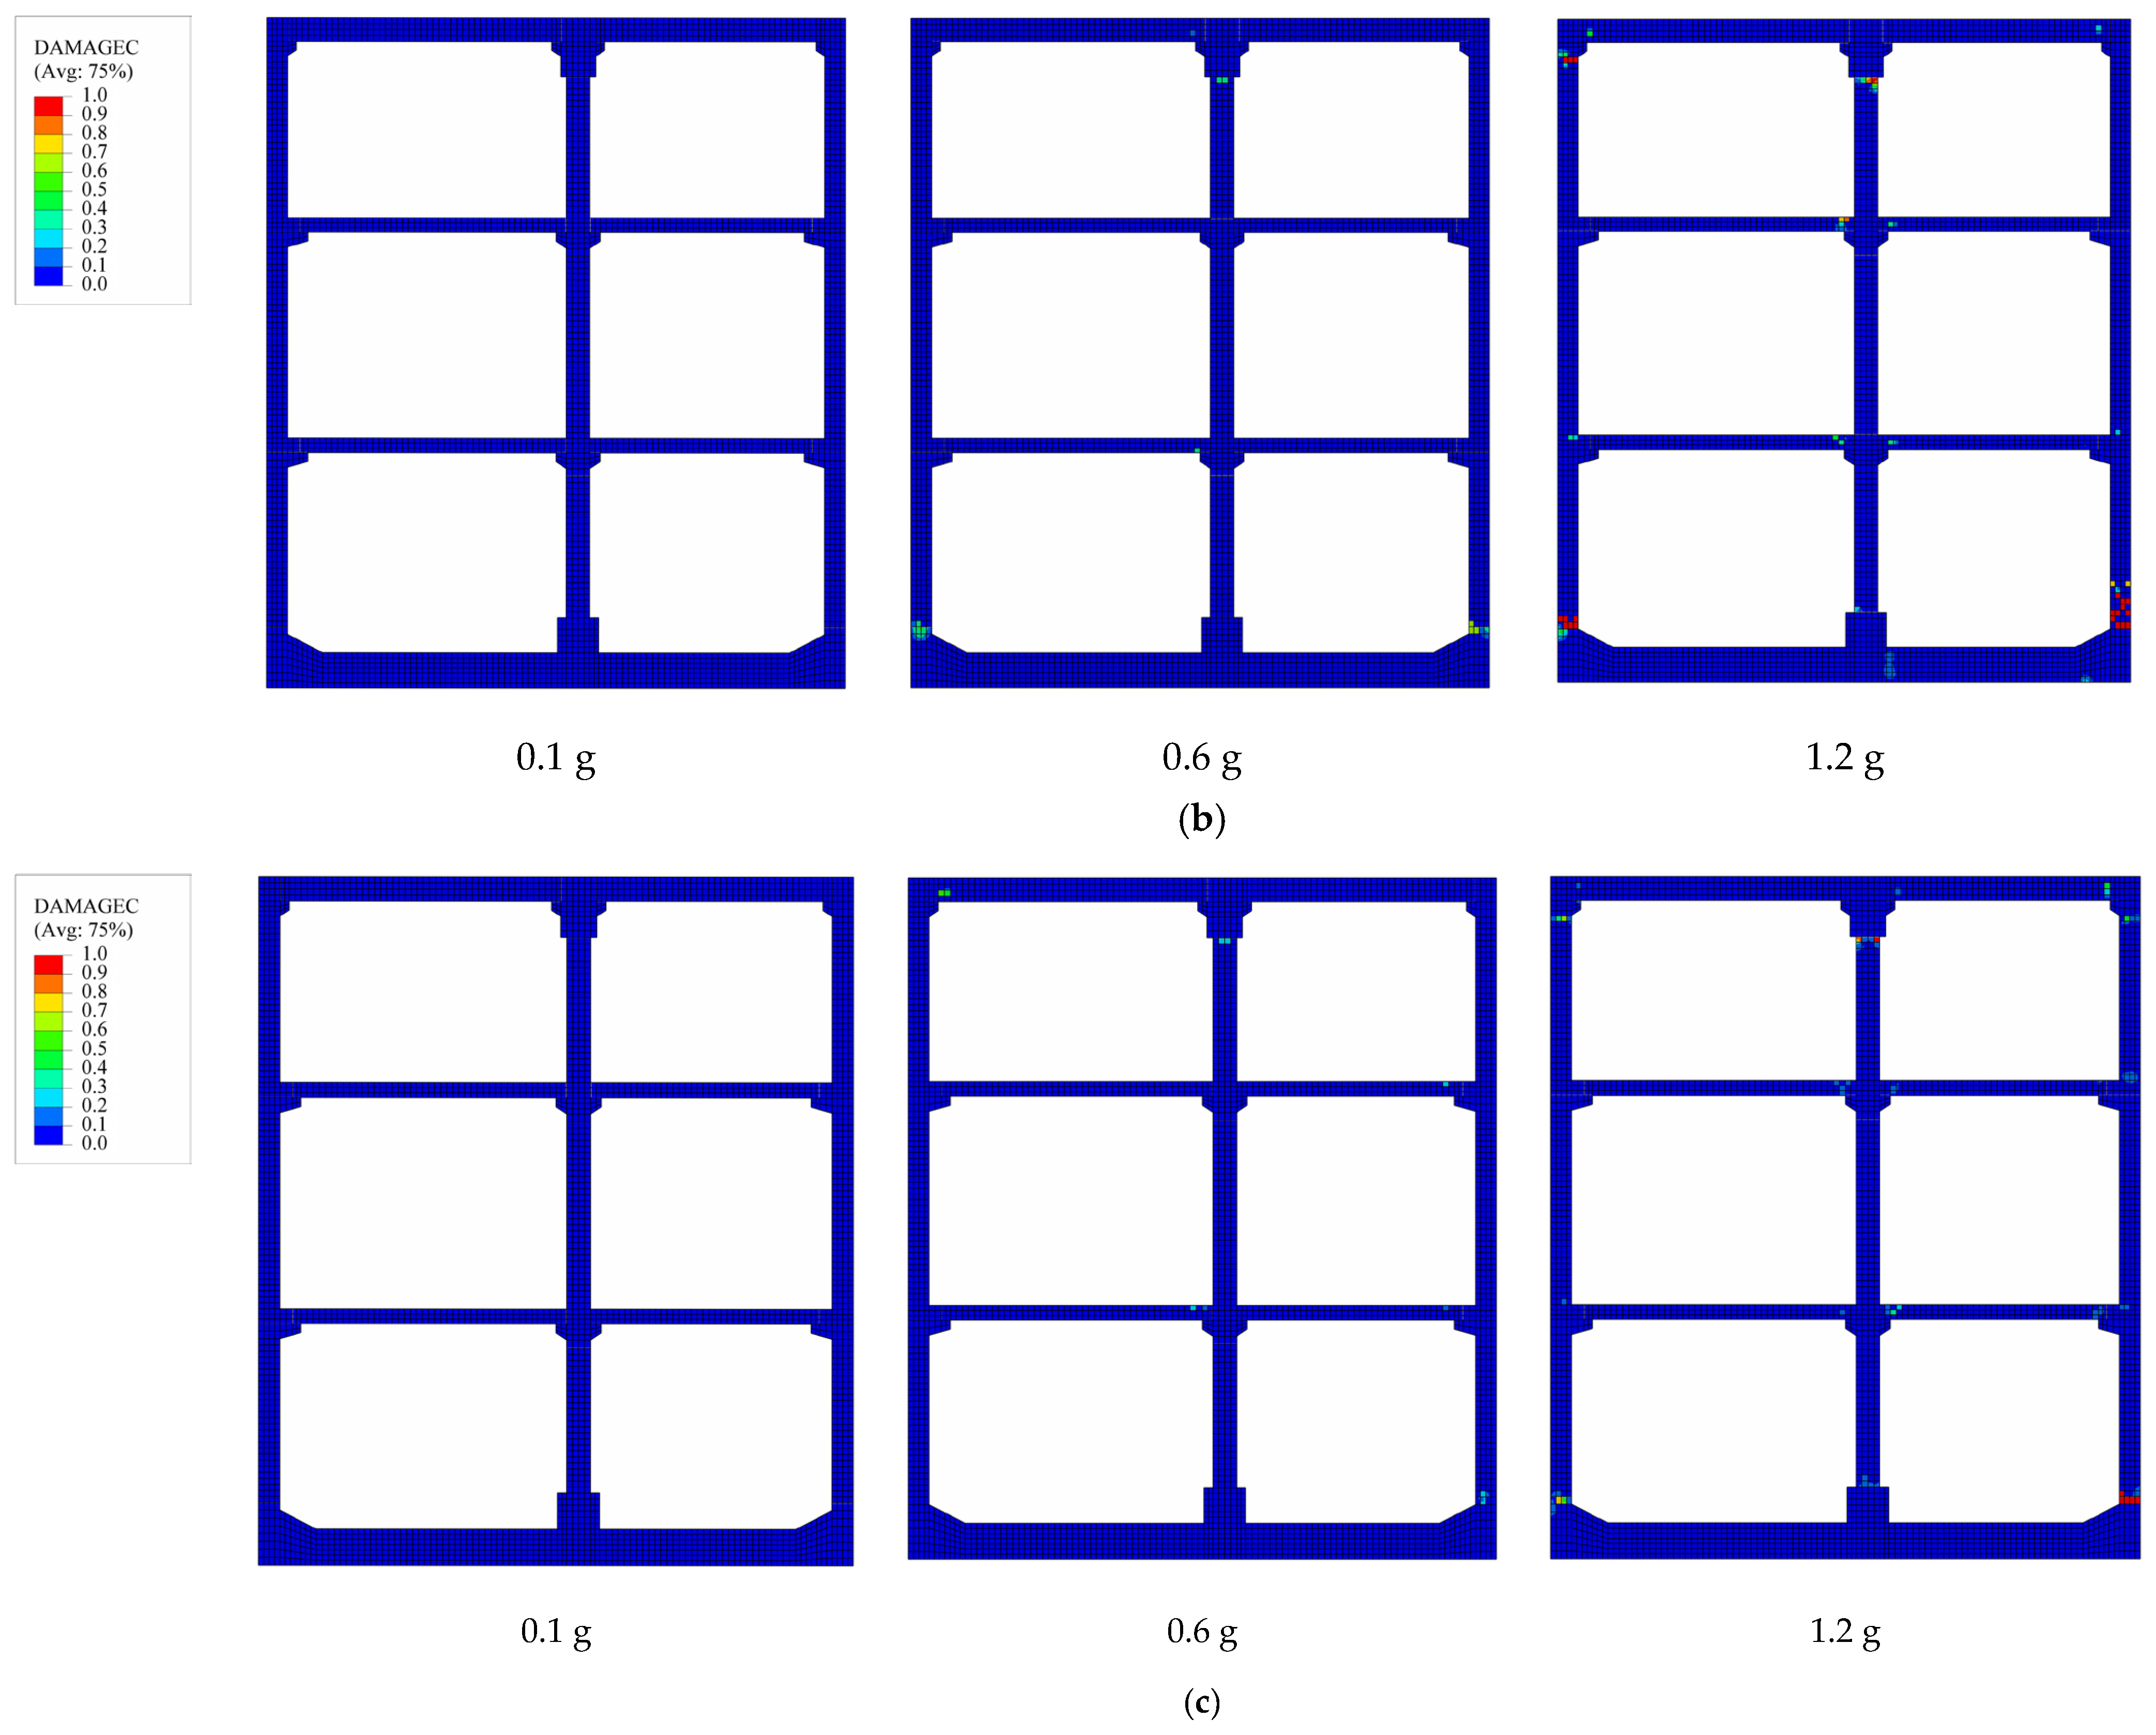
Figure 9b illustrates that for the station with a 9 m burial depth, concrete damage occurs not only at the base of the right-side wall but also in the connection zone between the left floor and the side wall at the apex. The maximum damage coefficient reaches 0.63, accompanied by an increase in the DM from 1.04% to 1.37%. At the maximum investigated burial depth of 15 m, compressive damage is observed at various locations, including the base of the right-side wall and the interface between the top floor middle column and its corbel, with damage coefficients ranging from 0.32 to 0.60. Notably, the DM shows a slight reduction to 1.21% compared to the intermediate burial depth.
When the PGA of the seismic excitation continues to increase, the severity of structural damage also intensifies. As shown in
Figure 9a, when the PGA increases from 0.6 g to 1.2 g at a burial depth of 3 m, significant damage occurs at the base of the right-hand side wall, with the damage coefficient reaching 0.91 and the DM reaching 2.68%. The DM demonstrates a positive correlation with burial depth, exhibiting a progressive increase up to 3.89% as the depth extends. However, an interesting deviation from this trend is observed at the burial depth of 15 m, where the DM exhibits a slight reduction to 3.40%. To sum up, under the condition of the same burial depth, the compressive damage to the structure intensifies as the PGA increases. When the burial depth increases, the damaged locations become scattered, and the DM first increases and then decreases. Therefore, the thickness of the overlying soil layer significantly influences the extent of damage to the prefabricated subway station.
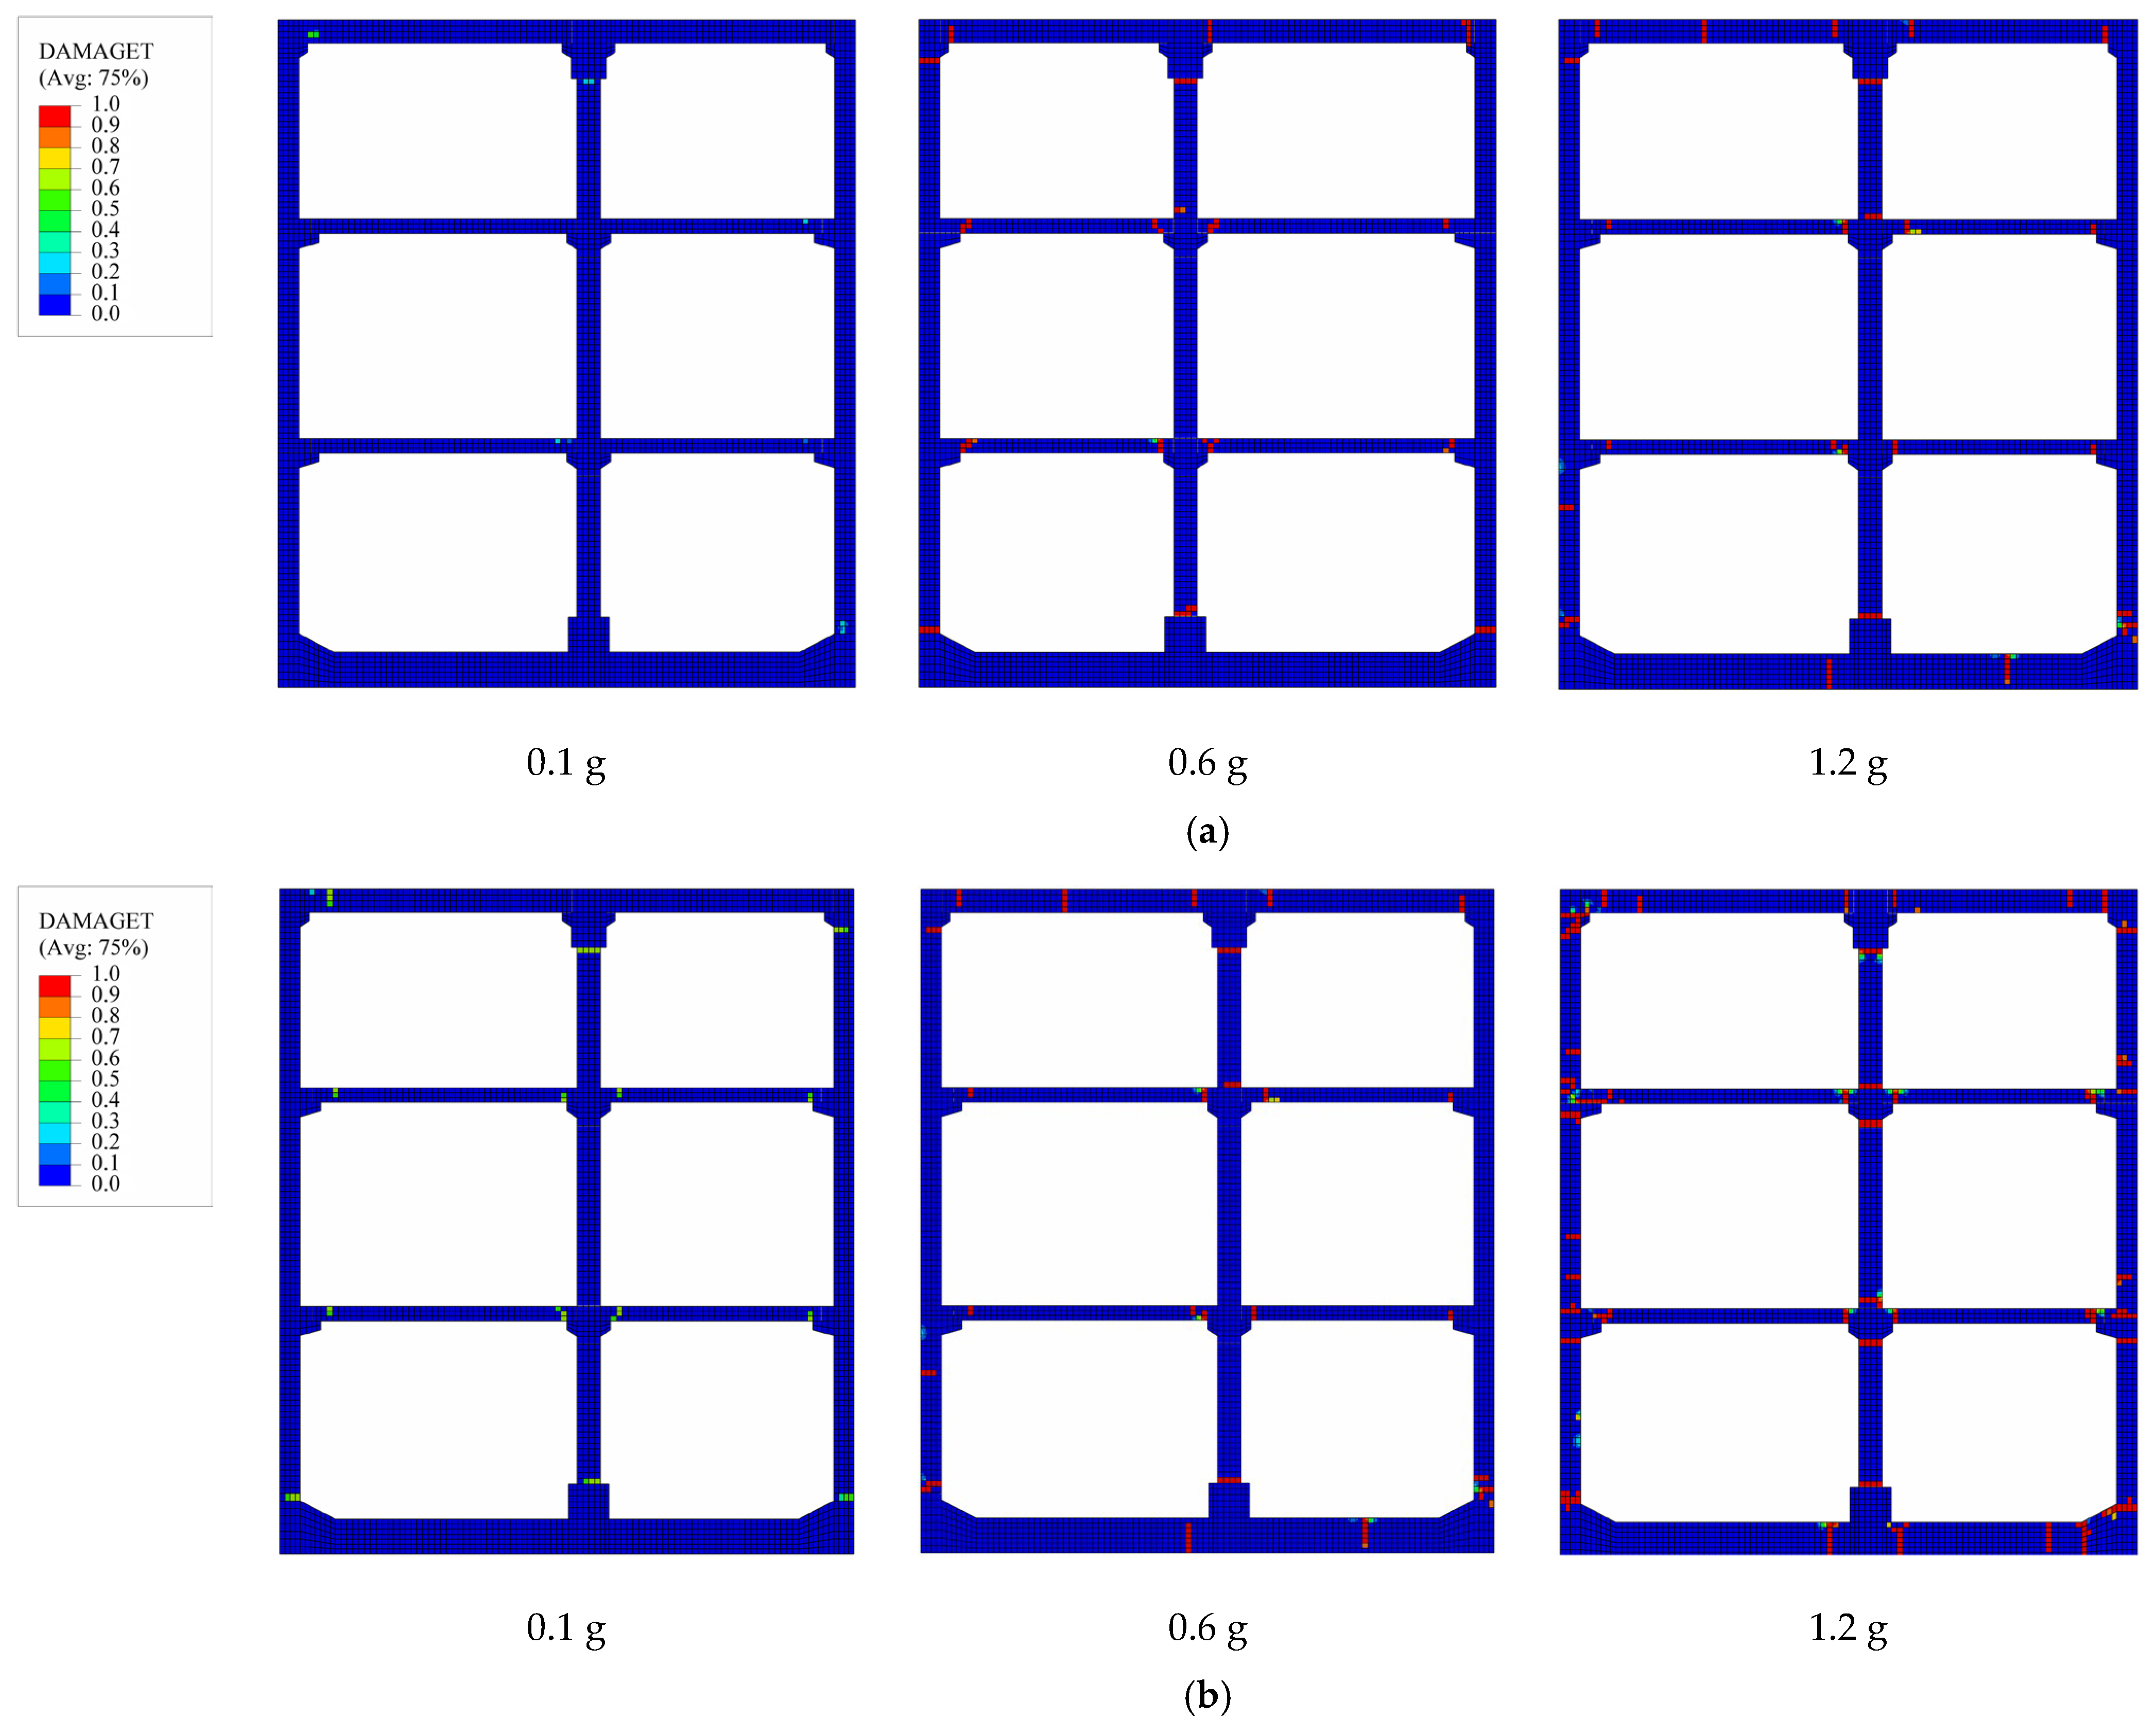
Figure 10 shows the tensile damage of prefabricated subway stations with varying burial depths under the different PGA levels of the No. 14 seismic from
Table 6. In this context, DAMAGET denotes the tensile damage coefficient of concrete, where values approaching unity indicate more severe tensile damage in the structure.
As depicted in
Figure 10, under low PGA conditions, the shallow-buried prefabricated subway station exhibits no tensile damage. A strong positive correlation exists between burial depth and damage severity, with damage significantly increasing as burial depth increases. At a burial depth of 9 m, slight tensile damage appears at the connection points of various components. When the burial depth increases to 15 m, the extent and severity of damage decrease.
With the escalation of PGA, prefabricated subway stations exhibit varying degrees of tensile damage, which is significantly influenced by their burial depths. At a PGA of 0.6 g, the tensile damage in shallow-buried stations is predominantly localized at critical structural junctions. Furthermore, minor tensile damage is also observed at the bottom-plate area. In contrast, medium-buried stations demonstrate a broader distribution and increased severity of tensile damage. Deep-buried stations, however, show relatively less damage compared to their medium-buried counterparts. Consequently, the medium-buried prefabricated subway stations are identified as the most susceptible to tensile damage under the examined burial conditions. As the PGA increases, prefabricated subway stations exhibit varying degrees of tensile damage, which is significantly influenced by their burial depths. When PGA = 1.2 g, the overall structure of prefabricated subway stations with different burial depths shows extensive damage. Significant structural damage is predominantly observed at the interfacial regions of all components. However, as illustrated in the figure, the medium-buried prefabricated subway station exhibits the most extensive and severe damage in terms of both affected area and intensity compared to other burial depths.
In summary, the overall failure mechanism of prefabricated subway stations under seismic is mainly characterized by the damage at the connection points of various components. The damage to the joints is not caused by compressive damage, but is mainly determined by tensile damage. Meanwhile, the buried depth of prefabricated subway stations significantly affects structural damage. The analysis of damage evolution patterns reveals a consistent nonlinear relationship across varying PGA levels: both compressive and tensile damage demonstrate an initial increase followed by subsequent decrease. The main reason is the influence of soil layer constraints and seismic wave propagation. Furthermore, under intense seismic loading, the initial failure predominantly occurs at the interface between the side wall and the bottom slab, with subsequent damage manifesting at the junction of the side wall and the top slab. Consequently, these critical regions necessitate robust seismic reinforcement measures in structural design. These findings align closely with the empirical observations reported by Xu et al. [
30], thereby corroborating the consistency of the results.


