1. Introduction
Acute hemorrhagic fever is caused by the Marburg virus, which is highly contagious and has an escalating death rate ranging from
to
. According to WHO [
1], this virus is transmitted from bats to humans [
2,
3,
4] and also spreads through secretions and materials that are contaminated. Once a person is infected, symptoms appear between 5 and 10 days, and incubation lasts from 2 to 21 days [
5]. This virus belongs to the filoviridae family alongside the Ebola virus [
6]. The virus has been proven to have originated in Africa, including countries such as Uganda, the Democratic Republic of Congo, Kenya, and many more, with many more outbreaks occurring afterward [
7,
8,
9,
10], and there has been a recent Marburg outbreak in Rwanda [
11]. The rapid increase in the mortality rate due to the spread of the Marburg virus demands a stronger and more effective control strategy. Ref. [
12] supported this by stating that the need to understand how social behavior transfer alters infectious disease spread patterns. Despite managing to contain past MVD outbreaks, there is no denying that there is a need to find new and efficient strategies to prepare for the inevitable future outbreaks if public health measures are unable to assist. The containment of past outbreaks has also shown that vaccination is not a necessary factor to keep the virus under control [
13]. However, the MVD virus, along with other contagious illnesses like the Ebola virus, is of considerable concern due to the damage such illnesses have the potential to cause if they were to surface in the future. Certain scenarios arise where precautionary measures like vaccination and treatment are not readily accessible, and that is where the issue surfaces.
Mathematical models broaden the spectra, since they allow researchers and decision-makers to determine the best course of action to stop the infection from spreading further [
14,
15,
16]. These models offer assistance in tackling the issue at both the domestic and international levels in a more robust way. However, it is also important to note that there are multiple methods available to combat the infection. However, mathematical modeling is perfect from a logical standpoint and ensures that the issue is not only fixed but also fixed in a timely and coherent manner [
17]. In recent years, researchers have made significant progress in the mathematical modeling of the Marburg virus dynamics to address the MVD prevalence [
18,
19]. While previous models have explored Marburg virus transmission, they often consider only human or bat populations separately, overlook vaccine efficacy and treatment failure, or rely on computationally intensive numerical methods [
18,
19,
20,
21,
22]. To address these gaps, we propose a novel epidemiological model integrating vaccination and treatment dynamics, explicitly accounting for their effectiveness. Additionally, we optimize a deep neural network (DNN) to enhance predictive accuracy and computational efficiency, providing a robust AI-driven alternative for disease modeling and control. Simulating large-scale outbreak models with intricate transmission dynamics is challenging when standard numerical methods are used, as these rely on known parameter data. A key challenge in epidemiology is designing deep learning frameworks that predict disease dynamics through parameter estimation in highly non-linear mathematical models. Deep Neural Networks (DNNs) [
23] are effective at modeling complex non-linear systems, bridging input–output relationships [
24], and forecasting infectious disease behaviors [
25,
26,
27].
Traditional methods, like Runge–Kutta and finite element analysis, face limitations in scalability and computational efficiency, especially for large-scale or real-time simulations [
28]. DNNs overcome these limitations by capturing non-linear connections, such as incidence and recovery rates, population movements, and spatial or temporal heterogeneity [
29]. They predict outbreaks using historical data, aiding public health planning [
30] and providing accurate infection rate predictions, which are essential for emerging diseases [
31]. Recent advancements in artificial intelligence (AI) and deep learning have significantly enhanced the modeling and prediction of infectious disease dynamics [
26,
32]. AI-driven models, particularly deep neural networks (DNNs), are being employed to improve disease forecasting, optimize intervention strategies, and assess outbreak risks with high precision [
33,
34]. Novel ensemble feature engineering approaches have enhanced disease detection [
35], while AI-based frameworks now integrate group-informed attention mechanisms for more accurate progression prediction [
36]. Additionally, deep learning has demonstrated its capability to model infectious disease epidemics, capturing complex transmission patterns that traditional models often overlook [
37]. AI is also transforming epidemic response by facilitating early detection, real-time risk assessment, and automated epidemiological surveillance, offering a transformative approach to public health management. These innovations not only improve parameter estimation in differential equation-based models but also enhance decision-making for controlling disease spread in real-world scenarios [
38]. Reinforcement learning combined with DNNs enables optimal real-time intervention strategies [
39]. Advanced architectures like CNNs and RNNs enhance forecasting of temporal and spatial dynamics in disease transmission [
40], while hybrid models integrate multiple topologies for comprehensive simulations [
41]. For instance, Yang et al. [
42] modified the SEIR model using DNNs to predict COVID-19 trends in China under public health measures. These models facilitate scenario simulation, intervention assessment, and public health program design, improving outbreak management and capturing complex nonlinear dynamics, including bifurcation behaviors [
43,
44]. Deep neural networks (DNNs) that can capture more variance are intrinsically more powerful than deep neural networks capable of capturing lesser variance, driving their success in numerous applications. Both compartmental models are most often expressed as systems of ordinary differential equations, and AI models have excelled at analyzing and predicting dynamic systems. However, each pf these has its shortcomings. To tackle these challenges, many researchers are combining compartmental models with AI, established hybrid models for improved analysis and prediction of systems that are more accurate than previous methods [
45]. Inspired by this literature, our investigation introduces vaccinated humans and humans who are receiving treatment and also considers the non-human class for mathematical modeling of Marburg Virus Disease (MVD) dynamics with vaccine efficacy and treatment failure within this framework and demonstrates its scenario analysis. To the best of our knowledge, no previous research has discussed or investigated Marburg transmission under these specific conditions; doing so will help combat disease outbreaks and, for simulations, leverage optimized deep neural network.
The paper is formatted as follows:
Section 2 lists the detailed class-wise transmission dynamics of the Marburg virus in a human and bat population.
Section 3 contains the reproduction number and the existence of Marburg-free and Marburg equilibrium-free points. Additionally, this section also delves into key characteristics of the model, including the positivity, boundedness, and stability of the system.
Section 5 gives the sensitivity analysis of the reproduction number
and
. The deep learning approach with DNN is illustrated in
Section 4. To validate all the theoretical concepts,
Section 6 presents the numerical simulations carried out by DNN and scenario analysis of the novel parameters. In the last
Section 8, the main findings of this research are summarized and illuminates future work in this direction.
2. Model Formulation
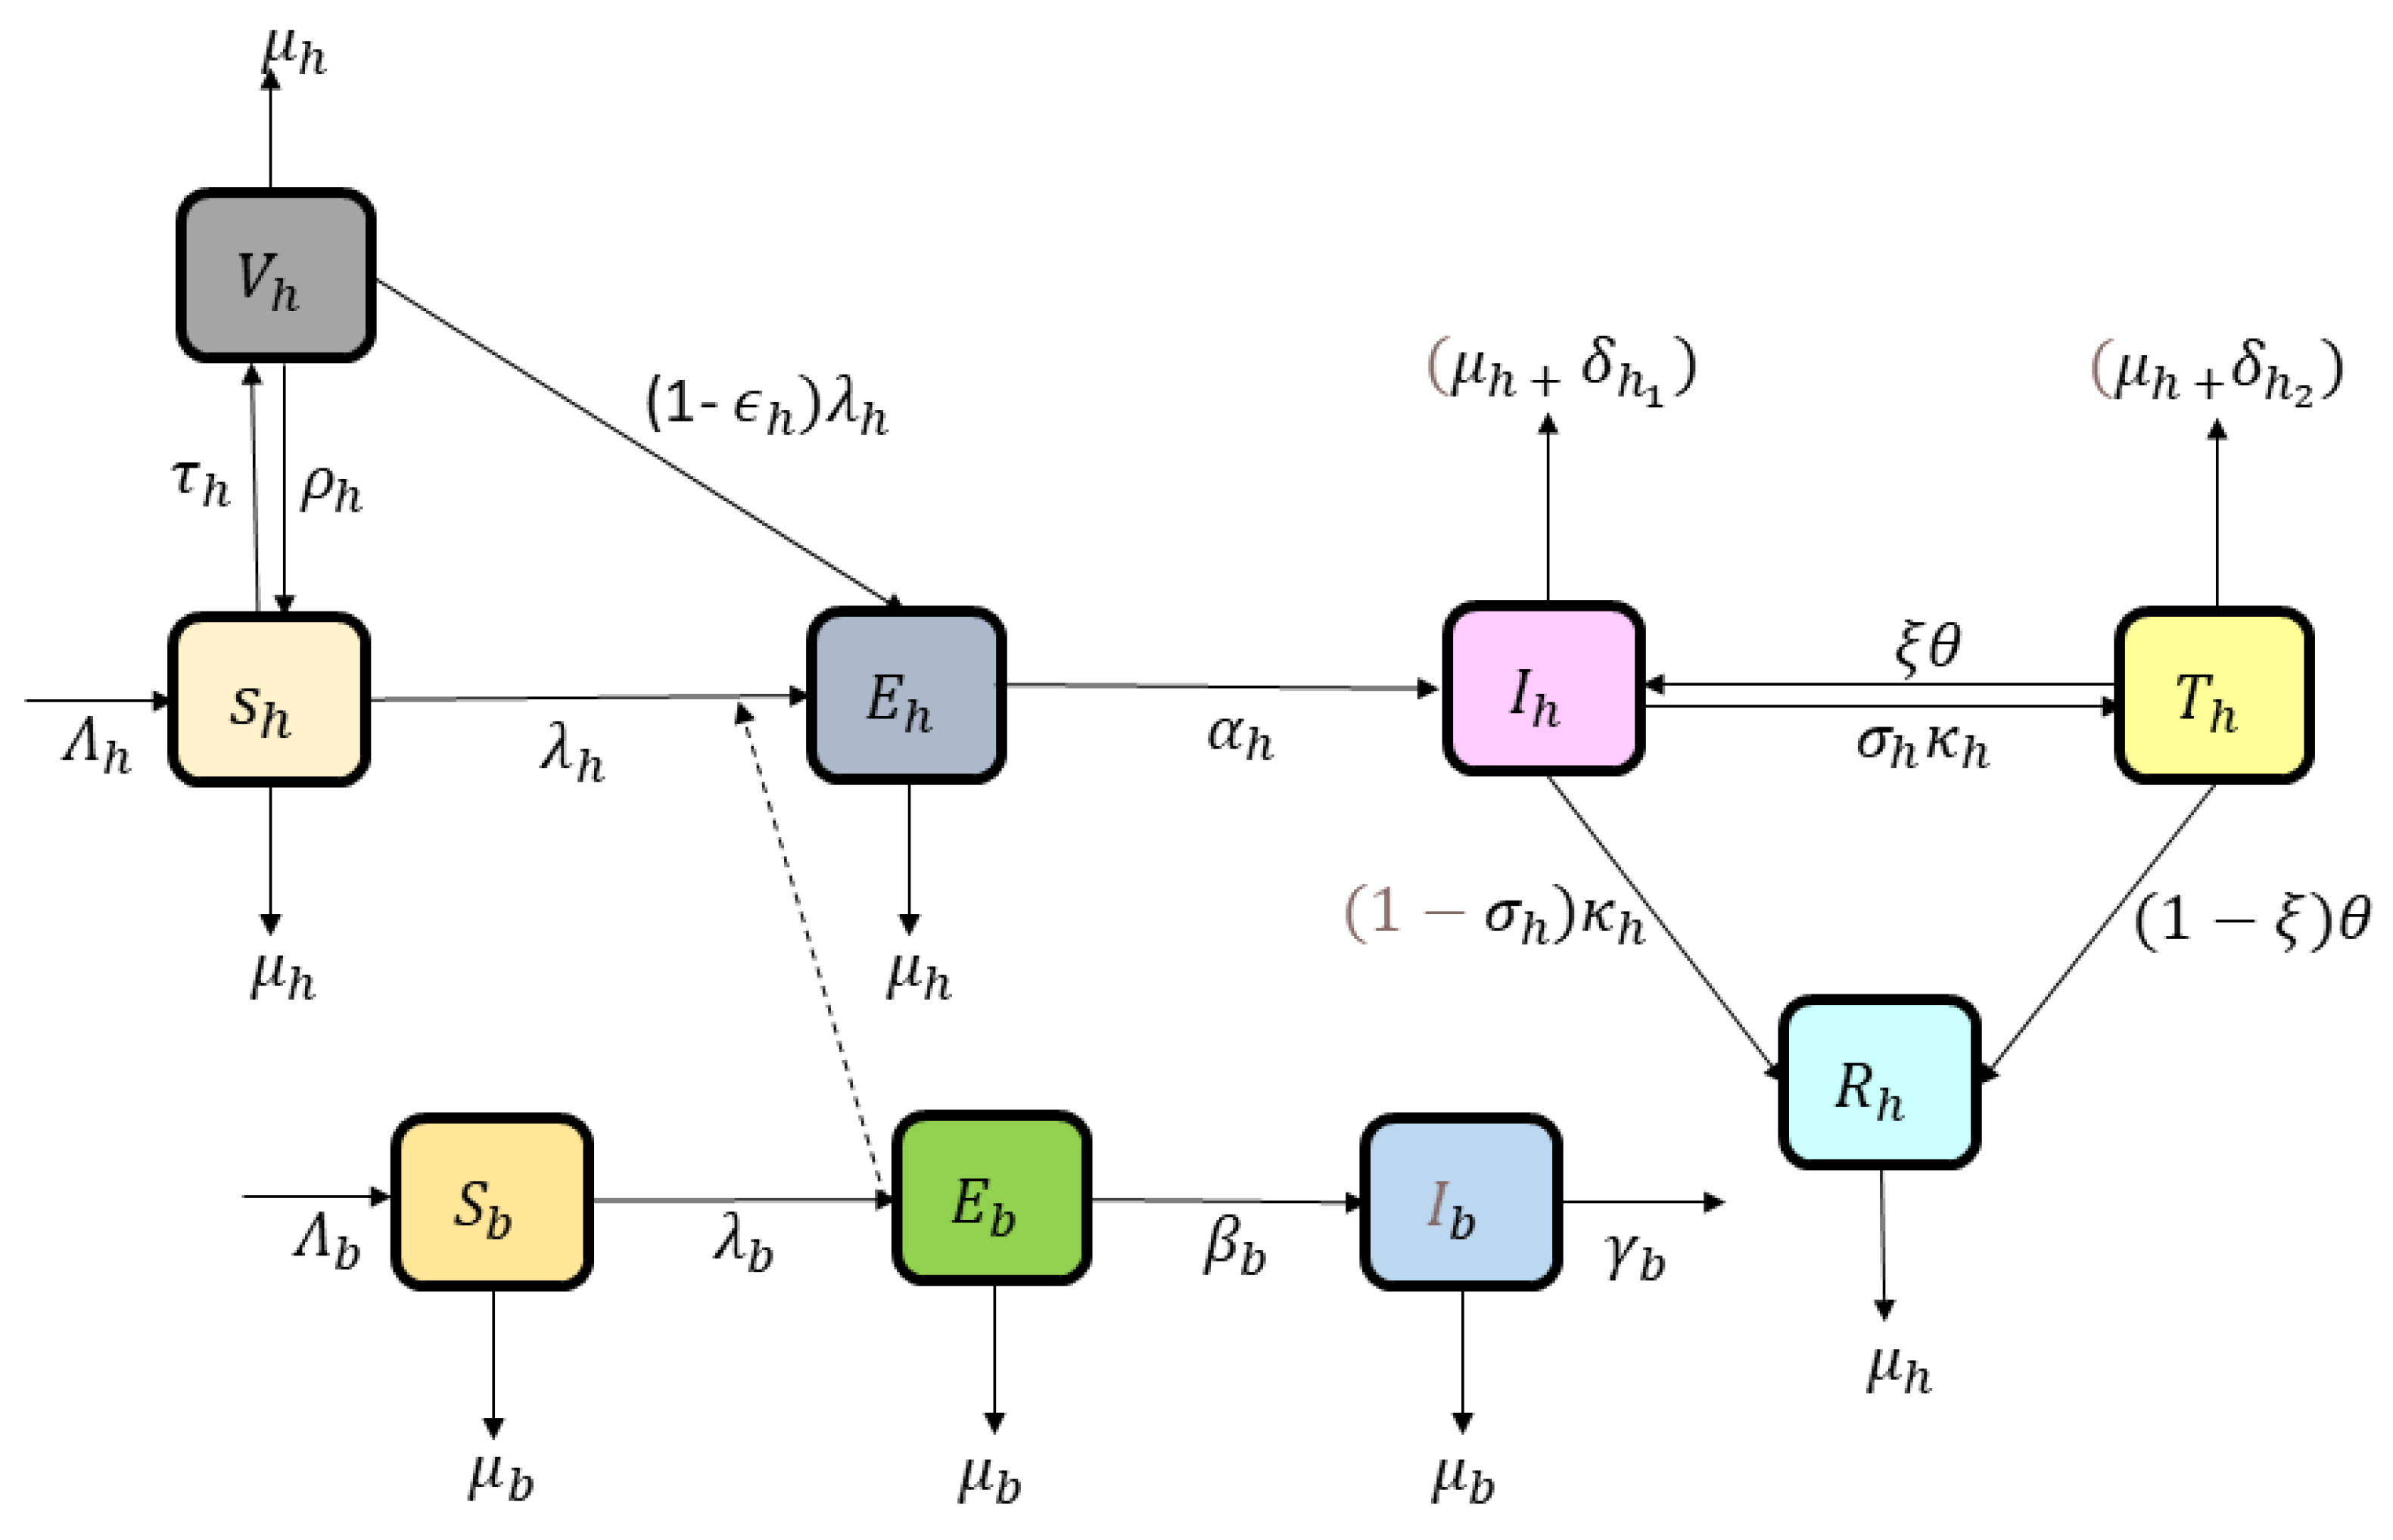
We develop an epidemiological model by incorporating nine compartments describing the dynamics of Marburg virus transmission between human and bat populations. The human population is divided into Marburg susceptible (healthy individuals who can be infected) humans (
), vaccinated individuals who received a vaccine but may still get infected) humans (
), exposed (those who are infected but not yet showing symptoms) (
) humans, infected (people who are actively spreading the virus) (
) humans, under treatment (people who are receiving medical care, and may recover or die) (
) humans, and recovered (people who have overcome the virus and are immune) (
) humans. The bat population is divided into Marburg-susceptible (healthy bats that can get infected)
, exposed (bats that are infected but not yet spreading the virus)
, and infected bats (bats that are actively carrying and spreading the virus)
. The total human population is represented by
and bats by
. The description and values of the model’s parameter are given in
Table 1. The schematic depiction of the presented model is shown in
Figure 1.
Susceptible humans
enter the population through recruitment rate
and vaccination of vaccinated individuals
. This population transitions out of the compartment by natural death rate
, the force of infection term
, or waning of vaccination
. Vaccinated humans
arise from the vaccination waning of susceptible individuals and vaccination rate
or become infected at a reduced rate due to partial vaccine protection
. Vaccinated humans have some protection, but they can still get infected (at a lower rate). Exposed humans
are infected but not yet infectious; they transition to the infected state
at a rate
or leave this category due to natural death. Infected individuals may recover naturally, die, or receive treatment. Infected humans
are recruited from the progression of exposed individuals and also by the under-treatment population with rate
in case of treatment failure. They can either be treated
or recover naturally, with some transitioning into the category
or recovering without treatment to
, and this population also reduces due to natural and disease-related death. Under-treatment humans
may recover with the rate
or die due to the disease by
, while numbers of recovered humans
are only reduced by natural death. The dynamics of bat class is formulated as susceptible vectors are recruited into the population by rate
and may become exposed after contact with infected individuals by rate
. Exposed bats progress to the infected state at a rate
, where they can transmit the infection to humans but remain infected until they die by the rate
. The force of Marburg infection for humans
is given in (
1)
and it incorporates contributions from infected bats
and infected humans
or treated individuals
, scaled by the respective transmission rates from bat-to-human
, human-to-human
and normalized by the total population sizes of bats
and humans
. This equation tells us how humans become infected, either from bats
or other humans
. Similarly, the force of infection for bats class
depends on the prevalence of infected vectors and the transmission rate
and given by (
Section 2).
This equation tells us how bats get infected by other infected bats
. This model captures the complex interactions between human and vector populations, accounting for disease progression, vaccination, treatment, and recovery dynamics. It provides a framework for analyzing disease spread and assessing control strategies.
The non-linear differential equations of the proposed model are given by system (
3),
Model Parameters
The parameters in our model describe the biological, epidemiological, and intervention dynamics of MVD. Whenever possible, parameter values were sourced from published studies on MVD and similar filoviruses (e.g., Ebola virus) or from WHO reports and prior mathematical models [
6]. The sources of the parameters values are given in
Table 1. Parameters related to transmission rates, progression rates, and natural death rates were derived from recent epidemiological studies [
20,
46], while others were estimated based on biological plausibility and model calibration to real-world outbreak [
47]. Several parameters, such as the natural death rates (
), bat–human contact rates (
), and disease-induced mortality rates (
), were obtained from previous mathematical models and WHO data [
20,
46]. Some parameters, such as the treatment failure rate (
) and recovery rates (
), were estimated based on prior studies on viral hemorrhagic fevers and expert judgment. These estimates were validated through satisfying reproduction numbers for human and bat class sensitivity analysis, confirming their influence on model dynamics. Parameters like vaccination efficacy (
) and the waning rate of immunity (
) were assumed within a realistic biological range, since no specific data for Marburg virus exists, as vaccination efficacy for this virus can be in a range of 0–1. These assumptions align with past studies on related viruses like Ebola and the ranges given by the researchers in the articles on MVD. By including these additional details, we ensure transparency in our model’s assumptions and provide a solid epidemiological basis for our parameter choices. Future studies featuring real-time outbreak data can refine these estimates further to improve model accuracy.
5. Sensitivity Analysis
We conducted a sensitivity analysis to examine how different parameters influence the model (
3). This analysis employed the Partial Rank Correlation Coefficient (PRCC) method to assess the sensitivity of the parameters, with the reproduction number serving as the response function. PRCC values, which range from −1 to 1, measure both the strength and direction of the relationship between each parameter and the reproduction number. Values near 1 or −1 indicate a strong correlation, while values close to zero suggest minimal impact. A positive PRCC value signifies that increasing the parameter tends to raise
and
, whereas a negative value indicates that an increase in the parameter leads to a decrease in
and
.
Figure 4 highlights these relationships using the reproduction number for the human population as the response variable.
The analysis identifies the human contact rate as the most influential parameter, with a PRCC value close to 0.95, indicating a strong positive impact on . This suggests that as the rate of human contact increases, rises significantly, highlighting the critical role of minimizing human-to-human transmission to control the MVD spread. Other contact rates, such as the bat-to-human contact rate , also have a positive PRCC value, though the influence of this specific contact rate is less pronounced than . In contrast, the bat-to-bat contact rate shows a slight negative PRCC value, suggesting a moderating effect on human infection rates, as increased bat interactions may reduce the likelihood of human infection indirectly by isolating the infection within the bat population.
The progression rate from to class is , with a PRCC value of approximately 0.2, which has a moderate positive influence on . This result indicates that faster progression from exposure to infection increases , since individuals become infectious more quickly. On the other hand, the death rate exhibits a moderate negative PRCC value of around −0.15. This implies that as mortality among infected humans increases, decreases, which could be due to the quicker removal of infectious individuals from the population, which limits disease transmission.
Vaccination-related parameters also play a significant role. The vaccination rate has a positive PRCC value, indicating that as vaccination uptake increases, the effective transmission rate among susceptible humans reduces. However, the waning rate of immunity has a small negative PRCC value, suggesting that faster immunity loss slightly increases by allowing previously vaccinated individuals to become susceptible again. Vaccination efficacy , with a moderate negative PRCC value, implies that higher efficacy directly reduces , as fewer vaccinated individuals can transmit the infection.
Other factors, such as the fraction of individuals under treatment and the treatment failure rate , influence disease dynamics in human populations. The fraction under treatment has a moderate positive PRCC value, implying that an increased number of treated individuals might enhance the potential for ongoing transmission if treatment does not lead to full recovery. In contrast, treatment failure , with a high positive PRCC, indicates that higher rates of treatment failure increase by ensuring that more individuals remain in the infectious stage.
Recruitment and natural death rates for both human and bat populations exhibit minimal influence on , with PRCC values close to zero. These parameters, including human recruitment and bat recruitment , have low PRCC values, indicating limited direct impact on disease transmission within the context of the model.
The movement rate from the treatment class
and the movement rate from the infected class
each exhibit low PRCC values, suggesting that while these rates contribute to the overall model dynamics, their impact on
is relatively minor compared to direct transmission parameters. Additionally, the death rate in bats
due to disease, with a slightly negative PRCC, points to a marginal effect on reducing transmission by decreasing the infected bat population. When
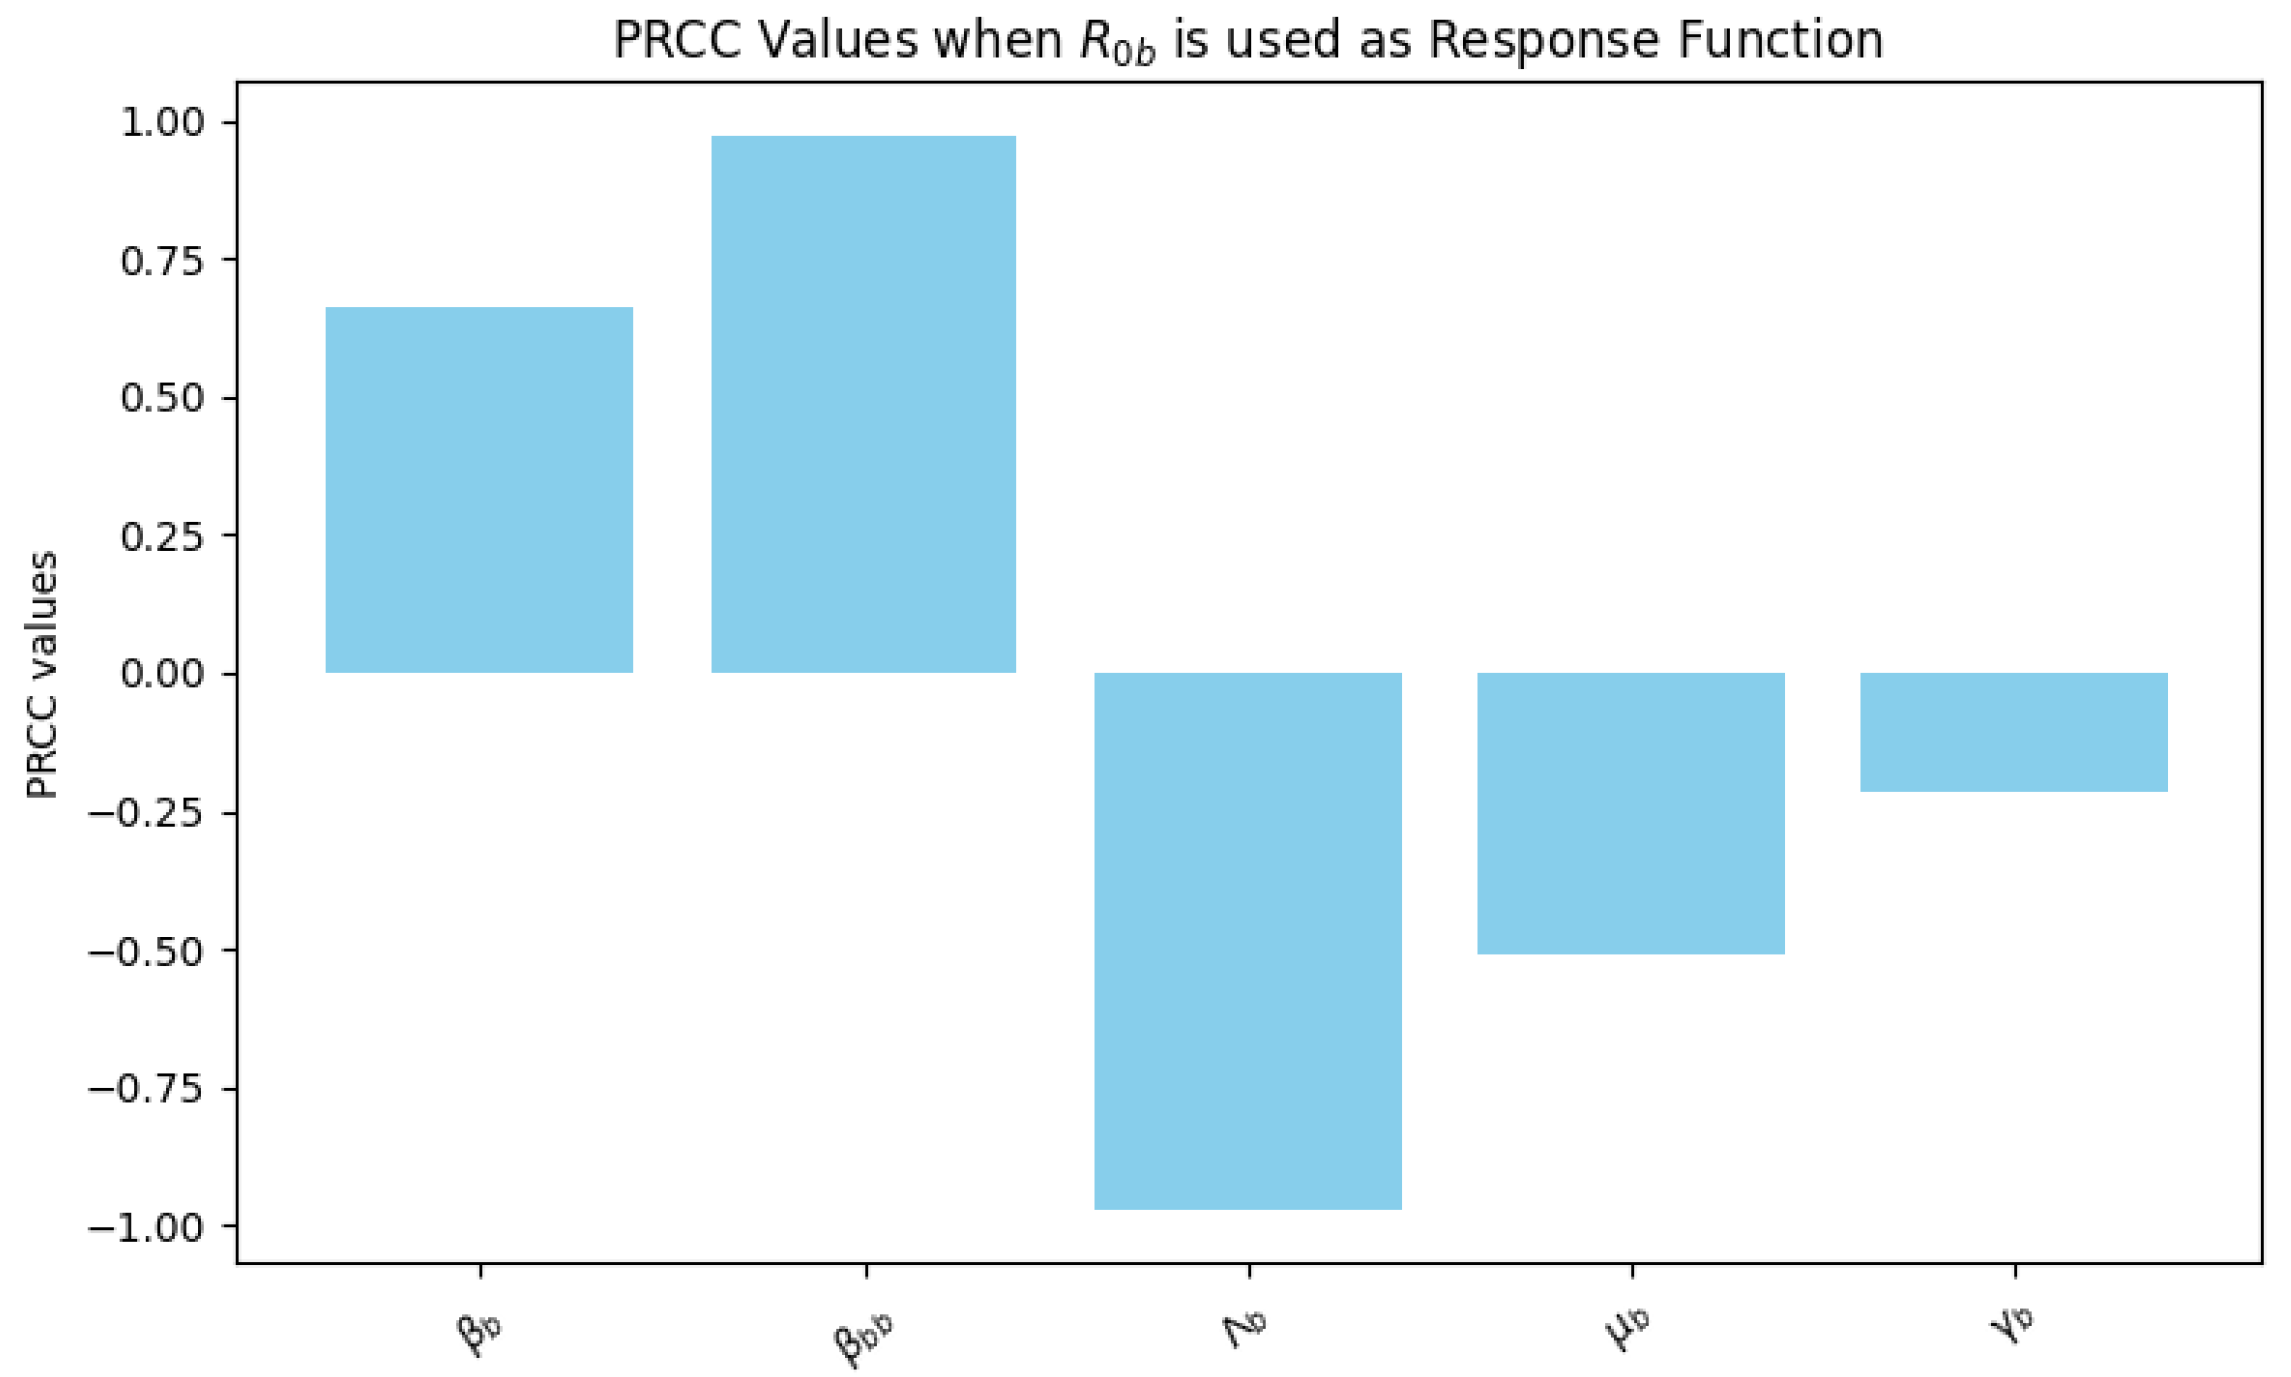
is used as a response function the relationship of the parameters is shown in
Figure 5. In this analysis, the parameters
and
exhibit the highest positive PRCC values, indicating a strong positive influence on
. This suggests that increasing the bat-to-bat contact rate (
) and progression rate from exposed to infected bats (
) substantially raises
, emphasizing the significance of controlling contact rates to manage disease transmission effectively. Conversely, parameters
and
show strong negative PRCC values, indicating that increases in the recruitment and natural death rates of bats may reduce
. These results imply that reducing the bat population or increasing mortality rates could help mitigate disease spread.
To strengthen the research findings, the 3D surface plots in
Figure 6 and contour plots in
Figure 7 have been plotted. The 3D plot of
vs.
sensitivity towards
is plotted in
Figure 6a and the contour plot in
Figure 7a illustrates that they both positively influence the
. As a result, to keep control of
, we must take precautionary measures to reduce these parameters. The progression rate exposed to the infected class and vaccination waning rate behaviors are illustrated in
Figure 6b and
Figure 7b and suggests a synergistic effect where both parameters together amplify disease transmission potential. The plot in
Figure 6c and
Figure 7c emphasizes the importance of reducing transmission
and optimizing mitigation
strategies to control the spread of the disease. Similar behavior is shown in
Figure 6d and
Figure 7d for human–human transmission and fraction of individuals under treatment. The vaccination rate and human transmission impact the
but the vaccination rate effect is relatively slow, as shown by
Figure 6e and
Figure 7e and similar behavior in
Figure 6f and
Figure 7f. The human reproduction number is influenced by both parameters and the impact of
and
is comparable.
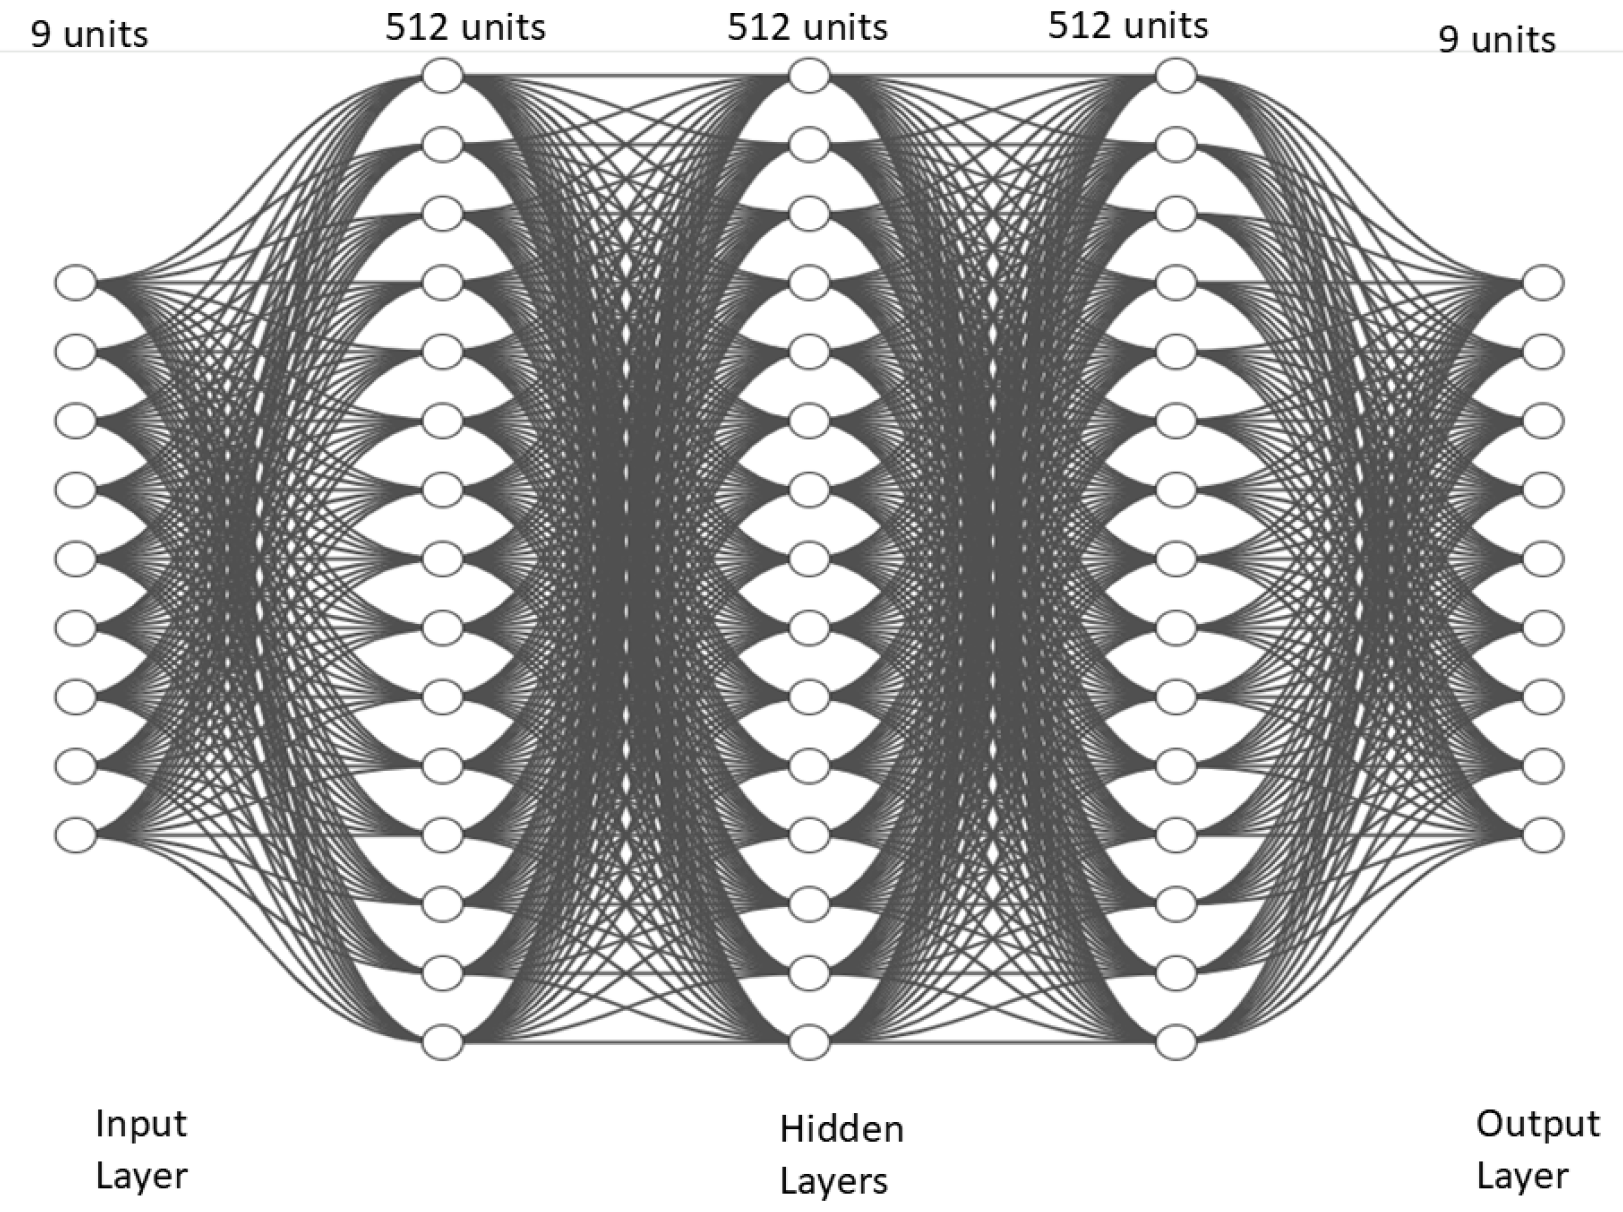
6. The Illustration of DNN Results
This section investigates how the basic reproduction number affects MVD dynamic behaviors. We ran computer simulations for 500 consecutive days. We checked that the system reached stability through model verification with theoretical expectations in the previous sections. We executed the simulation by utilizing DNN along with the LSODA method. It is observed that the prediction accuracy of trained DNN models reached high levels despite their exceptional approximation ability with non-linear complex differential equations. The synthetic data patterns matched well with the DNN output, which proved DNN’s predictive strength for highly non-linear complex differential equations. Strategies for control need to use the reproduction number of humans and bat species as a crucial threshold. When
, the dynamics behavior of MVD for the human population is illustrated in
Figure 8, which shows how human population compartments function within epidemiological modeling of Marburg virus disease. The number of people who are infected, exposed, and under treatment increases for 150 days, but as continuous control strategies are applied, the disease will be eradicated in the long run.
The number of susceptible individuals in
Figure 8a decreases over time because people move into different compartments because of vaccinations combined with infections and other medical actions. An ongoing immunization initiative achieves success through vaccination, leading to continuous increases in the number of protected people while maintaining stable results in
Figure 8b. The identified exposed group experiences an ascending membership which later declines, since members either shift into infective status or achieve recovery from their illness, as shown in
Figure 8c. An analysis of the infected population in
Figure 8d shows quick growth toward a peak before entering a declining stage, as active cases either heal through treatment or resolution or pass away. The under-treatment group in
Figure 8e shows parallel infection patterns that rise with the spread of infections before decreasing during patient recovery. The recovered population in
Figure 8f demonstrates constant growth before stabilizing because people develop immune protection after overcoming the disease.
Through this model, experts demonstrate how vaccination combined with treatment lowers disease burden and controls outbreak progression during specified time intervals, but the system stabilizes over time.
Figure 9 illustrates the human population dynamics under a scenario where the basic reproduction number
indicates sustained disease transmission. When the control strategies are sufficient to control the disease, the exposed, infected, and under-treatment populations start to decline from the start. The susceptible population in
Figure 9a decreases steadily as individuals transition to other categories due to infection or vaccination, while the vaccinated population in
Figure 9b shows a sharp increase, stabilizing over time. The exposed populations in
Figure 9c and infected populations in
Figure 9d follow similar trends, peaking mid-simulation due to disease progression before declining as individuals recover or receive treatment. The under-treatment population in
Figure 9e also rises to a peak before declining, reflecting the effectiveness of medical interventions. Finally, the recovered population in
Figure 9f grows steadily, stabilizing as more individuals recover and gain immunity, showing that recovery mitigates the disease spread in the long term. In all cases, red lines optimized DNN predictions align with the green lines that are reference solutions from the LSODA method, validating the optimized DNN model accuracy for this proposed MVD model.
For the bats class, when
, the disease dynamics are illustrated in
Figure 10, indicating controlled disease transmission within the bat population. The susceptible bat population in
Figure 10a shows an initial decline, as some individuals transition to the exposed and infected compartments but later stabilize, reflecting disease control and population recovery. The exposed bat population in
Figure 10b decreases rapidly to negligible levels, indicating limited progression to the infectious stage due to the low transmission rate. Similarly, the infected bat population in
Figure 10c exhibits a sharp decline early in the simulation, highlighting the effective containment and eventual elimination of the disease.
6.1. The Effect of Marburg Vaccination
To investigate the vaccination rate impact on MVD dynamics by varying it from
to
scenario analysis is performed. The influence on vaccinated, exposed, infected, under-treatment, and recovered populations can be seen in
Figure 11a–e. Vaccination rates have a positive impact on disease dynamics.
6.2. The Effect of Vaccination Efficacy
To investigate the impact of vaccine efficacy on MVD dynamics by varying vaccination efficacy from
to
, a scenario analysis is performed. The influence on vaccinated, exposed, infected, under-treatment, and recovered populations can be seen in
Figure 12a–d. This suggests that vaccination efficacy is a cornerstone for MVD control. The high effectiveness of vaccination and adequate coverage leads to a significant preventative effect with regard to Marburg epidemics, highlighting vaccination’s importance in public health strategies. When vaccination rate and vaccination efficacy are sufficiently high, it helps to control reproduction number as described in
Section 5, and this helps to eradicate the disease.
6.3. The Effect of Marburg Virus Treatment
Numerical assessments of the impact of Marburg treatment failure are presented in
Figure 13. It can be observed that as the treatment failure increases from 0.5 to 0.9, there is a significant increase in the infected and under-treatment population, as shown in
Figure 13a,b. Failure to treat has an extreme impact on the dynamics of Marburg disease. This trend also confirms the sensitivity analysis performed in the previous
Section 5. It will be significantly helpful for controlling the disease outbreak if, in the near future, scientists and researchers collaborate to make specific treatments to overcome the treatment failure factor.
7. Discussion
Many MVD transmission models have been introduced prior to our proposed model. Deterministic mathematical disease modeling has been utilized to study the quarantine effect on the human class within the SEIR framework [
21]. Transmission dynamics have been captured in models that consider both bat and human populations, emphasizing the role of non-human interactions [
46,
54]. Researchers have also examined MVD dynamics by incorporating the non-human class, as the virus can transfer from bats, alongside quarantine measures and public health awareness. Such models have identified quarantine as an effective strategy in the absence of specific treatments or vaccines [
20]. Medjoudja et al. [
22] explored the fractional epidemiological implications of MARV transmission and analyzed optimal control strategies. Addai et al. [
7] conducted a brief analysis of MVD, incorporating public health education to investigate its impact as a modern control strategy. Haque et al. [
55] studied the role of natural immunity in disease spread and identified key parameters influencing dynamics through sensitivity analysis within the human class. Albaqami et al. [
56] focused on designing and assessing mRNA and peptide vaccines for immunity against Marburg virus-induced hemorrhagic fever. Several scientists have employed mathematical models to enhance understanding by considering various compartments, enabling the suggestion of control measures and epidemic predictions for MVD [
57]. However, no previous model has incorporated all the specific conditions of our model, such as vaccine efficacy, treatment failure, and the inclusion of bats as natural reservoirs. The primary contribution of this research lies not only in disease modeling but also in deep learning. We optimized and trained a deep neural network for the proposed highly non-linear complex dynamical system, which significantly outperforms traditional deep neural networks in terms of convergence and computational efficiency. Training and validation losses were monitored using mean square error metrics. This trained model can be utilized by future researchers for predicting disease dynamics and estimating parameters during future outbreaks.
Main Contributions
Novel MVD Transmission Model: Incorporates the non-human class, vaccine efficacy, and treatment failure variability.
Optimized deep neural network: Designed for robustness and prevention of overfitting in the proposed MVD model.
Accuracy and stability: Overlapping outcomes with reference results validate the optimized deep neural network algorithm.
Efficient handling of non-linear systems: The optimized DNN effectively tackles complex dynamical models.
Key parameter identification: Sensitivity analysis identifies critical parameters for disease control in healthcare.
Scenario analysis: Highlights the impact of vaccination and treatment failure.
This study introduces a novel mathematical model for MVD, integrating vaccine efficacy and treatment failure into epidemiological modeling. Our findings reveal that human-to-human transmission
, treatment failure
, and the progression rate from exposed to infected
are the most influential parameters affecting the basic reproduction number
for humans. Sensitivity analysis using PRCC demonstrates that reducing
and
can effectively control the disease, underscoring the importance of improving treatment outcomes and public health interventions. Parameter values were varied from 75% to 125% of baseline values for sensitivity analysis (
Table 1).
The optimized deep neural network (DNN) efficiently approximates solutions to the complex non-linear differential equations governing MVD, offering an AI-driven alternative to disease modeling. With the suggested control strategies, the disease begins to decline after 150 days. Vaccination rate
is better in the current scenario and can improve further in real scenarios. Vaccine efficacy, discussed in
Section 6.2, significantly impacts disease control, with an optimal value of
in the current scenario analysis. Vaccine efficacy proves more influential than the vaccination rate (
Section 6.1) in controlling the disease. Other treatments also have a significant impact on disease dynamics, as high levels of treatment failure
result in prominent fluctuations in disease load.
Previous research on MVD has primarily focused on deterministic models analyzing quarantine measures or public health awareness, often neglecting vaccine efficacy and treatment failure. While some studies have employed AI for infectious disease prediction, they typically rely on standard architectures without optimization for epidemiological models. In contrast, our study integrates a disease-specific deep learning model, optimizing hyperparameters through a grid search for improved accuracy and computational efficiency. The DNN model successfully captures disease dynamics, providing a scalable alternative to traditional numerical solutions. To perform validation, DNN predictions were compared with the LSODA method. Surprisingly, our results indicate that vaccination efficacy has a moderate but not dominant effect on , suggesting that while vaccination is beneficial, controlling human contact and improving treatment strategies are more critical for outbreak mitigation.
A key strength of this study is its dual contribution to epidemiological modeling and AI-driven simulation. The proposed model advances the understanding of MVD transmission by explicitly incorporating vaccination efficacy and treatment failure—factors that are often overlooked in previous models. Additionally, optimizing a DNN for epidemiological forecasting enhances computational efficiency, enabling real-time scenario analysis. However, this study assumes a homogeneously mixed population and does not account for spatial heterogeneity or stochastic effects, which may influence localized outbreak patterns. Future research could extend this framework to include spatial dynamics and real-time surveillance data.
This study addresses a critical gap in Marburg virus modeling by developing a framework that integrates vaccination and treatment failure while leveraging AI for computational efficiency. The findings reinforce the need for targeted interventions to minimize human-to-human transmission and improve treatment success rates. Future work should explore hybrid models combining AI with stochastic epidemiological simulations, as well as real-world validation using outbreak data. Expanding AI-based approaches for early detection and response can further enhance epidemic preparedness and control.
8. Conclusions
This study focuses on a novel mathematical Marburg virus transmission model with vaccination efficacy and treatment failure interventions. This study includes proof of the model’s local stability, as well as the boundedness, and positivity of the solutions. The sensitivity analysis is performed using PRCC values and it highlights the human contact rate, the treatment failure rate, and the progression rate as the most influential parameters in determining . Through the use of surface and contour plots, we highlight the significance of different parameters in . Effective disease management should focus on reducing human contact, improving treatment outcomes, and controlling the progression of infection. Parameters related to recruitment and natural death rates have comparatively little influence on , while vaccination-related parameters, though moderately impactful, remain essential for controlling the susceptible population size. We successfully employed the proposed optimized deep neural network to approximate the solution of a complex nonlinear MVD model with nine coupled differential equations, showing the interpretability of DNN for accurate predictions in real world complex systems. The trained DNN model can generalize well to unseen data patterns, making it useful for predicting responses in scenarios that were not encountered during training. The optimized DNN has several advantages, offering flexibility, smooth implementation, and high predictive accuracy. Its broad applicability makes it an essential approach for tackling emerging infectious diseases and epidemiological forecasting because it efficiently tackles non-linear complex dynamical models. The comparison of DNN prediction with the LSODA method also validates its high accuracy and robustness, which was confirmed earlier by training and validation loss. The model provides valuable insights into Marburg virus dynamics, but like all models, it assumes a homogeneous population and does not explicitly incorporate spatial dynamics, which may influence localized outbreak patterns. However, these assumptions allow for analytical tractability and provide a solid foundation for understanding key transmission mechanisms and could represent a future research direction for researchers.


