1. Introduction
Photonic crystals are engineered structures made from dielectric materials with varying dielectric constants, arranged in a periodic pattern. Over the past decade, extensive research has been conducted on developing novel photonic crystal-based structures [
1]. Notably, a new category of photonic crystals has gained significant attention due to its composition of periodically distributed multilayer arrays of cylindrical rods. This specific photonic crystal, exhibiting a complete band gap, can be positioned on an electromagnetic mode in a designated array, directing propagation within a limited frequency range [
2]. Consequently, photonic crystals have garnered widespread interest for their innovative role in guiding devices that control light propagation. Further investigations into guided-mode photonic crystals have explored multimode orientation by eliminating a periodic arrangement of air cylinders and dielectric pillars [
3,
4,
5] (
Figure 1).
Among the various PC configurations, reconfigurable and multimode photonic crystal waveguides (PCWs) have been extensively explored for their potential in optical communication and signal processing. For instance, reconfigurable PCWs, as demonstrated by prior studies, can achieve efficient power transfer by infiltrating high-refractive-index substances, thus enabling dynamic control over optical pathways [
6]. Additionally, multimode interference waveguides in PCs have been successfully employed in designing ultra-compact all-optical logic gates, facilitating high-performance binary-phase-shift-keyed signal processing with considerable fabrication tolerance [
7]. Furthermore, spatial mode control in photonic crystal nanobeam cavities has been shown to enhance spectral utilization and enable multifunctional device integration through structural modifications [
8]. Building upon these advancements, this work investigates the transmission characteristics of novel symmetric photonic crystals in both multi- and single-mode configurations. By analyzing their optical properties and propagation behavior, we aim to contribute to the development of highly efficient and adaptable photonic structures for future integrated optical systems.
Previous studies have numerically analyzed two-dimensional (2D), square-patterned photonic crystals consisting of a single row of dielectric cylinders (monolayer medium) using the Fourier series expansion method (FSEM) combined with a perfectly matched layer (PML) and have investigated the single-mode phenomenon in such structures [
9]. The periodic arrangement of the monolayer medium has been examined in detail, along with its waveguide properties and structural characteristics [
10,
11]. The main advantage of this configuration lies in its simplicity, both in terms of fabrication and design. In this study, an effective method combining the Fourier series expansion method (FSEM) and the perfectly matched layer (PML) was employed, with PMLs applied in the horizontal direction (i.e., in the regions above and below the monolayer waveguide structure) [
12]. This approach creates an effective virtual periodicity, transforming the original waveguide into a structure analogous to a periodic waveguide array [
13,
14]. Furthermore, the design of single-layer 2D dielectric photonic crystal waveguides extends beyond conventional periodic configurations and can be further optimized through the incorporation of heterogeneous materials or asymmetric geometries within the photonic crystal [
15]. Such modifications enable the precise tuning of bandgap properties and light propagation characteristics, leading to improved optical control. These design advancements hold great potential for applications in optical communication and sensing. By refining these structural parameters, more efficient light manipulation can be realized, offering significant theoretical and practical insights for the development of high-performance optoelectronic devices.
In this study, a 2D photonic crystal material with an infinite periodic dielectric rod chain structure was compared and observed after changing the medium and radius conditions. The correlation between forward and backward propagation constants and leakage modes was analyzed, and the phase and attenuation constants of these modes were computed. The Bragg transmission and electric field distribution characteristics were examined based on the simulation results. It was found that, under the condition that the other conditions did not change, the structure with a round rod with a small radius had little impact on crosstalk, while structures with a large radius exhibit the coexistence of odd and even modes. Therefore, it was concluded that circular rods with a small radius are suitable for single-mode communication, while circular rods with a large radius are more suitable for multimode communication. The multimode behavior observed in structures with larger radii can be leveraged for high-density optical interconnects, where the ability to simultaneously transmit multiple signals would significantly enhance data throughput and communication efficiency in next-generation optical communication systems. These structures, supporting both odd and even modes, offer flexibility for designing high-speed data transmission systems, such as those found in data centers, supercomputing environments, and high-performance computing systems. Moreover, the stable single-mode behavior exhibited in structures with lower dielectric constants is crucial for applications that require minimal crosstalk and signal degradation, such as in densely packed photonic networks. This characteristic suggests that the proposed structures could be used in systems where signal integrity is of utmost importance, including long-distance optical communication links and integrated photonic circuits.
2. Derivation of Formulas for Photonic Crystal Waveguide Propagation
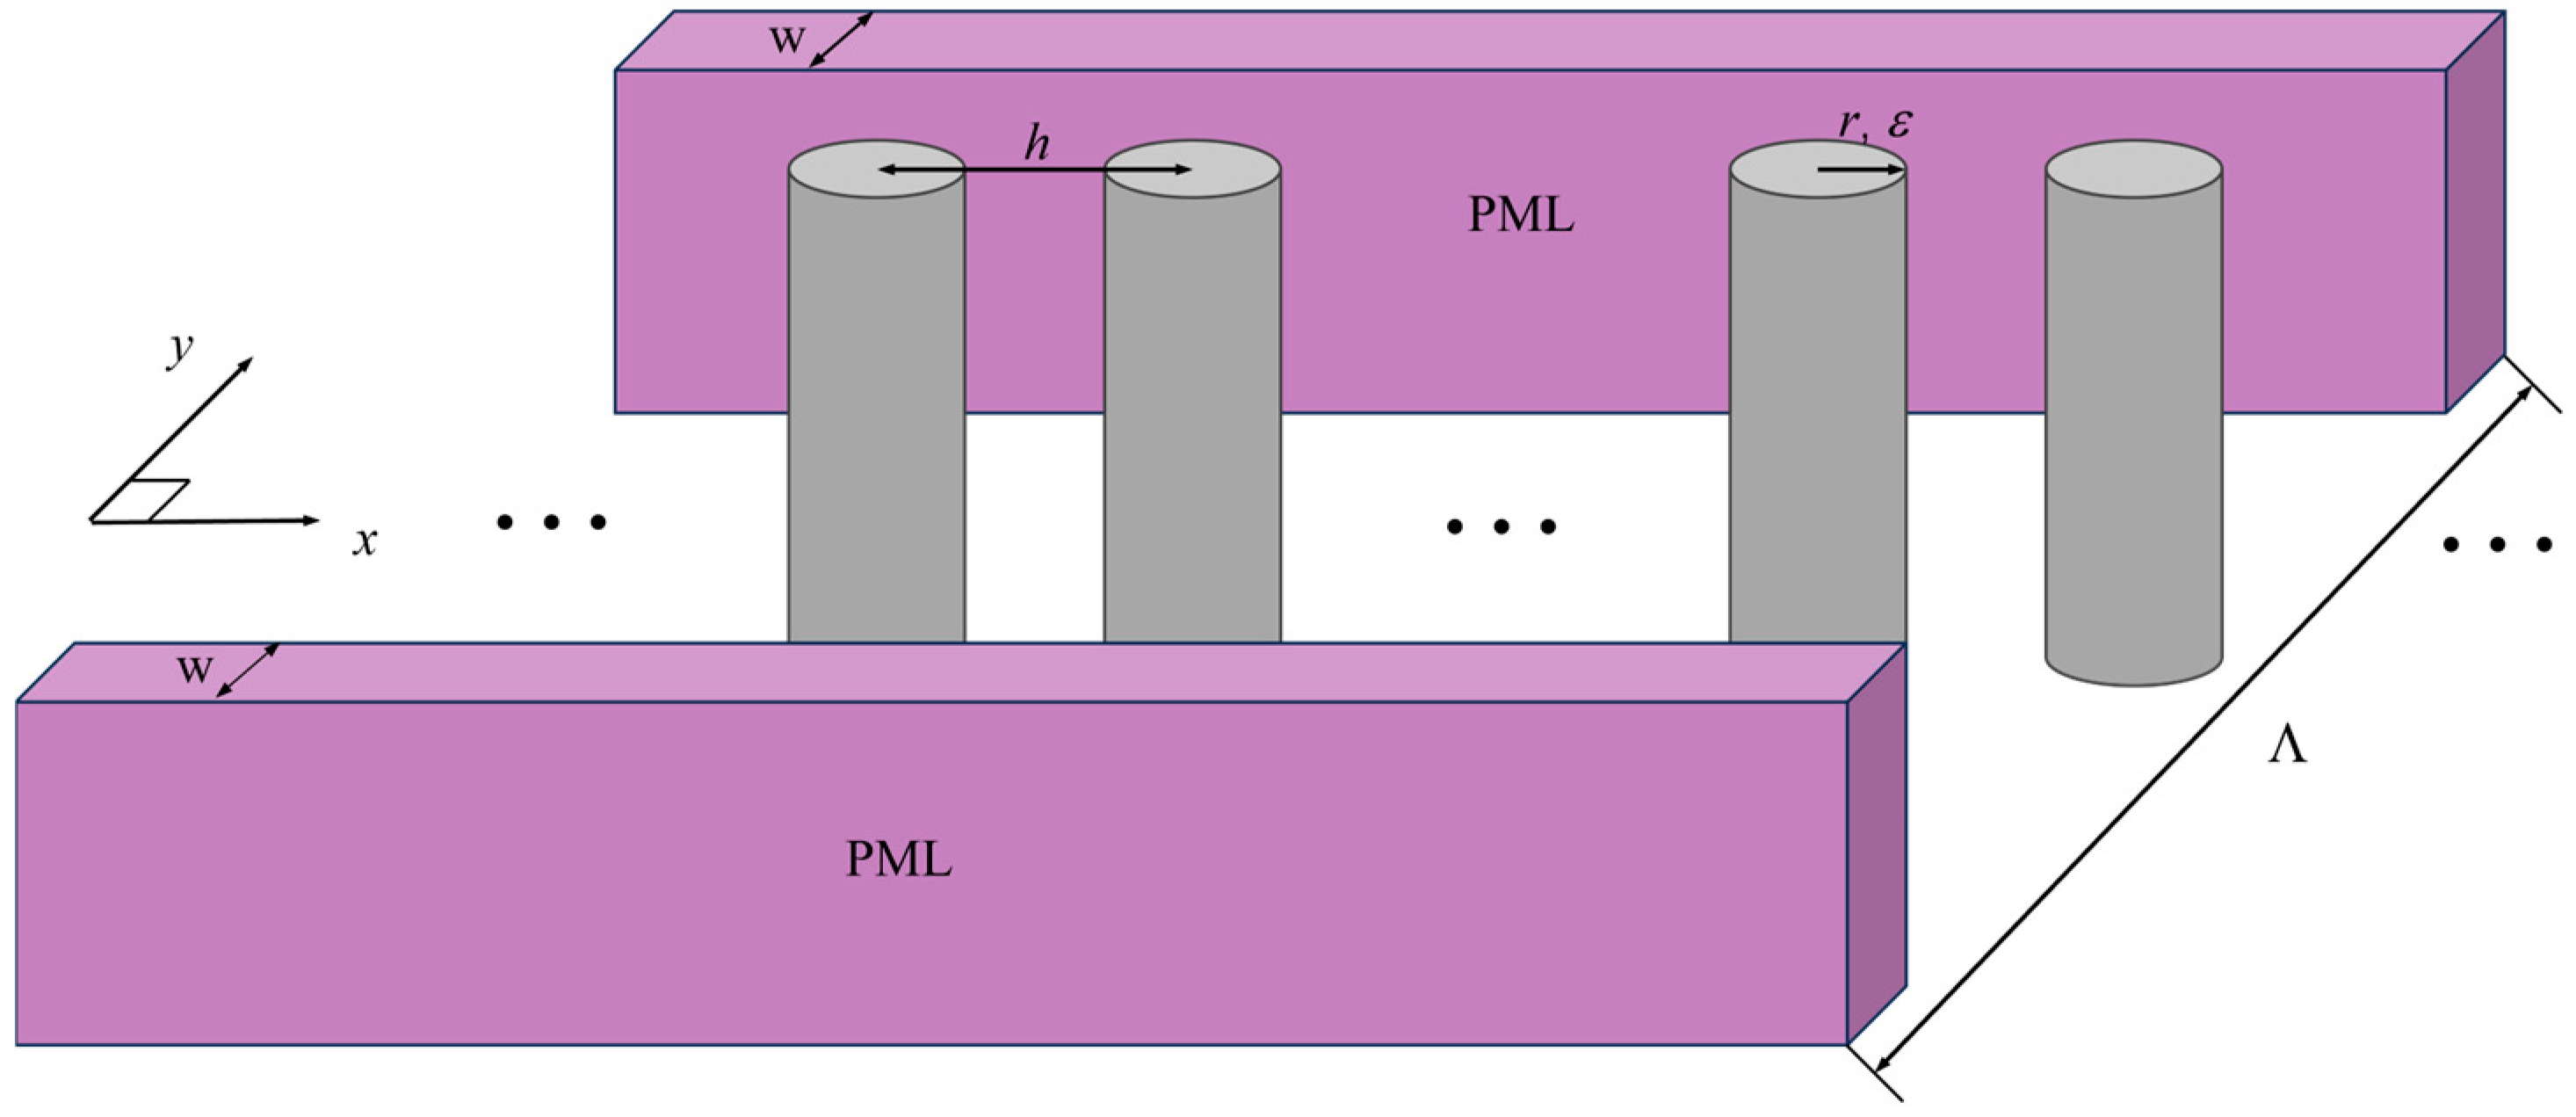
The photonic crystal structure in this study consists of a two-dimensional (2D) infinite periodic chain of circular rods, arranged periodically along the
x-axis with a lattice constant of ℎ = 55 nm. The scatterers are infinitely extended along the
z-axis, with their rod axes parallel to each other. Each rod is made of a pure dielectric material with a radius
r and a relative dielectric constant
ε. To implement the finite-size element method (FSEM), the structure is defined based on a distance of Λ/2 from the global origin, which serves as the boundary, while the thickness
w is constrained by the perfectly matched layer (PML) limit. A repeating identical configuration in the
y-direction establishes a virtual period Λ. Meanwhile, the virtual period Λ = 60
h = 3.3 × 10
3 nm, with the truncation number
M = 150. Therefore, the position of the original structure was approximately 0 ≤ y ≤ Λ. Then, the electric field mode was assumed as (E pattern,
Ez,
Hy,
Hx) and the magnetic field mode was (H pattern,
Hz,
Ey,
Ex), with the dissemination of information [
16].
First, assuming mode
E propagates in a planar structure, the Maxwell equations for the
E-mode were formulated as follows [
9]:
where
, in which
represents the normalized magnetic field, and
, which is the stretch coordinate variable associated with the coordinate system PML parameter.
where
q is a real number and
is a constant. The electrical conductivity of the
PMLs can be adjusted by controlling the values of
q and
. Considering that the system was
y. The periodicity of the direction, electric field, and magnetic field was approximated using a truncated Fourier series and expressed as follows:
where
αm = 2
πm/Λ and
is the
m-th order Fourier coefficient of the electric field component
Ez in the
z-direction. Similarly,
is the
m-th order Fourier coefficient of the magnetic field component
Hx in the
x-direction, and so on. The Fourier coefficients are
and
. The linear equations were as follows:
Among them,
where
is the Kronecker’s delta, with superscript
t indicating transformation of the corresponding vector.
k0 denotes the wave number in free space, while
ε(
y) represents the permittivity along the
y-axis within the 0 ≤ y ≤ Ʌ range. Equation (11) constructs the system coupling matrix
C, where [VA]
2 denotes the square of the product of matrix
V and diagonal matrix
A, manifesting the nonlinear coupling between modes. Equation (12) evaluates the impact of the periodic dielectric constant distribution on mode coupling. The matrix element [N]
mm′ quantifies the coupling strength between modes
m and
m′, with spatial harmonic components extracted via Fourier integration. Eigenvalue
and eigenvector
Pn defines the normalized propagation constant
and describes the field distribution of guided and radiation modes in the waveguide, leading to the solution of Equations (7) and (8):
From the above, it was obtained that
where
represents the magnitude of the
n-th pattern propagating forwards and backwards.
After reordering the element Re[
xn]reduction guidance and radiation modes for
and P, in mode H, Li’s factorization rule was applied to the Fourier series of the
Ey field components [
17]. At each discontinuous boundary, Fourier coefficients matching both sides of the interface were used. As a result, the scattering matrix
Sj at the boundary
x =
xj was defined as follows [
18]:
Each circular rod was subdivided into multiple parallel rectangular thin rods and periodic chain components, which were replaced with laminated parallel-plane waveguide structures [
19,
20,
21,
22]. Due to the mode guide structure
x, the generalized scattering array was calculated based on the equation
SN period h in the
x-direction. The calculation results were applied to the applicable elements to acquire the inverse transfer array
KN, expressed as follows:
therefore, the propagation constant was
and
k-th mode determined by
where χ
k is the
k-th eigenvalue of the transfer matrix
KN [
23].
3. Numerical Results and Discussion
To determine the interval between the propagation and cut-off stages from variations in the complex propagation constant, the phase and attenuation constants were calculated. Based on the FSEM applied to the optical waveguide structure, each period was discretized into 20 parallel cylindrical segments, while the virtual period was set to 60h. The value of q was set to 2.1. Next, the dielectric constant was determined to be 11.7 and compared when r = 0.4h and 0.45h, and the normalized frequency of 0–0.8 was taken as the research range. The analysis was as follows:
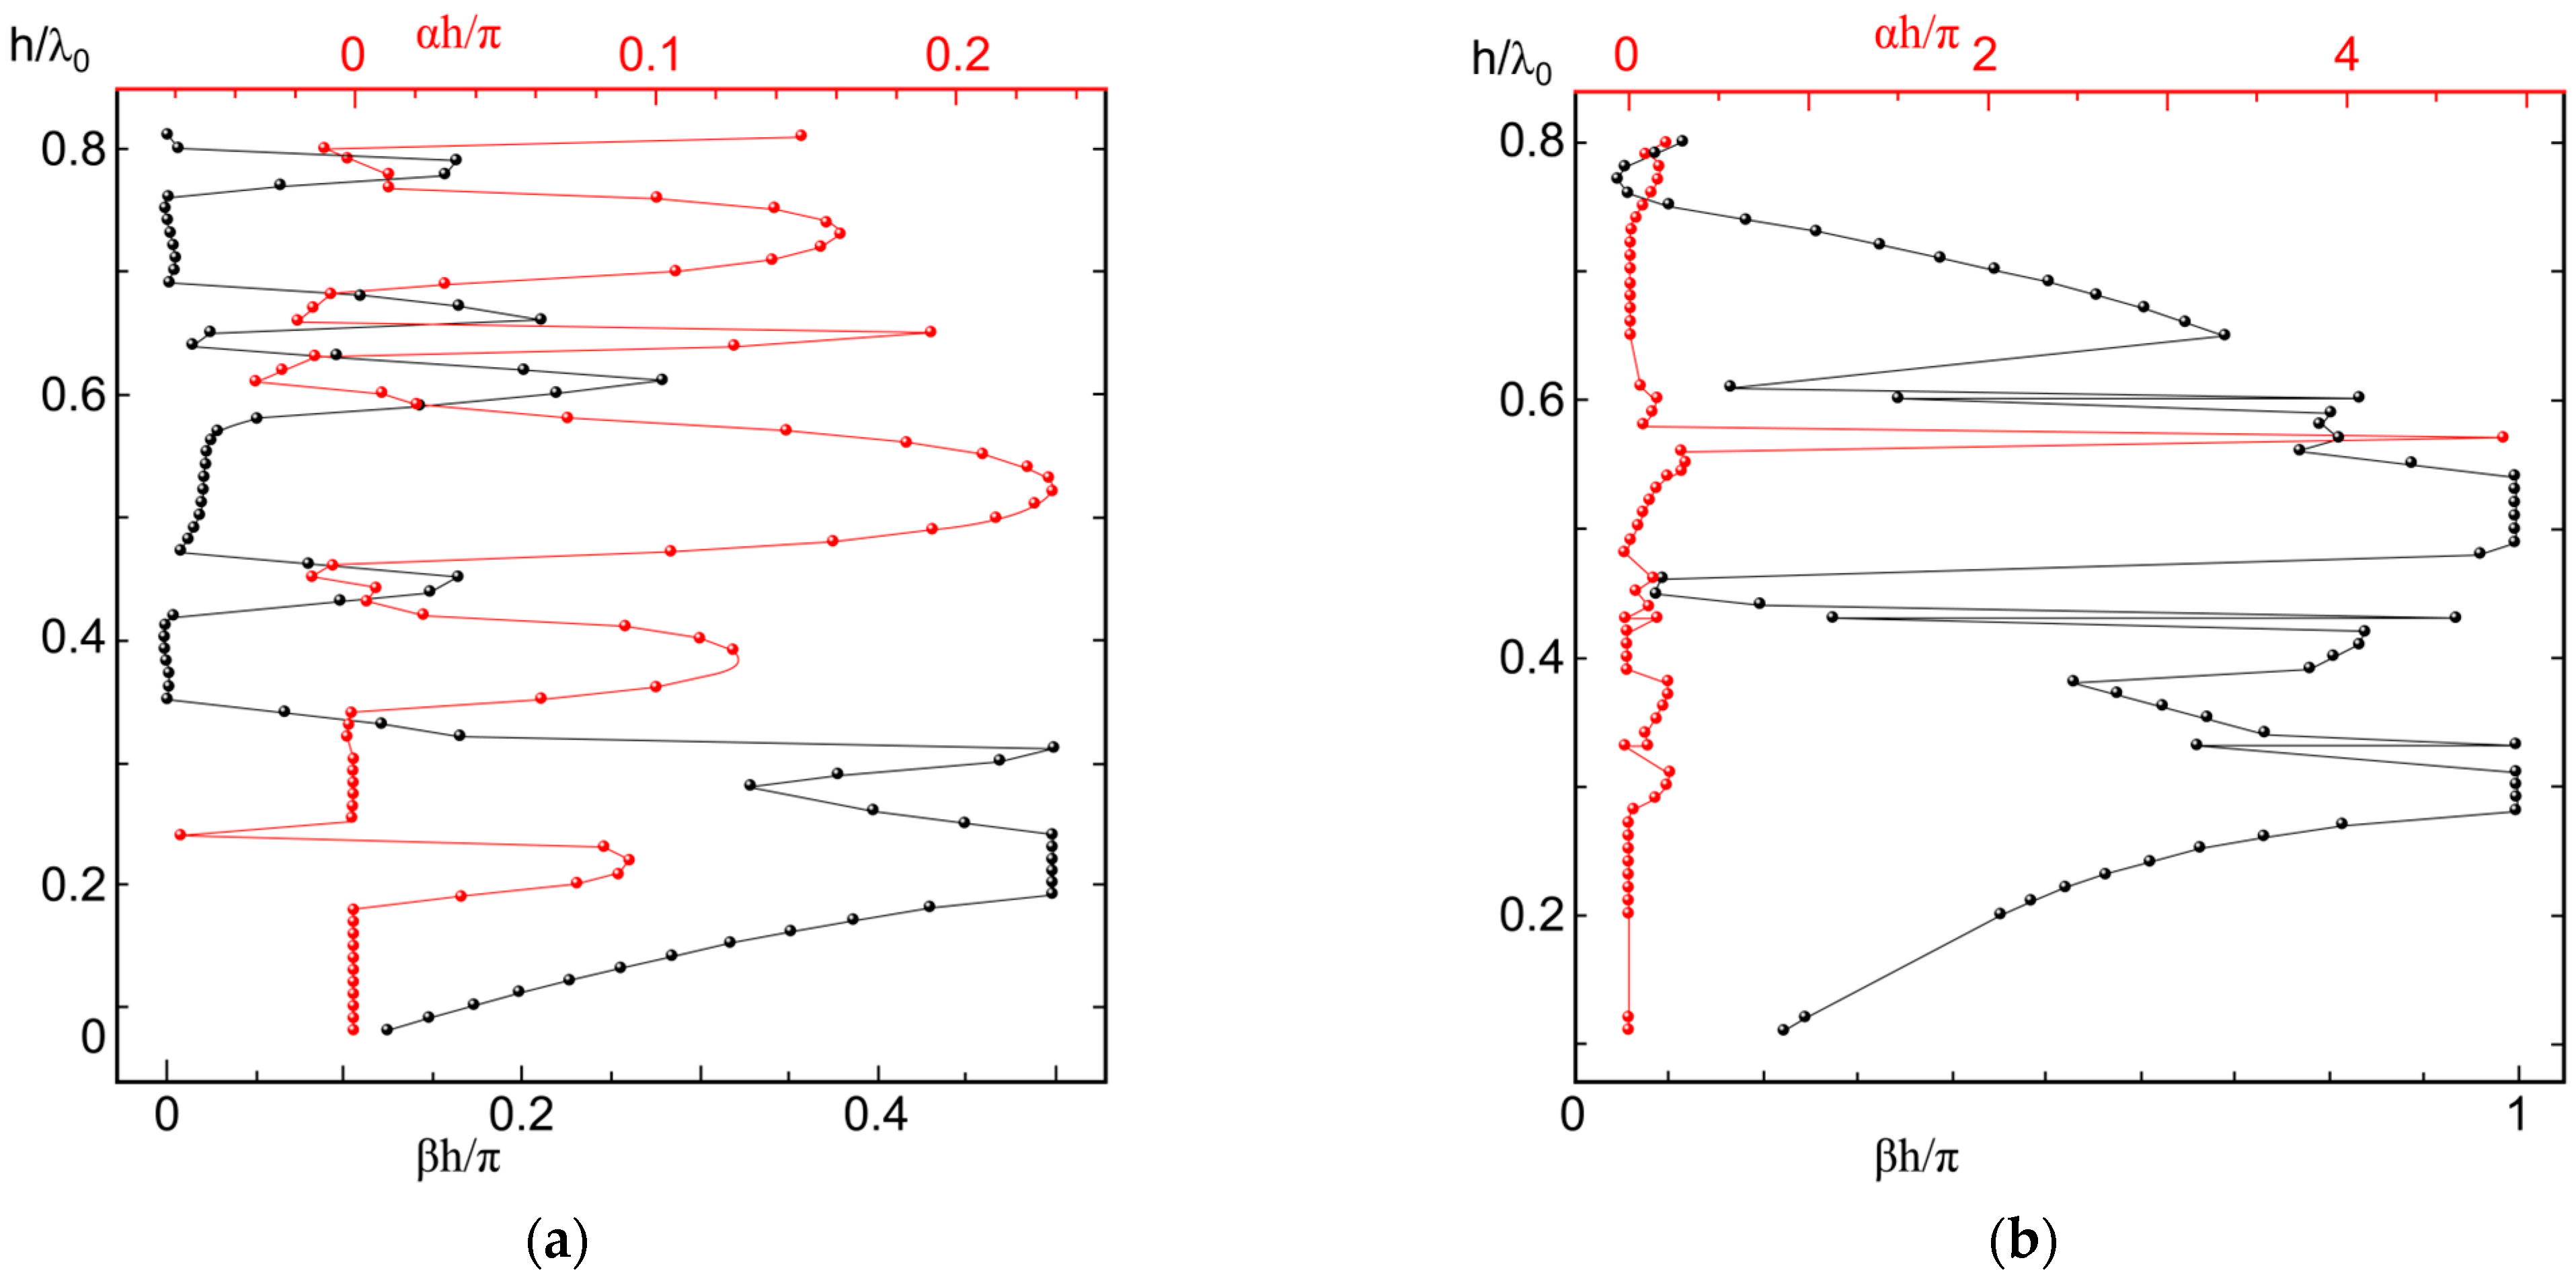
When
r = 0.4
h, the phase constants and attenuation constants of modes E and H were 0 ≤ h/λ
0 < 0.8 (
Figure 2). In mode E, the normalized frequency was 0.08 ≤ h/λ
0 < 0.12, and in mode H, the normalized frequency 0.11 ≤ h/λ
0 < 0.27 entered the first Bragg propagation cycle, with the wave propagating in alignment with the energy flow. The structure during this cycle was therefore considered to be an effective guiding device, and the phase constant increased linearly at this point. When the normalized frequency of mode E was 0.19 ≤ h/λ
0 < 0.24 and the normalized frequency of mode H 0.28 ≤ h/λ
0 < 0.38, the order level of both modes was 10
−1, which was the first cut-off stage. Mode E entered the second Bragg propagation cycle at a normalized frequency of 0.2 ≤ h/λ
0 < 0.29, while mode H entered it at 0.3≤ h/λ
0 <0.42. This represented a leakage mode where the wave propagation direction was opposite to the energy flow direction. The periodic pattern of the cycle exhibited a negative group velocity and leakage losses. For mode E, the normalized frequency was 0.29 ≤ h/λ
0 < 0.85, and for mode H, it was 0.42 ≤ h/λ
0 < 0.58. The attenuation constant value ranged from 10
−2 to 10
−1, corresponding to the second cut-off period. When the scope of frequency of mode H was 0.65 ≤ h/λ
0 < 0.64, there was a third Bragg communication period. In this cycle, the group velocity was positive and existed in leakage mode.
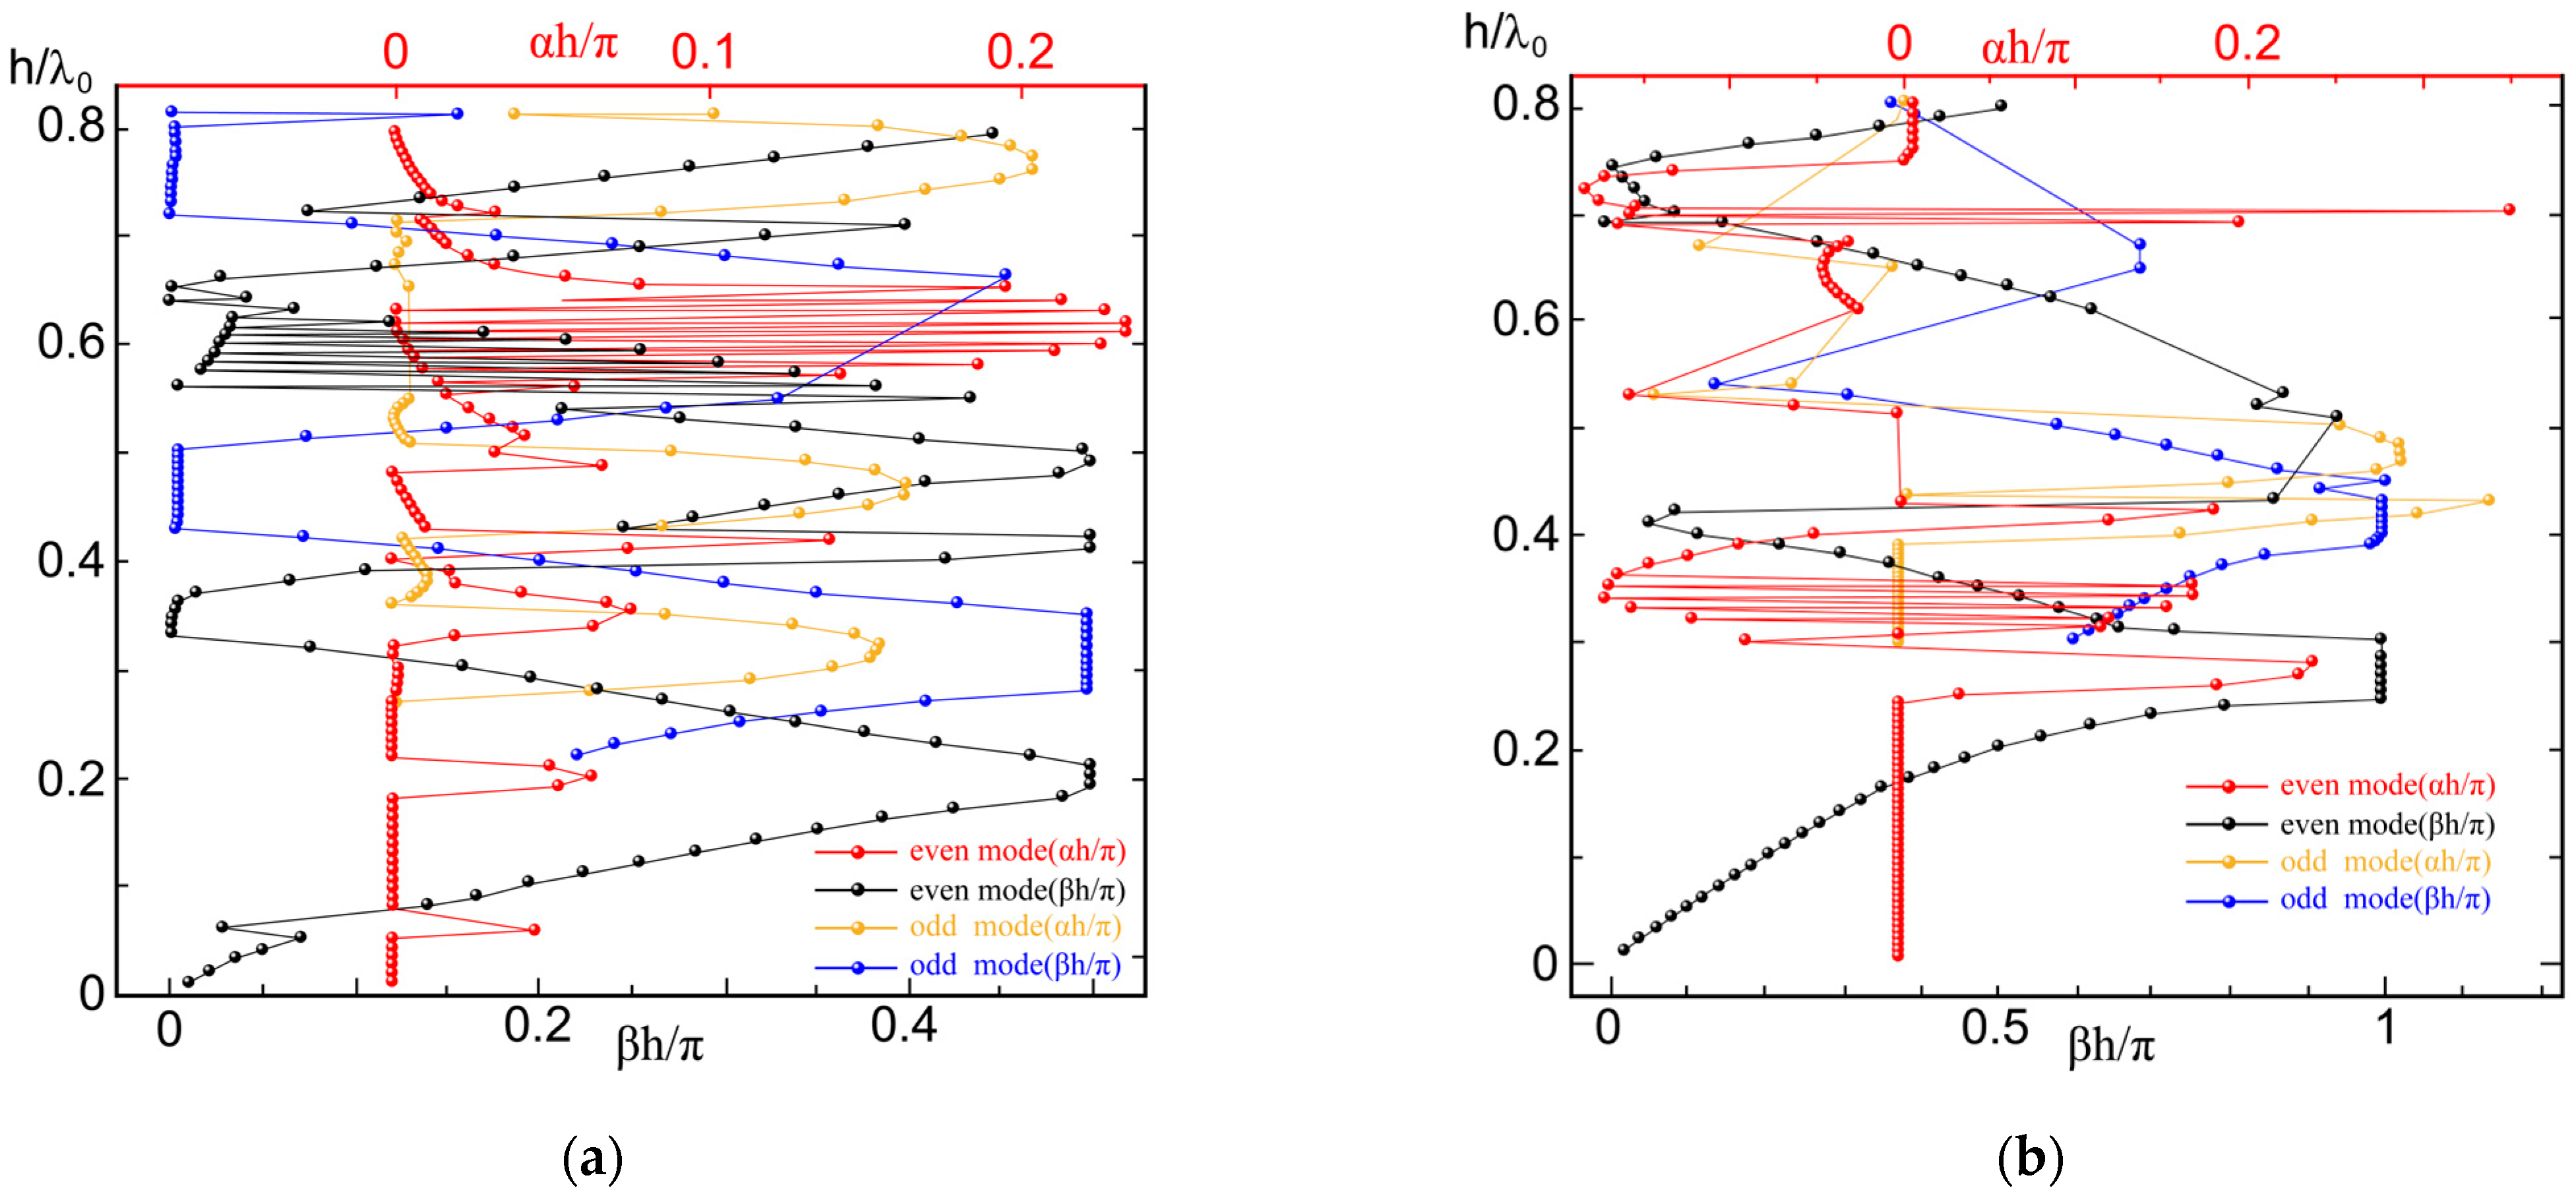
When the radius is
r = 0.45
h, the structure exhibits the presence of odd–even modes in its propagation characteristics.
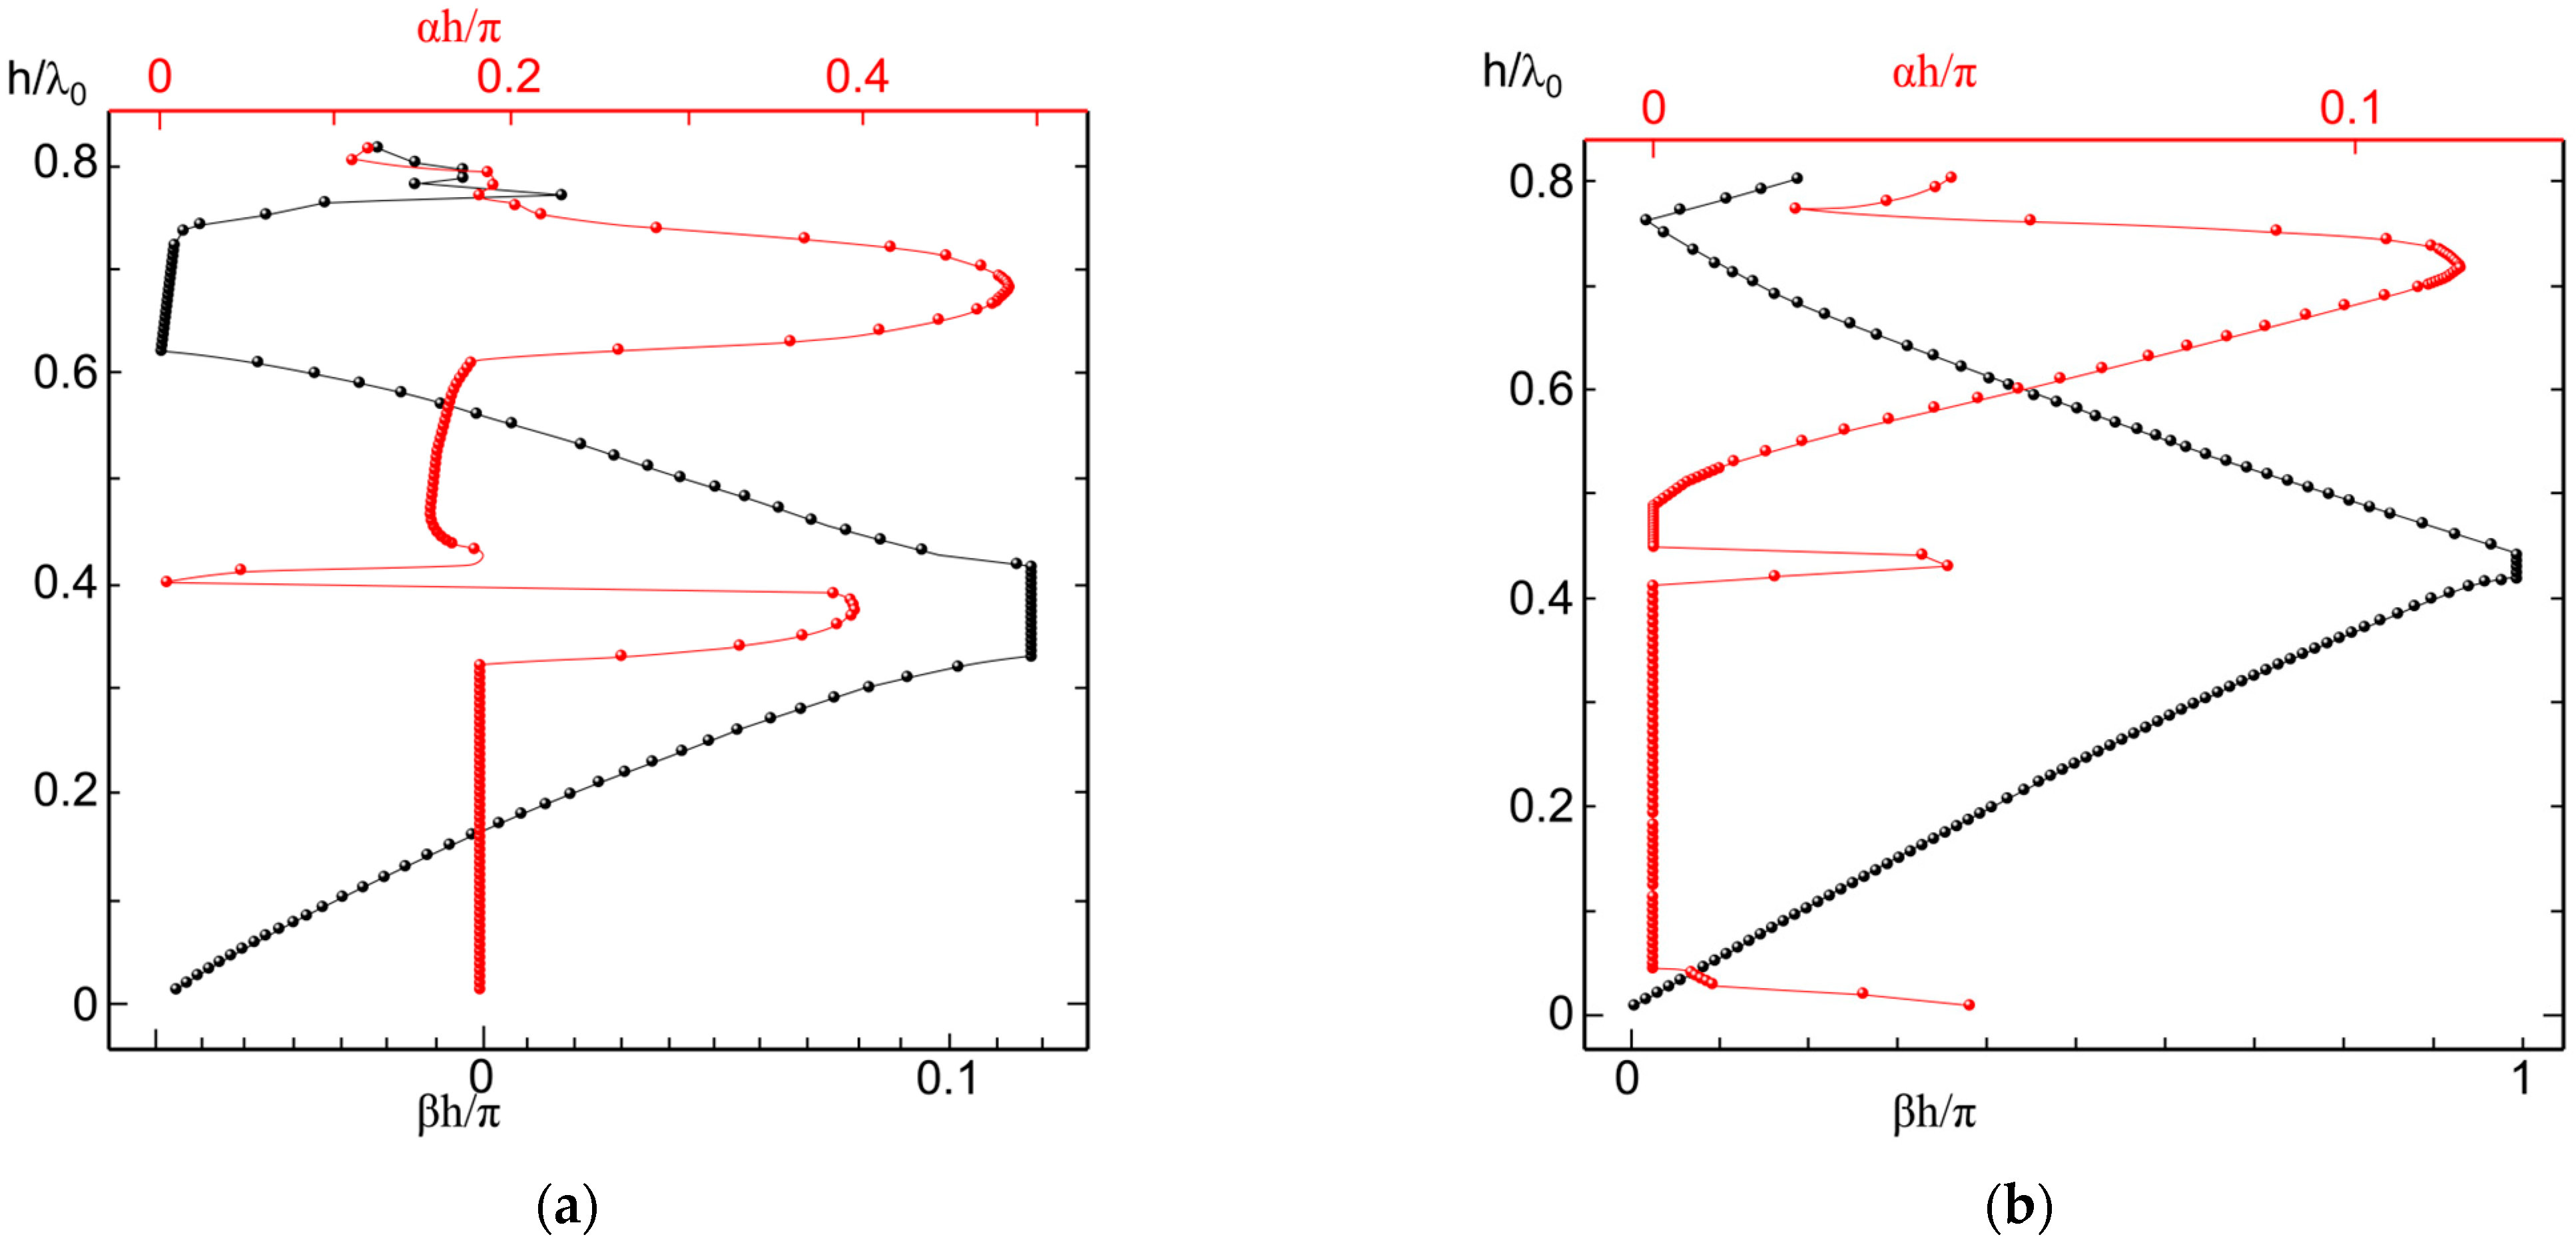
Figure 3 illustrates the numerical variation of the attenuation and phase constants for this case. Taking the standardized period 0 ≤ h/λ
0 < 0.8 as the research range, when the scope of frequency of mode E was 0 ≤ h/λ
0 < 0.05 and the scope of frequency of mode H was 0 ≤ h/λ
0 < 0.24, the order of magnitude of attenuation constant αh/π was 10
−3 and the phase constant showed a linear increase (
Figure 3a,b). This was the first Bragg propagation period. There is a waveguide pattern in which the wave traveled in the same direction as the energy, and the pattern in this cycle had a positive velocity. Theoretically, the practical attenuation constant must be zero in this period. As a result, the structure in this cycle was regarded as an exceptionally efficient guiding device.
When the scope of frequency of mode E was 0.05 ≤ h/λ0 < 0.08 and the scope of frequency of mode H was 0.24 ≤ h/λ0 <0.3, this was the first cut-off period. When the scope of frequency of mode E was 0.08 ≤ h/λ0 < 0.18 and the scope of frequency of mode H was 0.3 ≤ h/λ0 < 0.39, the attenuation constant αh/π was of the order of 10−3; this corresponded to the second Bragg communication cycle. In this cycle, a leakage pattern occurred where the wave propagation direction was opposite to the energy flow. The modes during this period exhibited negative group velocity and leakage loss, making them suitable for power distributors and antennas operating within this normalized frequency. When the normalized frequency of mode E was 0.18 ≤ h/λ0 < 0.22, it corresponded to the second cut-off period. For 0.22 ≤ h/λ0 < 0.32, the attenuation constant was approximately 10−3, indicating the third Bragg propagation period. During this period, a leakage pattern was present where the wave and energy propagated in the same direction, with the pattern exhibiting a positive velocity.
The standardized period range of mode E was 0.22 ≤ h/λ0 < 0.55 and 0.66 ≤ h/λ0 < 0.8. There was a monolayer dielectric cylindrical periodic structure with a double mode (odd and even modes), and there was only an even mode in 0.56 ≤ h/λ0 < 0.65. The standardized period range of mode H of the monolayer dielectric cylindrical periodic structure with two modes included 0.3 ≤ h/λ0 < 0.44, 0.65 ≤ h/λ0 < 0.67, and 0.7 ≤ h/λ0 < 0.80, in contrast to the cylindrical periodic structure of the monolayer medium with the same parameters of r = 0.4h. Structures with r = 0.45h not only included an odd–even mode but also had a different range of cut-off and propagation periods. Furthermore, the two material parameters exhibit significant variation with differing frequencies when the radius is altered. The reason was that the cut-off wavelengths of modes E and H were different, resulting in different transmission modes of dielectric cylindrical waveguides. The cut-off wavelength was directly proportional to the radius r of the dielectric cylindrical waveguide, with shorter operating wavelengths leading to an increased number of transmission modes.
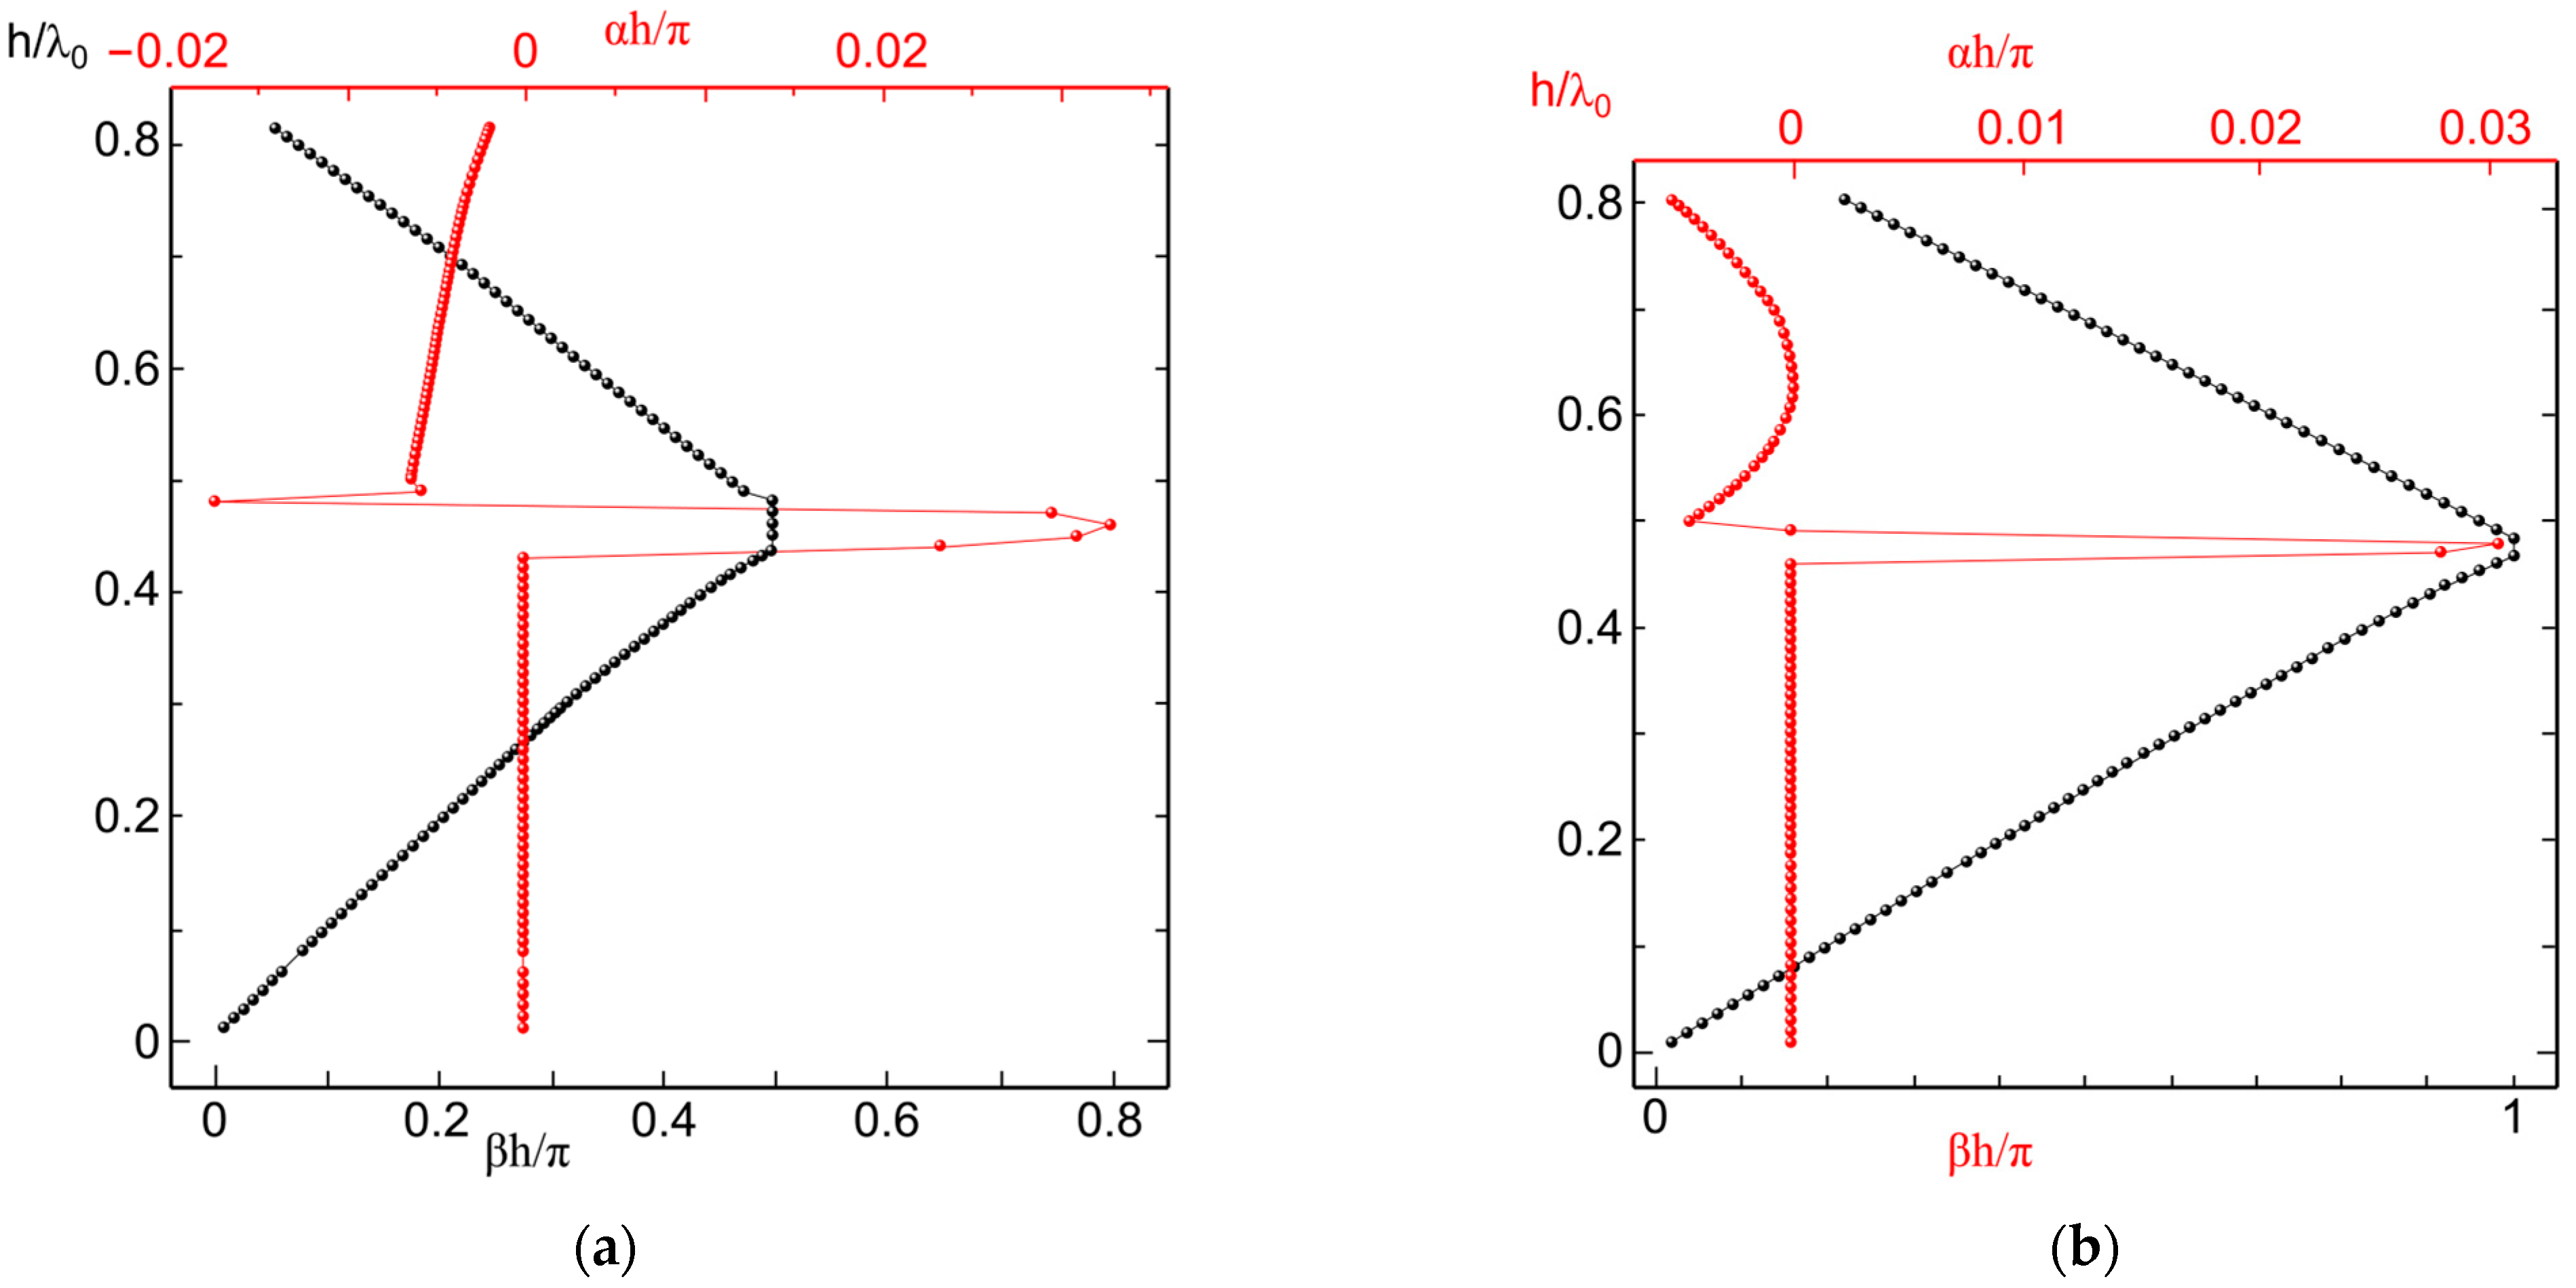
Next, the r was kept at 0.35
h, with the virtual period, number of sections, and PML thickness unchanged, and the dielectric constant varied between 2 and 4. When the dielectric constant was 2, the phase and attenuation constants of modes E and H were examined. The standardized periodic frequency 0 ≤ h/λ
0 < 0.8 was taken as the research range. When the scope of frequency of mode E was 0 ≤ h/λ
0 < 0.46 and the scope of frequency of mode H was 0 ≤ h/λ
0 < 0.43, the attenuation constant αh/λ
0 became very small (0~10
−5), and the phase constant showed a linear increase (
Figure 4a,b). This was the first Bragg propagation period. A waveguide mode with positive group velocity existed, where the wave propagation direction aligned with the energy flow. The theoretical real attenuation constant in this period should be zero.
When the scope of frequency of mode E was 0.43 ≤ h/λ0 < 0.48 and the scope of frequency of mode H was 0.46 ≤ h/λ0 < 0.5, the attenuation constant was very large. At this stage, the order of both modes was 10−1, marking the first cut-off. When the normalized frequency of mode E was 0.5 ≤ h/λ0 < 0.8 and that of mode H was also 0.5 ≤ h/λ0 < 0.8, the attenuation constant decreased to 10−3, corresponding to the second Bragg propagation cycle. In this cycle, a leakage pattern occurred, with the wave propagation direction opposite to that of the energy. The pattern exhibited a negative group velocity and leakage losses.
When the dielectric constant was 4, the phase and attenuation constants for modes E and H were examined (
Figure 5). The research range was defined by the normalized periodic frequency 0 ≤ h/λ
0 < 0.8. For the medium with a dielectric constant of 4, the normalized frequency for mode H was 0 ≤ h/λ
0 < 0.13, and for mode E, it was 0 ≤ h/λ
0 < 0.08. This range corresponds to a multimode case, which was more stable compared to the case with a dielectric constant of 2.
In the case of mode H, the normalized periodic normalized frequency is 0.13 ≤ h/λ0 < 0.41, while in the case of mode E, the normalized frequency is 0.08 ≤ h/λ0 < 0.32. Studies show that within this specific normalized frequency, the attenuation constant becomes significantly smaller, while the phase constant increases linearly as the frequency changes. This phenomenon indicates the unique propagation characteristics of waveguide modes within these ranges. In particular, waveguide modes exhibiting positive group velocity have been observed, implying that the direction of wave propagation aligns with the direction of energy flow. This confirms that these modes correspond to the first Bragg propagation stage.
During the first Bragg propagation stage, both the theoretical and actual attenuation constants are expected to be zero. The near-zero attenuation constant indicates that within this normalized frequency, the transmission loss in the waveguide is negligible, and the wave propagates without any significant attenuation. In contrast, the linear increase in phase constant with frequency indicates that the propagation speed of the wave increases within this normalized frequency, exhibiting higher phase and group velocities. This phenomenon is closely related to the electromagnetic properties of the material and the geometry of the waveguide, particularly the effects of reflection and refraction caused by the periodic structure in Bragg waveguides.
Furthermore, the changes in group and phase velocities with the variation in frequency within the normalized periodic range also reflect the behavior of energy propagation in the medium. The alignment of the direction of energy flow with the wave propagation direction further validates that the observed waveguide modes are typical of Bragg waveguides. In this Bragg propagation period, the wave experiences negligible attenuation, allowing for efficient energy transmission.
This phenomenon holds significant implications for the design and application of waveguide materials, especially in photonic crystals and other nanophotonic devices. It provides crucial guidance for enhancing waveguide transmission efficiency and minimizing attenuation losses. Therefore, a deeper understanding of electromagnetic wave propagation behavior within this normalized frequency will contribute to the further optimization of waveguide structures and promote the development of efficient light transmission technologies.
When the standardized periodic frequency of mode E was 0.32 ≤ h/λ0 < 0.42, the attenuation constant was large, attributed to the attenuation band characteristics from first- and second-order Bragg reflections in periodic structures. For mode H, the normalized frequencies were 0.41 ≤ h/λ0 < 0.45 and 0.72 ≤ h/λ0 < 0.8. When the normalized frequency of mode E was 0.61 ≤ h/λ0 < 0.68, the attenuation constant was approximately 9, and the phase constant entered the second-order Bragg reflection region. In this regime, a leaky mode was observed, where the wave propagation direction was opposite to the energy flow direction. The mode exhibited negative group velocity and leakage loss.
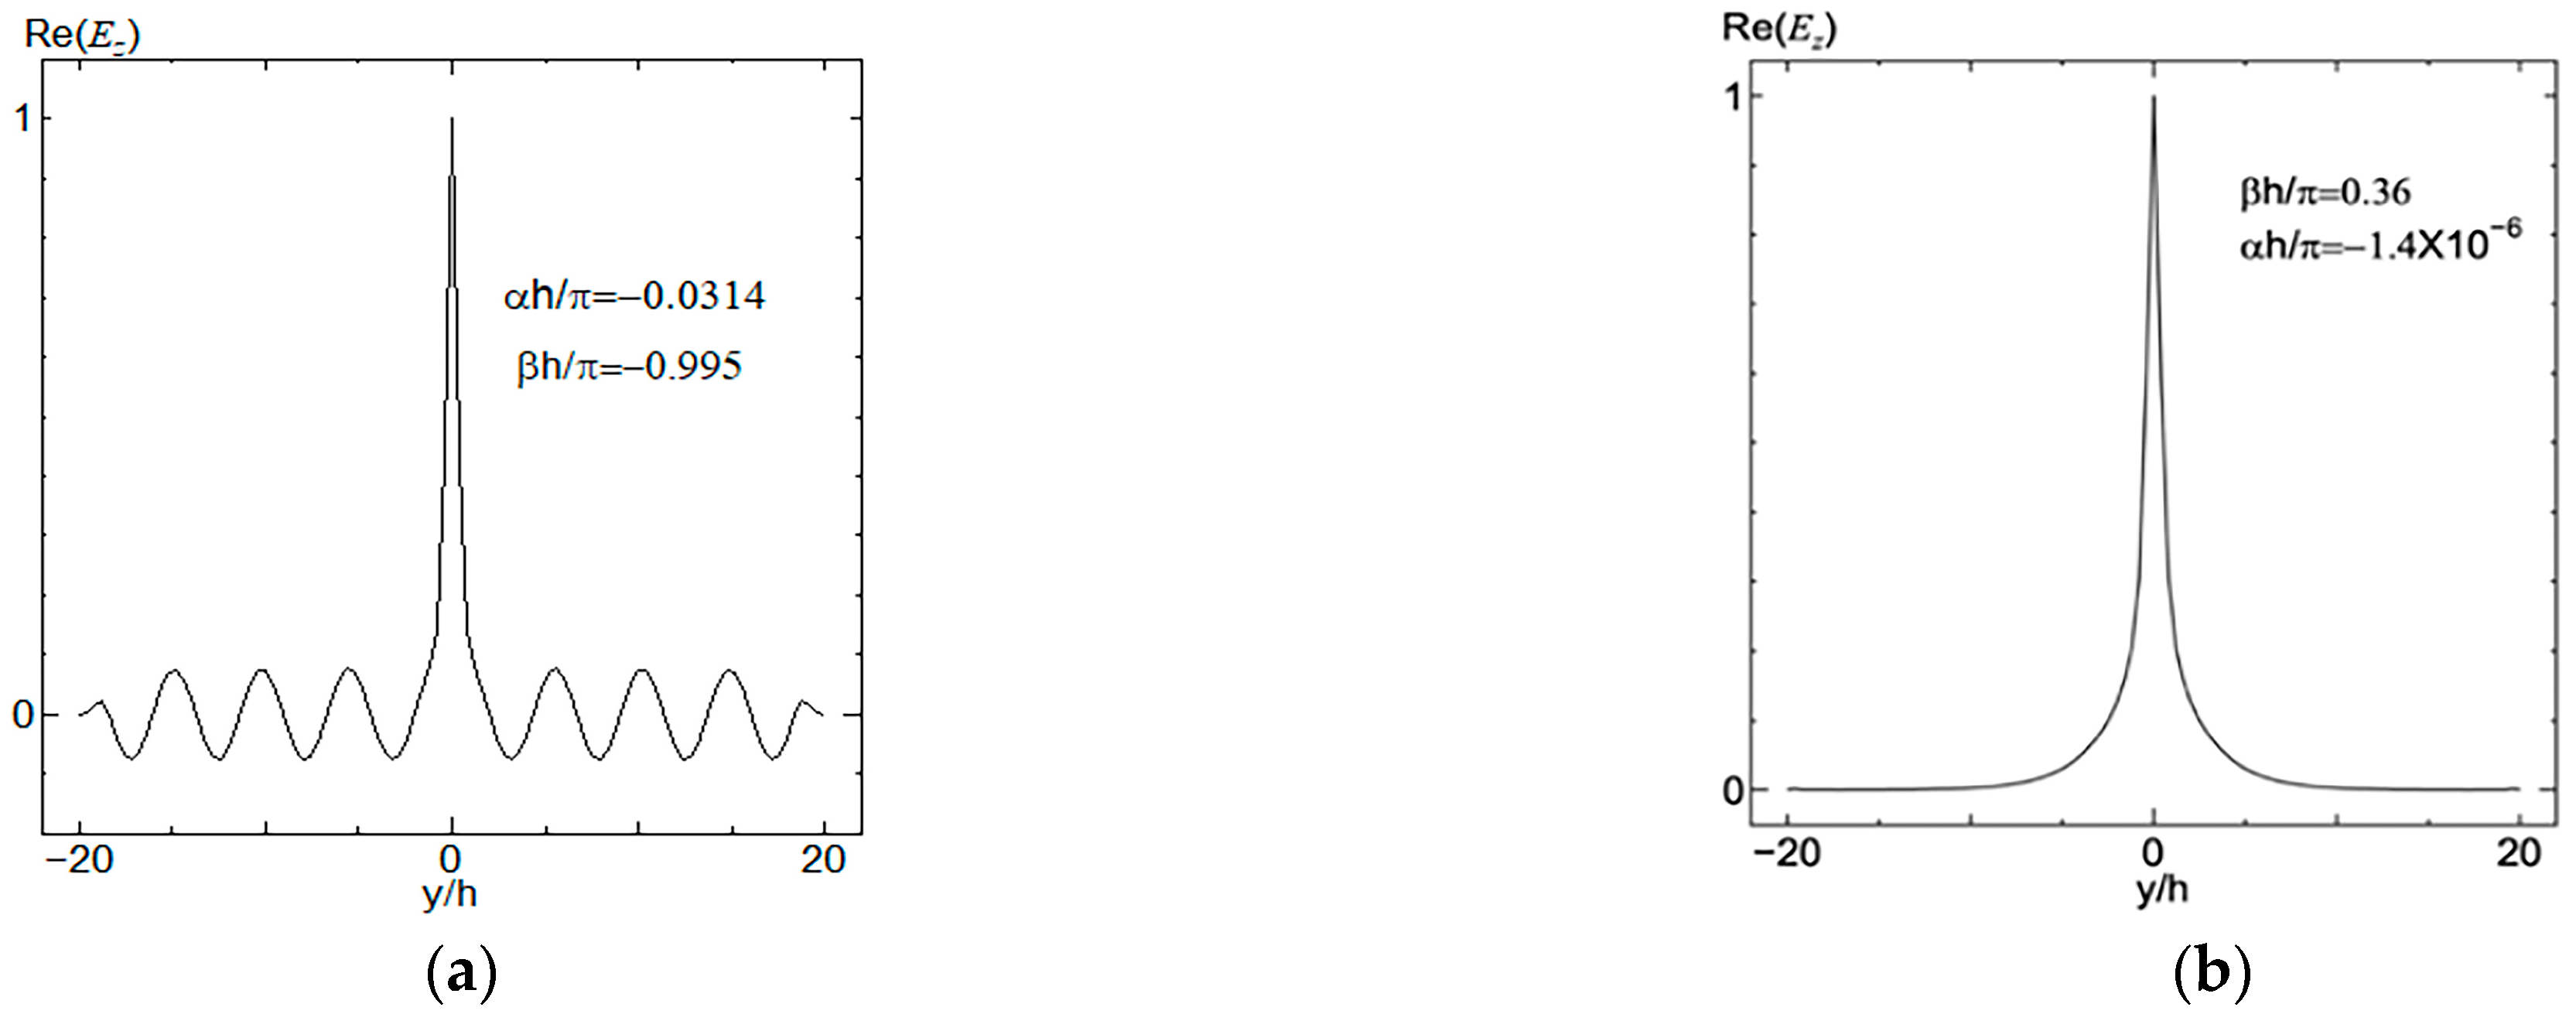
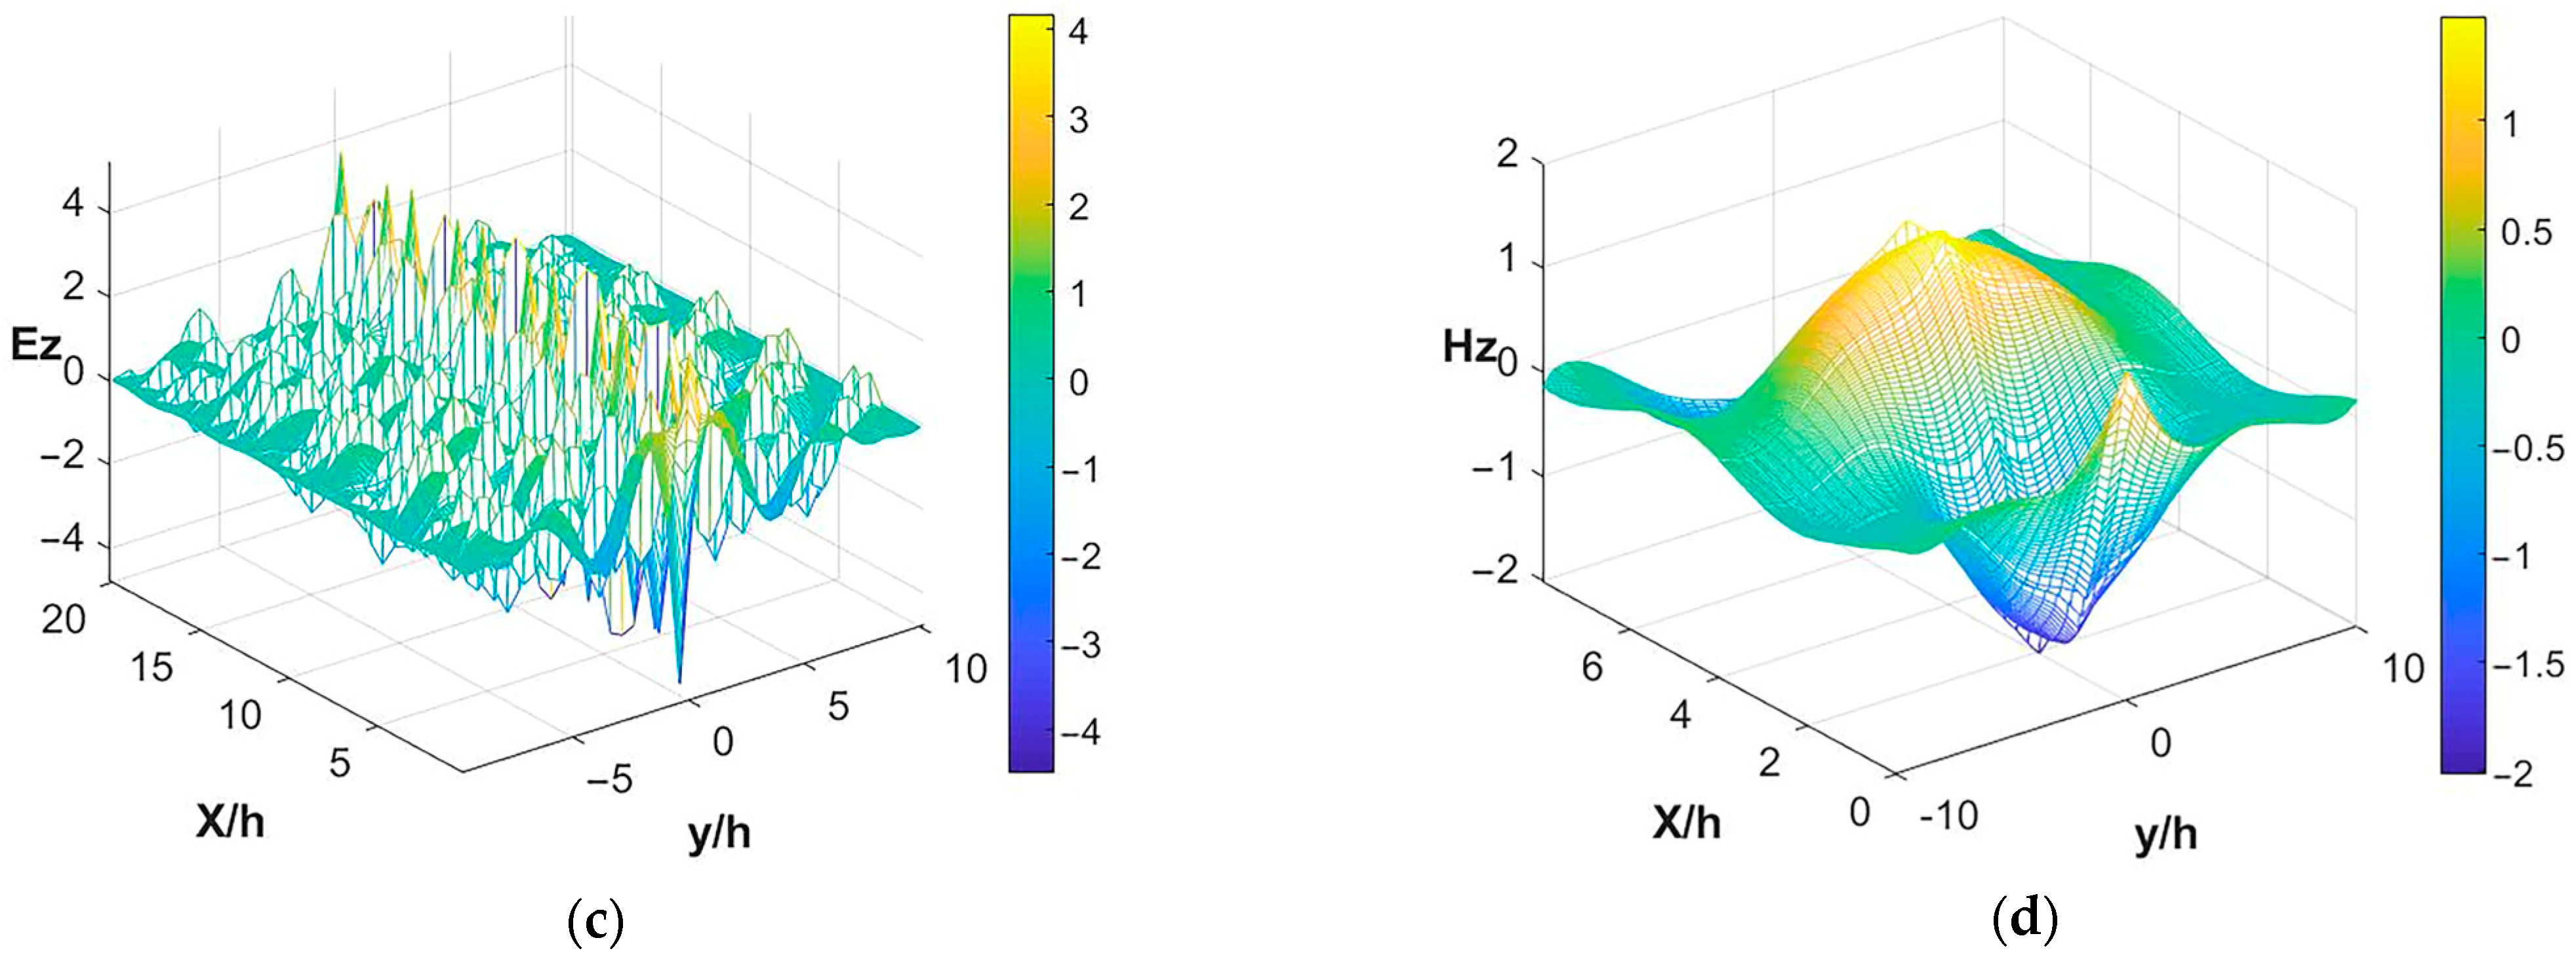
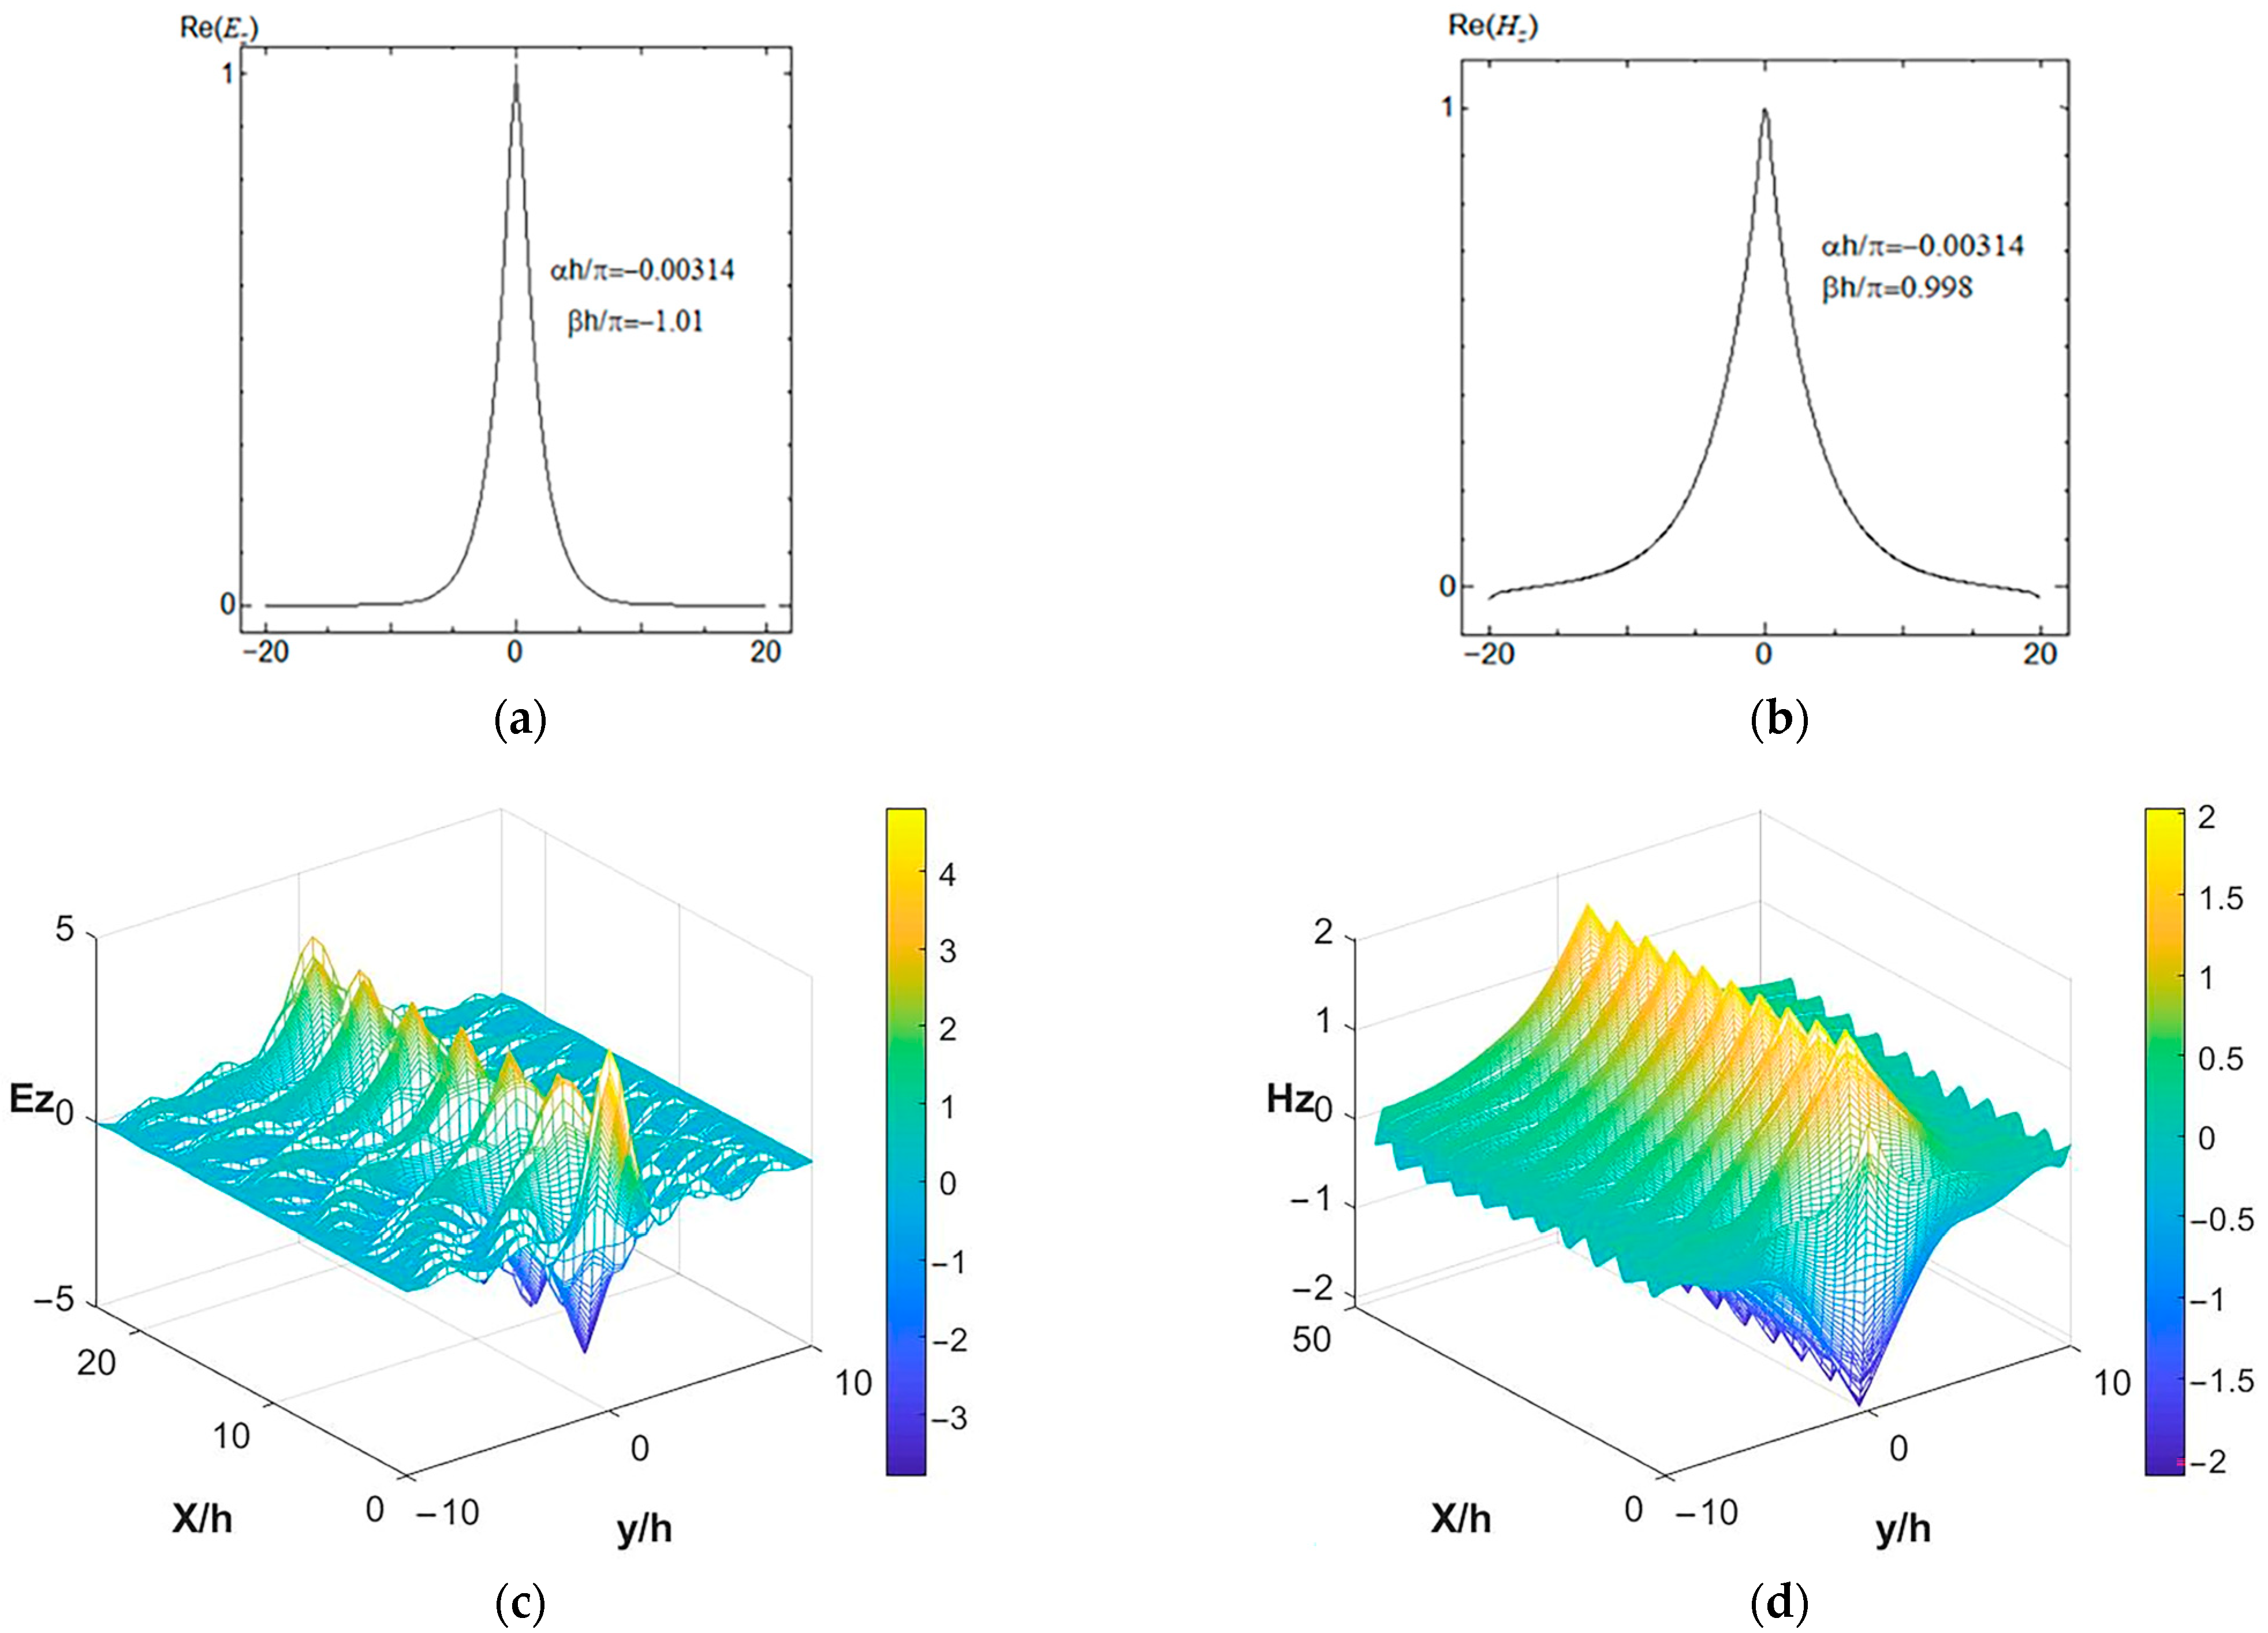
To better elucidate structural differences, physical properties were investigated. Taking the frequency point h/λ
0 = 0.3 as an example, modes E and H were studied. When h/λ
0 = 0.3 and
r =0.4
h, the continuous decay of the E system was large (
Figure 6c), and the decay constant of mode H was extremely small (
Figure 6d). At this time, mode E comprised an even mode and leakage mode (
Figure 6a), with mode H comprising a single mode. A waveguide mode is shown in
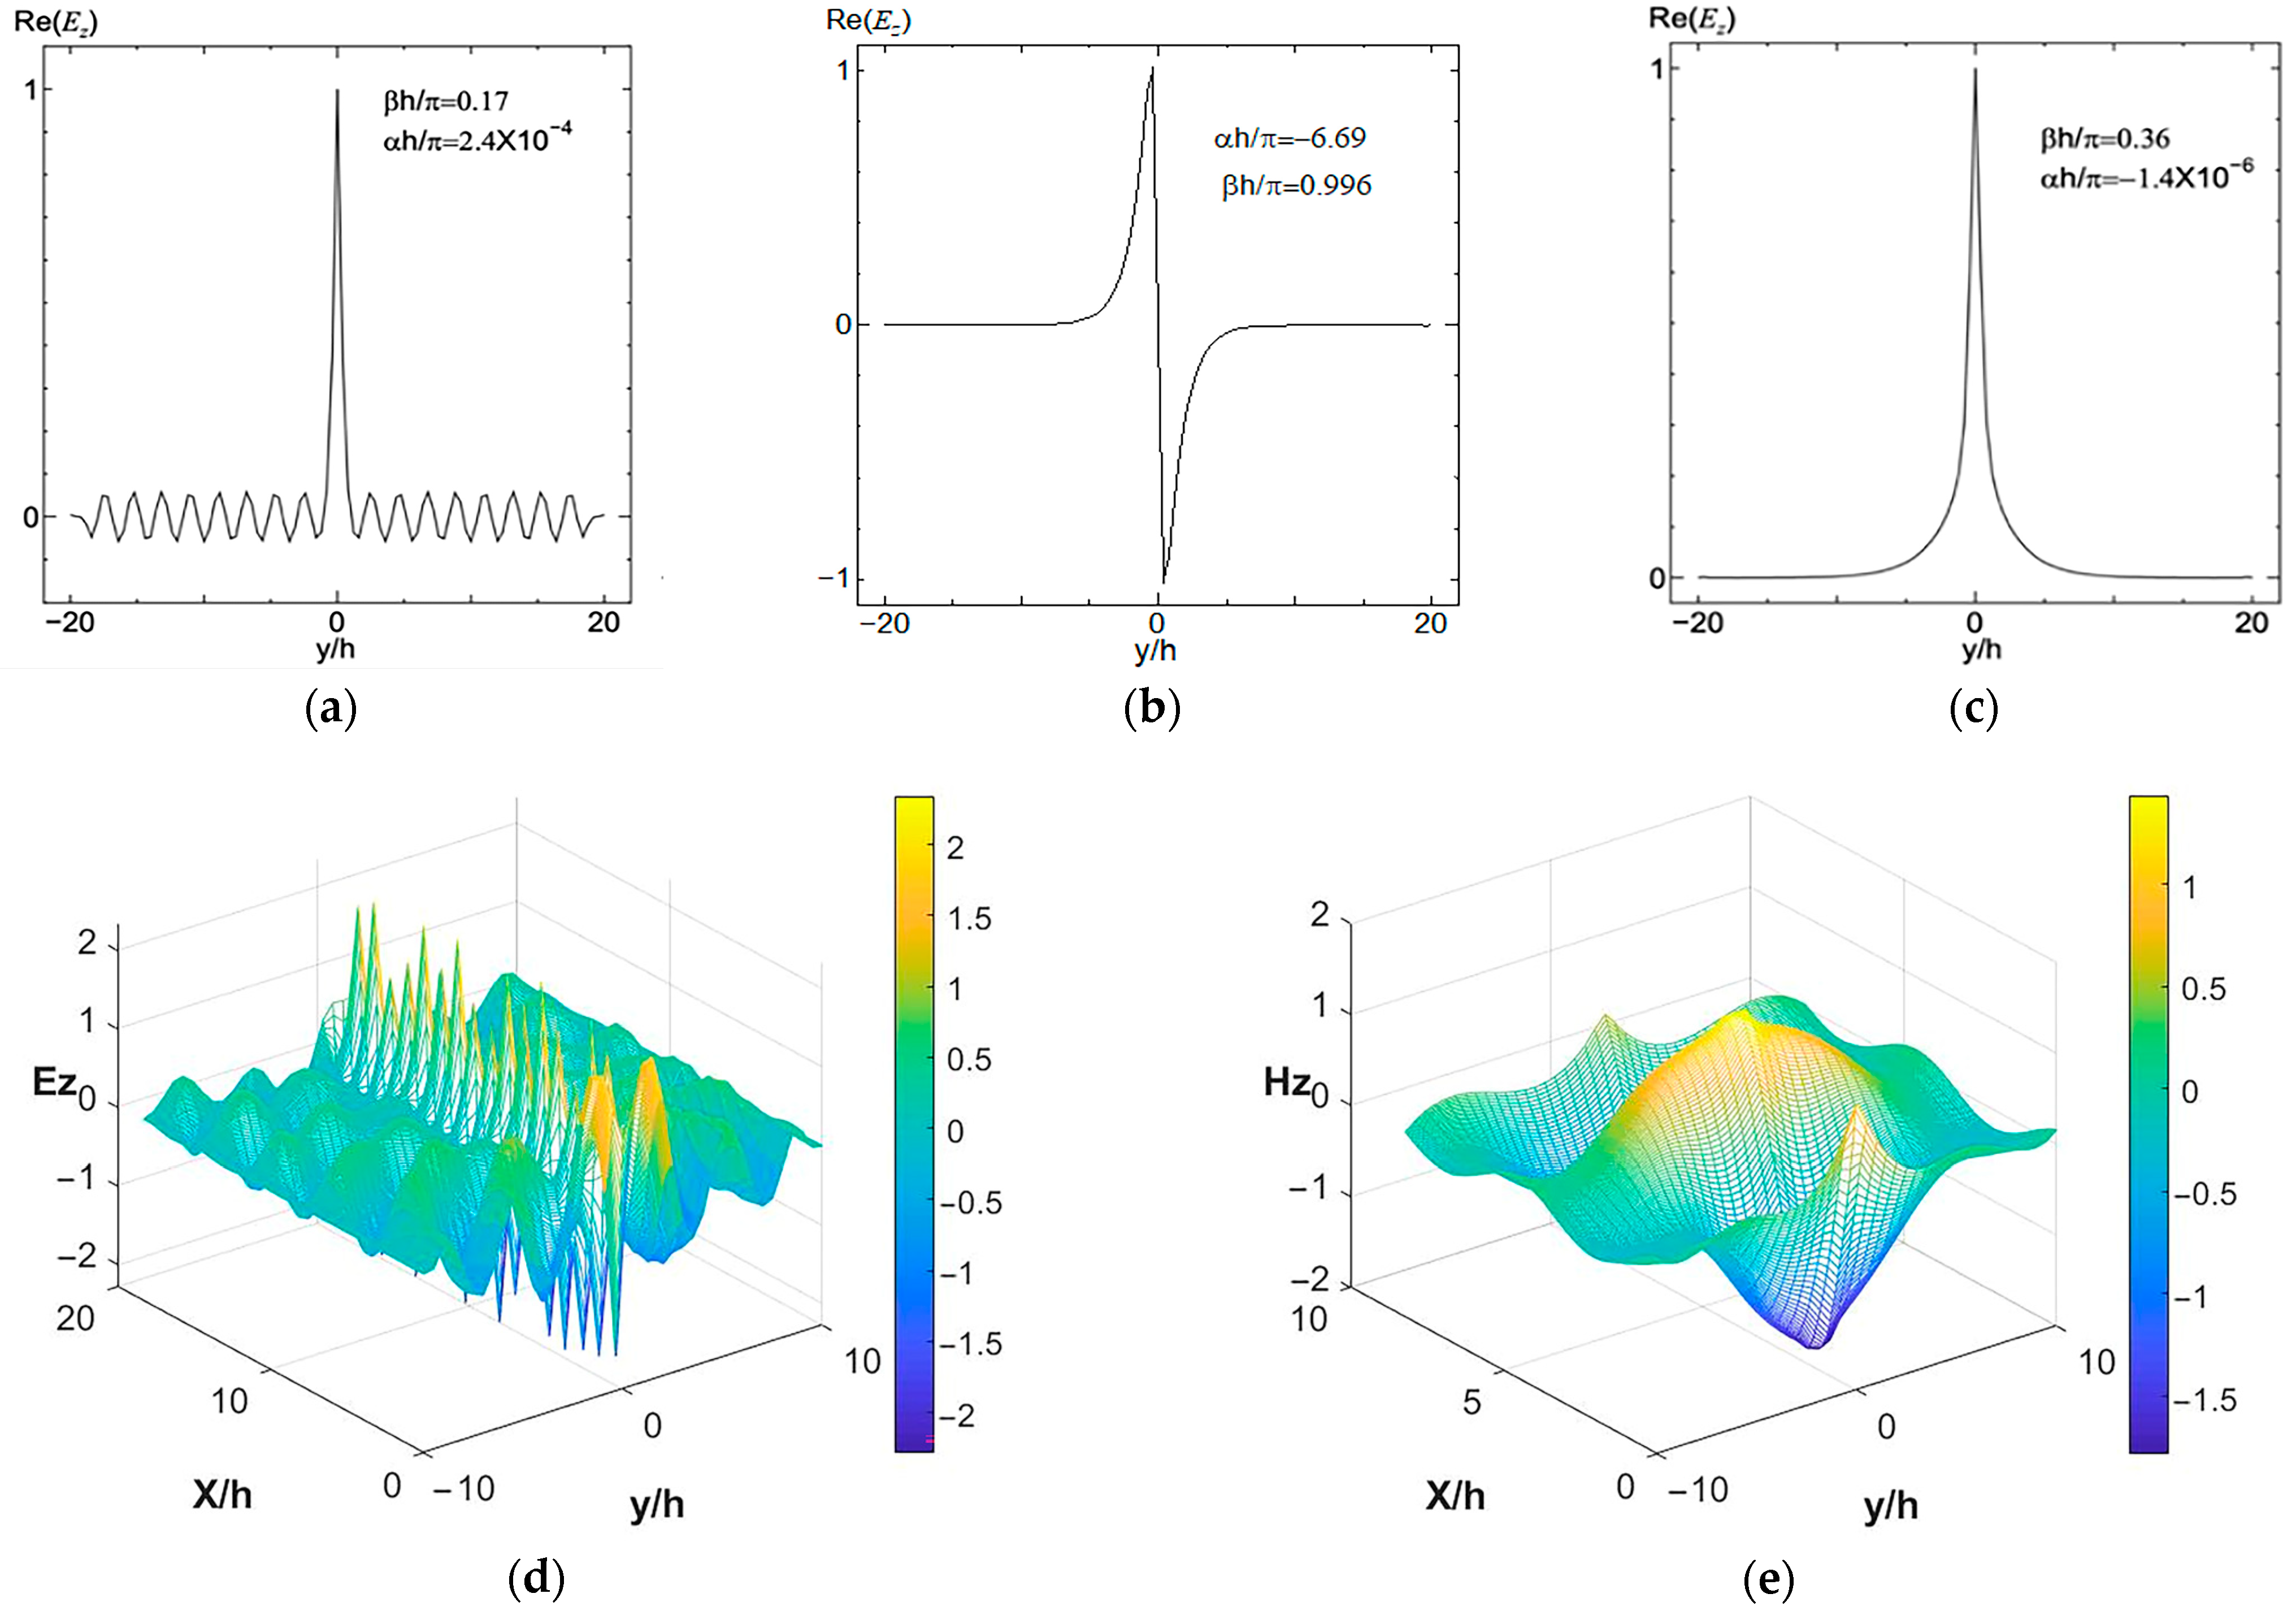
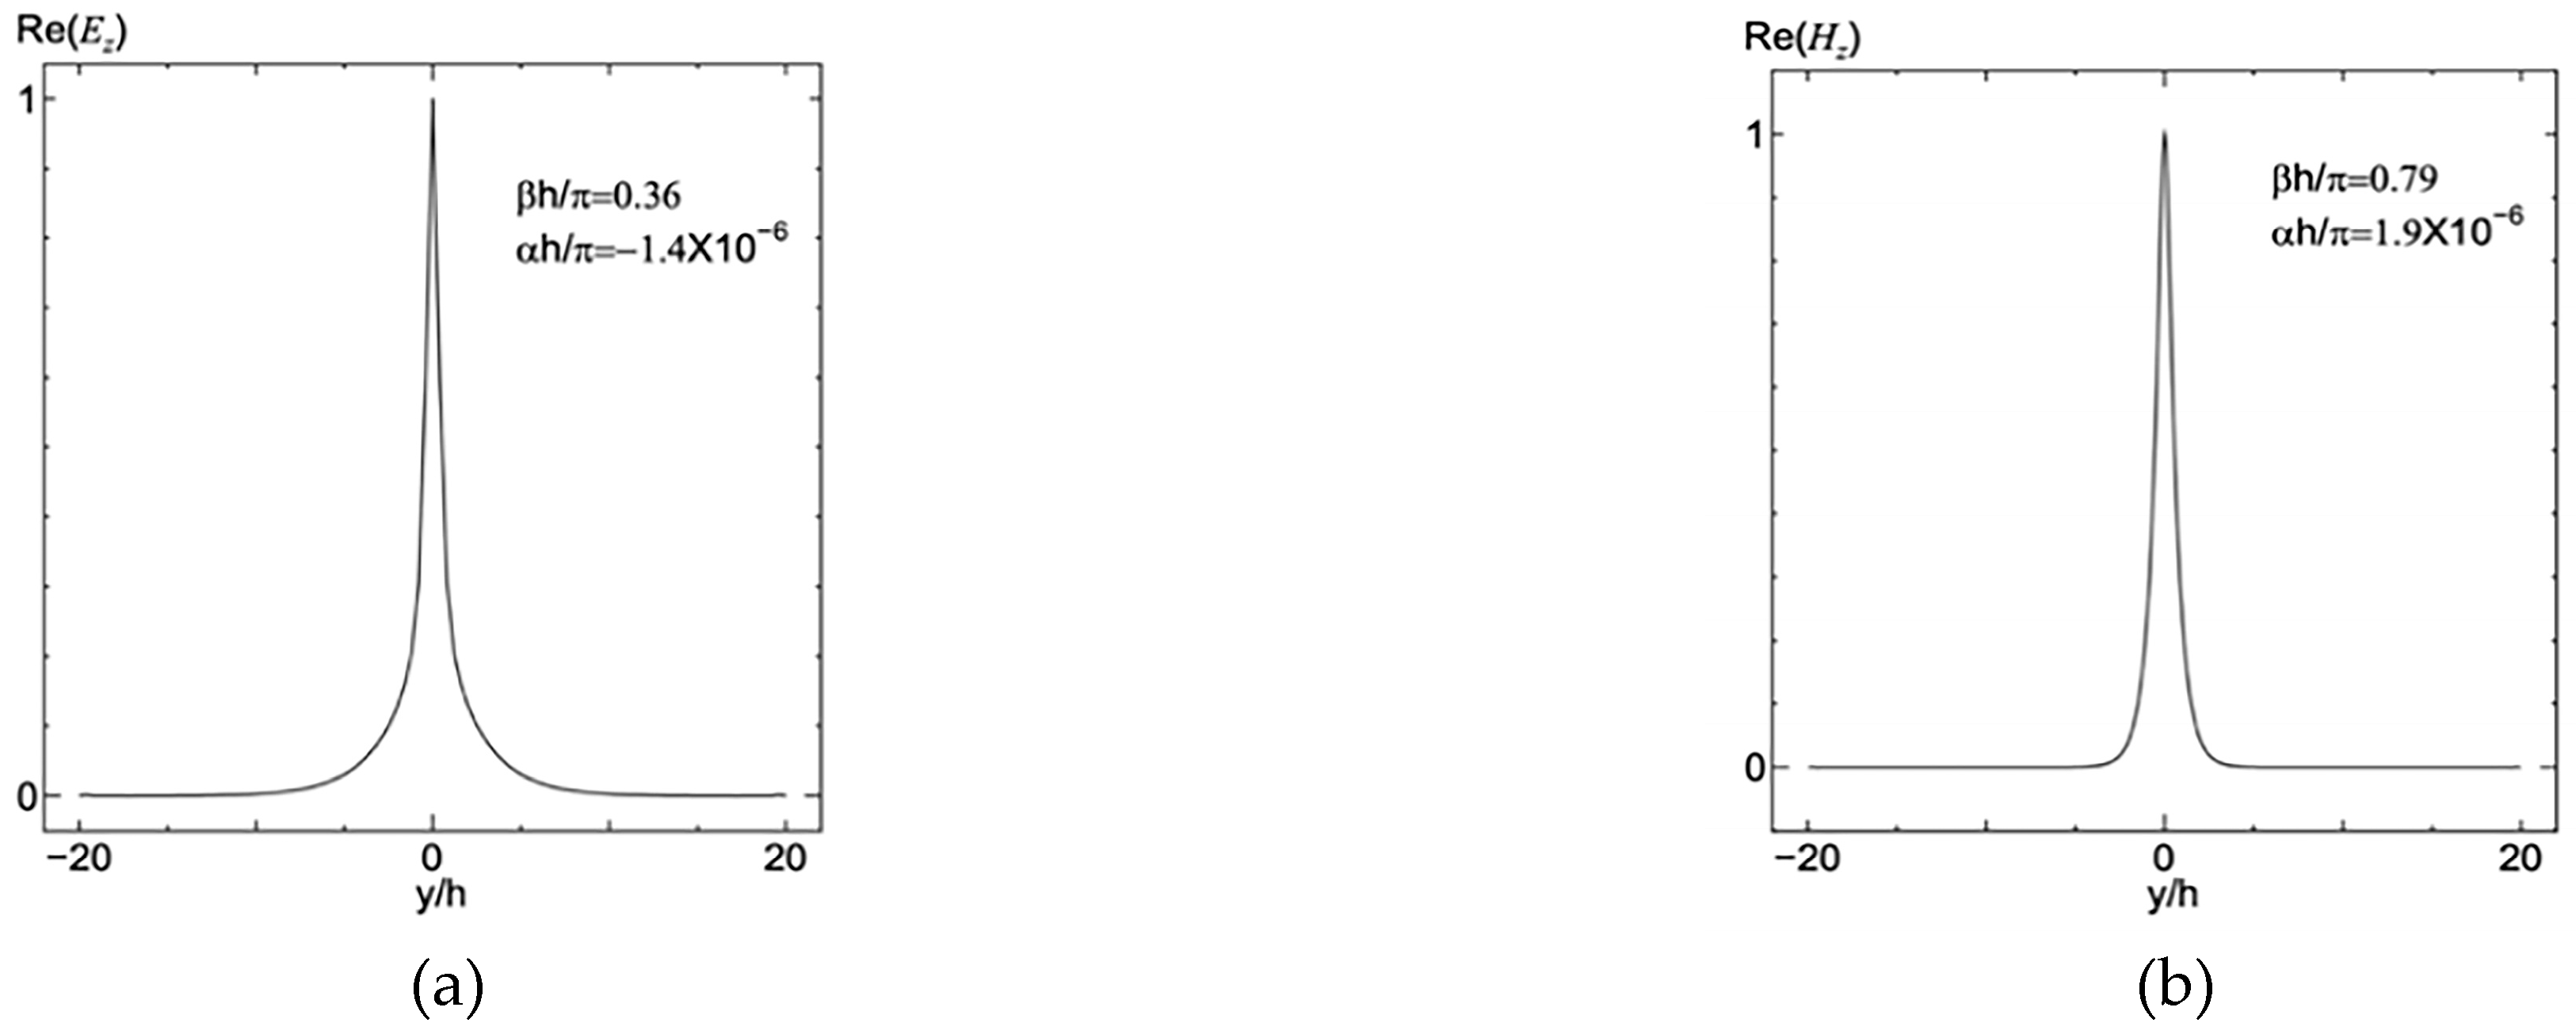
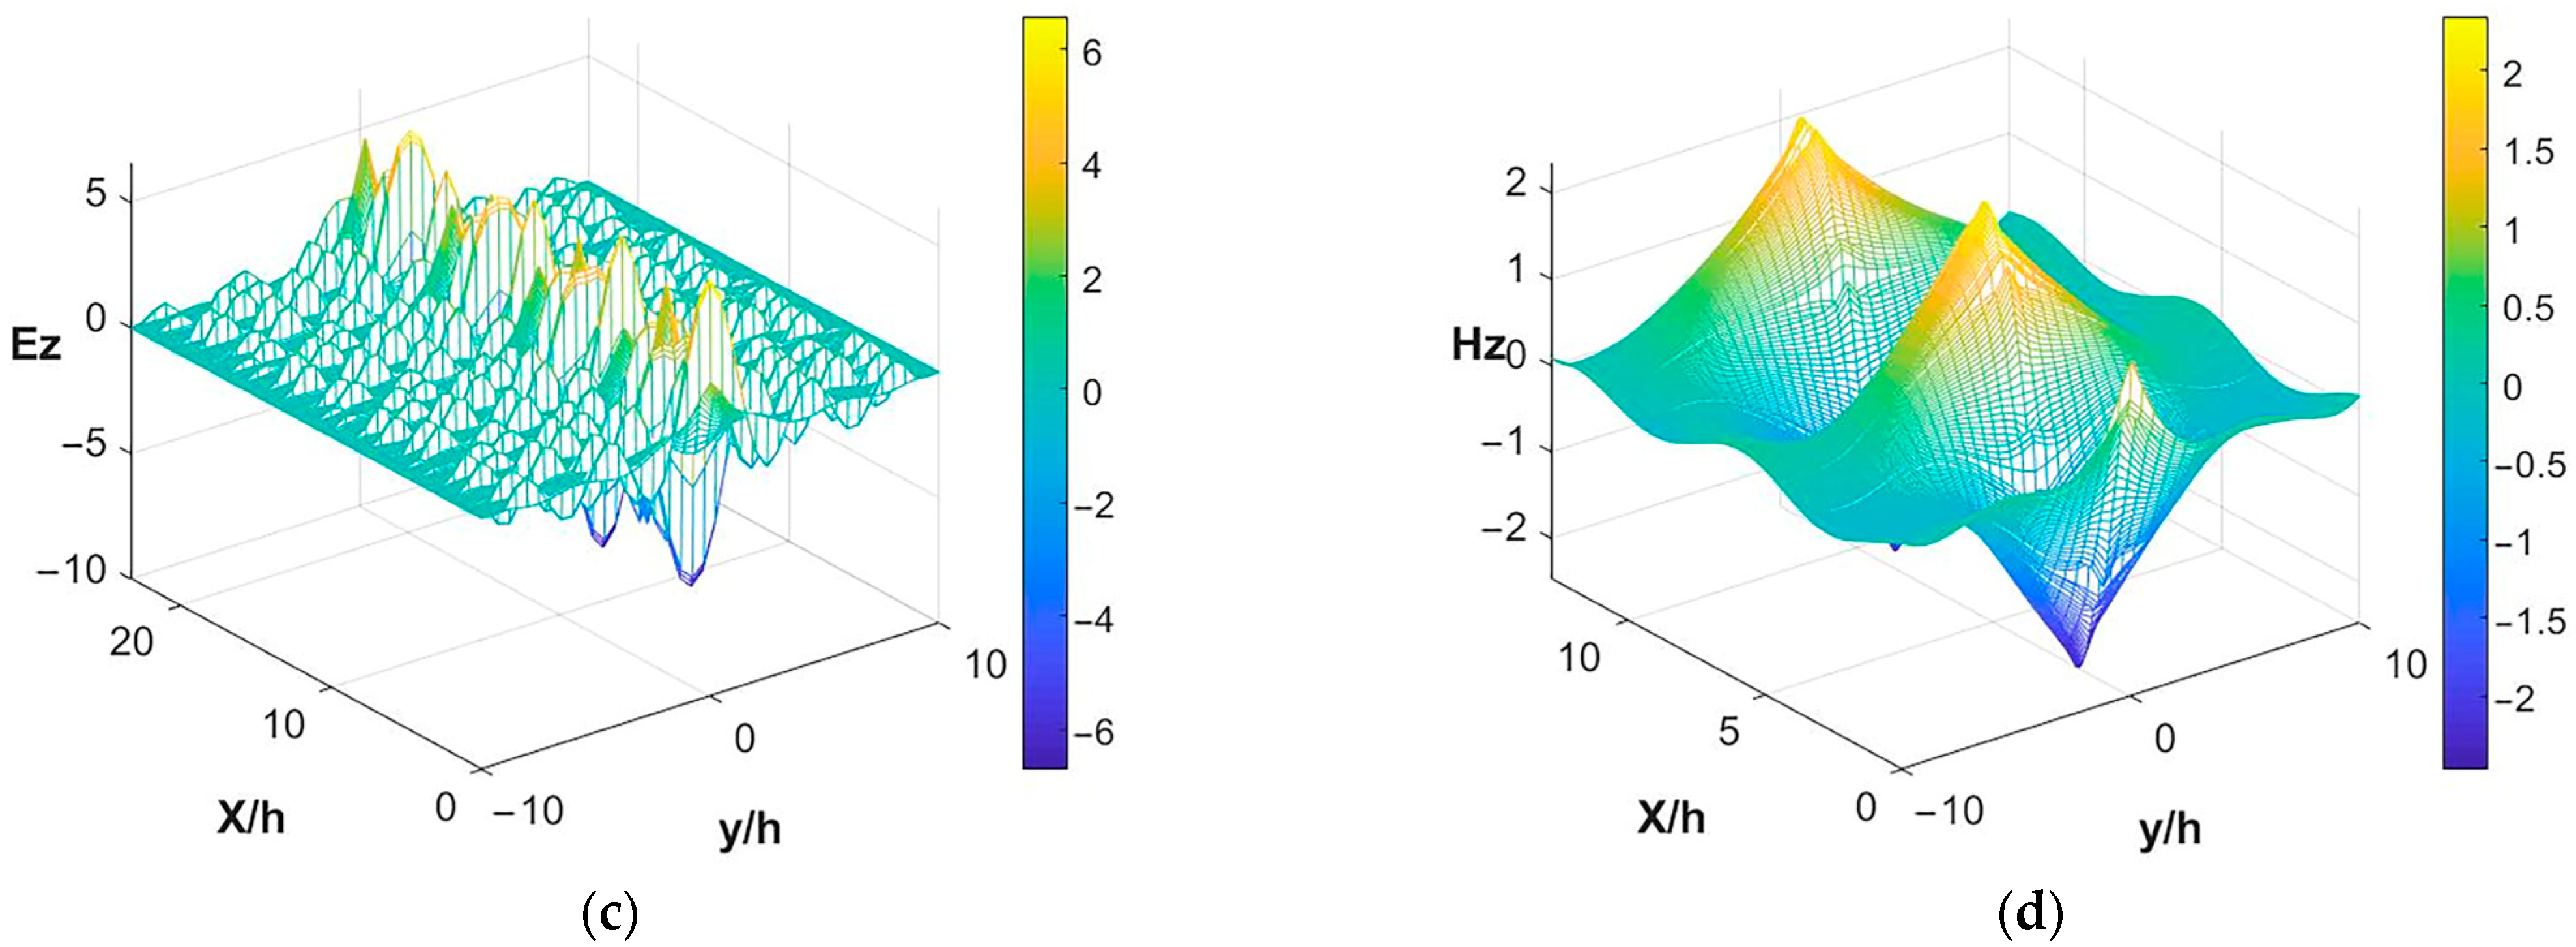
Figure 6b. With h/λ
0 = 0.3 and
r =0.45
h, there was an even illumination and leakage mode (
Figure 7a), an odd mode and waveguide mode (
Figure 7b), and mode H with a single mode and waveguide mode (
Figure 7c). When h/λ
0 = 0.3 and the dielectric constant 2, mode E was a single mode (
Figure 8a), as was the waveguide mode, while mode H was also a single mode (
Figure 8b). When h/λ
0 = 0.3 and the dielectric constant was 4, mode E remained a single mode (
Figure 9a), and similarly, the waveguide mode and mode H were also single modes (
Figure 9b).


