Article

Route Optimization and Scheduling for Asymmetric Micromobility-Based Logistics

1
Institute of Logistics, University of Miskolc, 3515 Miskolc, Hungary
2
Institute of Technical Sciences, State University of Applied Sciences in Przemyśl, 37-700 Przemyśl, Poland
*
Author to whom correspondence should be addressed.
Symmetry 2025, 17(4), 547; https://doi.org/10.3390/sym17040547
Submission received: 25 February 2025 / Revised: 28 March 2025 / Accepted: 31 March 2025 / Published: 3 April 2025
(This article belongs to the Special Issue Symmetry/Asymmetry in Operations Research)

Abstract

:
The optimization of asymmetric transportation problems is a critical challenge in modern logistics, where the complexity of the operational environment significantly influences efficiency. In first-mile and last-mile logistics operations, strategic optimization plays a crucial role in enhancing transportation efficiency. This article explores advanced optimization techniques that improve decision-making in such scenarios. By utilizing mathematical modeling and heuristic algorithms, transportation routes and schedules can be refined to minimize costs and enhance overall performance. The study demonstrates the potential of this approach through a case study focusing on asymmetric transportation problems using micromobility devices in an integrated first-mile/last-mile delivery network. Numerical results from optimization using heuristic solution methods show that the novel approach is suitable to optimize micromobility-based integrated first-mile and las-mile delivery tasks. We examine a network of eight restaurants located in downtown Miskolc, Hungary. To compare the optimized solution with a traditional one, we looked at the total distance in shuttle-based services, which was 121.65 km, with our solution covering 44.55% of the delivery. This led to a 19% improvement in the use of micromobility devices when demand and supply were synchronized. The findings indicate significant improvements in cost-effectiveness, delivery times, and resource utilization, highlighting the importance of structured optimization frameworks in complex logistics networks.

1. Introduction

Micromobility has emerged as a transformative solution in urban transportation, offering efficient, flexible, and sustainable alternatives to traditional vehicles. With its wide range of applications, from e-scooters to e-bikes, micromobility serves different sectors, including daily commuting, logistics, and shared mobility services. In densely populated areas, micromobility is particularly beneficial as it reduces the need for large trucks to navigate crowded streets [1]. This is especially crucial when small, time-sensitive deliveries must be made over short distances. By leveraging compact vehicles, cities can reduce traffic, lower emissions, and improve overall urban mobility. The growing demand for quicker, more sustainable delivery options further highlights the importance of integrating micromobility into modern urban systems, especially in areas where space is limited and efficiency is important.
Moreover, micromobility offers a viable solution for last-mile connectivity, bridging gaps in public transportation networks. It enables a smoother transition between different modes of transport, increasing the accessibility and efficiency of urban transit systems. Beyond transportation, micromobility can have significant environmental benefits by promoting energy-efficient alternatives to fossil fuel-powered vehicles. The convenience of micromobility also makes it an appealing choice for the urban population seeking an alternative to crowded public transport or costly private car ownership [2]. As urban populations continue to grow, the integration of micromobility will become even more important in ensuring that cities remain sustainable, efficient, and livable. The potential for micromobility to improve urban logistics, especially in terms of reducing delivery times and enhancing supply chain flexibility, cannot be understated. In this way, micromobility is not just a trend but a cornerstone of the future of urban mobility [3].
In this article, the authors examine how asymmetric transportation problems of micromobility-based material supply systems can be modeled in densely populated urban areas. This research aims to offer valuable insights into optimizing the flow of goods in urban environments, where traditional transportation solutions may not be viable. The article also explores the broader implications of applying micromobility in the context of sustainable urban logistics. The first part of the article provides a comprehensive literature review, offering an overview of the current state of research in the field of micromobility. It highlights significant findings, identifies key challenges, and uncovers research gaps that need to be addressed. The article’s contribution is a novel approach which makes it possible to optimize micromobility-based integrated first-mile/last-mile delivery solutions.

2. Literature Review

Within the frame of this chapter, we are identifying research gaps with a systematic literature review. This section includes three subsections as follows: descriptive analysis of available articles, content analysis and the consequences, and research gap identification.

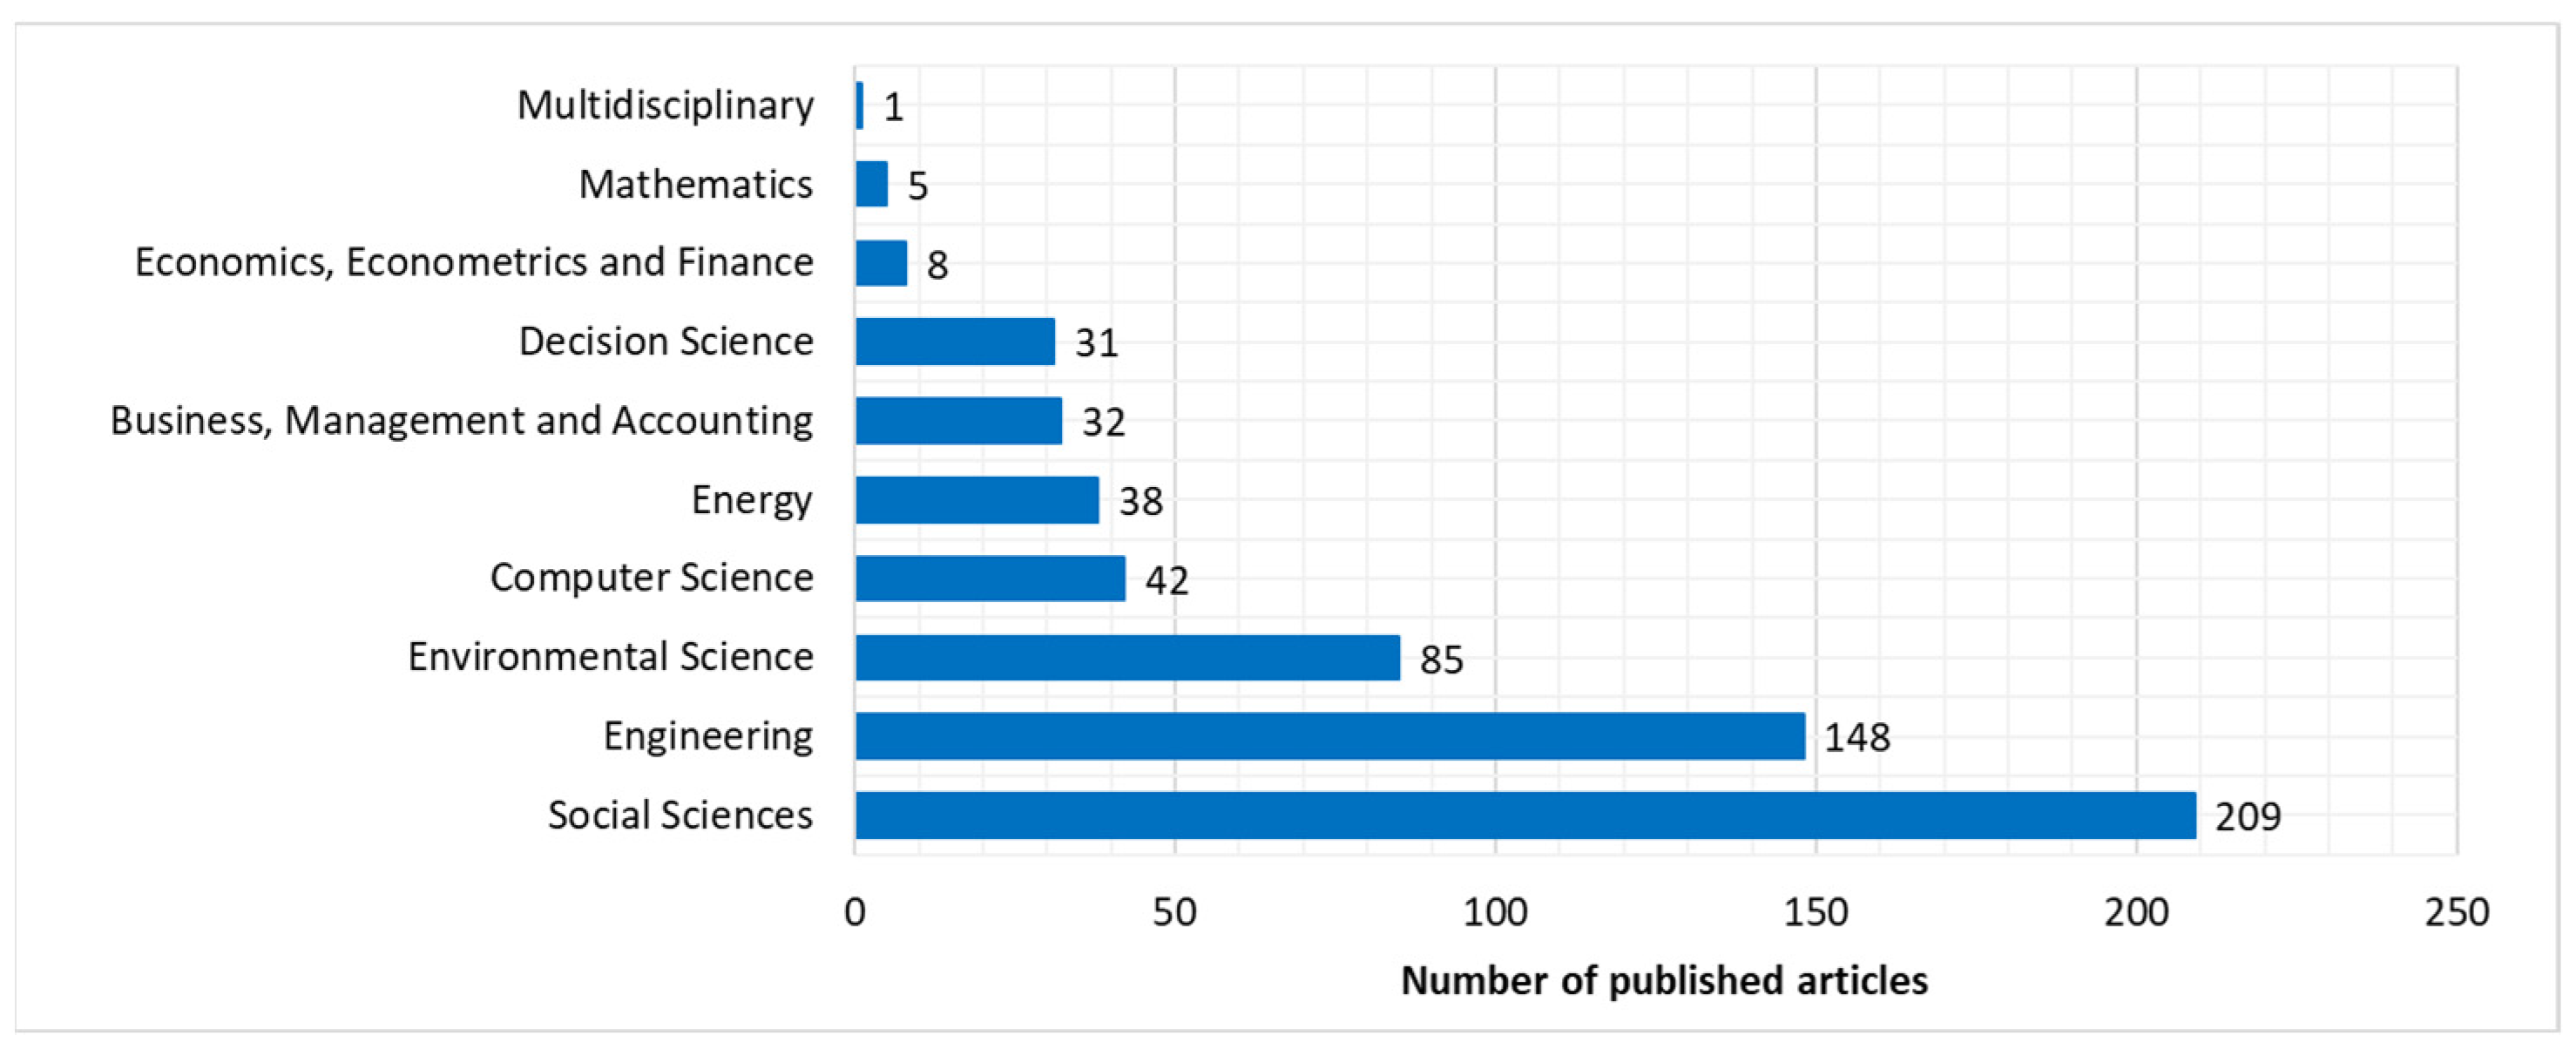
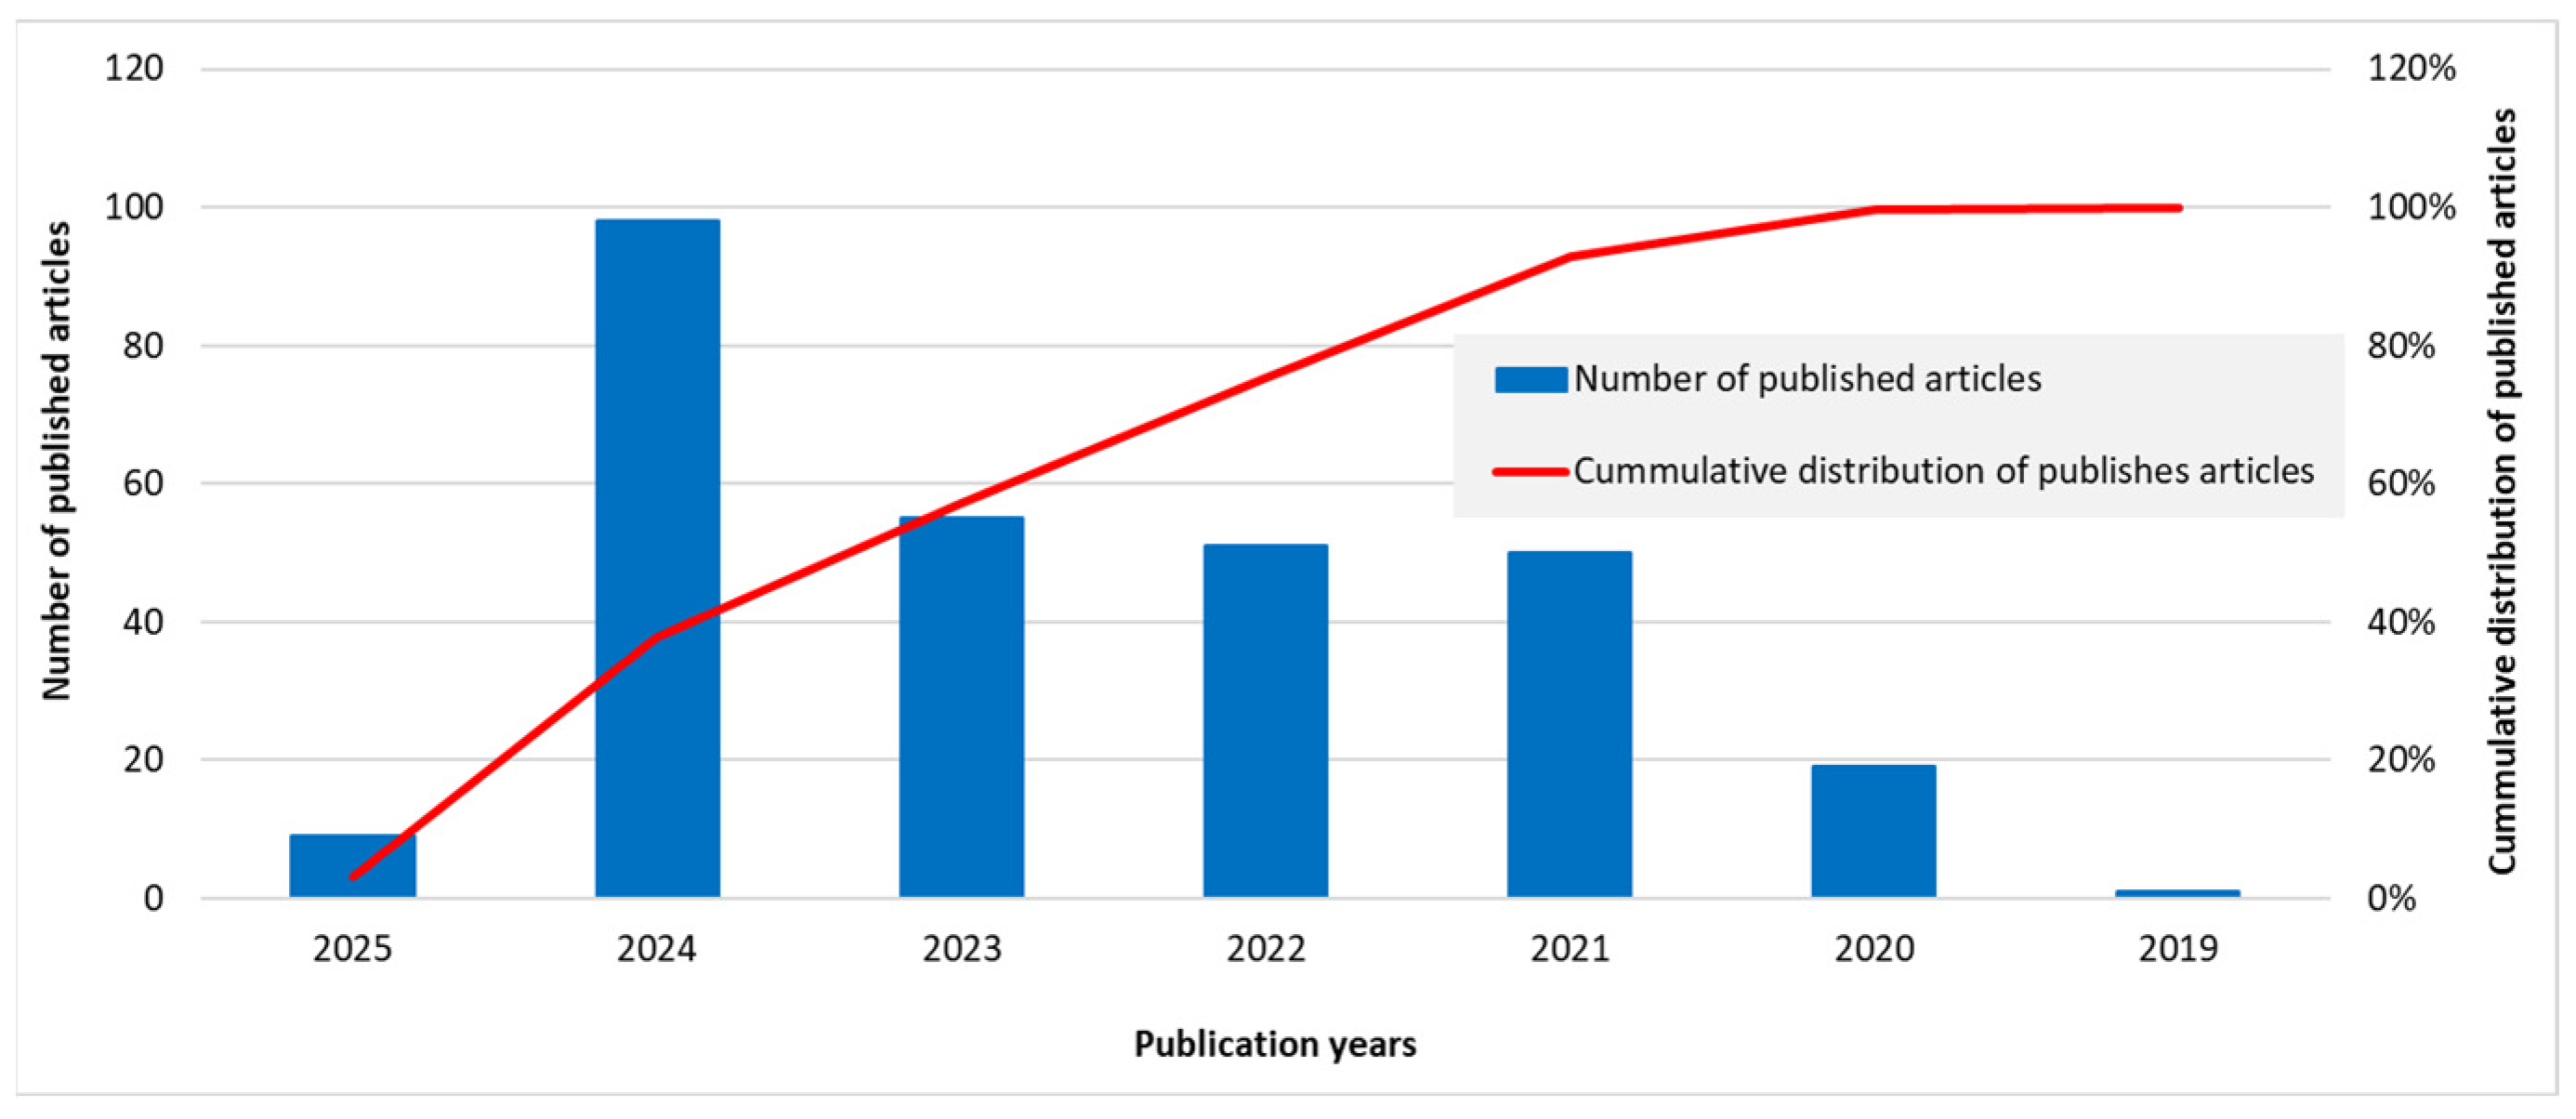
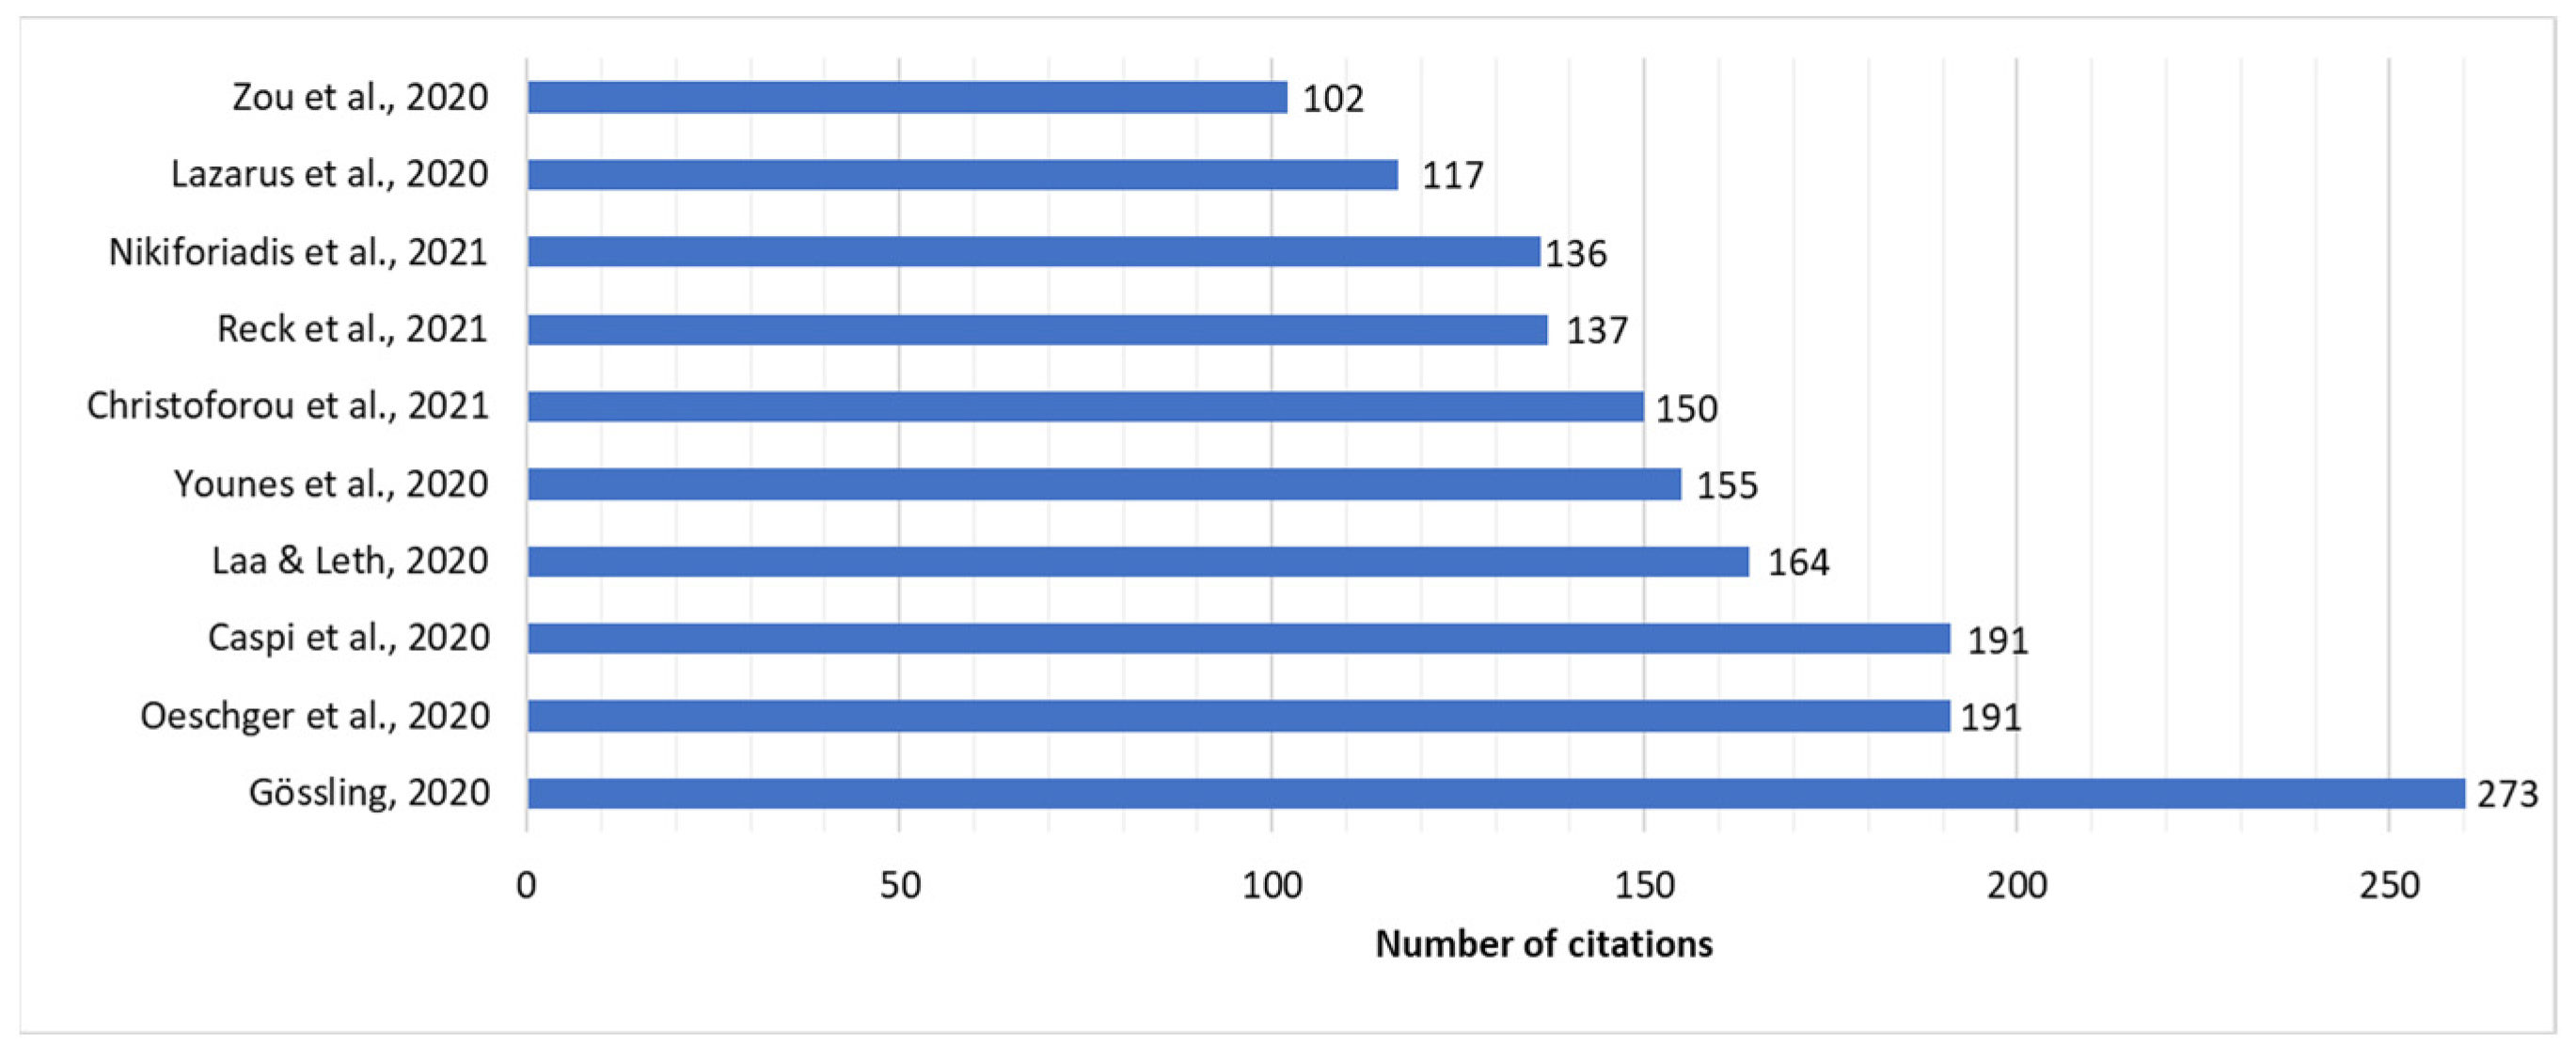
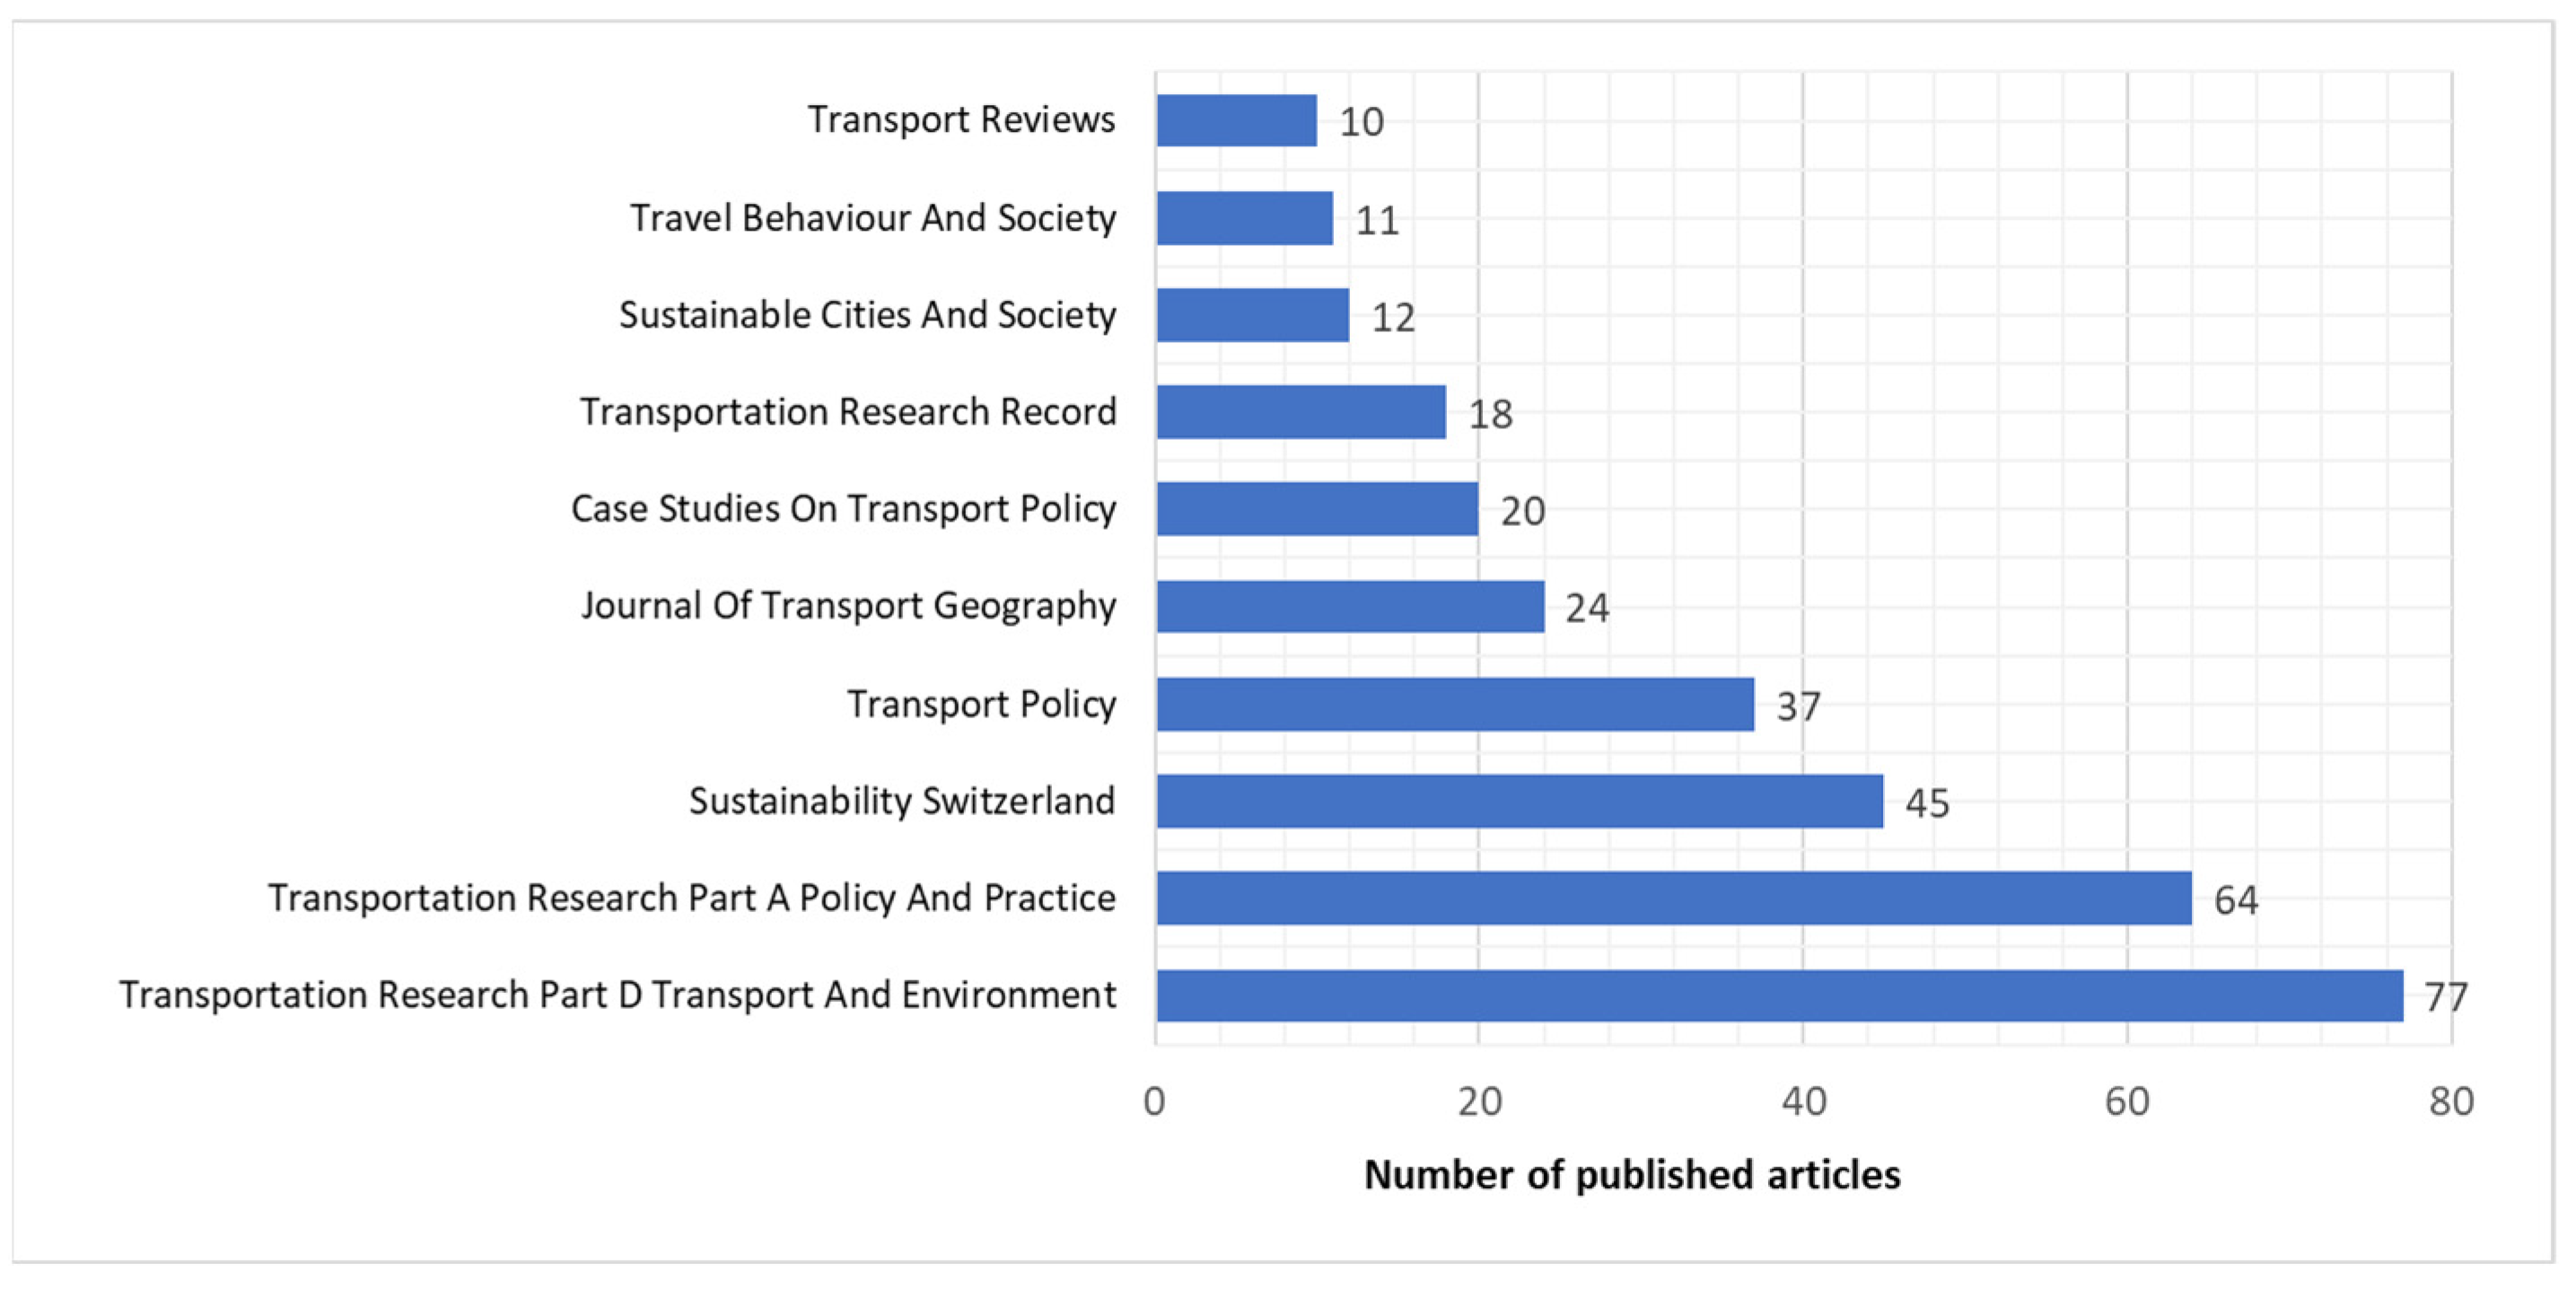
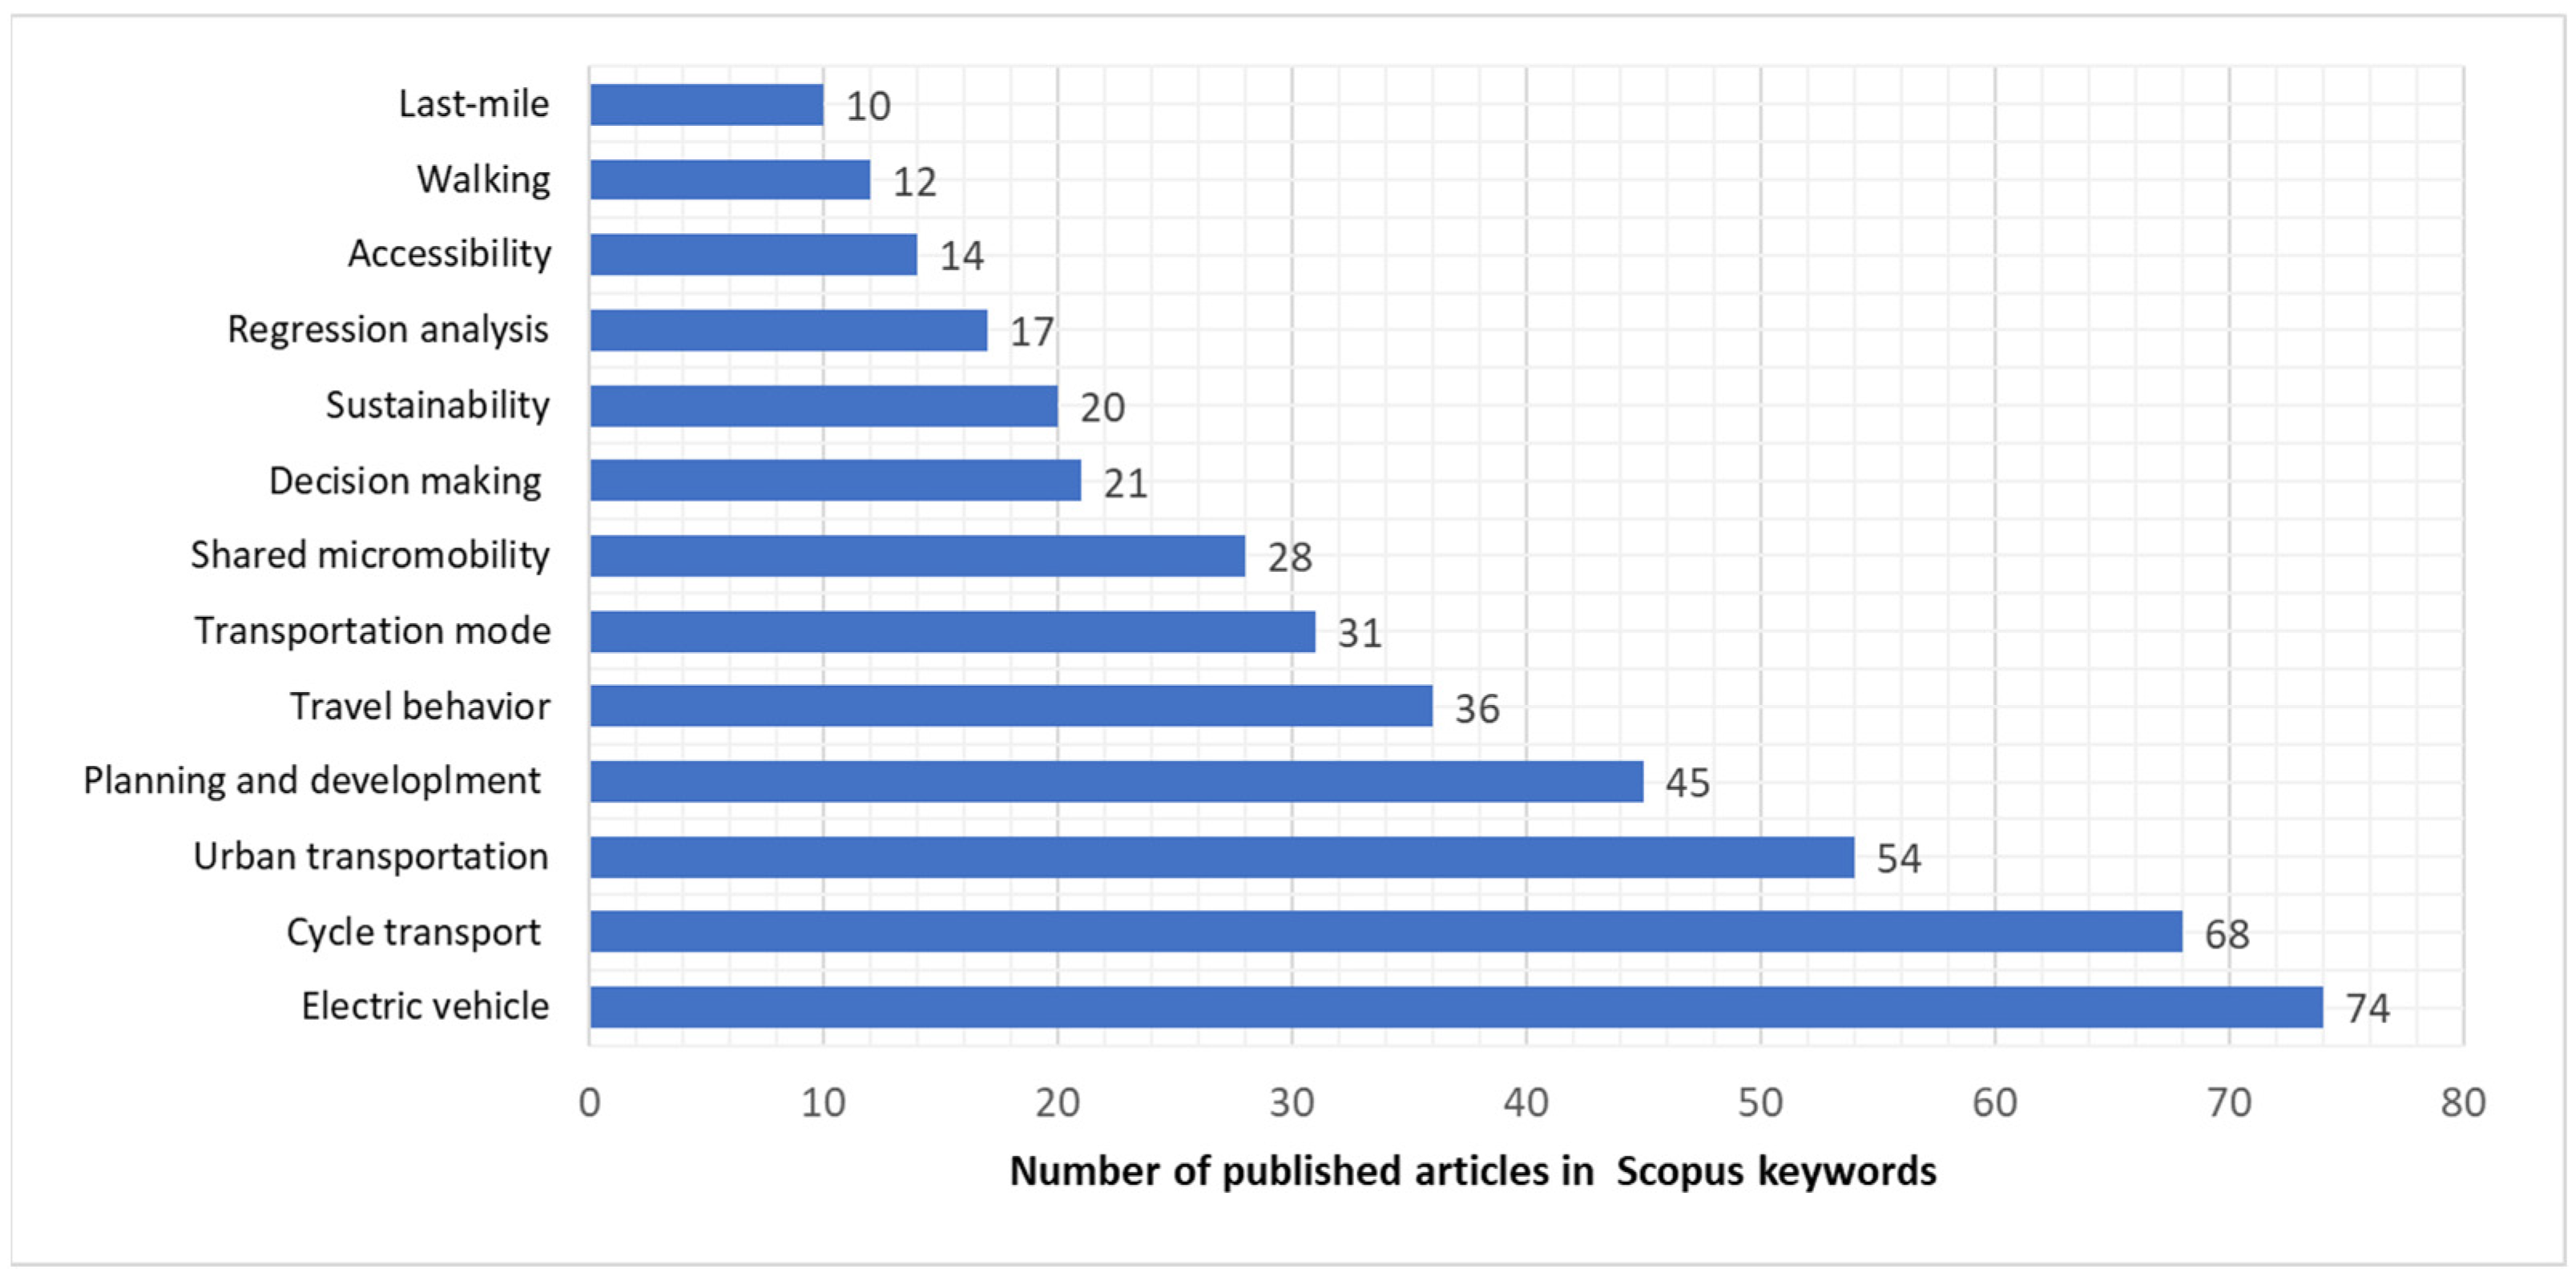
2.1. Descriptive Analysis of Available Research Results

As part of the systematic literature review, we carried out the following steps: defining the research questions, selecting sources from the Scopus, refining the list of articles by reading them and identifying their main topics, analyzing the selected articles, summarizing key scientific findings, and identifying research gaps and bottlenecks.
To search the Scopus database, we used the following keywords: “micromobility” AND “transportation”. It was important to add the keyword “transportation” to avoid the topic “micromobility protocols”. Initially, this search resulted in 429 articles. We then refined the selection using the following keywords: (TITLE-ABS-KEY (micromobility) AND TITLE-ABS-KEY (ransportation)) AND (LIMIT-TO (LANGUAGE, “English”)) AND (LIMIT-TO (DOCTYPE, “ar”)). We also included only journal articles published in English, reducing the total to 284 articles.
Our search was conducted in January 2025, so additional relevant articles may have been published since then.
The reduced articles can be classified depending on the research area. Figure 1 shows the classification of these 284 articles considering ten subject areas. This classification shows that the majority are on social sciences and engineering, whilst environmental science and energy highlight the increased sustainability aspects of micromobility and mathematics focuses on the optimization of micromobility-based transportation solutions.
As Figure 2 demonstrates, the research on micromobility solutions has been published in the past 5 years. The number of published papers has increased in recent years which shows the importance of this research field.
The articles were analyzed from a scientific impact point of view. The most usual form to evaluate articles from the scientific impact point of view is the number of citations. Figure 3 shows the ten most cited articles with their number of citations.
As Figure 4 demonstrates, most of the articles were published in journals with transportation topics, but a significant number of the papers were accepted for publication in journals focusing on sustainability, policy, social sciences and society, and safety. The distribution of journals shows that the design and operation problems of micromobility solutions are multidisciplinary problems.
We have analyzed the published articles from the Scopus keywords point of view. We have analyzed the distribution of articles in the following categories: micromobility, electric vehicle, cycle transport, urban transportation, public transport, e-scooter, bicycles, travel behavior, transportation policy, shared micromobility, decision-making, sustainable development, transportation safety, regression analysis, travel demand, sustainability, spatial analysis, mass transportation, environmental impact, accessibility, urban area, travel time, spatio-temporal analysis, land use, transportation equity, pedestrian, mode choice, last mile, machine learning, social mobility, and sensitivity analysis. Figure 5 depicts the distribution of the categories. As the categories show, the design and operation of micromobility-based transportation solutions is based on multidisciplinarity, where policy making, optimization, transportation technology, organization, safety, and environmental impact are integrated.
In the following step, the 284 articles were reduced after reading them. We excluded articles whose topic did not fit our interest and did not address the optimization of micromobility solutions.

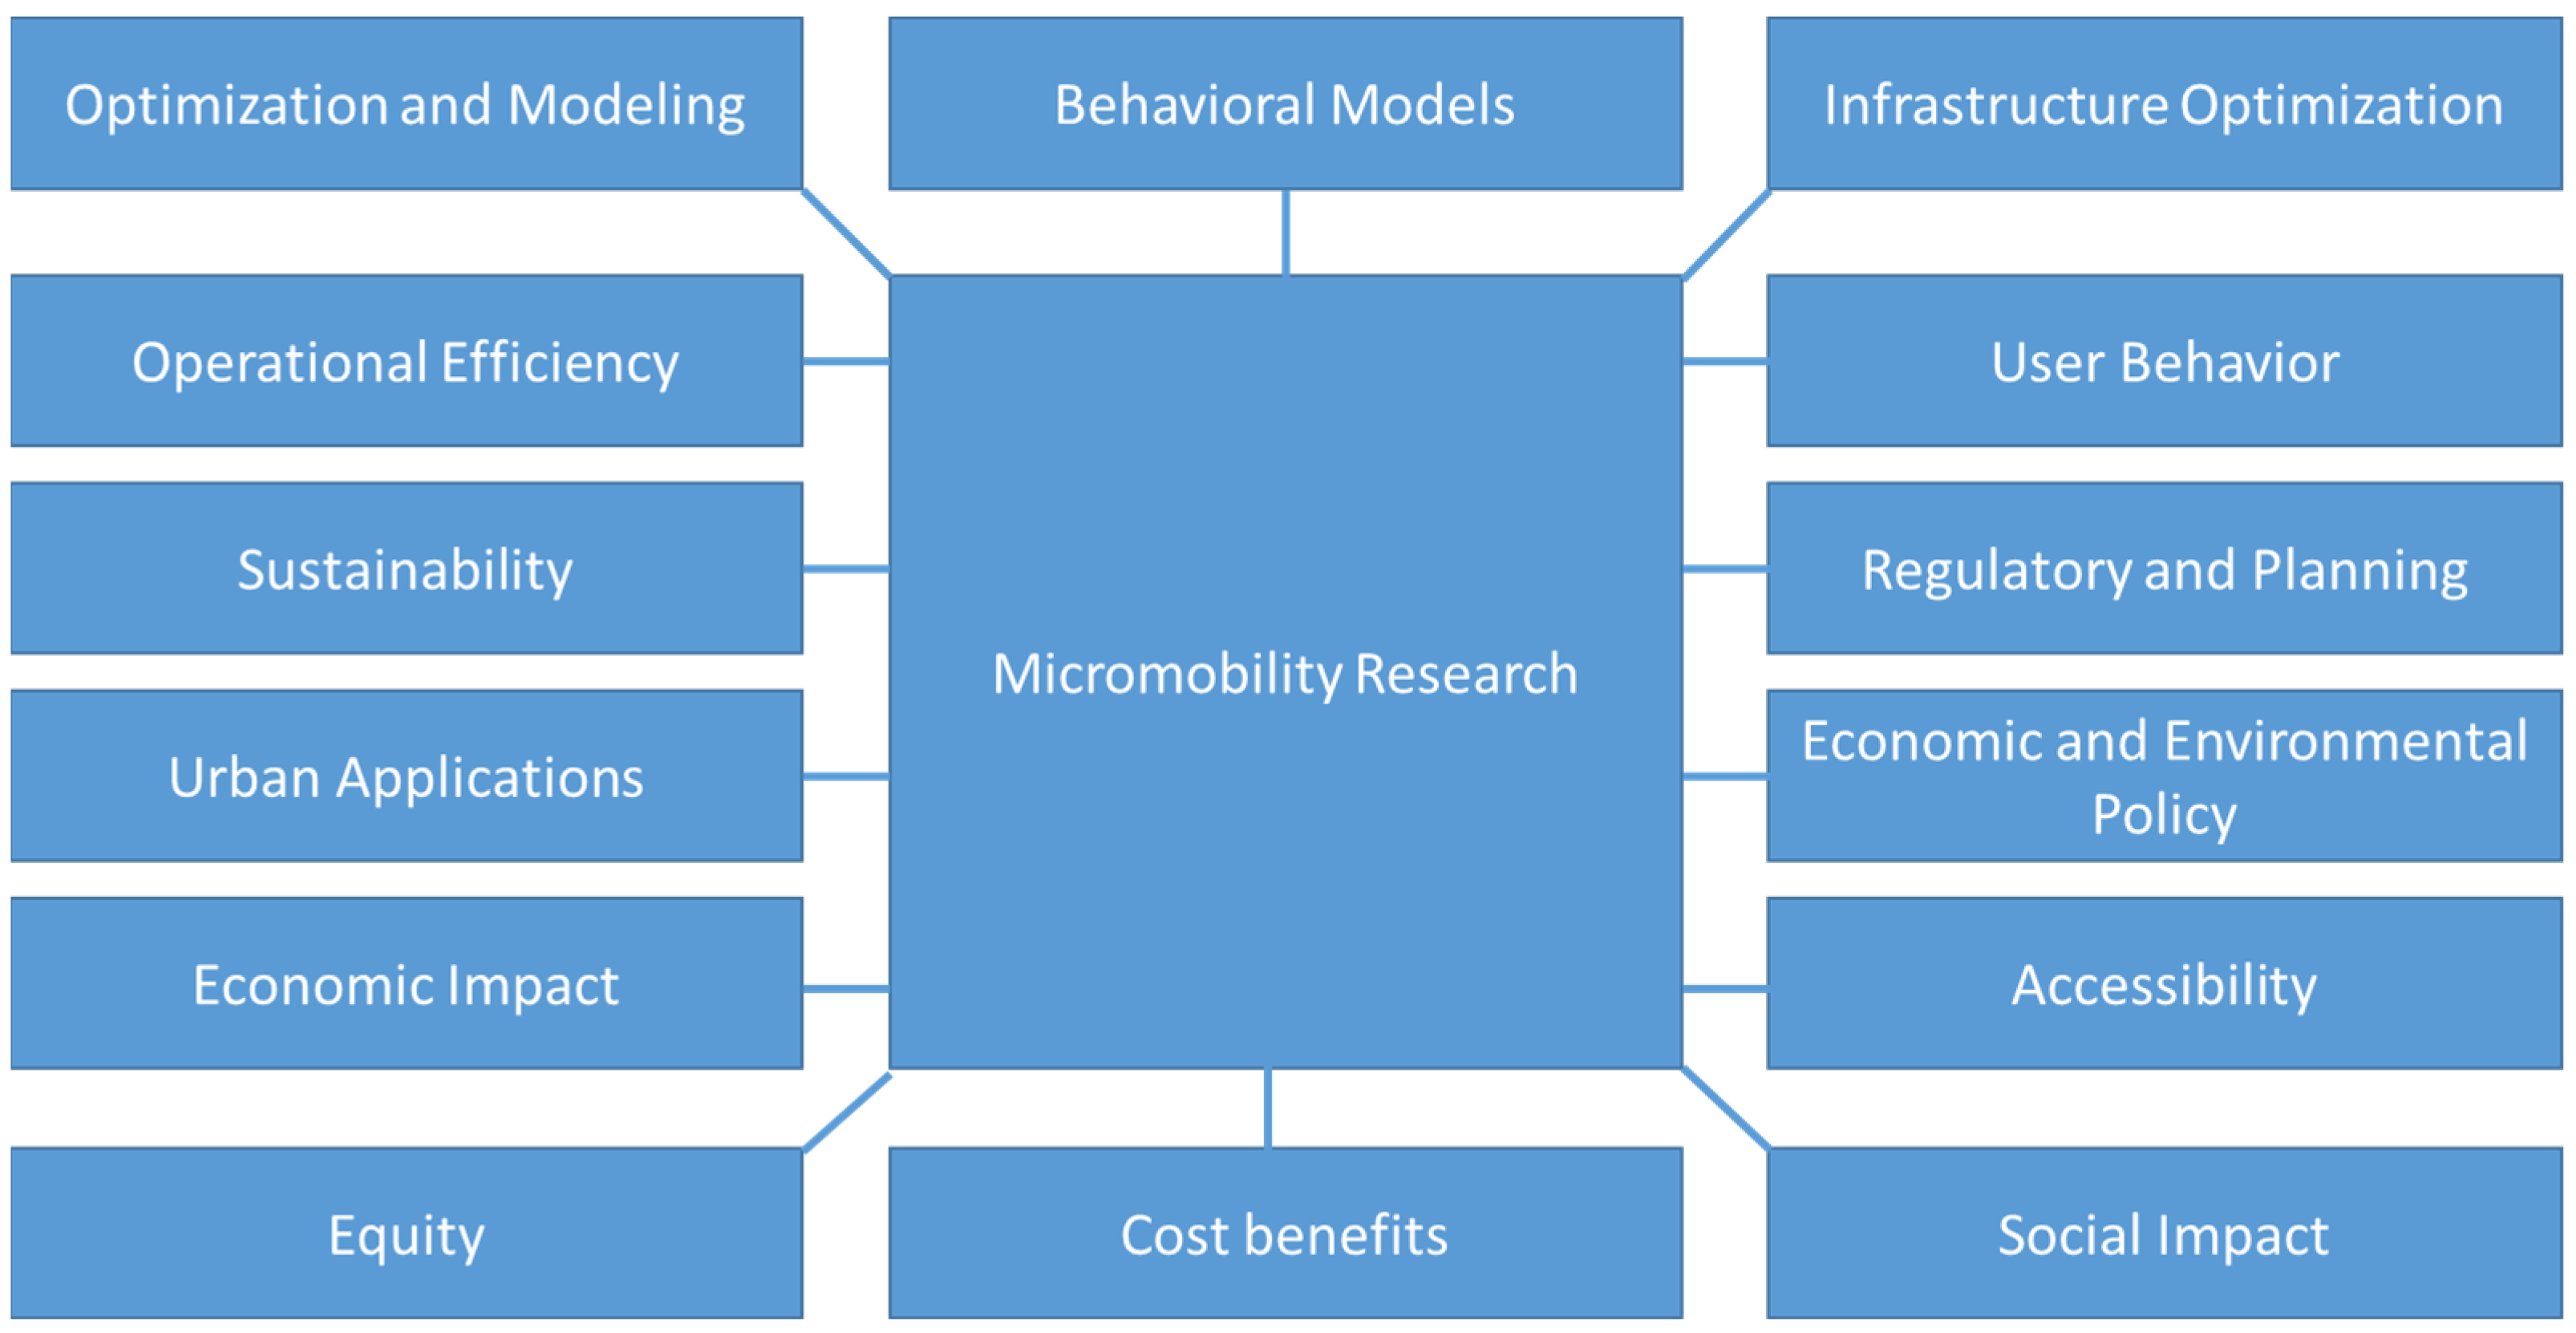
2.2. Content Analysis of Available Research Results

Teusch et al. explore the strategic placement of micromobility service facilities (MMSFs) using reinforcement learning to optimize e-scooter and e-bike infrastructure [12]. Their model balances service coverage, user convenience, and financial costs, allowing urban planners to adapt it to specific regulations. Experiments in Austin and Louisville, USA, show that their approach significantly improves parking demand and infrastructure efficiency compared to conventional methods. Saha et al. develop a decision-making framework using fuzzy multiple-objective optimization to evaluate e-scooter selection for sustainable urban mobility [13]. They identify economic factors, such as acquisition and maintenance costs, as the primary considerations for operators over technical features. Their model confirms that while e-scooters are promising for urban transport, cost barriers remain a key concern. Jaber et al. analyze optimal locations for shared electric micromobility stations using the analytic hierarchy process (AHP) model [14]. Their findings highlight that infrastructure quality—such as sidewalks and bike lanes—along with proximity to key destinations significantly influence placement decisions. Demographics, like age and income, have less of an impact, underscoring the importance of accessibility and integration with existing transport. Kim and Moon propose a spatio-temporal pricing model for battery-swapping in shared electric micromobility using reinforcement learning [15]. Their model dynamically adjusts task pricing based on driver availability and task distribution to optimize completion rates. Results show that their pricing strategy outperforms traditional fixed-pricing models by effectively balancing costs and task fulfillment.
Candiani et al. explore how the integration of shared micromobility can enhance express bus services by reducing passenger disadvantages [16]. They propose a mathematical optimization model that efficiently selects express bus stops while minimizing travel and waiting times. A case study in Milan demonstrates that combining micromobility with express buses can improve overall transport efficiency. Mambazhasseri Divakaran et al. use computational fluid dynamics (CFDs) to optimize heat dissipation in wheel-hub motors for micromobility vehicles [17]. Their study identifies airflow patterns and design improvements, such as air vents and rotor-lid fins, that enhance motor cooling efficiency. The findings contribute to extending the lifespan and performance of e-scooter motors by improving thermal management. Ayözen evaluates the use of e-scooters for postal deliveries in Turkey, focusing on energy consumption and delivery efficiency [18]. The study applies statistical optimization to identify key factors affecting e-scooter performance, including distance, weather, and delivery region. Results suggest that e-scooters offer significant cost and environmental benefits compared to traditional delivery vehicles. Noorzad et al. examine the economic operation of a multi-energy system (MES) incorporating micromobility, renewable energy, and community storage [19]. Their optimization model considers energy demands, operational costs, and the charging impact of e-scooters. Results indicate that integrating micromobility into a MES improves efficiency and reduces energy costs, especially under time-of-use pricing structures. Ayözen et al. analyze the benefits of e-scooters in postal delivery using optimization and statistical models with data from Istanbul [20]. Their findings highlight that e-scooters reduce delivery costs, energy consumption, and CO2 emissions, making them a potential alternative to conventional postal transport. The study provides a model for integrating e-scooters into urban logistics, particularly in high-density areas.
Fu et al. investigate shared micromobility (SMM) in multimodal travel across Utrecht, Greater Manchester, and Malmö [21]. Using latent class analysis (LCA), they identify distinct travel patterns where frequent SMM users exhibit greater multimodal flexibility. Their findings suggest that SMM integration varies by city and depends on existing transport infrastructure and modal share. Hassanpour and Bigazzi analyze perceptions of comfort and safety when pedestrians and micromobility device users share off-street cycling facilities and multi-use paths in Vancouver [22]. Their study, based on survey data and observed PMD speeds, reveals that while most users feel comfortable sharing space, sit-down electric scooters significantly reduce comfort levels. The authors recommend regulatory updates, infrastructure adjustments, and continued monitoring to improve user experience and safety. Liu and Ouyang develop a queuing network model to optimize charging station placement for mixed docked and dockless shared e-scooter systems [23]. Their analysis shows that integrating charging stations can improve service efficiency by reducing reliance on repositioning trucks and incentivizing user-based charging. The study highlights the benefits of this approach compared to conventional alternatives, providing insights for policymakers and operators. Oeschger et al. investigate micromobility preferences for first- and last-mile travel in Dublin, using a stated preference experiment and mixed logit modeling [24]. Their findings challenge the assumption that walking is a last-resort option, showing that many users prefer it over shared micromobility. The authors conclude that private bicycles and e-scooters are more attractive alternatives than shared options, especially for younger male commuters. Bobičić and Esztergár-Kiss systematically review enablers and barriers to micromobility adoption across urban and suburban contexts using bibliometric and systematic analyses [25]. They classify influencing factors into micro (personal), meso (social/environmental), and macro (policy/regulation) levels, identifying infrastructure gaps and regulatory issues as key barriers. Their study underscores the need for tailored policy interventions to enhance micromobility adoption in diverse settings.
Philips et al. present a mixed-methods study assessing the health and environmental impacts of e-micromobility in the UK, focusing on e-cargo bikes [26]. Their research, combining surveys, GPS tracking, and CO2 impact assessments, highlights the potential for e-micromobility to increase physical activity while reducing emissions. The authors emphasize the importance of targeted interventions to maximize the benefits of these vehicles for different user groups. Distefano, Leonardi, and Litrico analyze micromobility user behavior at mini-roundabouts, using drone footage and tracking software to examine speed and lane positioning [27]. Their results show that e-scooters exhibit greater speed variability than bicycles, raising concerns about stability and safety. The authors suggest infrastructure modifications, such as dedicated lanes, to improve safety and accommodate different micromobility modes. Emami and Ramezani propose an integrated rebalancing and recharging method for dockless shared e-micromobility systems, incorporating both truck-based and user-assisted relocation strategies [28]. Their optimization model minimizes operational costs and unmet demand while maximizing system efficiency. Simulation results indicate that the proposed approach improves service availability and reduces user wait times, offering practical implications for shared mobility operators. Fuady et al. apply system dynamics modeling to examine shared micromobility fleet development, analyzing factors such as fleet size, user demand, and financial incentives [29]. Their study highlights the role of subsidies and fee structures in influencing adoption rates and service viability. The authors provide policy recommendations to enhance economic sustainability and optimize fleet management. Sarker et al. use machine learning techniques to explore factors influencing micromobility mode choice in Florida based on a consumer survey [30]. Their analysis identifies age, car-oriented attitudes, and infrastructure deficiencies as key barriers, while prior experience with micromobility enhances adoption likelihood. The authors emphasize the need for targeted policy measures to expand access and promote sustainable mobility options. Comi and Polimeni develop a data-driven approach using floating car data to assess the potential for replacing private car trips with micromobility in Trani, Italy [31]. Their findings indicate that 31% of daily car round trips could be substituted by micromobility, leading to significant emission reductions. The authors argue that integrating micromobility into urban planning can enhance sustainability and reduce traffic congestion. Gao et al. explore the environmental sustainability of shared e-scooters (SESs) in three Swedish cities [32]. The study finds that while SESs largely replace walking and public transport, they contribute to increased CO2 emissions in most trips. The authors stress the need for trip-level analyses to better understand the environmental effects and inform sustainable urban management strategies.

2.3. Critical Analysis of Published Research Results

The studies presented cover various aspects of micromobility and its integration into urban transport systems, each contributing to the understanding of how micromobility solutions, such as e-scooters and e-bikes, impact transportation, sustainability, and urban development. These studies can be categorized and analyzed from several perspectives: theoretical aspects, practical aspects, case studies, and policy implications.
  • Optimization and modeling: Many studies emphasize theoretical frameworks for optimizing the operation of micromobility systems. Teusch et al. employ reinforcement learning for strategic facility placement, focusing on balancing service coverage, convenience, and financial aspects [12], while similarly, Saha et al. develop a decision-making framework using Fermatean fuzzy optimization for selecting e-scooter models, considering economic factors [13]. The studies highlight how advanced optimization techniques, such as reinforcement learning, fuzzy logic, and system dynamics, can theoretically enhance the efficiency and sustainability of micromobility systems. In the case of these studies, the goal of optimization generally does not include the analysis of the relationship between supply and demand, the optimization of transportation costs, the optimization of routes based on capacity and time constraints, and their scheduling.
  • Infrastructure optimization: Several studies examine how micromobility can be integrated into existing transport systems. Kim and Moon propose a spatio-temporal pricing model for battery swapping, emphasizing the practical application of reinforcement learning to optimize service pricing [15]. Jaber et al. use the analytic hierarchy process (AHP) to identify optimal locations for shared stations [14], factoring in infrastructure quality and accessibility which are crucial for practical urban planning.
  • Operational efficiency: Practical insights on the operational side include Emami and Ramezani [28], who develop a method to optimize rebalancing and recharging strategies for dockless systems. The study’s model offers practical recommendations for reducing operational costs and improving service efficiency. Liu and Ouyang contribute by investigating the placement of charging stations for dockless and docked e-scooter systems, addressing the practical need to improve service availability and reduce fleet management challenges [23].
  • Sustainability and cost benefits: Several studies, such as [18,20], assess the practical benefits of micromobility, particularly e-scooters, in urban logistics. They demonstrate significant cost and environmental benefits, such as reduced CO2 emissions and energy consumption, especially in urban delivery systems. These studies show how e-scooters can provide viable alternatives to traditional vehicles.
  • Urban applications: Several studies focus on specific cities to explore the real-world application of micromobility. Fu et al. [21] conduct case studies in Utrecht, Greater Manchester, and Malmö, identifying how shared micromobility (SMM) integrates into multimodal transport, with differences in integration depending on local infrastructure. Similarly, Candiani et al. use a case study in Milan to demonstrate how integrating micromobility with express bus services can improve travel efficiency [16].
  • Economic and social impact: Gao et al. analyze the environmental sustainability of shared e-scooters in Swedish cities, highlighting the trade-offs between replacing public transport and increasing emissions [32]. Comi and Polimeni provide a case study in Trani, Italy, suggesting that micromobility could replace private car trips, reducing emissions [31]. Both studies reflect how case-specific factors influence the sustainability of micromobility solutions.
  • Regulatory and planning: Several studies call for new policy frameworks to optimize micromobility integration into urban planning. Philips et al. discuss how micromobility can increase physical activity while reducing emissions, urging targeted policies to maximize health benefits [26]. Bobičić and Esztergár-Kiss [25] identify regulatory and infrastructure gaps as key barriers to adoption, suggesting that tailored policies are necessary to support micromobility in different urban contexts.
  • Economic and environmental policy: The studies emphasize the importance of subsidies, pricing structures, and regulatory frameworks to enhance the sustainability of micromobility. Fuady et al. offer policy recommendations to optimize fleet management and service viability based on factors like fleet size and user demand [29].
Figure 6 summarizes the main topics of the above-mentioned micromobility-related research fields.

2.4. Research Gap Identification

Based on the above literature review, it can be concluded that research on micromobility solutions includes multiple scientific disciplines. However, a research gap exists in the area where the focus is on the optimization of micromobility-based supply chain solutions. This challenge fundamentally represents a logistics planning task. Therefore, in this study, the authors examine how it is possible to organize the efficient delivery of small and lightweight parcels within a relatively small area (such as an urban residential district) through an integrated first-mile/last-mile logistics solution using micromobility devices. The primary objective of this research is to develop a mathematical model.
This paper is organized as follows. Section 1 presented a systematic literature review, which summarized the research background of micromobility-related problems. Section 2 describes the model framework of the real-time optimization of asymmetric, micromobility-based transportation problems. Section 3 presents the numerical results, while Section 4 discusses the conclusions and future research directions.

3. Materials and Methods

Symmetric and asymmetric transportation problems are important in logistics as their solution can significantly influence cost efficiency. In symmetric problems, travel costs or times between locations are equal in both directions, simplifying route planning. In contrast, asymmetric problems reflect real-world complexities such as one-way streets, traffic conditions, and different transportation modes, requiring advanced optimization techniques. Understanding both types is essential for designing efficient and sustainable supply chain networks. Within the frame of this article, the asymmetric transportation problems are discussed.
The mathematical model for the asymmetric transportation problem with a Eulerian circuit and shortest path optimization includes three phases. The first phase is the solution of the asymmetric transportation problem for the optimal allocation of goods.
The transportation problem involves distributing goods from multiple suppliers to multiple customers while minimizing transportation costs. Each supplier has a limited supply, and each customer has a specific demand. The goal is to find an optimal transportation plan that minimizes costs while satisfying constraints. The input parameters of the asymmetric transportation problem are shown in Table 1.
The decision variable of the asymmetric transportation problem is the quantity transported from supplier i to customer j in the case of product k.
The objective function of the optimization of the asymmetric transportation problem is the minimization of the total transportation cost, which is as follows:
C = k = 1 k m a x i = 1 m j = 1 n c i j · x i j k m i n .
The constraints of the asymmetric transportation problems can focus on both capacity- and time-related constraints. The first capacity-related constraint defines that each supplier cannot send more goods than its available supply, which means that it is not allowed to exceed the predefined supply capacity at the supplier. This can be expressed as follows:
i , k : j = 1 n x i j k q i k .
The second capacity-related constraint defines that each supplier cannot send more goods than its available supply, which means that it is not allowed to exceed the predefined supply capacity of the supplier. This can be expressed as follows:
j , k : i = 1 m x i j k d j k .
The time-related constraint defines that all delivery tasks must be performed within the predefined time frame, which can be expressed as follows:
i , k : τ i , k m i n t i k x i j k τ i , k m a x
and
j , k : τ j , k * m i n t i k x i j k τ j , k * m a x
where τ i , k m i n is the lower limit of the time frame to perform a first-mile delivery from supplier i in the case of product k, τ i , k m a x is the upper limit of the time frame to perform a first-mile delivery from supplier i in the case of product k, τ j , k * m i n is the lower limit of the time frame to perform a last-mile delivery to customer j in the case of product k, τ j , k * m a x is the upper limit of the time frame to perform a last-mile delivery to customer j in the case of product k.
The non-negativity constraint ensures that it is not allowed to define negative transportation values, and it is expressed as follows:
i , j , k : x i j k 0 .
The non-negativity constraint is crucial because transportation values are not physically meaningful and products cannot be transported in negative quantities. This constraint ensures that the model correctly represents real-world logistics, where shipments either occur in positive amounts or not at all. Without it, the solution might suggest infeasible routes, leading to unrealistic transportation plans.
After solving this problem, we obtain an optimal transportation plan which defines the flow of products from suppliers to customers. The next phase of the optimization is to construct a Eulerian circuit with minimum cost idle routes.
We can represent the transportation plan as a G = V , E directed graph, where vertices V defines all suppliers and customers and edges E are for transportation routes (i,j) where x i j k 0 .
The first phase of creating a Eulerian circuit is to check the Eulerian conditions. A directed graph has a Eulerian circuit if and only if:
  • The in-degree and out-degree are equal for all nodes, the equation for which is expressed as follows:
v V : d e g + v = d e g v .
  • The graph is strongly connected (there exists a path between every pair of nodes).
In our case, the transportation solution may not satisfy these conditions so we must add empty trips (dummy edges) to balance the graph. The next task is to define the rules to identify imbalanced nodes and calculate the number of needed incoming and outgoing edges. The following formulas are used:
v V : d e g + v > d e g v a d d   o u t g o i n g   e d g e
v V : d e g + v < d e g v a d d   i n c o m i n g   e d g e .
In this phase, the extra outgoing and incoming edges must be added so that the total transportation cost of added idle routes is minimized. It means that in this phase the minimum-cost matching problem must be solved. This can be solved using the Hungarian Algorithm (if the cost matrix is small) or the Minimum-Cost Flow Algorithm (for large networks).
The last phase of the optimization is to find the Eulerian circuit using Hierholzer’s Algorithm. Once the graph is balanced, we can apply the Hierholzer’s Algorithm using the following optimization phases:
  • Start from any vertex with edges.
  • Follow a cycle until returning to the start node.
  • If unvisited edges remain, repeat from an already visited node.
  • Concatenate all cycles into a single Eulerian circuit.
The process of optimization is shown in Figure 7.
The above-mentioned optimization problem was solved using Open Solver 2.9.3, as presented in the next section. This tool was chosen due to its capability to handle large-scale linear and nonlinear optimization problems efficiently. By using Open Solver’s built-in algorithms, we ensured accurate and reliable results. The following section provides a detailed explanation of the key findings.

4. Results

In this section, the application of the algorithm presented in Section 2 is demonstrated through two case studies. The first case study uses generated data to illustrate the steps and numerical results involved in implementing micromobility-based first-mile and last-mile delivery tasks. The second case study presents the real-world application of the algorithm in the context of a restaurant network’s raw material redistribution system, based on actual data from Miskolc, Hungary. The two case studies demonstrate the operation of the algorithm, which integrates the solutions for the transportation problem and the route planning problem, based on a Eulerian circle, enabling the complete service to be carried out with micromobility vehicles.

4.1. Case Study A

In the first case study, we test the proposed optimization algorithm using generated data to evaluate its performance and applicability. The numerical study focuses on implementing first-mile and last-mile delivery operations across 16 locations in a rural area using micromobility devices.
The data for case study A were obtained from detailed map data, which provided essential geographic and logistical information. These map-based datasets included locations, distances, and connectivity between key points relevant to the study. No graphical representation was used; instead, the data were processed numerically to ensure accuracy in calculations. The extracted information was then structured to align with the study’s objectives and optimization framework. This approach allowed for a comprehensive analysis without relying on visual mapping tools.
The supply chain problem to be addressed using micromobility solutions is defined by the following known data:
  • Supply availability at each location: Each location has a certain stock of products categorized by type. These data are essential for determining where surplus goods are available and where redistribution may be required. The availability of specific product types at different locations can vary due to factors such as local production, storage limitations, or previous deliveries. Table 2 shows the supply availability at each location.
  • Demand at each location: Each location has specific demand requirements for different product types. This demand may be static or dynamic, depending on the nature of the products and consumption patterns. Understanding the demand distribution is crucial for optimizing delivery routes and ensuring that all demand points receive the necessary products in a timely manner. Table 3 shows the supply demand at each location.
Table 3. Supply demands of products (from product A to product E) at each location for case study A in [pcs].
LOC_021LOC_045LOC_013LOC_022LOC_065LOC_154LOC_007LOC_076LOC_077LOC_020LOC_059LOC_160LOC_011LOC_071LOC_038LOC_003
A02203303308913023055055
B002200220033001200360
C000667700004400023970
D101000056000650044
E4400123400000342182000
  • Transportation costs: In a micromobility-based first-mile and last-mile supply chain, the transportation cost between locations can be determined using a customized pricing model. This cost depends on both the origin and destination locations as well as the characteristics of the transported goods, such as weight, volume, and handling requirements. Since micromobility solutions, such as cargo bikes, e-scooters, and small electric vehicles, have different cost structures compared to conventional transportation, factors like distance, road conditions, and vehicle type may also influence pricing. Additionally, dynamic pricing mechanisms can be applied, considering factors such as peak demand periods or weather conditions that impact delivery efficiency. The transportation costs for each possible relation are detailed in Table 4 as an asymmetric transportation price matrix.
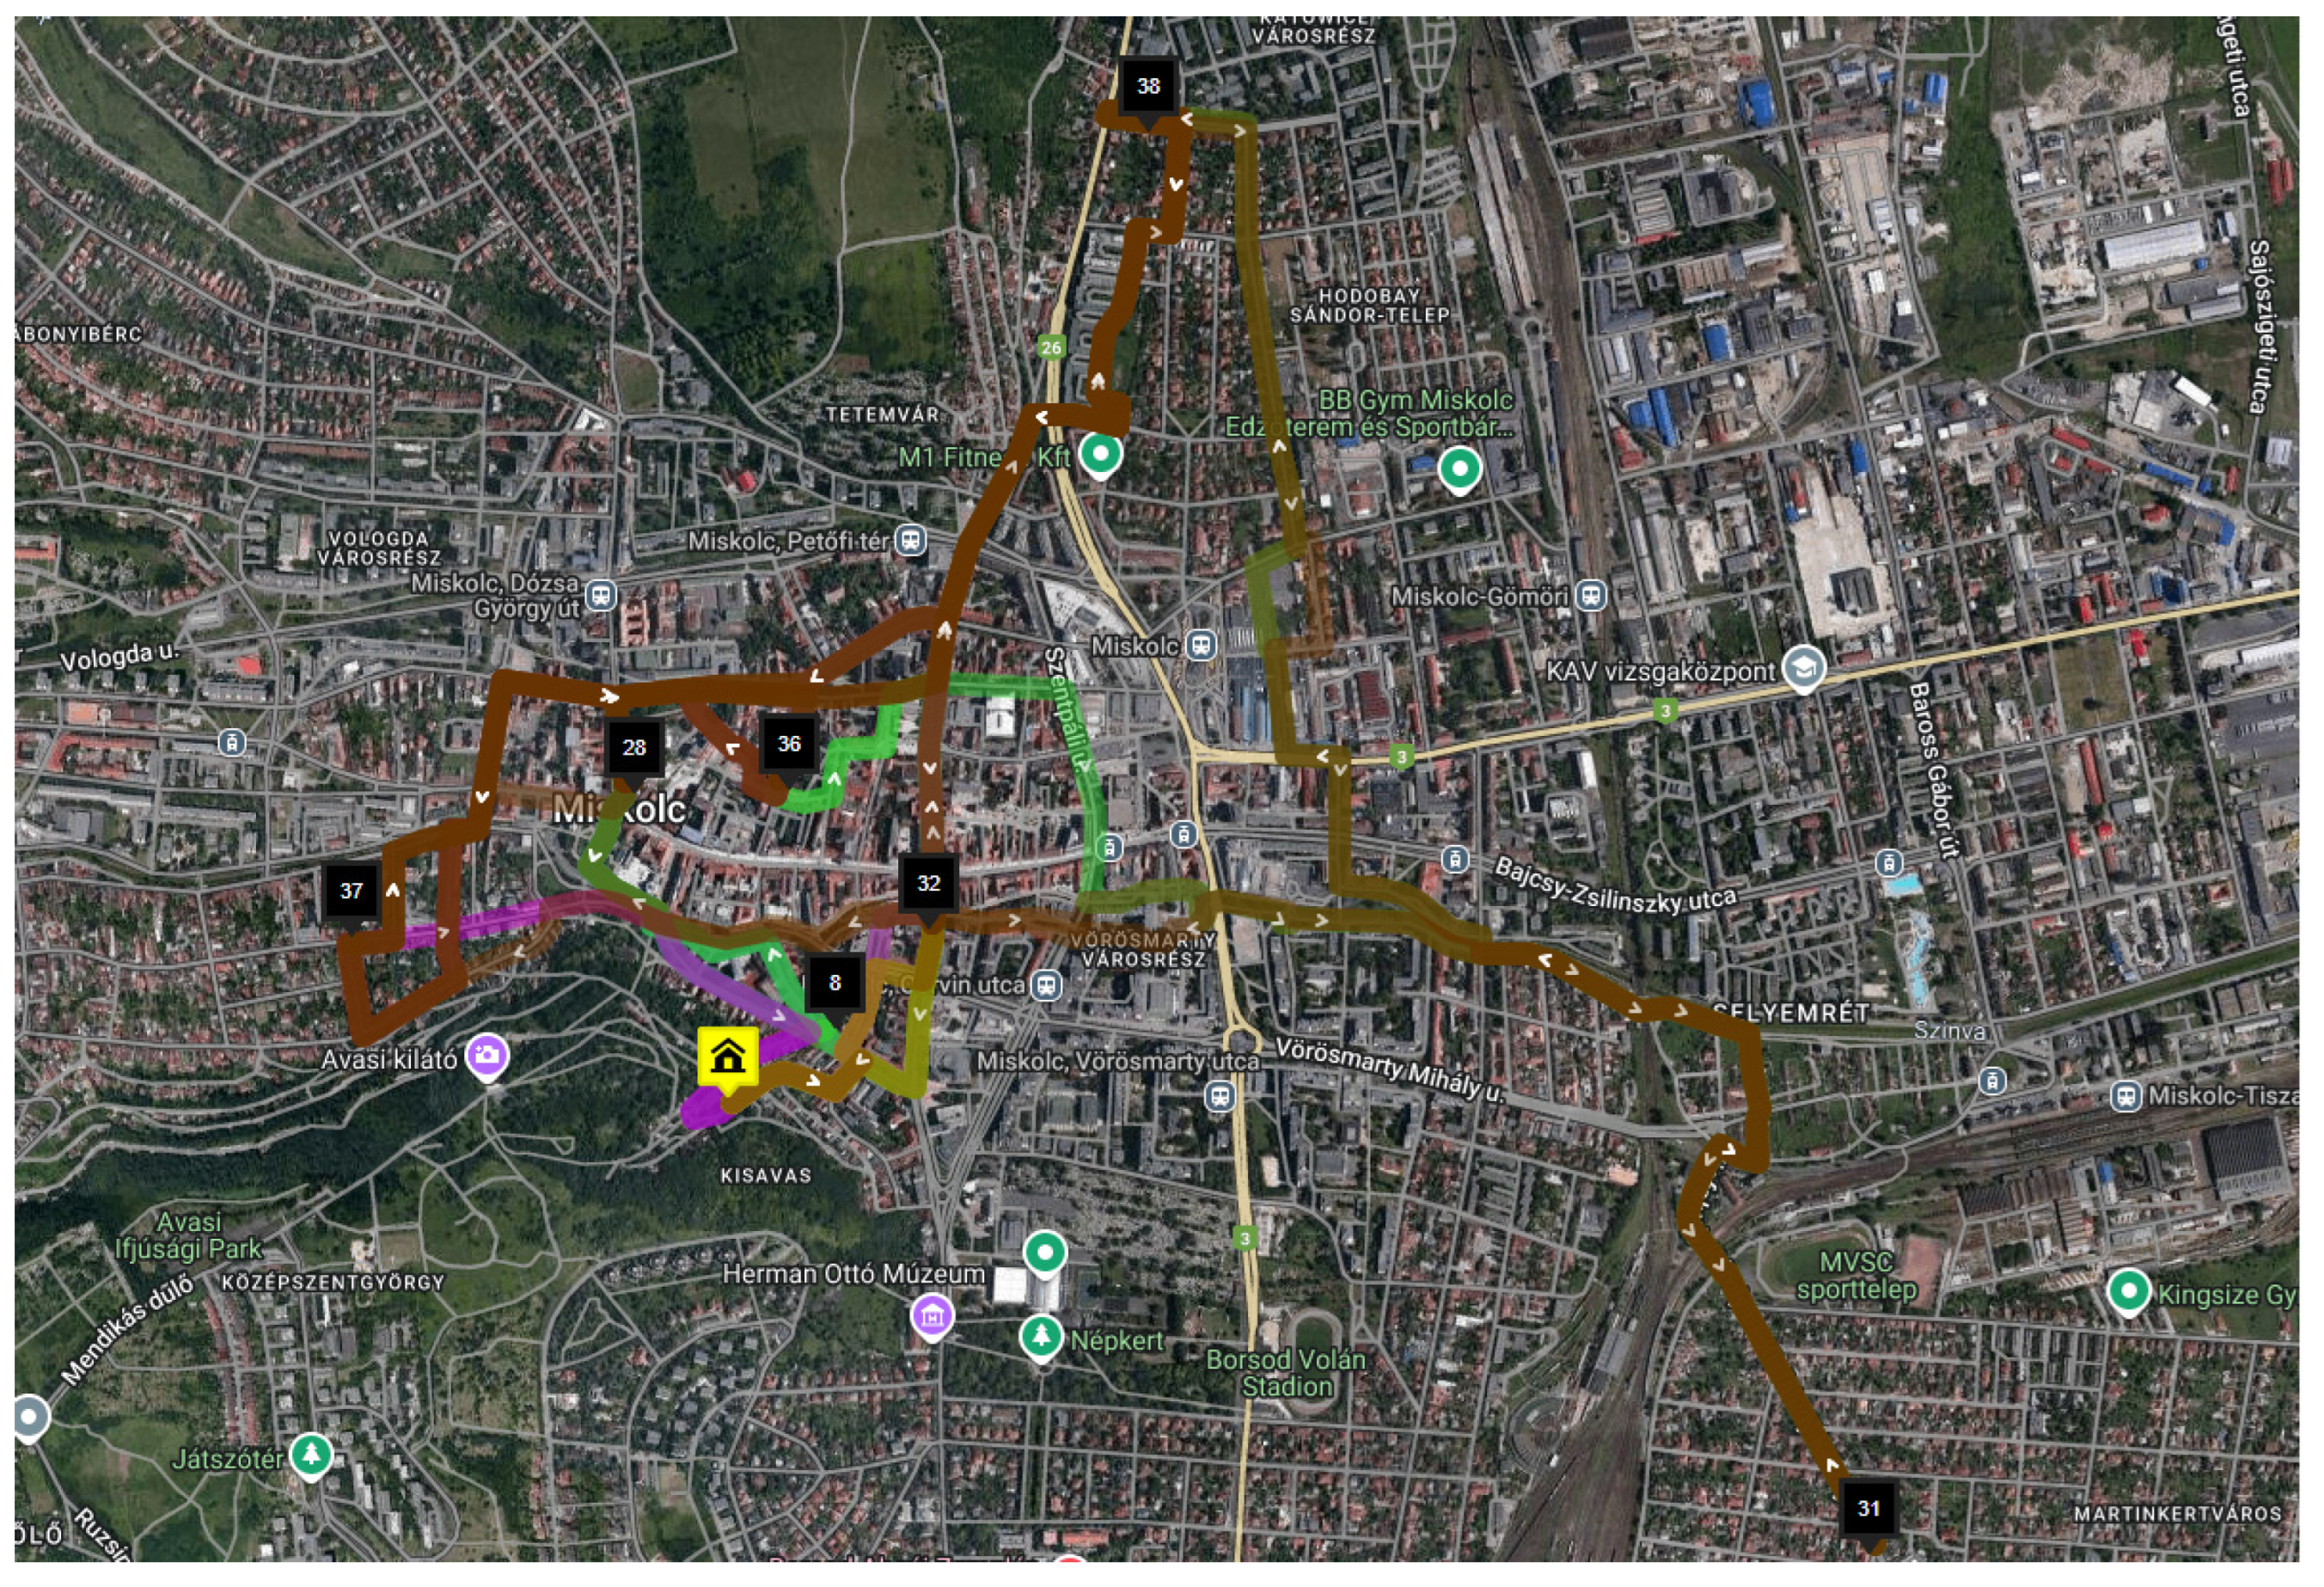
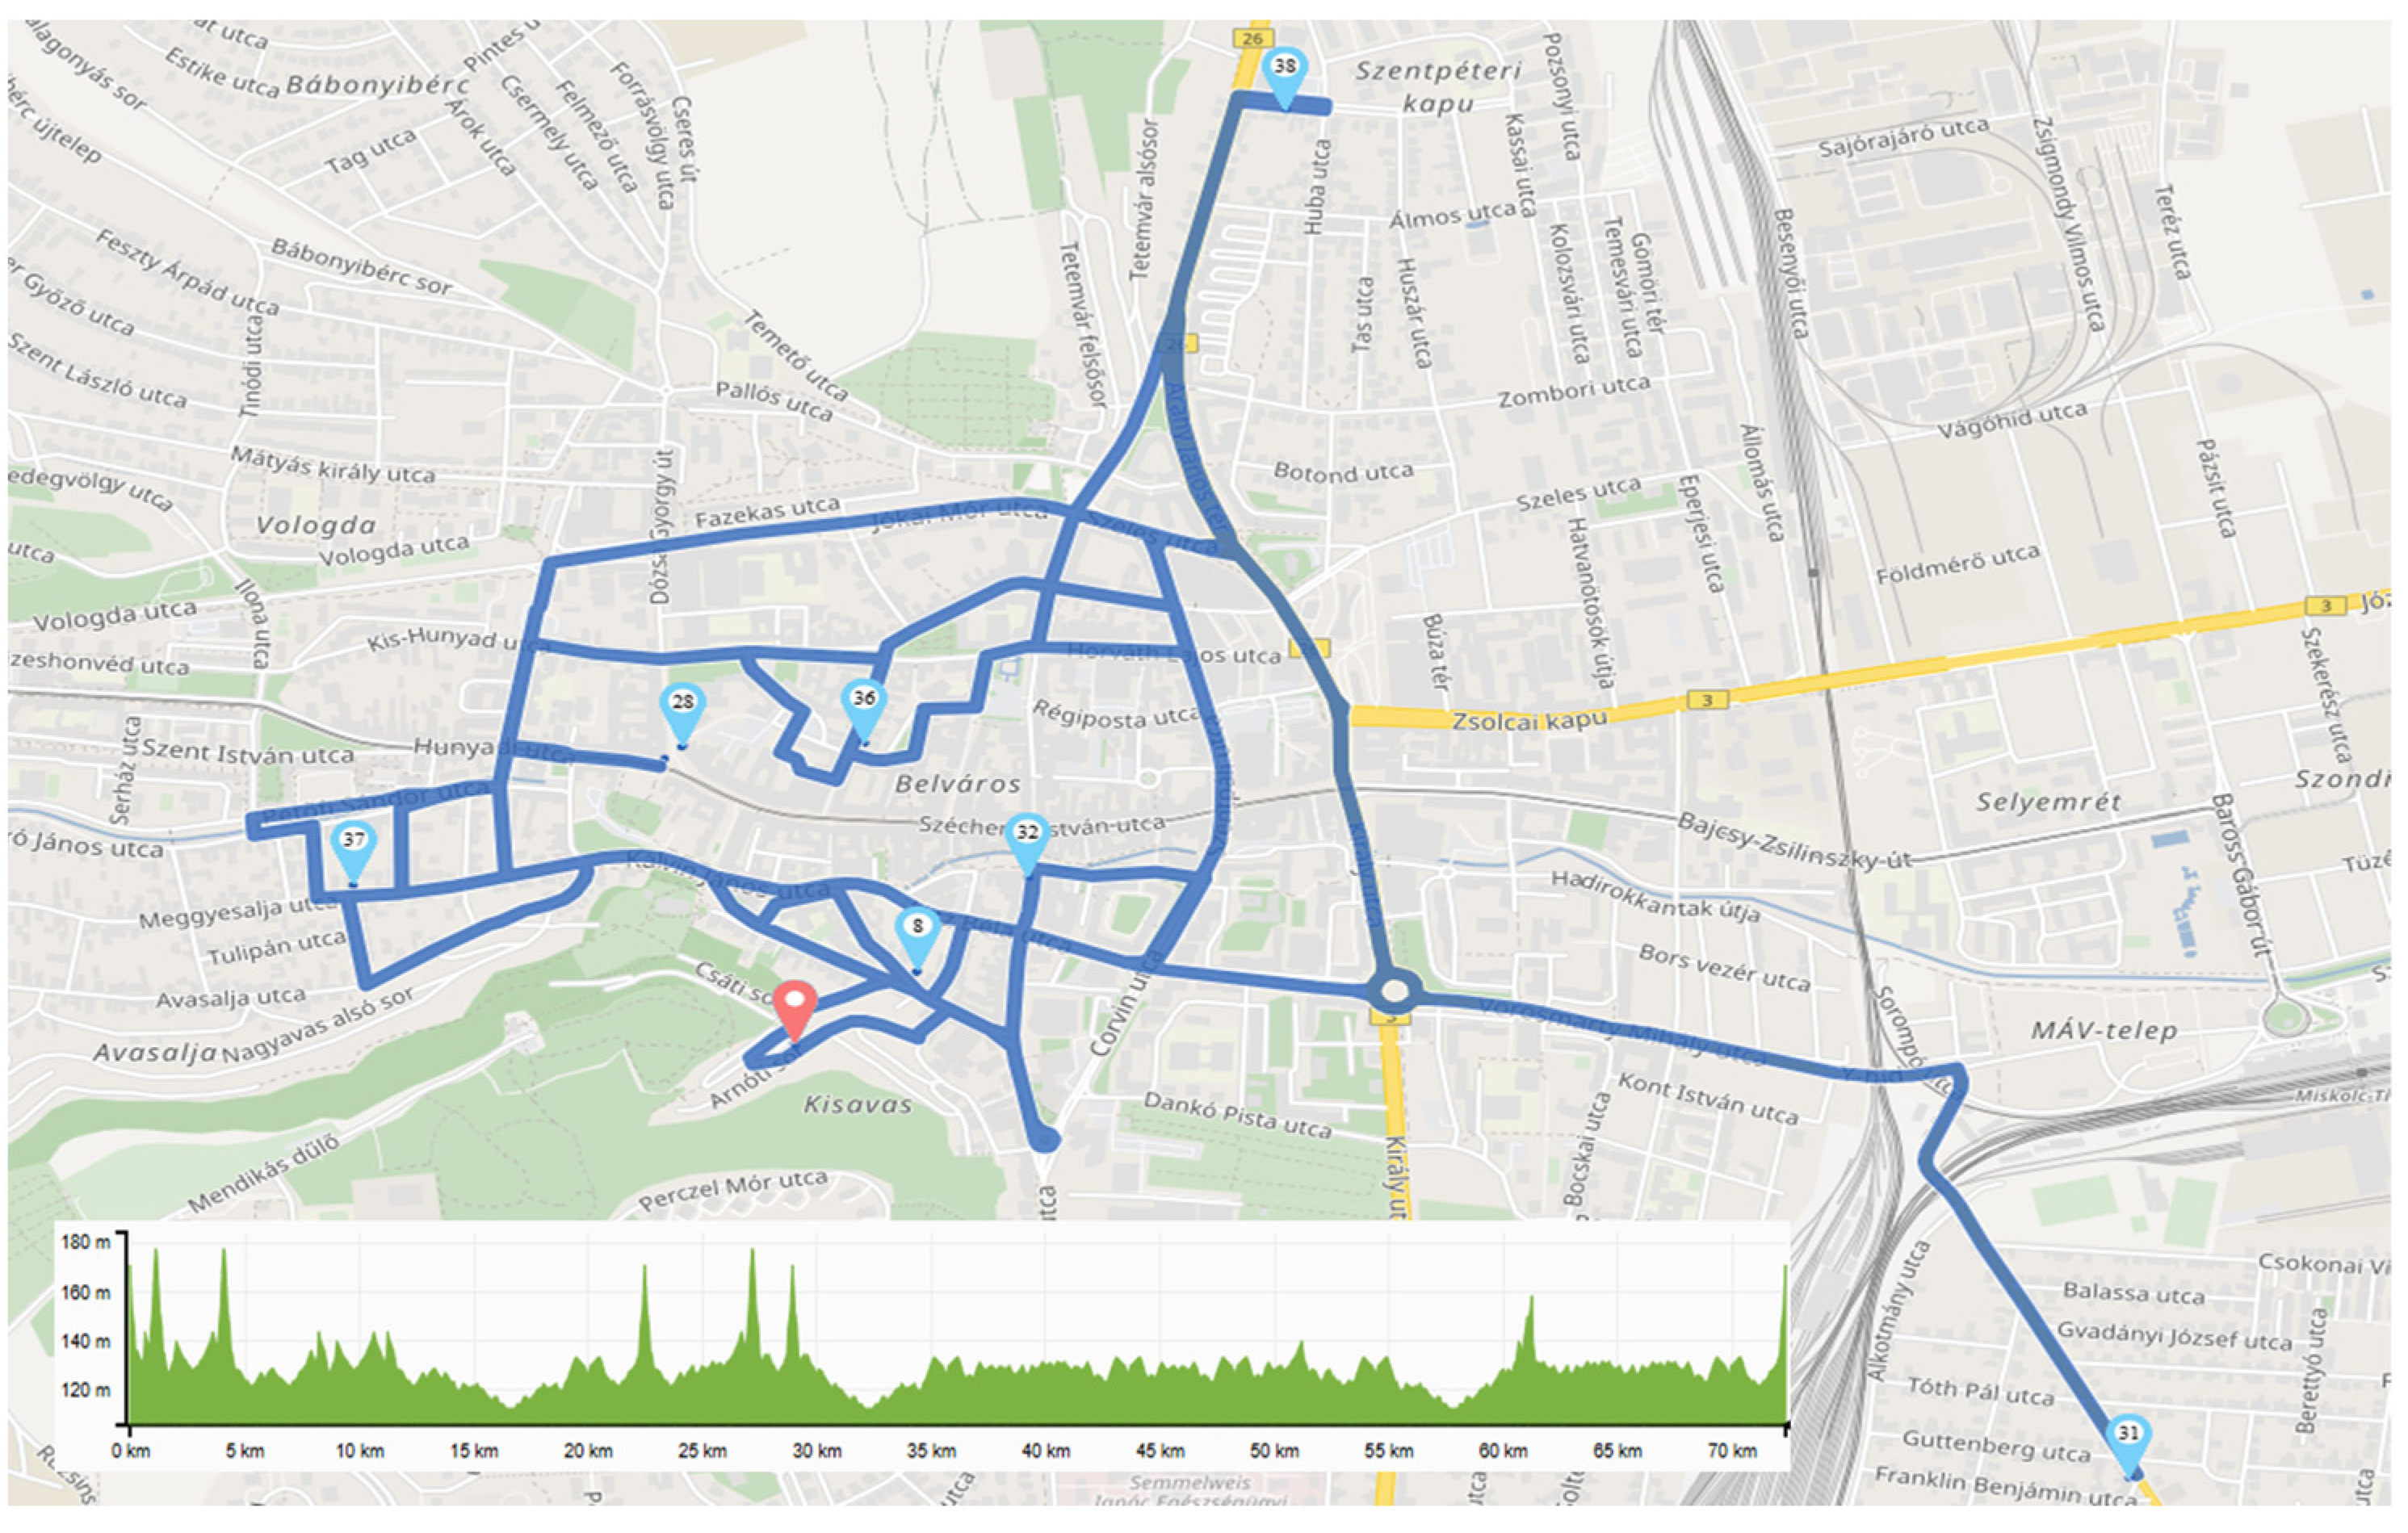
  • Geographical positions and travel distances: The exact spatial coordinates of each supply and demand location are crucial for route optimization. The distance between locations is not always symmetric, as factors such as one-way streets, restricted zones, and varying terrain conditions can create asymmetries in travel distances. In a rural setting, road quality, seasonal accessibility issues, and infrastructure limitations may further impact feasible delivery routes. The use of micromobility solutions—such as cargo bikes, e-scooters, or small autonomous delivery vehicles—requires an accurate understanding of these constraints to ensure efficient routing and minimize delays. The travel distances for micromobility devices are shown in Table 5.
Table 4. The asymmetric transportation cost matrix for case study A in [cent/pcs].
LOC_021LOC_045LOC_013LOC_022LOC_065LOC_154LOC_007LOC_076LOC_077LOC_020LOC_059LOC_160LOC_011LOC_071LOC_038LOC_003
LOC_0210691766365284585084204639953539
LOC_0451508289594172317171108819241090
LOC_0134135047964074629295512965161812
LOC_0224916590407442886751568456761652
LOC_0656577348405134592870333344733060
LOC_1544936947312033442797788687903692
LOC_0079160354959920681945121830733371
LOC_076771589072494004244981985227724
LOC_0776561273339298389056837127445614
LOC_0201791179531733287920726396557953
LOC_0598832762042984370248501695425161
LOC_1607185514371581450438085034394772
LOC_0116622734795762758106559140954347
LOC_0717111304911595921378877386609368
LOC_0385571108227361635335320966071045
LOC_0032616252180506253732780547611640
Table 5. The travel distances between each location for case study A in [m].
LOC_021LOC_045LOC_013LOC_022LOC_065LOC_154LOC_007LOC_076LOC_077LOC_020LOC_059LOC_160LOC_011LOC_071LOC_038LOC_003
LOC_0210.0039.0276.54111.11141.42166.29184.78196.16200.00196.16184.78166.29141.42111.1176.5439.02
LOC_04539.020.0039.0276.54111.11141.42166.29184.78196.16200.00196.16184.78166.29141.42111.1176.54
LOC_01376.5439.020.0039.0276.54111.11141.42166.29184.78196.16200.00196.16184.78166.29141.42111.11
LOC_022111.1176.5439.020.0039.0276.54111.11141.42166.29184.78196.16200.00196.16184.78166.29141.42
LOC_065141.42111.1176.5439.020.0039.0276.54111.11141.42166.29184.78196.16200.00196.16184.78166.29
LOC_154166.29141.42111.1176.5439.020.0039.0276.54111.11141.42166.29184.78196.16200.00196.16184.78
LOC_007184.78166.29141.42111.1176.5439.020.0039.0276.54111.11141.42166.29184.78196.16200.00196.16
LOC_076196.16184.78166.29141.42111.1176.5439.020.0039.0276.54111.11141.42166.29184.78196.16200.00
LOC_077200.00196.16184.78166.29141.42111.1176.5439.020.0039.0276.54111.11141.42166.29184.78196.16
LOC_020196.16200.00196.16184.78166.29141.42111.1176.5439.020.0039.0276.54111.11141.42166.29184.78
LOC_059184.78196.16200.00196.16184.78166.29141.42111.1176.5439.020.0039.0276.54111.11141.42166.29
LOC_160166.29184.78196.16200.00196.16184.78166.29141.42111.1176.5439.020.0039.0276.54111.11141.42
LOC_011141.42166.29184.78196.16200.00196.16184.78166.29141.42111.1176.5439.020.0039.0276.54111.11
LOC_071111.11141.42166.29184.78196.16200.00196.16184.78166.29141.42111.1176.5439.020.0039.0276.54
LOC_03876.54111.11141.42166.29184.78196.16200.00196.16184.78166.29141.42111.1176.5439.020.0039.02
LOC_00339.0276.54111.11141.42166.29184.78196.16200.00196.16184.78166.29141.42111.1176.5439.020.00
The solution of case study A includes three main phases:
  • Solving the transportation problem,
  • Identifying empty trips and transforming the transportation graph,
  • Determining the optimal tour for the entire supply chain.
In the first phase of the optimization process, the transportation problem is solved. The objective function of this transportation problem is the minimization of the total transportation cost. The transportation cost is determined by a dynamic pricing model, which could take into consideration several factors such as transportation distance, quantity of goods to be transported, value of the transported goods, and additional required services. The two most important constraints of the transportation problem are the following: all transportation demands must be fulfilled and the available supply cannot be exceeded. As a result of this phase, the optimization algorithm identifies 71 shuttle routes, which include only loaded trips. The details of these routes are presented in Table 6.
Table 6 contains information on which products, in what quantities, need to be transported in relation to each other. In this case study, the income of the delivery service provider is EUR 260.43. The distribution of revenue from transportation costs among the products is illustrated in Figure 8.
Following the first phase, the next step in the optimization algorithm is to determine the number and relations of idle routes. The main objective of this phase is to transform the transportation graph into a Eulerian cycle, enabling the integration of first-mile and last-mile delivery tasks into a single round route to be performed by the micromobility device. This transformation ensures operational efficiency by reducing unnecessary idle trips and optimizing vehicle usage. The specific relationships where idle routes need to be established are shown in Table 7. Subsequently, the optimization algorithm calculates the optimal assignment of idle routes, ensuring that their total travel distance is minimized. The results of this step are summarized in Table 8.
Once both loaded and idle routes are identified, the final phase of the optimization process involves determining the optimal round route within the supply chain. This route is structured within the Eulerian cycle and integrates all first-mile and last-mile delivery tasks efficiently. In the case of this optimized route, the total length of the route is 11.053 km, out of which 1.438 km is the total length of idle routes and the remaining 9.615 km is the total length of loaded transportation routes, which means that the total utilization of the micromobility device is 87%.
For an x-location route planning problem, the computational requirements depend on the method used. In the case of brute-force, the computational complexity is O x ! , meaning the number of possible routes grows factorially. Dynamic programming has a complexity of O x 2 · 2 x , while in the case of the used evolutionary algorithm of the solver the computational complexity ranges from O x 2 to O x 3 . In our case, the computation time was below 1 s, which comes from the small size of the optimization problem.

4.2. Case Study B

In the second case study, we examine a network of eight restaurants located in the downtown area of Miskolc, exploring how the method presented in Section 2 can be applied to the redistribution of ingredients used for cooking through the implementation of a micromobility-based system. This solution is beneficial because it leverages micromobility to optimize the transportation of ingredients between restaurants, reducing the need for large-scale delivery trucks. This not only cuts down on emissions and traffic congestion but also improves delivery efficiency by utilizing smaller, more agile vehicles. Moreover, it allows restaurants to share resources in real time, reducing food waste and ensuring that each location has the necessary ingredients when needed. This approach can lead to cost savings, increased sustainability, and a more resilient supply chain in the food service industry.
To enable real-time demand and supply management for ingredient redistribution among the eight restaurants in downtown Miskolc, an industry 4.0-based system can be implemented. IoTs-enabled smart storage units monitor ingredient levels in real time, while predictive analytics forecast demand based on sales patterns and external factors. A cloud-based platform ensures secure and transparent tracking of ingredient transfers, automating transactions based on predefined thresholds. Micromobility vehicles, such as e-bikes and cargo scooters, are dynamically assigned using route optimization to minimize travel distance and energy consumption. A digital twin simulates different scenarios to enhance decision-making, while edge computing processes data locally for real-time responsiveness.
The raw material redistribution problem to be addressed using micromobility solutions is defined by the following known data points:
  • Supply availability at each location (see Table 9),
  • Demand at each location (see Table 10),
  • Transportation costs (see Table 11),
  • Geographical positions and travel distances (see Table 12).
The solution of case study B includes three main phases:
  • Solving the transportation problem,
  • Identifying idle routes and transforming the transportation graph,
  • Determining the optimal tour for the entire supply chain.
As a result of this phase, the optimization algorithm identifies 28 shuttle routes, which include only loaded trips. The details of these routes are presented in Table 13.
Table 13 contains information on which products, in what quantities, need to be transported in relation to each other. In this case study, the income of the delivery service provider is EUR 634.12. The distribution of revenue from transportation costs among the raw materials is illustrated in Figure 9.
The next step of the optimization algorithm is to determine the number and relation of empty trips. The specific relationships where idle routes need to be established are shown in Table 14. Subsequently, the optimization algorithm calculates the optimal assignment of idle routes, ensuring that their total travel distance is minimized. The results of this step are summarized in Table 15.
Once both loaded and idle routes are identified, the final phase of the optimization process involves determining the optimal round route within the supply chain. This route is structured within the Eulerian cycle and integrates all first-mile and last-mile delivery tasks efficiently. The final optimized route is shown in Figure 10 and Figure 11. Figure 10 shows the optimal route in a Google hybrid map style, while Figure 11 shows the optimal route of the micromobility device in a Grashhopper map. In the case of this optimized route, the total length of the route is 54.2 km, out of which 16.8 km is the total length of the idle route and the remaining 37.4 km is the total length of the loaded transportation route, which means that the total utilization of the micromobility device is 69%.
In order to compare the optimized solution with a conventional solution, we developed a solution in which we examined how the total distance changes in the case of shuttle-based services. In this case, the total distance traveled is 121.65 km, which means that the solution we proposed accounts for 44.55% of the first-mile/last-mile delivery solutions implemented with shuttle services. In the case of the shuttle solution, the utilization of micromobility devices is around 50% when demand and supply are not synchronized. Therefore, in the case of our approach, the utilization of micromobility devices improved by 19%.

5. Discussion and Conclusions

The results of this study provide valuable insights into the optimization of asymmetric transportation problems, particularly in the context of first-mile and last-mile logistics using micromobility devices. By integrating mathematical modeling with heuristic optimization techniques, the proposed approach successfully enhances transportation efficiency. The numerical results demonstrate that the novel method makes it possible to optimize micromobility-based first-mile and last-mile delivery networks. These findings emphasize the importance of structured optimization frameworks in addressing the complexities of modern logistics networks.
A key contribution of this study is the demonstration that heuristic algorithms can effectively handle asymmetric transportation challenges in micromobility-based integrated first-mile and last-mile delivery networks. The optimization of these operations is particularly critical given the increasing demand for efficient urban logistics solutions. Unlike traditional transportation models, real-world scenarios frequently involve asymmetric travel times, costs, and constraints due to traffic patterns, road conditions, and operational limitations. The proposed model successfully accounts for these factors, leading to more realistic and applicable optimization results.
Despite the promising outcomes, some limitations should be acknowledged. First, the reliance on heuristic methods means that solutions are not guaranteed to be globally optimal. While the approach effectively balances computational efficiency with solution quality, future research could explore hybrid optimization techniques that integrate exact methods with heuristics for improved accuracy. Additionally, the model assumes a relatively stable demand and operational environment, whereas real-world logistics networks are often subject to dynamic changes such as fluctuating demand, unexpected delays, and regulatory constraints. Future work could extend the model to incorporate real-time data and adaptive decision-making frameworks.
The optimization of micromobility-based first-mile and last-mile delivery networks not only improves efficiency but also contributes to sustainability by reducing dependence on conventional fuel-based transportation, thereby decreasing carbon emissions in urban areas. By effectively addressing asymmetric transportation problems, this study supports the adoption of micromobility solutions, which can reduce urban traffic congestion by minimizing the need for larger delivery vehicles in densely populated areas. The findings highlight the potential for structured optimization frameworks to enhance urban logistics in a way that promotes cleaner and more efficient mobility solutions, aligning with broader sustainability goals. As urban areas continue to deal with growing e-commerce demands, optimizing last-mile logistics through micromobility not only reduces delivery times and costs but also mitigates traffic congestion and contributes to improved air quality. By integrating heuristic optimization techniques into real-world logistics planning, this study provides a methodology for a smarter, more sustainable urban transportation network.

Author Contributions

Conceptualization, Á.B. and T.B.; methodology, Á.B. and T.B.; software, T.B. and I.K.; validation, Á.B., I.K. and T.B.; formal analysis, Á.B., I.K. and T.B.; investigation, Á.B., I.K. and T.B.; resources T.B.; data curation, I.K.; writing—original draft preparation, Á.B., I.K. and T.B.; writing—review and editing, Á.B., I.K. and T.B.; visualization, Á.B., I.K. and T.B.; supervision, T.B.; project administration, Á.B. All authors have read and agreed to the published version of the manuscript.

Funding

This research received no external funding.

Data Availability Statement

Data are unavailable due to privacy restrictions.

Conflicts of Interest

The authors declare no conflicts of interest.

Abbreviations

The following abbreviations are used in this manuscript:
AHPAnalytic Hierarchy Process
AIArtificial Intelligence
CFDsComputational Fluid Dynamics
EMSElectric Microbility-Sharing Service
GPSGlobal Positioning System
IoTsInternet of Things
LCALatent Class Analysis
LiDARLi Detection and Ranging
MMSFMicromobility Service Facility
PMDPersonal Mobility Device
SESsShared e-scooters
SMMShared Micromobility

References

  1. Nikiforiadis, A.; Paschalidis, E.; Stamatiadis, N.; Raptopoulou, A.; Kostareli, A.; Basbas, S. Analysis of attitudes and engagement of shared e-scooter users. Transp. Res. Part D Transp. Environ. 2021, 94, 102790. [Google Scholar] [CrossRef]
  2. Christoforou, Z.; Gioldasis, C.; de Bortoli, A.; Seidowsky, R. Who is using e-scooters and how? Evidence from Paris. Transp. Res. Part D Transp. Environ. 2021, 92, 102708. [Google Scholar] [CrossRef]
  3. Bigazzi, A.; Wong, K. Electric bicycle mode substitution for driving, public transit, conventional cycling, and walking. Transp. Res. Part D Transp. Environ. 2020, 85, 102412. [Google Scholar] [CrossRef]
  4. Gössling, S. Integrating e-scooters in urban transportation: Problems, policies, and the prospect of system change. Transp. Res. Part D Transp. Environ. 2020, 79, 102230. [Google Scholar] [CrossRef]
  5. Oeschger, G.; Carroll, P.; Caulfield, B. Micromobility and public transport integration: The current state of knowledge. Transp. Res. Part D Transp. Environ. 2020, 89, 102628. [Google Scholar] [CrossRef]
  6. Caspi, O.; Smart, M.J.; Noland, R.B. Spatial associations of dockless shared e-scooter usage. Transp. Res. Part D Transp. Environ. 2020, 86, 102396. [Google Scholar] [CrossRef]
  7. Laa, B.; Leth, U. Survey of E-scooter users in Vienna: Who they are and how they ride. J. Transp. Geogr. 2020, 89, 102874. [Google Scholar] [CrossRef]
  8. Younes, H.; Zou, Z.; Wu, J.; Baiocchi, G. Comparing the Temporal Determinants of Dockless Scooter-share and Station-based Bike-share in Washington, D.C. Transp. Res. Part A Policy Pract. 2020, 134, 308–320. [Google Scholar] [CrossRef]
  9. Reck, D.J.; Haitao, H.; Guidon, S.; Axhausen, K.W. Explaining shared micromobility usage, competition and mode choice by modelling empirical data from Zurich, Switzerland. Transp. Res. Part C Emerg. Technol. 2021, 124, 102947. [Google Scholar] [CrossRef]
  10. Lazarus, J.; Pourquier, J.C.; Feng, F.; Hammel, H.; Shaheen, S. Micromobility evolution and expansion: Understanding how docked and dockless bikesharing models complement and compete—A case study of San Francisco. J. Transp. Geogr. 2020, 84, 102620. [Google Scholar] [CrossRef]
  11. Zou, Z.; Younes, H.; Erdoğan, S.; Wu, J. Exploratory Analysis of Real-Time E-Scooter Trip Data in Washington, D.C. Transp. Res. Rec. 2020, 2674, 285–299. [Google Scholar] [CrossRef]
  12. Teusch, J.; Saavedra, B.N.; Scherr, Y.O.; Müller, J.P. Strategic planning of geo-fenced micro-mobility facilities using reinforcement learning. Transp. Res. Part E Logist. Transp. Rev. 2025, 194, 103872. [Google Scholar] [CrossRef]
  13. Saha, A.; Görçün, Ö.F.; Pamucar, D.; Arya, L.; Simic, V. Evaluation of shared micro-mobility systems for sustainable cities by using a consensus-based Fermatean fuzzy multiple objective optimization and full multiplicative form. Eng. Appl. Artif. Intell. 2024, 134, 108662. [Google Scholar] [CrossRef]
  14. Jaber, A.; Ashqar, H.; Csonka, B. Determining the Location of Shared Electric Micro-Mobility Stations in Urban Environment. Urban Sci. 2024, 8, 64. [Google Scholar] [CrossRef]
  15. Kim, M.; Moon, I. Spatio-temporal task pricing for shared electric micro-mobility battery-swapping platform with reinforcement learning. Int. J. Prod. Res. 2024, 2024, 2379561. [Google Scholar] [CrossRef]
  16. Candiani, M.; Malucelli, F.; Pascoal, M.; Schettini, T. Optimizing the integration of express bus services with micro-mobility: A case study. Transp. Res. Procedia 2024, 78, 289–296. [Google Scholar] [CrossRef]
  17. Mambazhasseri Divakaran, A.; Gkanas, E.; Shepherd, S.; Jewkes, J.; Abo-Serie, E. A CFD-Based Numerical Evaluation, Assessment and Optimization of Conjugate Heat Transfer for Aerodynamic Cooling of a Wheel-Hub-Motors in Micro-Mobility Vehicles. SAE Tech. Pap. 2023, 1, 0760. [Google Scholar] [CrossRef]
  18. Ayözen, Y.E. Statistical Optimization of E-Scooter Micro-Mobility Utilization in Postal Service. Energies 2023, 16, 1291. [Google Scholar] [CrossRef]
  19. Noorzad, N.; Tascikaraoglu, A.; Catalao, J.P.S. Economic Operation of a Multi-Energy System Considering the Impacts of Micro-Mobility. In Proceedings of the 2023 International Conference on Smart Energy Systems and Technologies (SEST), Mugla, Turkiye, 4–6 September 2023. [Google Scholar] [CrossRef]
  20. Ayözen, Y.E.; İnaç, H.; Atalan, A.; Dönmez, C.Ç. E-Scooter Micro-Mobility Application for Postal Service: The Case of Turkey for Energy, Environment, and Economy Perspectives. Energies 2022, 15, 7587. [Google Scholar] [CrossRef]
  21. Fu, X.; van Lierop, D.; Ettema, D. Shared micromobility in multimodal travel: Evidence from three European cities. Cities 2025, 158, 105664. [Google Scholar] [CrossRef]
  22. Hassanpour, A.; Bigazzi, A. Perceptions toward pedestrians and micromobility devices in off-street cycling facilities and multi-use paths in metropolitan Vancouver, Canada. Transp. Res. Part F Traffic Psychol. Behav. 2025, 109, 951–964. [Google Scholar] [CrossRef]
  23. Liu, Y.; Ouyang, Y. Planning charging stations for mixed docked and dockless operations of shared electric micromobility systems. Transp. Res. Part C Emerg. Technol. 2025, 171, 104989. [Google Scholar] [CrossRef]
  24. Oeschger, G.; Caulfield, B.; Carroll, P. User characteristics and preferences for micromobility use in first- and last-mile journeys in Dublin, Ireland. Travel Behav. Soc. 2025, 38, 100926. [Google Scholar] [CrossRef]
  25. Bobičić, O.; Esztergár-Kiss, D. Enablers and barriers to micromobility adoption: Urban and suburban contexts. J. Clean. Prod. 2024, 484, 144346. [Google Scholar] [CrossRef]
  26. Philips, I.; Azzouz, L.; de Séjournet, A.; Anable, J.; Behrendt, F.; Cairns, S.; Cass, N.; Darking, M.; Glachant, C.; Heinen, E.; et al. Domestic Use of E-Cargo Bikes and Other E-Micromobility: Protocol for a Multi-Centre, Mixed Methods Study. Int. J. Environ. Res. Public Health 2024, 21, 1690. [Google Scholar] [CrossRef]
  27. Distefano, N.; Leonardi, S.; Litrico, A. Analysis of Driving Behavior of Micromobility Vehicle Users at Mini-Roundabouts. Appl. Sci. 2024, 14, 11944. [Google Scholar] [CrossRef]
  28. Emami, E.; Ramezani, M. Integrated operator and user-based rebalancing and recharging in dockless shared e-micromobility systems. Commun. Transp. Res. 2024, 4, 100155. [Google Scholar] [CrossRef]
  29. Fuady, S.N.; Pfaffenbichler, P.C.; Susilo, Y.O. Bridging the gap: Toward a holistic understanding of shared micromobility fleet development dynamics. Commun. Transp. Res. 2024, 4, 100149. [Google Scholar] [CrossRef]
  30. Sarker, M.A.A.; Asgari, H.; Chowdhury, A.Z.; Jin, X. Exploring micromobility choice behavior across different mode users using machine learning methods. Multimodal Transp. 2024, 3, 100167. [Google Scholar] [CrossRef]
  31. Comi, A.; Polimeni, A. Assessing potential sustainability benefits of micromobility: A new data driven approach. Eur. Transp. Res. Rev. 2024, 16, 19. [Google Scholar] [CrossRef]
  32. Gao, K.; Jia, R.; Liao, Y.; Liu, Y.; Najafi, A.; Attard, M. Big-data-driven approach and scalable analysis on environmental sustainability of shared micromobility from trip to city level analysis. Sustain. Cities Soc. 2024, 115, 105803. [Google Scholar] [CrossRef]
Figure 1. Classification of articles considering subject areas based on a search in Scopus database using topic: “micromobility” AND “transportation”.
Symmetry 17 00547 g001
Figure 2. Classification of articles by year of publication based on search in Scopus.
Symmetry 17 00547 g002
Figure 3. The ten most cited articles based on a search in Scopus [1,2,4,5,6,7,8,9,10,11].
Symmetry 17 00547 g003
Figure 4. Distribution of micromobility related articles in journals, based on a search in Scopus.
Symmetry 17 00547 g004
Figure 5. Distribution of papers according to Scopus keywords.
Symmetry 17 00547 g005
Figure 6. The main topics of micromobility-related research fields.
Symmetry 17 00547 g006
Figure 7. Process of optimization.
Symmetry 17 00547 g007
Figure 8. Distribution of revenue from transportation costs among the products in case study A.
Symmetry 17 00547 g008
Figure 9. Distribution of revenue from transportation costs among the products in case study B.
Symmetry 17 00547 g009
Figure 10. The optimal first-mile–last-mile delivery route of micromobility device for case study B in a Google hybrid map style.
Symmetry 17 00547 g010
Figure 11. The optimal first-mile–last-mile delivery route of micromobility device for case study B in a Grashhopper map, including elevation data.
Symmetry 17 00547 g011
Table 1. Input parameters of the asymmetric transportation problem.
ParameterDescription
m Number of suppliers.
n Number   of   customers ;   in   this   approach ,   the   number   of   customers   and   suppliers   is   the   same   ( n = m ) because the first-mile/last-mile delivery tasks of the supply chain can be generated at any locations.
q i k Supply   capacity   of   product   k   at   supplier   i   for   i = 1 m   and   k = 1 k m a x .
d j k Demand   for   product   k   at   customer   j   for   j = 1 n   and   k = 1 k m a x .
c i j k Specific transportation cost per unit from supplier i to customer j.
Table 2. Supply availability of products (from product A to product E) at each location for case study A in [pcs].
LOC_021LOC_045LOC_013LOC_022LOC_065LOC_154LOC_007LOC_076LOC_077LOC_020LOC_059LOC_160LOC_011LOC_071LOC_038LOC_003
A12045024031054090540220
B122301412098083066024
C415232002211443302523120012
D0098700856002500
E0232100254198100032652
Table 6. The results of the optimization of asymmetric transportation problem for each product types for case study A 1.
LOC_021LOC_045LOC_013LOC_022LOC_065LOC_154LOC_007LOC_076LOC_077LOC_020LOC_059LOC_160LOC_011LOC_071LOC_038LOC_003
LOC_021--B12-C41----------A12
LOC_045-----B1------E23A45B22, C52-
LOC_013D4, E9----------E12--C32, D1D4
LOC_022-D5------------B14, D3-
LOC_065-----A19D1-B120D6--A5--
LOC_154E13---C22, E12----0---0--
LOC_007---A18----B9A13, C11--E410--
LOC_076---- -D3--C21-B8, D5, E90C23--
LOC_077---A6, C19C14D5------E8A5-A43
LOC_020D6, E1-B8-------------
LOC_059---A9, C25-------B3----
LOC_160---C22----0-----C1-
LOC_011-A22----D20A9, B6--A23--C12-
LOC_071-D5-E10E22A14-A8B6-0-----
LOC_038E21---------E34-E10---
LOC_003--B2E2-B21---C120B1----
1 Xn in the table defines that n pieces are transported from product type X in the given relation. For example, B12 defines that 12 pieces of product type B are transported from LOC_021 to LOC_013.
Table 7. The specific relationships where idle routes need to be established in Case Study A.
LOC_045LOC_013LOC_007LOC_076LOC_077LOC_059LOC_011LOC_003
LOC_02139.0276.54184.78196.16200.00184.78141.4239.02
LOC_02276.5439.02111.11141.42166.29196.16196.16141.42
LOC_154141.42111.1139.0276.54111.11166.29196.16184.78
LOC_020200.00196.16111.1176.5439.0239.02111.11184.78
LOC_160184.78196.16166.29141.42111.1139.0239.02141.42
LOC_038111.11141.42200.00196.16184.78141.4276.5439.02
Table 8. The optimal assignment of idle routes in Case Study A.
LOC_045LOC_013LOC_007LOC_076LOC_077LOC_059LOC_011LOC_003
LOC_02112000000
LOC_02202030000
LOC_15400200000
LOC_02000001000
LOC_16000021110
LOC_03800000012
Table 9. Supply availability of products (from raw material A to raw material D) at each location for case study B in [kg].
Creppy
Pancake
Rákóczi Cellar RestaurantGrizzly
Music Pub
Mill
Restaurant
Ciao Martin RestaurantBabylon
Pizzeria
Rossita
Pizzeria
Bitang Joe Burger
A8.92.80010.706.60
B007.511.103.74.25.1
C6.107.205504.0
D11.14.42.10005.52.1
Table 10. Supply demands of products (from raw material A to raw material D) at each location for case study B in [kg].
Creppy
Pancake
Rákóczi Cellar RestaurantGrizzly Music PubMill
Restaurant
Ciao Martin RestaurantBabylon
Pizzeria
Rossita
Pizzeria
Bitang Joe Burger
A001260704
B1011.60010000
C040507.106.7
D000889.200
Table 11. The asymmetric transportation cost matrix for case study B in [EURO/kg].
Creppy
Pancake
Rákóczi Cellar RestaurantGrizzly Music PubMill
Restaurant
Ciao Martin RestaurantBabylon
Pizzeria
Rossita
Pizzeria
Bitang Joe Burger
Creppy Pancake03.0354.2123.9988.0648.0645.4963.57
Rákóczi Cellar Restaurant3.24903.6773.4638.2786.784.8543.463
Grizzly Music Pub4.1053.89103.8918.7066.3523.9983.677
Mill Restaurant4.2123.9983.35608.2785.9244.643.463
Ciao Martin Restaurant9.998.7069.5629.134010.63210.6328.278
Babylon Pizzeria7.856.9946.3525.719.56208.4925.924
Rossita Pizzeria4.644.4263.7844.5339.1347.63604.64
Bitang Joe Burger4.4263.6773.7843.4637.4225.715.0680
Table 12. The travel distances between each location for case study B in [m].
Creppy
Pancake
Rákóczi Cellar RestaurantGrizzly Music PubMill
Restaurant
Ciao Martin RestaurantBabylon
Pizzeria
Rossita
Pizzeria
Bitang Joe Burger
Creppy Pancake0250800700260026001400500
Rákóczi Cellar Restaurant3500550450270020001100450
Grizzly Music Pub750650065029001800700550
Mill Restaurant8007004000270016001000450
Ciao Martin Restaurant35002900330031000380038002700
Babylon Pizzeria25002100180015003300028001600
Rossita Pizzeria10009006009503100240001000
Bitang Joe Burger9005506004502300150012000
Table 13. The results of the asymmetric transportation problem for each product types for case study B.
Creppy PancakeRákóczi Cellar RestaurantGrizzly Music PubMill RestaurantCiao Martin
Restaurant
Babylon PizzeriaBitang Joe Burger
Creppy Pancake-C4A2.6A6, D3.1D8-A0.3, C2.1
Rákóczi Cellar Restaurant--A2.8D4.4---
Grizzly Music PubB5.8B1.7-C1-C1.6, D2.1C4.6
Mill Restaurant-B9.9--B1.2--
Ciao Martin Restaurant-----A7, C5.5A3.7
Babylon Pizzeria----B3.7--
Rossita PizzeriaB4.2-A6.6D0.5-D5-
Bitang Joe Burger----B5.1D2.1-
Table 14. The specific relationships where idle routes need to be established in Case Study B.
Creppy PancakeGrizzly Music PubRossita Pizzeria
Rákóczi Cellar Restaurant3505501100
Mill Restaurant8004001000
Babylon Pizzeria250018002800
Bitang Joe Burger9006001200
Table 15. The optimal assignment of idle routes in Case Study B.
Creppy PancakeGrizzly Music PubRossita Pizzeria
Rákóczi Cellar Restaurant100
Mill Restaurant004
Babylon Pizzeria230
Bitang Joe Burger101
Disclaimer/Publisher’s Note: The statements, opinions and data contained in all publications are solely those of the individual author(s) and contributor(s) and not of MDPI and/or the editor(s). MDPI and/or the editor(s) disclaim responsibility for any injury to people or property resulting from any ideas, methods, instructions or products referred to in the content.

