Article

Development of a Micro-Radian Phasemeter and Verification Based on Single Pilot Tone for Space Gravitational Wave Detection

1
School of Electronic Information Engineering, Changchun University of Science and Technology, Changchun 130022, China
2
Changchun Institute of Optics, Fine Mechanics and Physics, Chinese Academy of Sciences, Changchun 130033, China
3
School of Physics and Photoelectric Engineering, Hangzhou Institute for Advanced Study, University of Chinese Academy of Sciences, Hangzhou 310024, China
*
Author to whom correspondence should be addressed.
Symmetry 2025, 17(4), 519; https://doi.org/10.3390/sym17040519
Submission received: 11 March 2025 / Revised: 22 March 2025 / Accepted: 26 March 2025 / Published: 30 March 2025
(This article belongs to the Section Engineering and Materials)

Abstract

:
Space gravitational wave detection uses a three-satellite formation scheme, with the distance between satellites reaching hundreds of thousands or millions of kilometers. According to the principle of laser heterodyne interferometry, the distance change between the inter-satellite inertial references caused by the gravitational wave event is converted into the phase change of the heterodyne interference signal. The payload for measuring the phase change information is the phasemeter. The mission requires that the phasemeter’s ranging accuracy is 1 picometer, and the corresponding phase measurement accuracy is required to reach 2π μrad/Hz1/2 @(0.1 mHz–1 Hz). Due to the inter-satellite Doppler effect, the dynamic range of the interference signal frequency reaches 5 MHz to 25 MHz. Due to the sampling jitter noise of the interference signal, it is necessary to suppress the noise through a single pilot tone. This paper introduces the development of the phasemeter, which uses a single pilot tone to suppress sampling jitter noise. The test results show that when the dynamic range of the interference signal frequency is 5 MHz to 25 MHz, the phasemeter meets the mission indicator requirement of 2π μrad/Hz1/2 @(0.1 mHz–1 Hz).

1. Introduction

The scientific implications of gravitational wave detection have transcended the initial validation of the relativity theory, evolving into a revolutionary astronomical discipline. In addition to electromagnetic observations, gravitational waves now offer unprecedented insights into astrophysical phenomena, including early universe evolution, galactic structural formation, and complex physical processes in astrophysics and cosmology [1,2]. The 2016 announcement by the Laser Interferometer Gravitational Wave Observatory (LIGO) marked a historic milestone with the first direct detection of gravitational waves, inaugurating a new era in gravitational wave astronomy [3]. Concomitant advances in black hole research have highlighted the prevalence of gravitational wave sources within the 0.1 mHz–1 Hz frequency band, primarily originating from binary black hole mergers with masses ranging from 10 2 to 10 6 solar masses [4]. However, terrestrial gravitational wave detectors face inherent limitations imposed by seismic vibrations, gravitational gradient noise, and interference arm length constraints, restricting their sensitivity to low-frequency and mid-frequency gravitational waves emitted by celestial events. This requires the development of long-baseline space-based laser interference systems [5]. In 1993, the European Space Agency (ESA) [6] and the National Aeronautics and Space Administration (NASA) jointly proposed the Laser Interferometer Space Antenna (LISA) [7], designed to measure gravitational waves using a constellation of three spacecraft arranged in an equilateral triangle configuration. Subsequent initiatives include the Taiji program [8,9] proposed by the Chinese Academy of Sciences (CAS) in 2012 and the Tianqin program [10] proposed by Sun Yat-sen University (SYSU) in 2014. Although both share the fundamental configuration of LISA, they differ in orbital mechanics: the Tianqin program operates in geocentric orbit, whereas the LISA program and Taiji program utilize heliocentric orbits. Additionally, each program employs different arm lengths between spacecraft [11].
Based on the principle of laser heterodyne interferometry, gravitational wave detection missions employ laser interference systems to measure picometer-level distance variations between inter-satellite inertial references. These distance changes are converted into phase changes in the interference signals, which are detected and measured by dedicated payloads called phasemeters. The relative motion between satellites produces Doppler shifts that affect the beat-note frequency generated in interferometry [12,13]. Jiafeng Zhang [14] summarized the external constraints on beat-note frequency. First, as heterodyne interference is adopted, the interference signal frequency cannot be 0 Hz. In addition, it is necessary to avoid the low-frequency band dominated by laser relative intensity noise (RIN). Furthermore, the frequency generated by the analog-to-digital converter (ADC) sampling pilot tone cannot be consistent with the frequency of the interference signal. Finally, the bandwidth of the phase meter is limited. Therefore, an offset frequency is usually added to satisfy these external constraints. Beat-note frequencies for the LISA mission [15] and the Taiji mission [16] limited to 5–25 MHz. Beat note has the same meaning as the interference signal in this paper. For space gravitational wave detection missions, achieving picometer-level range accuracy (1 pm) requires phase measurement noise of 2π μrad/Hz1/2 @(0.1 mHz–1 Hz) [17,18].
The phasemeter and the ADC are driven by the onboard ultra-stable oscillator (USO) [19]. During the digital sampling process of the heterodyne interference signal, clock jitter noise will also be introduced [20]. Even for a perfect system clock, the signal is digitized at non-equidistant intervals because of intrinsic timing jitter of the ADC. The digital replica of the signal will deviate from the original. To measure intrinsic noise and remove it from the measured signal, a reference signal at a different frequency (pilot tone) is digitized simultaneously by the same ADC [12]. A frequency distribution system has been proposed, which has the functions of generating GHz frequencies for inter-satellite noise transmission, the system clock frequency of the phasemeter, and the pilot tone. The above frequencies remain constant during system operation. Therefore, before integrating the frequency distribution system, it is necessary to verify the sampling jitter noise suppression of the phase measurement results of the full dynamic frequency range interference signal using a single frequency pilot for the phasemeter. The above research results can provide the feasibility verification and engineering development basis for functional expansion of the phasemeter in the future, as well as integration with the frequency distribution system.
In recent years, several research teams have verified the phase measurement function, but the frequencies of the interference signals and the pilot tones are selected differently. Heshan Liu [21] employed a 10 MHz interference signal and a 14 MHz pilot tone, while Xiangqing Huang [22] adopted a 15 MHz interference signal and a 31 MHz pilot tone. Qiangtao Zhang [23] further expanded the interference testing signals of 5 MHz, 10 MHz, 15 MHz, 20 MHz, and 25 MHz with the corresponding 15.1 MHz, 25.1 MHz, 25.1 MHz, 25.1 MHz, and 29.1 MHz pilot tones, respectively.
This paper presents a phasemeter development scheme that validates the full dynamic range (5 MHz to 25 MHz) of interference signals using a single 31 MHz pilot tone. The experimental results show that phase measurement noise reaches 2π μrad/Hz1/2 @(0.1 mHz–1 Hz), meeting the requirements of space gravitational wave detection missions. This can expand and supplement the research results of other research teams mentioned earlier.

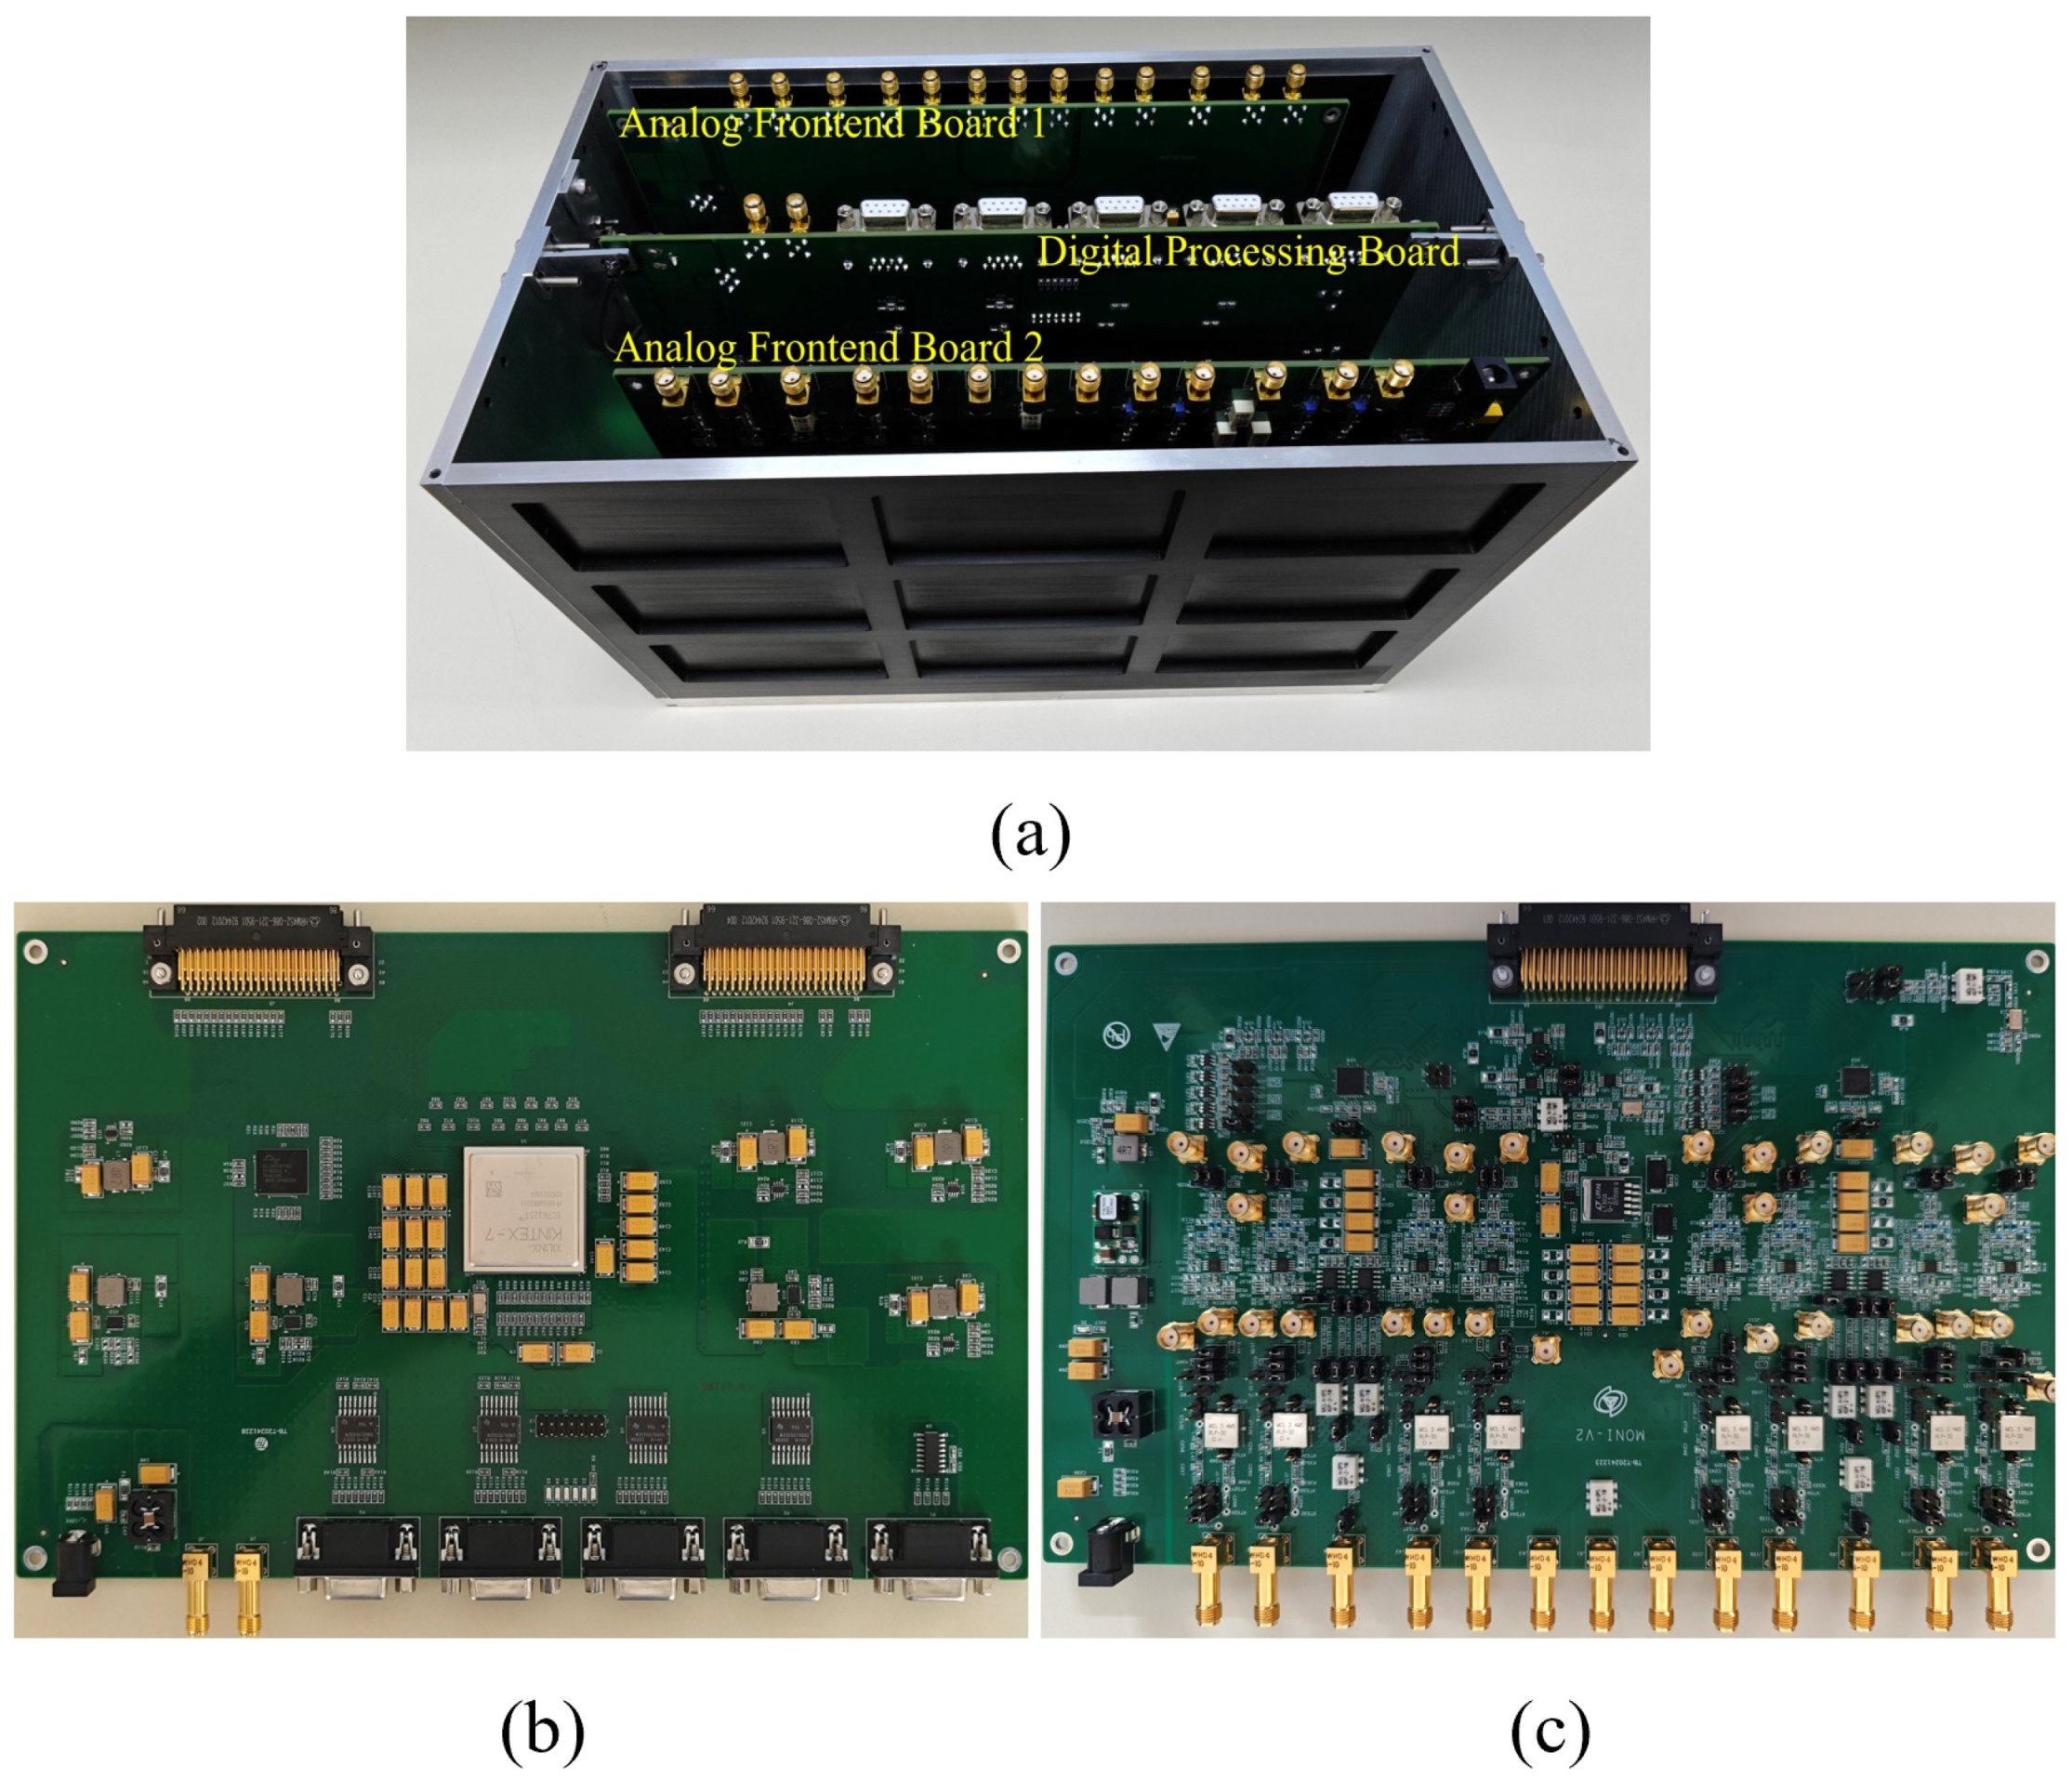
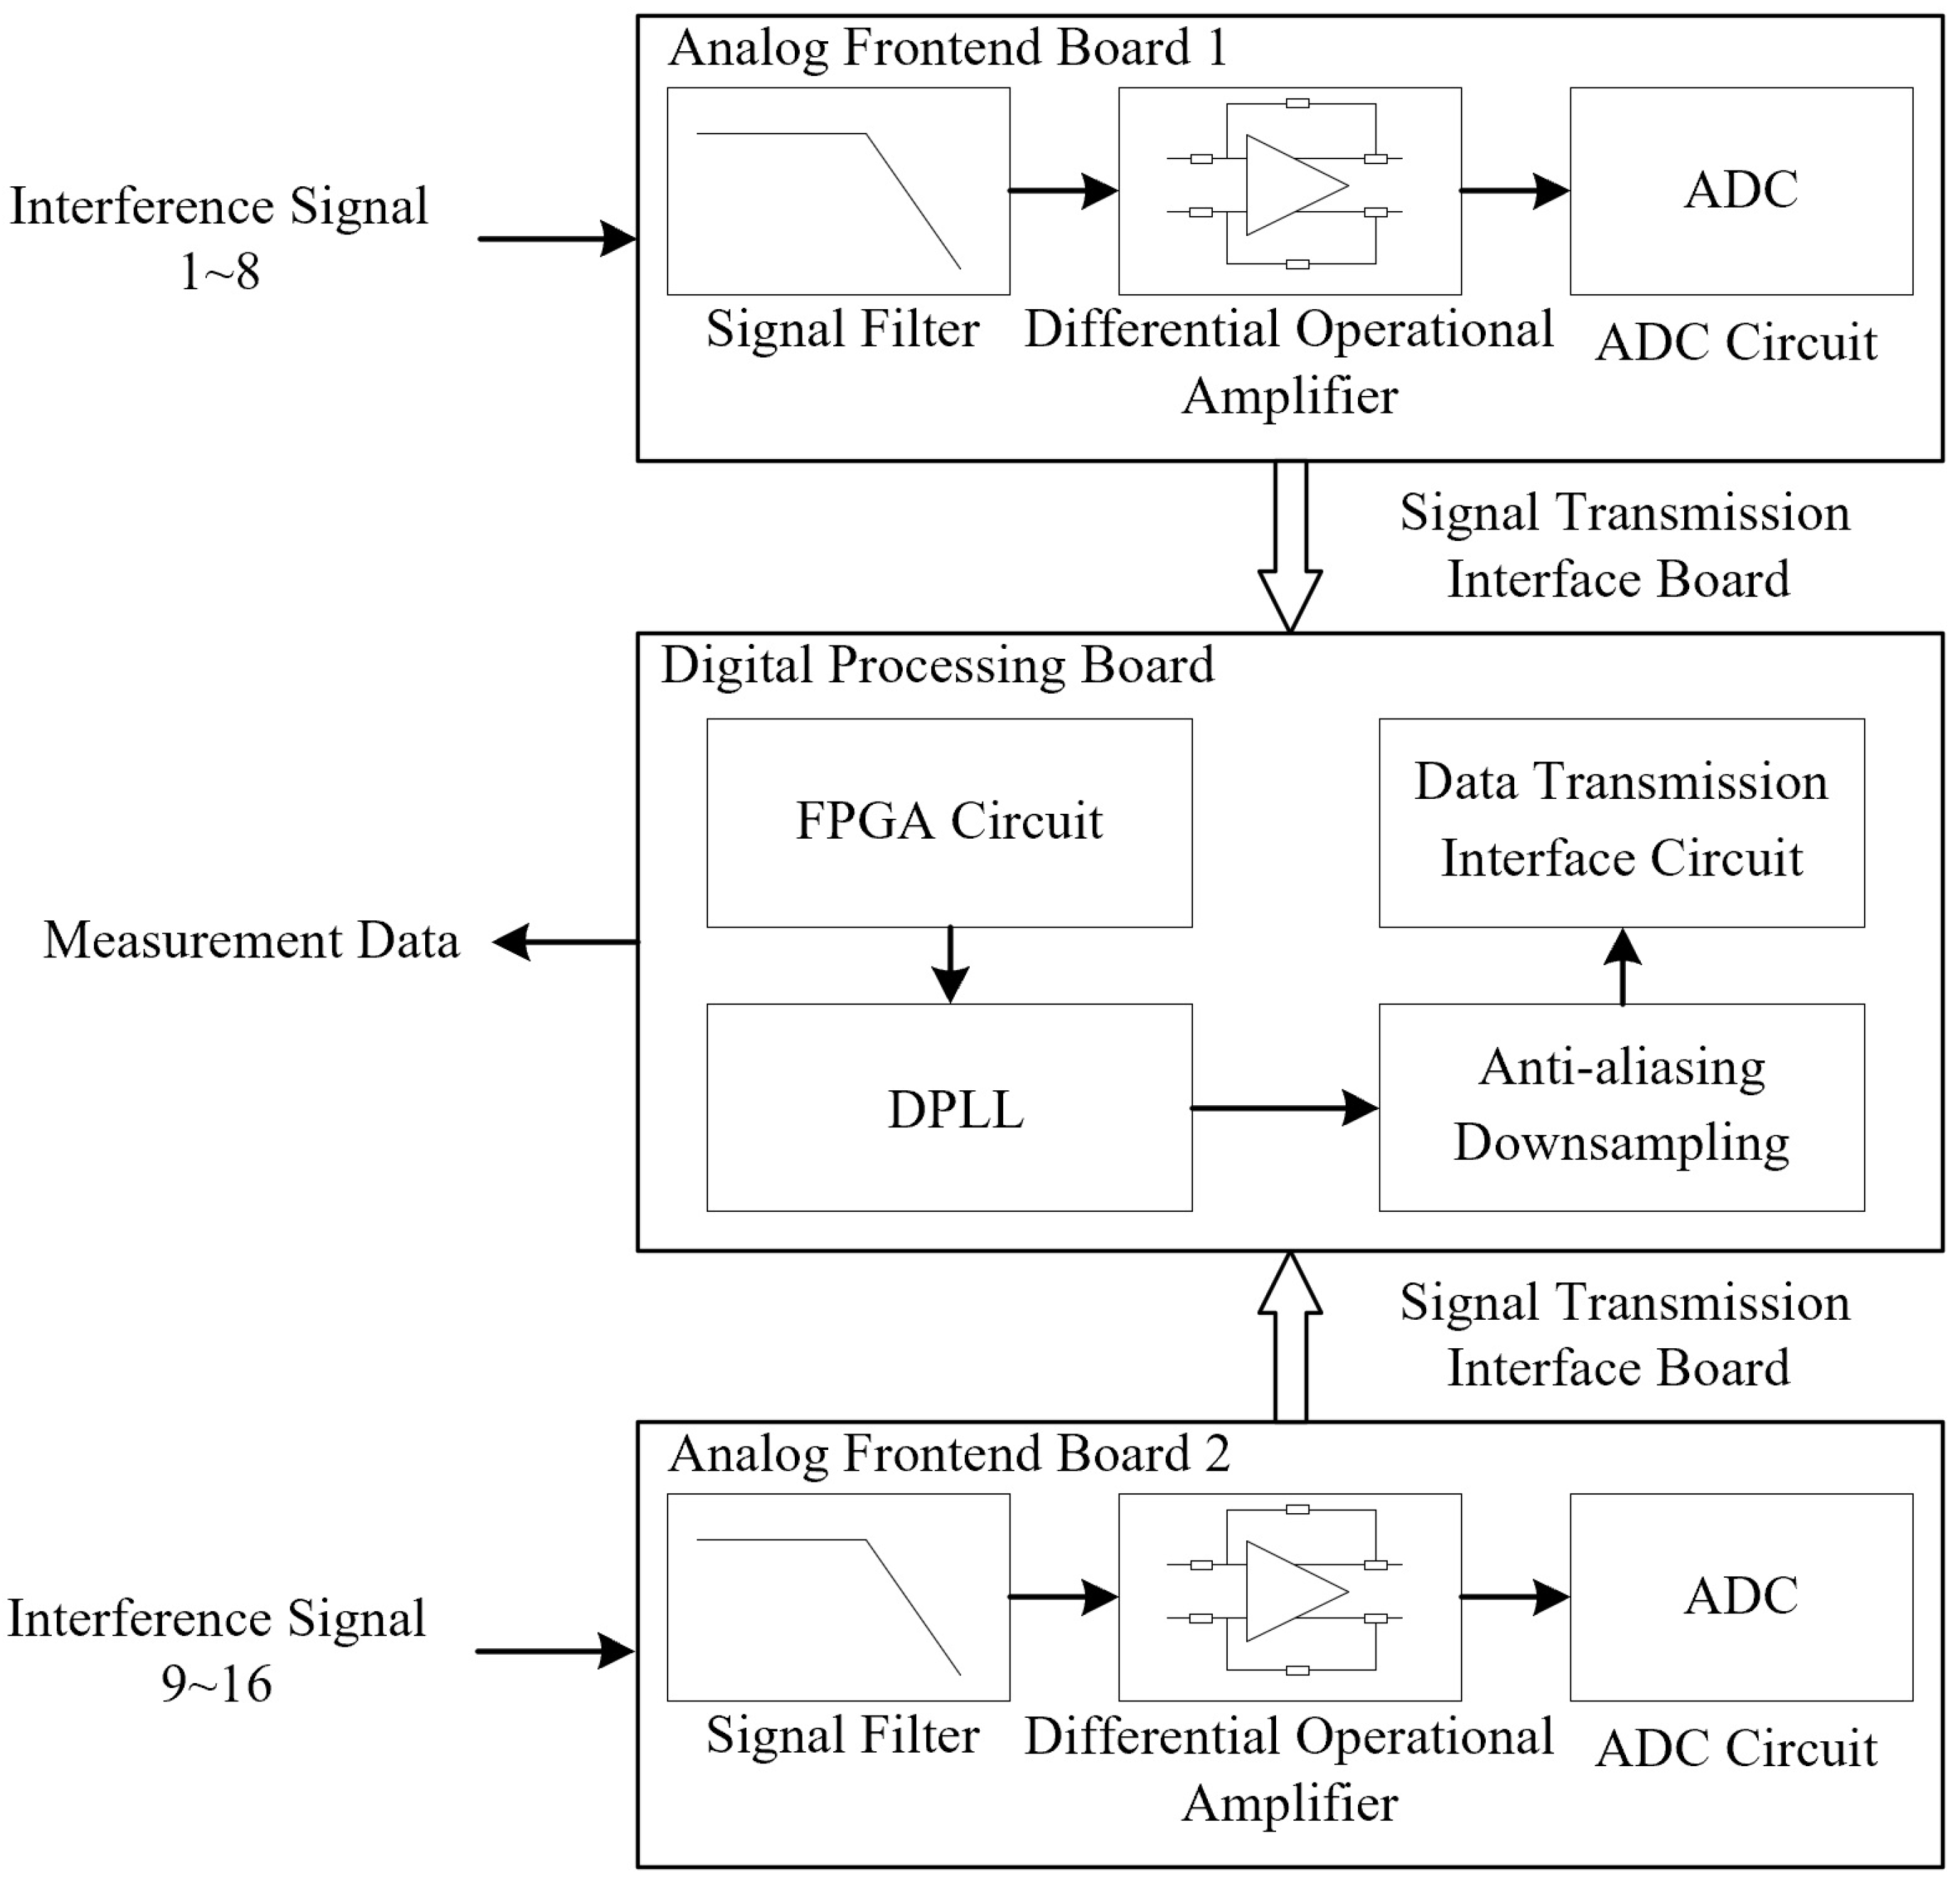
2. The Development of Phasemeter

The phasemeter employs a modular architecture with analog and digital subsystems, consisting of three circuit board types: analog front-end, digital processing, and inter-board signal transmission interface. The analog front-end board handles the analog-to-digital conversion path for interference signal input, while the digital processing board implements post-ADC signal processing algorithms and external data communication protocols. The inter-board signal transmission interface board provides high-speed signal routing between the analog and digital subsystems. A complete phasemeter assembly incorporates two analog front-end boards (each supporting 8-channel interference signal processing), one digital processing board, and one signal transmission interface board. The hardware diagram of the multichannel phasemeter is shown in Figure 1.
The principal block diagram is shown in Figure 2. Following sequential low-pass filtering, differential operational amplifier, and analog-to-digital conversion by two analog front-end boards, the processed data from the 16 interference signals are transferred to the digital processing board via the signal transmission interface board. On the FPGA platform, the DPLL and data downsampling processes are implemented, and the measurement results are ultimately outputted.

2.1. Signal Filtering Circuit

The signal filtering module performs two critical functions: (1) optimizing stopband attenuation characteristics to suppress out-of-band noise interference; and (2) improving the signal transmission rate to increase system response speed. The analog-to-digital converter (ADC) utilized in the phasemeter features an operational bandwidth of 650 MHz, significantly exceeding the measured signal frequency range (5 to 25 MHz). To prevent high-frequency noise from aliasing in the signal band, a precise cutoff frequency configuration is required to establish an attenuation channel. For this purpose, the Mini-Circuits RLP-30+ low-pass filter chip is selected, offering a cutoff frequency of −3 dB of 37 MHz, which fully encompasses the phasemeter measurement band while maintaining low insertion loss characteristics.

2.2. Differential Operational Amplifier Circuit

Differential operational amplifier circuit modules are designed to convert single-ended signals into differential signal pairs, effectively rejecting common-mode noise interference to enhance the signal-to-noise ratio (SNR) of the system and interference rejection capability. In contrast to the transformer scheme, which suffers from insignificant noise rejection of the pilot tone in the low-frequency band (<3 MHz) and thermal-magnetic interference defects [24], this article uses the AD8138 differential amplifier to construct the differential operational amplifier module. The device achieves balanced differential output through an internal feedback network, featuring a −3 dB bandwidth of 320 MHz, a voltage slew rate of 1150 V/μs, and low harmonic distortion throughout the operational bandwidth. Its external circuit design simplifies the superposition process of the measured signal and pilot tone frequency, while optimizing the channel consistency through symmetric impedance matching to ensure the phase stability of the signal transmission.

2.3. ADC Circuit

In the ADC circuit, the AD9253 14 bit four-channel ADC is utilized to perform differential to digital conversion. This device supports configurable sampling rates of 80/105/125 Mbps and employs a multi-channel synchronous sampling architecture to ensure timing synchronization accuracy between channels. Thus, it overcomes the phase mismatch problem caused by independent sampling of multiple single-channel ADC solutions and establishes the basis for accurate inter-channel signal synchronization for the phasemeter.

2.4. FPGA Circuit

For the selection of programmable logic devices, the XC7K325T-2FFG900I FPGA from Xilinx’s Kintex-7 series serves as the core processing unit. This device incorporates 326,080 programmable logic cells, 50,950 configurable logic slices, and a hierarchical memory architecture: 4000 Kb distributed RAM for high-speed data caching and 445 × 36 Kb block RAM modules to support large-scale data staging. Its 500 configurable I/O ports provide hardware expansion capability for the phasemeter’s multichannel synchronous acquisition system. These resource allocations are optimally suited to meet the requirements for phase calculation processing, data buffering, and interface control.

2.5. Data Transmission Interface Circuit

This paper employs two low-voltage differential signaling (LVDS) buses to accommodate the 16-channel phasemeter measurement data, with a unified baud rate of 10 Mbps that supports multitype and high data-rate down-link transmission. Additionally, two RS-232 interfaces are utilized for auxiliary data communication, configured at a consistent baud rate of 115,200 bps.

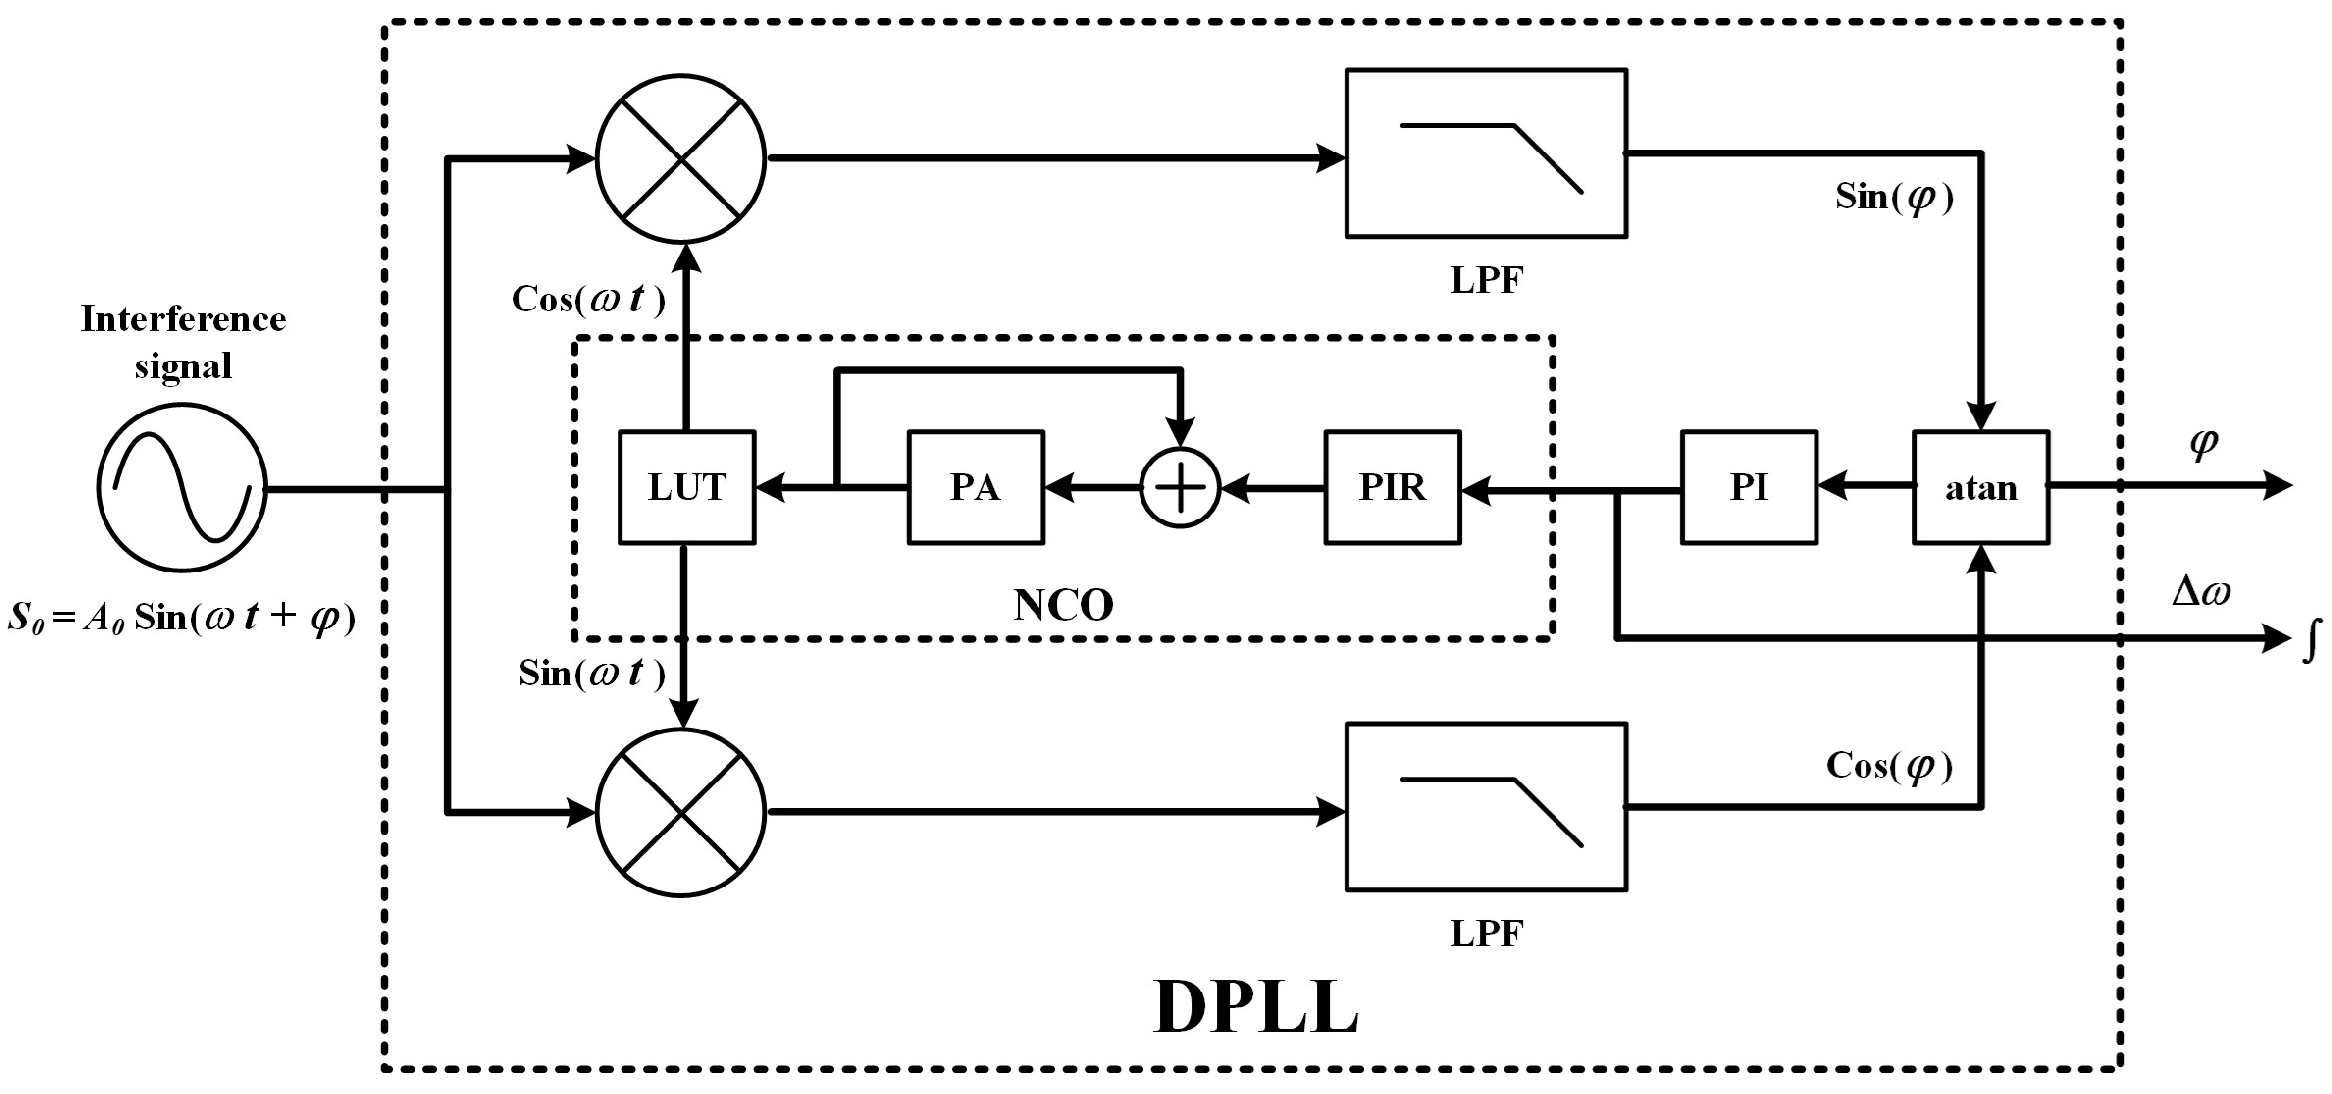
2.6. DPLL (Digital Phase-Locked Loop)

The DPLL phase measurement technique operates on the principle of I/Q phase demodulation. It introduces a frequency feedback loop to form a phase-locked loop and ultimately performs phase measurement through the frequency change in the numerically controlled oscillator (NCO). This technique can meet the special requirements of spatial laser interference measurements and has been applied to this task. The working principle of the DPLL phase measurement algorithm is illustrated in Figure 3 [21,25].
Assume the expression of the measured signal as defined in Equation (1).
S 0 = A 0 sin ( ω t + φ )
The signal frequency is first predicted or the frequency value at the initial moment is measured by a frequency measuring device. Based on this frequency value, an internal reference quadrature signal is generated as in Equation (2).
R c o s = c o s ( ω t ) R s i n = s i n ( ω t ) .
The internal quadrature reference signals are mixed with the measurement signals by multiplication, as defined in Equation (3).
S 0 × R c o s = A 0 sin ( ω t + φ ) × c o s ( ω t ) = A 0 2 ( s i n ( φ ) + s i n ( 2 ω t + φ ) ) S 0 × R s i n = A 0 sin ( ω t + φ ) × s i n ( ω t ) = A 0 2 ( c o s ( φ ) c o s ( 2 ω t + φ ) ) .
Subsequently, the octave component of the above equation is filtered out by a filter, yielding Equation (4).
P = A 0 2 × c o s ( φ ) Q = A 0 2 × s i n ( φ ) .
Finally, the phase value is derived via an inverse tangent operation on the preceding equation, as depicted in Equation (5).
φ = arctan ( P / Q )
The requency discrepancy Δ ω between the measured signal and the NCO results in an ultimate phase offset of Δ ω + φ . Phase derivative computation yields the frequency difference Δ ω , which is fed back to the NCO via a closed-loop control mechanism to achieve phase synchronization. For fluctuating signal frequencies, frequency variations are tracked by monitoring changes in Δ ω , while integral calculation extracts information on phase fluctuation.
This analysis reveals that the NCO serves as the core algorithm unit in DPLL phase measurement. The algorithm fundamentally achieves phase locked between the measured signal and NCO, and computed signal frequency (phase) variations by tracking NCO frequency changes during DPLL locking. Meanwhile, setting different initial values for the NCO at the initial time and choosing an appropriate filter, the DPLL loop can capture the phase changes of different frequency components in the signal.

2.7. Anti-Aliasing Downsampling

The DPLL output measurement data feature a sampling frequency up to 80 MHz, while the phase measurement sensitivity evaluation band spans only 0.1 mHz–1 Hz, making the majority of the bandwidth signal irrelevant. According to signal processing theory, downsampling the original high-frequency signal leads to noise aliasing into the low-frequency band. To address this, an anti-aliasing downsampling algorithm is implemented: prefiltering followed by decimation. According to previous research results [26], multiple filters are cascaded to perform anti-aliasing downsampling of the measurement data, including the CIC filter, compensation filter, multirate FIR filter and HB filter, and the structure schematic is shown in Figure 4.
The first stage is a variable extraction factor filter bank, which consists of 8×, 4× and 2 × CIC filters, and can accomplish 1∼32 times downsampling by cascading different ex-traction multiples; the second stage is a fixed extraction factor CIC filter bank, which consists of three 16 × CIC filters in cascade, and can accomplish 163 times downsampling; the third stage is a compensating filter, which is used to reduce the passband attenuation; the fourth stage is a multi-rate FIR and HB filter bank, which can realize multiple times of downsampling according to different needs. The third stage is a compensation filter to reduce the passband attenuation; the fourth stage is a multi-rate FIR and HB filter bank, which can realize multiple times of downsampling according to different needs.

3. The Verification of Phasemeter

3.1. Phasemeter Performance Evaluation Method

In this paper, absolute measurement, split measurement, and sampling jitter noise suppression are used. Phase measurement noises are evaluated using the amplitude spectral density [27] and smoothed using the LISA Technology Package Data Analysis Toolbox (LTPDA) developed by the Albert Einstein Institute in Germany [28].

3.1.1. Absolute Measurement

Direct phase measurements are performed on an interference signal with phase φ r . The measured phase φ I n S is directly compared to the reference phase φ r , and the phase difference φ I n S φ r serves as the phase noise floor of the measurement system. Under the ideal input signal assumption, the performance evaluation results directly quantify additive noise and phase noise contributions within the measurement chain.

3.1.2. Split Measurement

Separation measurement, also known as zero measurement, is measured by separating an interference signal with a phase of φ I n S into two signals, I n S 1 and I n S 2, and performing phase measurements on the two signals, respectively, to obtain the phases φ I n S 1 and φ I n S 2 , which can be φ I n S 1 φ I n S 2 as the background noise of the phase measurement, and the performance evaluation results help detect and suppress uncorrelated noise sources in the two measurement chains.

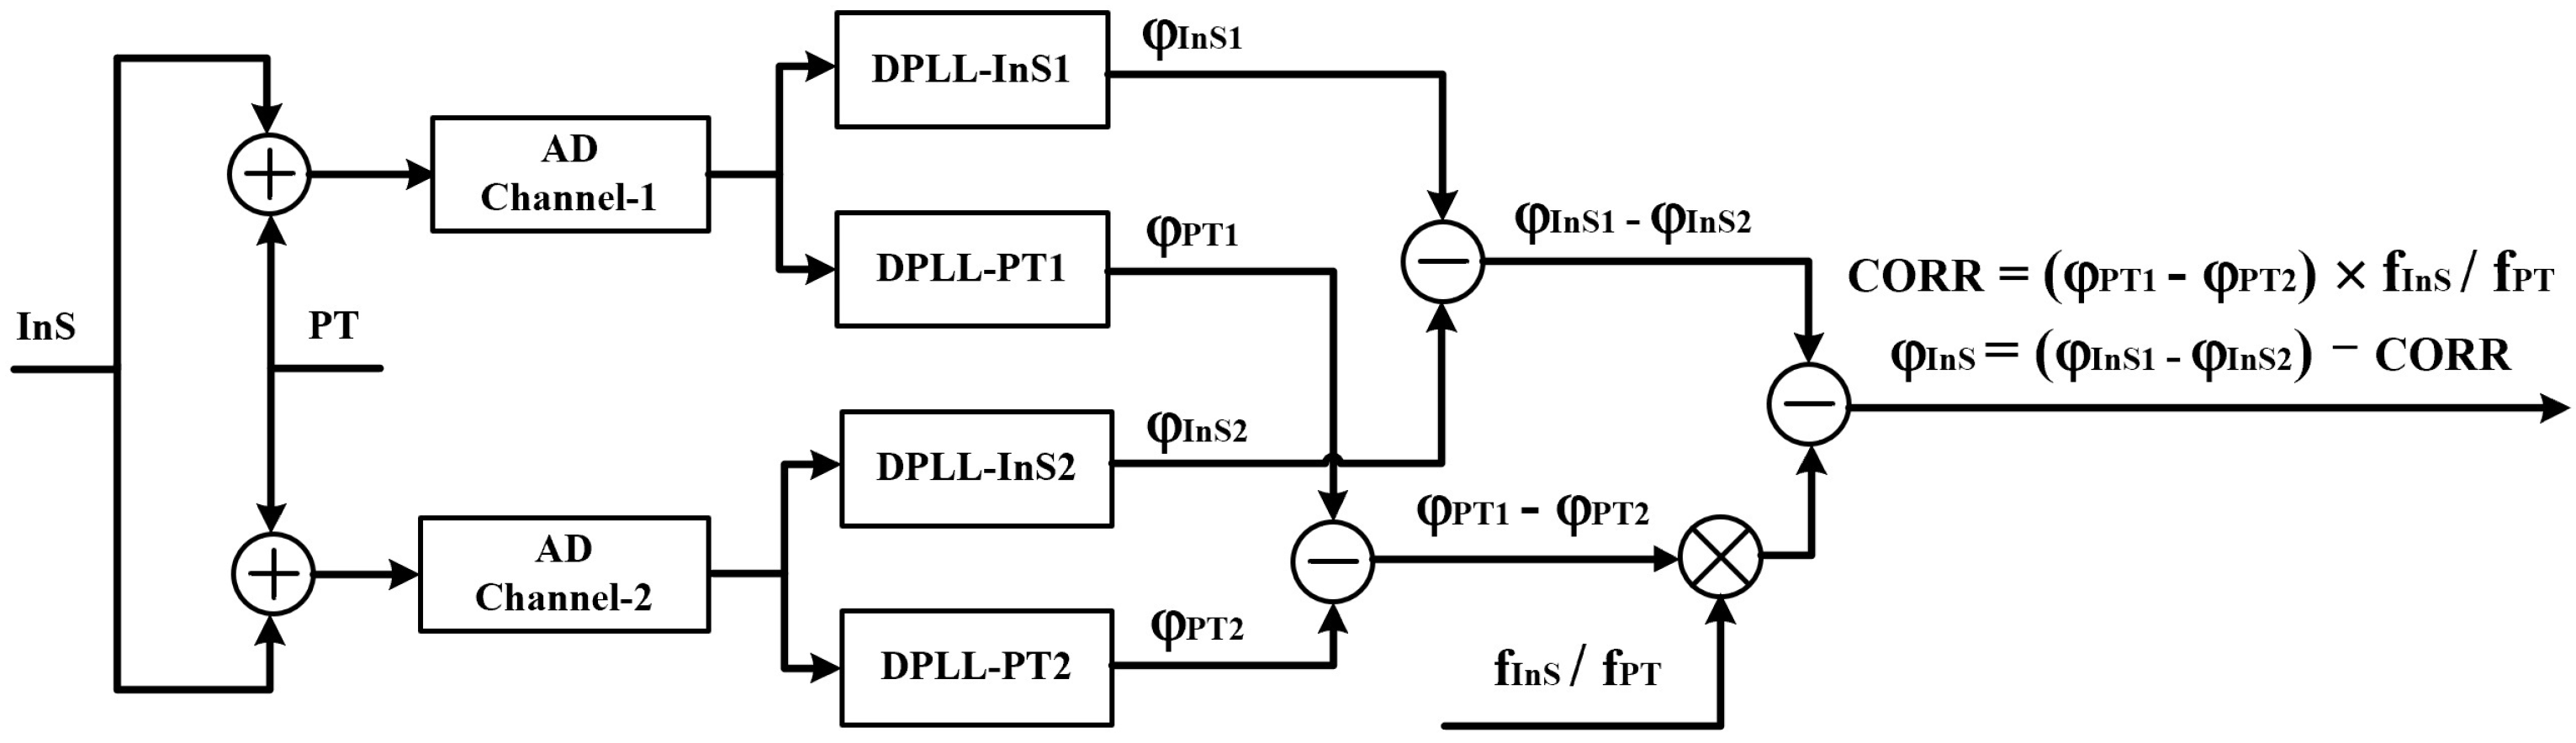
3.1.3. Sampling Jitter Noise Suppression
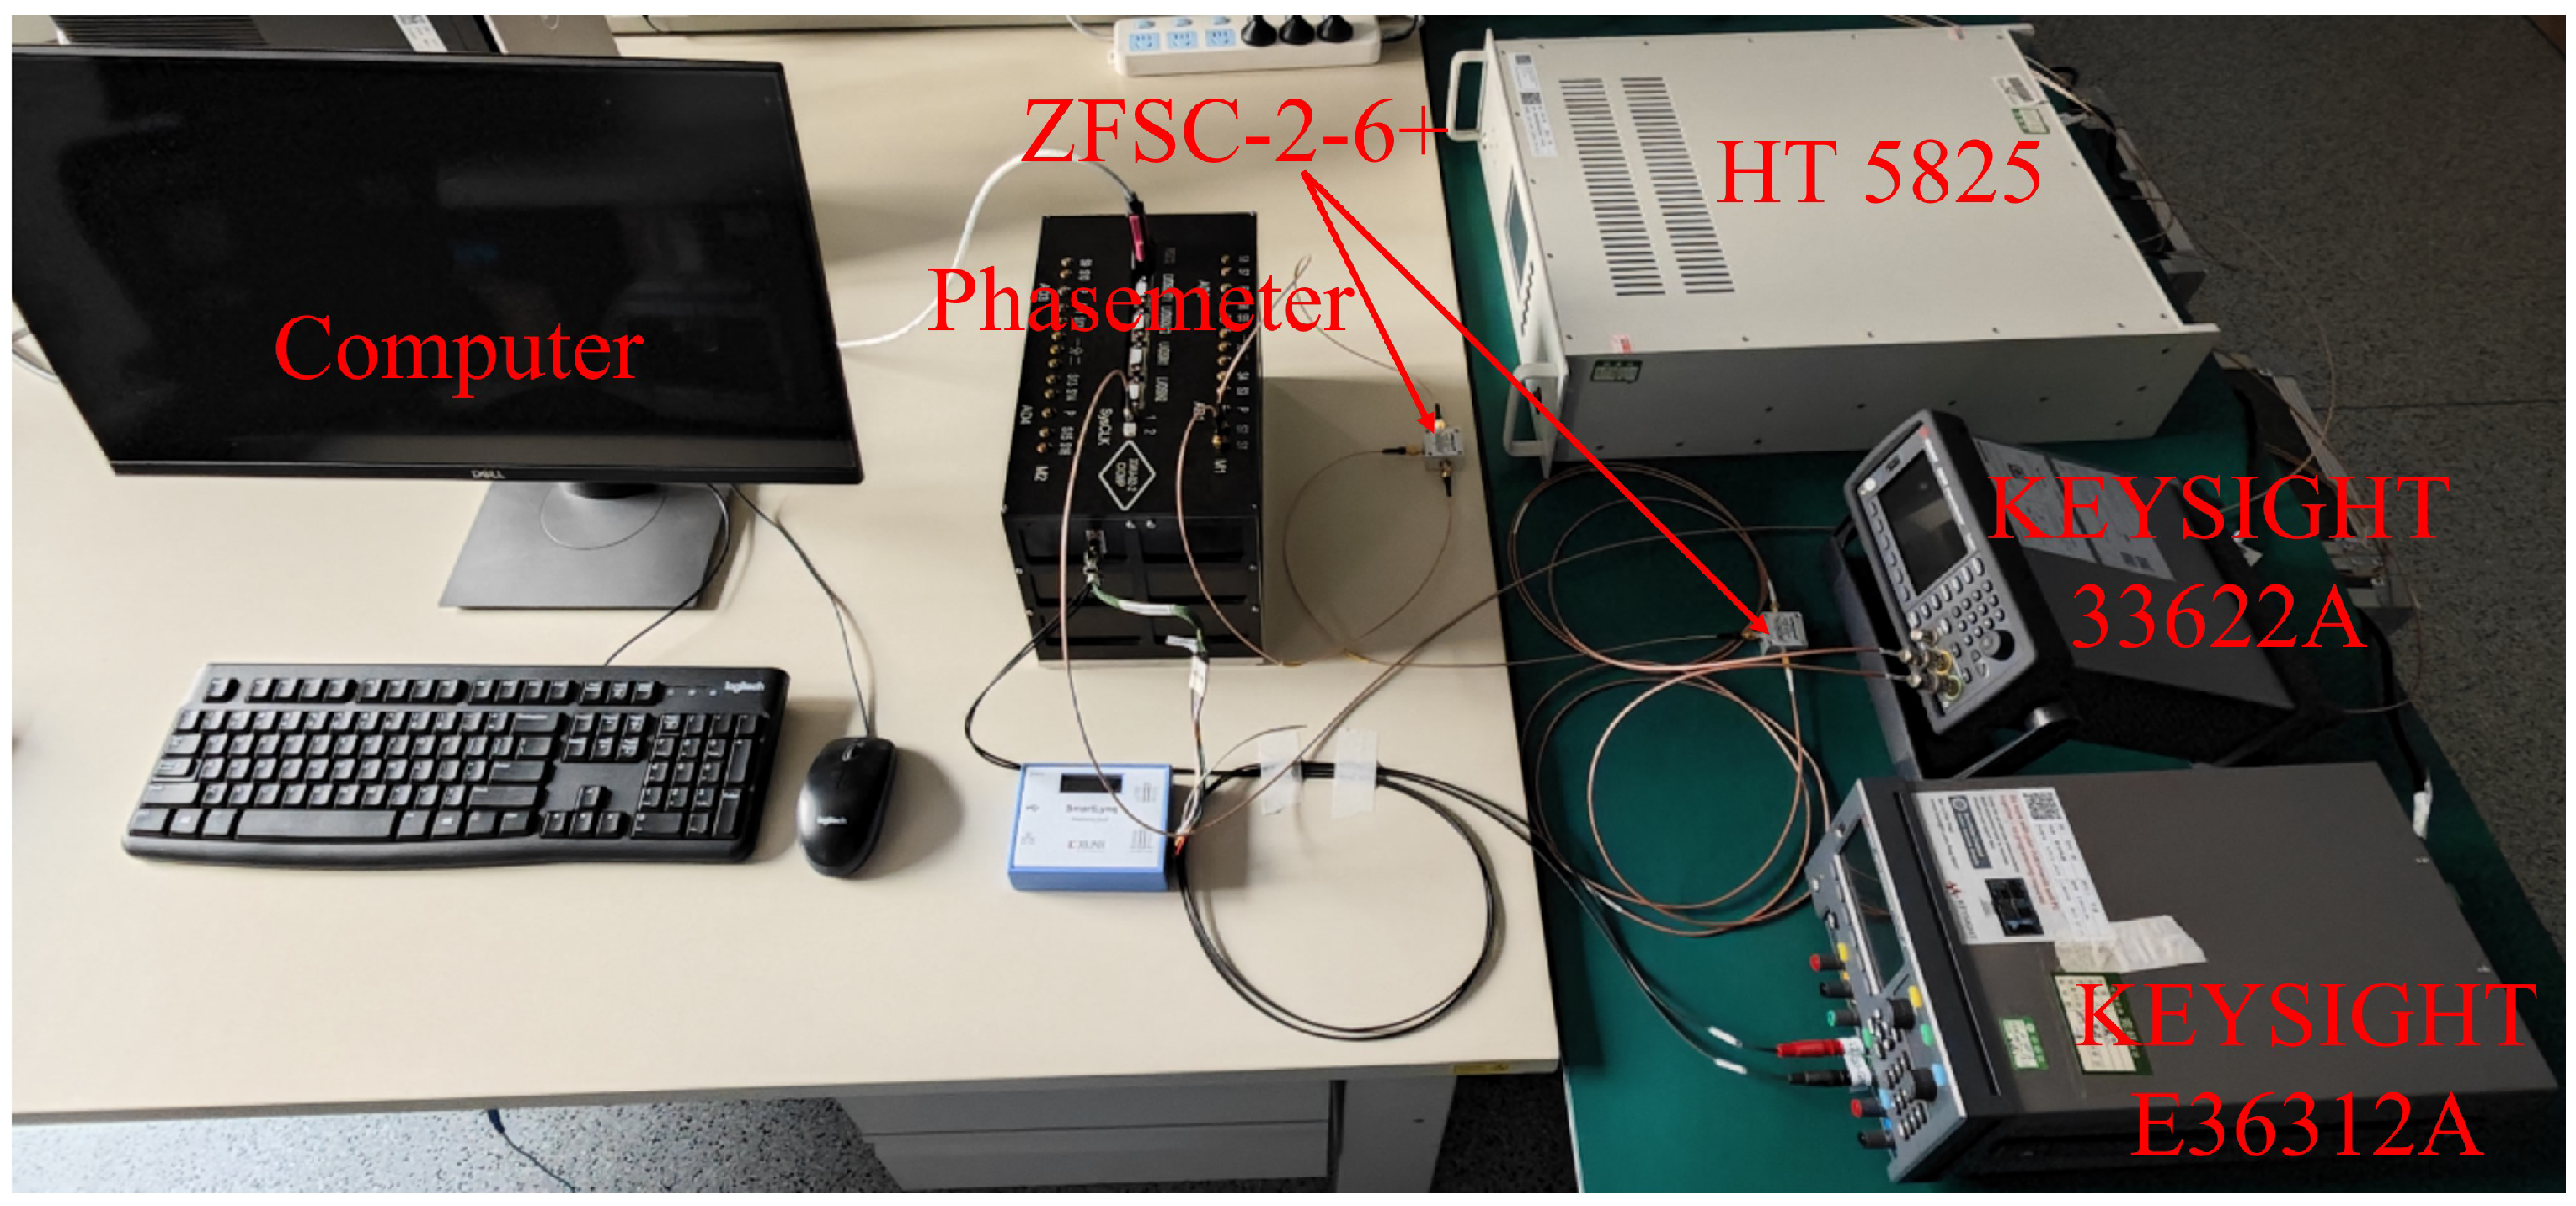
The inherent timing jitter within the ADC causes the input signals to be digitized at non-equal spacing intervals, resulting in some distortion of the digital signal relative to the analog signal. One solution to this problem is to use an ADC clock jitter correction method based on pilot tone calibration [29]. This is achieved by adding a fixed frequency pilot tone at the input of each ADC channel, which is phase tracked by a dedicated DPLL. By injecting a stabilized high-frequency pilot tone, the phase noise derived from its phase measurement is mainly attributed to the ADC time jitter, and the amount of phase correction is computed. According to the principle shown in Figure 5, the phase measurement results can be corrected by applying phase correction to basically eliminate sampling jitter noise. The interference signal (InS) and pilot tone (PT) are separated into two ADC channels. After processing through four DPLL modules, the interference signal phase information ( φ I n S 1 , φ I n S 2 ) and the pilot tone phase information ( φ P T 1 , φ P T 2 ) are obtained. Using the interference signal frequency ( f I n S ) and the pilot tone frequency ( f P T ), the jitter noise correction term (CORR) is calculated to eliminate the sampling jitter. The corrected interference signal phase is denoted as φ I n S .

3.2. Experiment

The objective of the research is to develop a prototype phasemeter to meet the requirements of micro-radian phase measurement. Within the full dynamic frequency range of the interference signal, a single pilot tone is used to verify the phase noise of the phasemeter, and to evaluate whether the performance of the phasemeter after integration of its components meets the requirements of the space gravitational wave mission. This can expand and supplement the research results of other research teams mentioned earlier.
The phasemeter verification evaluation environment is shown in Figure 6. The phasemeter supports parallel processing of 16-channel interference signals. A KEYSIGHT 33622A signal generator provides 5 MHz to 25 MHz simulated interference signals and pilot tone, while a KEYSIGHT E36312A power supply delivers a +12 V regulated source. Additionally, a high-stability time-frequency reference device (HT 5825) developed by the Xi’an Space Unlimited Electricity Technology Research Institute synchronizes the phasemeter and signal generator with a low-jitter clock. Mini-Circuits ZFSC-2-6+ can not only combine interference signal and pilot tone, but also split the combined signals.
A fixed 31 MHz pilot tone was combined with simulated interference signals spanning 5 to 25 MHz for experimental validation. Five frequencies (5 MHz, 10 MHz, 15 MHz, 20 MHz, 25 MHz) were tested to characterize phase measurement noise in the 0.1 mHz–1 Hz frequency band. The signal generator outputs a sinusoidal signal with V p p = 2 V, maintaining a consistent amplitude throughout the dynamic range.
The experimental results for the phase measurement noise of five interference signals are depicted in Figure 7. The curves InS1 and InS2 represent absolute measurements of the interference signal (InS), while the curves PT1 and PT2 show absolute measurements of the pilot tone (PT). The differential measurements PT1–PT2 and InS1–InS2 reflect common-mode noise suppression for the pilot tone and the interference signal, respectively. The curve InS_PT_CORR demonstrates the sampling jitter noise correction of the interference signal using the pilot tone, quantifying the phase noise floor of the interference measurement chain. Figure 7 shows the phase noise curves of the interference signals with frequencies of 5 MHz, 10 MHz, 15 MHz, 20 MHz, and 25 MHz respectively. The curves indicate that the frequencies of the interference signals cover the full dynamic range and their performances all meet the mission indicator requirement of 2π μrad/Hz1/2 @(0.1 mHz–1 Hz).
According to the results of the phase noise comparison in Table 1, with reference to Figure 7, the trend at 1 Hz phase noise is that the higher the frequency of the interference signal, the higher the noise. However, the testing process was conducted in the laboratory in stages and without temperature stability treatment. Therefore, the trend in experimental results at other frequency points may not be completely consistent with that at 1 Hz, possibly due to fluctuations in ambient temperature and other conditions. However, this does not affect the final evaluation of the phasemeter.

4. Conclusions and Outlook

This paper presents a micro-radian phasemeter development scheme. Since sampling jitter is one of the main noises affecting phase measurement, noise cancellation and suppression must be implemented through a single pilot tone provided by the frequency distribution system. The micro-radian phasemeter meets space gravitational wave mission requirements for phase measurement noise in the 0.1 mHz–1 Hz frequency band, operating under conditions of a 5 to 25 MHz frequency dynamic range for interference signals and a single 31 MHz pilot tone. The experimental results mentioned above indicate that the development for micro-radian phasemeter is correct, and technologies such as circuit design, DPLL, and anti-aliasing downsampling are feasible. The phasemeter possesses engineering applicability. Each satellite in the space gravitational wave detection mission will supply a fixed system clock signal and a single pilot tone to each phasemeter payload via a frequency distribution system. The phasemeter validation results presented in this paper offer the feasibility and technical foundation required for the subsequent integration of phasemeters into the frequency distribution system.
Functional expansion considerations reveal that the phasemeter integrates core phase measurement along with auxiliary functions such as interstellar ranging and communication. The interference signal will contain multiple signals/noises. The phasemeter will also be integrated with the frequency distribution system. Environmental equivalence testing will involve the integration of the phasemeter with the optical bench in follow-up validation campaigns.

Author Contributions

Conceptualization, T.Y.; methodology, T.Y.; software, T.Y., K.X. and H.L.; validation, T.Y., K.X. and H.L.; formal analysis, T.Y., M.P., Z.W. and Y.L.; investigation, T.Y., M.P., Z.W. and Y.L.; resources, M.P., Z.W. and Y.L.; data curation, T.Y.; writing—original draft preparation, T.Y.; writing—review and editing, T.Y., K.X. and H.L.; visualization, T.Y.; supervision, M.P., Z.W. and Y.L.; project administration, M.P., Z.W. and Y.L.; funding acquisition, M.P., Z.W. and Y.L. All authors have read and agreed to the published version of the manuscript.

Funding

This work was supported by the National Key R&D Program of China (2020YFC2200602), the National Key R&D Program of China (2022YFC2203901), and the National Key R&D Program of China (2020YFC2200600).

Data Availability Statement

The data presented in this study are not publicly available due to privacy, and access can be requested from [yut@ciomp.ac.cn] upon reasonable request.

Conflicts of Interest

The authors declare no conflicts of interest.

References

  1. Einstein, A.; Rosen, N. On gravitational waves. J. Frankl. Inst. 1937, 223, 43–54. [Google Scholar] [CrossRef]
  2. Ju, L.; Blair, D.; Zhao, C. Detection of gravitational waves. Rep. Prog. Phys. 2000, 63, 1317. [Google Scholar] [CrossRef]
  3. Abbott, B.P.; Abbott, R.; Abbott, T.D.; Abernathy, M.R.; Acernese, F.; Ackley, K.; Adams, C.; Adams, T.; Addesso, P.; Adhikari, R.X.; et al. Observation of gravitational waves from a binary black hole merger. Phys. Rev. Lett. 2016, 116, 061102. [Google Scholar] [PubMed]
  4. Pitkin, M.; Reid, S.; Rowan, S.; Hough, J. Gravitational wave detection by interferometry (ground and space). Living Rev. Relativ. 2011, 14, 5. [Google Scholar] [PubMed]
  5. Vitale, S.; Bender, P.; Brillet, A.; Buchman, S.; Cavalleri, A.; Cerdonio, M.; Cruise, M.; Cutler, C.; Danzmann, K.; Dolesi, R.; et al. LISA and its in-flight test precursor SMART-2. Nucl. Phys.-Proc. Suppl. 2002, 110, 209–216. [Google Scholar] [CrossRef]
  6. Danzmann, K.; LISA Science Team. LISA—An ESA cornerstone mission for the detection and observation of gravitational waves. Adv. Space Res. 2003, 32, 1233–1242. [Google Scholar] [CrossRef]
  7. Armano, M.; Audley, H.; Auger, G.; Baird, J.T.; Bassan, M.; Binetruy, P.; Born, M.; Bortoluzzi, D.; Brandt, N.; Caleno, M.; et al. Sub-femto-g free fall for space-based gravitational wave observatories: LISA pathfinder results. Phys. Rev. Lett. 2016, 116, 231101. [Google Scholar] [CrossRef]
  8. Hu, W.R.; Wu, Y.L. The Taiji Program in Space for gravitational wave physics and the nature of gravity. Natl. Sci. Rev 2017, 4, 685–686. [Google Scholar] [CrossRef]
  9. Luo, Z.R.; Liu, H.S.; Jin, G. The recent development of interferometer prototype for Chinese gravitational wave detection pathfinder mission. Opt. Laser Technol. 2018, 105, 146–151. [Google Scholar]
  10. Luo, J.; Chen, L.S.; Duan, H.Z.; Gong, Y.G.; Hu, S.; Ji, J.; Liu, Q.; Mei, J.; Milyukov, V.; Sazhin, M.; et al. TianQin: A space-borne gravitational wave detector. Class. Quantum Gravity 2016, 33, 035010. [Google Scholar] [CrossRef]
  11. Min, J.; Wang, Z.L.; Li, Y.P.; Tao, W.Z.; Li, C.H.; Lei, J.G.; Xi, D.X.; Fan, D.; Wang, J.B. Drop tower tests of Taiji-1 inertial sensor substitute. NPJ Microgravity 2021, 7, 25. [Google Scholar]
  12. Barke, S.; Brause, N.; Bykov, I.; Esteban Delgado, J.J.; Enggaard, A.; Gerberding, O.; Heinzel, G.; Kullmann, J.; Pedersen, S.M.; Rasmussen, T. LISA Metrology System-Final Report; PubMan Inc.: Atlanta, GA, USA, 2014. [Google Scholar]
  13. Yamamoto, K.; Vorndamme, C.; Hartwig, O.; Staab, M.; Schwarze, T.S.; Heinzel, G. Experimental verification of intersatellite clock synchronization at LISA performance levels. Phys. Rev. D 2022, 105, 042009. [Google Scholar]
  14. Zhang, J.; Ma, X.; Zhao, M.; Peng, X.; Gao, C.; Yang, Z. Advanced inter-spacecraft offset frequency setting strategy for the Taiji program based on a two-stage optimization algorithm. Appl. Opt. 2023, 62, 4370–4380. [Google Scholar] [CrossRef] [PubMed]
  15. Reinhardt, J.N.; Hartwig, O.; Heinzel, G. Clock synchronization and light-travel-time estimation for space-based gravitational-wave detectors. Class. Quantum Gravity 2025, 42, 055014. [Google Scholar]
  16. Zhang, J.; Yang, Z.; Ma, X.; Peng, X.; Liu, H.; Tang, W.; Zhao, M.; Gao, C.; Qiang, L.E.; Han, X.; et al. Inter-spacecraft offset frequency setting strategy in the Taiji program. Appl. Opt. 2022, 61, 837–843. [Google Scholar] [CrossRef] [PubMed]
  17. Luo, Z.R.; Wang, Y.; Wu, Y.L.; Hu, W.R.; Jin, G. The Taiji program: A concise overview. Prog. Theor. Exp. Phys. 2021, 2021, 05A108. [Google Scholar]
  18. Luo, J.; Bai, S.; Bai, Y.Z.; Cai, L.; Dang, H.; Dong, Q.; Duan, H.Z.; Du, Y.; Fan, L.; Fu, X.; et al. Progress of the TianQin project. arXiv 2025, arXiv:2502.11328. [Google Scholar]
  19. Zeng, H.; Yan, H.; Xie, S.; Jiang, S.; Li, Y.; Pan, Y.; He, D.; Du, Y.; Yeh, H.c. Experimental demonstration of weak-light inter-spacecraft clock jitter readout for TianQin. Opt. Express 2023, 31, 34648–34666. [Google Scholar]
  20. Xu, M.; Tan, Y.; Wu, H.; Wang, P.; Yan, H.; Liang, Y.; Shao, C. Influence of EOM sideband modulation noise on space-borne gravitational wave detection. Results Phys. 2024, 57, 107366. [Google Scholar]
  21. Liu, H.S.; Yu, T.; Luo, Z.R. A low-noise analog frontend design for the Taiji phasemeter prototype. Rev. Sci. Instruments 2021, 92, 054501. [Google Scholar]
  22. Huang, X.; Wang, G.; Yang, M.; Yang, Z.; Cai, C.; Ming, M.; Zhang, J.; Yang, S.; Tu, L.; Duan, H.; et al. Study on picometer-level laser interferometer readout system in TianQin project. Opt. Laser Technol. 2023, 161, 109185. [Google Scholar] [CrossRef]
  23. Zhang, Q.T.; Liu, H.S.; Luo, Z.R. Multi-Channel Phase Measurement System for the Space Laser Interferometry. Chin. Opt. 2023, 16, 1089–1099. [Google Scholar]
  24. Kullmann, J. Development of a Digital Phase Measuring System with Microradian Precision for LISA. Ph.D. Thesis, Leibniz Universität Hannover, Hannover, Germany, 2012. [Google Scholar]
  25. Gerberding, O.; Sheard, B.; Bykov, I.; Kullmann, J.; Delgado, J.J.E.; Danzmann, K.; Heinzel, G. Phasemeter core for intersatellite laser heterodyne interferometry: Modelling, simulations and experiments. Class. Quantum Gravity 2013, 30, 235029. [Google Scholar]
  26. Yang, P.; Yu, T.; Xue, K.; Pan, M.; Long, H.; Wang, Z.; Zhou, J. Four-Module Cascaded Downsampling Filter for Phasemeter in Space Gravitational Wave Detection. Symmetry 2025, 17, 258. [Google Scholar] [CrossRef]
  27. Gerberding, O. Phase Readout for Satellite Interferometry. Ph.D. Thesis, Technische Informationsbibliothek und Universitätsbibliothek Hannover (TIB), Hannover, Germany, 2014. [Google Scholar]
  28. Hewitson, M.; Armano, M.; Benedetti, M.; Bogenstahl, J.; Bortoluzzi, D.; Bosetti, P.; Brandt, N.; Cavalleri, A.; Ciani, G.; Cristofolini, I.; et al. Data analysis for the LISA Technology Package. Class. Quantum Gravity 2009, 26, 094003. [Google Scholar]
  29. Simon, B. Inter-Spacecraft Frequency Distribution for Future Gravitational Wave Observatories. Ph.D. Thesis, Gottfried Wilhelm Leibniz Universität Hannover, Hannover, Germany, 2015. [Google Scholar]
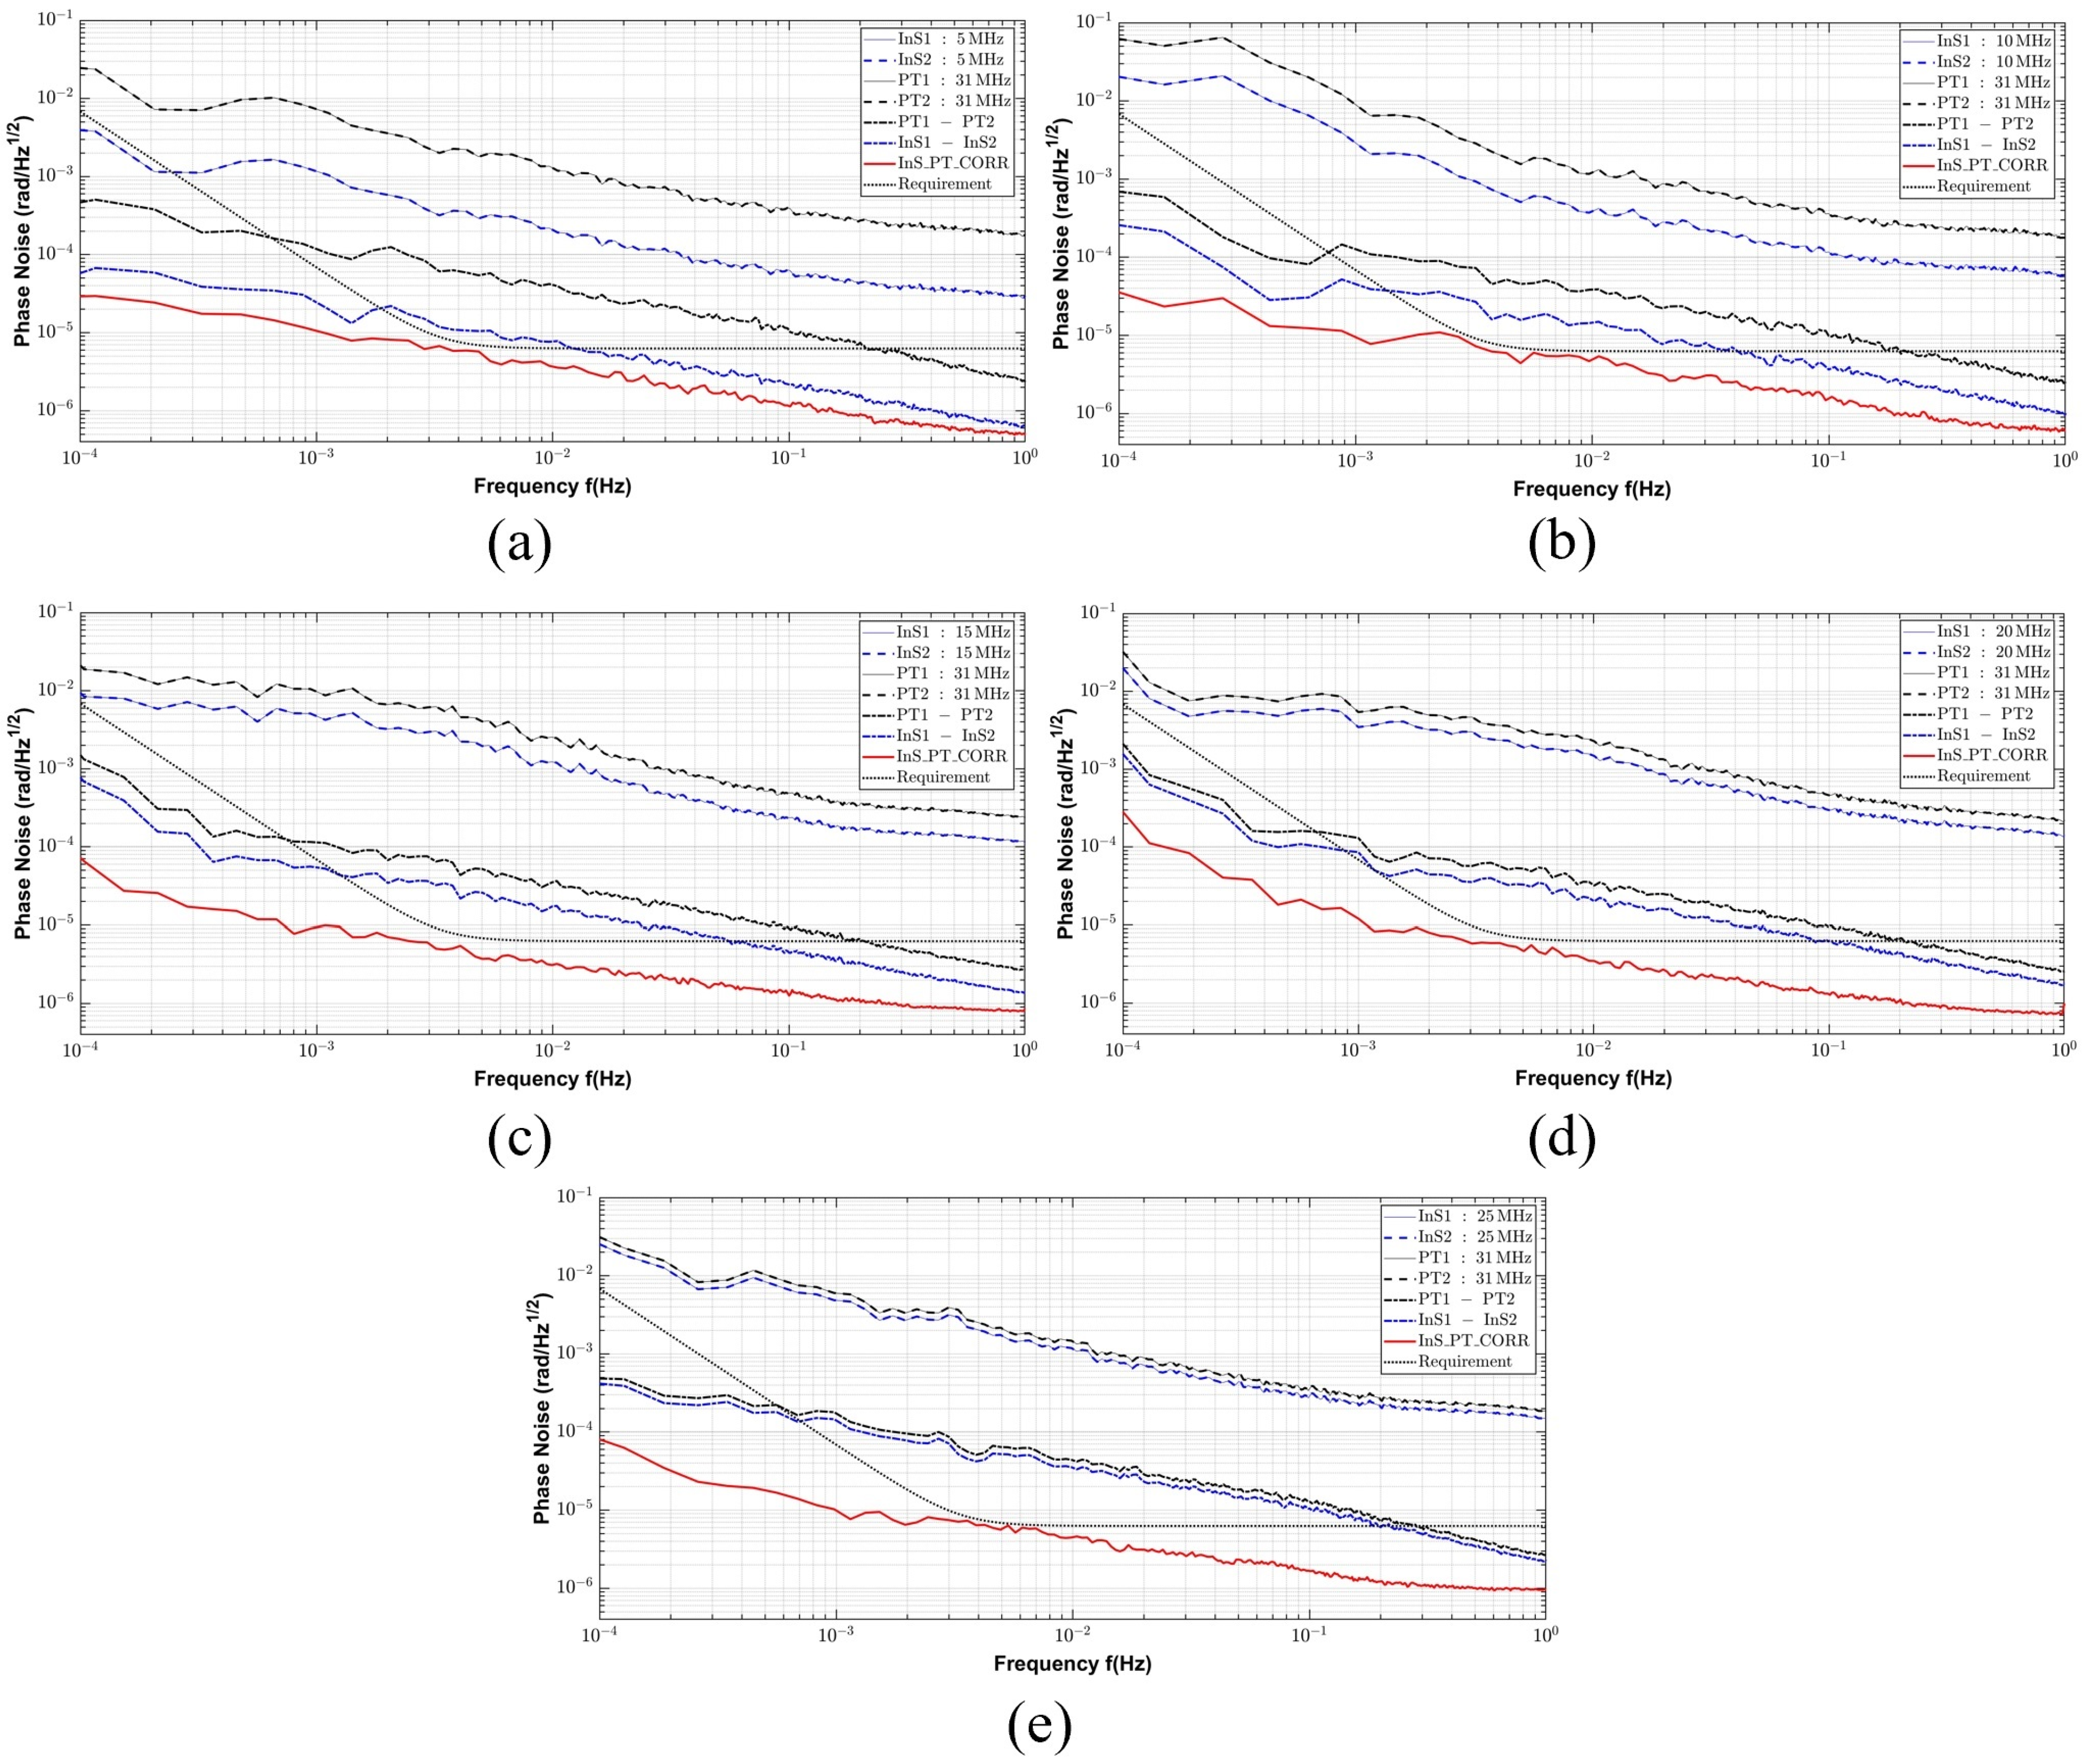
Figure 1. (a) The hardware diagram of the multi-channel phasemeter. (b) Digital processing board. (c) Analog front-end board.
Symmetry 17 00519 g001
Figure 2. Diagram of the phasemeter (includes hardware architecture and signal flow diagrams).
Symmetry 17 00519 g002
Figure 3. Diagram of the DPLL: LUT, look-up table; PA, phase accumulator; NCO, numerically controlled oscillator; PIR, phase increment register; PI, proportional integral; LPF, lower pass filter.
Symmetry 17 00519 g003
Figure 4. Four-stage downsampling filter bank.
Symmetry 17 00519 g004
Figure 5. Principle diagram of pilot tone correction for sampling jitter noise.
Symmetry 17 00519 g005
Figure 6. The phasemeter verification evaluation environment.
Symmetry 17 00519 g006
Figure 7. (a) Phase noise of 5 MHz interference signal. (b) Phase noise of 10 MHz interference signal. (c) Phase noise of 15 MHz interference signal. (d) Phase noise of 20 MHz interference signal. (e) Phase noise of 25 MHz interference signal.
Symmetry 17 00519 g007
Table 1. The results of the phase noise comparison.
InS@ 1 Hz@ 100 mHz@ 10 mHz@ 1 mHz@ 0.1 mHz
5 MHz0.49 μrad1.13 μrad3.56 μrad9.62 μrad29.48 μrad
10 MHz0.60 μrad1.56 μrad4.91 μrad9.50 μrad35.59 μrad
15 MHz0.85 μrad1.26 μrad3.11 μrad9.41 μrad72.60 μrad
20 MHz0.94 μrad1.27 μrad3.48 μrad12.02 μrad282.03 μrad
15 MHz0.96 μrad1.66 μrad4.47 μrad9.89 μrad80.37 μrad
Disclaimer/Publisher’s Note: The statements, opinions and data contained in all publications are solely those of the individual author(s) and contributor(s) and not of MDPI and/or the editor(s). MDPI and/or the editor(s) disclaim responsibility for any injury to people or property resulting from any ideas, methods, instructions or products referred to in the content.

