Abstract
The significance of the chiral symmetry restoration is studied by considering the role of the modification of the nucleon mass in nuclear medium at finite density and temperature. Using the Korea-IBS-Daegu-SKKU density functional theory, we can create models that have an identical nuclear matter equation of state but different isoscalar and isovector effective masses at zero temperature. The effect of the effective mass becomes transparent at non-zero temperatures, and it becomes more important as temperature increases. The role of the effective mass is examined thoroughly by calculating the dependence of thermodynamic variables such as free energy, internal energy, entropy, pressure and chemical potential on density, temperature and proton fraction. We find that sensitivity to the isoscalar effective mass is several times larger than that of the isovector effective mass, so the uncertainties arising from the effective mass are dominated by the isoscalar effective mass. In the analysis of the relative uncertainty, we obtain that the maximum uncertainty is less than 2% for free energy, internal energy and chemical potential, but it amounts to 20% for pressure. Entropy shows a behavior completely different from the other four variables that the uncertainty is about 40% at the saturation density and increases monotonically as density increases. The effect of the uncertainty to properties of physical systems is investigated with the proto-neutron star. It is shown that temperature depends strongly on the effective mass at a given density, and substantial swelling of the radius occurs due to the finite temperature. The equation of state is stiffer with smaller isoscalar effective mass, so the effect of the effective mass appears clearly in the mass–radius relation of the proto-neutron star, where a larger radius corresponds to a smaller effective mass.
1. Introduction
In the last decade, ab initio calculations have become a potential method in traditional nuclear physics such as in the study of nuclear structure and reactions. They provide a way to describe the nuclear interactions in nuclear many-body systems in terms of the two-, three- and multi-nucleon interactions. By using the chiral effective field theory (EFT), inter-nucleon interactions can be expanded in a perturbative way, which allows for a systematic control of the uncertainties pertinent to nuclear forces and their consequential effects [,].
Chiral EFT is an effective theory of quantum chromo dynamics (QCD) scaled down to low-energy nuclear phenomena. An essential ingredient that connects the chiral EFT to QCD is chiral symmetry. In the chiral EFT, chiral symmetry is broken by the presence of nucleon mass. From various theoretical calculations, it is shown that the nucleon mass decreases at finite density, so the chiral symmetry is restored partially in nuclear medium. When the density is high enough that the quarks inside the nucleon become unbound, it is believed that the chiral symmetry is completely restored. The in-medium mass, more frequently referred to as the effective mass of the nucleon, is one of the key uncertainties with a profound impact on various nuclear systems and phenomena [,,,].
The development of the KIDS (Korea-IBS-Daegu-SKKU) nuclear density functional theory was motivated by the goal to incorporate the nuclear many-body theory into a systematic expansion scheme on one hand, and on the other hand, to reduce the uncertainties pertinent to the nuclear properties and the density dependence of the nuclear matter equation of state (EoS) at both below and above the saturation density (). A large number of intensive studies in recent years have constrained the density dependence of the nuclear symmetry energy by using the modern observation data of the neutron star [,,,]. Thousands of models for nuclear matter and finite nuclei have been created using various theories, and those consistent with the neutron star data have been sorted out. As a result, the range of the slope (L) and curvature () of the symmetry energy has been significantly constrained. Similar studies have also been conducted using the KIDS framework, working to further refine the models [,,].
Another big issue in the nuclear many-body problem is the value of the isoscalar and isovector effective masses at . Conventionally, they are constrained in terms of the dynamic properties of nuclei such as various resonance behavior, or in terms of specific conditions for the nuclear matter. Empirical ranges of the isoscalar and isovector effective masses are (0.7–1.0) and (0.6–0.9), respectively (for a recent extensive review, see [] and references therein). denotes the nucleon mass in free space. In the KIDS framework, by construction, the nuclear matter EoS is independent of the effective mass at zero temperature []. However, the effective mass is explicitly included in the thermal fluctuation of the baryon distribution, so their effect is likely to appear directly in the thermodynamic properties of nuclear matter. In case of hot nuclear matter and a proto-neutron star environment, the compositional isospin asymmetry and thermal effects largely affect the EoS [,,,,,]. Several studies, including numerical simulations [,,,,,,,], suggest that properties of hot nuclear matter and the corresponding related phenomena of supernovae, proto-neutron star and binary neutron star mergers are predominantly affected by the nucleon effective mass. This is because the effective mass contributes substantially to the determination of the kinetic energy, and consequently, the strength of thermal effects of the system.
In the present work, by constraining the zero-temperature EoS within the range of experimental data or ab initio calculation results, isoscalar and isovector effective masses at are fixed to the values (0.7, 0.7), (0.7, 0.8), (0.7, 0.9), (0.7, 1.0), (0.8, 0.7), (0.8, 0.8), (0.8, 0.9), (0.8, 1.0), (0.9, 1.0) and (1.0, 1.0), where is the isoscalar effective mass and is the isovector effective mass, both of which will be defined later. Ten models that have distinct splitting of the effective mass are applied to the calculation of the thermodynamic properties of the nuclear matter. The thermodynamic variables such as free energy, internal energy, entropy and pressure are obtained as functions of density, temperature and proton fraction. In fact, these thermodynamic quantities are essential inputs for numerical simulations of core-collapse supernovae and the subsequent evolution of proto-neutron stars. As an application, we calculate the bulk properties of the proto-neutron star for the neutrino-trapped case in the isentropic condition by solving the Tolman–Oppenheimer–Volkoff equations [,]. We find that the thermodynamic variables are sensitive to the effective masses, and so the results are clearly distinguishable. The mass–radius relation of the proto-neutron star also depends strongly on the effective masses.
We organize the work in the following order. In Section 2, we present detailed information of the models and explain how the finite temperature effect is incorporated in the nuclear matter EoS. Section 3 shows the results for the thermodynamic quantities of nuclear matter and discuss the effects of the uncertainty of the effective masses on the EoS. In Section 4, we apply the obtained EoSs to the calculations of the proto-neutron star structure. The work is summarized in Section 5.
2. Model
In the KIDS framework, undetermined constants of the functional are determined stepwise. In the first step, we consider the energy per particle in homogeneous nuclear matter at temperature T = 0 as
where is the baryon density; is the proton fraction; and and are densities of the neutron and the proton, respectively. It is shown that three (, , ) are optimal for a correct description of the symmetric nuclear matter, and four for (, , , ) for the asymmetric nuclear matter []. In the KIDS0 model, which is an initial version of the KIDS density functional, the three are adjusted to 0.16 fm−1, MeV and 240 MeV, which correspond to the saturation density, binding energy per particle and incompressibility of the symmetric matter, respectively. Four are fitted to the pure neutron matter EoS obtained by the variational chain summation method with modern nucleon–nucleon interactions []. It is verified that although the KIDS0 model is determined independent of the neutron star data, the model satisfies the most recent data of large mass () and radius of the canonical star ( 11.8–13.1 km) [].
In the second step of the parameter fitting, the model is applied to finite nuclei. The lowest number of additional parameters is two: one for the density–gradient term and the other for the spin–orbit interaction []. When only two parameters are fitted to nuclear data, there are no restrictions to the effective masses, and they are obtained as a result of the fitting. If we assume specific values for the effective masses, two terms corresponding to the exchange terms in the density–gradient interaction are added, and four parameters are adjusted to nuclear data and effective mass. Skyrme-type force in the KIDS model is given by
where , , and is the spin exchange operator.
By using the Skyrme parameters in Equation (2), the energy per particle for homogeneous matter at zero temperature is expressed as
where and are the effective masses for proton and neutron, respectively. The explicit expression for () is given by
Here, the upper (lower) sign corresponds to the proton (neutron), and the isoscalar nucleon effective mass and isovector nucleon effective mass can also be defined as
The determination of specific parameters in Equation (2) follows the steps outlined below. For symmetric nuclear matter at = 1/2, , , and are determined from the saturation properties, and we assume because truncates at . Here, , and are determined uniquely, but we cannot fix because the coefficient of the term proportional to , in Equation (1), contains , and , as well as . For pure neutron matter, since , and are now known, , and can also be determined from the values of saturation parameters. On the other hand, the equation for has six parameters , , , , and . For the terms, we have two conditions for symmetric and pure neutron matter, but there are six parameters so they cannot be determined. In the KIDS0 model, to overcome the difficulty, we reduce the number of parameters by assuming . Furthermore, since and are obtained prior to , , and , we do not know what portion of and comes from the density term ( and ) and from the momentum term ( and ). To resolve this ambiguity, we introduce a weight parameter k between 0 and 1, and evaluate the term as a weighted sum of the density term and momentum term. Then, , , , , and are obtained as functions of k, and only two parameters, k and , are left unknown. In the KIDS0 model, these two parameters are fitted to the measured values of binding energies and charge radii of 40Ca, 48Ca and 208Pb, and we then obtain the numerical values of , , , , and . Because the fitting process proceeds in this way, the effective mass can be defined after the fitting to nuclear data. We note that even though the contribution of the spin–orbit term proportional to is null in the unpolarized nuclear matter, it is essential to include the term in the fitting to reproduce the nuclear data accurately.
Table 1 summarizes the resulting values of the parameters for the models considered in this work. The model denoted as m* is the effective mass; the first number denotes and the second corresponds to . For example, m*87 means and , while the number 1 implies 1.0. Since the nuclear matter properties are determined prior to the fitting to nuclear properties, nuclear matter EoS is not affected by the values of the effective mass. Figure 1 shows the energy per particle for the symmetric and pure neutron matter at zero temperature with the KIDS0, KIDS0-m*78, KIDS0-m*87 and KIDS0-m*11 models. The figure confirms that the nuclear matter EoS at is not affected by the effective mass. Among the Skyrme force parameters, , , , , and are related to the effective mass and , , , , and are determined from the nuclear matter EoS and independent of the properties of finite nuclei. Therefore, the four models have the same values for , , , , and , but differ in , , , , and . Although it is not shown in the figure, it is difficult to distinguish between the energies calculated using all the models in Table 1 at .

Table 1.
Skyrme force parameters of the models for the given isoscalar and isovector effective masses at the saturation density. Units of , , , , , and are MeV fm5. Effective mass ratios are defined as and . For simplicity, we choose as the mass of a neutron in numerical calculations. All the models have identical values of −1772.04 and −127.52 in MeV fm3, 12,216.73 and −11,970.00 in MeV fm4, and 0 and −22,955.30 in MeV fm6.
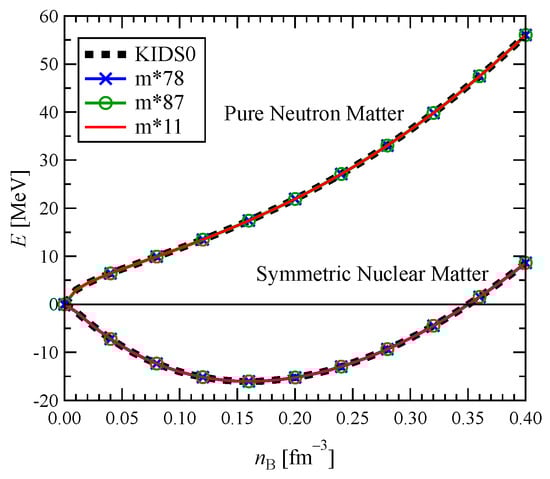
Figure 1.
Energy per particle for pure neutron matter (upper lines) and symmetric nuclear matter (lower lines) as a function of the density at 0 with the KIDS0, KIDS0-m*78, KIDS0-m*87 and KIDS0-m*11 models.
Figure 2 shows the neutron effective mass for (a) symmetric nuclear matter and (b) pure neutron matter with various KIDS models. In the case of symmetric nuclear matter, the effective mass of the neutron is exactly equal to that of the proton and the isoscalar effective mass, i.e., . It can be seen that decreases monotonically as increases. For a fixed , decreases with and is independent of the value of . The vertical shaded region represents the empirical range of the isoscalar effective mass (0.7–1.0) [], and all KIDS models used in this study are within this empirical range.
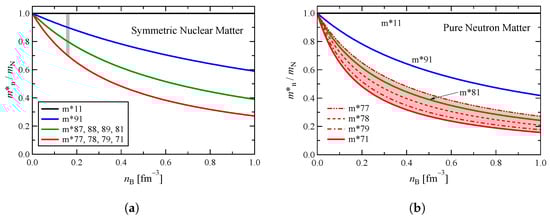
Figure 2.
(a) Neutron effective mass as a function of the density for symmetric nuclear matter. (b) Neutron effective mass as a function of the density for pure neutron matter.
In the case of pure neutron matter, decreases with , similar to symmetric nuclear matter, but it is observed to increase as decreases. As a result, in the present models, when is fixed at 0.7, the uncertainty in relative to the neutron effective mass corresponds to the red band in Figure 2b. On the other hand, the effective mass of the proton completely coincides with the isovector effective mass in pure neutron matter, as can be understood from Equation (4). Therefore, in pure neutron matter, is independent of and decreases with . Here, since and are given as functions of density with exactly the same functional form, the figure for will be exactly the same as Figure 2a. In this case, the black line corresponds to the m*71, m*81, m*91 and m*11 models, the blue line corresponds to the m*79 and m*89 models, the green line corresponds to the m*78 and m*88 models, and the red line corresponds to the m*77 and m*87 models.
In the 0 scenario, the thermodynamic quantities are expressed by the following equations. The nucleon number density () is given as
where the average occupation probability is
Here, and is dertermined so as to satisfy the normalization condition in Equation (7). It should be noted that is different from the true chemical potential for nucleon , which will later be derived from thermodynamic relations.
The internal energy per particle U is then given as
In Equation (9), the terms in the second to fourth lines correspond to the potential energy, which is not temperature-dependent and is in complete agreement with the case of Equation (3). Namely, the temperature dependence is fully contained in the kinetic component.
The entropy per particle S can also be expressed as
Then, we obtain the free energy per particle . In these numerical calculations, the Fermi integrals and their inverses are computed using the subroutines provided by Fukushima [,].
The pressure P and the neutron chemical potential are given by
and
Note that in the aforementioned finite-temperature framework, the nucleon effective masses are completely independent of the temperature and are given by the definition in Equation (4).
3. Numerical Result of Thermodynamic Quantity
In this section, we discuss the properties of the various thermodynamic quantities mentioned above.
In Figure 3, we show the difference of free energy with respect to the values of the m*11 model as functions of the isoscalar effective mass ratio at different temperatures, densities and proton fractions. Isovector effective mass ratio is fixed to . Free energy becomes larger with small and high temperature. At MeV, the free energy weakly depends on the density and proton fraction, so the difference is almost identical in all the three panels. Variation with respect to becomes significant as the temperature increases. At , the result is not sensitive to temperature and proton fraction, so the lines corresponding to triangles are similar to each other. At , an increase in the free energy with higher temperature is most prominent in the pure neutron matter (), but the dependence on the temperature becomes marginal as the proton fraction increases. Summarizing the result of Figure 3, isoscalar effective mass gives an evident impact on the free energy, and the dependence on the isoscalar effective mass becomes stronger at high temperature and proton fraction.
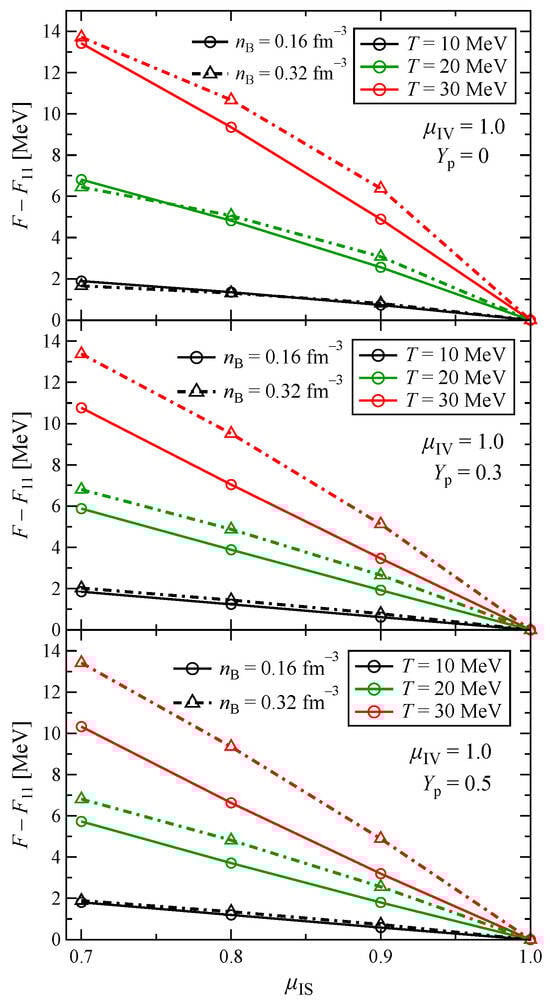
Figure 3.
Free energy residual from the values of m*11 model () as a function of the isoscalar effective mass ratio at different temperatures, densities and proton fractions.
Figure 4 displays the free energy subtracted by the values of the m*71 model as functions of the isovector effective mass ratio with different temperatures, densities and proton fractions. Isoscalar effective mass ratio is fixed to . It is notable that the magnitude of the residual () depends strongly on the proton fraction. The result is enhanced with a smaller proton fraction. is also significantly affected by both temperature and density. Enhancement of with fewer protons becomes more amplified at high temperature, while the dependence on the density is complicated. Since the effect of becomes comparable to that of in the neutron-rich systems, both isoscalar and isovector masses must be treated carefully in the applications, especially at high temperatures.
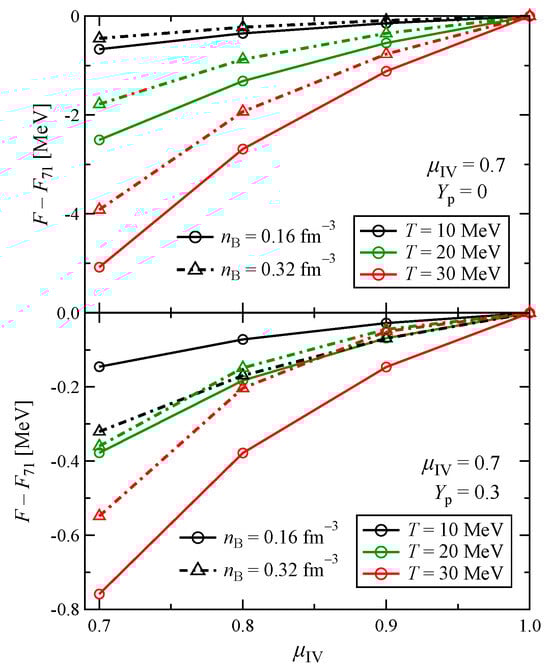
Figure 4.
Free energy residual from the values of the m*71 model () as a function of the isovector effective mass ratio at different temperatures, densities and proton fractions.
In Figure 5, we present the variation in free energy with respect to density at different temperatures and proton fractions. The bands in Figure 5 indicate the uncertainty range of F for the models in Table 1 based on different values of and . As expected, the free energy increases and becomes more positive as the matter becomes neutron-rich. The upper and lower bounds for each band correspond to models m*71 and m*11, respectively. It can be seen that uncertainty enhances as temperature increases. However, the width of a band at a given temperature does not differ much with different . It is also worthwhile to note that regardless of temperature and proton fraction, in a given band, the width of the band increases to the saturation density and shows no significant change at higher densities. The result shows that the uncertainty of the free energy is saturated at .
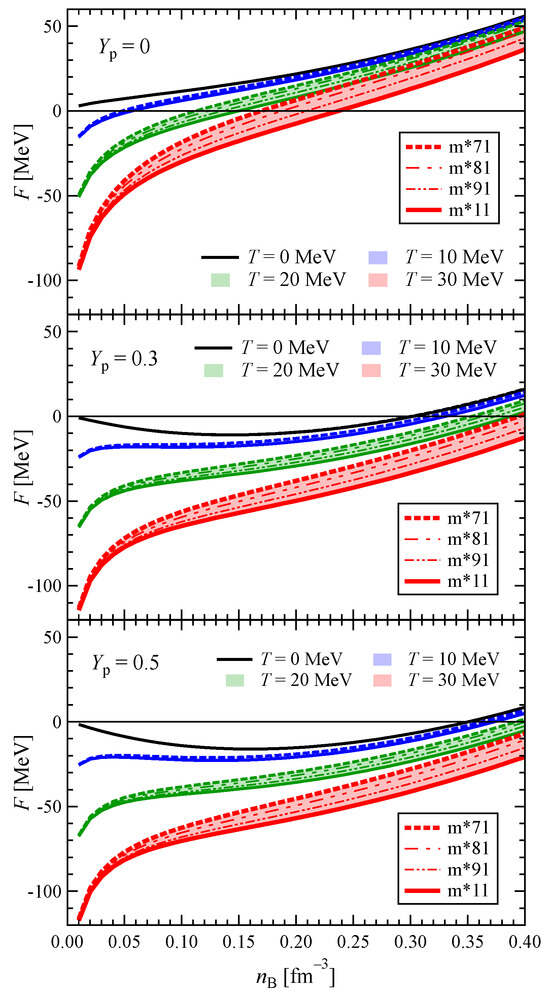
Figure 5.
Uncertainty range of the free energy as a function of density, temperature and proton fraction with the models in Table 1. Uncertainty becomes enhanced at higher temperatures. For all the temperatures and proton fractions, the upper and lower bounds correspond to m*71 and m*11, respectively.
From Figure 6, we are able to study the residual of the internal energy from and that of the entropy from with respect to for pure neutron matter and symmetric matter. Only the saturation density is considered, and the isovector effective mass is set to . Both U and S increase monotonically with increasing . The difference between the symmetric matter scenario and that of the pure neutron matter becomes more distinguishable with increasing temperature, indicating that the uncertainty due to is larger at higher temperature.
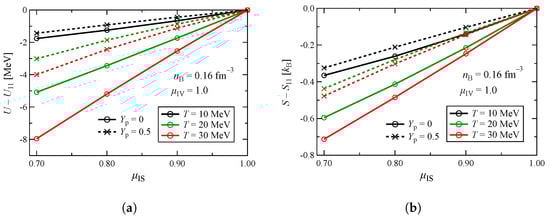
Figure 6.
(a) Residual of the internal energy from . (b) Residual of the entropy from as functions of for symmetric and pure neutron matter with different temperatures.
Figure 7 shows the residual of the internal energy from and that of the entropy from as functions of . Since the isovector effect is maximized when the neutron–proton asymmetry reaches maximum, we only consider the pure neutron matter. Variations in both U and S follow a decreasing trend. Dependence on temperature increases as decreases. The magnitude of uncertainty (or the value of largest difference) at a given temperature is roughly half of those in the variation in in Figure 6. For U and S, similarly to F, uncertainty arising from dominates, but the effect of is also substantial. It is shown in Figure 4 that the isovector contribution is greatly affected by the proton fraction, so caution is needed when the matter is close to the pure neutron matter.
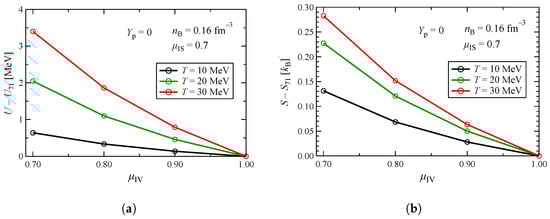
Figure 7.
(a) Residual of the internal energy from . (b) Residual of the entropy from as functions of for pure neutron matter with different temperatures.
We display the variation in internal energy with respect to density for pure neutron and symmetric matters at different temperatures in Figure 8. As expected, the value of U is always positive and monotonically increasing for the pure neutron matter. However, in the case of symmetric nuclear matter, the value of U at saturation density increases and becomes positive from negative with increasing temperature. In Figure 8, we also show the uncertainty range of U for different models. For all the temperatures and proton fractions, the upper and lower bounds correspond to m*11 and m*71, respectively. Similarly to the case of F seen in Figure 5, we find that the uncertainty in U increases with temperature. It is also noteworthy from Figure 8 that the uncertainty in U is slightly more in the case of pure neutron matter than in the case of symmetric nuclear matter because, in the former case, the effective mass of the nucleon depends on both the isoscalar and isovector contributions, while for the latter case, depends only on the isoscalar contribution. The width of the band (range of uncertainty) becomes wider as density increases but does not show recognizable change at fm−3.
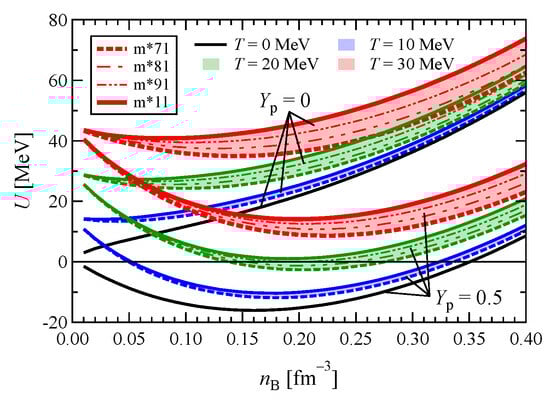
Figure 8.
Range of uncertainty for the internal energy as a function of density, temperature and proton fraction. For all the temperatures and proton fractions, the upper and lower bounds correspond to m*11 and m*71, respectively.
In Figure 9, the range of entropy is shown with respect to density at different temperatures for both pure neutron and symmetric nuclear matters. For all the temperatures and proton fractions, the upper and lower bounds correspond to m*11 and m*71, respectively. The value of entropy is larger in the symmetric matter than those in the pure neutron matter, and becomes smaller at high densities. Uncertainty of the entropy is magnified with increasing density and temperature. A notable feature is that at high density and temperature, the width of a band (uncertainty range) becomes comparable to the value of entropy, so the relative uncertainty (band width divided by the entropy value) can exceed 50%, which is much higher than the relative uncertainties of F and U. We discuss this point in more detail at the end of this section.
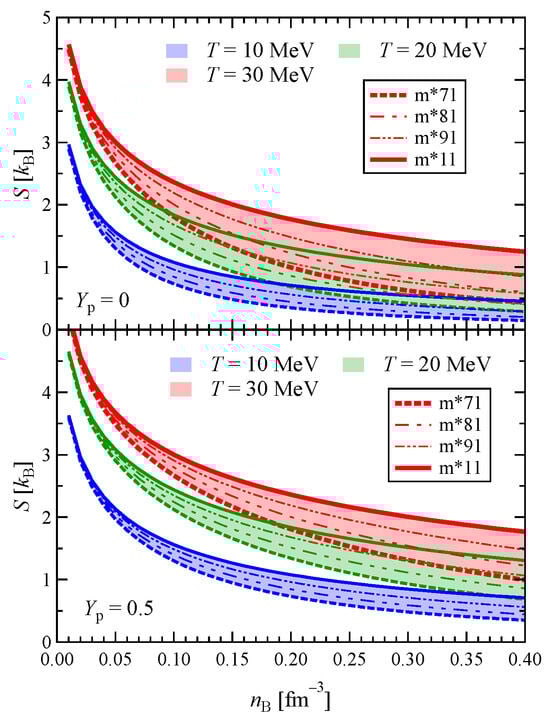
Figure 9.
Range of uncertainty for the entropy as a function of density, temperature and proton fraction. For all the temperatures and proton fractions, the upper and lower bounds correspond to m*11 and m*71, respectively.
Figure 10 shows the variation in the residuals of the (a) pressure from and (b) neutron chemical potential from as functions of at different temperatures for both pure neutron and symmetric nuclear matter. Density is fixed to the saturation density. Figure 11 shows the same, but from and with respect to . shows a simple behavior, decreasing with large but conversely with increasing . The variation in P is, however, not specific or inclusive, but more complicated. For example, in Figure 10, P shows a monotonically decreasing trend for symmetric nuclear matter, but it is convex for the pure neutron matter. This is because pressure, being the first density derivative of free energy, depends on the behavior of the effective mass. As mentioned before, for symmetric nuclear matter, the effective mass of the neutron is identical to that of the proton and there is no mass splitting between the neutron and the proton. In pure neutron matter, because the isovector contribution becomes maximum, effective masses of the neutron and the proton are distinguished, and the neutron effective mass decreases faster than the proton effective mass with small . Since the derivative of the effective mass is negative, a rapid decrease results in a more negative contribution to the pressure, and this leads to a relatively small residual of compared to or in Figure 10. From Figure 10, it can be seen that the sensitivity of P to is higher in symmetric matter than pure neutron matter. From Figure 10, we also find that the dependence of on is negligible at 10 and 20 MeV, and it becomes sizable at 30 MeV, implying that the dependence of on is magnified at higher temperatures. Compared to the dependence of P on as shown in Figure 10, the sensitivity of P to is suppressed by an order of 10, as seen from Figure 11. So, dependence on is relatively small compared to that on . Similarly, comparing Figure 10 and Figure 11, we find that the uncertainty of due to is marginal compared to the uncertainty due to .
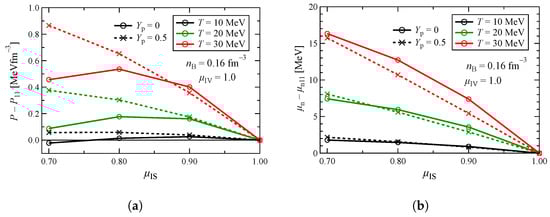
Figure 10.
(a) Residual of the pressure from and (b) chemical potential from as functions of isoscalar effective mass ratio at different temperatures for both symmetric and pure neutron matter.
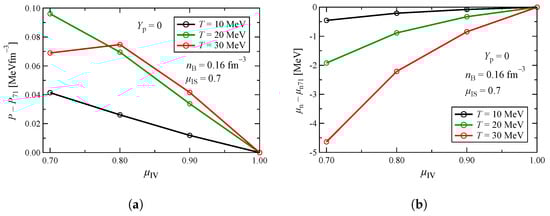
Figure 11.
(a) Residual of the pressure from and (b) chemical potential from as functions of isovector effective mass ratio at different temperatures for the pure neutron matter.
In Figure 12 and Figure 13, we depict the density dependence of pressure and neutron chemical potential, respectively, for pure neutron and symmetric nuclear matter at different temperatures. Both P and increase with density at all densities in the pure neutron matter, and at for the symmetric nuclear matter. Similarly to the internal energy, pressure is always positive in the pure neutron matter. In the case of symmetric nuclear matter, the value of P at minima increases and becomes positive after reaching the critical temperature, which is about slightly above 10 MeV. Similarly to the other thermodynamic quantities like F, U and S, the uncertainty in P and also enhances with increasing temperature. At 10 MeV, the width of the band is very narrow, but it becomes substantial at higher temperature. While the width of the band for is broader than that for for F, U and S, symmetric nuclear matter has a larger uncertainty than pure neutron matter for P. The widths of the bands increase up to saturation density, and after that, they seldom change. This behavior is similar to F and U, and opposite to S, for which the width of the band increases as increases.
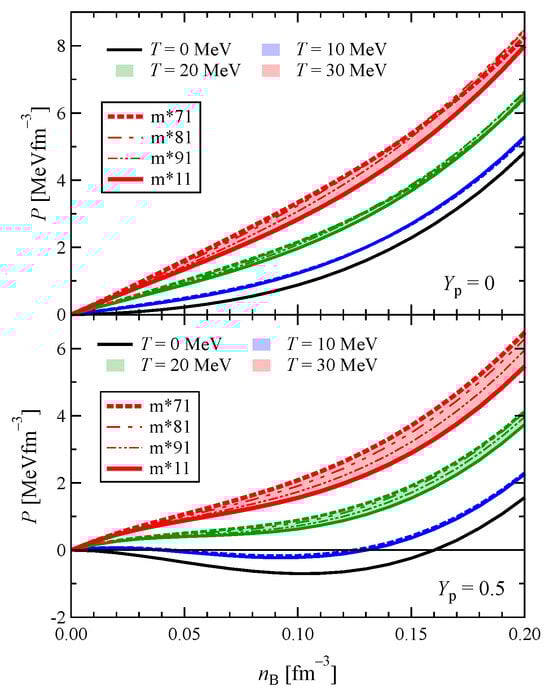
Figure 12.
Range of uncertainty for the pressure as a function of density, temperature and proton fraction.
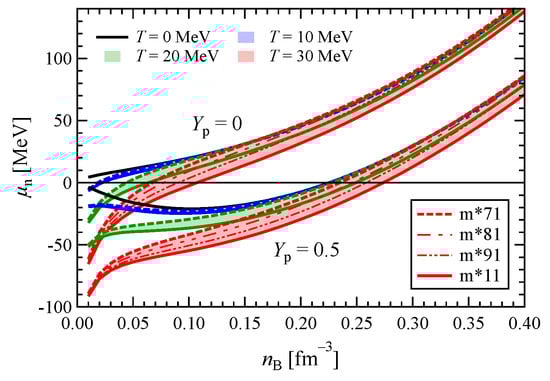
Figure 13.
Range of uncertainty for the chemical potential as a function of density, temperature and proton fraction.
In the case of P shown in Figure 12, the upper and lower bounds correspond to m*71 and m*11, respectively, for all the temperatures in symmetric nuclear matter. On the other hand, in pure neutron matter, the lower limit corresponds to the m*11 at all the temperatures in this figure, while the model that sets the upper limit varies with density. For P at 30 MeV, the m*71 model provides the upper bound in the low-density region , but at higher densities, it is replaced by other models. Furthermore, at densities even higher than those shown in Figure 12, it is also found that, in both symmetric nuclear matter and pure neutron matter, the models providing both the upper and lower limits of P change with density. In the case of , it does not exhibit as a complex model dependent on P. For symmetric nuclear matter, the m*71 always provides the upper limit, while the m*11 gives the lower limit at all densities and temperatures. For pure neutron matter, the lower limit is consistently determined by the m*11, while the model providing the upper limit changes from m*71 to another model at high densities.
From the above discussion, we notice that in the case of most of the thermodynamic quantities, the isoscalar effective mass has larger effects than the isovector effective mass. The reason for this can be explained as follows. In the case of symmetric nuclear matter, as shown in Equation (4), both the proton and neutron effective masses coincide with the isoscalar effective mass (). Therefore, changes in directly affect the thermodynamic quantities through the nucleon effective masses, which do not depend on at all.
In contrast, in neutron-rich matter, since , Equation (4) indicates that is primarily determined by , while is influenced by both and , with a relative weighting of 2:1. Here, the number of protons is small in neutron-rich matter, so the contribution from the protons becomes relatively insignificant, and the behavior of neutron occupation probability thus dominates the thermodynamic quantities. Consequently, the effect of , which influences with twice the weight of , remains significant even in neutron-rich matter.
Up until now, we have seen the values of the thermodynamic quantities and their uncertainties arising from the effective mass. We find that the uncertainty originating from is dominant and the role of is suppressed by a factor from 3 to 10. The uncertainty is magnified with temperature, and the sensitivity to the proton fraction is also easily distinguished. Another way which could be more comprehensive to understand the dependence on the effective mass is the relative uncertainty, i.e., the maximum difference divided by a reference value. For instance, entropy has a range (1.5–2.0) at in the pure neutron matter, and so, its relative uncertainty S∼0.5/2.0–0.5/1.5 takes the range of 25–33%. For the pressure, however, the relative uncertainty is below 10%, so the relative uncertainties are strongly dependent on the observables. In Figure 14, we show the dependence of normalized maximum uncertainty on density. The normalization factors for , and include the averaged nucleon mass , so they are ( + M), ( + M) and ( + ), respectively, while and do not involve M in the definition of the relative uncertainty. For example, , while .
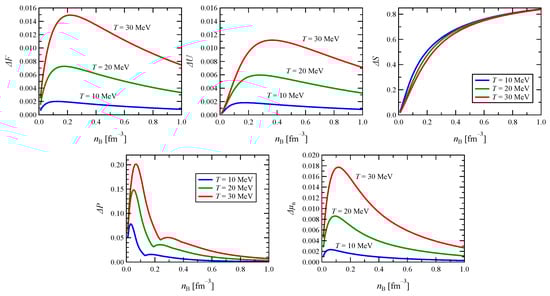
Figure 14.
Maximum uncertainty of thermodynamical quantities normalized by the quantities at .
The relative uncertainty of F, U, P and increases very quickly as temperature increases. Another interesting result is that at a given temperature, the relative uncertainty reaches a maximum at a certain density, and above this density, it decreases as density increases for F, U, P and . However, entropy shows behavior completely different from F, U, P and . Dependence on the temperature is scarcely distinguished, but the relative uncertain increases monotonically with density. Entropy also exhibits unique behavior in terms of the magnitude of the relative uncertainty. Maximum uncertainty at MeV does not exceed 2% for F, U and , and it is about 20% for P at most. For S, however, it is about 40% at and approaches 60% at . If an observable is considered, uncertainty due to S may be a dominant source of the uncertainty for the observable, and pressure can also have a significant effect. On the other hand, since the uncertainty due to the effective mass is well below 2% for F, U and , their uncertainties may not play a critical role to the uncertainty of an observable. To have a sense of the effect of the uncertainty due to the effective mass, we consider the proto-neutron star in the following section.
4. Proto-Neutron Star
In this section, we apply the KIDS model at finite temperature to investigate the properties of proto-neutron stars for different isoscalar effective masses. A proto-neutron star is a hot, lepton-rich remnant formed immediately after the gravitational collapse of a massive star in a core-collapse supernova, primarily due to neutrino trapping. Over tens of seconds, it undergoes deleptonization as neutrinos escape, eventually evolving into a cold neutron star or collapsing into a black hole. To replicate such conditions, we consider charge-neutral, -stable matter composed of nucleons, leptons and photons, with a fixed lepton fraction per nucleon . The lepton component consists of electrons, positrons, electron-type neutrinos and electron-type antineutrinos, treated as relativistic non-interacting Fermi gases. The contribution of photons is incorporated via the Stefan–Boltzmann law. The thermodynamic quantities of proto-neutron star matter are computed along adiabats with a fixed total thermodynamic entropy per baryon, , which includes contributions from nucleons, leptons and photons. This is because a proto-neutron star evolves approximately along isentropic trajectories, where the total entropy per baryon remains nearly constant in each region of the star due to the high neutrino opacity at early times. In contrast, temperature varies significantly with density and position within the star, making it less suitable as a control parameter []. Since we focus on the influence of effective masses of uniform nuclear matter, we supplement the non-uniform EoS at low densities by the TNTYST EoS [].
In Figure 15a, we show the temperature profile in the proto-neutron star at the total entropy per baryon = 1 and 2 as a function of the baryon mass density for the isoscalar effective masses 0.7, 0.8, 0.9 and 1.0. Isovector effective mass is fixed to . Noticeable difference begins at 1014 g/cm3 because the TNTYST EoS is adopted at 1014 g/cm3. The red (green) band in Figure 15 corresponds to the uncertainty range of the temeperature profile in the proto-neutron star at = 2 (1) for different models shown in Table 1. The range becomes enlarged as density increases. In the case of = 2 at 1015 g/cm3, temperatures are about 40, 50, 60 and 70 MeV for 1.0, 0.9, 0.8 and 0.7, respectively. Temperature is sensitive to the isoscalar effective mass and tends to increase with a lower value. In the preceding results, it is shown that the internal energy decreases and pressure increases as decreases. Therefore, one can expect that the EoS becomes stiff at small values. Stiffness of EoS with respect to the isoscalar effective mass can be understood from Figure 15b, where we display the mass–radius relation of the proto-neutron star with the EoS obtained in Figure 15a. For comparison, we also show the mass–radius relation of the cold neutron star with m*11 and m*71 models, which represent the untrapped neutrino -stable matter at . In the case of a cold neutron star, the results obtained with all the KIDS models are difficult to distinguish from each other. In Figure 15b, it can also be seen that the radius of the canonical mass star is km for a cold neutron star. On the other hand, for the proto-neutron star at = 2, 17.0, 16.5, 16.0 and 15.0 km for 0.7, 0.8, 0.9, and 1.0, respectively, so the result indicates significant swelling of the radius at finite temperature. This is consistent with the results in [,]. In general, the radius becomes large with stiff EoS, so the mass–radius relation of the proto-neutron star demonstrates close correlation between the effective mass and stiffness of EoS at finite temperature.
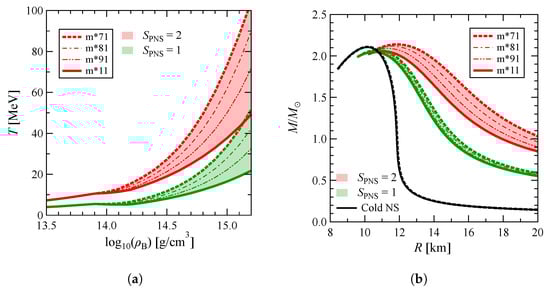
Figure 15.
(a) Temperature profile and (b) mass–radius relation of the proto-neutron star for 0.7, 0.8, 0.9 and 1.0 at S = 1 and 2.
In contrast to the case of cold neutron stars, where muon mixing is considered, muons are not included in the proto-neutron star model. This is because no muons are present when neutrinos become trapped and the total muon lepton number can be considered to be zero. As the proto-neutron star evolves and the density increases, muons can be thermally produced and contribute to matter properties, but even then, muons play only a minor role []. Moreover, we note that many simulations of core-collapse supernovae also neglect muons in their calculations [,,].
5. Summary
We examined the properties of nuclear matter at finite density and temperature, particularly emphasizing the role played by the effective mass in this context. For the purpose of this study, the KIDS model is adopted. The free energy is found to be larger (smaller) with smaller values of isoscalar (isovector) effective mass, the effects being more pronounced at higher temperature. The internal energy and the entropy increase (decrease) with increasing isoscalar (isovector) effective mass, and the magnitude of uncertainty due to isovector effective mass is about half of that of isoscalar effective mass. The sensitivity of isovector effective mass to the pressure residual is relatively quite small compared to that of isoscalar effective mass. Similarly, the uncertainty due to isovector effective mass on the residual of chemical potential is marginal compared to that of isoscalar effective mass. The maximum uncertainties of free energy, internal energy and chemical potential show that these thermodynamical quantities are weakly dependent on the effective mass. However, the entropy is quite strongly affected by effective mass but weakly affected by temperature. Both effective mass and temperature have moderate effects on pressure.
We also extend our work to investigate the properties of proto-neutron stars considering the trapped neutrino case with isentropic matter. We found that a smaller isoscalar effective mass makes the EoS stiffer, which results in larger values of .
Author Contributions
Conceptualization, H.T. and C.H.H.; methodology, H.T. and H.G.; software, H.T.; validation, All authors; formal analysis, H.T. and H.G.; investigation, All authors; resources, H.T. and C.H.H.; data curation, H.T.; writing—original draft preparation, H.T., D.S. and C.H.H.; writing—review and editing, All authors; visualization, H.T.; supervision, C.H.H.; project administration, C.H.H.; funding acquisition, C.H.H. All authors have read and agreed to the published version of the manuscript.
Funding
This work was supported by the National Research Foundation of Korea (NRF) Grant Nos. 2018R1A5A1025563 and 2023R1A2C1003177. The research of author H.T. was supported in part by JSPS KAKENHI Grant Numbers JP21K13924 and JP21H01088.
Data Availability Statement
The raw data presented in this article will be made available by the authors on request.
Acknowledgments
We would like to express our special thanks to K. Sumiyoshi and M. Takano for valuable discussions and comments.
Conflicts of Interest
The authors declare no conflicts of interest.
References
- Hammer, H.-W.; Nogga, A.; Schwenk, A. Colloquium: Three-body forces: From cold atoms to nuclei. Rev. Mod. Phys. 2013, 85, 197. [Google Scholar] [CrossRef]
- Carlson, J.; Gandolfi, S.; Pederiva, F.; Pieper, S.C.; Schiavilla, R.; Schmidt, K.E.; Wiringa, R.B. Quantum Monte Carlo methods for nuclear physics. Rev. Mod. Phys. 2015, 87, 1067. [Google Scholar] [CrossRef]
- Li, B.-A.; Cai, B.-J.; Chen, L.-W.; Xu, J. Nucleon effective masses in neutron-rich matter. Prog. Part. Nucl. Phys. 2018, 99, 29–119. [Google Scholar] [CrossRef]
- Choi, S.; Miyatsu, T.; Cheoun, M.-K.; Saito, K. Constraints on nuclear saturation properties from terrestrial experiments and astrophysical observations of neutron stars. Astrophys. J. 2021, 909, 156. [Google Scholar] [CrossRef]
- Wang, S.; Tong, H.; Zhao, Q.; Wang, C.; Ring, P.; Meng, J. Neutron star matter with a relativistic quark model. Phys. Rev. C 2023, 108, L031303. [Google Scholar] [CrossRef]
- Li, S.; Pang, J.; Shen, H.; Hu, J.; Sumiyoshi, K. Influence of effective nucleon mass on equation of state for supernova simulations and neutron stars. Astrophys. J. 2025, 980, 54. [Google Scholar] [CrossRef]
- Li, B.-A.; Cai, B.-J.; Xie, W.-J.; Zhang, N.-B. Progress in constraining nuclear symmetry energy using neutron star observables since GW170817. Universe 2021, 7, 182. [Google Scholar] [CrossRef]
- Miyatsu, T.; Cheoun, M.-K.; Kim, K.; Saito, K. Can the PREX-2 and CREX results be understood by relativistic mean-field models with the astrophysical constraints? Phys. Lett. B 2023, 843, 138013. [Google Scholar] [CrossRef]
- Lim, Y.; Schwenk, A. Symmetry energy and neutron star properties constrained by chiral effective field theory calculations. Phys. Rev. C 2024, 109, 035801. [Google Scholar] [CrossRef]
- Burgio, G.F.; Das, H.C.; Vidaña, I. The nuclear symmetry energy and the neutron skin thickness in nuclei. Front. Astron. Space Sci. 2024, 11, 1505560. [Google Scholar] [CrossRef]
- Gil, H.; Kim, Y.-M.; Papakonstantinou, P.; Hyun, C.H. Constraining the density dependence of the symmetry energy with nuclear data and astronomical observations in the Korea-IBS-Daegu-SKKU framework. Phys. Rev. C 2021, 103, 034330. [Google Scholar] [CrossRef]
- Gil, H.; Hyun, C.H. Compression modulus and symmetry energy of nuclear matter with KIDS density functional. New Phys. Sae Mulli 2021, 71, 242. [Google Scholar] [CrossRef]
- Gil, H.; Papakonstantinou, P.; Hyun, C.H. Constraints on the curvature of nuclear symmetry energy from recent astronomical data within the KIDS framework. Int. J. Mod. Phys. E 2022, 31, 2250013. [Google Scholar] [CrossRef]
- Gil, H.; Papakonstantinou, P.; Hyun, C.H.; Oh, Y. From homogeneous matter to finite nuclei: Role of the effective mass. Phys. Rev. C 2019, 99, 064319. [Google Scholar] [CrossRef]
- Prakash, M.; Bombaci, I.; Prakash, M.; Ellis, P.J.; Lattimer, J.M.; Knorren, R. Composition and structure of protoneutron stars. Phys. Rep. 1997, 280, 1–77. [Google Scholar] [CrossRef]
- Dexheimer, V.; Schramm, S. Proto-neutron and neutron stars in a chiral SU (3) model. Astrophys. J. 2008, 683, 943. [Google Scholar] [CrossRef]
- Burgio, G.F.; Vidaña, I. The equation of state of nuclear matter: From finite nuclei to neutron stars. Universe 2020, 6, 119. [Google Scholar] [CrossRef]
- Sedrakian, A.; Harutyunyan, A. Equation of state and composition of proto-neutron stars and merger remnants with hyperons. Universe 2021, 7, 382. [Google Scholar] [CrossRef]
- Sedrakian, A.; Harutyunyan, A. Delta-resonances and hyperons in proto-neutron stars and merger remnants. Eur. Phys. J. A 2022, 58, 137. [Google Scholar] [CrossRef]
- Raduta, A.R.; Oertel, M.; Sedrakian, A. Proto-neutron stars with heavy baryons and universal relations. Mon. Not. Roy Astron. Soc. 2020, 499, 914–931. [Google Scholar] [CrossRef]
- Constantinou, C.; Muccioli, B.; Prakash, M.; Lattimer, J.M. Thermal properties of supernova matter: The bulk homogeneous phase. Phys. Rev. C 2014, 89, 065802. [Google Scholar] [CrossRef]
- Constantinou, C.; Muccioli, B.; Prakash, M.; Lattimer, J.M. Thermal properties of hot and dense matter with finite range interactions. Phys. Rev. C 2015, 92, 025801. [Google Scholar] [CrossRef]
- Nakazato, K.; Suzuki, H. Cooling timescale for protoneutron stars and properties of nuclear matter: Effective mass and symmetry energy at high densities. Astrophys. J. 2019, 878, 25. [Google Scholar] [CrossRef]
- Schneider, A.S.; Roberts, L.F.; Ott, C.D.; O’connor, E. Equation of state effects in the core collapse of a 20 -M star. Phys. Rev. C 2019, 100, 055802. [Google Scholar] [CrossRef]
- Yasin, H.; Schäfer, S.; Arcones, A.; Schwenk, A. Equation of state effects in core-collapse supernovae. Phys. Rev. Lett. 2020, 124, 092701. [Google Scholar] [CrossRef]
- Raithel, C.; Paschalidis, V.; Özel, F. Realistic finite-temperature effects in neutron star merger simulations. Phys. Rev. D 2021, 104, 063016. [Google Scholar] [CrossRef]
- Andersen, O.E.; Zha, S.; Schneider, A.D.; Betranhandy, A.; Couch, S.M.; O’Connor, E.P. Equation-of-state dependence of gravitational waves in core-collapse supernovae. Astrophys. J. 2021, 923, 201. [Google Scholar] [CrossRef]
- Raduta, A.R.; Nacu, F.; Oertel, M. Equations of state for hot neutron stars. Eur. Phys. J. A 2021, 57, 329. [Google Scholar] [CrossRef]
- Tolman, R.C. Static solutions of Einstein’s field equations for spheres of fluid. Phys. Rev. 1939, 55, 364. [Google Scholar] [CrossRef]
- Oppenheimer, J.R.; Volkoff, G.M. On massive neutron cores. Phys. Rev. 1939, 55, 374. [Google Scholar] [CrossRef]
- Papakonstantinou, P.; Park, T.-S.; Lim, Y.; Hyun, C.H. Density dependence of the nuclear energy-density functional. Phys. Rev. C 2018, 97, 014312. [Google Scholar] [CrossRef]
- Akmal, A.; Pandharipande, V.R.; Ravenhall, D.G. Equation of state of nucleon matter and neutron star structure. Phys. Rev. C 1998, 58, 1804. [Google Scholar] [CrossRef]
- Miller, M.C.; Lamb, F.K.; Dittmann, A.J.; Bogdanov, S.; Arzoumanian, Z.; Gendreau, K.C.; Guillot, S.; Ho, W.C.G.; Lattimer, J.M.; Loewenstein, M.; et al. The radius of PSR J0740+6620 from NICER and XMM-Newton data. Astrophys. J. Lett. 2021, 918, L28. [Google Scholar] [CrossRef]
- Gil, H.; Papakonstantinou, P.; Hyun, C.H.; Park, T.-S.; Oh, Y. Nuclear energy density functional for KIDS. Acta Phys. Polon. B 2017, 48, 305. [Google Scholar] [CrossRef]
- Fukushima, T. Precise and fast computation of inverse Fermi–Dirac integral of order 1/2 by minimax rational function approximation. Appl. Math. Comput. 2015, 259, 698. [Google Scholar] [CrossRef]
- Fukushima, T. Precise and fast computation of Fermi–Dirac integral of integer and half integer order by piecewise minimax rational approximation. Appl. Math. Comput. 2015, 259, 708. [Google Scholar] [CrossRef]
- Togashi, H.; Nakazato, K.; Takehara, Y.; Yamamuro, S.; Suzuki, H.; Takano, M. Nuclear equation of state for core-collapse supernova simulations with realistic nuclear forces. Nucl. Phys. A 2017, 961, 78. [Google Scholar] [CrossRef]
- Yu, Z.; Ding, W.-B.; Liu, N.-N.; Luo, Q. Effects of temperature on the stability of protoneutron stars with hyperons. Mod. Phys. Lett. A 2012, 27, 1250008. [Google Scholar] [CrossRef]
- Sen, D. Nuclear matter at finite temperature and static properties of proto-neutron star. J. Phys. G 2021, 48, 025201. [Google Scholar] [CrossRef]
- Burgio, G.F.; Schulze, H.-J. The maximum and minimum mass of protoneutron stars in the Brueckner theory. Astron. Astrophys. 2010, 518, A17. [Google Scholar] [CrossRef]
- Sumiyoshi, K.; Yamada, S.; Suzuki, H.; Shen, H.; Chiba, S.; Toki, H. Postbounce evolution of core-collapse supernovae: Long-term effects of the equation of state. Astrophys. J. 2005, 629, 922. [Google Scholar] [CrossRef]
- Janka, H.-T. Explosion mechanisms of core-collapse supernovae. Annu. Rev. Nucl. Part. Sci. 2012, 62, 407. [Google Scholar] [CrossRef]
- Burrows, A. Colloquium: Perspectives on core-collapse supernova theory. Rev. Mod. Phys. 2013, 85, 245. [Google Scholar] [CrossRef]
Disclaimer/Publisher’s Note: The statements, opinions and data contained in all publications are solely those of the individual author(s) and contributor(s) and not of MDPI and/or the editor(s). MDPI and/or the editor(s) disclaim responsibility for any injury to people or property resulting from any ideas, methods, instructions or products referred to in the content. |
© 2025 by the authors. Licensee MDPI, Basel, Switzerland. This article is an open access article distributed under the terms and conditions of the Creative Commons Attribution (CC BY) license (https://creativecommons.org/licenses/by/4.0/).