Abstract
Chemically modified electrodes based on derivatives of 2-thioxothiazolidin-4-one were mentioned as possible solutions for heavy metal (HM) ions heterogeneous recognition. Such ligands form thin films with reversible responses in the ferrocene redox probe with a well-defined symmetrical peak and symmetrical values for the anodic and cathodic currents. Their selectivity in coordinating HM ions was proven. In this paper, a computer-added study was performed using density functional theory (DFT) based on two methods, B3LYP and ωB97XD, to arrive at a better inside of their structure. Properties related to their reactivity concerning experimental electrochemical behaviour and spectral results were calculated using specific molecular descriptors. DFT-calculated HOMO-LUMO energies were found in good linear correlation with experimental redox potential. The accuracy of the calculations was also proven by a good agreement between the energy calculated by the DFT method and the UV-Vis spectra for the studied ligands. Such a computational approach can be used to evaluate the properties of possible new ligands for such electrochemical applications. The strong correlation between DFT-predicted quantum parameters and experimental redox potentials underscores the relevance of these computational approaches in designing selective molecular sensors. The results obtained using the two functionals are in good agreement, although there are also situations and parameters for which the results are not identical. There is a symmetry of the values obtained by the electrochemical and spectral methods with those calculated by DFT.
1. Introduction
In recent years, the integration of computational chemistry with electrochemical analysis has enabled more precise predictions of molecular behavior, facilitating the rational design of functionalized electrodes for selective metal detection. Electrochemical properties for various organic compounds were previously correlated with structural parameters using density functional theory (DFT) calculations to rationally design new materials with improved electrochemical properties [1,2,3,4,5,6,7,8,9,10,11,12,13,14,15,16,17,18].
Also, in the medical field, rhodanine derivatives are used as antiviral [19], antimicrobial [20,21], antibacterial [22], antituberculosis [23], anticancer [19,24], antidiabetic activity [25], in the detection of Alzheimer’s markers [26], and pan assay interference compounds (PAINS) [27,28], and last but not least, they are materials with applications in biomedicine [29]. They can also be used for the identification of silver ions [30,31,32,33], mercury [33,34,35,36], lead [33], iodine [30], and fluorine [37]. New materials have been developed with applications in the production of supercapacitors [38] for the protection of various surfaces [39,40,41] and for the manufacture of photovoltaic cells [42].
Recent advancements have demonstrated that integrating density functional theory (DFT) calculations with experimental UV-Vis spectroscopy provides a comprehensive understanding of the electronic properties of various materials. For instance, Bulut et al. conducted a thorough investigation of cytosine-ZnO interactions, combining experimental UV-Vis data with DFT computations to elucidate the electronic transitions and binding characteristics of the system. Their study highlighted that the choice of basis sets in DFT significantly influences the accuracy of the predicted absorption spectra, aligning closely with experimental observations when appropriately selected. This approach underscores the critical role of computational methods in interpreting spectroscopic data and guiding the design of materials with tailored optical properties [43].
The link between the energy levels that correspond to the highest occupied molecular orbital (HOMO) and the lowest unoccupied molecular orbital (LUMO), and the electrochemical oxidation and reduction potentials, respectively, justify this attempt [16,17,18,44,45,46,47,48]. D. Méndez-Hernández and co-workers found strong linear correlations of DFT-calculated HOMO/LUMO energies functional and experimental redox potentials for polycyclic aromatic hydrocarbons [49] by using B3LYP/6-31G(d,p). The use of accurate and low-cost predictions using the B3LYP/6-31G(d,p) functional may therefore represent a reliable approach to apply on various molecules to evaluate their electrochemical properties [50,51]. The method ωB97XD model gives better performance for predictions on small neutral molecules than the commonly used B3LYP model [52].
Computer-aided approaches can be used as alternatives in case of required laborious investigations. Our team is involved in building chemically modified electrodes (CMEs) for sensors. The choice of a specific ligand is very important if a given target is a goal. One of our major objectives is to find appropriate organic ligands for the heterogenous detection of heavy metal (HM) ions using CMEs. Previous research by our group has shown the ability of such CMEs to coordinate HM ions and their high selectivity was proven [53]. Performing their DFT calculations [17], the prediction of properties was also possible by in-silico approaches. These properties were correlated with experimental data [17].
The present study aimed to identify parameters that characterize the best molecular structure among three thioxothiazolidin-4-ones. The structures of the compounds investigated in this paper are shown in Figure 1.
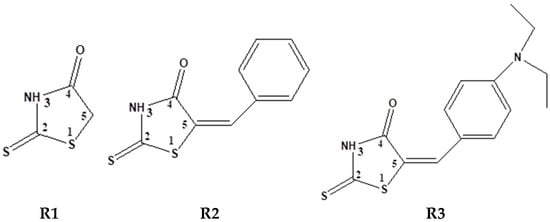
Figure 1.
Structures of 2-thioxo-thiazolidin-4-one (rhodanine, R1), 5-benzylidene-2-thioxo-thiazolidin-4-one (benzylidenerhodanine, R2), 5-(4-diethylamino-benzylidene)-2-thioxo-thiazolidin-4-one (p-diethiaminobenzylidenerhodanine, R3).
All investigated ligands have in their structure a part of rhodanine (R1), proven to have complexing properties for HMs in homogeneous and heterogeneous systems [54]. The rational design of ligands with tailored structural and electronic properties is essential for developing high-performance electrochemical sensors. By incorporating specific functional groups, these ligands enhance analyte recognition, facilitating selective and sensitive detection in complex environments. Similar research was reported using p-dimethylaminophenylenrhodanine (isomer of R3) for the precise determination of Cu, Ni, Fe, and Zn ions [55,56] and for the detection of Ag(I), Hg(II) ions using triarylamine rhodanine derivatives as colorimetric sensors [57].
The other part of the investigated ligand structures in Figure 1 is saturated CH2 group (in R1) or benzylidene group (in R2 and R3). The last groups could serve as polymerizable units to get modified electrodes. The two ethyl groups in p-position of the phenyl moiety in R3 induce electron-donating inductive effect (+I effect), which increases the electron density of the molecule in respect to R2. Consequently, the alkyl-substituted compound R3 is expected to be easier oxidized than R1 and R2. Also, it is expected that it will be harder to be reduced, but the steric effect of these groups makes the reductions more difficult to anticipate.
The immobilization of similar azulene rhodamines on electrodes by electropolymerization processes by π-stacking was demonstrated in a previous study [58]. As the number of grafted complexing units on the electrode surface is higher in this way, the preparation method is advantageous for sensors application leading to a better response.
R1, R2, and R3 ligands have been used to generate modified electrodes with complexing ability. Although the structures of the investigated ligands are similar, the obtained films show different electrochemical characteristics [59,60,61]. These experimental results led us to look for structural reasons to explain why the behaviour is so different.
In this paper, we report the results of DFT study on several calculated properties, which are compared with the experimental ones obtained by electrochemistry and UV-Vis, similarly with those for other structurally related thiazolidines confirmed by NMR spectra [53]. Quantum mechanical calculation is found as a reliable approach to help the rational design based on structural effects occurring by substitution of a parent compound. Since the analysis of inductive effects of the substituents, as previously performed on similar structures [62] led to the conclusion that it is not sufficient to find the best molecular structure able to detect metallic ions, an additional approach by DFT is compulsory to anticipate and design the optimal structure for the specific task of metal recognition.
2. Materials and Methods
Density functional theory (DFT) computations were performed with Spartan 24 software Wavefunction, Inc., Irvine, CA, USA [63] for investigated ligands at their equilibrium geometry in ground state in gas and in polar solvent. The predictions of the molecular properties and quantum chemical parameters were done on the basis of DFT [64], using B3LYP algorithm (Becke’s three-parameter hybrid exchange functional with the Lee–Yang–Parr correlation functional [65] with 6-311++G(d,p) basis set [66] and using ωB97XD model with 6-311++G(d,p) basis set, confirmed before as having notable improvement over other empirical dispersion-corrected density functionals [67].
3. Results
3.1. Electrochemical and UV-Vis Data
R1, R2, and R3 ligands, having structures given in Figure 1, have been characterized by electrochemical and UV-Vis methods. Table 1 shows the potentials of the first oxidation (Ea1) and reduction (Ec1) peaks put in evidence by differential pulse voltammetry (DPV) in 0.5 mM solutions in 0.1 M tetrabutylammonium perchlorate (TBAP) in acetonitrile (CH3CN) and the maximum wavelengths/frequencies for the first absorption peaks for the UV-Vis spectra recorded in CH3CN. These experimental parameters are further correlated with the calculated ones.

Table 1.
Experimental electrochemical properties in 0.5 mM solutions in 0.1 M TBAP in acetonitrile * and spectral data in acetonitrile related to R1–R3 ligands.
Figure 2 shows in parallel the electrochemical behaviour of R1–R3 expressed as DPV curves recorded in anodic and cathodic scans. The curves were obtained for each ligand in 2 mM in solution in the same supporting electrolyte (0.1 M TBAP in CH3CN) and on the same glassy carbon (GC) electrode (3 mm in diameter) in experiments performed under argon. The supporting electrolyte curves are shown with dashed lines. The oxidation processes are denoted a1–a4, while the reduction processes are denoted c1–c3 in the order of their apparition on each scan. Each starting potential is marked with a flash sign. The residual signal for oxygen reduction (O2)/O2–occurs sometimes at about −1.2 V as a parasite signal, while the signal at −3 V is linked to the amount of residual water present in the supporting electrolyte.
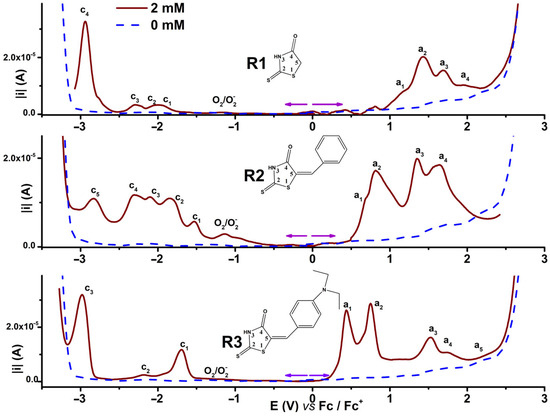
Figure 2.
DPV curves for investigated compounds R1–R3 in solutions of 2 Mm concentration in 0.1 M TBAP/CH3CN (continuous lines and, for the supporting electrolyte, dashed lines).
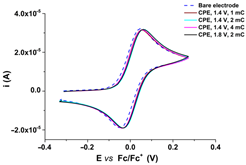
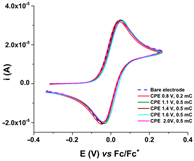
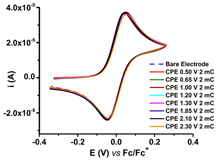
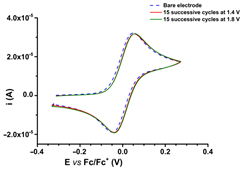
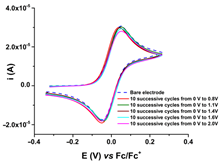
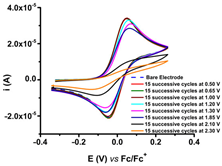
R1, R2, and R3 ligands were characterized by electrochemical and UV-Vis methods, and the results were collected and resumed in Table 1 [59,60,61]. Considering the complexing ability of rhodanine moiety, these ligands were used to prepare modified electrodes with complexing films in order to get molecular sensors for heavy metals. Although the structures of the investigated ligands are similar, the obtained films show different electrochemical characteristics, as seen in Table 2, when characterized by ferrocene redox probe. Either they are prepared by controlled potential electrolysis (Table 2, line 1) or by cycling the potential in similar potential domains (Table 2, line 2).
Table 2.
CV curves (0.1 V s−1) recorded after the transfer of the modified electrodes based on R1, R2, or R3 in ferrocene solution (1 mM) in 0.1 M TBAP/CH3CN compared to those recorded on bare electrode (dashed lines); the modified electrodes were obtained by controlled potential electrolysis (line 1) or by scanning (line 2) in 1 M solutions of each ligand in 0.1 M TBAP/CH3CN, according to references [59,60,61].
Different metal-binding properties were reported for the modified electrodes based on R1–R3 ligands (Table 3). For instance, modified electrodes based on R1 have detection limits with respect to Pb(II) (DLPb) in the order R1 < R3 < R2. The detection limits for Hg(II) vary in the order R2 < R1 < R3. For Cd, the detection limits (DLCd) vary in the order R1 = R3 < R2.
Table 3.
Estimated detection limits (DL, in mol/L) for Cd(II), Pb(II), Cu(II), and Hg(II) heavy metal ions using modified electrodes based on ligands R1–R3.
Spectral data [59,60,61] for the investigated ligands were obtained in acetonitrile solutions in connection with their electrochemical studies [59,60,61]. They were resumed in Table 4 and Figure 3 for comparison and analysis.
Table 4.
Maximum wave lengths (λmax) and absorbance (A) for compounds R1–R3 as a function of concentration C expressed in micromoles per liter (µM).
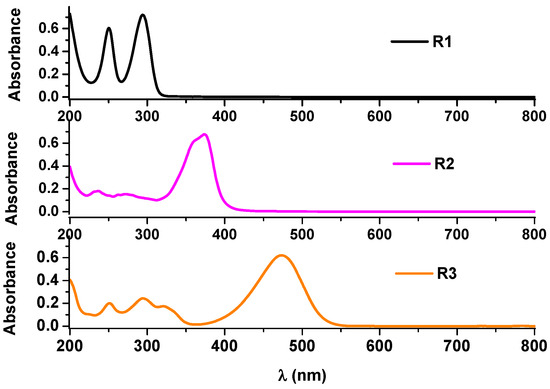
Figure 3.
UV-Vis spectra in acetonitrile for investigated compounds each in concentration of about 10 μM.
3.2. Computation of Molecular and QSAR Properties
Aiming to obtain detailed structural insights for the ligands under study, quantum mechanical calculations were performed on their optimized geometries using two DFT functionals in gas and in polar solvent.
Table 5 lists the results of DFT computations in gas for the optimized structures of the investigated ligands describing the most relevant molecular and quantitative structure–activity relationships (QSAR) properties of the investigated ligands using B3LYP/6-31G(d,p) and ωB97XD/6-311++G(d,p) density functional models. The lines 1–5 display the calculated molecular weight (line 1), energy (line 2), dipole moment (line 3), energy of the HOMO orbital (line 4), and energy of the LUMO orbital (line 5). Lines 6–13 show QSAR properties: area (line 6), volume (line 7), polar surface area (PSA) (line 8), degree of deviation from perfect spherical shape molecule (ovality index) (line 9), polarizability (line 10), octanol–water partition coefficient (logP) (11), minimum value of the local ionization potential (MinLocIonPot) (12), and minimum value of electrostatic potential (MinElPot) (13). The same 13 properties are listed in the same order in Table 6 as results of computations performed in polar solvent.
Table 5.
Predicted molecular (lines 1–5) and QSAR (lines 6–13) properties of R1–R3 calculated using B3LYP/6-311++G** and ωB97XD/6-311++G** density functional models, respectively, in gas.
Table 6.
Predicted molecular (lines 1–5) and QSAR (lines 6–13) properties of R1–R3 calculated using B3LYP/6-311++G** and ωB97XD/6-311++G** density functional models, respectively, in polar solvent.
The plots of predicted electrostatic potential maps in gas using ωB97XD/6-311++G** model are given in Figure 4, depicting the minimum values of the electrostatic potential situated on the most intense red regions (see alongside scale), as listed in Table 5 (line 13).
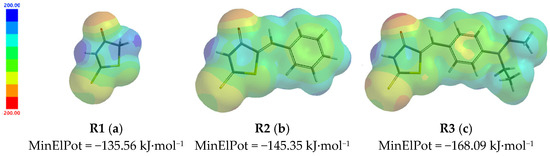
Figure 4.
Predicted electrostatic potential maps in gas for the investigated structures R1 (a), R2 (b), and R3 (c) using ωB97XD/6-311++G** model.
3.3. Computation of Ligands Chemical Reactivity Parameters
HOMO and LUMO energies given in Table 5 and Table 6 served to obtain other quantum parameters, as listed in Table 7 for gas and Table 8 for polar solvent, respectively: ionization potential (I) [68,69], electron affinity (A) [68,69], energy gap (ΔE), electronegativity (χ), global hardness (η) [70], global softness (σ) [70,71,72,73,74,75,76,77], and global electrophilicity index (ω) [78,79,80] using B3LYP/6-31G(d,p) and ωB97XD/6-311++G(d,p) density functional methods. These parameters describe the global reactivity of molecules related to electronic perturbations, influenced by the environmental media (solvent or gas) [17].
Table 7.
Quantum chemical reactivity parameters of R1–R3 obtained using B3LYP/6-311++G** and ωB97XD/6-311++G** density functional models in gas.
Table 8.
Quantum chemical reactivity parameters (in eV) of R1–R3 obtained using B3LYP/6-311++G** and ωB97XD/6-311++G** density functional models in polar solvent.
The frontier molecular orbitals density distributions obtained by calculation for the studied structures are shown in Figure 5, along with the energy diagram and the gaps between the HOMO and LUMO (ΔE) in polar solvent. They were calculated using the ωB97XD/6-311++G**) density functional model. For gas, using the same functional model, ωB97XD/6-311++G**, they are given in Figure S1.
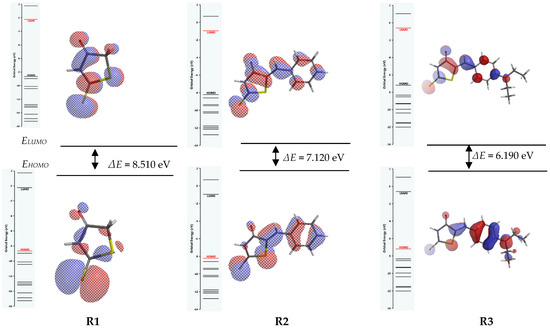
Figure 5.
Illustration of HOMO (down) and LUMO (up) frontier molecular orbitals distribution and their energy gaps for R1, R2, and R3, resulted from ωB97XD/6-311++G** model in polar solvent.
Furthermore, the correlation between electrochemical potential of oxidation (Ea1) and reduction (Ec1) taken from experimental DPV curves for R1, R2, and R3, together with the frequency from UV-Vis spectra (Table 1) and EHOMO, ELUMO, and ΔE, were studied. Linear dependencies (y = a + b•x) were obtained for calculations with B3LYP or ωB97XD methods in gas and polar solvent, as shown in Table 9, where a is the intercept and b is the slope.
Table 9.
Parameters of linear dependencies and their correlation coefficients (R2) obtained for the experimental first oxidation potential vs. EHOMO, first reduction potential vs. ELUMO, and UV-Vis frequency vs. HOMO, LUMO, and energy gap ΔE between LUMO and HOMO; EHOMO and ELUMO were calculated with B3LYP or ωB97XD functions.
3.4. Correlation of Molecular and QSAR Properties
Correlations between calculated molecular and QSAR properties (from Table 5 and Table 6, respectively) and the electron affinity (A) or ionization potential (I), respectively, are collected in Table 10 for gas and polar solvent computations. Linear relationships were proposed for all properties to establish the appropriate connections.
Table 10.
Parameters of the linear correlations (y = a + b•x) between predicted molecular (lines 1–6) and QSAR (lines 7–22) properties and electronic affinity A (eV) or ionization potential I (eV) calculated using B3LYP/6-311++G** and ωB97XD/6-311++G** density functional models, respectively, according to Table 5 and Table 6 for gas and polar solvent, respectively.
The best linear correlations from Table 10, using both functionals, are resumed in Table 11 for gas and Table 12 for polar solvent, respectively.
Table 11.
a, b, and R2 parameters of the best linear correlations (“y = a + b•x”) between predicted molecular and QSAR properties and electronic affinity A (eV) or ionization potential I (eV) in gas.
Table 12.
a, b, and R2 parameters of the best linear correlations (“y = a + b•x”) between predicted molecular and QSAR properties and electronic affinity A (eV) or ionization potential I (eV) in polar solvent.
3.5. Correlation of Quantum Chemical Reactivity Parameters
The predicted quantum reactivity parameters resumed in Table 7 for gas and Table 8 for polar solvent computations were correlated with electronic affinity A (eV) and ionization potential I (eV), respectively. Thus, the best correlations are resumed in Table 13 for gas and Table 14 for polar solvent, indicating the methods by which they were obtained.
Table 13.
a, b, and R2 parameters of the best linear correlations (“y = a + b•x”) in gas between quantum chemical reactivity parameters and electronic affinity A (eV) or ionization potential I (eV).
Table 14.
a, b, and R2 parameters of the best linear correlations (“y = a + b•x”) in polar solvent between quantum chemical reactivity parameters and electronic affinity A (eV) or ionization potential I (eV).
4. Discussion
The compounds structurally represented in Figure 1 have the electrochemical data resumed in Table 1 and Figure 2. The first oxidation process (a1) occurs at potentials, which vary in the order R1 > R2 > R3, while the first reduction process (c1) occurs at potentials with absolute values varying in the order R1 > R3 > R2 (Table 1). The different potentials for the first oxidation process agree with the extended conjugation of R3 with respect to R2 and R1. The reduction potentials are not situated in the same trend.
R1, R2, and R3 ligands were used to prepare chemically modified electrodes (CMEs). Although the structures of the investigated ligands are similar, the obtained films show different electrochemical characteristics revealed by cyclic voltammetry, as seen in Table 2, when characterized by ferrocene redox probe. Either they are prepared by control potential electrolysis or by cycling the potential. The potentials of ferrocene/ferrocenium (Fc/Fc+) couple on CME based on R1–R3 ligands (R1-CME, R2-CME, and R3-CME) are quite close to that on bare electrode for R2-CME and R3-CME, but less positive for R1-CME. for thin films (obtained at potentials less than 1.85 V). The shape of the cyclic voltammogram indicates a reversible redox process of ferrocene through these films with a well-defined symmetrical peak and symmetrical values for the anodic and cathodic currents.
Porous films are formed when scanning until 1.4 V from all ligands, as seen from the values of the ferrocene anodic peak current on the CMEs. When the CMEs are prepared at more positive potentials than 1.4 V, the films become isolating, covering the electrode and giving smaller anodic and cathodic currents. This behaviour is evident especially for R3-CME.
Different metal-binding properties were reported for these CMEs based on R1–R3 ligands (Table 3). For instance, R1-CME has detection limits in respect to Pb(II) in the order R1 < R3 < R2. The detection limits for Hg(II) vary in the order R2 < R1 < R3. For Cd, the detection limits vary in the order R1 = R3 < R2. The structural properties of the designed ligands significantly impact the performance of electrochemical sensors, such as detection limits, in respect to the given target, heavy metal detection. Key functional moieties (benzylidene group in R1 and R2 and the two ethyl groups in the para position of the phenyl moiety in R3) change the coordination interactions and influence the charge transfer mechanisms. For instance, R1-CME has detection limits with respect to Pb(II) in the order R1 < R3 < R2. The detection limits for Hg(II), Cd, and Cu vary in different order. These findings indicate that the monomer’ structure is important. Taking into account the heterogeneous complexation of the ions in the case of these CMEs, it seems that the films obtained by electropolymerization of these monomers have complexing cavities specifically appropriate for certain heavy metal ions. All CMEs are more sensitive for Pb(II) in respect to the other HMs. However, the detection limits indicate the order R3 < R1 < R2, showing that R3 is the best ligand for Pb. Taking each couple (R3 < R1), if we compare their structures, R3 structure contains 5-(4-diethylamino-benzylidene) group, which has a donor diethylamino group responsible for enhancing the ability of complexing Pb ions. By comparing R1 and R2, it shows that the introduction of 5-benzylidene group leads to a decrease in complexation (R1 < R2), probably due to the absorption of phenyl group on the electrode, blocking partially the electrode. These results could be further exploited in experiments dedicated to these structural particularities.
The electrochemical properties of the rhodanine derivatives investigated in this study were systematically analysed together with their UV-Vis spectral data to establish a direct relationship between electronic structure, optical transitions, and redox behaviour.
The observed electrochemical performance confirms that the ligand’s coordination sites and redox-active functionalities significantly influence sensor response, enabling efficient charge transfer and selective analyte binding. These structural features contribute to improve sensitivity, making the sensor highly effective for practical applications. By incorporating specific functional groups, these ligands enhance analyte recognition, facilitating selective and sensitive detection in complex environments. Furthermore, the synergy between ligand structure and sensor functionality demonstrates the importance of molecular design in optimizing electrochemical sensing platforms.
The UV-Vis spectral data reveal a progressive bathochromic shift in the absorption maxima from R1 (293.5 nm) to R2 (374 nm) and R3 (474 nm), indicating an increase in conjugation across the molecular structures. This shift suggests enhanced π-electron delocalization, particularly due to the benzylidene and diethylamino-benzylidene substitutions, which lower the energy required for electronic transitions. The strong correlation between these spectral features and the calculated frontier molecular orbitals confirms the role of HOMO-LUMO energy gaps in governing optical properties. Furthermore, the linear dependence of absorbance on concentration for all ligands, with high correlation coefficients, supports their stability and predictability in spectroscopic applications. The alignment of experimental UV-Vis data with DFT-predicted energy levels further validates the computational approach for rational sensor design.
The maximum absorbance values are close for these structures (around 0.5 for a concentration of 10 µM). For all compounds, linear dependencies of absorbance as a function of concentration were obtained for the main peak with very good correlation coefficients (Table 4). The other transitions with less intensity have smaller slopes. The experimental frequencies were correlated with the calculated energies, as discussed below.
The DFT computations of molecular and QSAR properties listed in Table 5 for gas and Table 6 for polar solvent revealed the most significant properties that change in magnitude for R1, R2, and R3, using both the functional method for computations (B3LYP or ωB97XD, respectively): the energy, the dipole moment, the energies of HOMO and LUMO, the area, the volume, the polar surface area (PSA), the ovality index, the polarizability, the water-partition coefficient (logP), and the electrostatic potential. Although the two functionals are different, they gave the same general trend in relation to the experiment. The methods lead to differences due to specific calculation algorithms. The influence of the functions grafted off the pattern rhodanine structure is highlighted by the variation of properties upon rhodanine substitution with benzylidene and di-ethylamino benzylidene groups. For instance, the calculated energies increase in the order R1 < R2 < R3.
Further analysis of the dipole moments, obtained via DFT calculations (Table 5, line 3), reveals an increasing trend R1 (2.06 D) < R2 (3.98 D) < R3 (8.84 D). The highest dipole moment observed for R3 reflects the strong electron-donating effect of the diethylamino group, which further contributes to its easier oxidation. This behaviour aligns with the electrochemical data, where R3 exhibits the lowest oxidation potential. The significant influence of dipole moment on electrochemical behavior can be linked to the polarizability values (Table 5, line 10), which increase with conjugation: R1 (48.78 × 10⁻³⁰ m3) < R2 (56.88 × 10⁻³⁰ m3) < R3 (63.97 × 10⁻³⁰ m3). A higher polarizability facilitates charge redistribution upon excitation, contributing to both longer absorption wavelengths in UV-Vis spectra and enhanced redox activity. The dipole moment, which is an electronic parameter, is also well correlated with energy, EHOMO, area, volume, ovality index, octantal-water partition coefficient (logP), minimum local ionization potential (MinLocIonPot), and minimum electrostatic potential (MinElPot). The order of the dipole moment values does not correlate with the PSA values, which can be analyzed in relation to the structural changes of the ligands, as discussed above.
The values of the frontier molecular orbitals energies for the HOMO orbitals (Table 5, line 4) vary in the order R3 > R2 > R1. The results are in good agreement with the variation in structure reflecting the order of the reactivity in electrooxidation. The experimentally determined oxidation potentials (Ea1) follow the order R1 (1.234 V) > R2 (0.681 V) > R3 (0.436 V). This trend indicates that the more conjugated derivatives undergo oxidation at lower potentials, confirming that electron delocalization facilitates charge transfer. The strong correlation between these parameters confirms that oxidation occurs more readily in molecules with higher HOMO energy levels. The calculated LUMO energies follow a slightly different order, R1 (−2.36 eV) > R2 (−2.99 eV) < R3 (−2.55 eV), suggesting that the reduction processes involve additional structural and electronic considerations, particularly in the stabilization of the radical anion intermediate.
The area and the volume are increasing in the same order, according to the increasing molecular weight upon substitution. The substitution and the occurrence on the phenyl ring of additional diethylamino group induces the change in polar surface area (R3 > R2).
The ovality index normally increases according to the complexity of the molecule.
The polarizability values are affected by increasing in conjugation length (R2 > R1) and with the introduction of the diethylamino group with electron-donating inductive effect (R3 > R2).
Concerning logP values, the increase of 8 times in magnitude between R1 and R2 is evident and reflects the influence of the phenyl groups, which increases 8 times, that strongly affect the structure and only 1.5 times between R2 and R3, a result of the addition of the polar di-ethyl amino group, that increases the conjugation chain. The obtained values for logP are identical regardless of the method used for calculation.
The minimum value of the local ionization potential (MinLocIonPot) and the minimum value of the electrostatic potential (MinElPot) vary in the same order (R1 > R2 > R3). The results agree and reflect the order of the easiness in electrooxidation (R3 > R2 > R1). Using both methods, B3LYP or ωB97XD, close values are obtained for MinLocIonPot, but the same trend of variation for all these two properties is kept.
From Table 6, the calculations done in polar solvent give the same conclusions as those obtained in gas. In this case also, the dipole moment shows a higher increase when calculated with B3LYP functional than with ωB97XD. For MinElPot, the values obtained by ωB97XD method are higher in absolute values than those in gas.
The graphical representation of predicted electrostatic potential maps in gas given in Figure 4 shows that the most intense red colour is located on the rhodanine carbonyl group of R3 and confirmed by their colour the values given for the MinElPot given under the structures. The most intense red regions refer to the atoms where the electroxidation takes place the easiest (correlated with the potentials of the first oxidation peak, a1) and are the potential sites for HM ions complexation, where positive charges are the most susceptible to be attracted (correlated with the detection limits for HM ions). The most intense blue regions refer to the atoms where the electroreduction takes place the easiest (correlated with the potentials of the first reduction peak, c1).
The computation of ligands chemical reactivity parameters of R1–R3 using B3LYP/6-31G(d,p) and ωB97XD/6-311++G(d,p) density functional methods in gas or polar solvent given in Table 7 and Table 8, respectively, show values correlated to their structure in a similar way, as those reported above for EHOMO and ELUMO. The energy gap (ΔE) and global hardness (η) values vary in the order R1 > R2 > R3, while electronegativity (χ) and global electrophilicity index (ω) vary in the opposite order, R1 < R2 > R3. The global softness (σ) varies in the order R1 < R2 < R3.
The values of I, A, η, σ, and ω are quite different when calculated using the two methods: the values for I, η are lower when calculated with B3LYP and higher for A, χ, σ, and ω when calculated with ωB97XD.
Table 7 and Table 8 are useful to assess the global reactivity of these molecules and the kinetic stability mainly indicated by the energy gap (ΔE) between the frontier molecular orbitals, HOMO and LUMO. The unsubstituted ligand R1 has the highest ΔE value, followed by R2 and R3, either by using B3LYP or ωB97XD methods in the same media (gas or polar solvent). These findings are in accordance with the results of experimental UV-Vis spectra (Table 1, line 3), which show that the first transition occurs at wavelengths increasing from R1 to R3, indicating that the energies of these transitions decrease in the same order.
By comparing Table 7 values obtained in gas with Table 8 values obtained in polar solvent, the influence of solvent can be obtained when using B3LYP or ωB97XD methods. The unsubstituted ligand R1 has the highest ΔE value (8.51 eV), followed by R2 (7.12 eV) and R3 (6.19 eV) in polar solvent.
For both methods in polar solvent (Table 8), ΔE is higher for R1 (4.530 eV in polar solvent > 4.430 eV in gas), while for R2 (3.590 eV in gas vs. 3.520 eV in polar solvent) and R3 (3.120 eV in gas vs. 2.830 eV in polar solvent), the values are lower (Table 7). That means that the substitution of rhodanine in R2 and R3 led to an increase in reactivity when the molecules are solved. This result agrees with the electrochemical potentials of oxidation of the ligands (Ea1 of R1 > Ea1 of R2 > Ea1 of R3, as resumed in Table 1). The ligands oxidise at lower potentials when they are more reactive. Thus, the calculations in polar solvent confirmed the order of the experimental oxidation potentials (R3 > R2 > R1). In addition, by comparing Figure 5 and Figure S1, it can be concluded that the computations given in Table 7 (line 3) and Table 8 (line 3) when using ωB97XD/6-311++G** density functional model, differences were found: 0.110 eV for R1, 0.070 eV for R2, and 0.360 eV for R3. The repartition of the HOMO orbitals on the bond C=S in the rhodanine core is similar for R2 and R3 and quite different for R1. The energy gap (ΔE) varies in the order R1 < R2 < R3. No major differences are noticeable in Figure 4 obtained for polar solvent compared with Figure S1 when the computations were referred to gas, exception made for R1.
Table 9 shows a good correlation between the electrochemical potential of oxidation (Ea1) and EHOMO, while that between the reduction potential (Ec1) and ELUMO is weaker. The correlations between UV-Vis frequency and EHOMO and ELUMO are less significant than the correlation with ΔE. When light is absorbed, the energy of the photon, which is directly proportional to the frequency, is transferred to an electron leading to a transition from HOMO to LUMO. This ΔE calculated by DFT as difference between ELUMO and EHOMO determines the frequency at which the molecule absorbs light. An excellent correlation between ΔE and UV-Vis spectral data was put in evidence.
Table 10 resumes the parameters of the linear correlation or the nonlinear correlations (nlc) found for the predicted molecular and QSAR properties and electronic affinity (A) or ionization potential (I) calculated using both functionals in gas and polar solvent. The best correlations for gas computations resumed in Table 11 indicate that the energy, dipole moment, area, volume, PSA, ovality index, polarizability, and MinElPot are best correlated with I using mostly ωB97XD functional. PSA is better correlated with I when using B3LYP. The dipole moment is also well correlated using B3LYP. Only the reduction potential is correlated with the affinity (A).
For polar solvent (Table 12), the best correlations with I are obtained for the energy, dipole moment, area, volume, ovality index, polarizability, and MinElPot using mostly ωB97XD functional. The dipole moment is better correlated with I when using B3LYP. MinElPot is correlated with the same coefficient using both functional methods. As in the case of Table 11 for gas, the reduction potential is correlated with A, better using ωB97XD than B3LYP.
The best correlations for predicted quantum reactivity parameters resumed in Table 13 for gas show that softness (σ) is correlated with the ionization potential (I) and ω is correlated with the affinity (A), both using B3LYP method.
The best correlations in polar solvent in the case of predicted quantum reactivity parameters resumed in Table 14 show that hardness (η) and softness (σ) are well correlated with I using ωB97XD; the electrophilicity index (ω) is correlated with A using B3LYP method.
5. Conclusions
The analysis of obtained results by DFT computations on 2-thioxothiazolidin-4-one derivatives has shown that the quantum reactivity parameters associated with the global reactivity and complexing properties of the CMEs based on these ligands are correlated with the experimental redox potentials of the ligands and their UV-Vis data.
The results obtained using the two functionals are in good agreement, although there are also situations and parameters for which the results are not identical. There is a symmetry of the values obtained by the electrochemical and spectral methods with those calculated by DFT.
Overall, the trends observed for UV-Vis spectral properties, electrochemical oxidation potentials, and computationally derived quantum chemical descriptors provide a comprehensive framework for understanding the structure-property relationships of rhodanine derivatives. The bathochromic shifts in UV-Vis spectra, the decreasing oxidation potentials, and the decreasing HOMO-LUMO gaps all point toward an increasing electron delocalization and enhanced electrochemical reactivity in the order R1 < R2 < R3. This synergy between experimental and computational results underscores the potential of DFT-based predictions in designing new electroactive molecular ligands for selective metal ion detection. These results could be further exploited in experiments dedicated to these structural particularities.
This analysis facilitates the design of new ligands that could be used to build molecular sensors. These findings pave the way for further computational experimental synergy in the design of advanced electrochemical sensors, potentially extending beyond heavy metal detection to broader environmental and biomedical applications.
Supplementary Materials
The following supporting information can be downloaded at: https://www.mdpi.com/article/10.3390/sym17030444/s1, Figure S1: Illustration of HOMO (down) and LUMO (up) frontier molecular orbitals distribution and their energy gaps for R1–R3, resulted from ωB97XD/6-311++G** model in gas.
Author Contributions
Conceptualization, A.S. and E.-M.U.; methodology, A.S.; software, A.S.; validation, E.-M.U., G.S. and R.I.; formal analysis, O.-T.M.; investigation, C.E.M. and O.-T.M.; resources, A.S. and O.-T.M.; data curation, R.I. and A.S.; writing—original draft preparation, C.E.M.; writing—review and editing, A.S.; visualization, E.-M.U.; supervision, R.I. and G.S.; project administration, E.-M.U. All authors have read and agreed to the published version of the manuscript.
Funding
This research received no external funding.
Data Availability Statement
Raw data and computations files are available from the authors upon reasonable request.
Conflicts of Interest
The authors declare no conflicts of interest.
Abbreviations
The following abbreviations are used in this manuscript:
| A | electron affinity |
| B3LYP | Becke, 3-parameter, Lee–Yang–Parr |
| CME | chemically modified electrode |
| CV | cyclic voltammetry |
| DFT | density functional theory |
| DL | detection limit |
| DPV | differential pulse voltammetry |
| Ea1 | potential of the first anodic peak |
| Ec1 | potential of the first cathodic peak |
| CPE | controlled potential electrolysis |
| HBA | hydrogen bond acceptor |
| HBD | hydrogen bond donor |
| HOMO | highest occupied molecular orbital |
| HSAB | Pearson’s Hard and Soft Acids and Bases Principle |
| I | ionization potential |
| logP | octanol/water partition coefficient |
| LUMO | lowest unoccupied molecular orbital |
| MHP | maximum hardness principle |
| MinElPot | minimum value of electrostatic potential |
| PSA | polar surface area |
| QSAR | quantitative structure-activity relationship |
| TBAP | tetrabutylammonium perchlorate |
| THz | terahertz = 1012 cycles per second. “Tera” is the prefix in the SI system denoting 1012 (or a trillion); 1 THz = 1012Hz. |
| ΔE | energy gap between frontier molecular orbitals |
| η | global hardness |
| σ | global softness |
| χ | electronegativity |
| ω | global electrophilicity index |
References
- Marenich, A.V.; Ho, J.; Coote, M.L.; Cramer, C.J.; Truhlar, D.G. Computational Electrochemistry: Prediction of Liquid-Phase Reduction Potentials. Phys. Chem. Chem. Phys. 2014, 16, 15068–15106. [Google Scholar] [CrossRef]
- Ho, J.; Coote, M.; Cramer, C.; Truhlar, D. Theoretical Calculation of Reduction Potentials. In Organic Electrochemistry: Revised and Expanded; CRC Press: Boca Raton, FL, USA, 2015; pp. 229–259. ISBN 9781420084016. [Google Scholar]
- Mohan, M.; Pangannaya, S.; Satyanarayan, M.N.; Trivedi, D.R. Photophysical and Electrochemical Properties of Organic Molecules: Solvatochromic Effect and DFT Studies. Opt. Mater. 2018, 77, 211–220. [Google Scholar] [CrossRef]
- Stefaniu, A.; Pop, M.D.; Arnold, G.L.; Birzan, L.; Pintilie, L.; Diacu, E.; Ungureanu, E.M. DFT Calculations and Electrochemical Studies on Azulene Ligands for Heavy Metal Ions Detection Using Chemically Modified Electrodes. J. Electrochem. Sci. Eng. 2018, 8, 73–75. [Google Scholar] [CrossRef]
- Avcı, D.; Tamer, Ö.; Başoğlu, A.; Atalay, Y. 5-Methyl-2-Thiophenecarboxaldehyde: Experimental and TD/DFT Study. J. Mol. Struct. 2018, 1174, 52–59. [Google Scholar] [CrossRef]
- David, C.I.; Prabakaran, G.; Sundaram, K.; Ravi, S.; Parimala devi, D.; Abiram, A.; Nandhakumar, R. Rhodanine-Based Fluorometric Sequential Monitoring of Silver (I) and Iodide Ions: Experiment, DFT Calculation and Multifarious Applications. J. Hazard. Mater. 2021, 419, 126449. [Google Scholar] [CrossRef]
- Wang, L.; Ye, D.; Li, W.; Liu, Y.; Li, L.; Zhang, W.; Ni, L. Fluorescent and Colorimetric Detection of Fe(III) and Cu(II) by a Difunctional Rhodamine-Based Probe. Spectrochim. Acta A Mol. Biomol. Spectrosc. 2017, 183, 291–297. [Google Scholar] [CrossRef]
- Kulinich, A.V.; Derevyanko, N.A.; Ishchenko, A.A.; Gusyak, N.B.; Kobasa, I.M.; Romańczyk, P.P.; Kurek, S.S. Structure and Redox Properties of Polymethine Dyes: Electrochemical and DFT/TD-DFT Study. Dyes Pigm. 2019, 161, 24–33. [Google Scholar] [CrossRef]
- Kouassi, K.A.R.; Benié, A.; N’guessan, K.N.; Koné, M.G.-R.; Ganiyou, A.; Bohoussou, K.V.; Coulibaly, W.K. Orbital Analysis of Natural Bonds, Calculations of the Functional Theory of Density Time-Dependent and Absorption Spectral of a Series of Rhodanine Derivatives. Med. J. Chem. 2020, 10, 453. [Google Scholar] [CrossRef]
- Bai, C.-B.; Wang, W.-G.; Zhang, J.; Wang, C.; Qiao, R.; Wei, B.; Zhang, L.; Chen, S.-S.; Yang, S. A Fluorescent and Colorimetric Chemosensor for Hg2+ Based on Rhodamine 6G With a Two-Step Reaction Mechanism. Front. Chem. 2020, 8, 14. [Google Scholar] [CrossRef]
- Vishaka, H.V.; Saxena, M.; Chandan, H.R.; Ojha, A.A.; Balakrishna, R.G. Paper Based Field Deployable Sensor for Naked Eye Monitoring of Copper (II) Ions; Elucidation of Binding Mechanism by DFT Studies. Spectrochim. Acta A Mol. Biomol. Spectrosc. 2019, 223, 117291. [Google Scholar] [CrossRef]
- Ghosh, K.; Rathi, S. A Novel Probe for Selective Colorimetric Sensing of Fe(II) and Fe(III) and Specific Fluorometric Sensing of Fe(III): DFT Calculation and Logic Gate Application. RSC Adv. 2014, 4, 48516–48521. [Google Scholar] [CrossRef]
- Sen, P.; Mpeta, L.S.; Mack, J.; Nyokong, T. New Difluoroboron Complexes Based on N,O-Chelated Schiff Base Ligands: Synthesis, Characterization, DFT Calculations and Photophysical and Electrochemical Properties. J. Lumin. 2020, 224, 117262. [Google Scholar] [CrossRef]
- Vadivel, I.; Udhayakumari, D. A Review on Schiff Base as Colorimetric and Fluorescence Sensors for D-Metal Ions. Curr. Chem. Lett. 2023, 12, 739–758. [Google Scholar] [CrossRef]
- Santana, J.A.; Ishikawa, Y. DFT Calculations of the Electrochemical Adsorption of Sulfuric Acid Anions on the Pt(110) and Pt(100) Surfaces. Electrocatalysis 2020, 11, 86–93. [Google Scholar] [CrossRef]
- Rakib, E.M.; Boga, C.; Calvaresi, M.; Chigr, M.; Franchi, P.; Gualandi, I.; Ihammi, A.; Lucarini, M.; Micheletti, G.; Spinelli, D.; et al. A Multidisciplinary Study of Chemico-Physical Properties of Different Classes of 2-Aryl-5(or 6)-Nitrobenzimidazoles: NMR, Electrochemical Behavior, ESR, and DFT Calculations. Arab. J. Chem. 2021, 14, 103179. [Google Scholar] [CrossRef]
- Vasile (Corbei), A.-A.; Ungureanu, E.-M.; Stanciu, G.; Cristea, M.; Stefaniu, A. Evaluation of (Z)-5-(Azulen-1-Ylmethylene)-2-Thioxothiazolidin-4-Ones Properties Using Quantum Mechanical Calculations. Symmetry 2021, 13, 1462. [Google Scholar] [CrossRef]
- Guerraoui, A.; Goudjil, M.; Direm, A.; Guerraoui, A.; Şengün, İ.Y.; Parlak, C.; Djedouani, A.; Chelazzi, L.; Monti, F.; Lunedei, E.; et al. A Rhodanine Derivative as a Potential Antibacterial and Anticancer Agent: Crystal Structure, Spectral Characterization, DFT Calculations, Hirshfeld Surface Analysis, in Silico Molecular Docking and ADMET Studies. J. Mol. Struct. 2023, 1280, 135025. [Google Scholar] [CrossRef]
- Mousavi, S.M.; Zarei, M.; Hashemi, S.A.; Babapoor, A.; Amani, A.M. A Conceptual Review of Rhodanine: Current Applications of Antiviral Drugs, Anticancer and Antimicrobial Activities. Artif. Cells Nanomed. Biotechnol. 2019, 47, 1132–1148. [Google Scholar] [CrossRef]
- Krátký, M.; Vinšová, J.; Stolaříková, J. Antimicrobial Activity of Rhodanine-3-Acetic Acid Derivatives. Bioorg. Med. Chem. 2017, 25, 1839–1845. [Google Scholar] [CrossRef]
- Abdel Hafez, N.A.; Elsayed, M.A.; El-Shahawi, M.M.; Awad, G.E.A.; Ali, K.A. Synthesis and Antimicrobial Activity of New Thiazolidine-Based Heterocycles as Rhodanine Analogues. J. Heterocycl. Chem. 2018, 55, 685–691. [Google Scholar] [CrossRef]
- Wu, Y.; Ding, X.; Xu, S.; Yang, Y.; Zhang, X.; Wang, C.; Lei, H.; Zhao, Y. Design and Synthesis of Biaryloxazolidinone Derivatives Containing a Rhodanine or Thiohydantoin Moiety as Novel Antibacterial Agents against Gram-Positive Bacteria. Bioorg. Med. Chem. Lett. 2019, 29, 496–502. [Google Scholar] [CrossRef]
- Cheng, S.; Zou, Y.; Chen, X.; Chen, J.; Wang, B.; Tian, J.; Ye, F.; Lu, Y.; Huang, H.; Lu, Y.; et al. Design, Synthesis and Biological Evaluation of 3-Substituted-2-Thioxothiazolidin-4-One (Rhodanine) Derivatives as Antitubercular Agents against Mycobacterium tuberculosis Protein Tyrosine Phosphatase B. Eur. J. Med. Chem. 2023, 258, 115571. [Google Scholar] [CrossRef] [PubMed]
- Sung, H.; Ferlay, J.; Siegel, R.L.; Laversanne, M.; Soerjomataram, I.; Jemal, A.; Bray, F. Global Cancer Statistics 2020: GLOBOCAN Estimates of Incidence and Mortality Worldwide for 36 Cancers in 185 Countries. CA Cancer J. Clin. 2021, 71, 209–249. [Google Scholar] [CrossRef]
- bin Ahmad Kamar, A.K.D.; Ju Yin, L.; Tze Liang, C.; Tjin Fung, G.; Avupati, V.R. Rhodanine Scaffold: A Review of Antidiabetic Potential and Structure–Activity Relationships (SAR). Med. Drug Discov. 2022, 15, 100131. [Google Scholar] [CrossRef]
- Rai, H.; Singh, R.; Bharti, P.S.; Kumar, P.; Rai, S.; Varma, T.; Chauhan, B.S.; Nilakhe, A.S.; Debnath, J.; Dhingra, R.; et al. Rhodanine Composite Fluorescence Probes to Detect Pathological Hallmarks in Alzheimer’s Disease Models. Sens. Actuators B Chem. 2024, 407, 135364. [Google Scholar] [CrossRef]
- Sun, J.; Zhong, H.; Wang, K.; Li, N.; Chen, L. Gains from No Real PAINS: Where ‘Fair Trial Strategy’ Stands in the Development of Multi-Target Ligands. Acta Pharm. Sin. B 2021, 11, 3417–3432. [Google Scholar] [CrossRef] [PubMed]
- Kratky, M.; Sramel, P.; Bodo, P.; Prnova, M.S.; Kovacikova, L.; Majekova, M.; Vinsova, J.; Stefek, M. Novel Rhodanine Based Inhibitors of Aldose Reductase of Non-Acidic Nature with p-Hydroxybenzylidene Functional Group. Eur. J. Med. Chem. 2023, 246, 114922. [Google Scholar] [CrossRef]
- Hiba, I.H.; Koh, J.K.; Lai, C.W.; Mousavi, S.M.; Badruddin, I.A.; Hussien, M.; Wong, J.P. Polyrhodanine-Based Nanomaterials for Biomedical Applications: A Review. Heliyon 2024, 10, e28902. [Google Scholar] [CrossRef] [PubMed]
- Leslee, D.B.C.; Karuppannan, S.; Karmegam, M.V.; Gandhi, S.; Subramanian, S.A. Fluorescent Turn-On Carbazole-Rhodanine Based Sensor for Detection of Ag+ Ions and Application in Ag+ Ions Imaging in Cancer Cells. J. Fluoresc. 2019, 29, 75–89. [Google Scholar] [CrossRef]
- Nan, Z.; Min, Z.; Chun-xiang, H.; Zhao-qiang, J.; Li-fen, L. An Improved Spectrophotometric Method for the Determination of Silver with 5-[p-(Dimethylamino)Benzylidene]Rhodanine. Talanta 1990, 37, 531–533. [Google Scholar] [CrossRef]
- Ludlow, J.W.; Guikema, J.A.; Consigli, R.A. Use of 5-(4-Dimethylaminobenzylidene)Rhodanine in Quantitating Silver Grains Eluted from Autoradiograms of Biological Material. Anal. Biochem. 1986, 154, 104–109. [Google Scholar] [CrossRef] [PubMed]
- Chandrasekaran, P.O.; Aswathy, A.; James, K.; Kala, K.; Ragi, M.T.; Manoj, N. A Molecular Chameleon: Fluorometric to Pb2+, Fluorescent Ratiometric to Hg2+ and Colorimetric to Ag+ Ions. J. Photochem. Photobiol. A Chem. 2021, 407, 113050. [Google Scholar] [CrossRef]
- Wang, Y.; Xu, T.; Song, E.; Jiang, Y.; Wang, F.; Gu, C.; Ju, X.; Bian, Y.; Song, Y.; Kengara, F.O.; et al. Ultrasensitive Detection of Trace Hg(II) in Acidic Conditions Using DMABR Loaded on Sepiolite: Function, Application and Mechanism Studies. J. Hazard. Mater. 2024, 474, 134734. [Google Scholar] [CrossRef] [PubMed]
- Chen, Y.; Han, S.; Yang, S.; Pu, Q. Rhodanine Stabilized Gold Nanoparticles for Sensitive and Selective Detection of Mercury (II). Dyes Pigm. 2017, 142, 126–131. [Google Scholar] [CrossRef]
- Bayindir, S. A Simple Rhodanine-Based Fluorescent Sensor for Mercury and Copper: The Recognition of Hg2+ in Aqueous Solution, and Hg2+/Cu2+ in Organic Solvent. J. Photochem. Photobiol. A Chem. 2019, 372, 235–244. [Google Scholar] [CrossRef]
- Saleh Hussein, A.; Lafzi, F.; Bayindir, S.; Toprak, M. The Selective Turn-on Recognition of Fluoride Ions Using 5-Aryl-Rhodanines: Colorimetric & Fluorescent Detection. J. Photochem. Photobiol. A Chem. 2023, 438, 114574. [Google Scholar] [CrossRef]
- Lin, J.; Jiang, C.; Liu, Z.; Zhao, J.; Huo, L.; Fan, E.; Zhang, P.; Deng, K. Porous Hollow Carbon Microspheres from Poly(Aniline-Co-Rhodanine) Prepared in Micellar Template for High-Performance Supercapacitors. J. Energy Storage 2024, 83, 110674. [Google Scholar] [CrossRef]
- Altunbaş, E.; Solmaz, R.; Kardaş, G. Corrosion Behaviour of Polyrhodanine Coated Copper Electrode in 0.1M H2SO4 Solution. Mater. Chem. Phys. 2010, 121, 354–358. [Google Scholar] [CrossRef]
- Solmaz, R.; Altunbaş Şahin, E.; Döner, A.; Kardaş, G. The Investigation of Synergistic Inhibition Effect of Rhodanine and Iodide Ion on the Corrosion of Copper in Sulphuric Acid Solution. Corros. Sci. 2011, 53, 3231–3240. [Google Scholar] [CrossRef]
- Umoren, S.A.; Solomon, M.M. Protective Polymeric Films for Industrial Substrates: A Critical Review on Past and Recent Applications with Conducting Polymers and Polymer Composites/Nanocomposites. Prog. Mater. Sci. 2019, 104, 380–450. [Google Scholar] [CrossRef]
- Wang, G.; Huang, Y.; Tang, X.; Li, J.; Dai, J.; Liu, B.; Zhang, J.; Xiong, J. A Rhodanine Modified Poly-Triarylamine Dye Function as a Hole Transport Layer for Inverted Perovskite Solar Cells. Dyes Pigm. 2024, 222, 111843. [Google Scholar] [CrossRef]
- Bulut, N.; Keser, S.; Zanchet, A.; Zuchowski, P.S.; Ates, T.; Kilic, İ.; Kaygili, O. A Comprehensive Study of Cytosine-ZnO Interactions: Theoretical and Experimental Insights. Phys. B Condens. Matter 2025, 697, 416732. [Google Scholar] [CrossRef]
- Boulkroune, M.; Ignatovich, L.; Muravenko, V.; Spura, J.; Chibani, A.; Jouikov, V. Correlation of the Homo–Lumo Gap in Furyl and Thienyl Nitrones and Nitroethenes with Their Electrochemical Redox Potentials*. Chem. Heterocycl. Compd. 2014, 49, 1579–1588. [Google Scholar] [CrossRef]
- Hu, T.; Lai, Q.; Fan, W.; Zhang, Y.; Liu, Z. Advances in Portable Heavy Metal Ion Sensors. Sensors 2023, 23, 4125. [Google Scholar] [CrossRef] [PubMed]
- Bai, C.; Meng, Q.; Song, Q.; Wang, S.; Chen, M.; Wang, X.; Liu, X.; Wei, B.; Qiao, R.; Zhang, L.; et al. A Novel Colorimetric/Fluorometric Dual-Channel Probe for Selective Detection of Sn2+ with Long-Wavelength Emission and Its Bioimaging Applications. Sens. Actuators B Chem. 2024, 417, 136135. [Google Scholar] [CrossRef]
- Brovelli, F.; Rivas, B.L.; Bernède, J.C.; del Valle, M.A.; Díaz, F.R.; Berredjem, Y. Electrochemical and Optical Studies of 1,4-Diaminoanthraquinone for Solar Cell Applications. Polym. Bull. 2007, 58, 521–527. [Google Scholar] [CrossRef]
- Wu, T.Y.; Tsao, M.H.; Chen, F.L.; Su, S.G.; Chang, C.W.; Wang, H.P.; Lin, Y.C.; Sun, I.W. Synthesis and Characterization of Three Organic Dyes with Various Donors and Rhodanine Ring Acceptor for Use in Dye-Sensitized Solar CellsJ. Iran. Chem. Soc. 2010, 7, 707–720. [Google Scholar] [CrossRef]
- Méndez-Hernández, D.D.; Tarakeshwar, P.; Gust, D.; Moore, T.A.; Moore, A.L.; Mujica, V. Simple and Accurate Correlation of Experimental Redox Potentials and DFT-Calculated HOMO/LUMO Energies of Polycyclic Aromatic Hydrocarbons. J. Mol. Model. 2013, 19, 2845–2848. [Google Scholar] [CrossRef]
- Becke, A.D. Density-Functional Exchange-Energy Approximation with Correct Asymptotic Behavior. Phys. Rev. A 1988, 38, 3098–3100. [Google Scholar] [CrossRef]
- Becke, A.D. Density-functional Thermochemistry. IV. A New Dynamical Correlation Functional and Implications for Exact-exchange Mixing. J. Chem. Phys. 1996, 104, 1040–1046. [Google Scholar] [CrossRef]
- Chen, L.; Süß, D.; Sukuba, I.; Schauperl, M.; Probst, M.; Maihom, T.; Kaiser, A. Performance of DFT Functionals for Properties of Small Molecules Containing Beryllium, Tungsten and Hydrogen. Nucl. Mater. Energy 2020, 22, 100731. [Google Scholar] [CrossRef]
- Ungureanu, E.M.; Popescu, M.; Tatu, G.L.; Birzan, L.; Isopescu, R.; Stanciu, G.; Buica, G.O. Electrochemical Comparison on New (Z)-5-(Azulen-1-Ylmethylene)-2-Thioxo-Thiazolidin-4-Ones. Symmetry 2021, 13, 588. [Google Scholar] [CrossRef]
- Arnold, G.L.; Lazar, I.G.; Buica, G.O.; Ungureanu, E.M.; Birzan, L. New Azulene Modified Electrodes for Heavy Metal Ions Recognition. Bulg. Chem. Commun. 2017, 49, 205–210. [Google Scholar]
- Kshirsagar, V.; Gandhem, S.; Gautam, M.D. Electrochemical Studies on P-Dimethylaminobenzylidine Rhodanine and Its Application as Amperometric Reagent. Rasayan J. Chem. 2010, 3, 772–776. [Google Scholar]
- Sada, P.K.; Bar, A.; Jassal, A.K.; Kumar, P.; Srikrishna, S.; Singh, A.K.; Kumar, S.; Singh, L.; Rai, A. A Novel Rhodamine Probe Acting as Chemosensor for Selective Recognition of Cu2+ and Hg2+ Ions: An Experimental and First Principle Studies. J. Fluoresc. 2024, 34, 2035–2055. [Google Scholar] [CrossRef] [PubMed]
- Thamaraiselvi, P.; Duraipandy, N.; Kiran, M.S.; Easwaramoorthi, S. Triarylamine Rhodanine Derivatives as Red Emissive Sensor for Discriminative Detection of Ag+ and Hg2+ Ions in Buffer-Free Aqueous Solutions. ACS Sustain. Chem. Eng. 2019, 7, 9865–9874. [Google Scholar] [CrossRef]
- Buica, G.-O.; Ungureanu, E.-M.; Birzan, L.; Razus, A.; Bujduveanu, M.-R. Films of Poly(4-Azulen-1-Yl-2,6-Bis(2-Thienyl) Pyridine) for Heavy Metals Ions Complexation. Electrochim. Acta 2011, 56, 5028–5036. [Google Scholar] [CrossRef]
- Matica, O.T.; Brotea, A.G.; Ungureanu, E.-M.; Mandoc, L.R.; Birzan, L. Electrochemical and Spectral Studies of Rhodanine in View of Heavy Metals Determination. Electrochem. Sci. Adv. 2023, 3, e2100218. [Google Scholar] [CrossRef]
- Matica, O.T.; Brotea, A.G.; Ungureanu, E.-M.; Stefaniu, A. Electrochemical and Spectral Studies on Benzylidenerhodanine for Sensor Development for Heavy Metals in Waters. Appl. Sci. 2022, 12, 2681. [Google Scholar] [CrossRef]
- Matica, O.T.; Musina, C.; Brotea, A.G.; Ungureanu, E.M.; Cristea, M.; Isopescu, R.; Buica, G.O.; Razus, A.C. Electrochemistry of Rhodanine Derivatives as Model for New Colorimetric and Electrochemical Azulene Sensors for the Detection of Heavy Metal Ions. Symmetry 2023, 15, 752. [Google Scholar] [CrossRef]
- Birzan, L.; Cristea, M.; Draghici, C.C.; Tecuceanu, V.; Maganu, M.; Hanganu, A.; Razus, A.C.; Buica, G.O.; Ungureanu, E.M. Vinylazulenes Chromophores: Synthesis and Characterization. Dyes Pigm. 2016, 131, 246–255. [Google Scholar] [CrossRef]
- Shao, Y.; Molnar, L.F.; Jung, Y.; Kussmann, J.; Ochsenfeld, C.; Brown, S.T.; Gilbert, A.T.B.; Slipchenko, L.V.; Levchenko, S.V.; O’Neill, D.P.; et al. Advances in Methods and Algorithms in a Modern Quantum Chemistry Program Package. Phys. Chem. Chem. Phys. 2006, 8, 3172–3191. [Google Scholar] [CrossRef] [PubMed]
- Parr, R.G.; Weitao, Y. Density-Functional Theory of Atoms and Molecules; Oxford University Press: Oxford, UK, 1995; ISBN 9780195092769. [Google Scholar]
- Lee, C.; Yang, W.; Parr, R.G. Development of the Colle-Salvetti Correlation-Energy Formula into a Functional of the Electron Density. Phys. Rev. B 1988, 37, 785–789. [Google Scholar] [CrossRef] [PubMed]
- Hehre, W.J. A Guide to Molecular Mechanics and Quantum Chemical Calculations; Wavefunction: Irvine, CA, USA, 2003; ISBN 189066118X. [Google Scholar]
- Chai, J.-D.; Head-Gordon, M. Long-Range Corrected Hybrid Density Functionals with Damped Atom–Atom Dispersion Corrections. Phys. Chem. Chem. Phys. 2008, 10, 6615–6620. [Google Scholar] [CrossRef]
- Sastri, V.S.; Perumareddi, J.R. Molecular Orbital Theoretical Studies of Some Organic Corrosion Inhibitors. Corrosion 1997, 53, 617–622. [Google Scholar] [CrossRef]
- Yankova, R.; Genieva, S.; Halachev, N.; Dimitrova, G. Molecular Structure, Vibrational Spectra, MEP, HOMO-LUMO and NBO Analysis of Hf(SeO3)(SeO4)(H2O)4. J. Mol. Struct. 2016, 1106, 82–88. [Google Scholar] [CrossRef]
- Pearson, R.G.; Songstad, J. Application of the Principle of Hard and Soft Acids and Bases to Organic Chemistry. J. Am. Chem. Soc. 1967, 89, 1827–1836. [Google Scholar] [CrossRef]
- Pearson, R.G. Recent Advances in the Concept of Hard and Soft Acids and Bases. J. Chem. Educ. 1987, 64, 561. [Google Scholar] [CrossRef]
- De Proft, F.; Liu, S.; Parr, R.G. Chemical Potential, Hardness, Hardness and Softness Kernel and Local Hardness in the Isomorphic Ensemble of Density Functional Theory. J. Chem. Phys. 1997, 107, 3000–3006. [Google Scholar] [CrossRef]
- Luo, X.; Huang, W.; Shi, Q.; Xu, W.; Luan, Y.; Yang, Y.; Wang, H.; Yang, W. Electrochemical Sensor Based on Lead Ion-Imprinted Polymer Particles for Ultra-Trace Determination of Lead Ions in Different Real Samples. RSC Adv. 2017, 7, 16033–16040. [Google Scholar] [CrossRef]
- Murugaperumal, P.; Nallathambi, S. A Comprehensive Review on Colorimetric and Fluorometric Investigations of Dual Sensing Chemosensors for Cu2+ and Fe3+ Ions from the Year 2017 to 2023. Spectrochim. Acta A Mol. Biomol. Spectrosc. 2025, 326, 125193. [Google Scholar] [CrossRef] [PubMed]
- Zarrouk, A.; Zarrok, H.; Salghi, R.; Hammouti, B.; Al-Deyab, S.S.; Touzani, R.; Bouachrine, M.; Warad, I.; Hadda, T.B. A Theoretical Investigation on the Corrosion Inhibition of Copper by Quinoxaline Derivatives in Nitric Acid Solution. Int. J. Electrochem. Sci. 2012, 7, 6353–6364. [Google Scholar] [CrossRef]
- Liu, M.; Wang, K.; Wang, H.; Lu, J.; Xu, S.; Zhao, L.; Wang, X.; Du, J. Simple and Sensitive Colorimetric Sensors for the Selective Detection of Cu(II). RSC Adv. 2021, 11, 11732–11738. [Google Scholar] [CrossRef] [PubMed]
- Wang, H.; Wang, X.; Wang, H.; Wang, L.; Liu, A. DFT Study of New Bipyrazole Derivatives and Their Potential Activity as Corrosion Inhibitors. J. Mol. Model. 2007, 13, 147–153. [Google Scholar] [CrossRef] [PubMed]
- Parr, R.G.; v. Szentpály, L.; Liu, S. Electrophilicity Index. J. Am. Chem. Soc. 1999, 121, 1922–1924. [Google Scholar] [CrossRef]
- Fatma, N.; Mehata, M.S.; Pandey, N.; Pant, S. Flavones Fluorescence-Based Dual Response Chemosensor for Metal Ions in Aqueous Media and Fluorescence Recovery. J. Fluoresc. 2020, 30, 759–772. [Google Scholar] [CrossRef]
- Roy, N.; Dutta, A.; Mondal, P.; Paul, P.C.; Sanjoy Singh, T. Coumarin Based Fluorescent Probe for Colorimetric Detection of Fe3+ and Fluorescence Turn On-Off Response of Zn2+ and Cu2+. J. Fluoresc. 2017, 27, 1307–1321. [Google Scholar] [CrossRef]
Disclaimer/Publisher’s Note: The statements, opinions and data contained in all publications are solely those of the individual author(s) and contributor(s) and not of MDPI and/or the editor(s). MDPI and/or the editor(s) disclaim responsibility for any injury to people or property resulting from any ideas, methods, instructions or products referred to in the content. |
© 2025 by the authors. Licensee MDPI, Basel, Switzerland. This article is an open access article distributed under the terms and conditions of the Creative Commons Attribution (CC BY) license (https://creativecommons.org/licenses/by/4.0/).