Article

Research on the Quality Improvement of the Segmented Interferometric Array Integrated Optical Imaging Based on Hierarchical Non-Uniform Sampling Lens Array

1
School of Information Engineering, Shanxi College of Technology, Shuozhou 036000, China
2
School of Physics and Optoelectronic Engineering, Xidian University, Xi’an 710071, China
*
Author to whom correspondence should be addressed.
Symmetry 2025, 17(3), 336; https://doi.org/10.3390/sym17030336
Submission received: 19 January 2025 / Revised: 12 February 2025 / Accepted: 18 February 2025 / Published: 23 February 2025
(This article belongs to the Special Issue Studies of Optoelectronics in Symmetry)

Abstract

:
As a typical representative of advanced remote sensing imaging technology, the segmented interferometric array integrated optical imaging system has problems such as poor contrast, insufficient medium and low-frequency information, and low resolution in its imaging quality. In this paper, based on the multi-dimensional light field conversion model of the integrated optical imaging quality of the full-link segmented interferometric array, the spatial distribution of the multi-baseline lens array is researched. The design of the hierarchical non-uniform sampling lens array, which is symmetrical in spatial distribution, is proposed. Combined with the actual production and processing, the influence of the fill factor of the lens array on the imaging quality is analyzed, and the tolerance error for the fill factor of the lens array is 10%. The research results can provide a theoretical basis for the optimal design and fabrication of the segmented interferometric array integrated optical imaging system.

1. Introduction

The resolution of a conventional diffraction-limited optical telescope system is determined by the diffraction limit, and the larger the aperture of the system, the higher its spatial resolution [1,2,3,4,5,6]. In order to obtain high-quality imaging results, the aperture of conventional telescopes needs to be made very large [7,8]. However, while increasing the aperture, the weight, volume, and manufacturing difficulty of the system have increased significantly, and the application of the system is facing great difficulties and challenges [9,10,11,12]. In the face of the growing demand for high-resolution and long-distance remote sensing imaging, it is very necessary to break through the limitations of traditional optical telescope systems and explore new imaging mechanisms.
The concept of a segmented integrated optical imaging system based on photonic integrated circuits (PICs) provides a new approach to the development of ultra-thin, ultra-light, ultra-high-resolution photoelectric imaging detection systems [13,14,15,16]. The imaging mechanism is completely different from the optical telescope imaging technology. The segmented integrated optical interferometric imaging is based on the principle of interferometric imaging, which uses multiple radial microlens arrays instead of telescope aperture arrays to form an interference baseline and integrates paired lenses and PICs into a single chip through photonic integration technology to realize beam combination [17,18,19,20], which avoids the limitations of traditional optical telescopes with large aperture manufacturing, high processing cost, and high assembly difficulty. At the same resolution, the SWaP (size, weight, and power) of the detector is reduced by 10~100 times [21,22].
The imaging quality of the segmented interference array integrated optical imaging system is limited by the spatial baseline arrangement of the lens array. According to the public literature reports, there are three types of lens arrays for segmented interferometric array integrated optical imaging systems, which are wheel-shaped lens array [23], hexagonal lens array [24,25], and rectangular lens array [26], respectively. The rest of the lens array arrangements are improved on the basis of the above lens arrays [27]. Among them, the axial resolution of the hexagonal lens array and rectangular lens array is not as high as that of the wheel-shaped lens array. The hexagonal lens array can achieve high-quality imaging due to its high fill factor, but the design of PICs is more difficult. Although the rectangular lens array can achieve continuous sampling of the U-V spatial spectrum spectrum, the imaging resolution of the rectangular lens array is lower than that of the other two lens arrays under the same number of lenslets.
In this study, a hierarchical non-uniform sampling lens array is proposed on the basis of the wheel-shaped lens array, the influence of the lens array fill factor on the imaging quality is researched, and the allowable range of the lens array fill factor error is given, which can provide a theoretical basis for the optimal design and processing of the segmented interferometric array integrated optical imaging system.

2. Segmented Interference Array Integrated Optical Imaging System

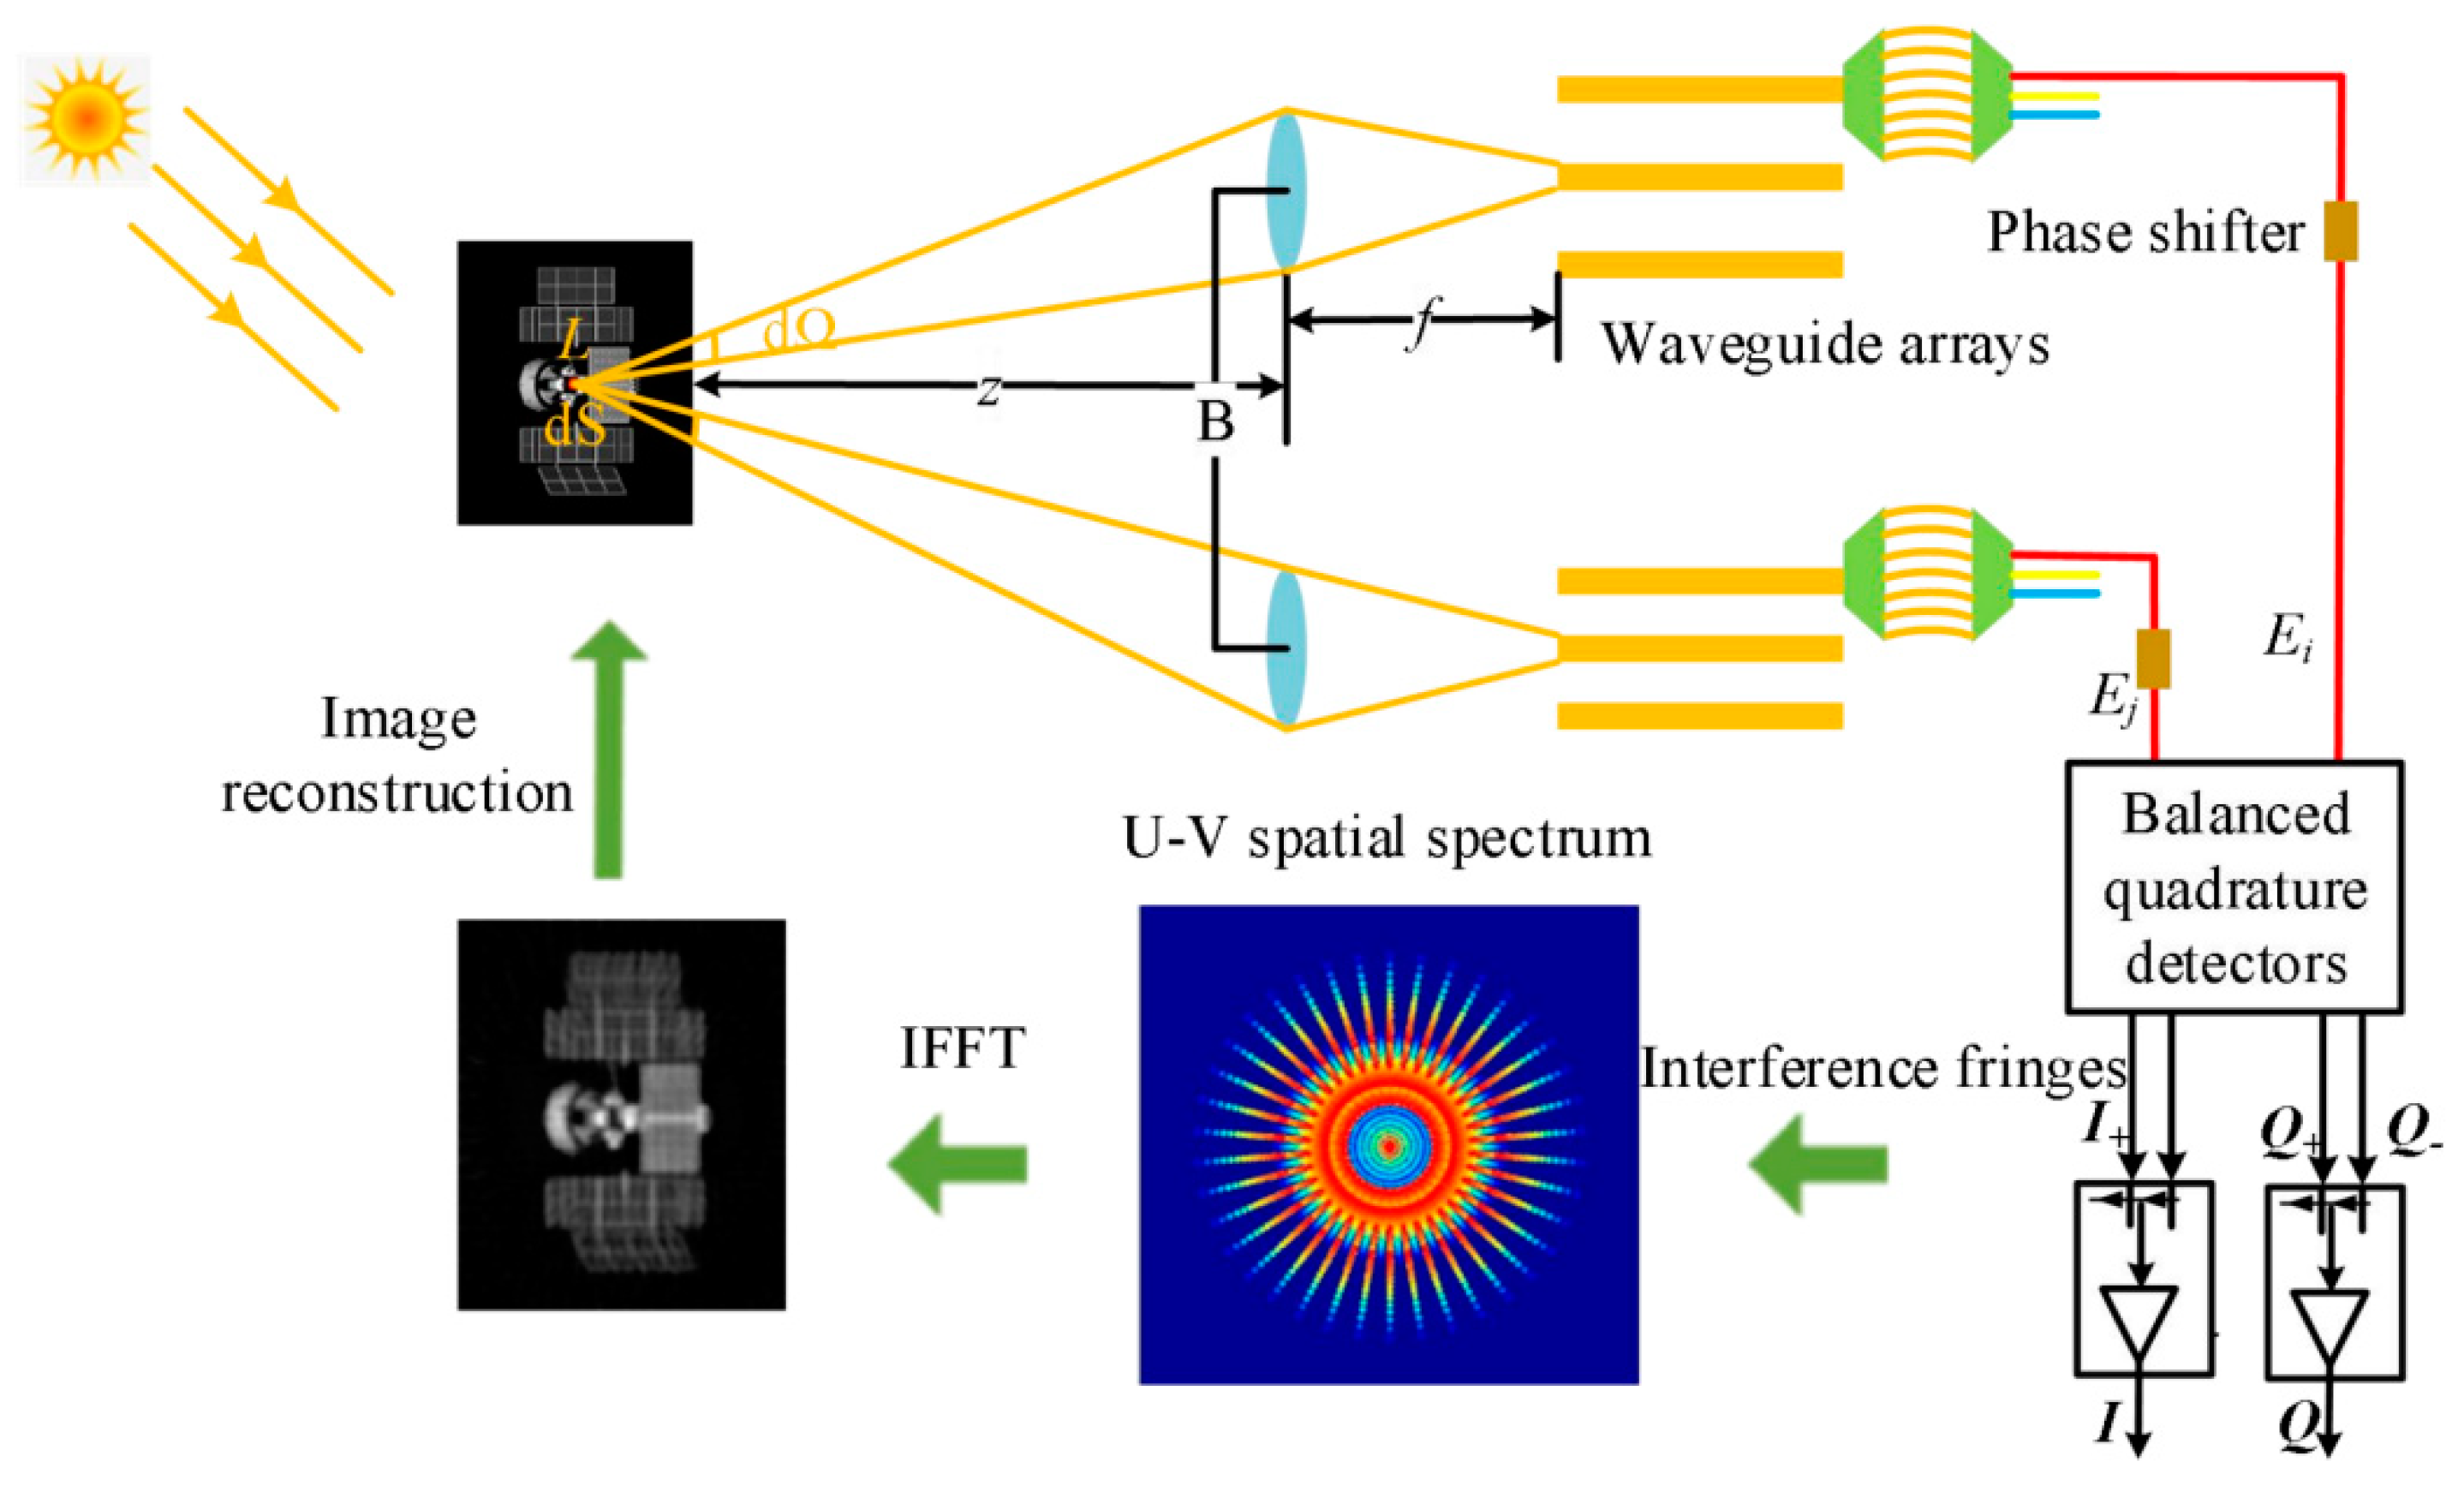
2.1. Structure and Principle of the Imaging System

Segmented interferometric array integrated optical imaging is an advanced imaging system combined with PICs and computational imaging. The structure of the segmented interferometric array integrated optical imaging system comprises lenslet arrays, PICs, and computational reconstruction modules, as shown in Figure 1. The waveguide array, array waveguide grating (AWG), phase shifter, and balanced quadrature detector are integrated into a PIC chip. The information collected and coupled by the PICs. The output signal of PICs is processed by digital signal and synthesized into the U-V spatial spectrum. The computational reconstruction module includes digital signal processing and image reconstruction, which are combined with IFFT and reconstruction algorithms to generate the reconstructed image.

2.2. Scene Radiation Field Transformation Model of the Imaging System

The process of the scene radiation light field conversion is shown in Figure 2. When the radiation signal of the long-distance object is coupled into the segmented interference array integrated optical imaging system, the light field of the same object point is converged by the paired lenlets and then coupled by the spatial dimension of the corresponding waveguide array. AWG is used to perform spectral splitting of the incident-wide spectral radiation field. Then, the phase is adjusted by the phase shifter, and the balanced quadrature detector completes the coherent superposition of quasi-monochromatic light with different baselines of the same object point in the scene. The U-V spatial spectrum of different spatial frequencies is synthesized by digital signal processing. Finally, the image reconstruction algorithm is combined to realize high-quality image computational reconstruction.
The segmented interferometric array integrated optical imaging system detects the reflected light of long-distance objects, and the signal mainly comes from the radiant energy of sunlight in a certain spectral range. According to Planck’s blackbody radiation formula, the monochromatic radiance of blackbody radiation is as follows:
M ( λ , T 0 ) = c 1 / λ 5 exp c 2 / λ T 0 1 1 .
where λ is the wavelength, T0 is the temperature of the black body, c1 is the first radiation constant (c1 = 2πhc2 = 3.7418 × 10⁻¹⁶ W·m2), and c2 is the second radiation constant (c2 = hc/k = 1.4388 × 104 μm·K).
The spectral radiant flux of the sun φ as follows:
φ λ = 4 π R s 2 M λ .
where Rs is the radius of the sun, and M(λ) is the monochromatic radiance of blackbody radiation at a specific temperature.
Assuming that the total radiation emitted by the sun is uniformly distributed in the spatial direction, the spectral luminescence intensity of the sun is as follows:
I λ = φ λ / 4 π = R s 2 M λ .
Considering the atmospheric transmittance, according to the inverse square law of distance, the spectral irradiance E0 of the sun at a distant target in the process of radiative transfer is as follows:
E 0 λ = η λ I λ / Z s e 2 = η λ R s 2 c 1 Z s e 2 λ 5 exp c 2 / λ T 0 1 1 .
where η(λ) is the atmospheric transmittance, and Zs-e is the distance between the sun and the earth. Since the distance between the object and the sun is much greater than the distance between the object and the earth, Zs-e can be regarded as the actual distance between the sun and the earth.
Assuming the distant target is a Lambertian diffuse reflector with a reflectivity of R(λ), the spectral radiance reflected by the target surface can be expressed as follows:
L λ = R λ E 0 λ / π .
Correspondingly, the radiant intensity can be expressed as follows:
I λ = L λ r 2 Ω .
where r is the distance between the ground target and the detector, and Ω is the solid angle.
The segmented interferometric array integrated optical imaging system measures the normalized mutual spectral density Wρ(u, λ) of the scene, which is used to represent the spatial coherence between two points separated by the baseline length at a determined wavelength. According to the Van Cittert–Zernike theorem, the relationship between Wρ(u, λ) and the intensity distribution I(x, λ) of the radiant light field at any point can be expressed as follows:
W ρ ( u , λ ) = ρ ( x , λ ) I ( x , λ ) exp ( i 2 π u x ) d x ρ ( x , λ ) I ( x , λ ) d x .
u = B λ R .
where u is the spatial spectrum sampling point, and B is the paired baseline length.
Assuming that the coupling efficiency and luminous flux of the detector are the same for all baselines and spectral channels, the two signals output from the two output ports of the j-th baseline and the k-th spectral channel are (l = 0, 1) Pl(Bj, λk).
P l ( B j , λ k ) = P 0 ( λ k ) 1 + Re e i l π W ρ B j λ k R , λ k .
where P0(λ) is the detector signal corresponding to the zero-fringe visibility, which can be expressed as:
P 0 ( λ ) = η ( λ ) λ h c τ π D l e n s l e t 2 4 R 2 Δ λ ρ ( x , λ ) L λ ( x , λ ) d x .
where η(λ) is the efficiency factor, including the optical loss and the quantum efficiency of the detector, τ is the detector integration time, Dlenslet is the aperture of the small lens, and Δλ is the bandwidth of the spectral channel. Interference fringe visibility can be expressed as follows:
W ρ u j , k , λ k = 1 2 P 1 max P 1 min P 1 max + P 1 min + P 2 max P 2 min P 2 max + P 2 min .

3. Optimized Design of the Lens Array

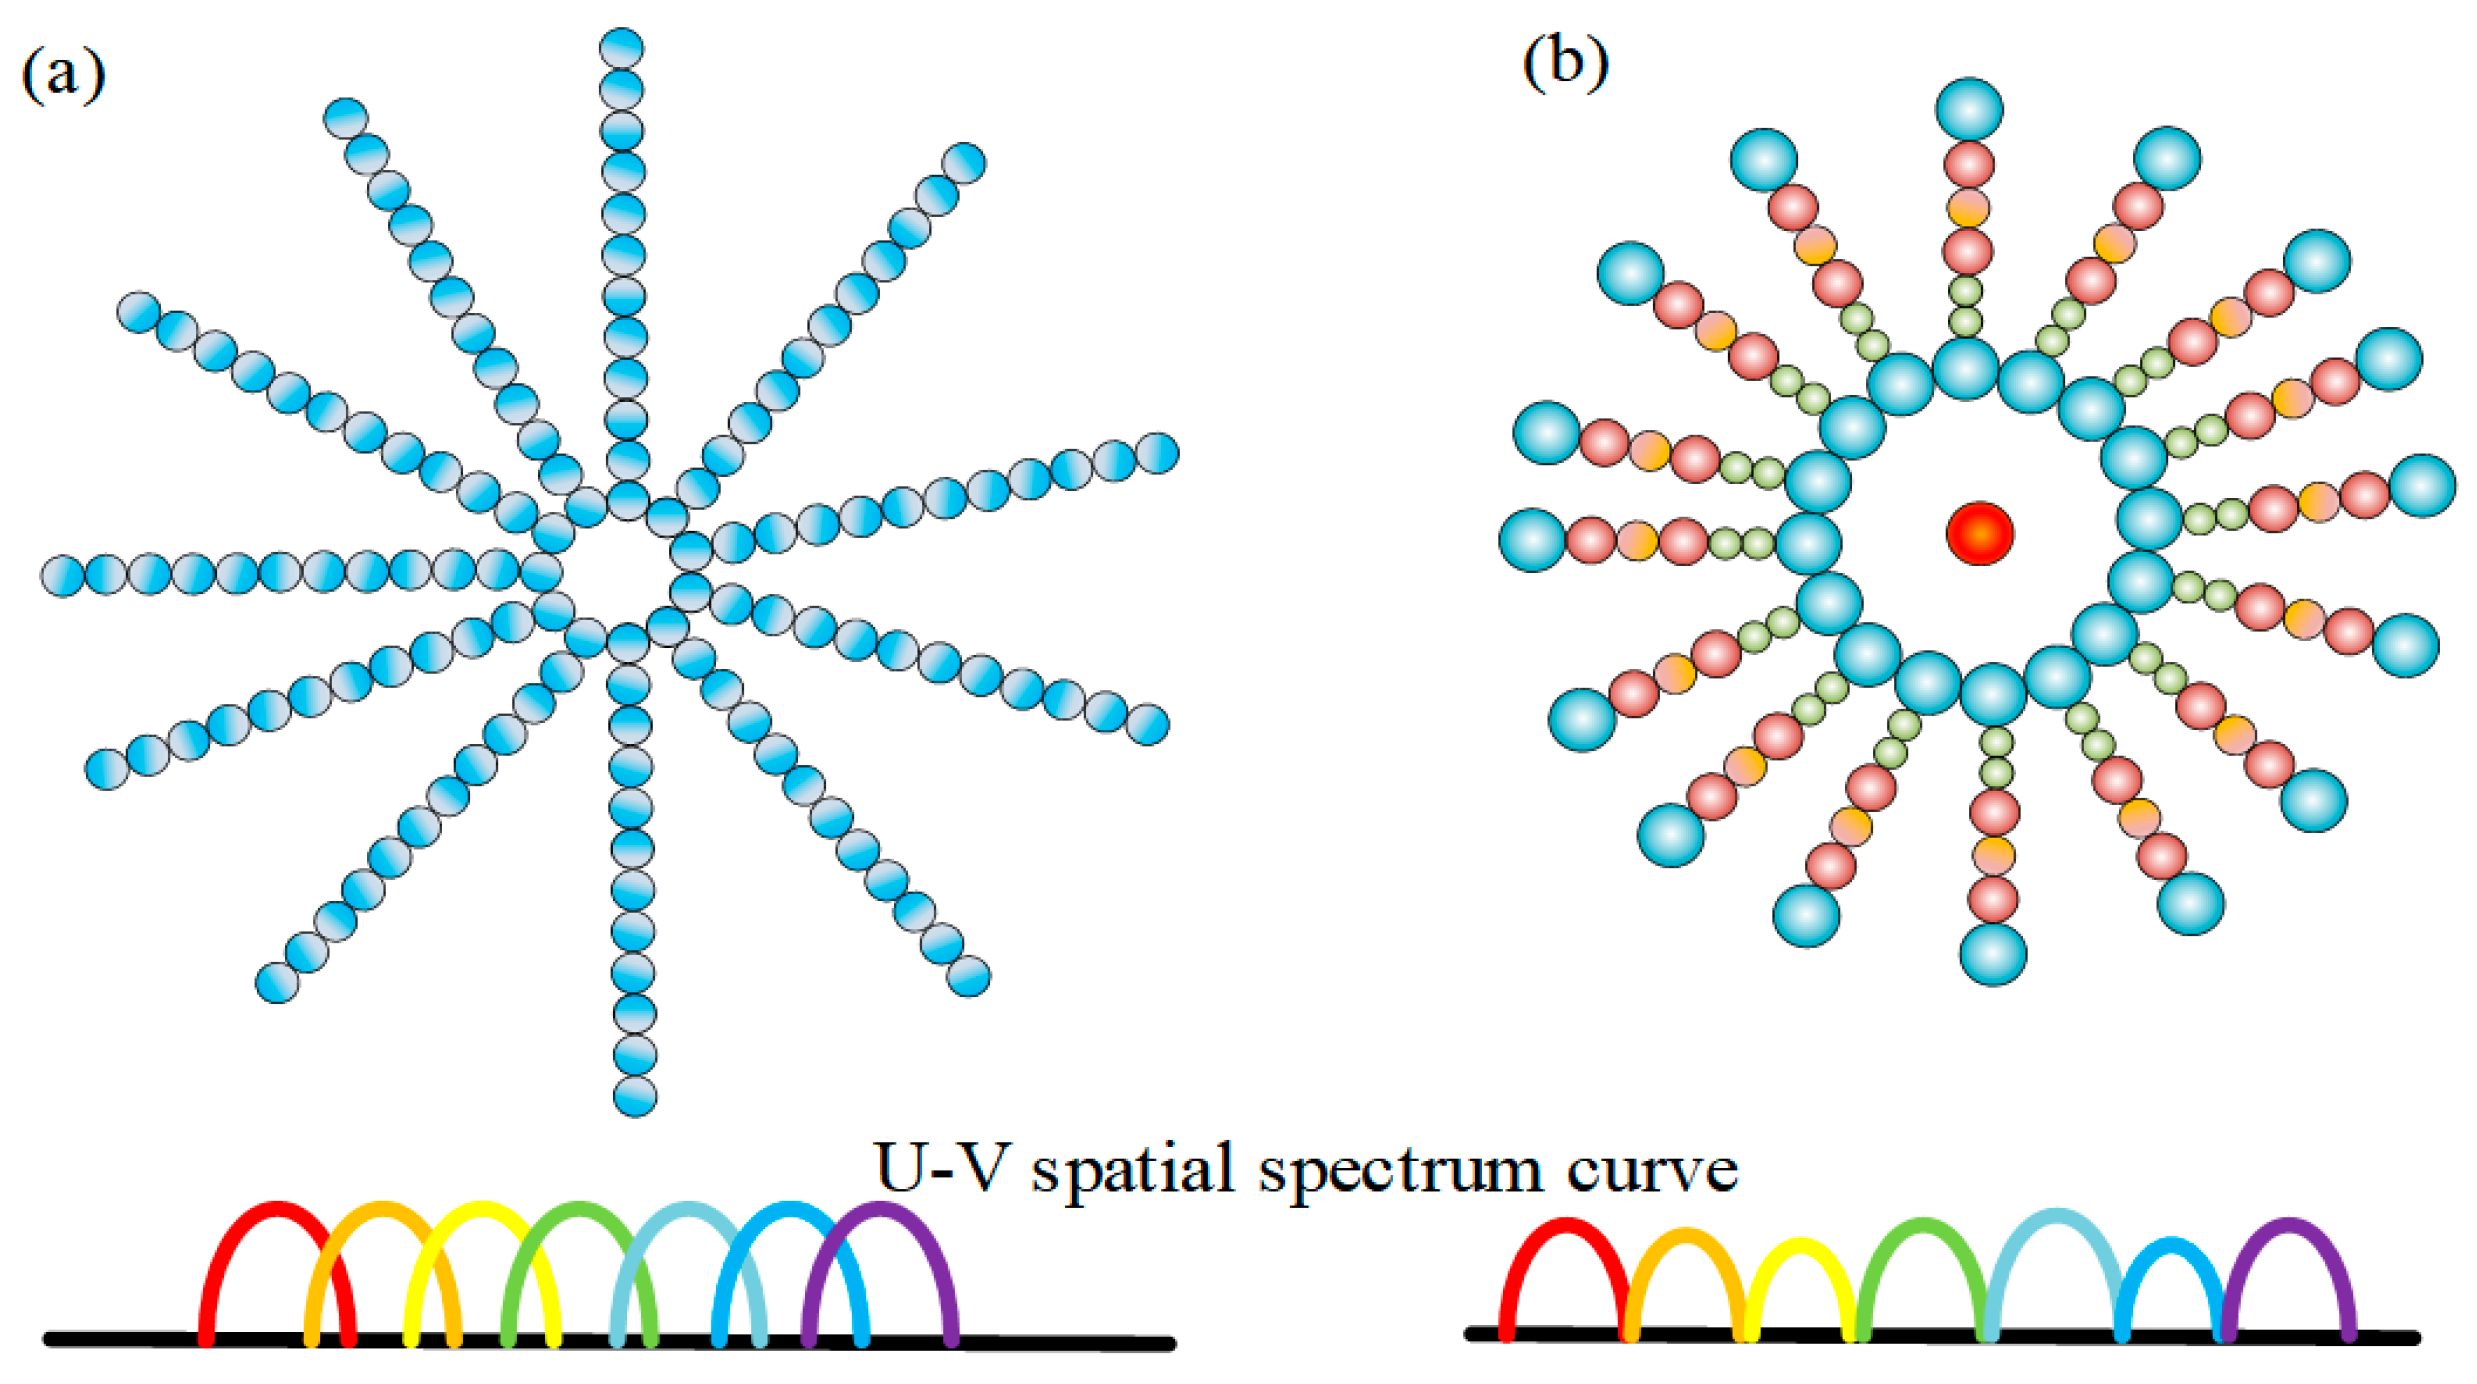
3.1. Design Principles of Hierarchical Non-Uniform Sampling Lens Array

The optimal design of the hierarchical non-uniform sampling lens array is to improve the arrangement of lenslets based on the wheel-shaped lens array. Suppose there are N lenslets on the lens array, and the pairing method is 1&N, 2&N − 1, 3&N − 2… Figure 3 shows a sampling schematic of a wheel-shaped lens array and a hierarchical non-uniform sampling lens array, which is symmetrical in spatial distribution. The advantage of symmetrical distribution is that it can uniformly collect information from all directions. The schematic diagram of the U-V spatial spectrum of the imaging system with the wheel-shaped lens array and hierarchical non-uniform sampling lens array is shown in the color curve below the lens array in Figure 3. By decreasing the size of the low-frequency and medium-frequency information sampling lenlets, increasing the size of the high-frequency information sampling lenlets, and compensating the zero-frequency information sampling lens in the center, the obtained U-V spatial spectrum distribution is non-uniform, and the spectral overlap is reduced. Through comparison, it can be seen that under the premise of the same pairing method, the hierarchical non-uniform sampling lens array can effectively reduce spectral overlap and improve imaging quality.

3.2. Design Method of the Hierarchical Non-Uniform Sampling Lens Array

The design principle of the wheel-shaped lens array and the hierarchical non-uniform sampling lens array show that under the premise that the size and pairing method of the lens array are the same, the hierarchical non-uniform sampling lens array can reduce the spectral overlap, compensate for the zero-frequency information acquisition, and optimize the spectrum distribution of U-V spatial spectrum. Figure 4 shows a schematic diagram of a wheel-shaped lens array and a hierarchical non-uniform sampling lens array. The hierarchical non-uniform sampling lens array is based on the optimized design of the wheel-shaped lens array with symmetric spatial distribution. The design method of the hierarchical non-uniform sampling lens array is to reduce the size of the low-frequency and medium-frequency information sampling lenses, increase the size of the high-frequency information sampling lens, and increase the lens in the center to compensate for the zero-frequency information. Compared with the inhomogeneous multistage sampling lens array [16] shown in Figure 4b, the hierarchical non-uniform sampling lens array shown in Figure 4c can use fewer lenslets to reduce spectral aliasing of the U-V spatial spectrum, thereby reducing economic costs to a certain extent.

3.3. Baseline Pairing Method of Hierarchical Non-Uniform Sampling Lens Array

Using the hierarchical non-uniform sampling lens array depicted in Figure 4c as an illustration, the hierarchical non-uniform sampling lens array comprises 19 long radial lens arrays, each containing 30 lenslets. The baseline pairing method for 30 lenslets is the same as the second-generation SPIDER lens array [7], and the pairing method is (1, 30), (2, 24), (3, 6), (4, 17), (5, 7), (8, 25), (9, 10), (18, 23), (19, 29), (20, 28), (21, 27), (22, 26), and the length of the baseline is 1, 2, 3, 4, 5, 6, 8, 10, 13, 17, 22, 29. The baseline pairing method of the hierarchical non-uniform sampling lens arrays is shown in Figure 5. Due to the different lenslet radii on the hierarchical non-uniform sampling lens array, the sampling lens is divided into zero-frequency information sampling unit, low-frequency information sampling unit, medium-frequency information sampling unit, high-frequency information sampling unit, and unsampled unit according to the length of the paired baseline. The corresponding sampling unit radius is r0, r1, r2, r3, r4. The baseline length of the low-frequency information sampling lens is 1, 2, 3, 4. The baseline length of the medium-frequency information sampling lens is 5, 6, 8, 10. The baseline length of the high-frequency information sampling lens is 13, 17, 22, 29.

4. Research of Imaging Characteristics

4.1. Spatial Spectral Imaging Characteristics

Figure 6 shows the U-V spatial spectrum of the segmented interferometric array integrated optical imaging system corresponding to the lens array in Figure 4 under the parameters shown in Table 1. The U-V spatial spectrum of the wheel-shaped lens array is shown in Figure 6a. With the wheel-shaped lens array, the maximum sampling radius R and continuous sampling radius r in the U-V spatial spectrum are 1.113 and 0.841, respectively. When the size of the low-frequency sampling lens is large, and the size of the high-frequency sampling lens is small, the corresponding lens array is shown in Figure 4b, and the U-V spatial spectrum is shown in Figure 6b. Under the inhomogeneous multistage sampling lens array, the maximum sampling radius R and continuous sampling radius r in the U-V spatial spectrum are 1.122 and 0.885, respectively. When the size of the low-frequency sampling lens is small, and the size of the high-frequency sampling lens is large, as shown in Figure 6c. Compared with the inhomogeneous multistage sampling lens array, the segmented interference array integrated optical imaging system with the hierarchical non-uniform sampling lens array integrates the U-V spatial spectrum sampling classification of the optical imaging system and reduces the spectral overlap in the low and medium frequency range.

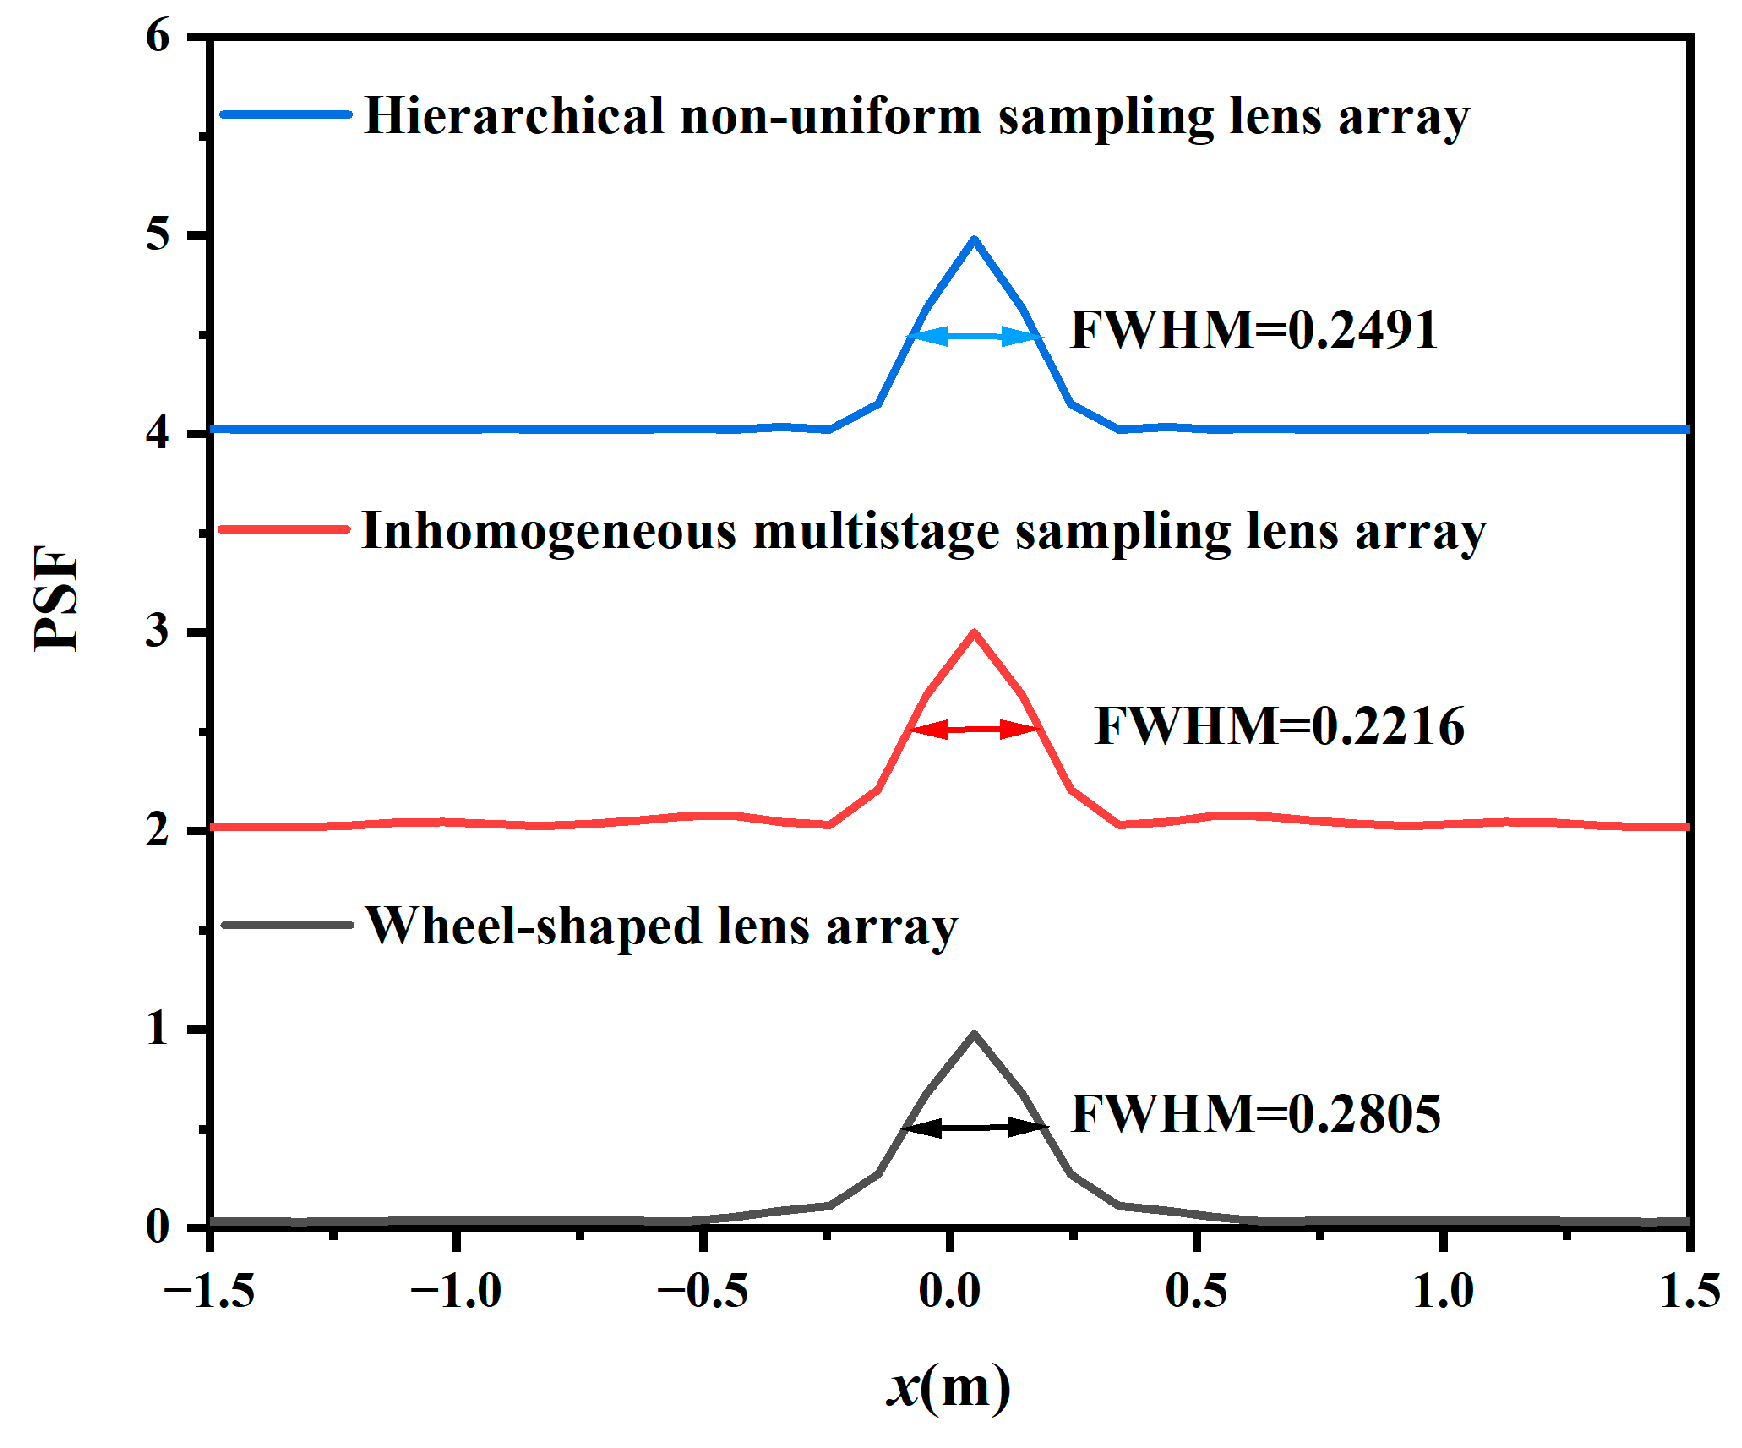
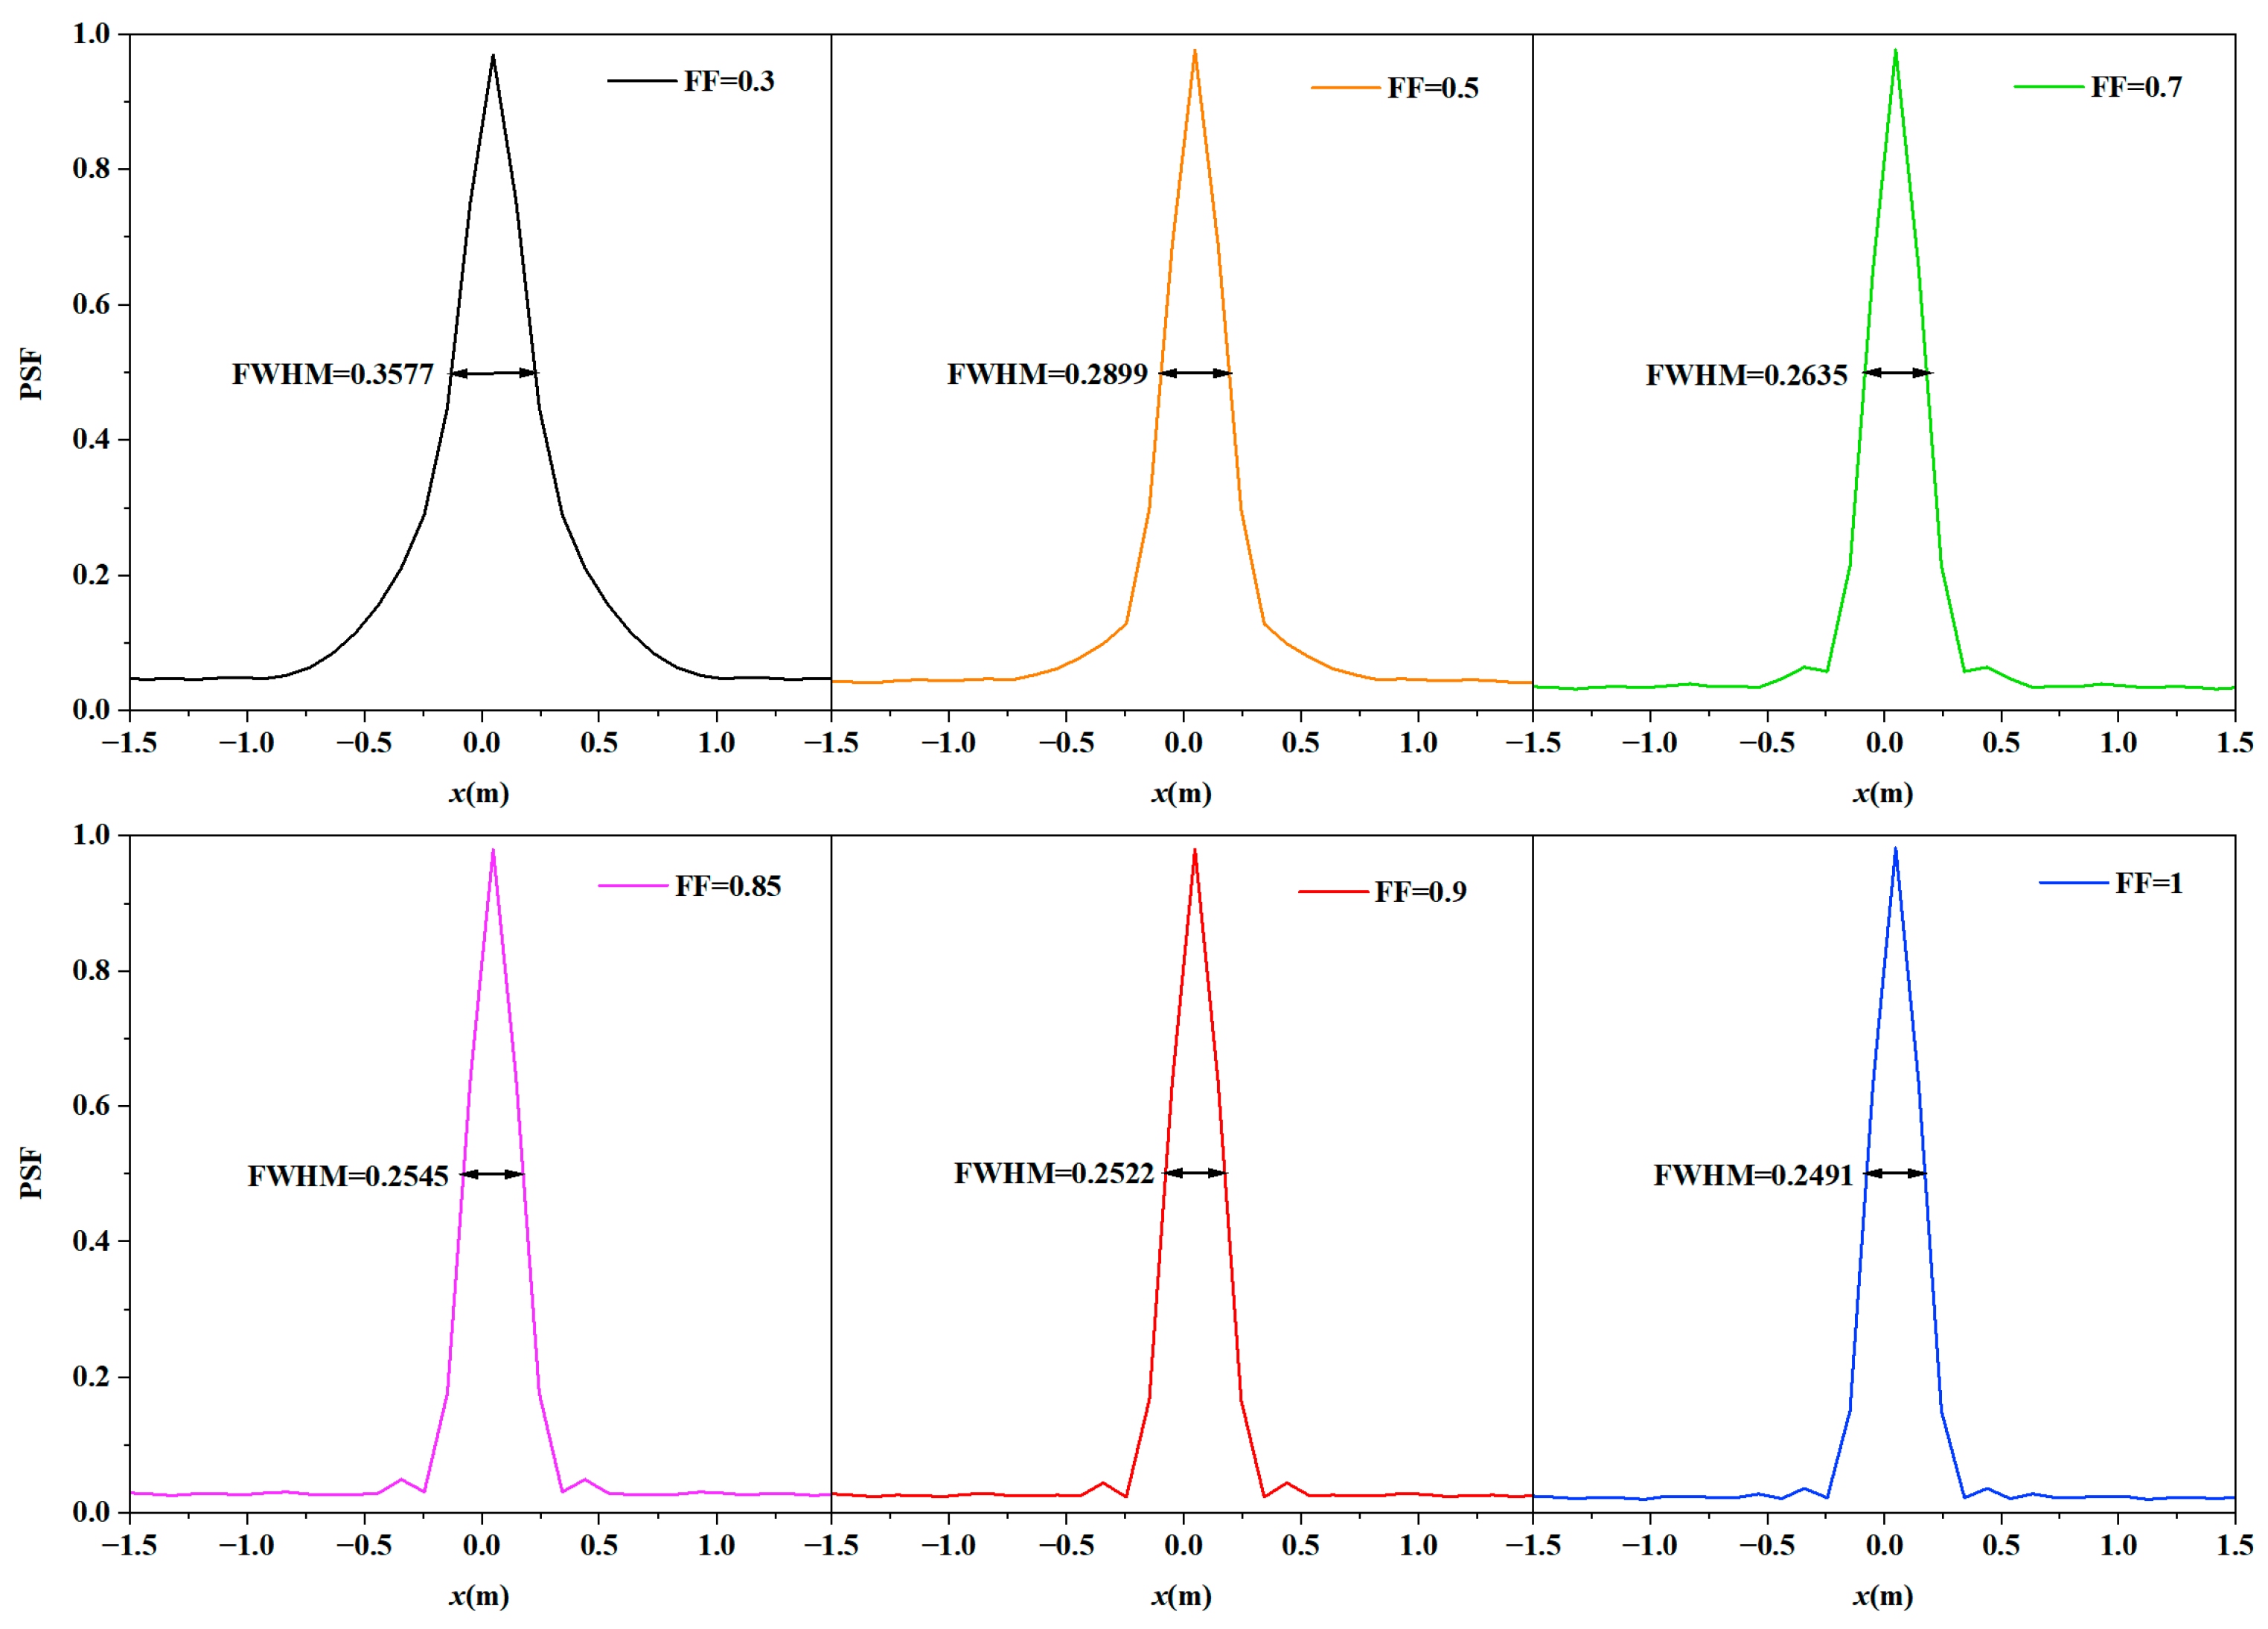
4.2. Point Spread Function (PSF) Characteristics

The object PSF is the inverse Fourier transform of spatial frequency distributions. Figure 7 shows the object PSF of the segmented interferometric array integrated optical imaging system corresponding to the lens array in Figure 4. It can be seen that when the size of the low-frequency sampling lens is large, and the size of the high-frequency sampling lens is small, the full-width at half-peak (FWHM) of the segmented interferometric array integrated optical imaging system with hierarchical non-uniform sampling lens array is narrower than with the wheel-shaped lens array. Because the longest baseline length of the inhomogeneous multistage sampling lens array is longer than that of the hierarchical non-uniform sampling lens array, the FWHM of the segmented interferometric array integrated optical imaging system with the hierarchical non-uniform sampling lens array is 0.0314 m narrower than with the wheel-shaped lens array. Due to the inhomogeneous multistage sampling lens array sampling more medium-frequency information, the FWHM of the segmented interferometric array integrated optical imaging system with the hierarchical non-uniform sampling lens array is wider than with inhomogeneous multistage sampling lens array.

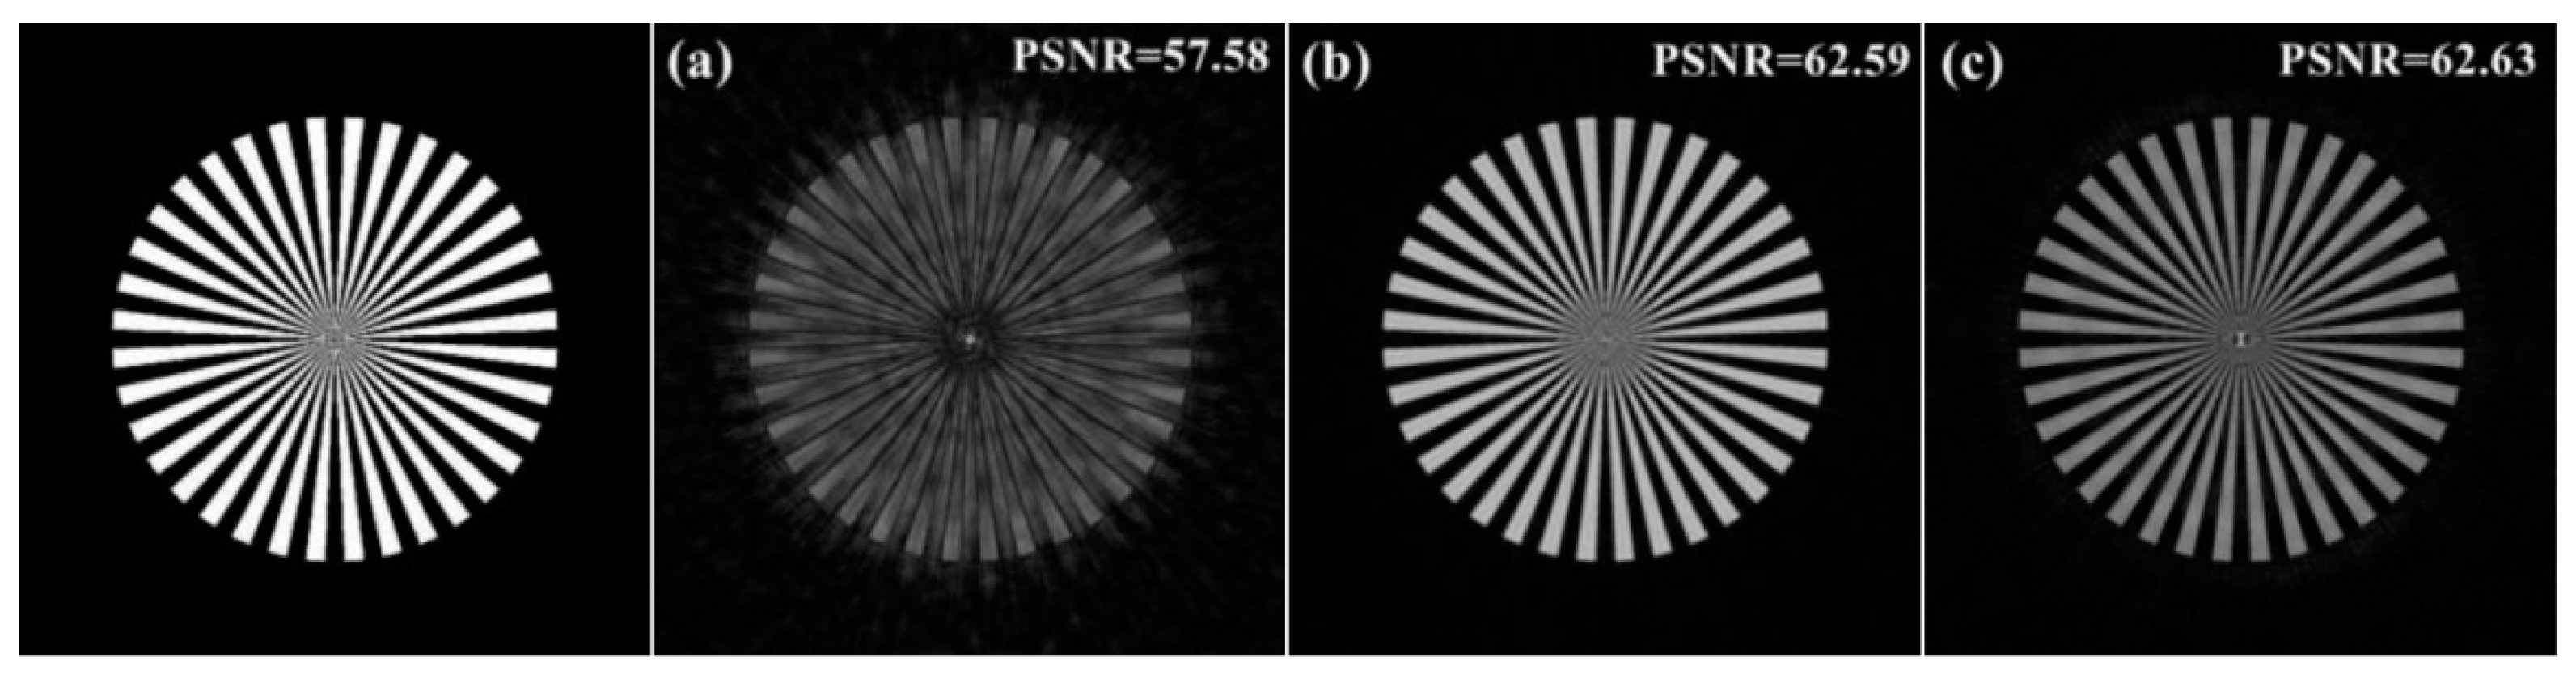
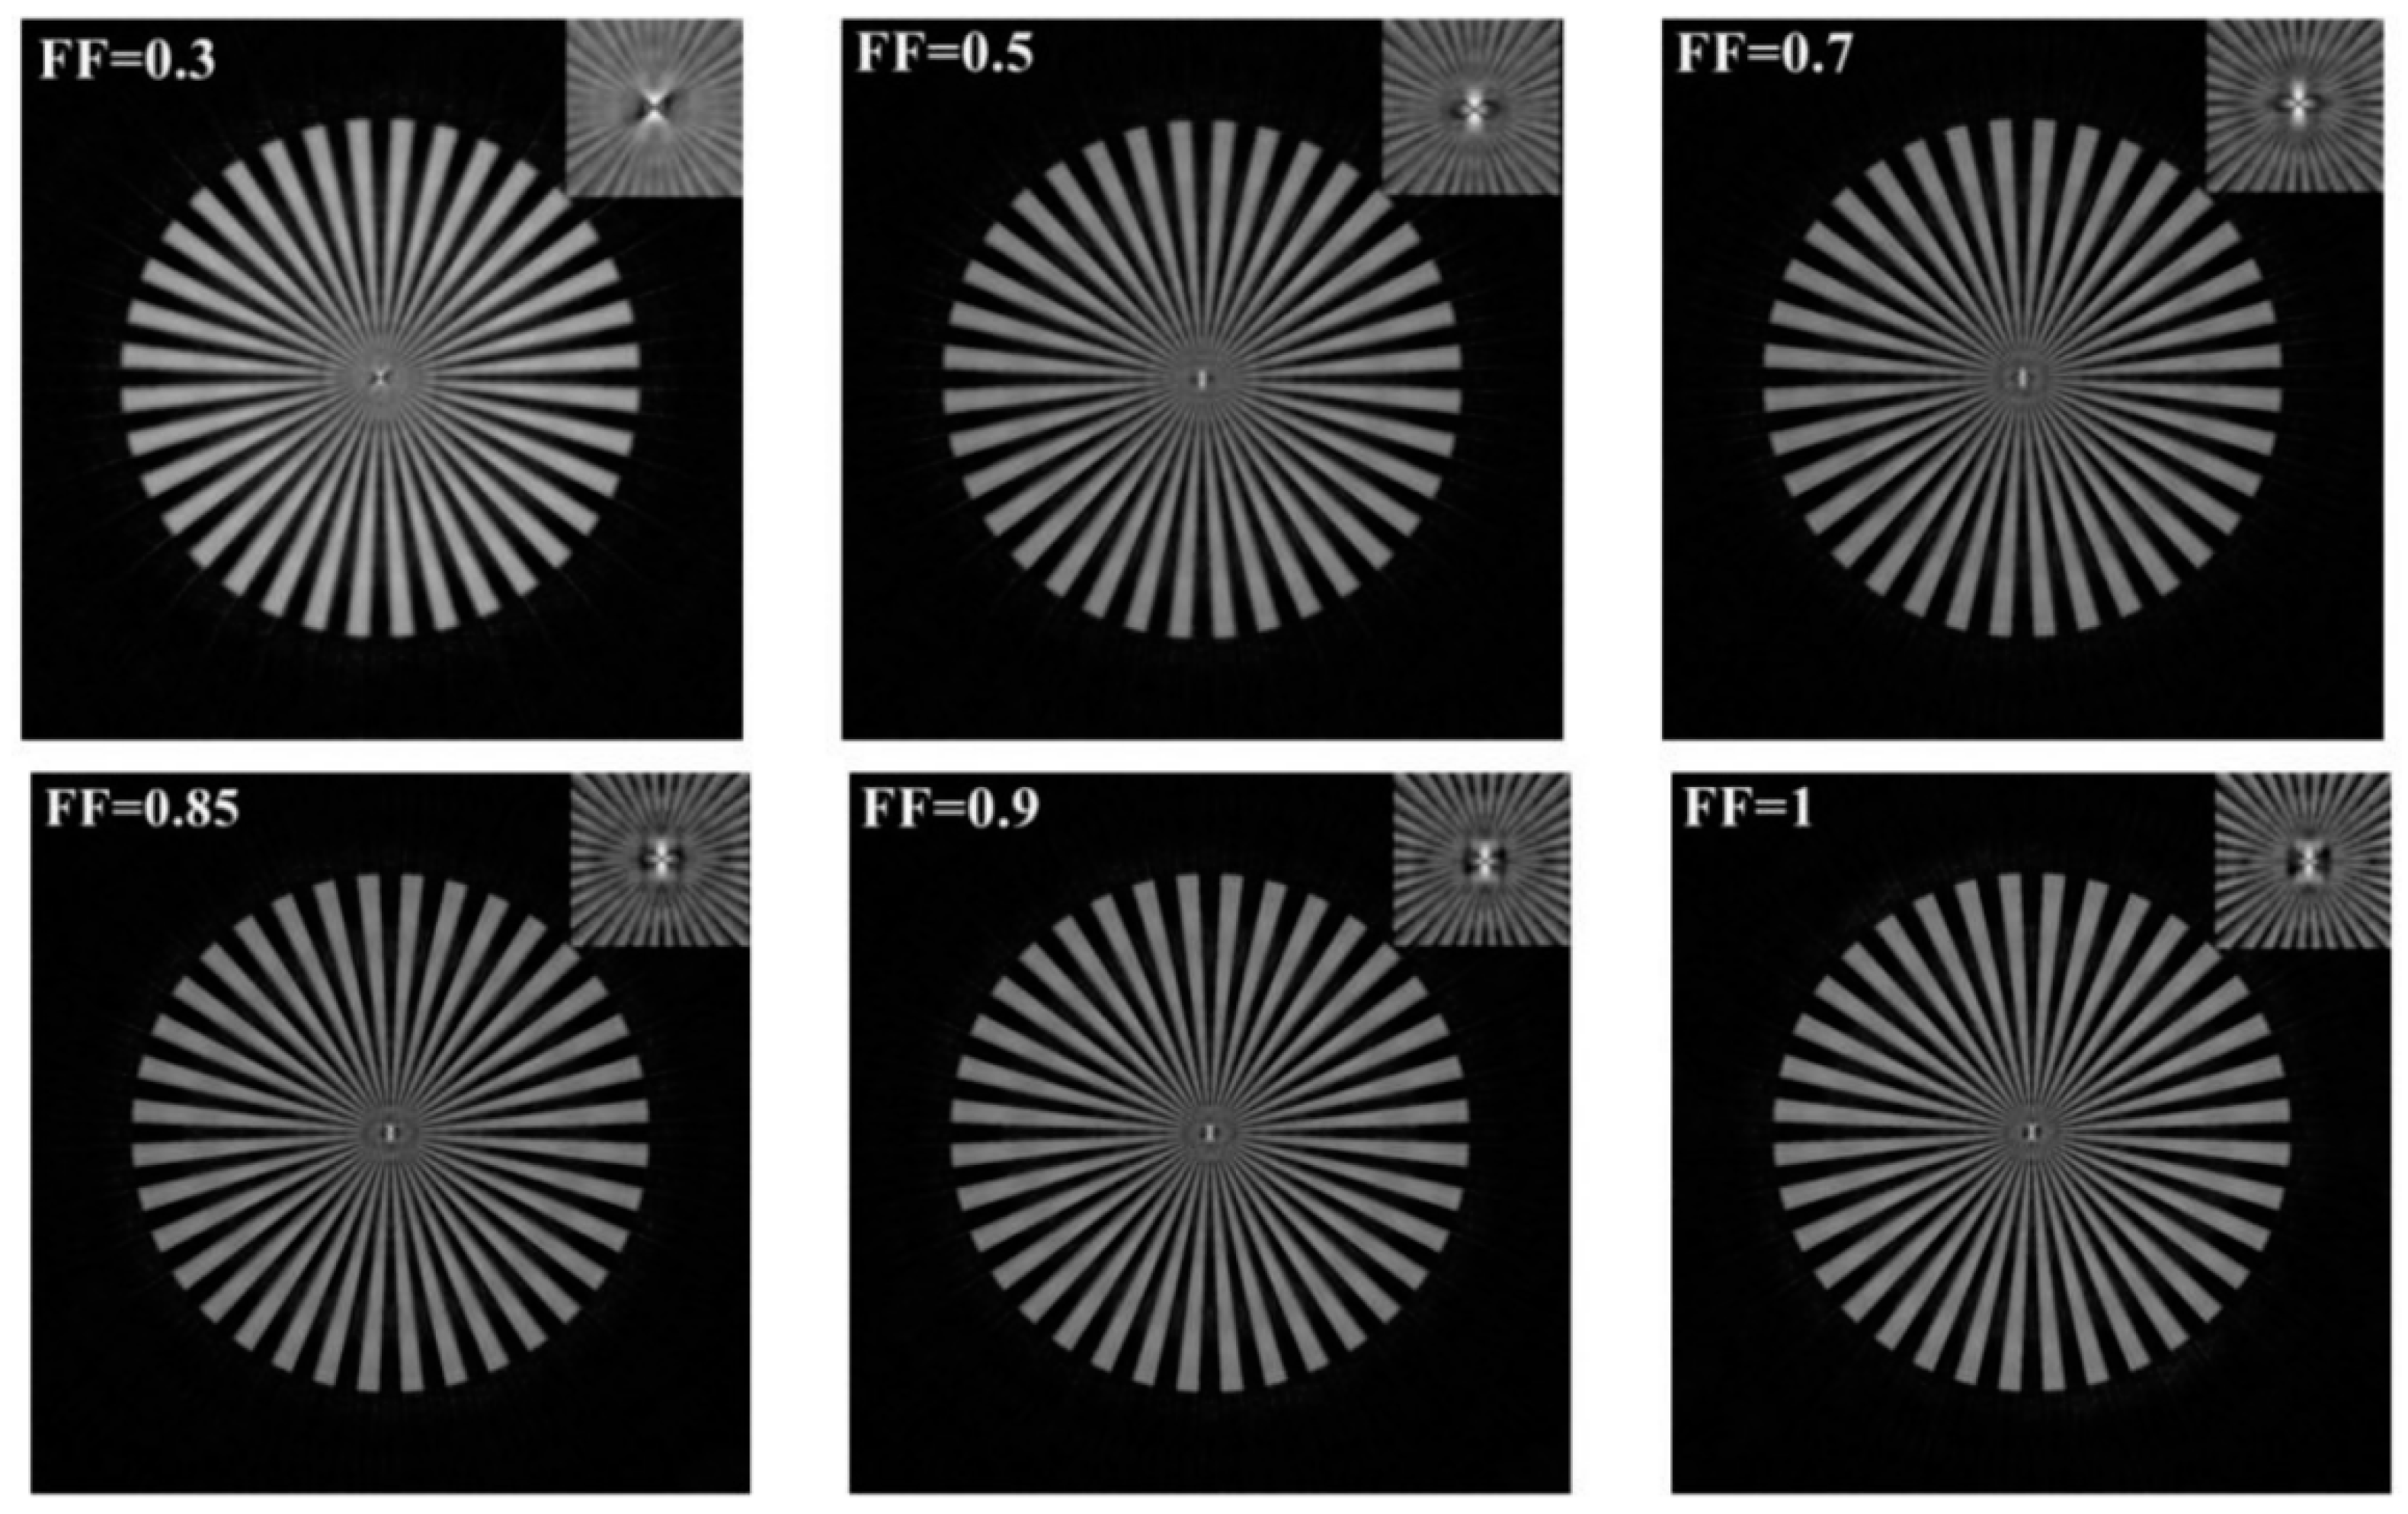
4.3. System Imaging Characteristics

Figure 8 shows the imaging results of the segmented interferometric array integrated optical imaging system corresponding to the lens array in Figure 4. As can be seen, compared with the wheel-shaped lens array, the hierarchical non-uniform sampling lens array can effectively improve the peak signal-to-noise ratio (PSNR). Under the parameters shown in Figure 8c. When the size of the low-frequency sampling lens is larger, and the size of the high-frequency sampling lens is smaller, the PSNR of the segmented interferometric array integrated optical imaging system with the hierarchical non-uniform sampling lens array is increased by 5.05 compared with the wheel-shaped lens array. The PSNR of the imaging system with the inhomogeneous sampling lens array is slightly smaller than with the hierarchical non-uniform sampling lens array.

5. Analysis of Lens Array Parameters

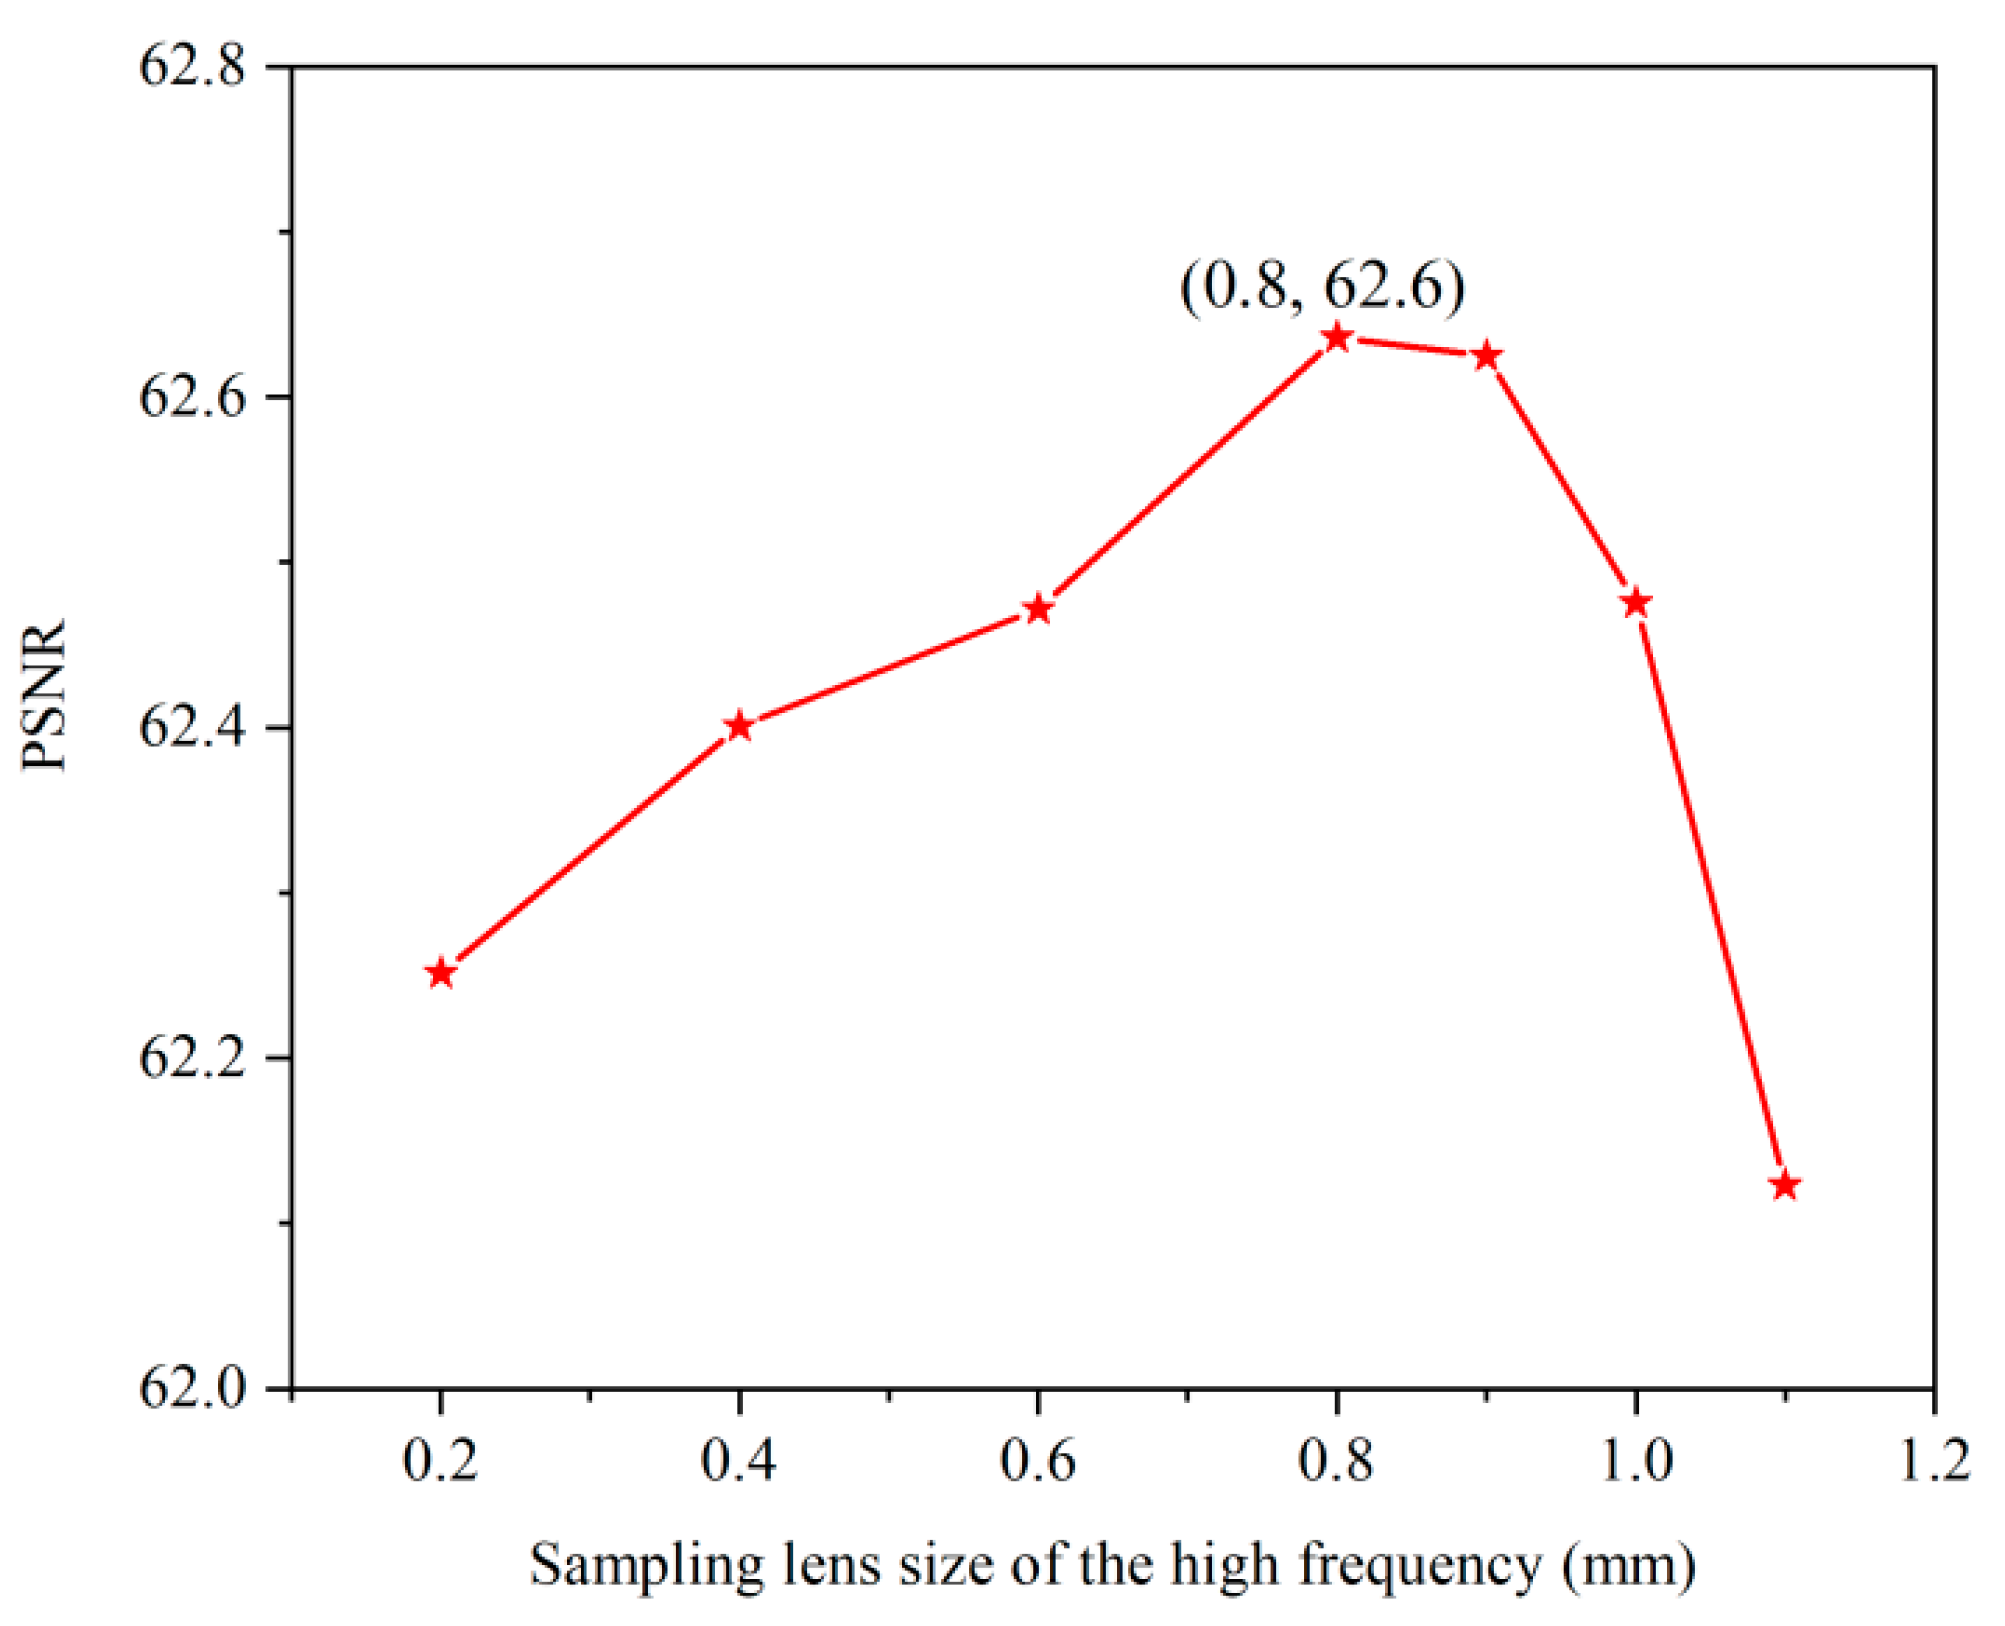
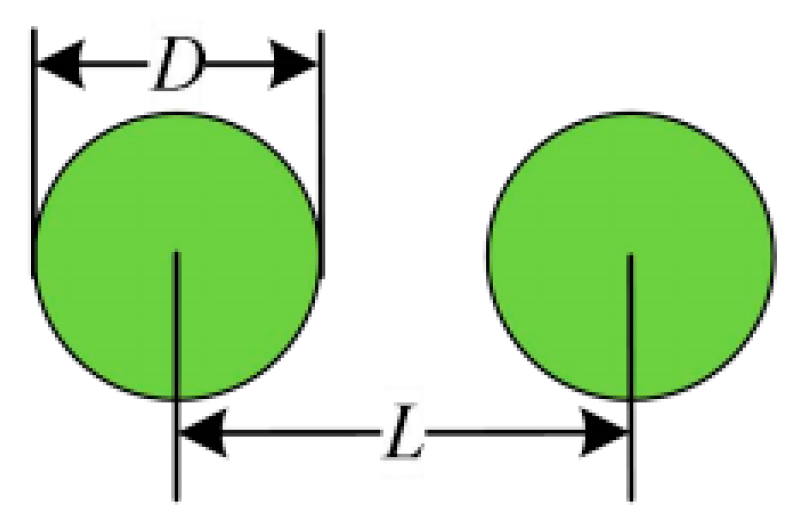
5.1. Analysis of Lenslet Size

On the basis of the longest baseline length being the same, the PSNR of the segmented interferometric array integrated optical imaging system with hierarchical non-uniform sampling lens arrays under different parameters are compared. When the size of the low-frequency sampling lens is small, and the high-frequency sampling lens size is large, the imaging quality of the imaging system is better. Compared with the wheel-shaped lens array with the lens radius of r = 1.8 mm, the PSNR of the segmented interferometric array integrated optical imaging system with hierarchical non-uniform sampling lens arrays under the radius parameters are r0 = 0.9 mm, r2 = 1.6 mm, r4 = 1.8 mm is shown in Figure 9. When r1 = 0.8 mm and r3 = 3.0 mm, the PSNR of the imaging system is the highest at 62.6.

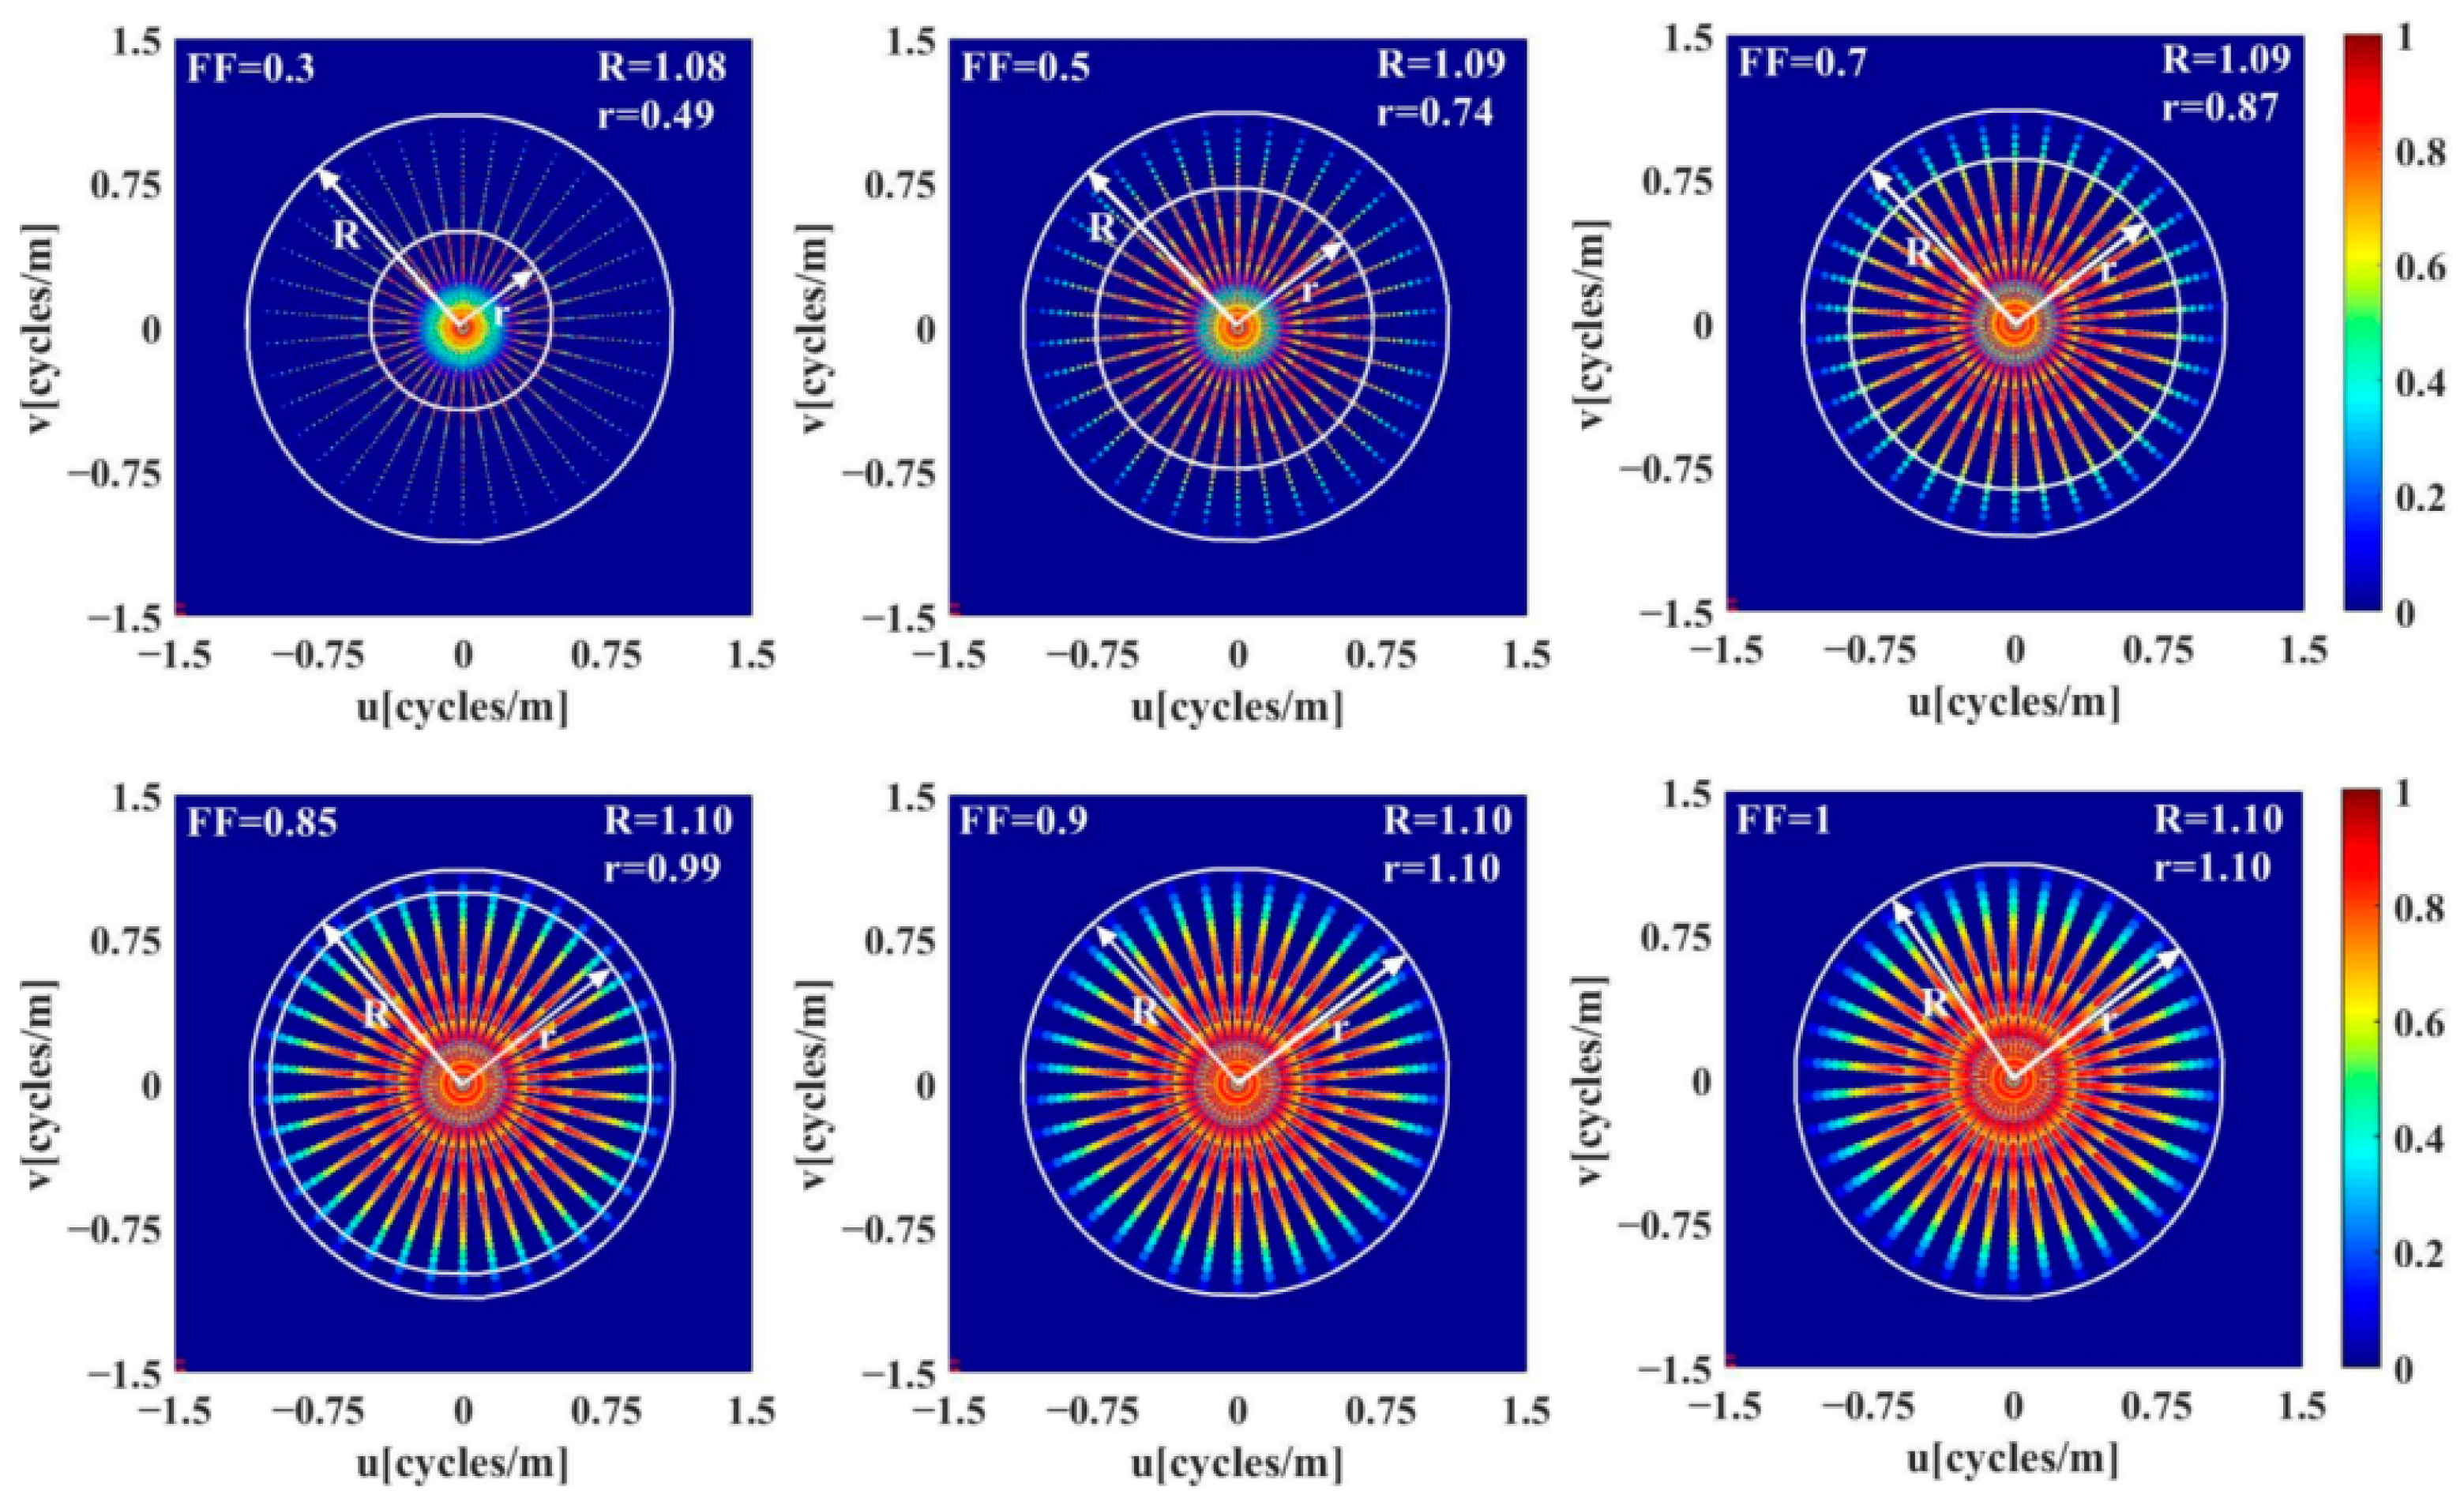
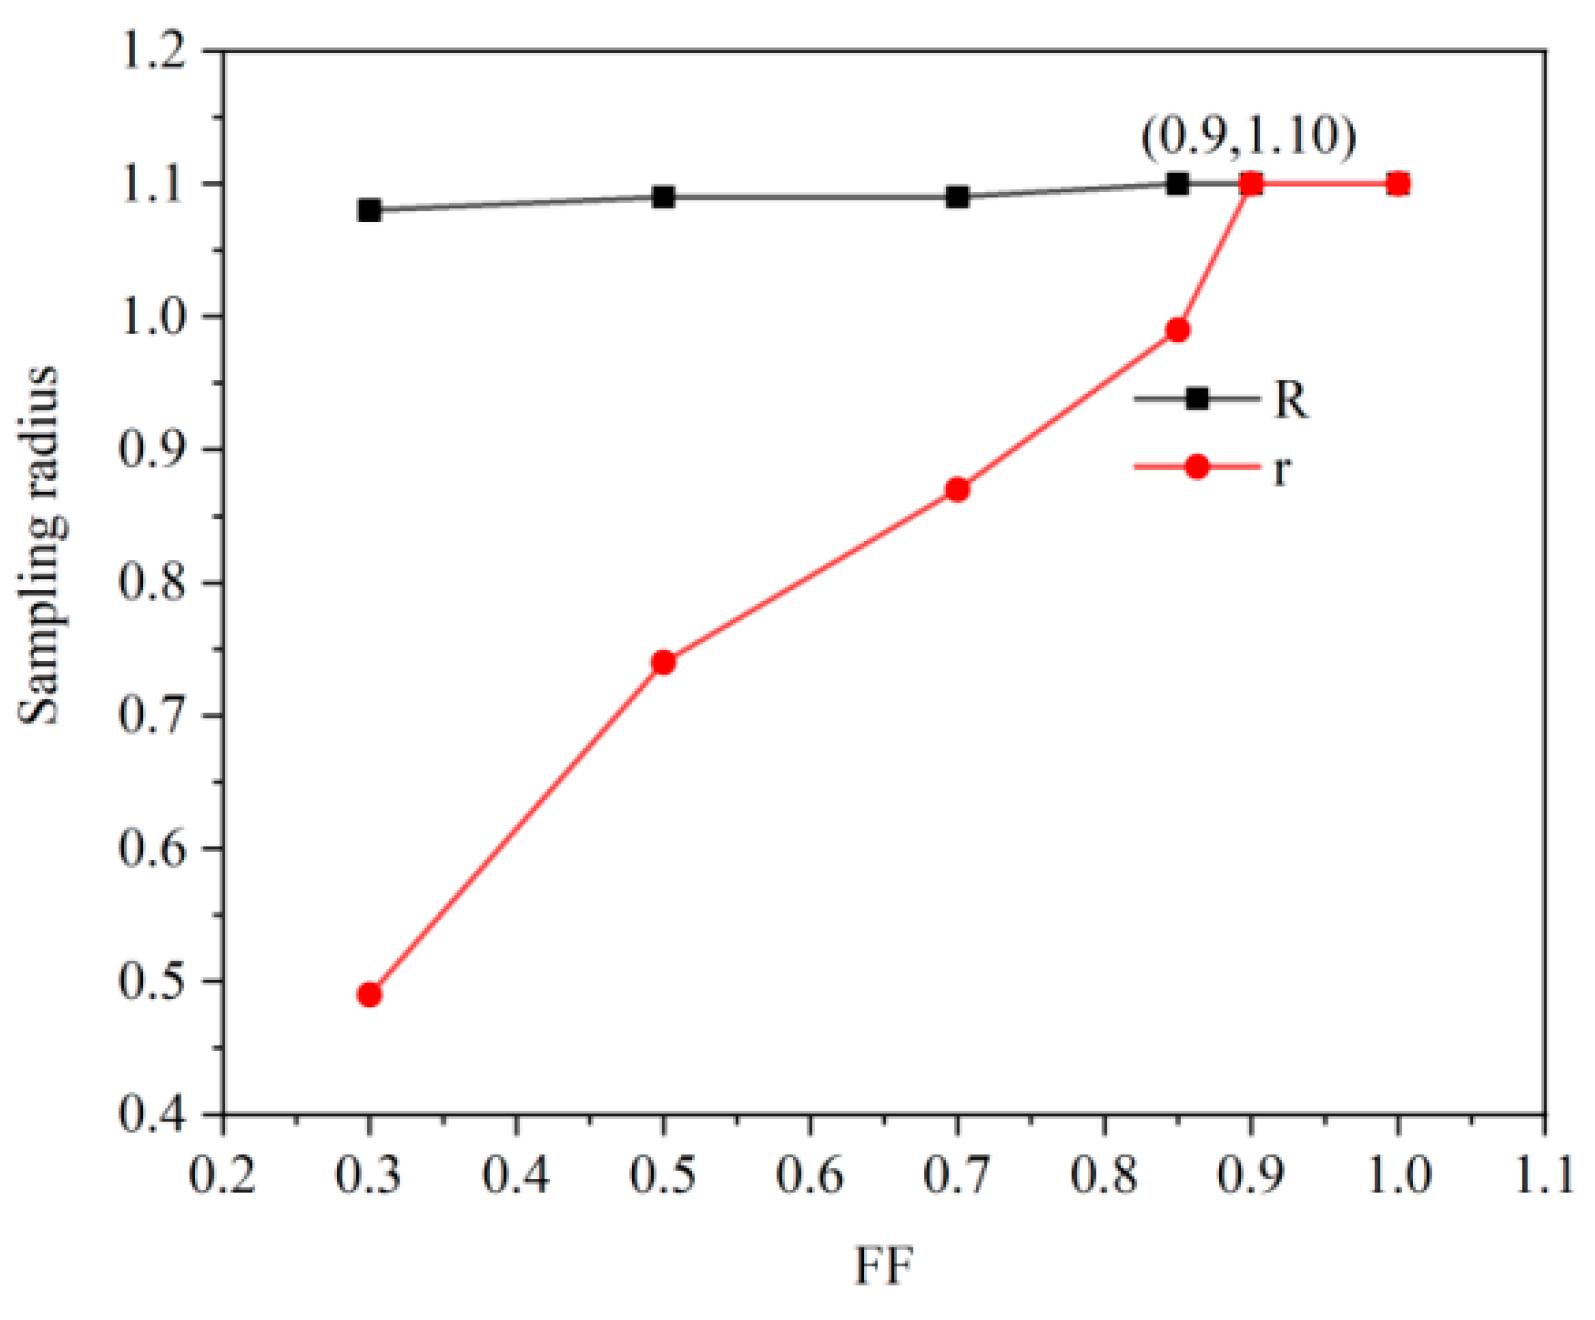
5.2. Analysis of Lens Array Fill Factor

The fill factor (FF) is defined as the ratio of the distance L between two lenses to the lens diameter D, as shown in Figure 10. The fill factor of the hierarchical non-uniform sampling lens array is 1 under ideal conditions. In actual processing, insufficient processing accuracy will cause a decrease in the fill factor of hierarchical non-uniform sampling lens arrays. As a result, the imaging quality of the segmented interferometric array integrated optical imaging system will be reduced. Therefore, it is necessary to analyze the imaging quality of the imaging system with hierarchical non-uniform sampling lens arrays with different fill factors.
Figure 11 shows the U-V spatial spectrum of the segmented interferometric array integrated optical imaging system under hierarchical non-uniform sampling lens arrays with different fill factors. As the fill factor of the lens array increases, the maximum sampling radius R and continuous sampling radius r in the U-V spatial spectrum gradually increase. The relationship between R and r as a function of FF is shown in Figure 12. When the fill factor of the lens array is FF = 0.9, the U-V spatial spectrum is basically the same as that when the fill factor of the lens array is FF = 1.
Figure 13 shows the object PSF of the segmented interferometric array integrated optical imaging system under hierarchical non-uniform sampling lens arrays with different fill factors. As the fill factor of the lens array increases, the FWHM of the segmented interferometric array integrated optical imaging system with hierarchical non-uniform sampling lens arrays gradually decreases. Combining the results of U-V spatial spectrum analysis, it is shown that when the fill factor of the lens array is FF = 0.9, the FWHM of the segmented interferometric array integrated optical imaging system is basically the same as that when the fill factor FF = 1 with an FWHM of approximately 0.25 m.
As shown in Figure 14, the imaging results of the segmented interferometric array integrated optical imaging system with hierarchical non-uniform sampling lens arrays of different fill factors are presented. As the fill factor of the lens array increases, the sampling radius of the U-V spatial spectrum increases, and the contour and detail information of the system imaging gradually become clearer. According to the magnified image of the imaging center, it can be seen that when the lens array fill factor is FF = 0.9, the imaging detail information is basically consistent with the result when the lens array fill factor is FF = 1.

6. Conclusions

This paper investigates the scene radiation light field conversion mechanism of the segmented interferometric array integrated optical imaging system. A hierarchical non-uniform sampling lens array is proposed to compensate for zero frequency sampling and improve sampling redundancy in the U-V spatial spectrum. Compared with the wheel-shaped lens array, the system imaging quality with the hierarchical non-uniform sampling lens array is better. Compared with the inhomogeneous multistage sampling lens array, the imaging system with a hierarchical non-uniform sampling lens array has lower economic costs because it uses fewer lenses. Processing errors are allowed in the process of hierarchical non-uniform sampling lens array processing. The results of the research show that the processing error of the fill factor of hierarchical non-uniform sampling lens array cannot exceed 10%. The research results provide a theoretical basis for the development of a segmented interferometric array integrated optical imaging system.

Author Contributions

Conceptualization, W.G. and X.W.; methodology, X.W.; software, W.G.; validation, W.G.; formal analysis, Y.H.; investigation, J.Z.; resources, P.L.; data curation, W.G.; writing—original draft preparation, W.G. and F.W.; writing—review and editing, J.Z.; visualization, Y.H.; supervision, F.W.; project administration, W.G.; funding acquisition P.L. All authors have read and agreed to the published version of the manuscript.

Funding

This research was supported by Fundamental Research Program of Shanxi Province (202203021222329, 202303021221186), Shanxi College of Technology Scientific Research Startup Fund Project (009010, 009018), The Shanxi Province Outstanding Young Academic Leader Program of Colleges and Universities (No. 2024Q043) and National Natural Science Foundation of China (No. 62001430).

Data Availability Statement

Data are contained within the article.

Conflicts of Interest

The authors declare no conflicts of interest.

References

  1. Pedrotti, F.L.; Leno, M.P.; Leno, S.P. Introduction to Optics; Cambridge University Press: Cambridge, UK, 2017. [Google Scholar]
  2. Michael, B. Handbook of Optics; McGraw-Hill: New York, NY, USA, 1995. [Google Scholar]
  3. Wang, H.; Kang, F.Z.; Zhao, W.; Xie, Y.J. Optical design of infrared diffractive telescope. J. Infrared Millim. Waves 2016, 35, 425–429. [Google Scholar]
  4. Zhang, Y.; Qin, F.; Li, X. Advances in the Sub-diffraction Limited Light Modulation by Supercritical Lens(Invited). Acta Photonica Sin. 2023, 51, 0551310. [Google Scholar]
  5. Radhika, D.; Padmakar, P.; Annu, J. Building a large affordable optical-NIR telescope (I): An alternate way to handle segmented primary mirror. Exp. Astron. 2023, 56, 1–36. [Google Scholar]
  6. Tang, H.; Liao, Z.; Jiang, J.; Chen, M.; Xian, H.; Li, H.; Liao, S. Simulation method for multichromatic light spots in mosaic aperture telescopes with large image planes during deployment. Appl. Opt. 2024, 63, 3770–3778. [Google Scholar] [CrossRef]
  7. Trumper, I.; Hallibert, P.; Arenberg, J.W.; Kunieda, H.; Guyon, O.; Stahl, H.P.; Kim, D.W. Optics technology for large-aperture space telescopes: From fabrication to final acceptance tests. Adv. Opt. Photonics 2018, 10, 644–702. [Google Scholar] [CrossRef]
  8. Zhang, X.J.; Fan, Y.C.; Bao, H.; Xue, D. Applications and development of ultra large aperture space optical remote sensors. Opt. Precis. Eng. 2016, 24, 2613–2626. [Google Scholar] [CrossRef]
  9. Blind, N.; Coarer, E.L.; Kern, P.; Gousset, S. Spectrographs for astrophotonics. Opt. Express 2017, 25, 27341–27369. [Google Scholar] [CrossRef] [PubMed]
  10. Meinel, B.A. Cost relationships for nonconventional telescope structural configurations. J. Opt. Soc. Am. 1982, 72, 14–20. [Google Scholar] [CrossRef]
  11. Whiteaker, K.; Marshalek, R.; Domber, J.; Kaliski, R. Large Aperture Diffractive Receiver for Deep Space Optical Communications. In Applications of Lasers for Sensing and Free Space Communications; Optica Publishing Group: Washington, DC, USA, 2015. [Google Scholar]
  12. An, Q.; Wang, K.; Liu, X.; Li, H.; Zhu, J. Integrated Test System for Large-aperture Telescopes Based on Astrophotonics Interconnections. Jinst 2024, 11, 1–9. [Google Scholar]
  13. Kendrick, R.L.; Duncan, A.; Ogden, C.; Wilm, J.; Stubb, D.M. Flat-Panel space-based spacesurveillance sensor. In Proceedings of the Advanced Maui Optical and Space Surveillance Technologies Conference, Maui, HI, USA, 10–13 September 2013. [Google Scholar]
  14. Kendrick, R.; Thurman, S.T.; Duncan, A.; Ogden, C.; Wilm, J. Segmented planar imaging detector for EO reconnaissance. In Proceedings of the Imaging and Applied Optics, Arlington, VI, USA, 23–27 June 2013. [Google Scholar]
  15. Liu, G.; Wen, D.; Song, Z.; Jiang, T. System design of an optical interferometer based on compressive sensing: An update. Opt. Express 2020, 28, 19349–19361. [Google Scholar] [CrossRef] [PubMed]
  16. Cao, K.; Ye, Z.; Jiang, C.; Zhu, J.; Qiao, Z.; Jiang, Y. Lenslets combination optimal design of the segmented planar image detector for electro-optical reconnaissance. Opt. Eng. 2020, 59, 1–9. [Google Scholar] [CrossRef]
  17. Deng, X.; Tao, W.; Diao, Y.; Sang, B.; Sha, W. Imaging Analysis of Photonic Integrated Interference Imaging System Based on Compact Sampling Lenslet Array Considering On-Chip Optical Loss. Photonics 2023, 10, 797. [Google Scholar] [CrossRef]
  18. Chen, T.; Zeng, X.; Bai, Y.; Zhang, Z.; Wang, Y.; Zhang, F.; Zhang, X. Sparse-aperture photonics-integrated interferometer (SPIN) imaging system: Structural design and imaging quality analysis. Opt. Express 2021, 29, 39256–39270. [Google Scholar] [CrossRef] [PubMed]
  19. Pan, X.; Yang, Z.; Jia, R.; Ren, G.; Peng, Q. Photonic integrated interference imaging system based on front-end S-shaped microlens array and Con-DDPM. Opt. Express 2024, 32, 29112–29124. [Google Scholar] [CrossRef] [PubMed]
  20. Zhang, Z.; Lü, G.; Feng, H.; Xu, Z.; Chen, Y. Analysis of Signal Energy and Noise in Photonic Integrated Interferometric Imaging System. Acta Opt. Sin. 2022, 42, 1311001. [Google Scholar]
  21. Chen, T.; Zeng, X.; Bai, Y.; Tian, M.; Zhang, X. Image Reconstruction of Photonics Integrated Interference Imaging: Entropy Prior. Acta Opt. Sin. 2021, 41, 2311002. [Google Scholar]
  22. Chu, Q.; Shen, Y.; Yuan, M.; Gong, M. Numerical simulation and optimal design of Segmented Planar Imaging Detector for Electro-Optical Reconnaissance. Opt. Commun. 2017, 405, 288–296. [Google Scholar] [CrossRef]
  23. Gao, W.; Wang, X.; Ma, L.; Guo, D.F. Quantitative analysis of segmented planar imaging quality based on hierarchical multistage sampling lens array. Opt. Express 2019, 27, 7955–7967. [Google Scholar] [CrossRef]
  24. Ding, C.; Zhang, X.; Liu, X.; Meng, H.; Xu, M. Structure design and image reconstruction of hexagonal-array photonics integrated interference imaging system. IEEE Access 2020, 8, 139396–139403. [Google Scholar] [CrossRef]
  25. Zhao, Z.; Yuan, Y.; Zhang, C.; Wang, X.; Gao, W. Imaging quality characterization and optimization of segmented planar imaging system based on honeycomb dense azimuth sampling lens array. Opt. Express 2023, 31, 35670–35684. [Google Scholar] [CrossRef]
  26. Yu, Q.; Wu, D.; Chen, F.; Sun, S. Design of a wide-field target detection and tracking system using the segmented planar imaging detector for electro-optical reconnaissance. Chin. Opt. Lett. 2018, 16, 071101. [Google Scholar]
  27. Gao, W.; Yuan, Y.; Wang, X.; Ma, L.; Zhao, Z.; Yuan, H. Quantitative analysis and optimization design of the segmented planar integrated optical imaging system based on an inhomogeneous multistage sampling lens array. Opt. Express 2021, 29, 11869–11884. [Google Scholar] [CrossRef] [PubMed]
Figure 1. The schematic diagram of the segmented interferometric array integrated optical imaging system.
Symmetry 17 00336 g001
Figure 2. The process of the scene radiation light field conversion.
Symmetry 17 00336 g002
Figure 3. Schematic diagram of wheel-shaped and hierarchical non-uniform sampling lens array: (a) wheel-shaped lens array; (b) hierarchical non-uniform sampling lens array.
Symmetry 17 00336 g003
Figure 4. Different lens arrays: (a) wheel-shaped lens array; (b) inhomogeneous multistage sampling lens array; (c) hierarchical non-uniform sampling lens array.
Symmetry 17 00336 g004
Figure 5. Baseline pairing method of the hierarchical non-uniform sampling lens arrays.
Symmetry 17 00336 g005
Figure 6. U-V spatial spectrum of the segmented interferometric array integrated optical imaging system: (a) wheel-shaped lens array; (b) inhomogeneous multistage sampling lens array; (c) hierarchical non-uniform sampling lens array.
Symmetry 17 00336 g006
Figure 7. Object PSF of the segmented interferometric integrated optical imaging system with different sampling lens arrays.
Symmetry 17 00336 g007
Figure 8. Imaging results of the segmented interferometric integrated optical imaging system under different lens arrays: (a) wheel-shaped lens array; (b) inhomogeneous multistage sampling lens array r1 = 2.2, r2 = 1.8, r3 = 1.4, r4 = 1.8 (mm); (c) hierarchical non-uniform sampling lens array r0 = 0.9 mm, r1 = 0.8 mm, r2 = 1.6 mm, r3 = 3.0 mm, r4 = 1.8 mm.
Symmetry 17 00336 g008
Figure 9. The relationship between high-frequency sampling lens size and PSNR of the hierarchical non-uniform sampling lens array.
Symmetry 17 00336 g009
Figure 10. The fill factor of the lens array.
Symmetry 17 00336 g010
Figure 11. U-V spatial spectrum of segmented interferometric array integrated optical imaging system with hierarchical non-uniform sampling lens array under different fill factors.
Symmetry 17 00336 g011
Figure 12. The relationship between R and r with FF.
Symmetry 17 00336 g012
Figure 13. Object PSF of the segmented interferometric array integrated optical imaging system under hierarchical non-uniform sampling lens arrays with different fill factors.
Symmetry 17 00336 g013
Figure 14. Imaging results of the segmented interferometric array integrated optical imaging system with hierarchical non-uniform sampling lens arrays of different fill factors (the inset is a center enlargement).
Symmetry 17 00336 g014
Table 1. Parameters of Imaging Simulation System.
System Parameter Symbol Numerical Value
Wavelength rangeλ380~700 nm
Object distancez250 km
The longest interference baseline length BmaxBmax104.4 mm
Number of lenslets on an interference armN30
Number of interference armsp19
AWG channel numberSC16
Wavelength distanceΔλ20 nm
Optical path differenceΔ7.2 μm
Lens array fill factorFF1
Disclaimer/Publisher’s Note: The statements, opinions and data contained in all publications are solely those of the individual author(s) and contributor(s) and not of MDPI and/or the editor(s). MDPI and/or the editor(s) disclaim responsibility for any injury to people or property resulting from any ideas, methods, instructions or products referred to in the content.

