Article

Study on Cross-Section Transition Form and Stability of Super-Large Variable-Span Tunnel

School of Transportation Engineering, Shandong Jianzhu University, No. 1000 Fengming Road, Jinan 250101, China
*
Author to whom correspondence should be addressed.
Symmetry 2025, 17(12), 2036; https://doi.org/10.3390/sym17122036
Submission received: 31 October 2025 / Revised: 17 November 2025 / Accepted: 20 November 2025 / Published: 28 November 2025

Abstract

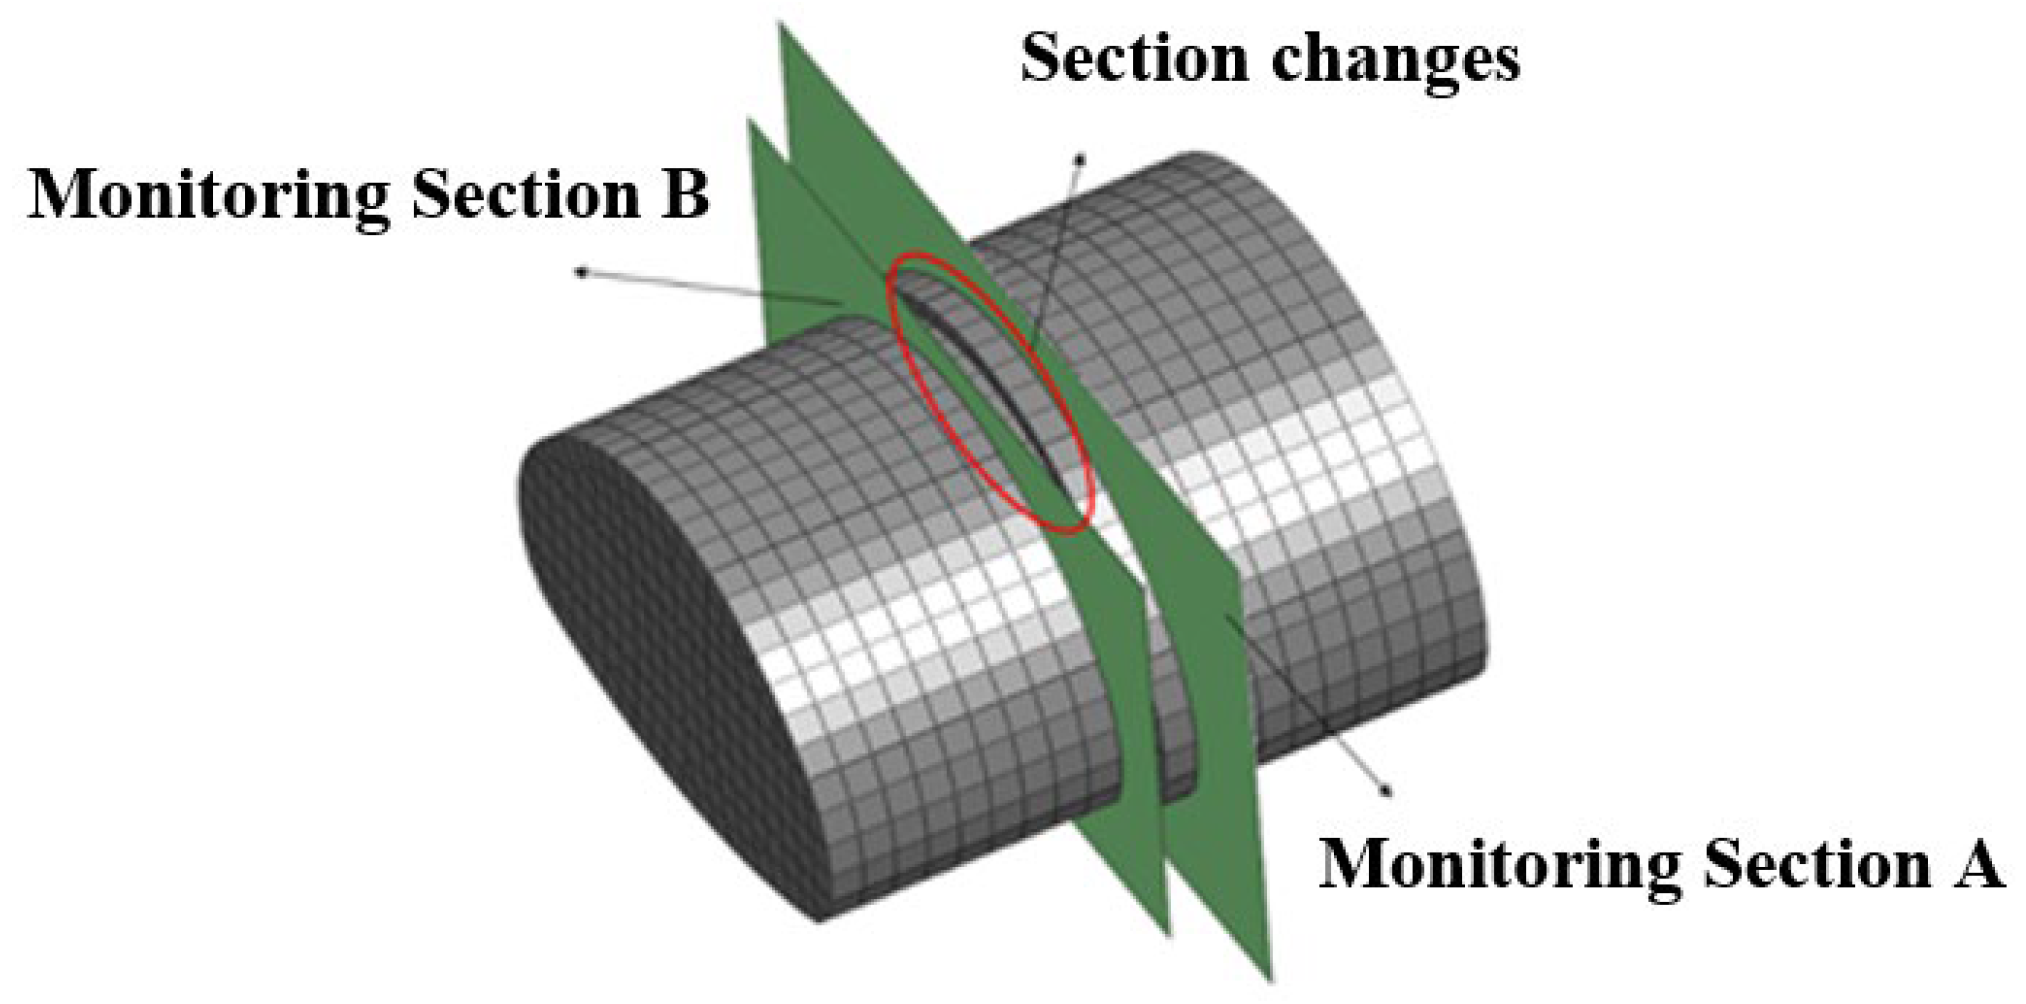
In order to clarify the influence of cross-section change mode of a large-span variable cross-section tunnel on the stability of the surrounding rock of a tunnel, four three-dimensional finite element models were established for four typical cross-section conversion forms: Sudden changes in the cross-section of the symmetric tunnel, Gradual changes in the cross-section of the symmetric tunnel, Sudden changes in the cross-section of the asymmetric tunnel, and Gradual changes in the cross-section of the asymmetric tunnel. The Stress characteristics and deformation laws of the surrounding rock under different cross-sectional changes were systematically analyzed. The simulation results were compared with the field monitoring results, and the construction scheme was optimized based on the results of the numerical analysis and field monitoring. The results demonstrate that the final settlement values for sudden changes in the cross-section of the symmetric tunnel and sudden changes in the cross-section of the asymmetric tunnel were 21.23 mm and 21.98 mm, respectively, representing reductions of 14.6% and 15.7% compared to gradual changes in the cross-section of the symmetric tunnel and gradual changes in the cross-section of the asymmetric tunnel. The final support stress values of sudden changes in the cross-section of the symmetric tunnel and sudden changes in the cross-section of the asymmetric tunnel were 8.59 and 7.88 MPa, respectively, representing reductions of 21.5% and 26.9% compared with gradual changes in the cross-section of the symmetric tunnel and gradual changes in the cross-section of the asymmetric tunnel. Compared with asymmetric construction, symmetrical construction is more likely to lead to a stress concentration effect on both sides of the tunnel. Considering the overall construction feasibility and economy, the asymmetric sudden-change construction scheme provides better comprehensive benefits. The research results can provide a theoretical basis and technical reference for solving engineering problems such as complex stress in a large section transition zone and difficult control of tunnel construction.

1. Introduction

Under the guidance of the “A Leading Country in Transport” strategy, China’s transportation infrastructure has continued to develop rapidly, and tunnel engineering has increasingly shown a significant development trend of “long mileage and large sections” [1,2,3,4,5,6]. To meet the requirements of complex traffic tunnel functions and structures, some super-large-span variable cross-section tunnels have been designed, which adversely affect the stability of the tunnels [7,8,9,10]. The stress redistribution and load release effect of the surrounding rock caused by the excavation of a long-span tunnel are much more complicated than those of a conventional tunnel, especially in sections with variable cross-sections. Because of its complex structural stress mechanism and the difficulty in controlling the stability of the surrounding rock, it has become a key risk control node in the construction process [11,12,13,14]. Therefore, to minimize the disturbance to the surrounding rock and realize the safety and controllability of the entire construction process, the cross-section transition form and stability of the super-large variable-span tunnel were systematically studied. The research results can provide theoretical basis and reference for similar tunnel engineering.
The stability of large-span variable cross-section tunnel has been studied by many scholars. Zhao [15] focused on the implementation of the ‘pilot tunnel reverse expansion method’ in a gradient variable cross-section tunnel project and conducted a systematic analysis of the deformation law of the surrounding rock and stress characteristics of the primary support structure during the construction process. Zhao [16] discussed the application of the bilateral tunneling method and multi-method conversion technology in large-span interchange variable cross-section tunnels and optimized the traditional double-side heading construction process. In view of the technical problems in the construction of the three-line bifurcated section of the Qiaopingshan Tunnel of the Chongqing Railway East Ring Line, Ren [17] proposed a construction technology that achieved a safe and smooth transition between three large spans of 15.12 m, 19.77 m, and 24.53 m. To reveal the strain and stress properties of the variable-section tunnel during construction, Ma [18] established a three-dimensional numerical model that considered the hardening process of shotcrete and systematically simulated and analyzed the stress and deformation of the surrounding rock at the cross-section change of the tunnel in each excavation stage. Jun [19] proposed a design method for a multi-section step change for a large-span slope tunnel, which optimized the supporting structure, effectively avoided the structural instability of the Xinkaotang Tunnel, and improved construction safety. Based on the Bibanpo Tunnel project of the Shanghai-Kunming Passenger Dedicated Line, Yan [20] analyzed the entire process of the construction technology for the four enlarged variable section construction conditions in the tunnel and summarized the core technical points of the variable section construction of the large section tunnel in combination with the field practice. Sun [21] carried out indoor model tests and disclosed the stress characteristics and deformation law of surrounding rock during the construction of large-span variable cross-section tunnels. To solve the engineering challenges caused by the variable cross-section tunnel crossing the layered expansive mudstone stratum, Fan [22] systematically explored the disaster-causing mechanism and control technology of this type of stratum through field investigations and laboratory tests. Song [23] advanced a methodology involving a step-by-step process integrated with a variable section transition. This approach is founded on pragmatic engineering principles and entails two optimized excavation schemes for the conversion of the construction method. Then, by comparing the field monitoring data, the rationality of the optimization scheme was verified, and the deformation and stress characteristics of the surrounding rock and supporting structure in the widening section were revealed. With the in-depth application of computer technology in the engineering field, some scholars have introduced mainstream numerical analysis software such as FLAC 3D 6.0 [24,25], Midas GTS NX 2021 [26,27,28], ANSYS 19.0 [29], ABAQUS 6.14 [30,31,32] into the study of variable-section tunnels. By simulating the process of construction and stress state of the supporting structure, significant technical support is provided for the advancement of theoretical research and development of engineering practice.
Based on the preceding studies, it is observed that the research on such tunnels in China and abroad mainly focuses on the optimization of construction methods and the stress characteristics of supporting structures. However, research on the cross-section change mode of super-large-span variable cross-section tunnels is not sufficiently systematic, and a theoretical system covering different forms of change has not been developed. Therefore, in this study, based on the large-span variable cross-section tunnel project of Tangshan Road in Qingdao City, Shandong Province, China, four calculation models were established using Midas GTS NX finite element analysis software to solve the engineering problems of complex stress in the large cross-section conversion area and high difficulty in the construction control of the tunnel. These four calculation models correspond to four types of cross-section change conditions: symmetrical gradient, symmetrical mutation, asymmetric gradient, and asymmetric mutation. The displacement development law and stress distribution characteristics of the surrounding rock and supporting structure under different working conditions were analyzed, and the influence mechanism of the variable cross-section form on tunnel stability was revealed. The numerical calculation results were compared with field monitoring data, and the construction scheme was optimized. The research results can provide a theoretical basis and engineering reference for similar projects.

2. Project Introduction

2.1. Project Overview

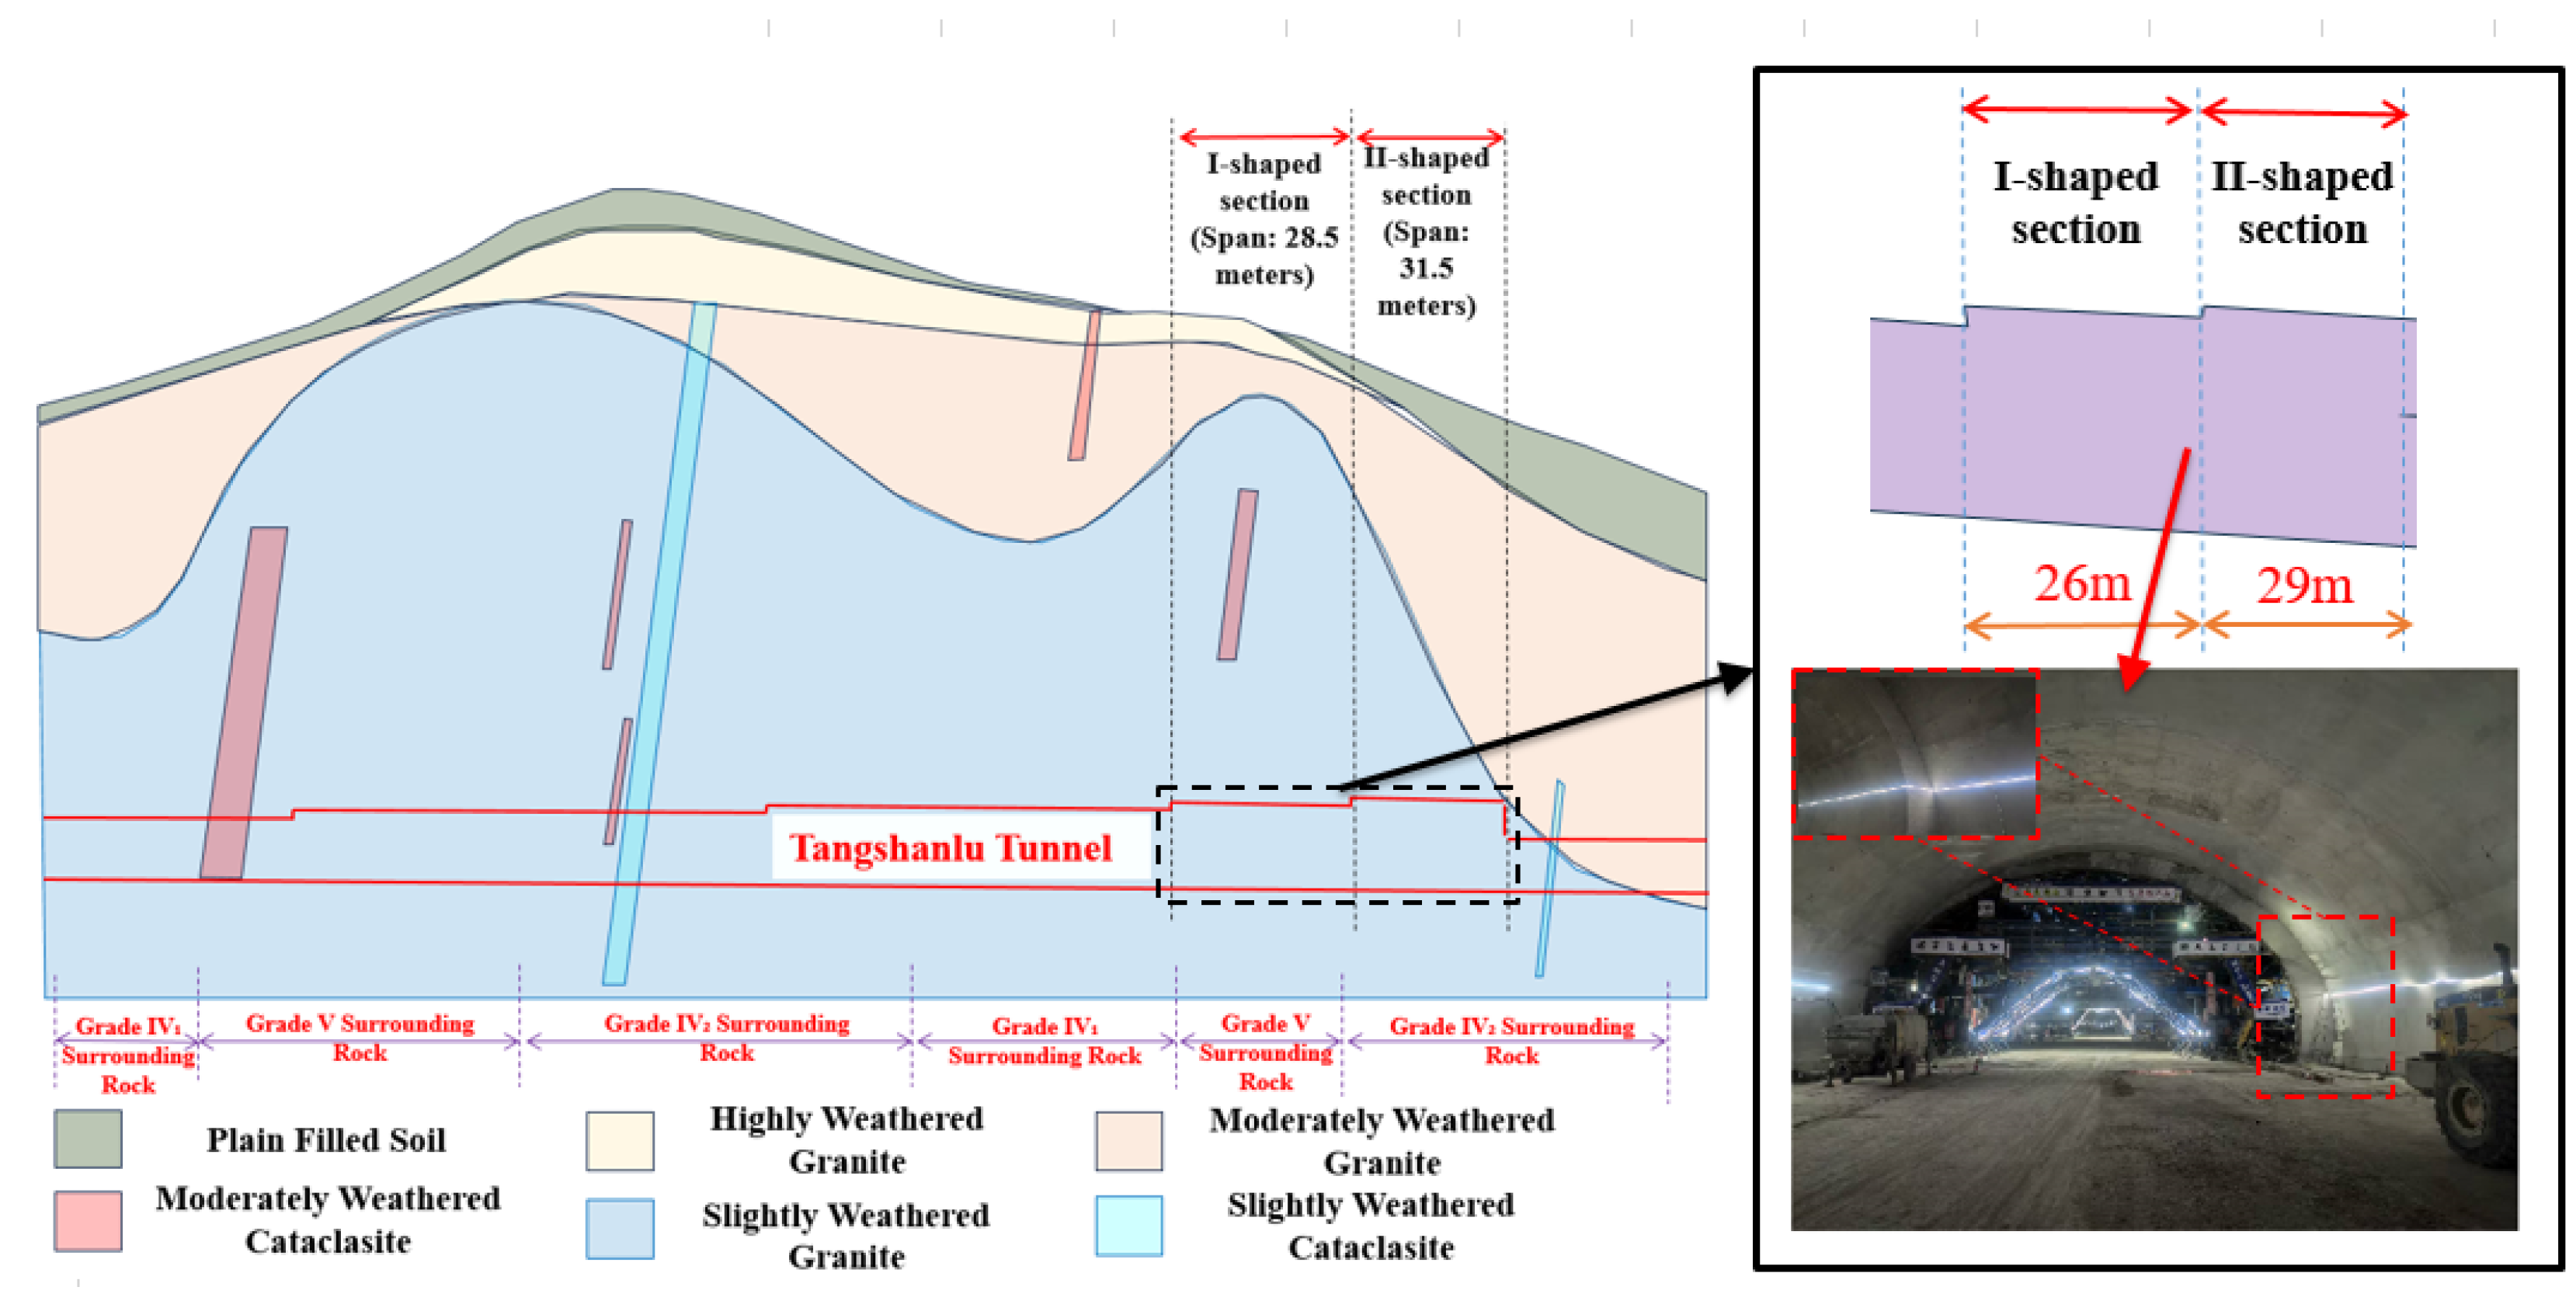
The Tangshan Road Tunnel is located in Qingdao City, Shandong Province, China, as shown in Figure 1. It is the largest traffic tunnel in China at present. The geological section of the Tangshan Road Tunnel is illustrated in Figure 2. From top to bottom, the strata are plain fill, strongly weathered granite, moderately weathered granite, and slightly weathered granite. The main body of the tunnel is located in a slightly weathered granite layer. In this geological formation, the focus of research is often not on “how to prevent cave-ins,” but rather on optimizing the design and construction. Therefore, to maximize both safety and cost effectiveness, research on the optimal method for varying tunnel cross-sections is of significant importance. The typical large-span variable cross-section areas (Sections I and II) were selected as the research objects of this study. The excavation area of Section I is 382 m2, the excavation span is 28.4 m, and the height is 16.4 m. The excavation area of Section II is 424 m2, the excavation span is 31.5 m, and the height is 17.6 m. The burial depth is 80 m.

2.2. Overview of Supporting Structure and Excavation Method

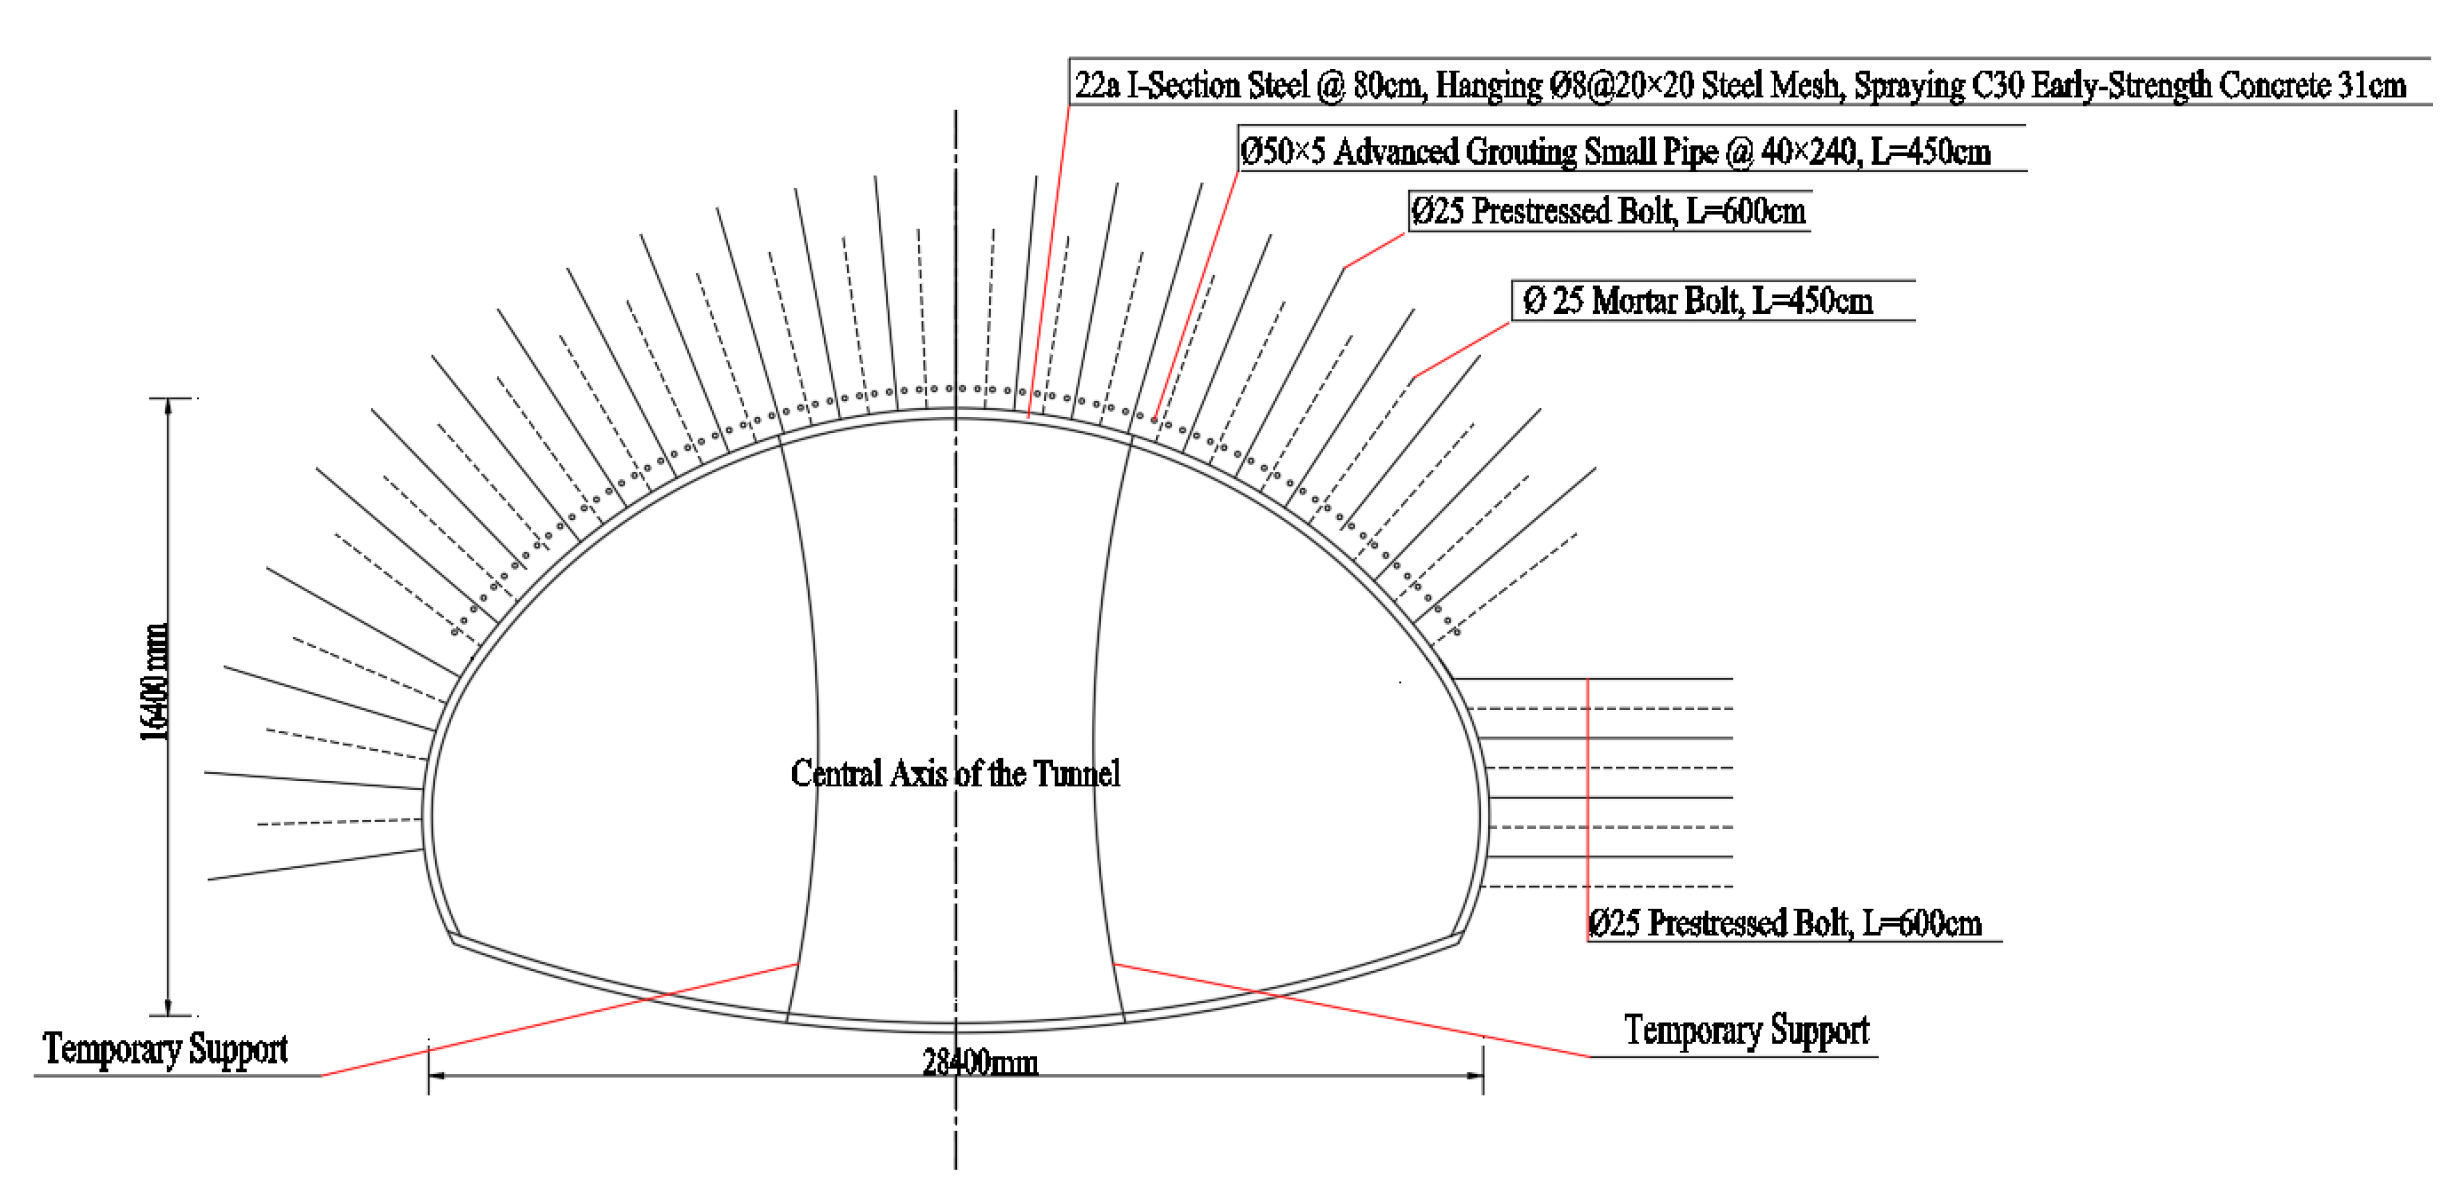
The supporting structures used in the tunnel sections of type I and type II are shown in Figure 3 and Figure 4, respectively.
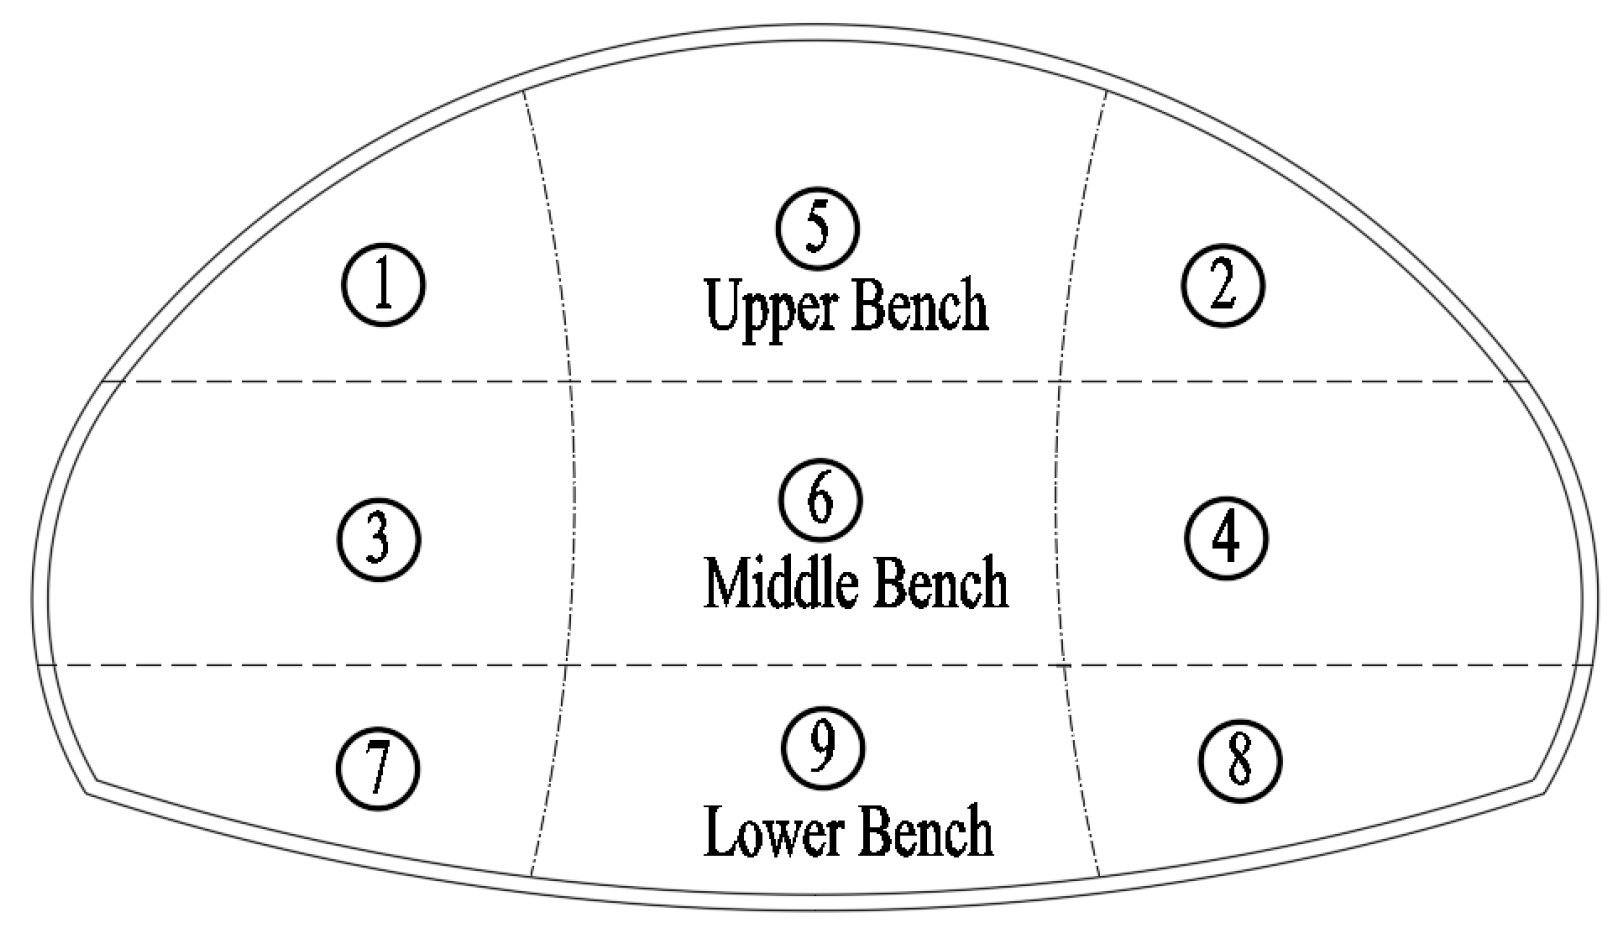
The excavation process is shown in Figure 5 and the specific steps of tunnel construction are as follows:
(1) Upper Bench—Left (Section①): a. Install advanced support. b. Excavate Section②. c. Erect initial support: steel mesh, rock bolts, steel frame, shotcrete, and temporary support.
(2) Upper Bench—Right (Section②): a. Install advanced support. b. Excavate Section②, after the excavation of Section① for 15 m. c. Erect initial support: steel mesh, rock bolts, steel frame, shotcrete, and temporary support.
(3) Middle Bench—Left (Section③): a. Excavate Section③, after the upper bench’s initial support meets design strength and a 30 m distance from Section② is achieved. b. Erect initial support: steel mesh, rock bolts, steel frame, shotcrete, and temporary support.
(4) Middle Bench—Right (Section④): a. Excavate Section④, after the excavation of Section③ for 15 m. b. Erect initial support: steel mesh, rock bolts, steel frame, shotcrete, and temporary support.
(5) Upper Bench—Center (Section⑤): a. Install advanced support. b. Excavate Section ⑤, after the excavation of Section④ for 15 m. c. Erect initial support: steel mesh, rock bolts, steel frame, and shotcrete.
(6) Middle Bench—Center (Section⑥): a. Excavate Section⑥, after the excavation of Section⑤ for 15 m. b. Erect initial support: steel mesh, rock bolts, steel frame, and shotcrete.
(7) Lower Bench—Left (Section⑦): a. Excavate Section⑦, after the excavation of Section⑥ for 15 m. b. Erect initial support: steel mesh, rock bolts, steel frame, shotcrete, and temporary support.
(8) Lower Bench—Right (Section⑧): a. Excavate Section⑧, after the excavation of Section⑦ for 15 m. b. Erect initial support: steel mesh, rock bolts, steel frame, shotcrete, and temporary support.
(9) Lower Bench—Center (Section⑨): a. Excavate Section⑨, after the excavation of Section⑧ for 15 m. b. Erect initial support: steel mesh, rock bolts, steel frame, and shotcrete.
The schematic diagram of the cross-section change is shown in Figure 6. The length of the gradual change in the cross section is 1.5 m. The Stress characteristics and deformation laws of the surrounding rock under different cross-sectional changes were systematically analyzed. Notably, only the supporting effects of the advance and initial support structures were considered in the simulation calculation. This is because the deformation of the surrounding rock is stable when the secondary lining is constructed. The main purpose of the secondary lining is to provide safety reserves.

3. Establishment of Numerical Model

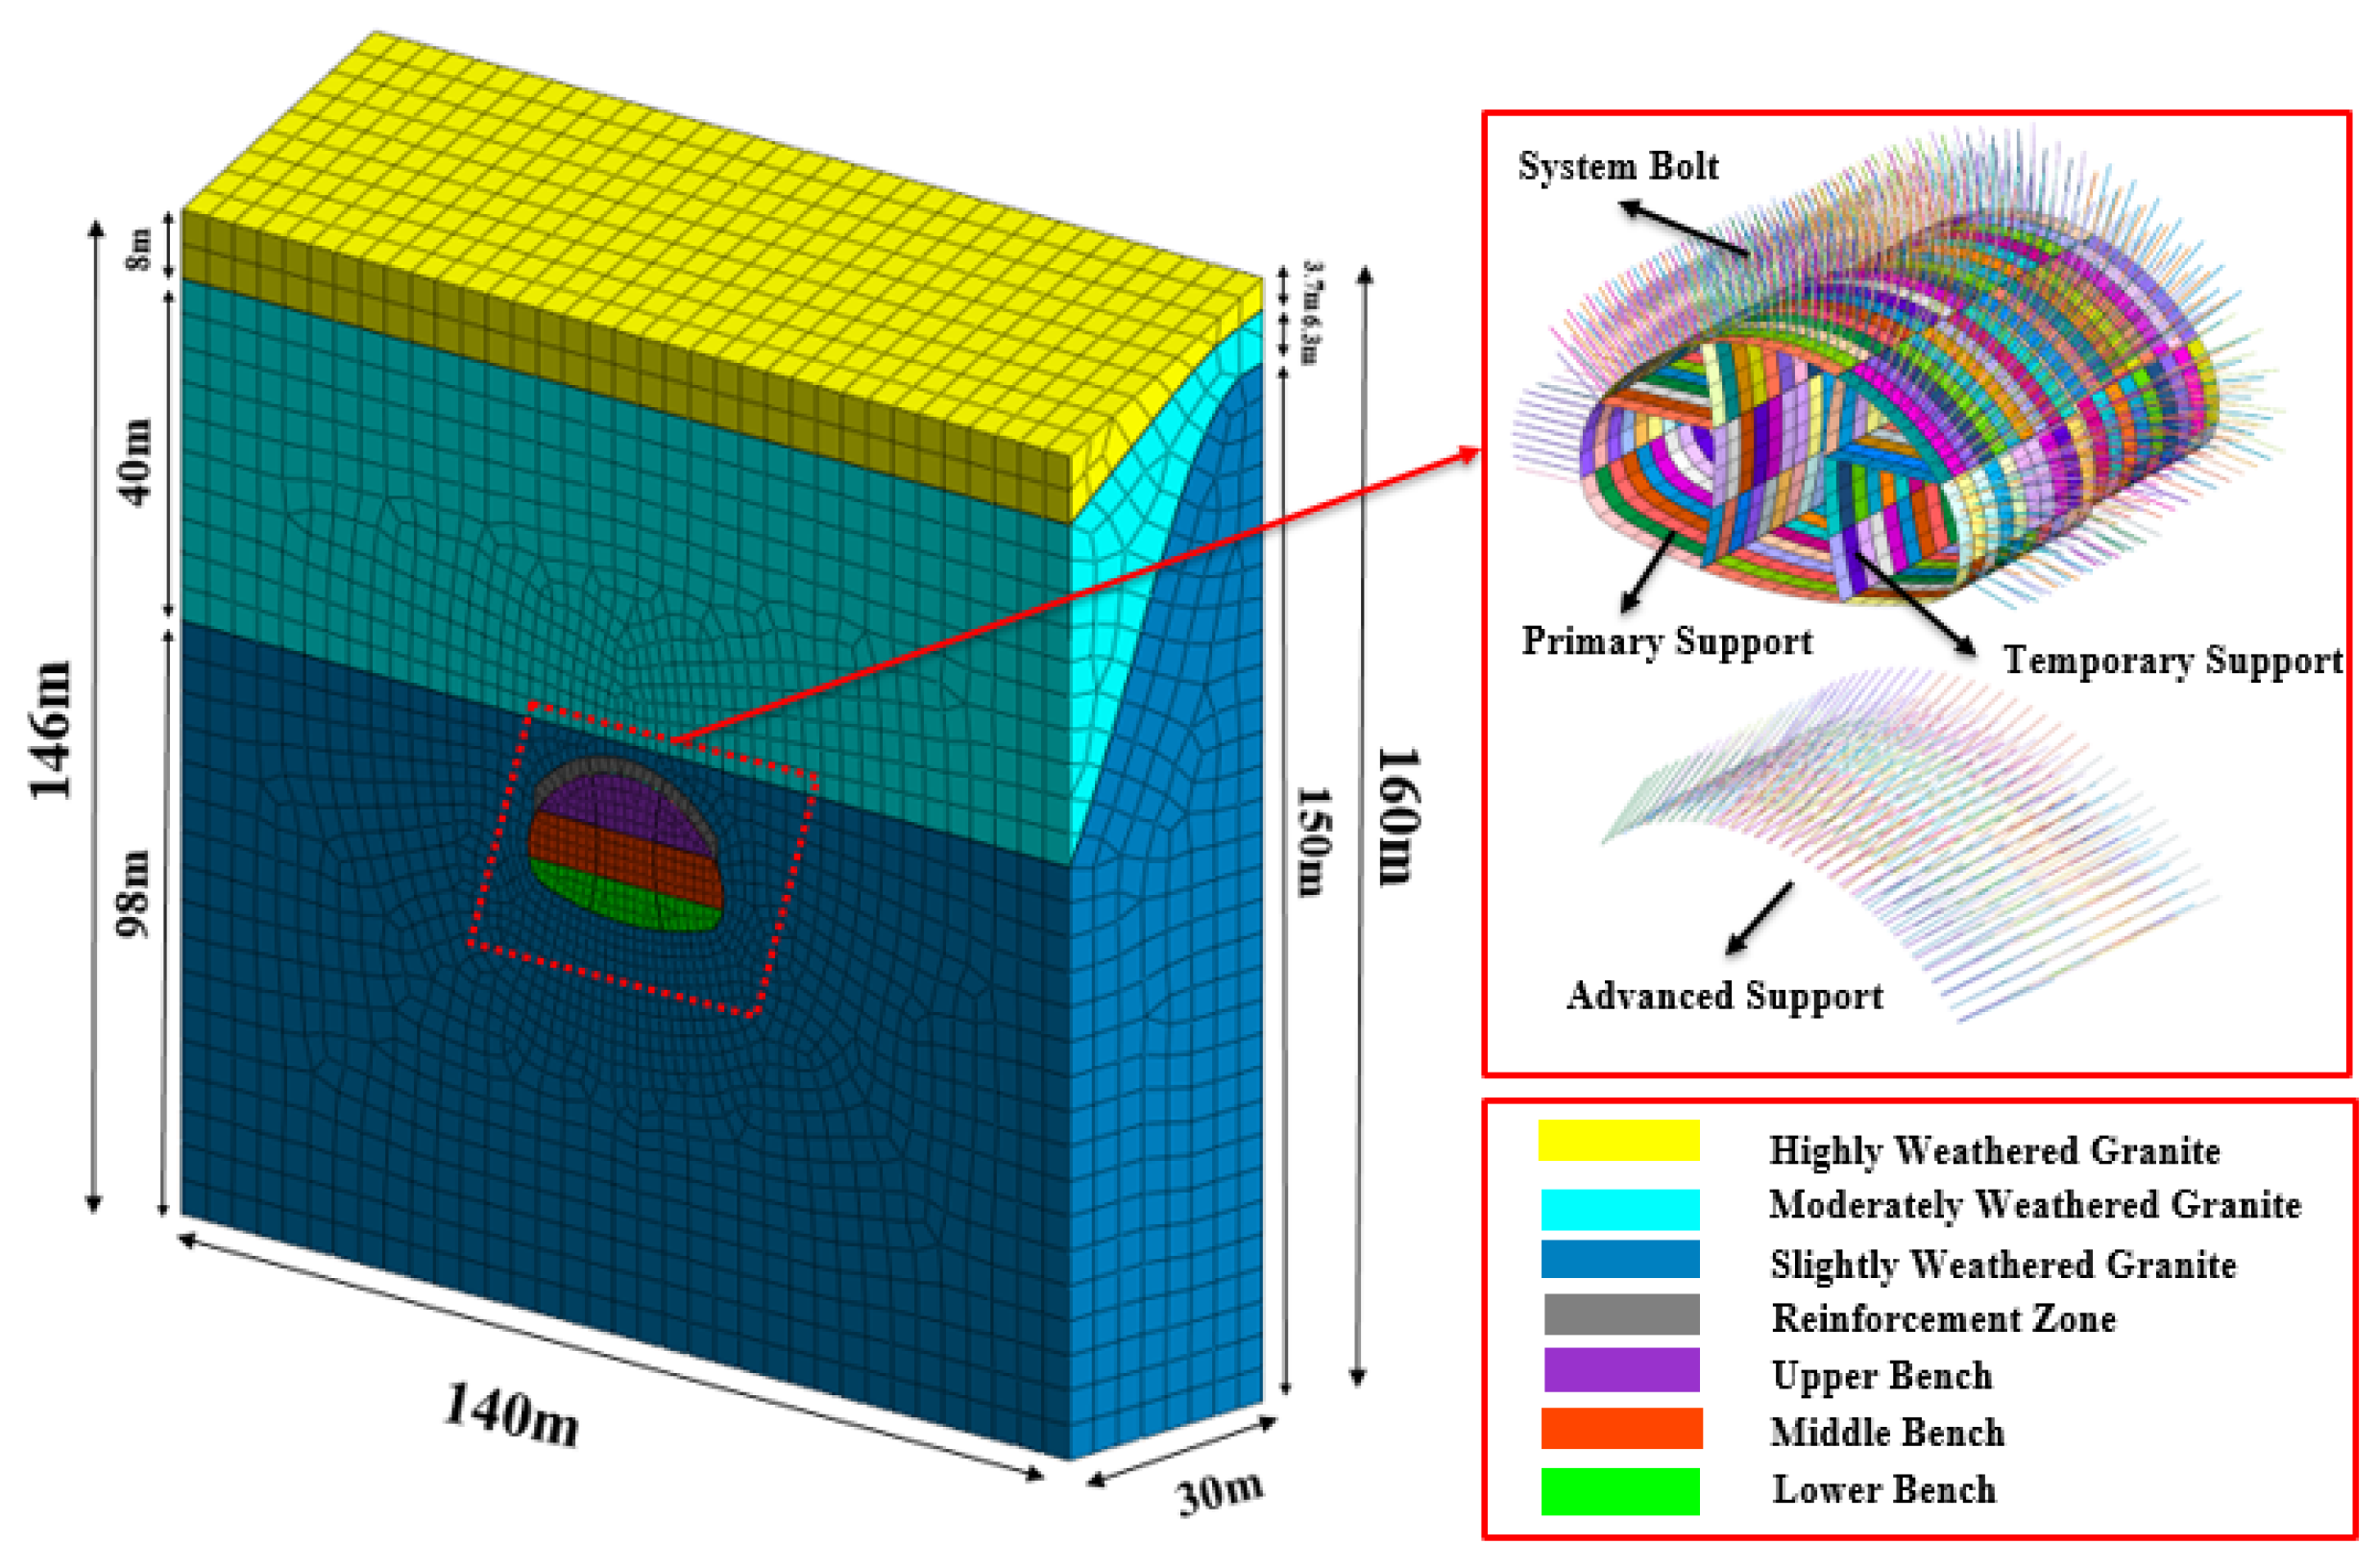
According to Saint-Venant’s principle, the model size should be three to five times the tunnel diameter. In the initial phase, we established a large-scale model that complied with Saint-Venant’s principle, but its computational speed was extremely slow. By analyzing the calculation results, we found that the horizontal influence range of the tunnel excavation on the surrounding area was approximately one times the tunnel diameter, while the vertical influence range was approximately two times the tunnel diameter. After considering the computational efficiency and influence range, we reduced the size of the model. Then, because this study focuses on the pattern of cross-sectional changes, we selected 15 m sections along the excavation direction at both I and II cross-sections, totaling 30 m. Consequently, the final model dimensions in this paper were 160 m × 140 m × 30 m, as shown in Figure 7. The strata in the model from top to bottom are highly weathered granite, moderately weathered granite and slightly weathered granite. The specific parameters are shown in Table 1. In the area where the tunnel passes through, the geology is slightly weathered granite, and the nonlinear characteristics of the strength envelope of slightly weathered granite are relatively weak. In the numerical calculation of this paper, the overall stability of the surrounding rock of the large three-dimensional tunnel is mainly concerned. Therefore, the Mohr-Coulomb criterion was selected to model rock behavior in the numerical simulations. The surrounding rock is a solid element and the bolt is an implant-able truss element. The plate element is used to simulate the temporary support structure. The upper surface of the model is a free surface. The lower boundary constrains the displacement in three directions of XYZ, the left and right boundaries con-strain the horizontal displacement, and the front and back boundaries constrain the horizontal displacement. The initial stress balance is carried out before excavation. The excavation and support construction sequence in the simulation calculation process is the same as that introduced in Section 2.2. It is worth noting that according to the geological survey report, the influence of groundwater on the surrounding rock is small; so, the model does not consider the factor of groundwater.
In the calculation, according to the principle of equal stiffness, the elastic modulus of the steel frame is converted to the elastic modulus of the shotcrete. The supporting parameters of the model are shown in Table 2.
The calculation formula is [33]:
EA = E1A1 + E2A2 + E3A3
In the formula, E and A are the elastic modulus and cross-sectional area of the equivalent post-mixed structure, respectively. E1 and A1 are the elastic modulus and cross-sectional area of the shotcrete, respectively. The elastic modulus and cross-sectional area of the steel mesh are denoted by E2 and A2, respectively, and the elastic modulus and cross-sectional area of the steel arch are denoted by E3 and A3.

4. Comparative Analysis of Numerical Simulation

The monitoring section in the numerical simulation is located at the same position as the on-site monitoring section, which is 1.5 m before and after the variable section, and the monitoring points were selected as the tunnel vault, tunnel arch shoulder, and tunnel haunch. The specific layout is shown in Figure 8 and Figure 9.

4.1. Analysis of Surrounding Rock Displacement

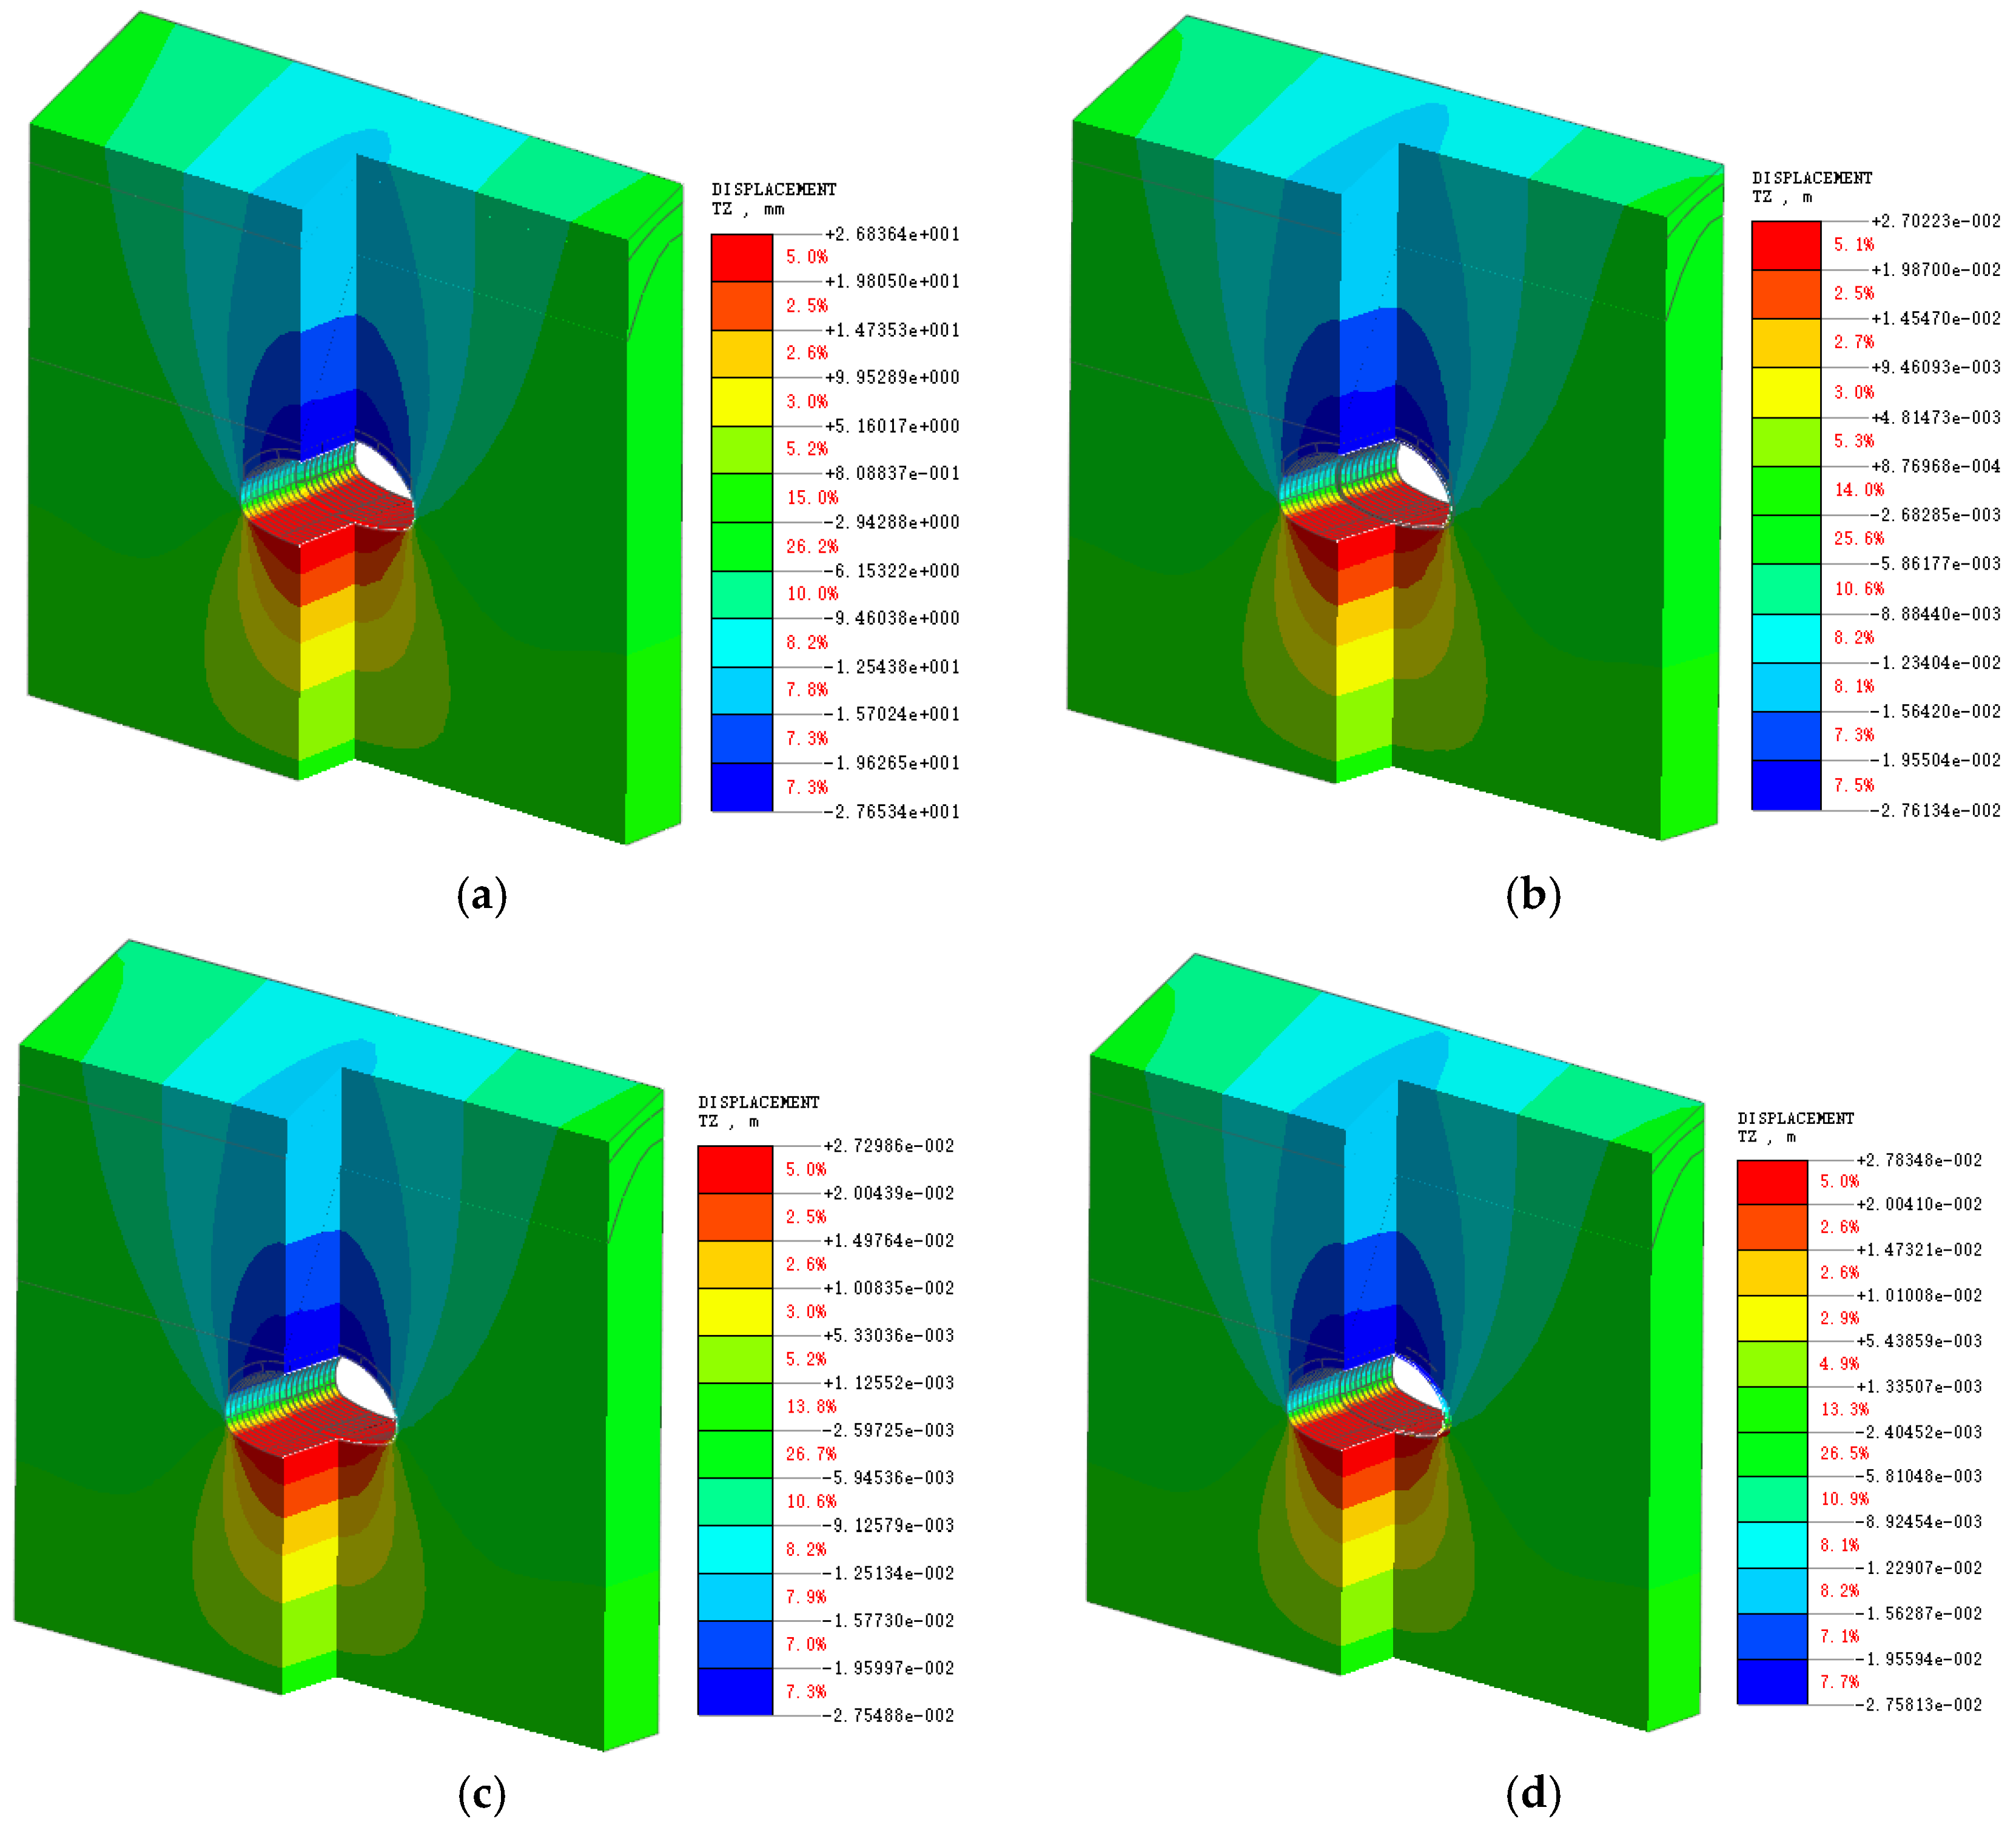
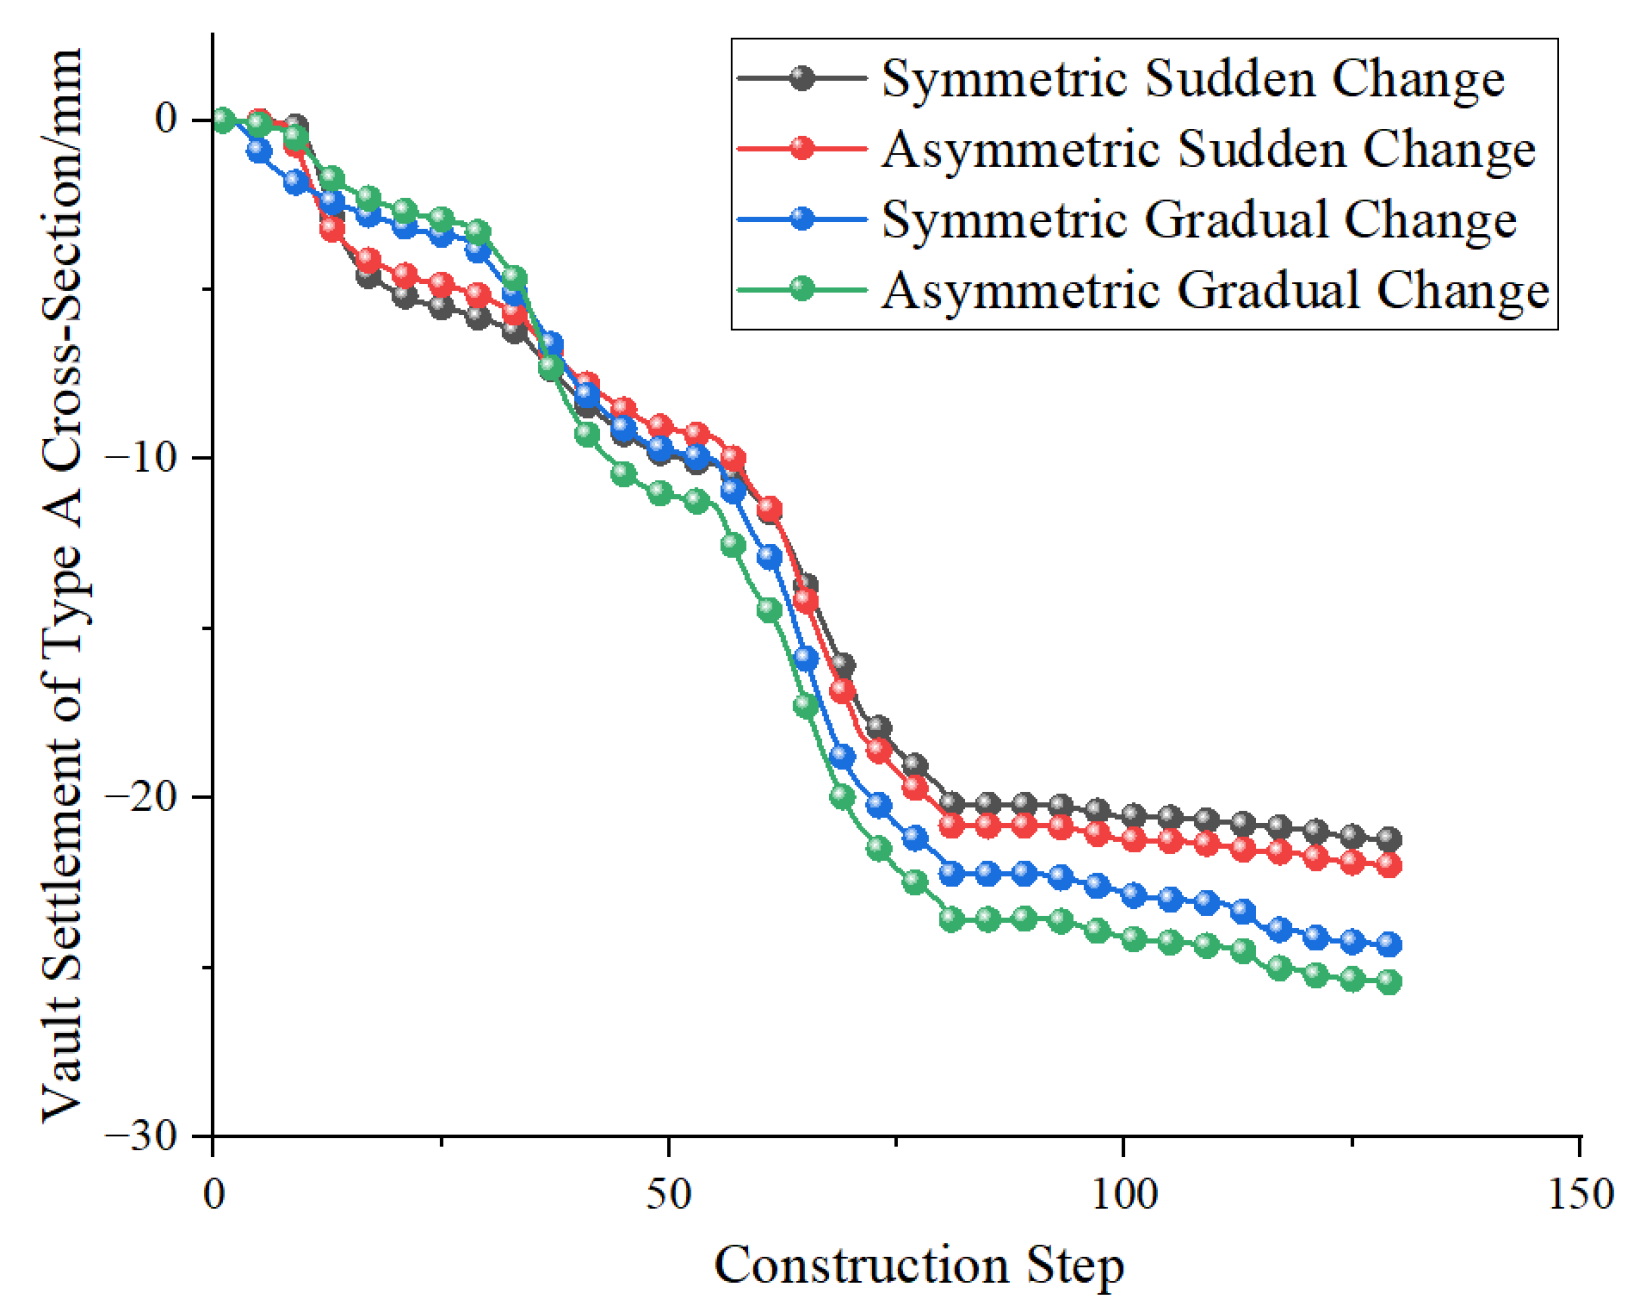
Figure 10 and Figure 11 are the Z-axis displacement cloud diagram of the four models and the comparison curve of the vault settlement of the monitoring section. As demonstrated in Figure 10 and Figure 11, with an increase in the number of construction steps, the vault settlement curves of the four models exhibited an ‘L’ distribution. The surrounding rock underwent five stages of deformation. Starting from the front of the tunnel face, the rock was gradually, rapidly, and sharply deformed along the excavation direction until the deformation began to stabilize. The pilot holes on the sides of the upper bench were excavated, and the vault settlement of the two gradual-change constructions was found to be 39.7% and 42.1% lower than that of the symmetrical and asymmetric sudden-change constructions, respectively. The left and right guide holes of the middle bench were continuously subjected to excavation, resulting in the rapid deformation of the surrounding rock. The rate of change in vault settlement for the two types of gradual-change construction was greater than that of the two types of sudden-change construction; therefore, the vault settlement of the four models was not significantly different in the subsequent slow deformation stage. Following the excavation of the middle pilot tunnel of the upper and middle benches, the surrounding rock began to deform. The deformations of the surrounding rock of the symmetrical gradual-change and the asymmetric gradual-change constructions were more severe, and the vault settlement increased by 13.3% and 14.5%, respectively, compared with the sudden-change construction. Subsequent to the excavation of the lower bench, the deformation of the surrounding rock was stable. During the 113th construction step, the gradual change in the construction vault settlement owing to the removal of the temporary support produced a mutation of approximately 2.2% of the total settlement, whereas the sudden change in the construction was less affected. The final settlement values of the symmetrical sudden-change and asymmetric sudden-change constructions were 21.23 mm and 21.98 mm, respectively, which were 14.6% and 15.7% lower than those of the symmetrical gradual-change and asymmetric gradual-change constructions.
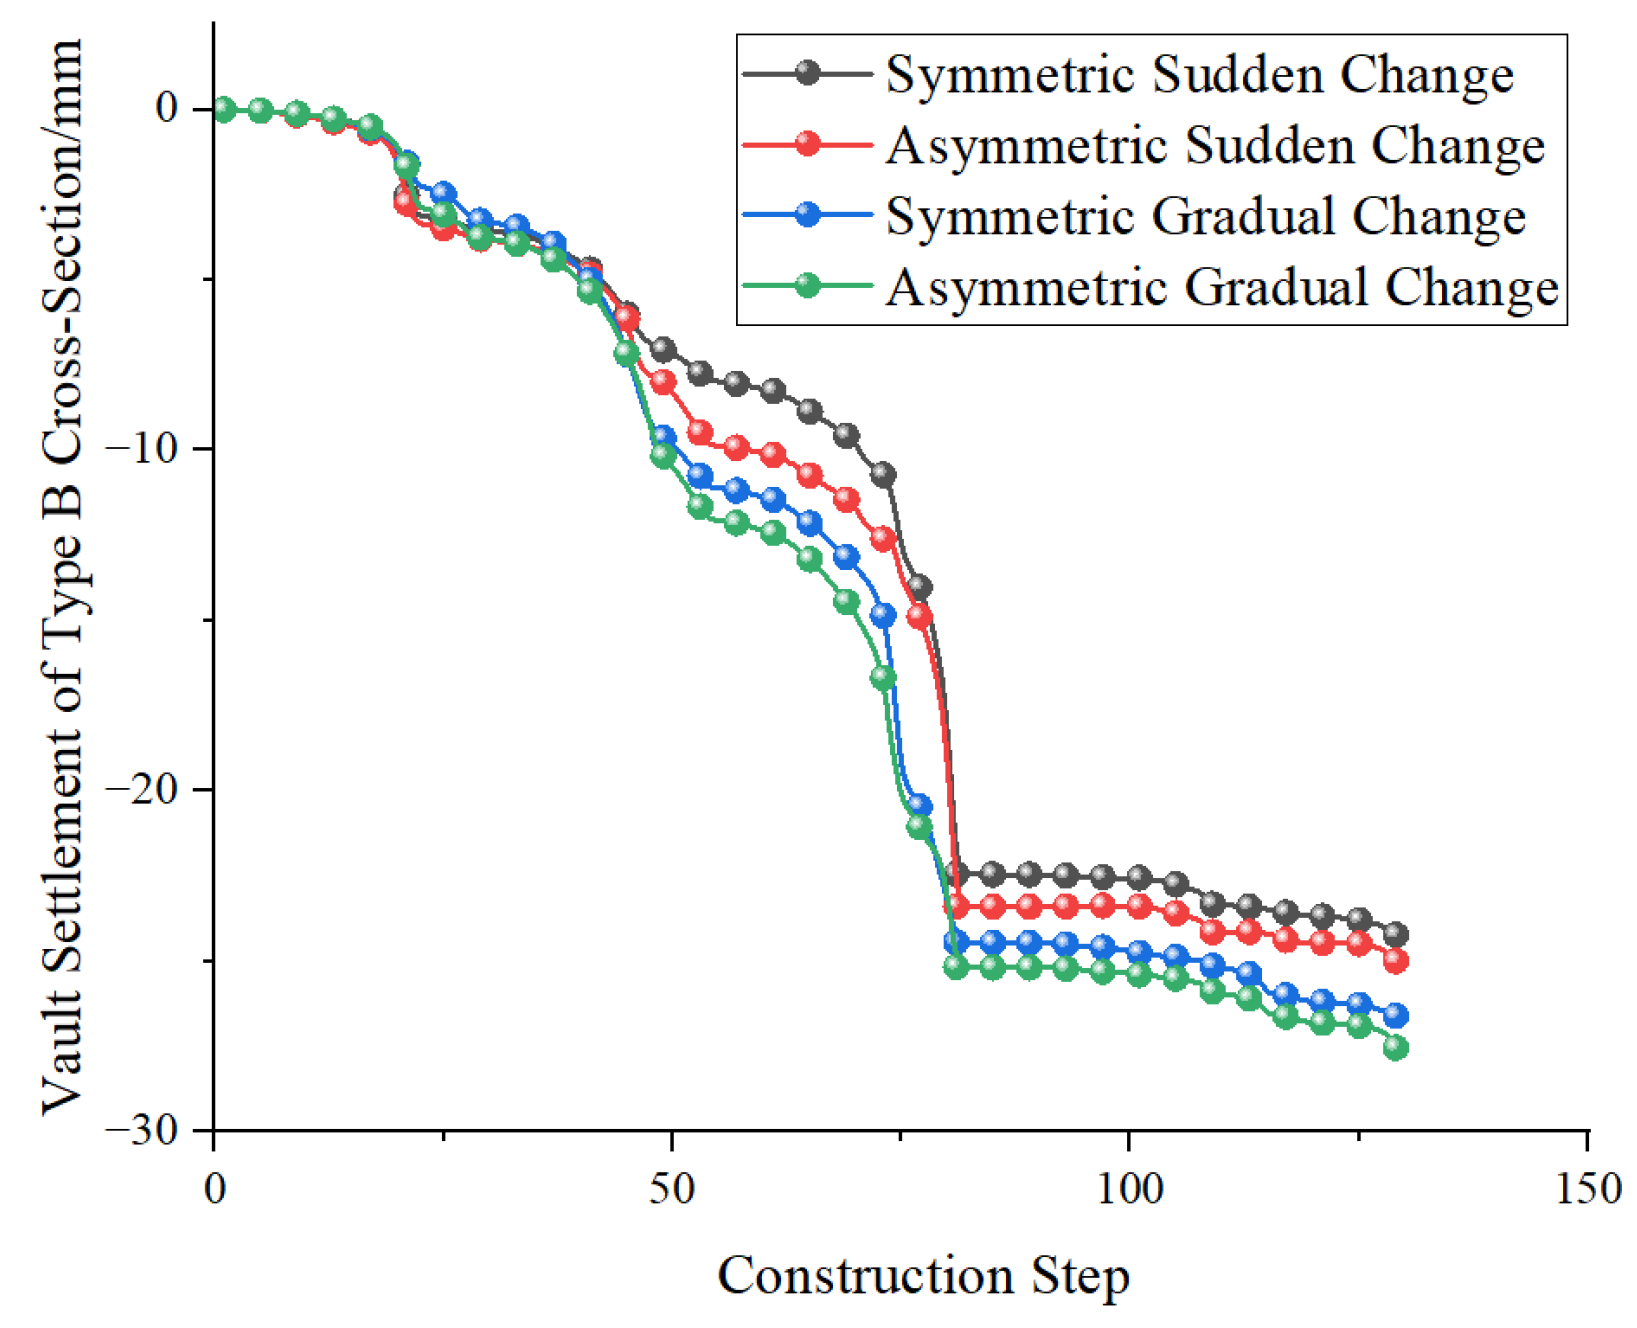
The comparison curve of the vault settlement of the four model sections is shown in Figure 12. The vault settlement curves of the four models also demonstrate an L-type distribution, and the stage of surrounding rock deformation is analogous to that of Monitoring Section A. Prior to the 41st construction step, the deformation of the surrounding rock was gradual, and the settlement of the four models was not significantly different; however, after the excavation of the left- and right-hand sides of the middle bench, the deformation of the surrounding rock was accelerated, and the vault settlement of the two types of sudden-change constructions was less than that of the two types of gradual-change constructions, which were reduced by 38.4% and 32.3%, respectively. Following the excavation of the middle pilot tunnel in the upper and middle benches, the surrounding rock underwent significant changes. As the construction of the tunnel in Monitoring Section A incorporated the implementation of vault reinforcement support measures, the rate of change in the settlement curve of the Monitoring Section B vault exhibited a greater magnitude than that observed in Monitoring Section A. After the excavation of the lower bench, the deformation attained a state of stability. Following the removal of the temporary support, the vault settlement of the sudden-change and gradual-change constructions exhibited varying degrees of sudden change, accounting for approximately 1.8% and 2.9% of the total settlement, respectively. The final settlement values of the symmetrical sudden-change and asymmetric sudden-change constructions were 24.23 mm and 24.99 mm, respectively, which were 9.8% and 10.2% lower than those of the symmetrical gradual-change and asymmetric gradual-change constructions, respectively.
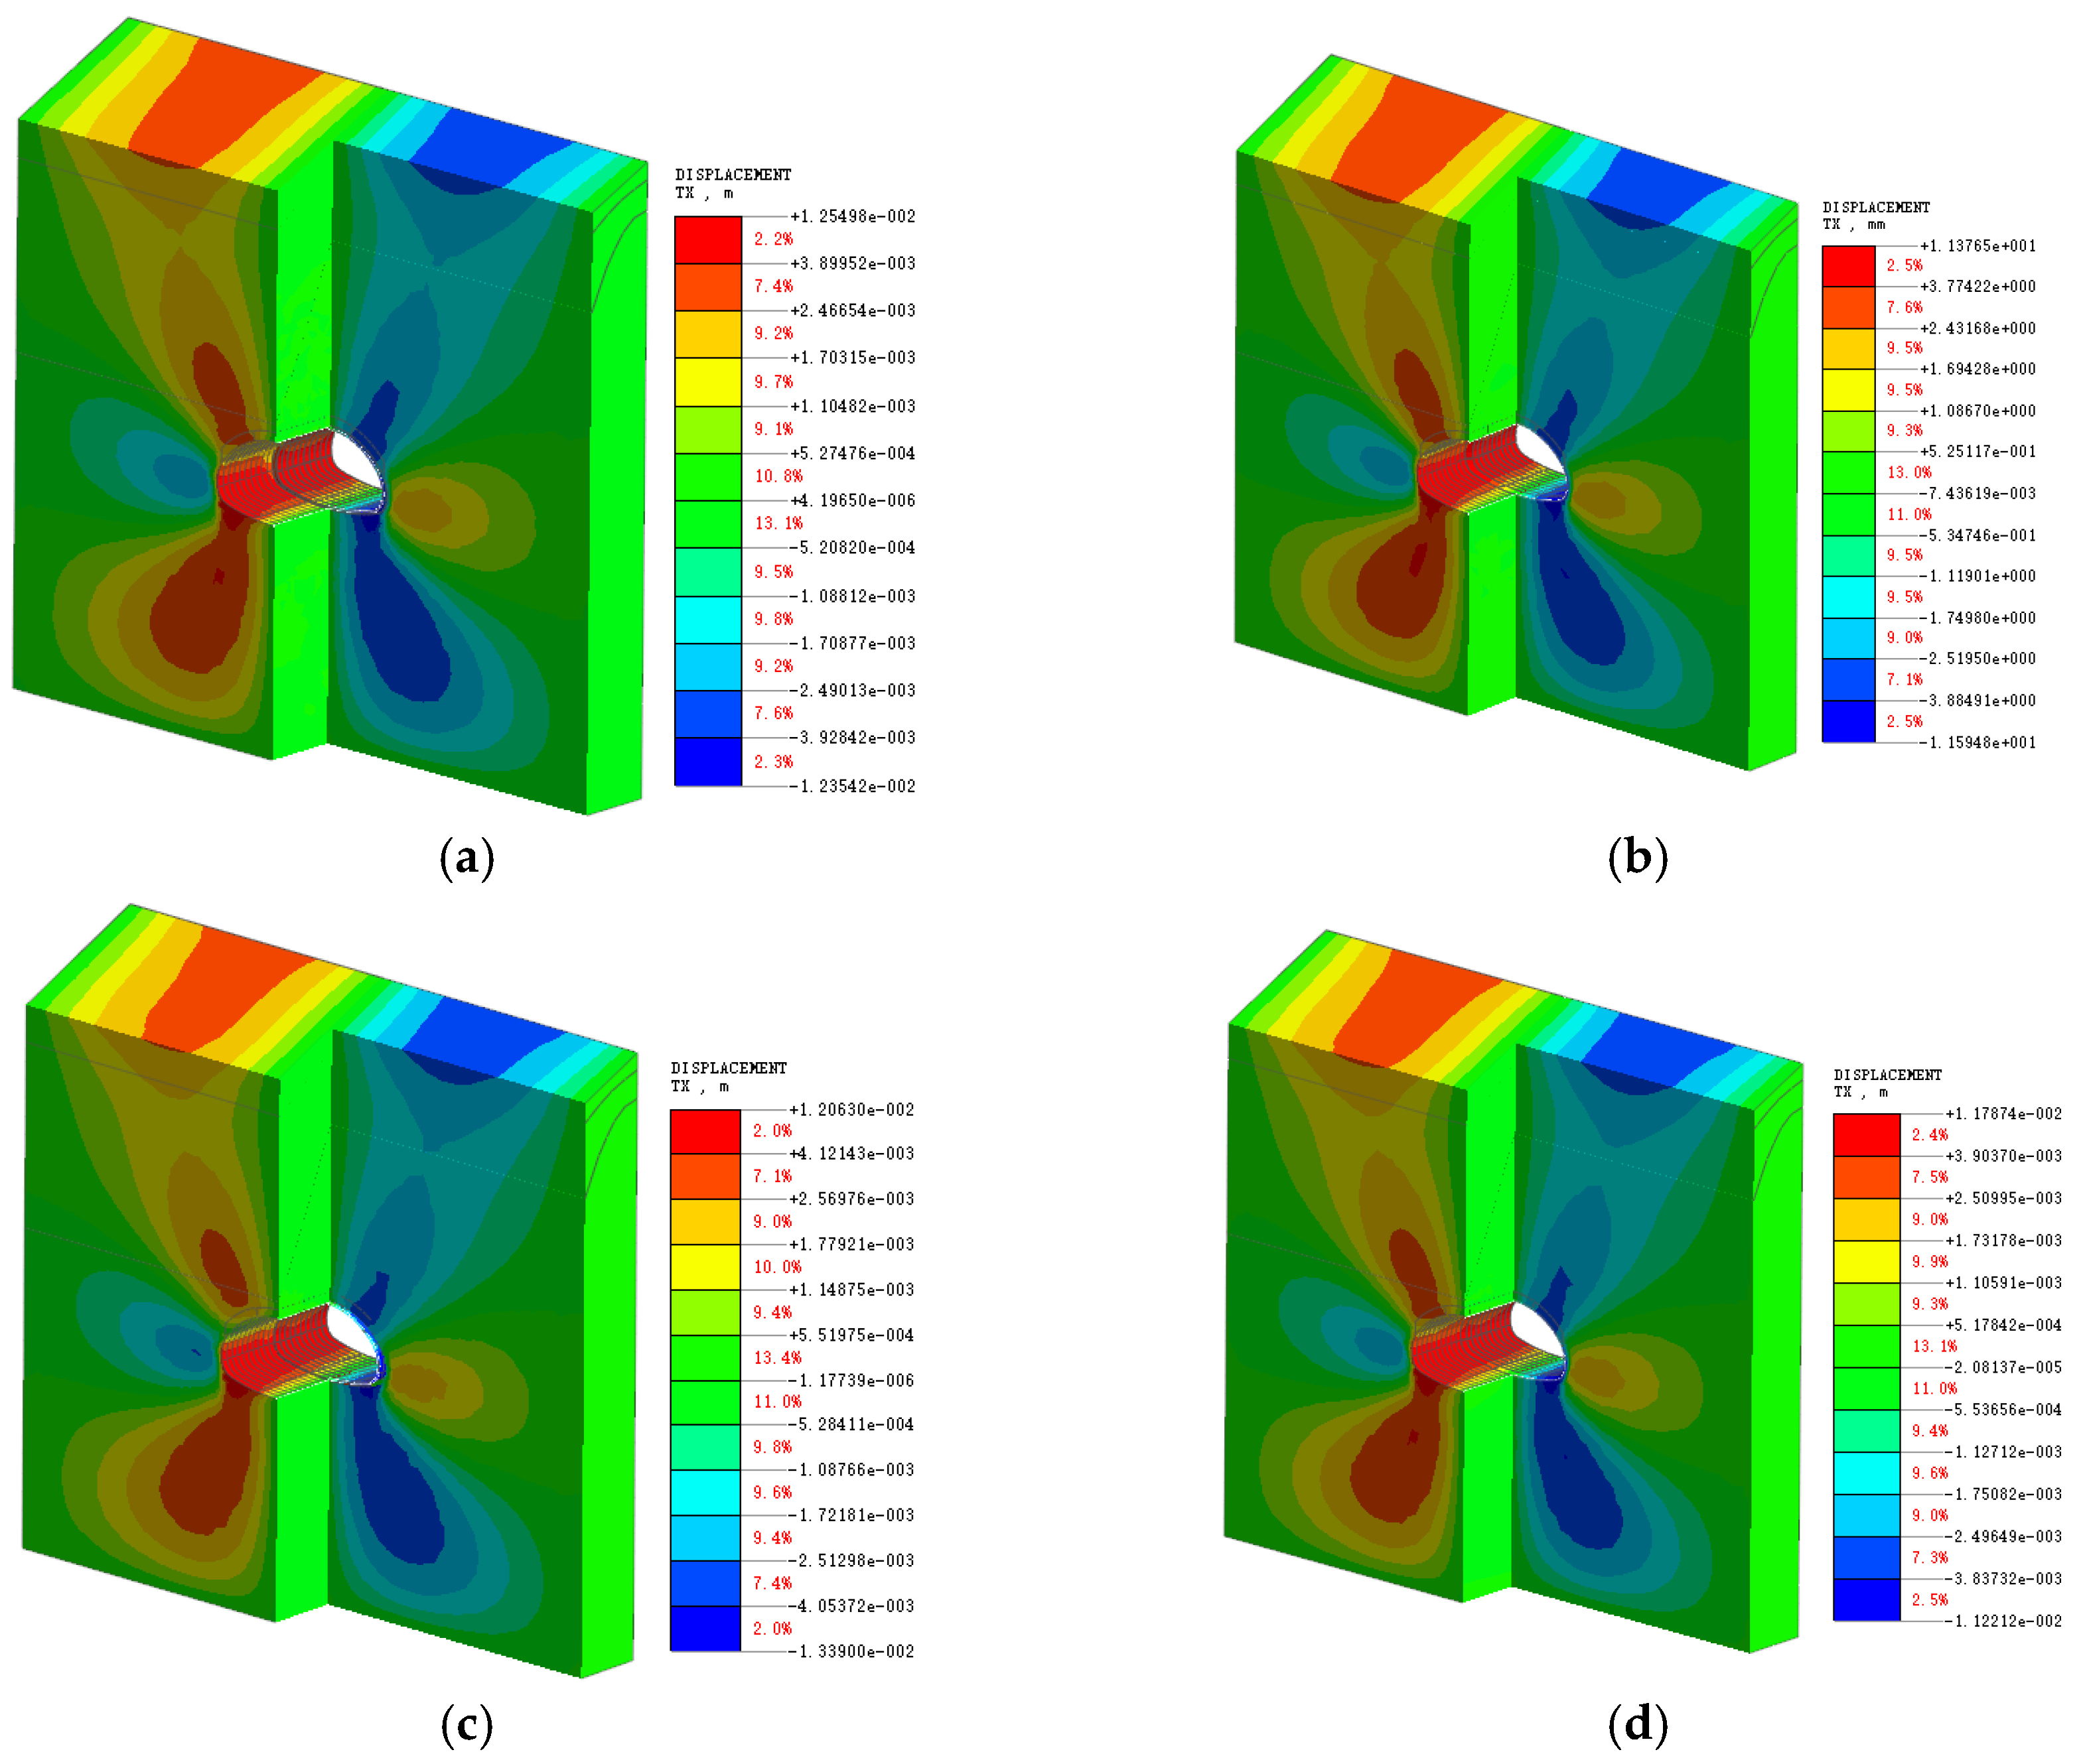
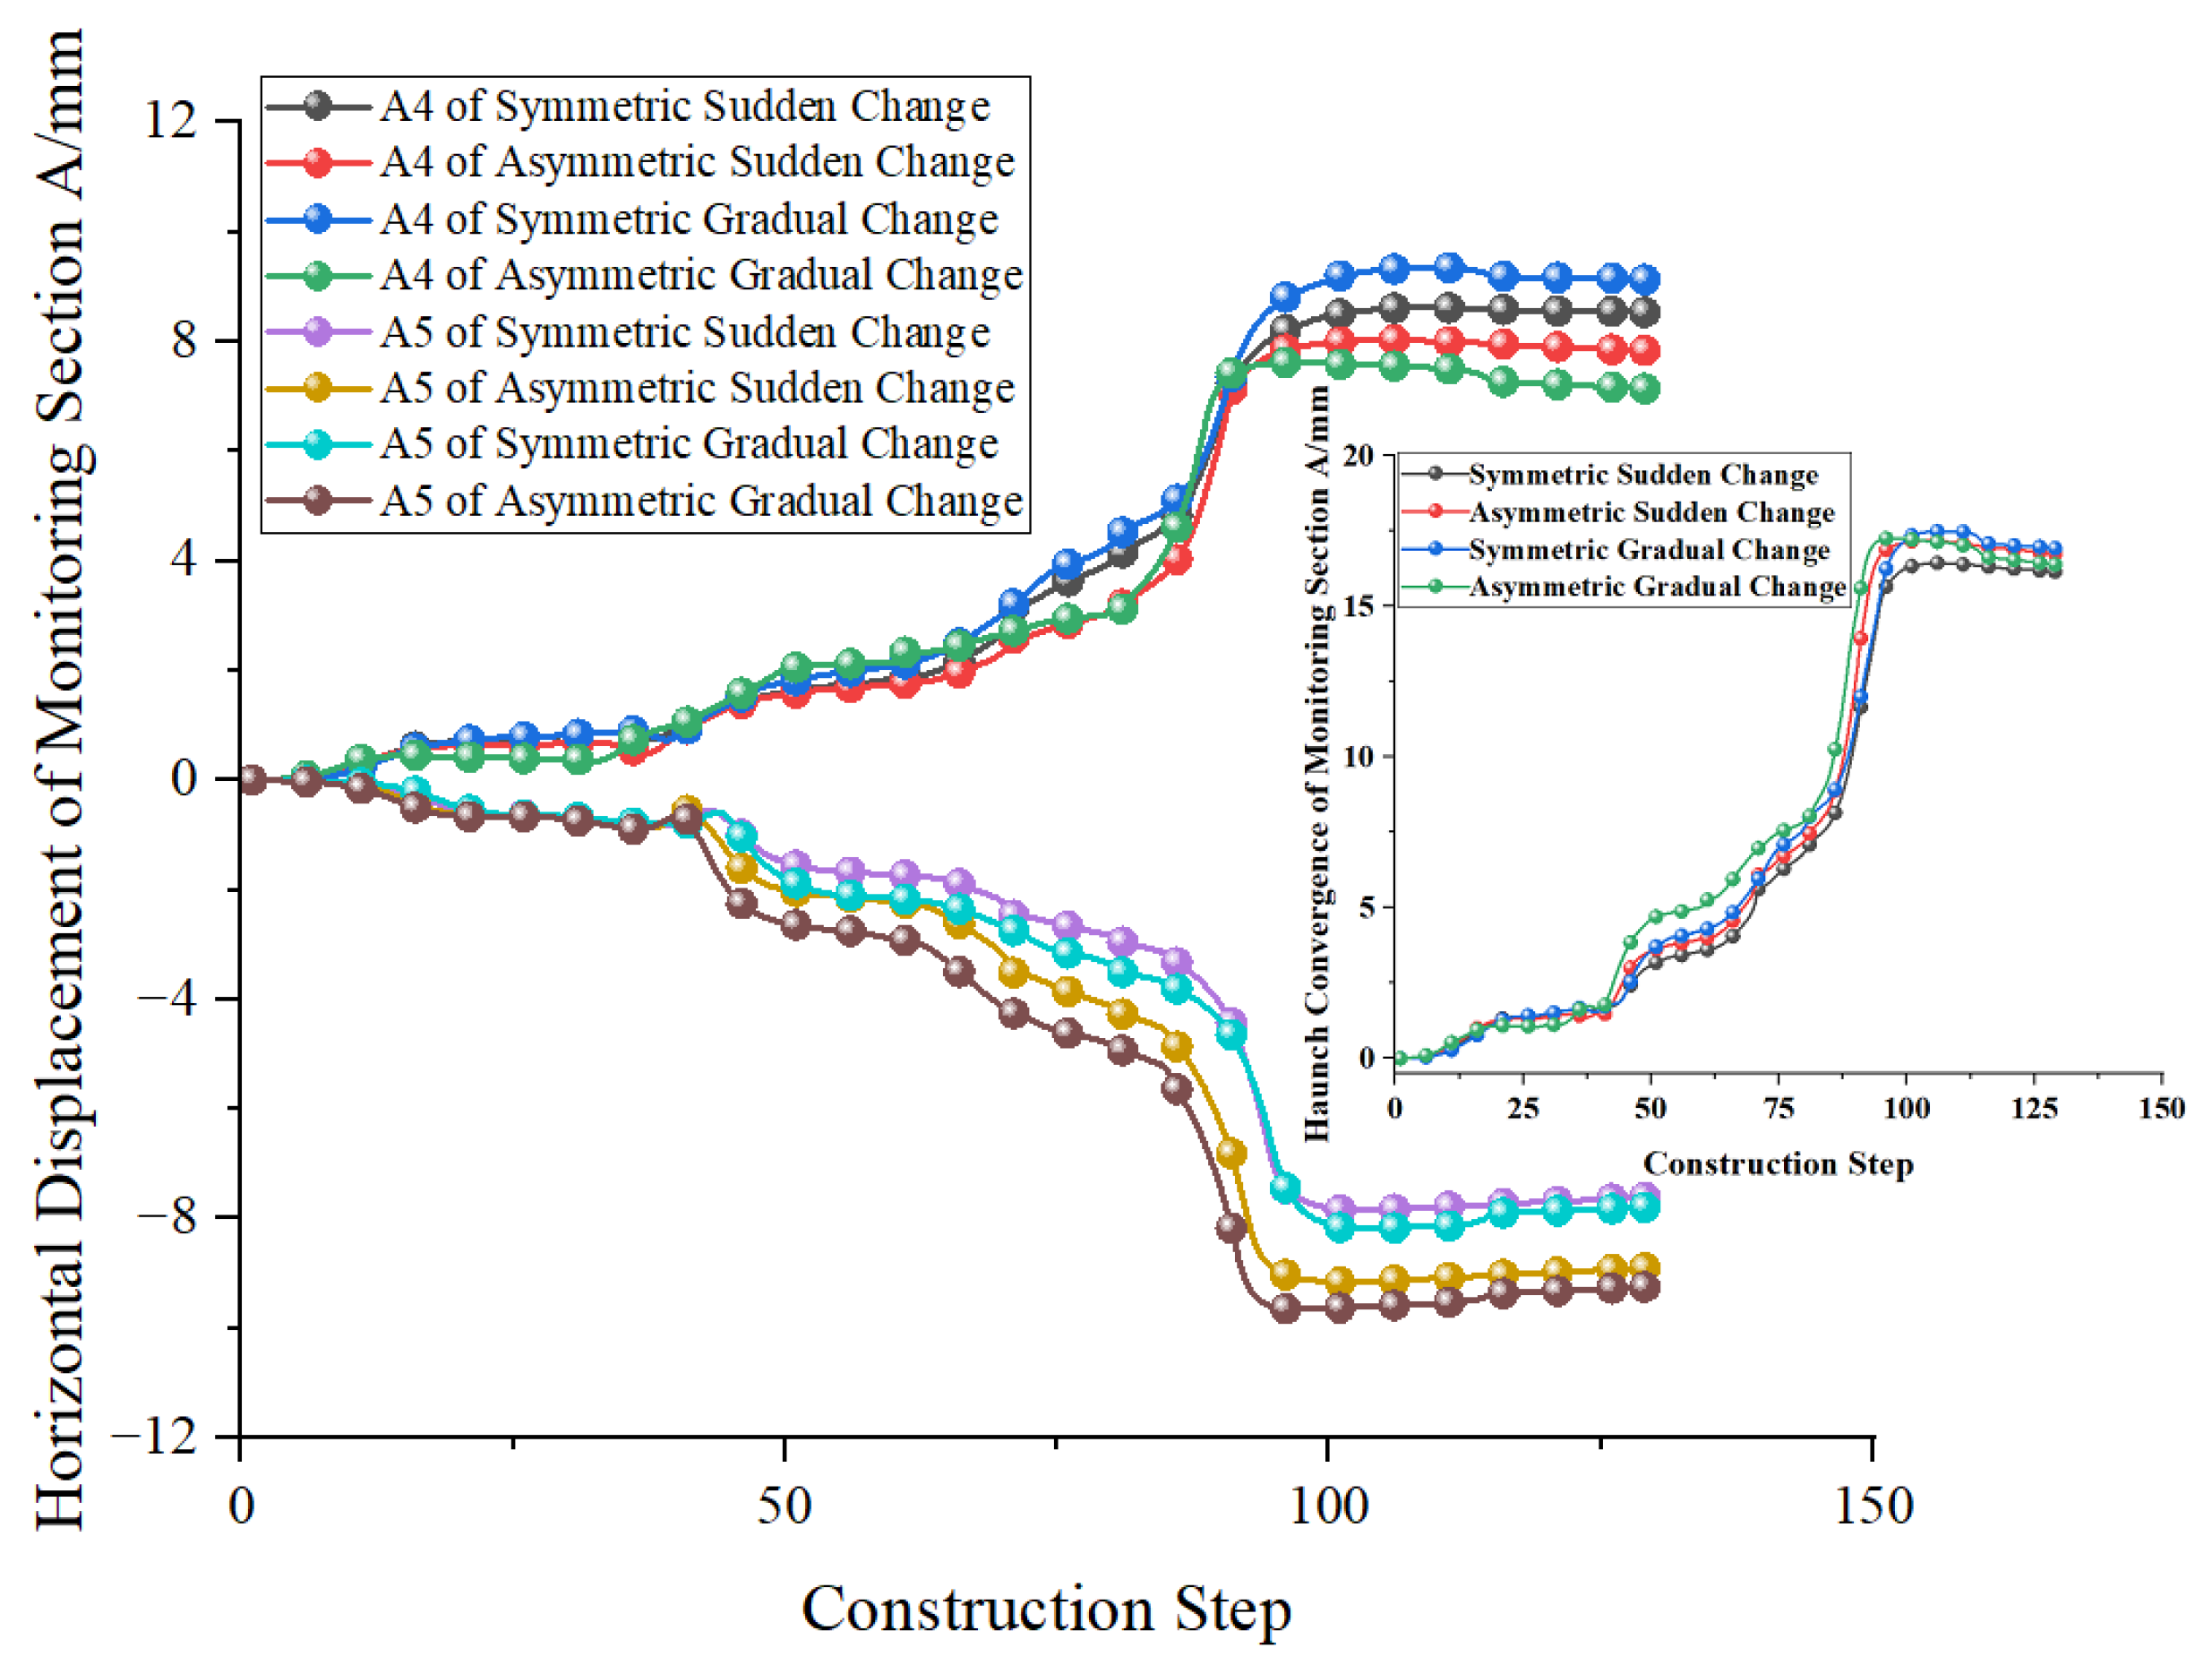
Figure 13 and Figure 14 show the X-axis displacement contour plots for the four models and the horizontal displacement evolution curve for Monitoring Section A, respectively. The horizontal displacement curve resembled the shape of the vault settlement curve; however, the values and trends were different from each other. The deformation of the surrounding rock on the left side of the excavation can be categorized into three distinct stages: slow, rapid, and stable deformation. Prior to the 66th construction step, the deformation of the surrounding rock was relatively slow, and there was no significant difference in the horizontal displacements of the four models. Subsequent to the 70th construction step, that is, following the excavation of the middle pilot tunnel in the upper and middle bench of the tunnel, the surrounding rock underwent rapid deformation. Among them, the horizontal displacements of the two symmetrical constructions increased rapidly, increasing by 14.1% and 12.1% compared with the asymmetric gradual-change and asymmetric sudden-change constructions, respectively. The final displacements of the asymmetric gradual-and sudden-change models were smaller, at 7.15 mm and 7.73 mm, respectively, which were 9.9% and 17.1% lower than those of the symmetrical gradual- and sudden-change models. For the dextral aspect of the excavation, the deformation stage of the surrounding rock was similar to that on the left. Following the onset of rapid deformation of the surrounding rock, the horizontal displacement of the two symmetrical constructions increased gradually, reaching values that were 16.9% and 17.8% lower than those of the asymmetric gradual-change and asymmetric sudden-change constructions, respectively. Following the removal of the temporary support, the horizontal displacements of the four models converged to approximately 4% of the total displacement. The final horizontal displacements of the symmetrical gradual-change and symmetrical sudden-change constructions were 7.79 mm and 7.61 mm, respectively, which were 14.1% and 21.7% lower than those of the asymmetrical gradual-change and symmetrical sudden-change constructions, respectively.
The horizontal displacement curves of Monitoring Section B for the four models are shown in Figure 15. Compared with Monitoring Section A, the horizontal displacement curve of Monitoring Section B was similar in shape and trend, with only slight differences in value. For the left side of the tunnel excavation, the final displacements of the asymmetric gradual-change and asymmetric sudden-change constructions are 7.51 mm and 7.83 mm, respectively, which are 13.7% and 16.7% lower than those of the symmetrical gradual-change and symmetrical sudden-change constructions, respectively. For the right side of the tunnel excavation, the temporary support was removed at 113 construction steps, resulting in a sudden change of approximately 3% in the total displacement in the horizontal displacement of the two symmetrical constructions. Owing to the small span of Monitoring Section B, the removal of the temporary support did not significantly affect the asymmetrical construction. The total displacements caused by the symmetrical gradual-and sudden-change constructions were 9.55 and 9.83 mm, respectively, which were reduced by 10.9 and 13.3%, respectively, compared with those of the asymmetric gradual-and sudden-change constructions.
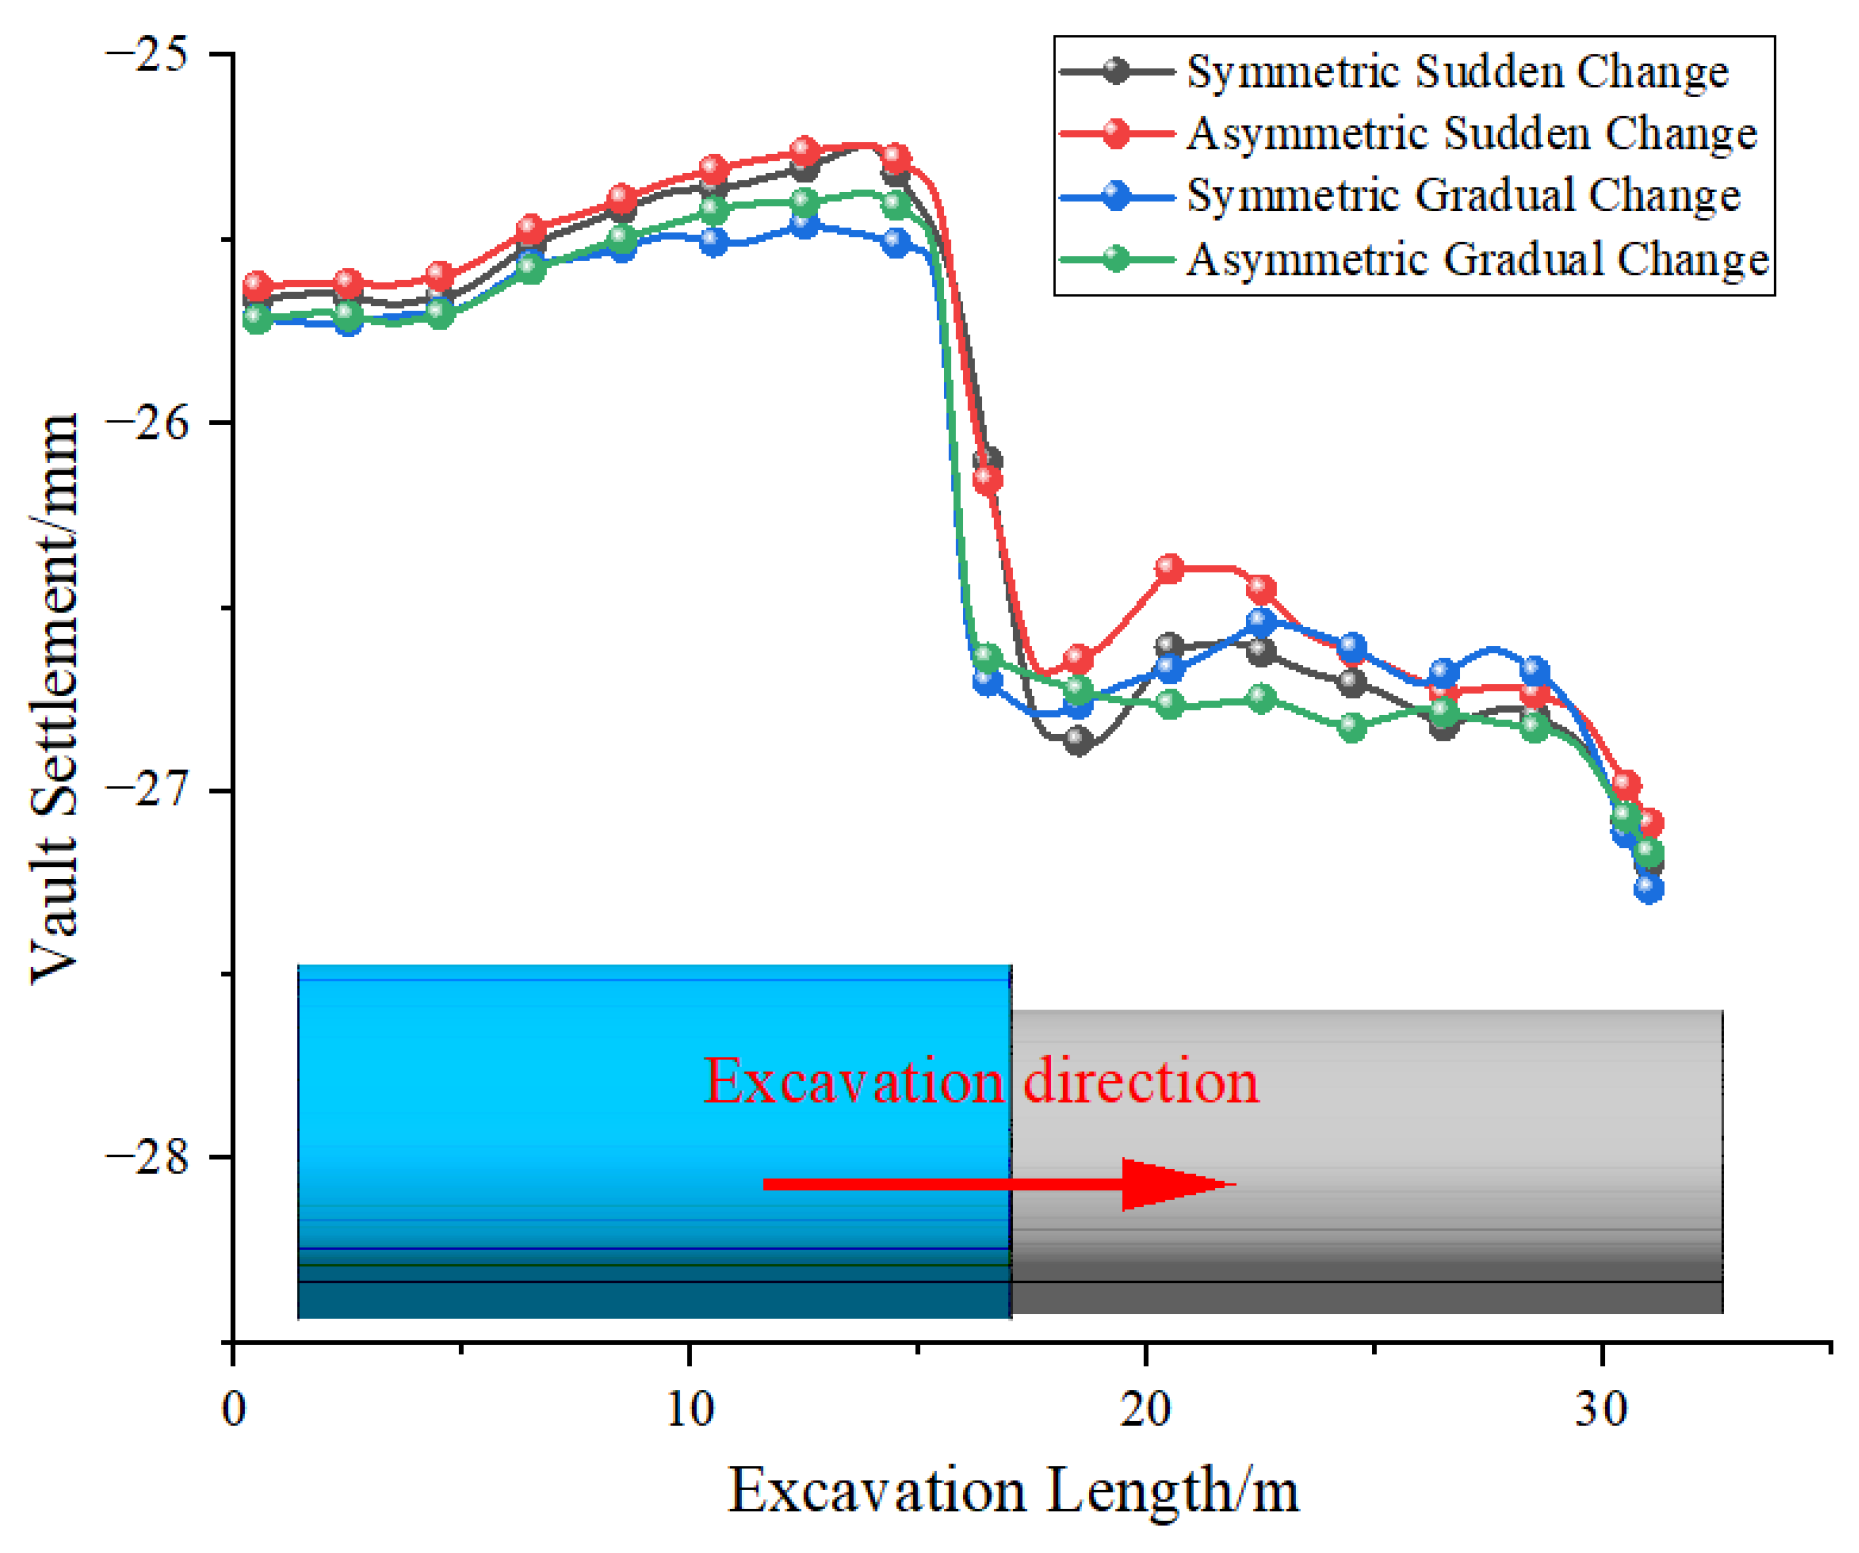
In the numerical simulation, the vault settlement along the direction of tunnel excavation was monitored, and the calculation results are shown in Figure 16. As shown in Figure 16, the overall trend of the vault settlement for the four excavation methods was analogous, with the values exhibiting a high degree of similarity. Concurrently, the influence range of the cross-section changes in the four models remained constant within the range of 12 m before and after the gradient section. The II-shaped section adopts vault-strengthening support, which inhibits the growth of the vault displacement of the tunnel. The vault settlement exhibited a sudden change at the change of the tunnel section, and the sudden change value accounted for 6% of the total vault settlement of the tunnel.

4.2. Surrounding Rock Stress Analysis

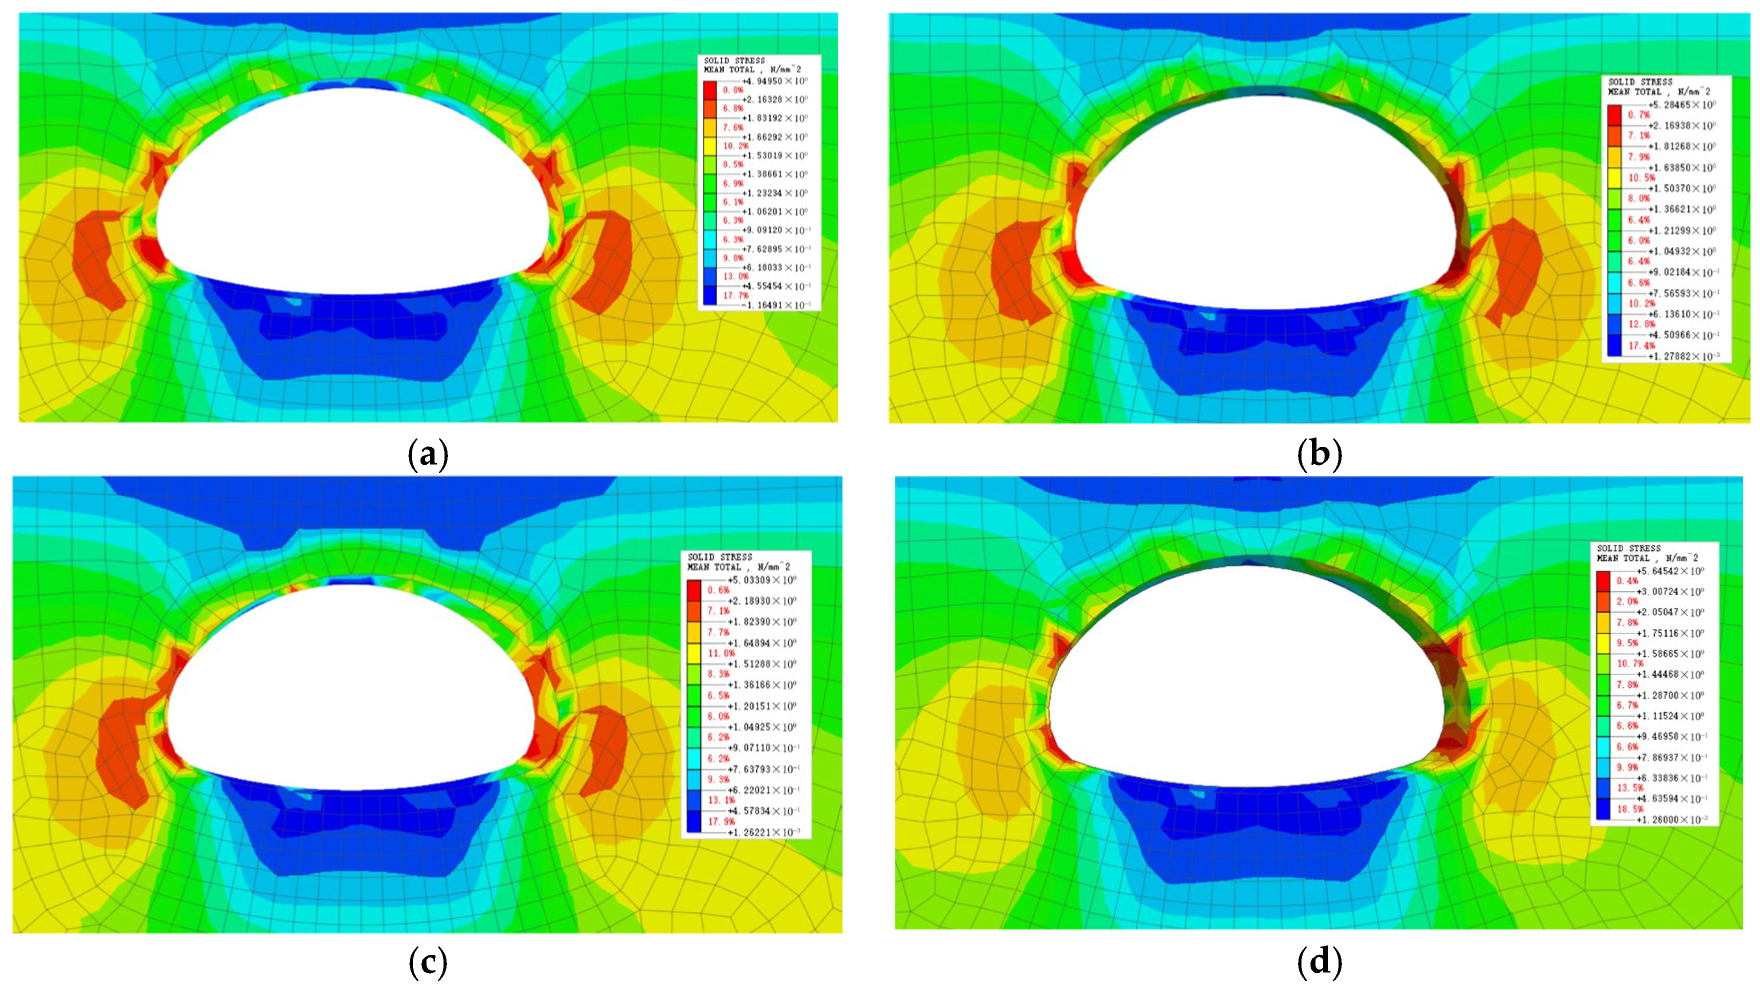
The average effective stress cloud diagrams of the surrounding rock for the four models are shown in Figure 17. After tunnel excavation was completed, the effective stress extreme values of the surrounding rock of the four models appeared at the tunnel arch shoulder and arch waist. The vault and arch bottoms were compressed, and the tunnel arch shoulder and waist were tensioned on both sides. Owing to the advance support of Monitoring Section A, the stress effect outside the influence range of the advance support above the tunnel was more evident. Among them, the stress of the two types of sudden-change construction is small, and the stress concentration at the Monitoring Section change is relatively not obvious, which is better than that of the two types of gradual-change construction. The maximum effective stresses of the symmetrical and asymmetrical sudden-change constructions were 4.95 and 5.03 MPa, respectively. Although the stress of the surrounding rock in symmetrical sudden-change construction is small, considering that symmetrical construction needs to be expanded on both sides, stress concentration can easily occur on both sides; therefore, it is necessary to focus on monitoring the stress to prevent the instability of the surrounding rock. The asymmetric sudden-change construction is unilaterally expanded, and only one side needs to be strengthened. Combined with on-site gradual-change tunnel construction, it is difficult to use a special-shaped steel arch. The asymmetric sudden-change construction in the four models was the best, which is consistent with actual engineering situations.

4.3. Initial Support Stress Analysis

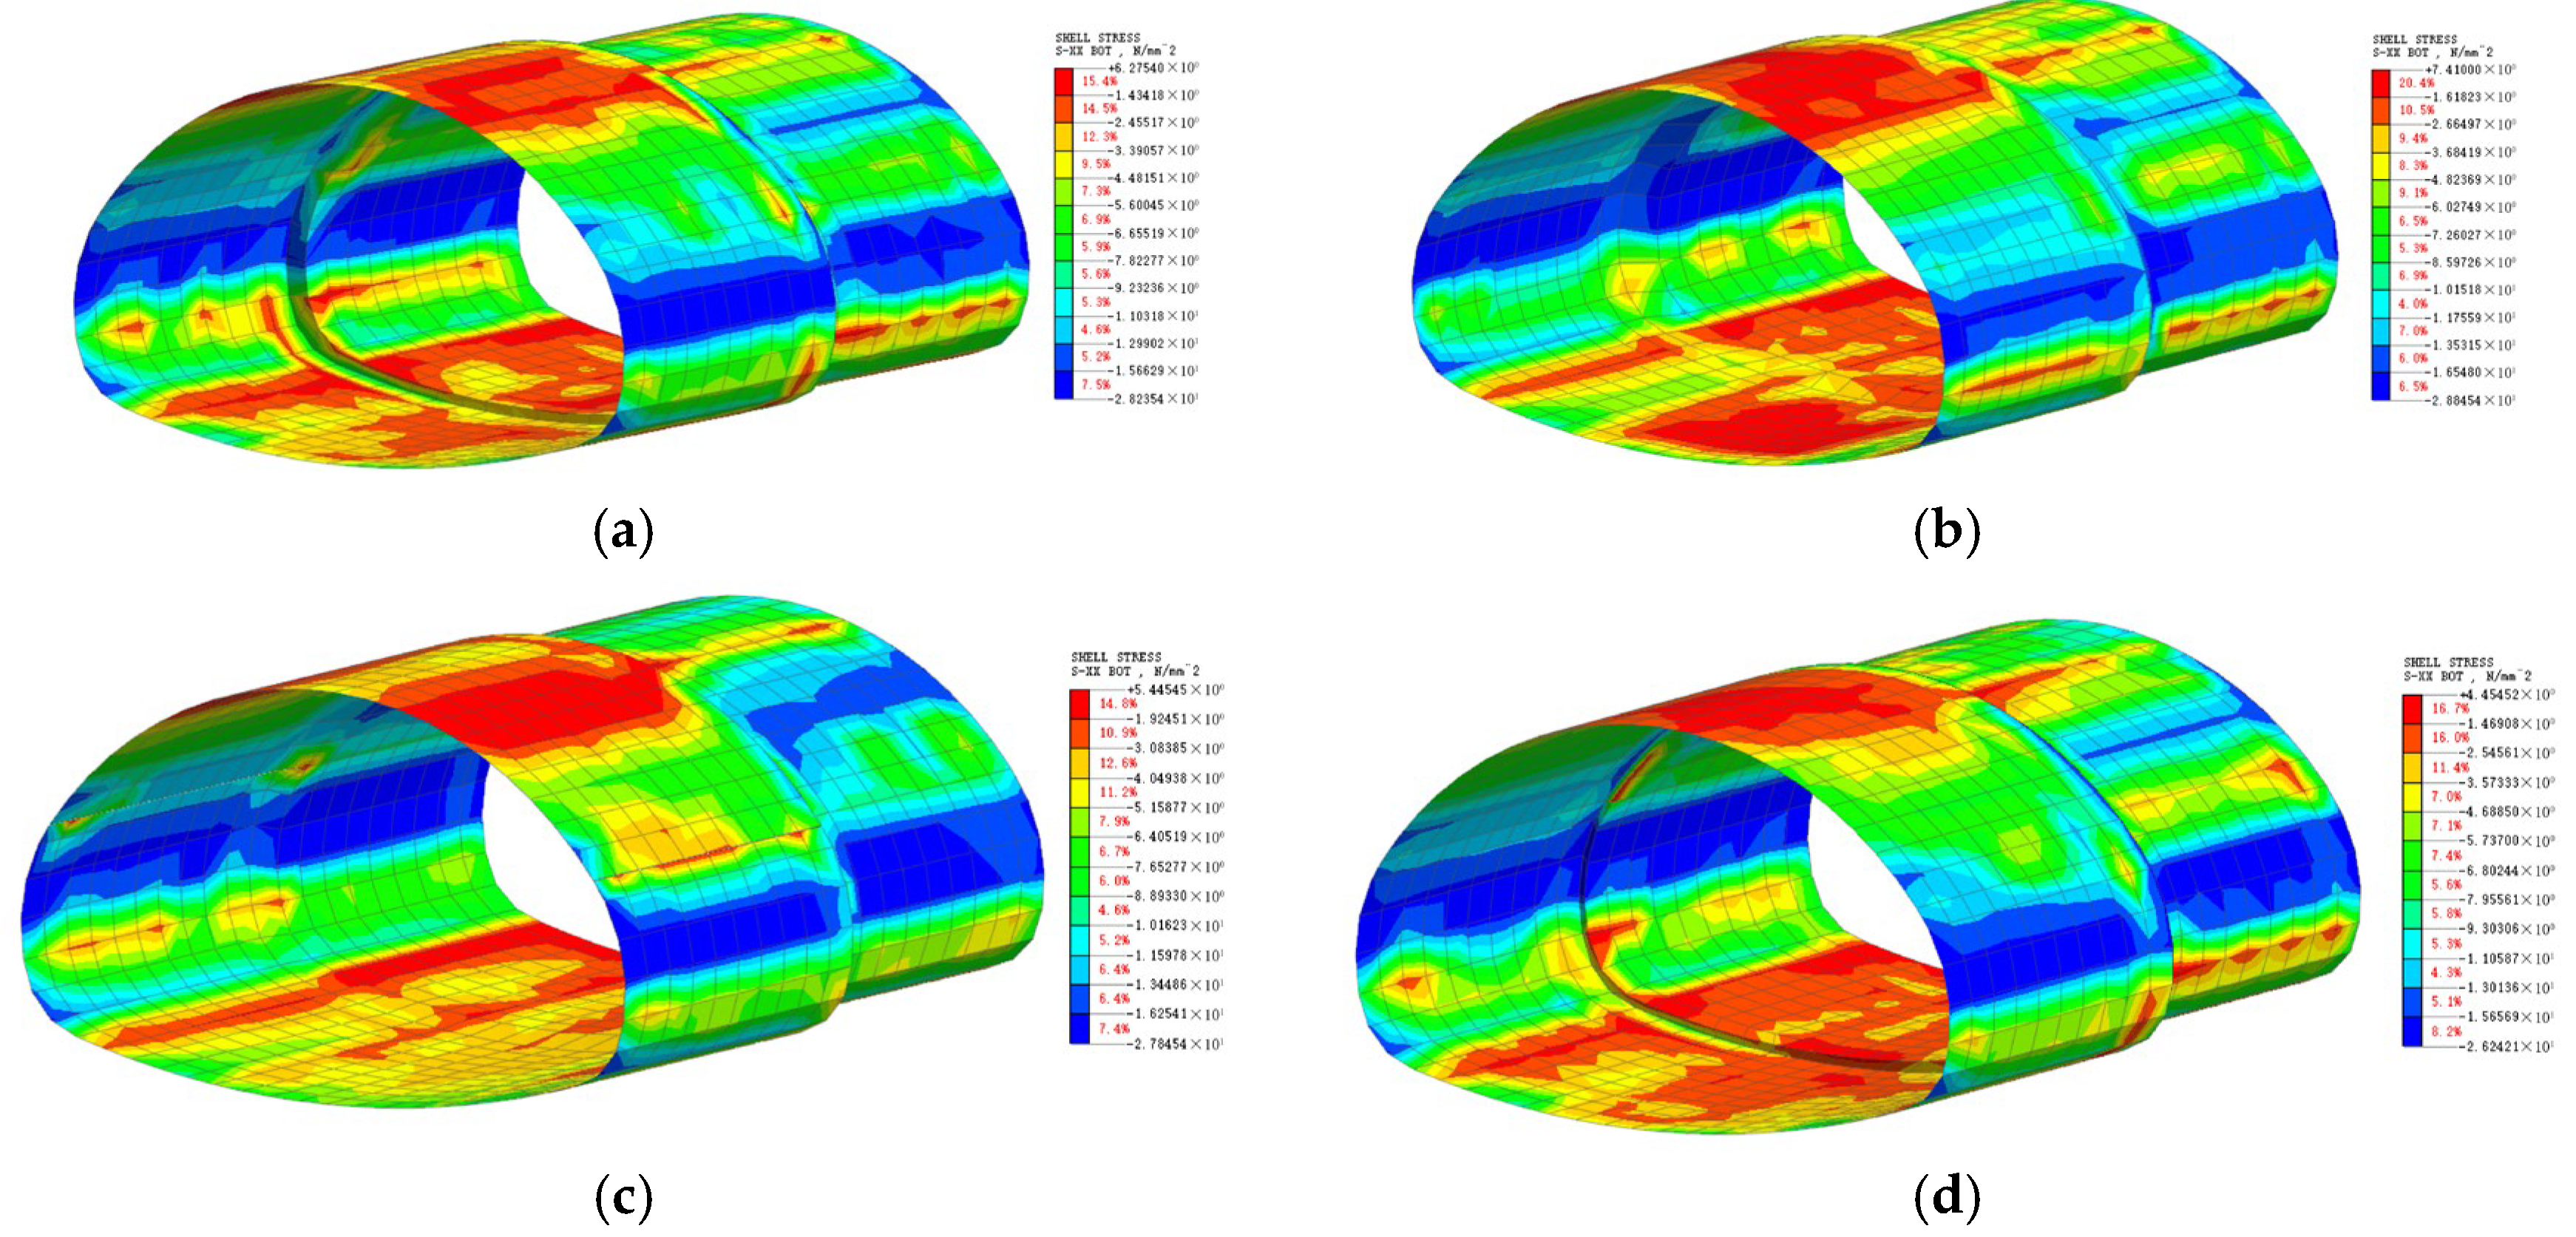
As illustrated in Figure 18, the stress cloud diagram of the initial support is displayed after the conclusion of the four-model excavation. As demonstrated in the accompanying diagram, the stress law governing the initial support of the tunnel under the four excavation methods is consistent. The vault and arch bottom were subjected to compressive stress, whereas the arch shoulder and waist were subjected to tensile stress. The maximum compressive stress was observed at the upper extremity of the Monitoring Section, whereas the maximum tensile stress was detected at the arch waist, coinciding with the transition between the tunnel sections. The stress levels increased significantly at the point where the section changed, and stress concentrations were observed at the tunnel expansion.
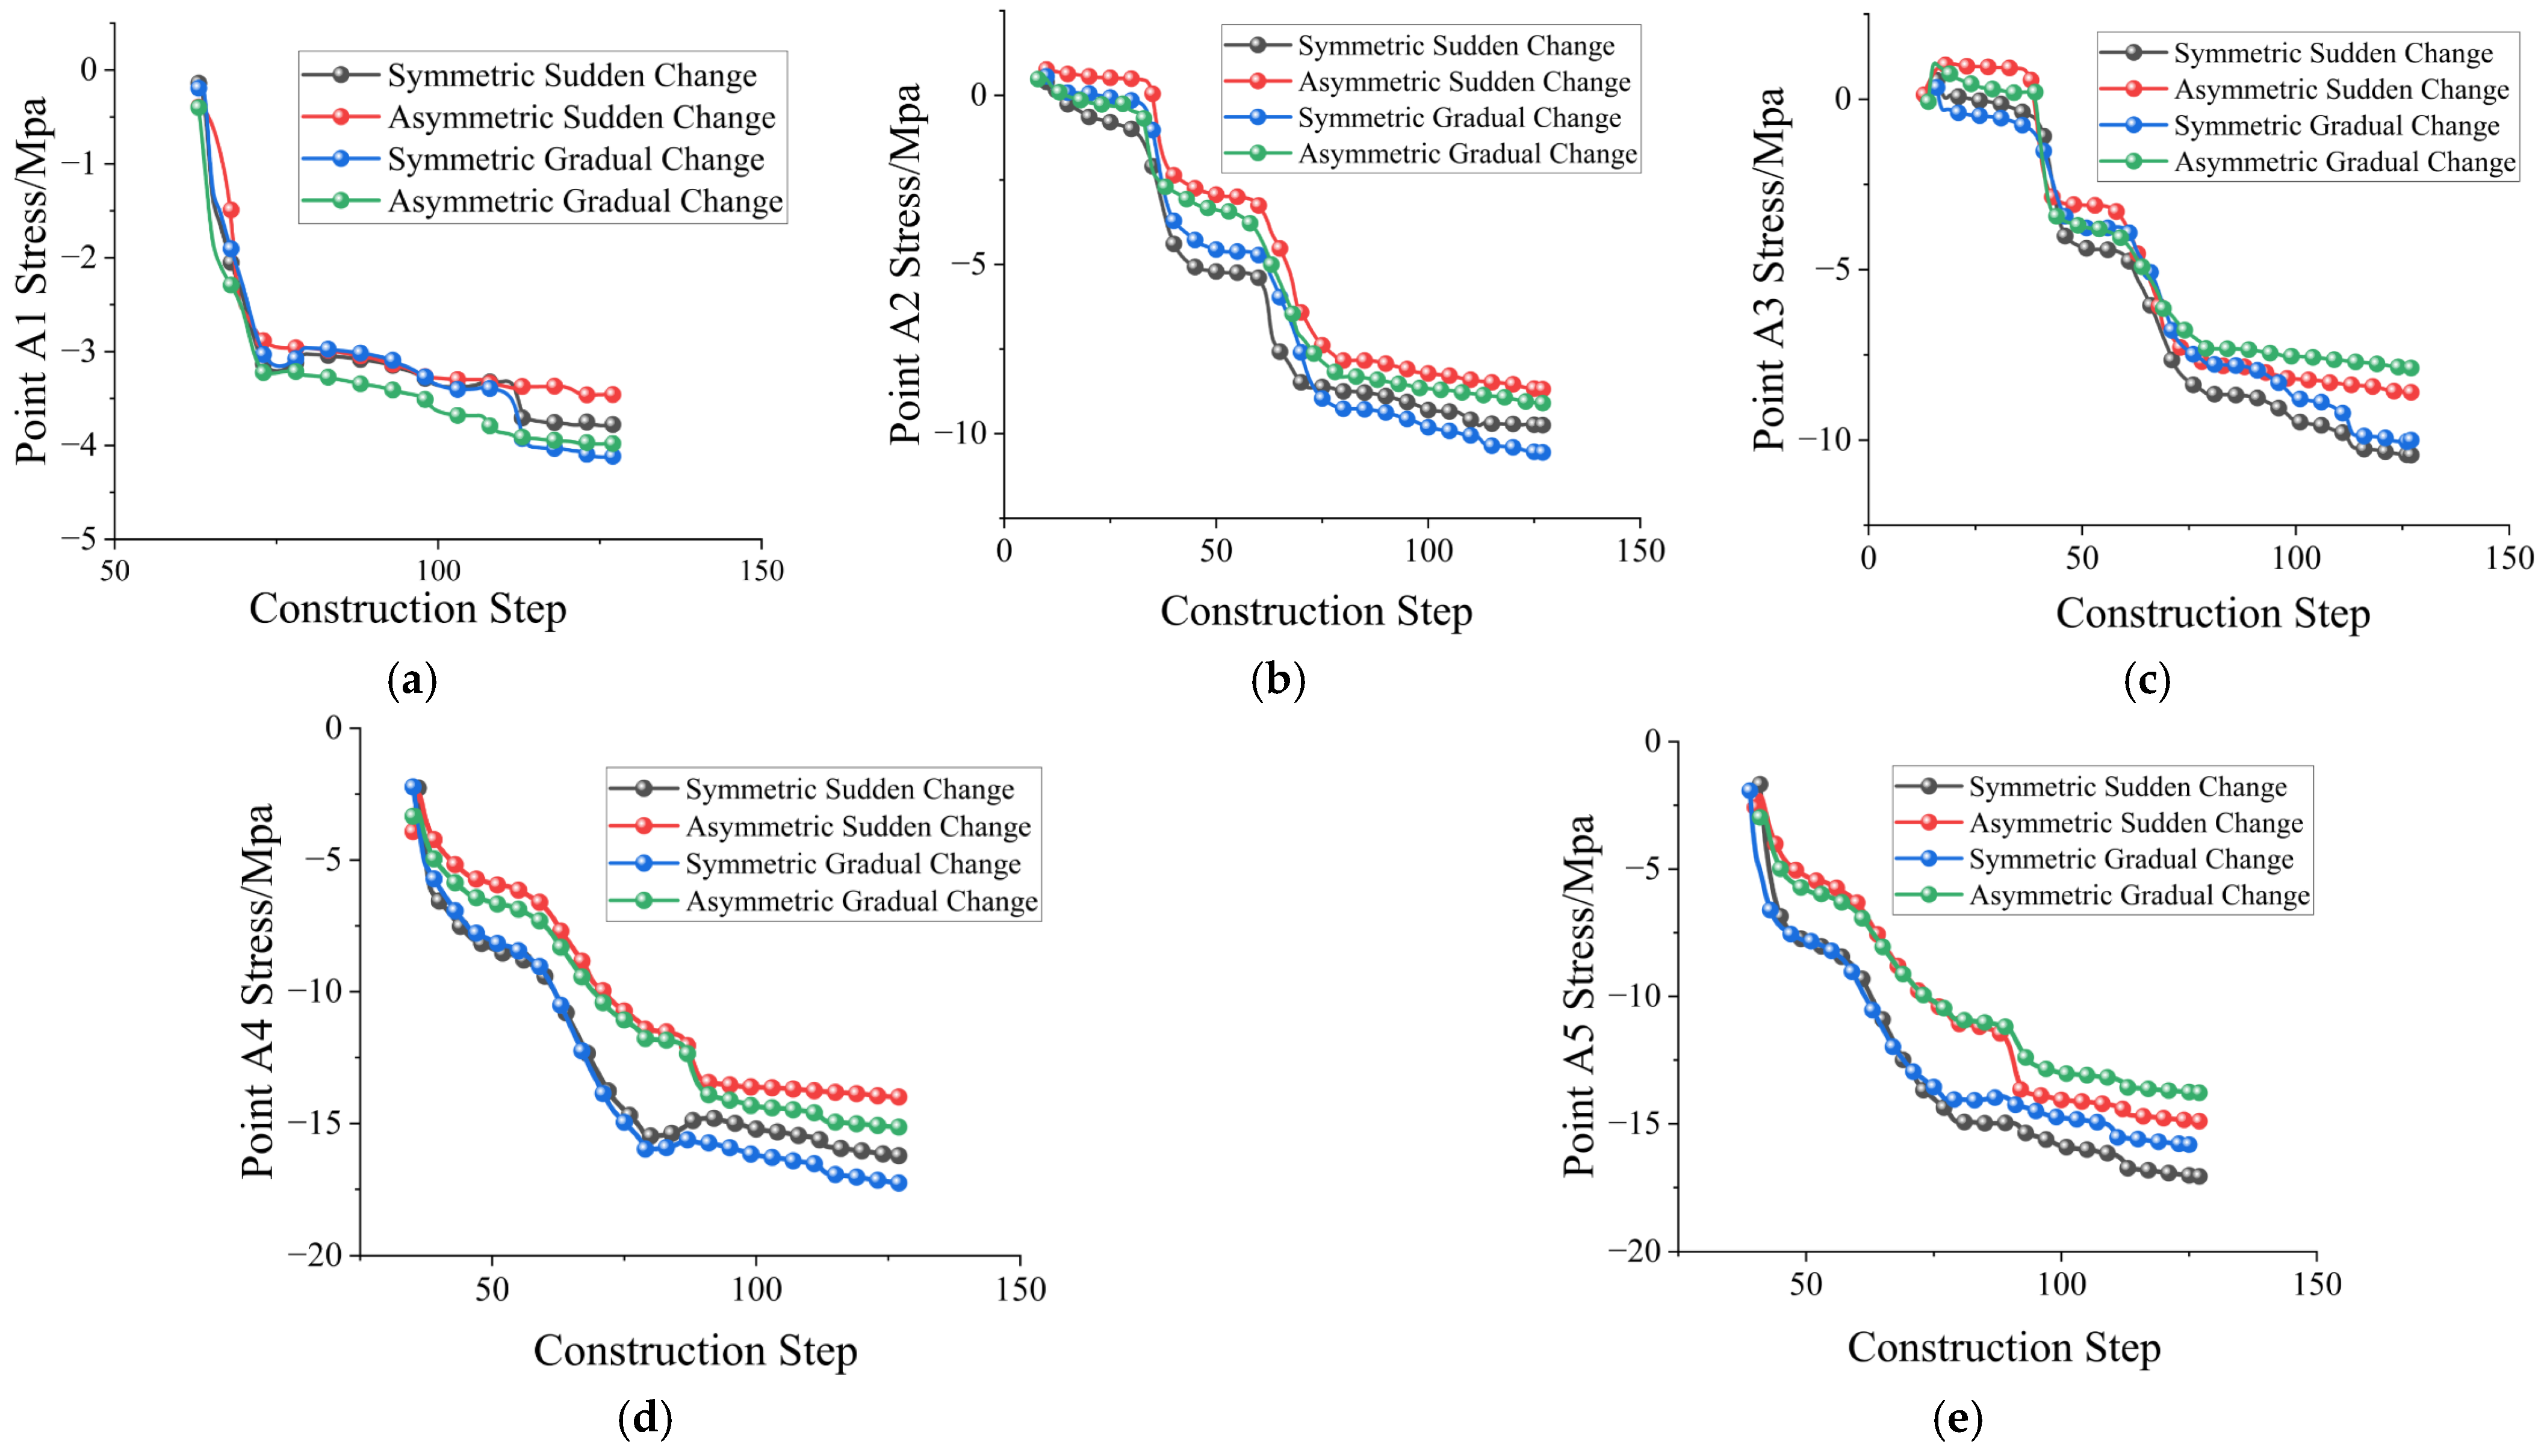
The comparison curve of the initial support stress of Monitoring Section B for the four models is shown in Figure 19. For the A1 monitoring point, the initial support stress increased rapidly during the excavation of the middle bench of the tunnel and gradually became stable after the excavation of the lower bench of the tunnel. The removal of the temporary support causes stress mutations of approximately 0.3 MPa and 0.4 MPa, respectively, in the symmetric and asymmetric gradual-change constructions, respectively, which do not affect the support stress of the two types of sudden-change constructions. For the A2 and A3 monitoring points, the change in the initial support stress curve of the four models can be divided into five stages: slow increase, sharp increase, slow increase, sharp increase, and stability. After the first sharp increase in the A2 monitoring curve, the growth rate of the initial stress of the two gradual-change constructions was higher than that of the two abrupt-change constructions. This situation continues until the completion of tunnel excavation, which increases the final value of the supporting stress in symmetric gradual-change and asymmetric gradual-change construction by 12.3% and 15.9%, respectively, compared with that in abrupt construction, which are 9.75 MPa and 10.55 MPa, respectively. There was no significant difference in the initial stress of the four models in the A3 monitoring curve until the second sharp increase. After excavating the lower bench of the tunnel, the growth rate of the initial support stress of the two gradual-change constructions accelerated. After the temporary support was removed, a sudden change of approximately 6% of the total stress was generated. The final stress values of the symmetric and asymmetric sudden-change constructions were 8.59 MPa and 7.88 MPa, which were 21.5% and 26.9% lower than those of the gradual-change construction, respectively. For the A4 and A5 monitoring points, the initial support stress of the four models began to increase after the excavation of the left and right sides of the middle bench of the tunnel and tended to be stable with the excavation of the lower bench of the tunnel. After the 77th construction step, that is, when the excavation of the upper and middle benches of the tunnel was completed, owing to the high degree of coordinated control of the supporting structure, the stress of the initial support was reduced to a certain extent, but it was still higher than that of the sudden-change construction. The final stress values of the symmetric sudden-change and asymmetric sudden-change constructions at the A4 monitoring point were 13.99 MPa and 15.14 MPa, which were reduced by 15.9% and 14.0%, respectively, compared with those of the gradual-change construction. The removal of temporary support did not significantly affect the results. The final values of symmetric and asymmetric sudden-change construction stresses at the monitoring point of A5 were 14.89 MPa and 13.78 MPa, respectively. The removal of the temporary support caused a mutation of approximately 1.5% of the total stress, which was reduced by 14.7% and 14.9%, respectively, compared with the final value of the gradual-change construction stress. The removal of the temporary support had a greater impact on the gradual-change construction, and the stress mutation value accounted for approximately 6% of the total stress.
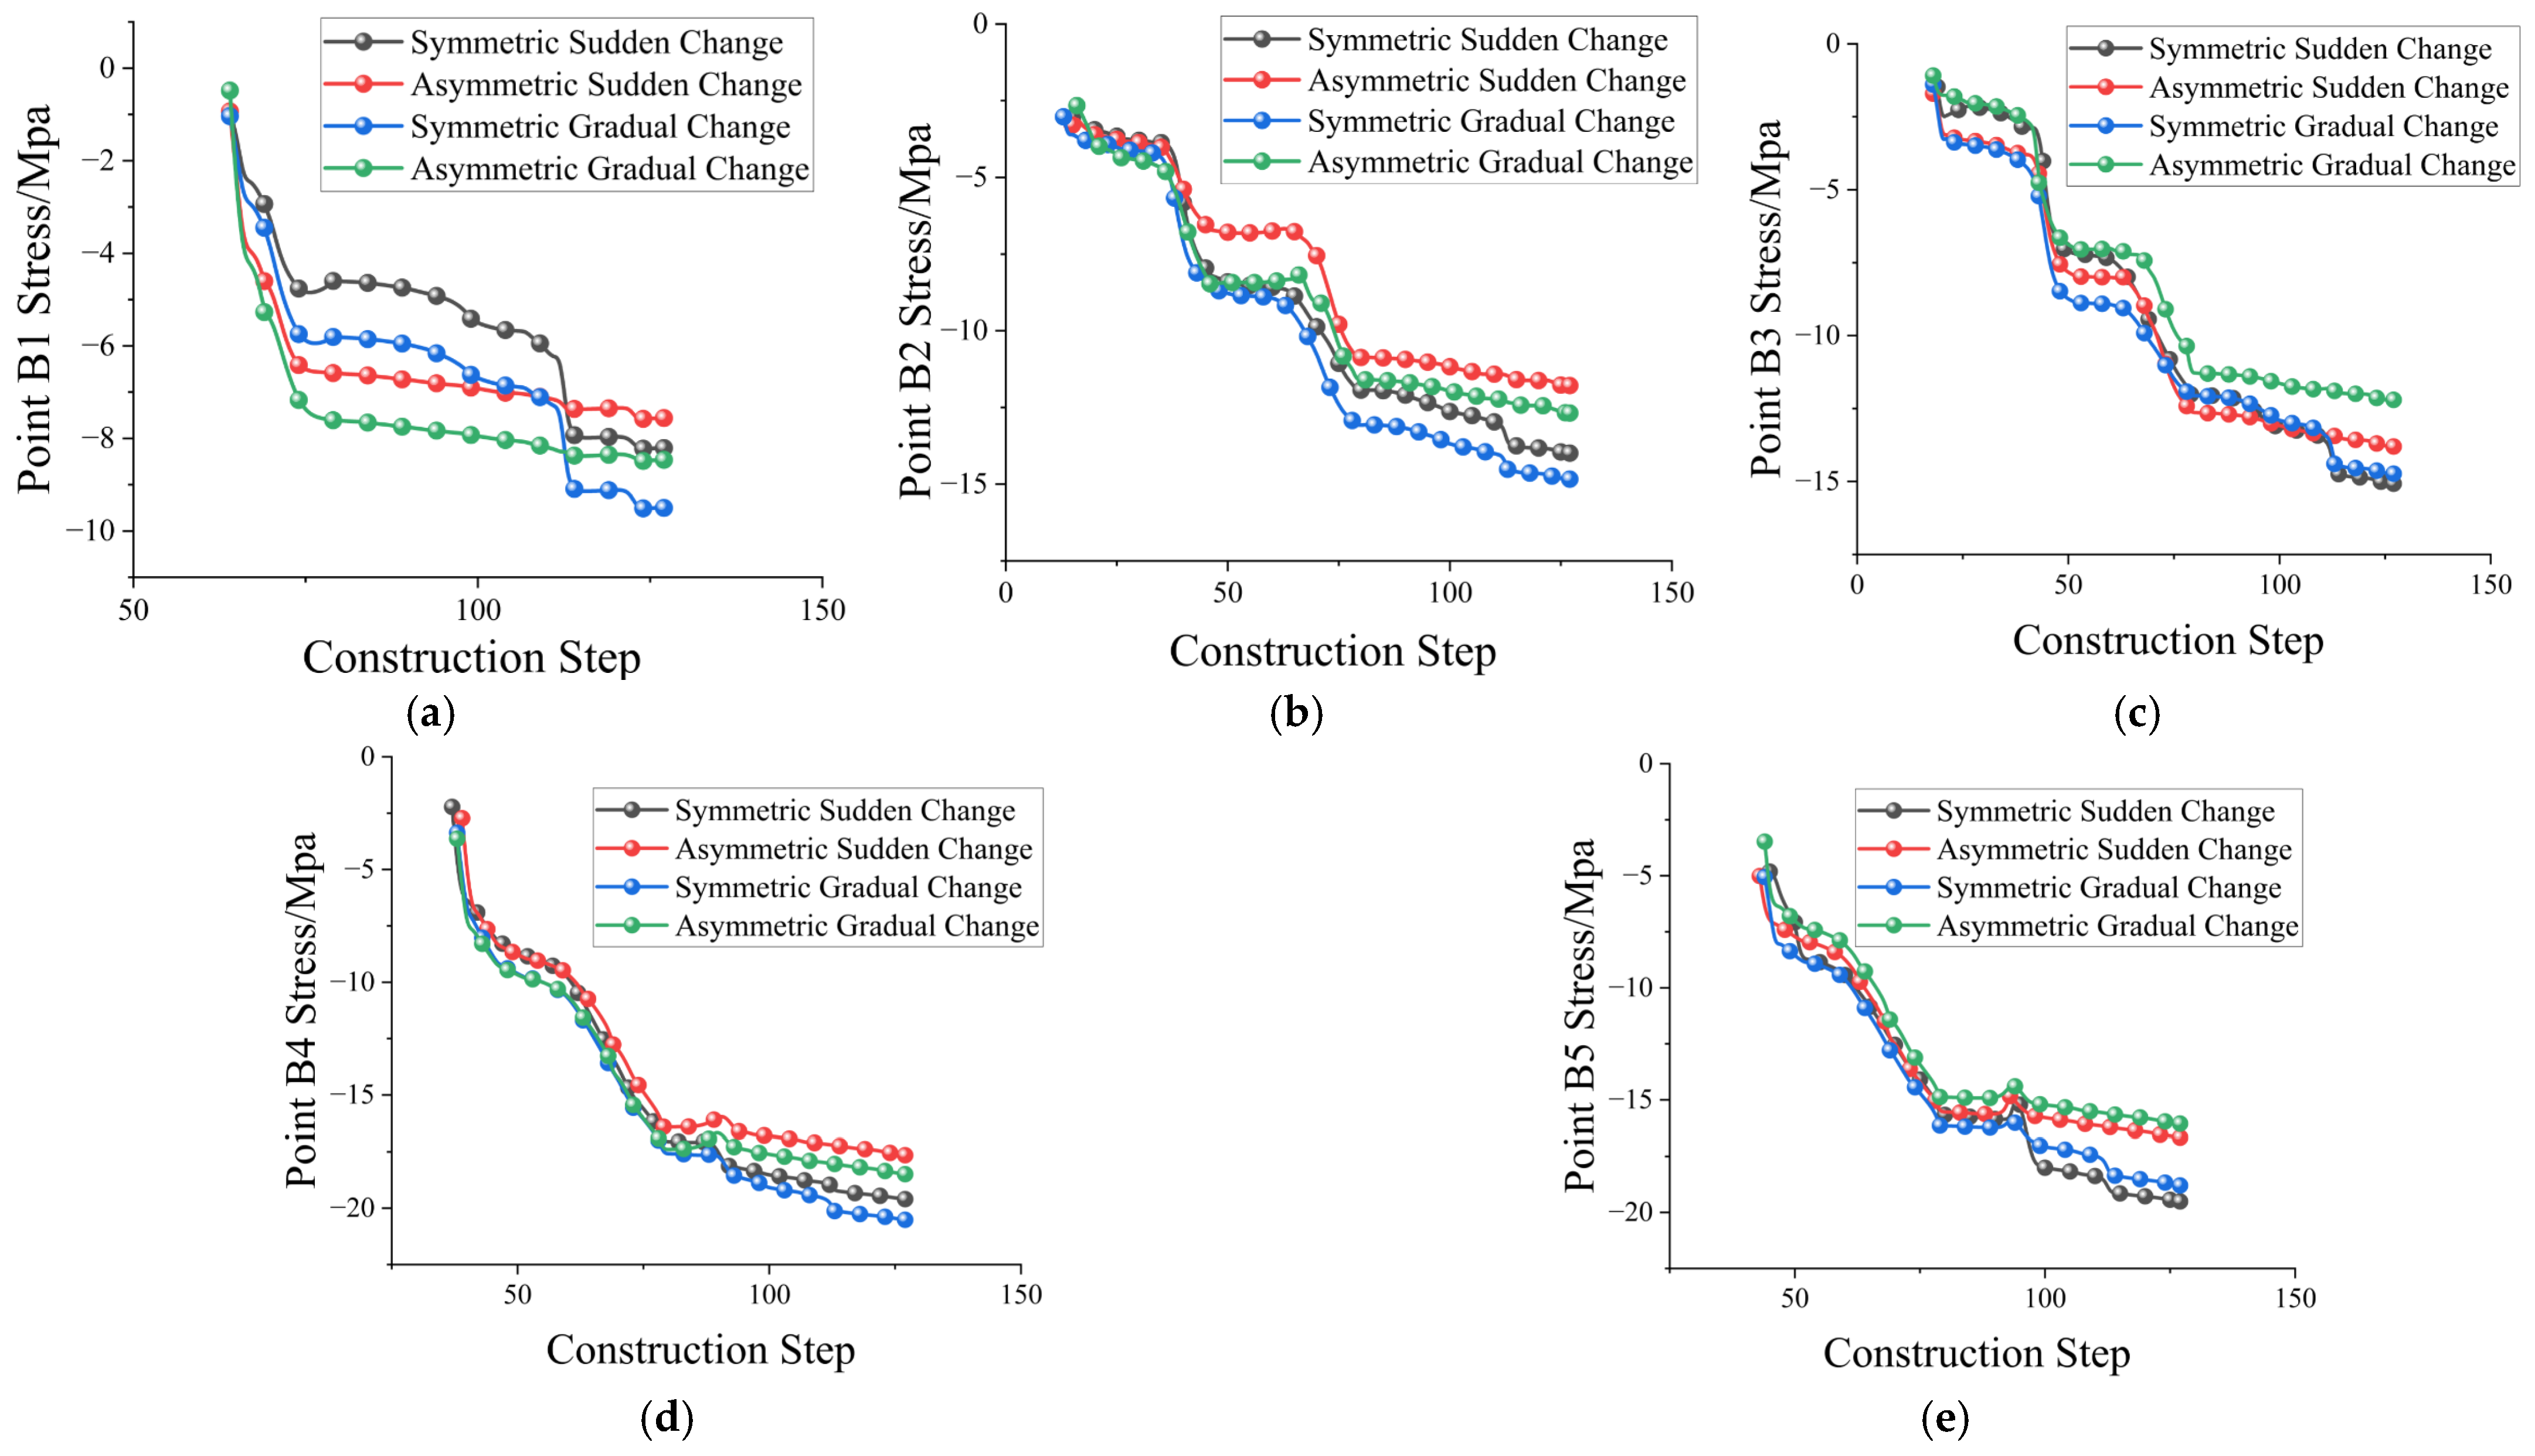
The stress change curve of the initial support of Section Monitoring Section B of the four models are shown in Figure 20: The trend of the stress change curve of monitoring points B1, B2, and B3 was similar to that of Monitoring Section A, differing only in value and change rate. For the B1 monitoring point, the growth rate and final value of the initial support stress were higher than those of the A1 monitoring point because the tunnel section was not reinforced by the vault. The change stages of the B2 and B3 monitoring curves were the same as those of Monitoring Section A, which were divided into five stages: slow increase, sharp increase, slow increase, sharp increase, and stability. The final stress values of the B2 monitoring point sudden-change construction were 11.79 and 12.68 MPa, which were 18.8% and 17.0% lower than those of the symmetric gradual-change and asymmetric gradual-change constructions, respectively. The final stress values of the symmetric sudden-change and asymmetric sudden-change constructions at the B3 monitoring point were 13.80 MPa and 12.20 MPa, respectively, which were reduced by 9.4% and 13.1%, respectively, compared with the gradual-change construction. For the B4 and B5 monitoring points, the change curve of the initial support stress was divided into four stages: rapid change, slow increase, rapid increase, and stability. The supporting stress increased rapidly after the pilot tunnel was excavated on the left and right sides of the middle bench, and the growth rate slowed when the pilot tunnel was excavated in the upper middle bench. After the support of the pilot tunnel on the left and right sides of the lower bench, the stress decreased to a certain extent and then tended to be stable. The final stress value law of monitoring points B4 and B5 was exactly the same as that of B2 and B3. The final stress value of the symmetric sudden-change construction at the B4 monitoring point was the smallest, at 17.65 MPa, followed by the asymmetric sudden change, which was 18.49 MPa, which was 11.4% and 10.8% lower than that of the gradual-change construction, respectively. For the B5 monitoring point, the final stress values of the asymmetric sudden-change and symmetric sudden-change constructions are the lowest, at 16.05 MPa and 16.66 MPa, respectively, which are 16.8% and 17.0% lower than those of the gradual-change construction. The removal of the temporary support causes a large stress mutation in the initial support of the gradual-change construction. Sudden changes of approximately 15%, 5%, 7%, and 4% of the total stress were produced at the monitoring points B1, B2, B3, and B5, respectively. The two types of sudden-change construction only produced approximately 0.8% and 2% stress mutations in B1 and B5, respectively.

4.4. Analysis of Bolt Axial Force

The axial forces of the four model bolts are shown in Figure 21. As shown in the figure, the axial force of the bolt was mainly concentrated at the arch waist of the tunnel. The maximum axial force of the bolt in the four excavation methods was distributed at the arch waist of the tunnel. Among them, the tension of the bolt at the arch waist of Monitoring Section A of the asymmetric gradual-change construction was the largest, followed by the symmetric gradual-change construction, which was 684.4 kN and 662.2 kN, respectively, which was 6.8% and 11.5% higher than that of the sudden-change construction. The maximum pressure of the anchor bolt appeared at the vault of Monitoring Section B, and the pressures of the symmetric and asymmetric sudden-change constructions were larger, at 138.8 kN and 93.8 kN, respectively. Compared with the two gradual-change constructions, it increased by 77.6% and 42.8%, respectively. This indicates that the stress at the arch shoulder of the gradual-change construction is large, and the stress should be monitored to prevent the instability of the supporting structure. The support of the sudden change in the vault is relatively weak, and the axial force of the bolt can be reduced by strengthening the vault support of Monitoring Section B.

5. Field Monitoring and Result Analysis

5.1. Monitoring Scheme

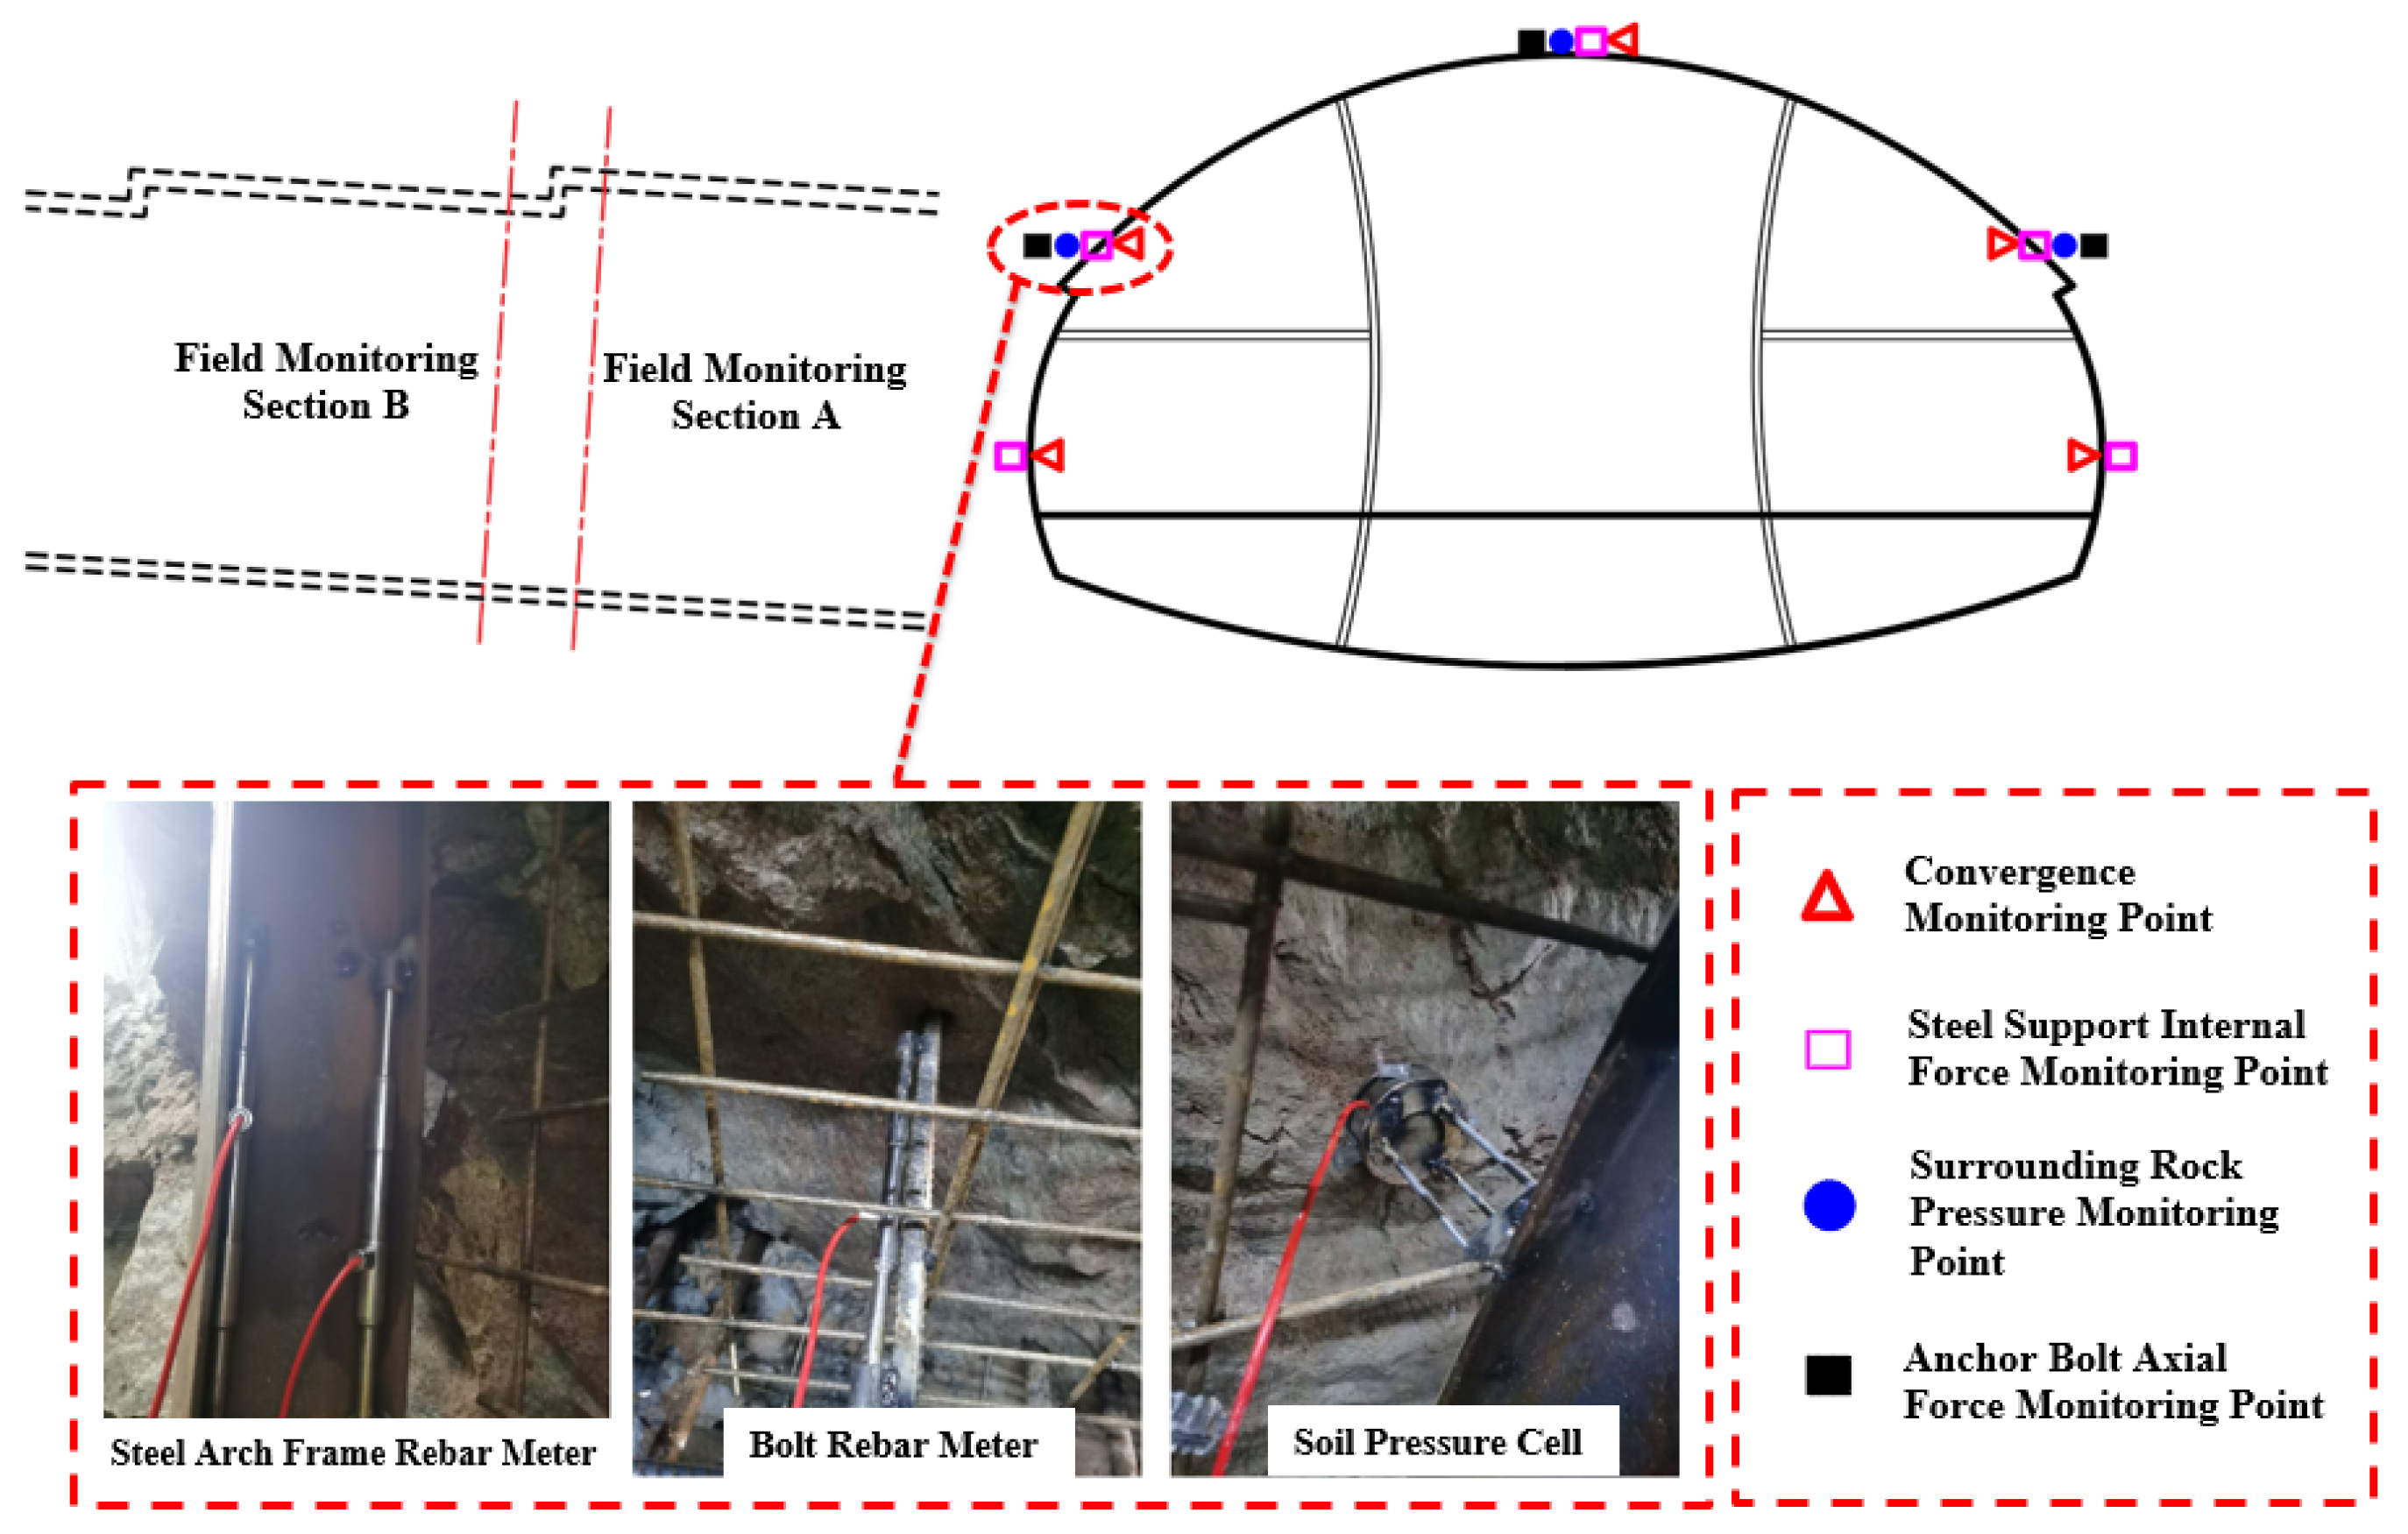
Monitoring points were set up in Field Monitoring Sections A and B, consistent with the simulated Monitoring Section, and a vibrating wire earth pressure box, steel bar meter, and other equipment were installed, supplemented by total station measurements. As shown in Figure 22. Through comprehensive monitoring of tunnel surrounding rock stress, bolt axial force, vault settlement and clearance convergence, it provides a scientific basis for analyzing the stability of surrounding rock and dynamically adjusting the initial support parameters.
To ensure timely and effective monitoring, the monitoring instruments were installed within 2 m of the excavation surface and controlled within a distance of no more than one cycle footage. After the instrument was installed, it was properly protected immediately to prevent it from being damaged by the explosion operation without affecting the accuracy of the measurement results.
The displacement monitoring points were strictly arranged in the same Monitoring Section. To monitor the internal force of the steel arch, at each selected monitoring point of the steel arch, a steel bar meter was installed at symmetrical positions of the inner walls on both sides to accurately obtain its stress state.
The installation time of The instrument was installed within 24 h after the completion of the blasting operation of the section and before the start of the next cycle blasting. After the installation was completed, the initial data were collected immediately and a reference value was established. The subsequent measurement frequency was dynamically adjusted according to the actual progress of the project, change in surrounding rock, and construction stage to ensure that the monitoring data reflected the change in structural state over time.

5.2. Monitoring Result Analysis

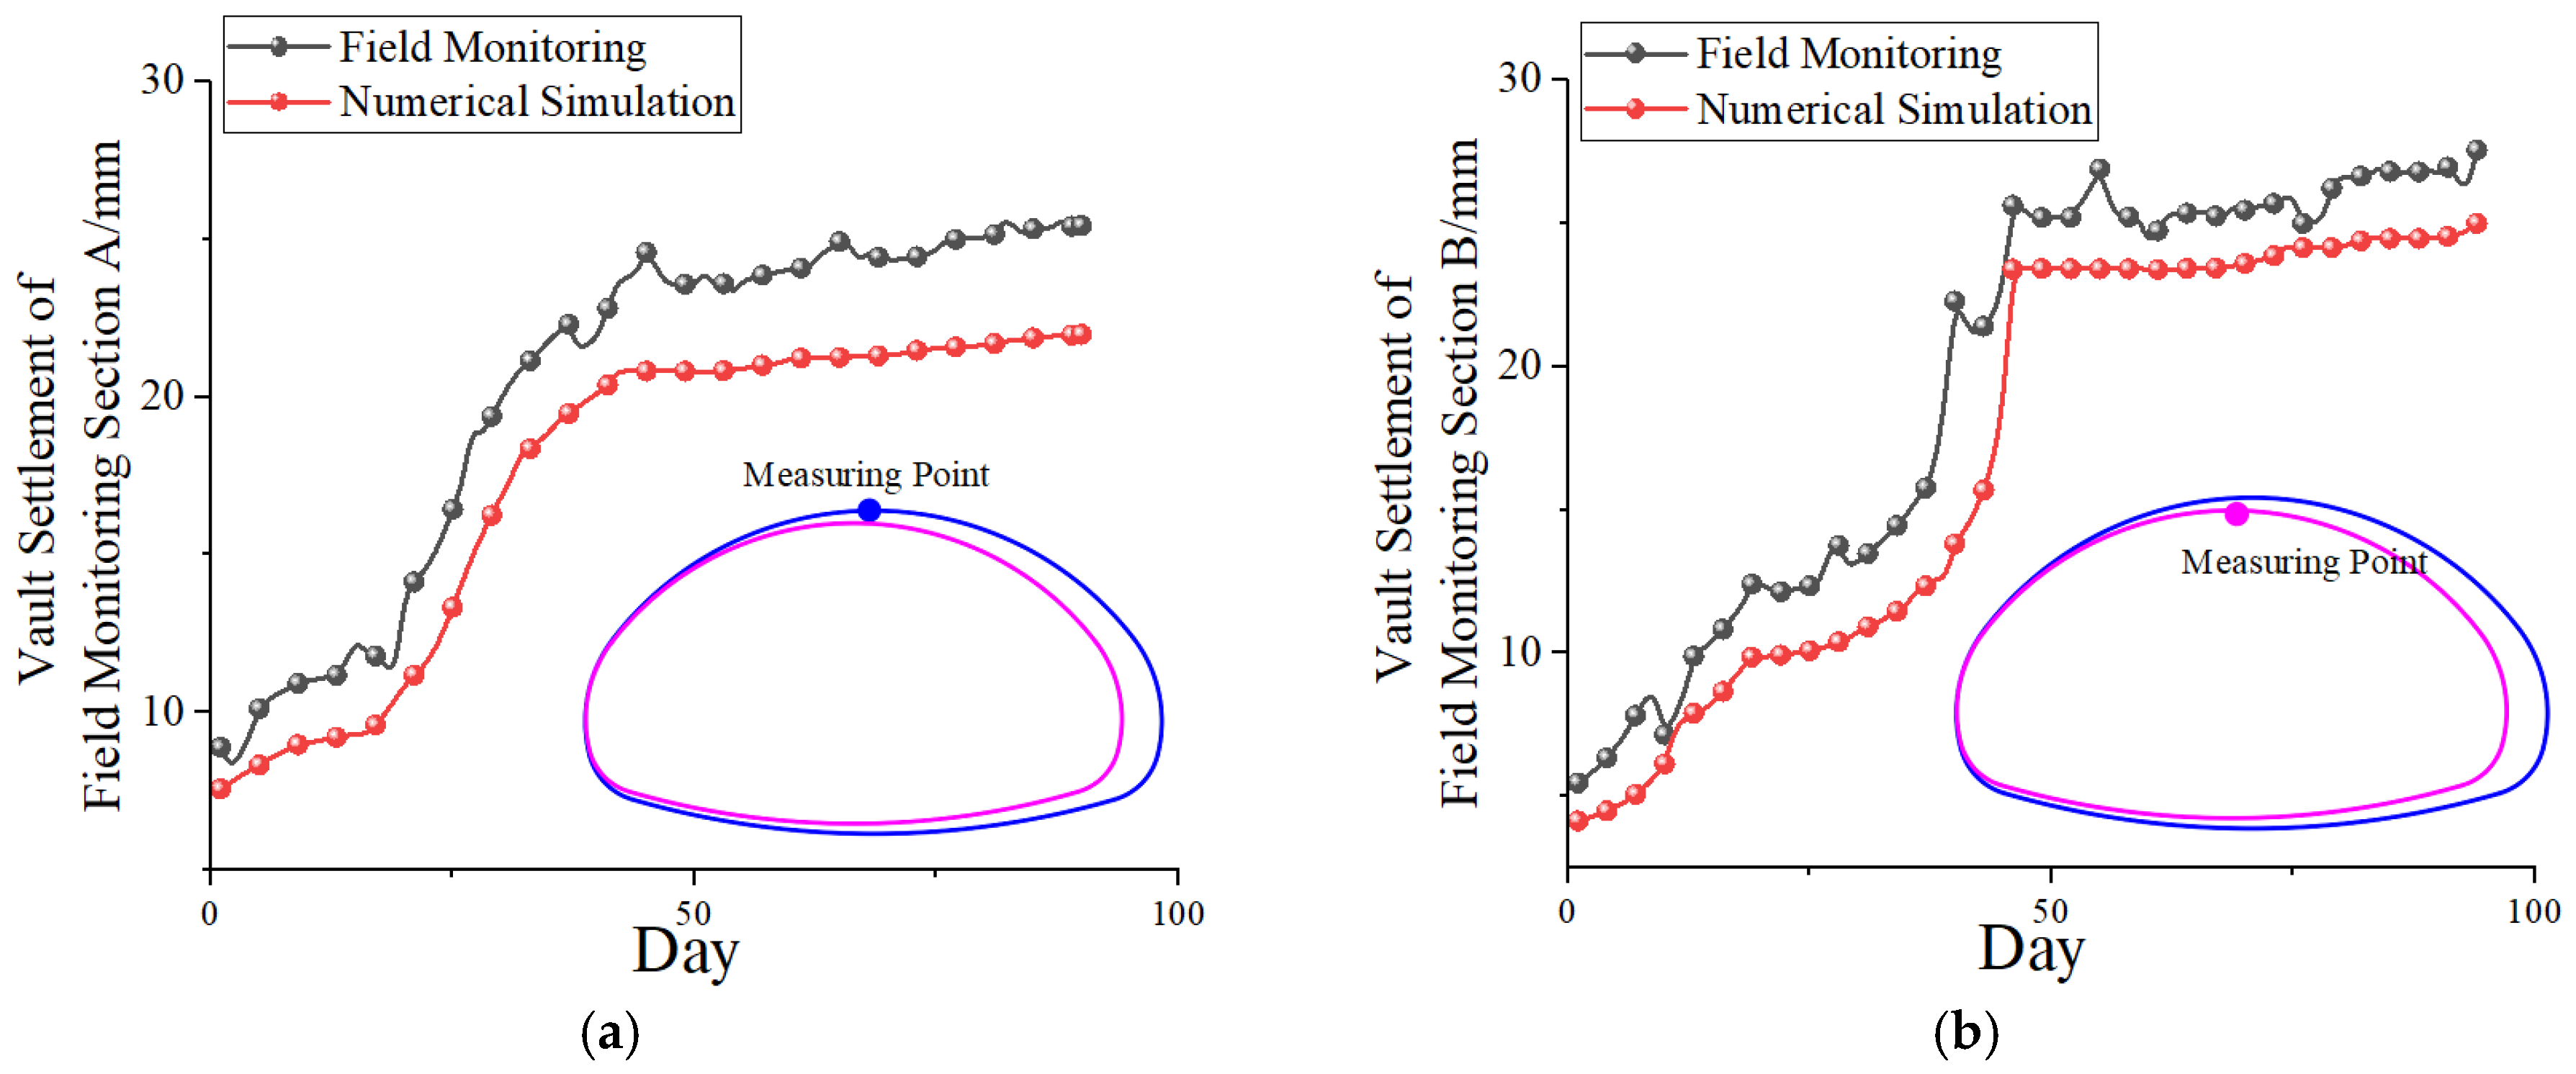
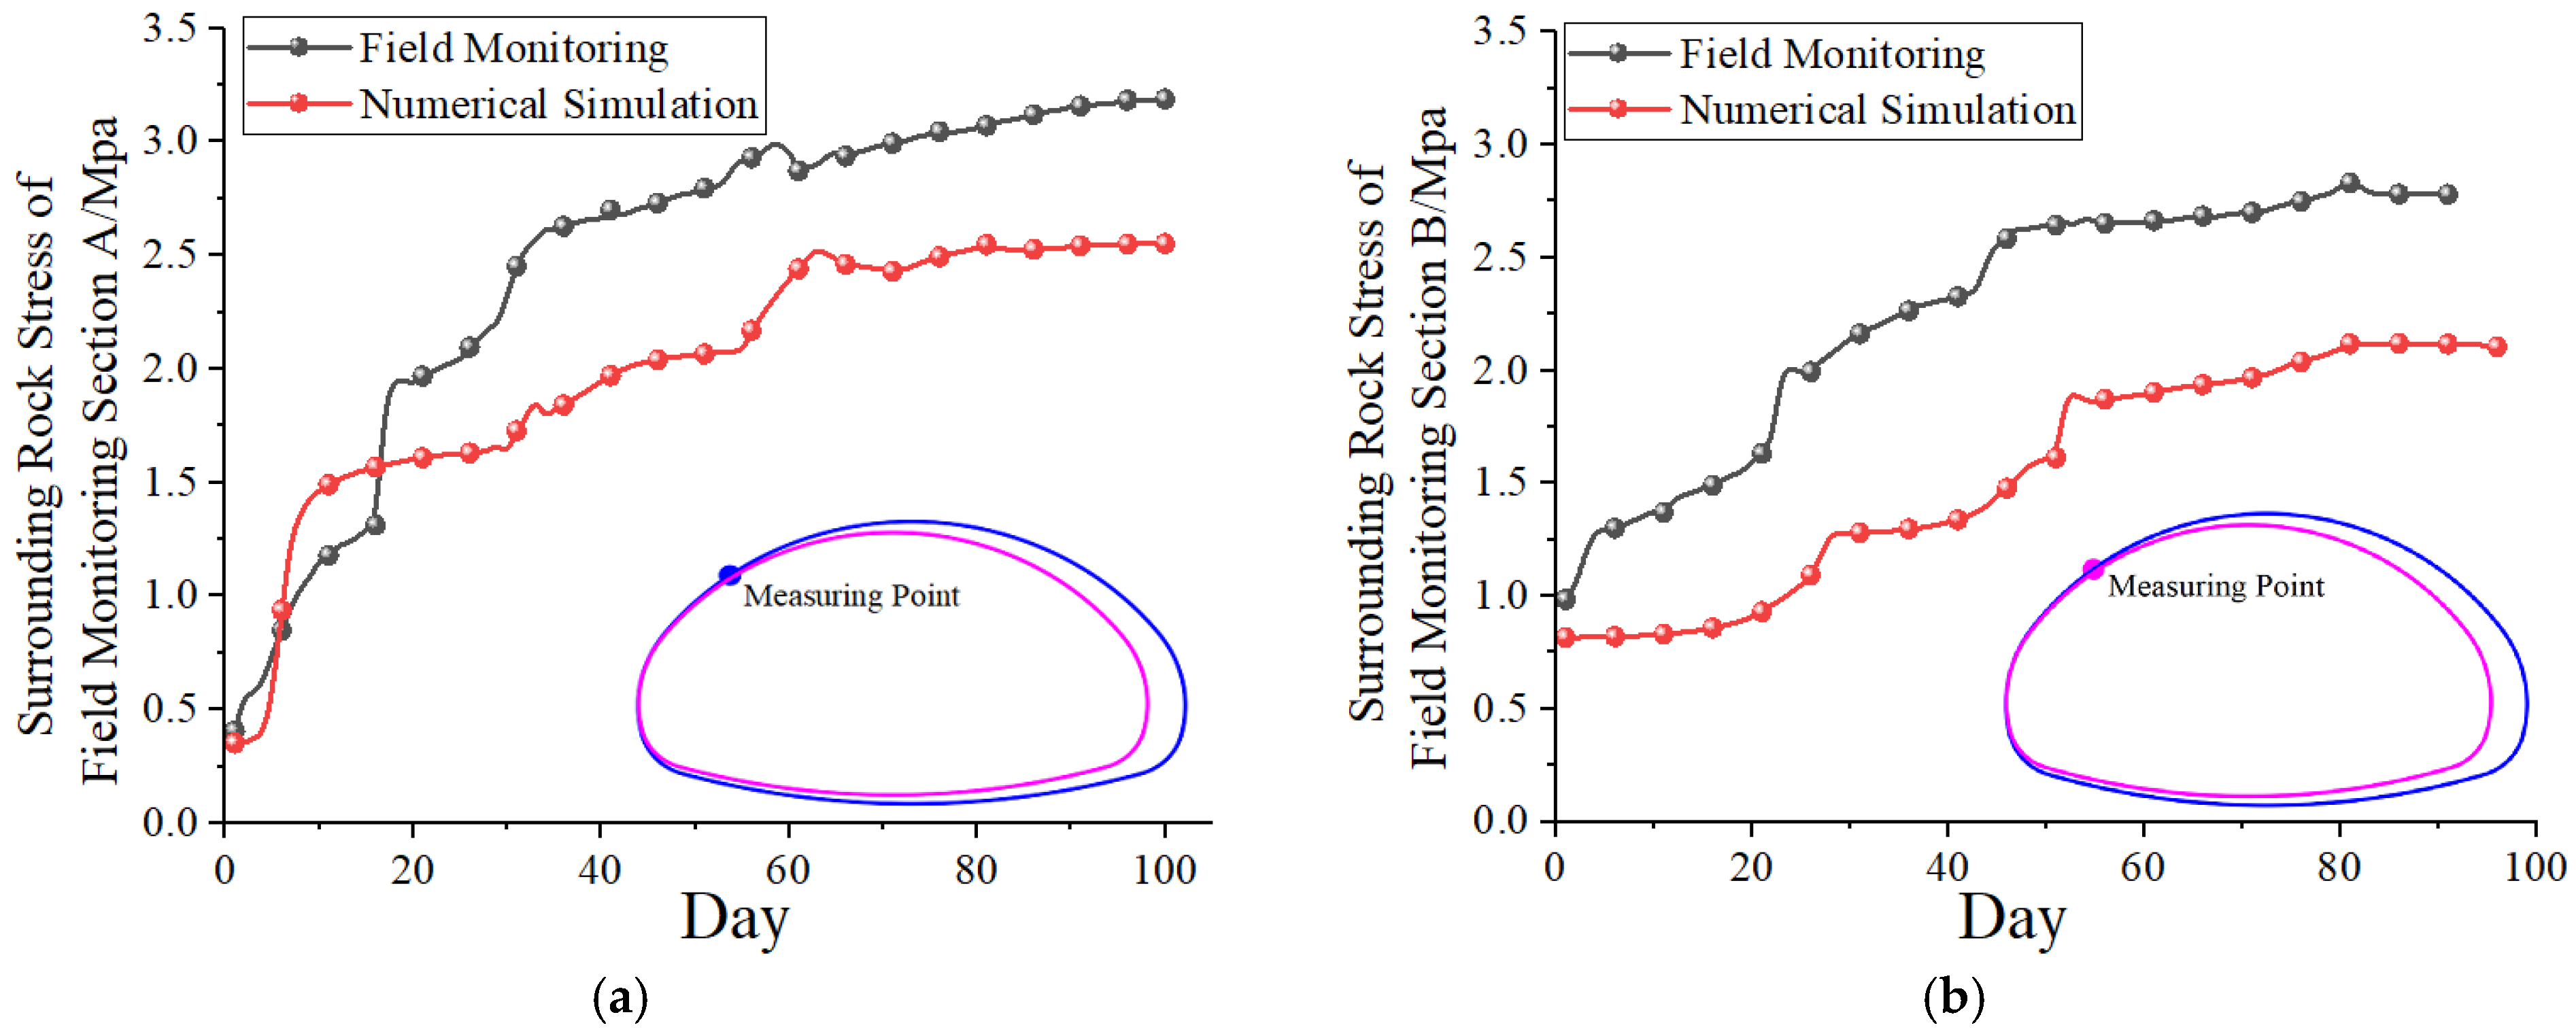
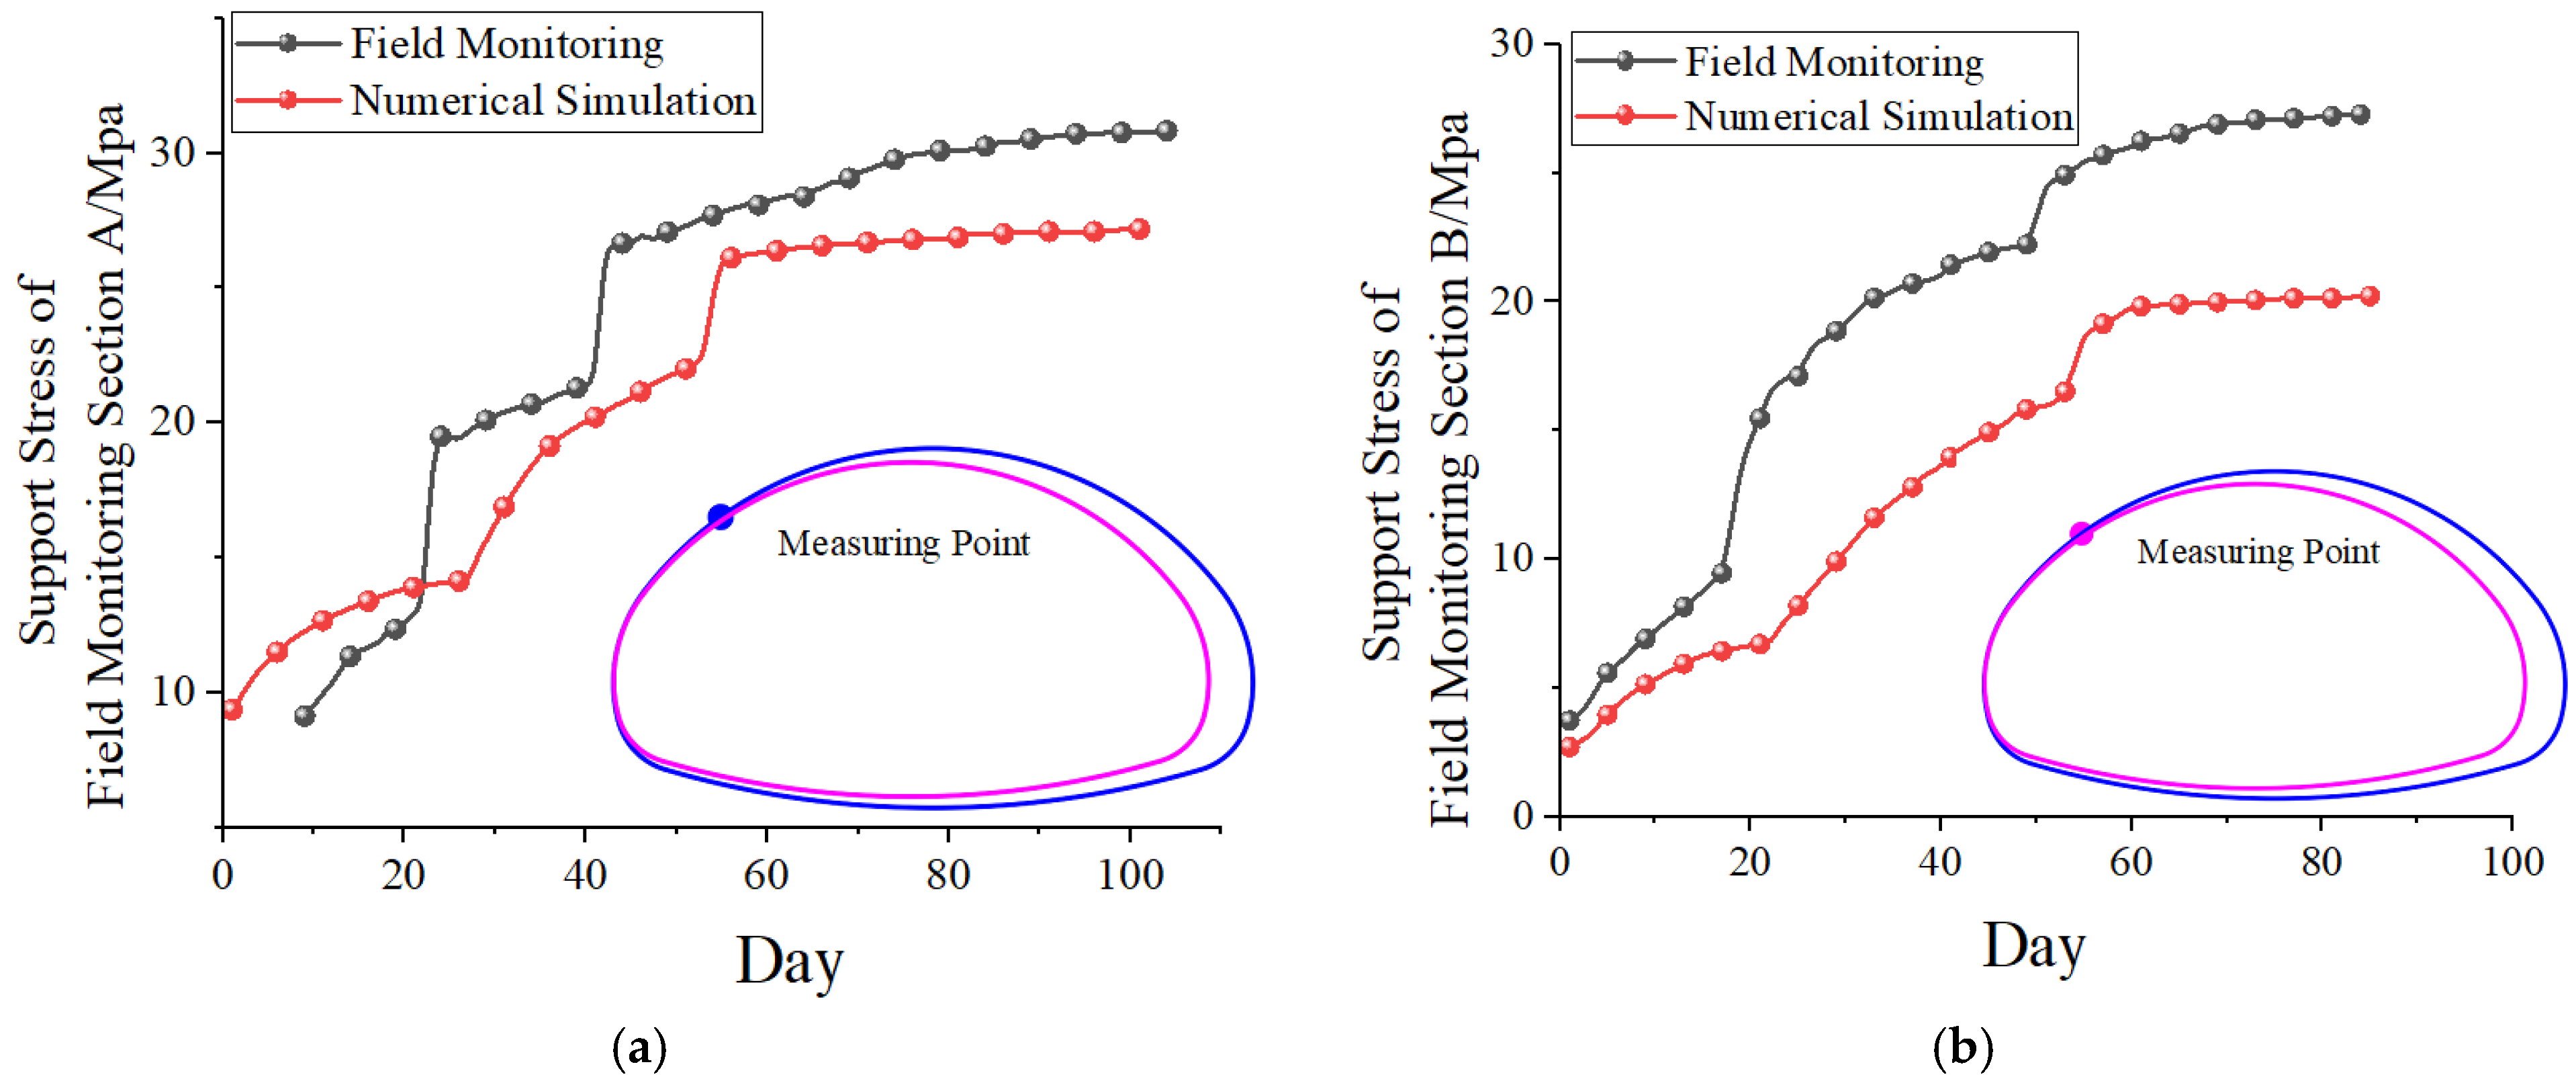
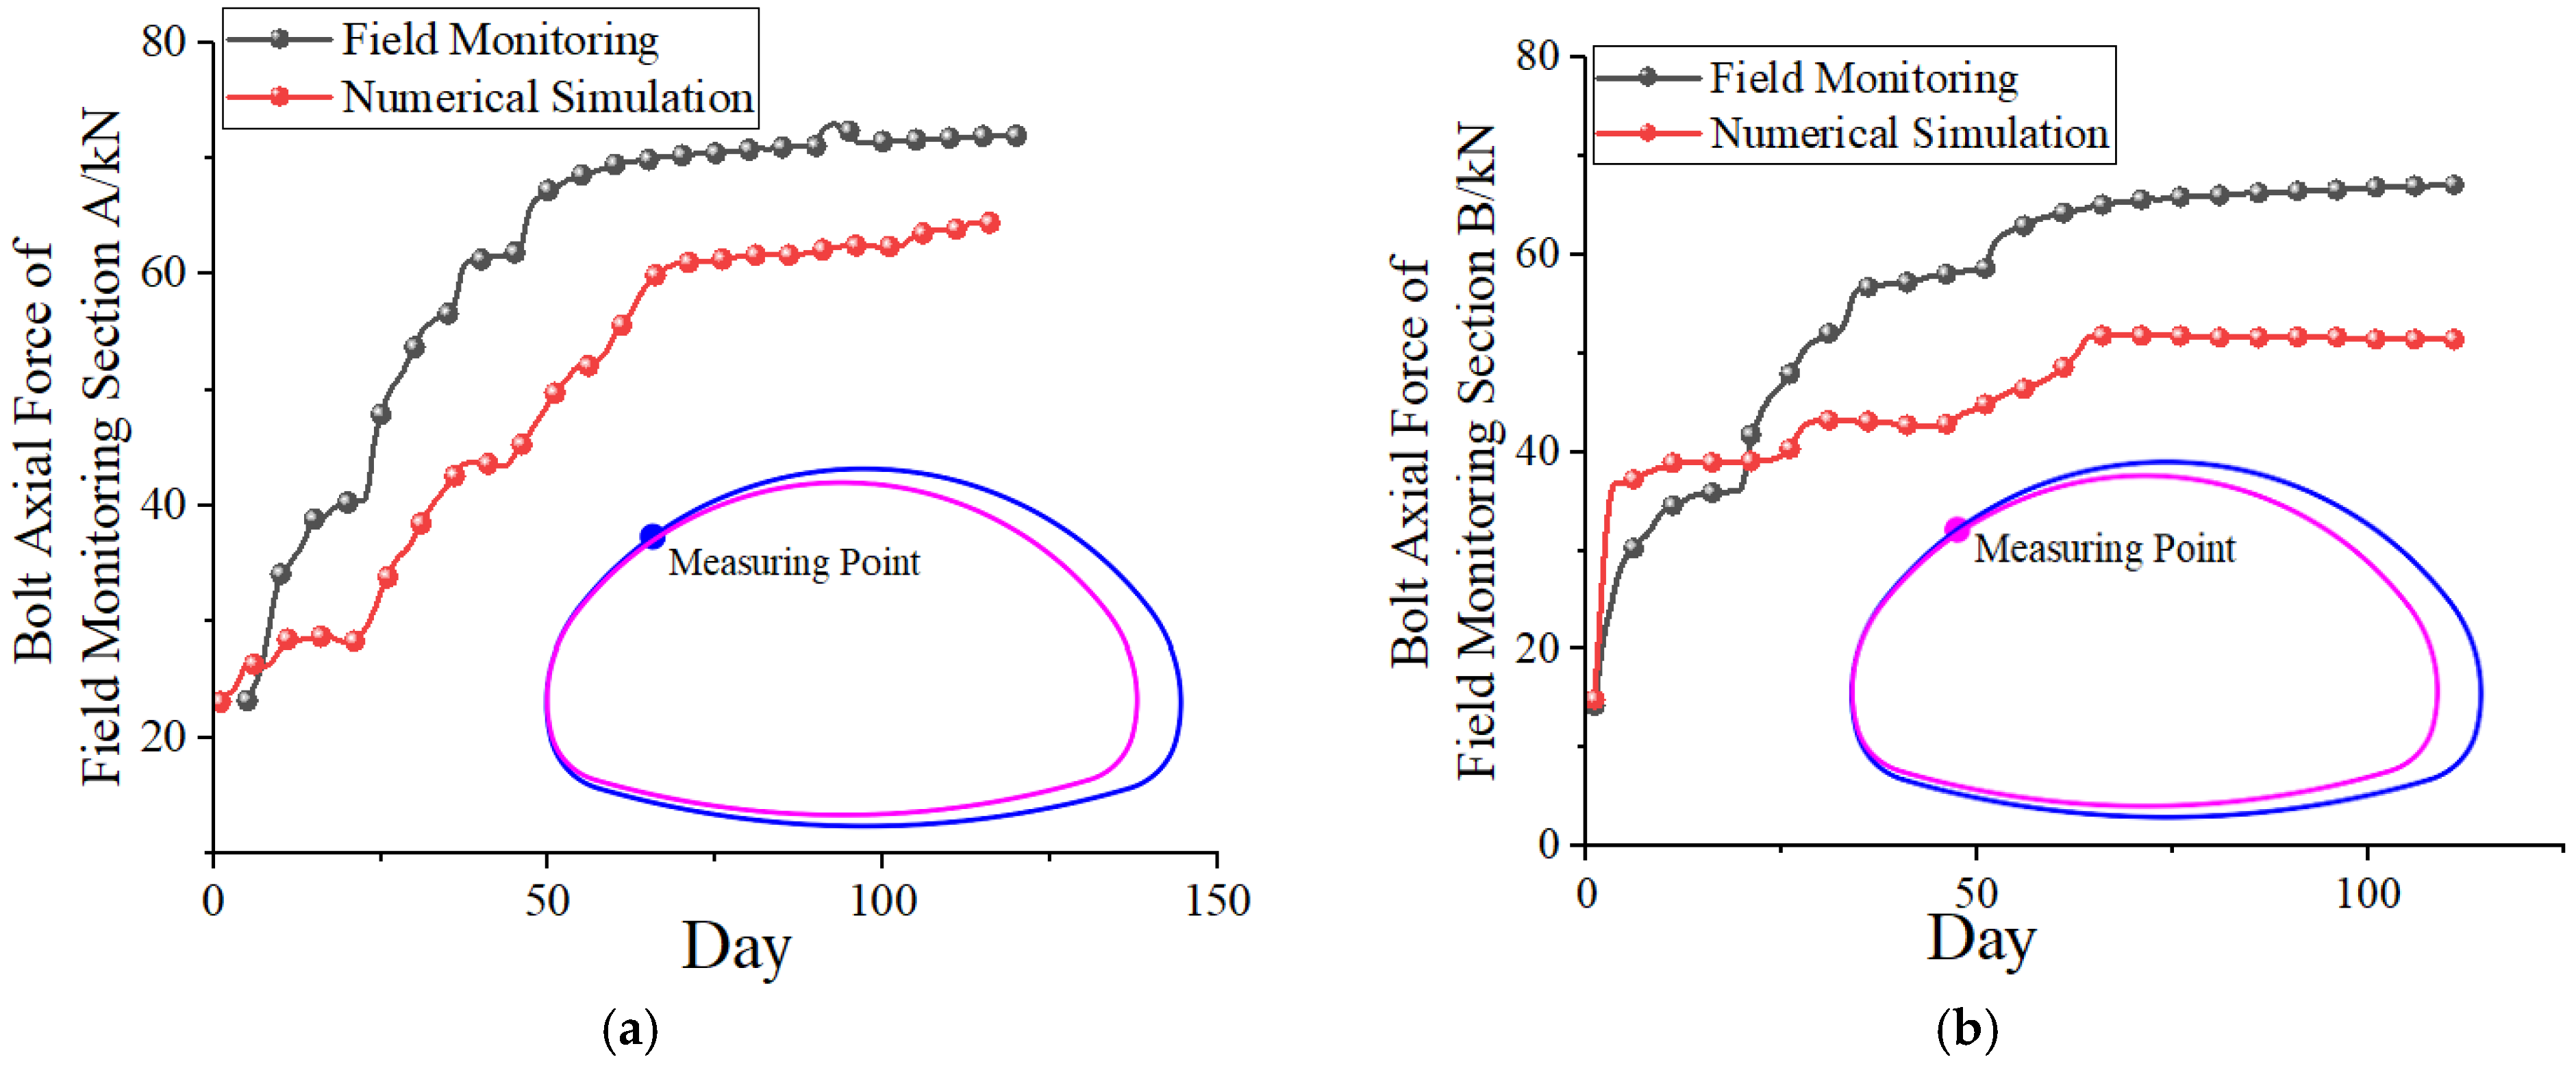
The changes in the field monitoring data are as follows: To verify the reliability of the numerical simulation, the field monitoring data were compared. The results show that some numerical simulation results are slightly different from the tunnel field monitoring data, but the numerical change trend is basically the same, and the difference rate is of more than 20%, which proves the reliability and effectiveness of the numerical simulation results. The field monitoring data were generally larger than the numerical simulation results. The reason for this error is that some assumptions and ideals were made during the simulation process. The monitoring points were located at the left tunnel arch shoulder, except for settlement.
The vault settlement monitoring diagrams of the Field Monitoring Sections are shown in Figure 23. Field Monitoring Section B was located in Tunnel I, and Field Monitoring Section A was located in Tunnel II. For Field Monitoring Section B, the vault settlement exhibited a rapid increase in the initial stage, with a deformation rate of the surrounding rock of approximately 0.37 mm/day. Following a period of 20 days of monitoring, with the distance from the tunnel face and the installation of the supporting structure, the deformation growth exhibited a tendency towards stability. However, this was subject to fluctuations owing to disturbances from the on-site blasting construction. After 35 days of monitoring, it was observed that the settlement of the vault had increased rapidly once more. This was due to the penetration of the upper steps of the tunnel and the excavation of the middle-step pilot tunnel. Concurrently, the deformation rate of the surrounding rock increased to 0.78 mm/day. Following a 52-day observation period, the settlement of the vault was found to be approximately 27 mm, and the deformation exhibited a tendency towards stability.
Field Monitoring Section A exhibited a comparatively gentle degree of deformation of the surrounding rock, which was attributable to the enhanced integrity of the vault-support system. From the initiation of monitoring to 51 d, the deformation of the surrounding rock exhibited stability, the vault settlement increased steadily, the deformation rate of the surrounding rock was approximately 0.31 mm/d, and the final vault settlement was 25.5 mm.
The results of the stress monitoring of the surrounding rock in the sections are presented in Figure 24. The stress levels in the surrounding rock of the t Field Monitoring Section B exhibited a consistent and gradual increase, without any discernible fluctuations. The monitoring and numerical simulation curves exhibited strong concordance, signifying that the stress levels of the section were satisfactory and that the construction stability was substantial. The monitoring of Field Section A demonstrated a rapid increase in the early stage, with the growth rate of the surrounding rock stress slowing and stabilizing after 30 days of monitoring. The ultimate tensile strength values of the surrounding rock in the two sections were 2.78 and 3.18 MPa, respectively.
The initial support stress monitoring is illustrated in Figure 25. The data change trends of Field Monitoring Section B and Section A are similar, and the stress exhibits two rapid growths. Compared with Field Monitoring Section A, the initial support stress of Field Monitoring Section B increased slowly, and the stress mutation was minimal. The stress of the two sections tended to be stable after 53 and 44 d of monitoring, and the final stress values were 27.3 MPa and 30.8 MPa.
The monitoring of the axial force of the bolt is shown in Figure 26. The stress state of the bolt was similar to that of the initial support stress. The two sections were divided into two stages: the rapid growth of the early axial force and the gentle growth of the stress. The monitoring of Field Monitoring Section A shows that the growth rate of the early axial force is higher than that of Field Monitoring Section B, and the data fluctuates significantly. The final values of the axial force were 63.8 kN and 71.4 kN, respectively, and the supporting stress was within the allowable range.

6. Conclusions

Based on a super-large-span variable cross-section tunnel located in Qingdao City, Shandong Province, China, the Stress characteristics and deformation laws of the surrounding rock under different cross-sectional changes were systematically analyzed using numerical simulations. The simulation results were compared with the field monitoring results, and then the construction scheme was optimized according to the results of numerical analysis and field monitoring. For a large-span variable cross-section tunnel crossing slightly weathered granite, the following conclusions were drawn from this study:
(1) The horizontal convergence final values for gradual changes in the cross-section of the symmetric tunnel and sudden changes in the cross-section of the symmetric tunnel were 16.15 mm and 16.39 mm, respectively, representing reductions of 4.8% and 5.7% compared to gradual changes in the cross-section of the asymmetric tunnel and sudden changes in the cross-section of the asymmetric tunnel. The final support stress values of sudden changes in the cross-section of the symmetric tunnel and sudden changes in the cross-section of the asymmetric tunnel were 8.59 and 7.88 MPa, respectively, representing reductions of 21.5% and 26.9% compared with gradual changes in the cross-section of the symmetric tunnel and gradual changes in the cross-section of the asymmetric tunnel.
(2) The final settlement values for sudden changes in the cross-section of the symmetric tunnel and sudden changes in the cross-section of the asymmetric tunnel were 21.23 mm and 21.98 mm, respectively, representing reductions of 14.6% and 15.7% compared to gradual changes in the cross-section of the symmetric tunnel and gradual changes in the cross-section of the asymmetric tunnel. The sudden changes in the cross-section of tunnel were superior to gradual changes in the cross-section of tunnel in terms of vault settlement, surrounding rock stress, and initial support stress. Considering that the gradual-change construction requires the adoption of a specially shaped steel arch, its cost and difficulty are significantly improved compared with those of sudden-change construction. Combined with the actual situation of the project, sudden construction was better than gradual construction in this study.
(3) The monitoring results of the Tangshan Road Tunnel showed that the maximum cumulative deviation of the II section tunnel vault was 25.5 mm and that of the I section tunnel vault was 27.7 mm. The maximum surrounding rock pressure of the two sections was 3.18 MPa, the magnitude of the maximum initial support stress was 30.8 MPa, and the maximum bolt axial force was 71.4 kN. Evidently, all of these parameters fall within the allowable displacement safety range of the Tangshan Road large-section highway tunnel, thereby substantiating the rationality of the asymmetric sudden-change construction method employed.

Author Contributions

Conceptualization, C.X. and W.G.; Methodology, C.X. and W.G.; Software, C.X., W.G. and R.W.; Data curation, C.X., W.G. and R.W.; Writing—original draft, C.X. and W.G.; field monitoring, W.G. and S.S.; writing—review and editing, C.X., W.G., R.W. and S.S. All authors have read and agreed to the published version of the manuscript.

Funding

This research was funded by the National Natural Science Foundation of China (NSFC) Project (Grant No. 52009074); the Youth Innovation Technology Support Program of Higher Education Institutions in Shandong Province, China (Grant No. 2024KJH088); the Natural Science Foundation of Shandong Province, China (General Program): ZR2025MS798; the National Natural Science Foundation of China (NSFC) Project (Grant No. 42477148).

Data Availability Statement

The original contributions presented in this study are included in the article. Further inquiries can be directed to the corresponding author.

Conflicts of Interest

The authors declare no conflicts of interest.

References

  1. Yu, Y.H.; Yan, B. Present Situation and Development Trend of Underground Space in Megacity in China. Chin. J. Undergr. Space Eng. 2021, 17, 1–7. [Google Scholar]
  2. Zhang, Z.; Lin, C.; Li, J.; Dong, Y.; Shen, Y. Development status and prospect of highway tunnel rehabilitation and expansion in China. Tunn. Constr. 2022, 42, 570. [Google Scholar]
  3. Yan, J. Development trends in world tunneling technology: Safe, economical, green and artistic. Tunn. Constr. 2021, 41, 693. [Google Scholar]
  4. Yan, J.X. Achievements and Challenges of Tunneling Technology in China over Past 40 Years. Tunn. Constr. 2019, 39, 537–544. [Google Scholar]
  5. Guo, D.P.; Liu, Y.Q.; Huang, X. Analysis on Sensitivity of Construction Mode and Supporting Structre Parameters of Variable Cross-section Tunnel. Subgrade Eng. 2025, 3, 175–181. [Google Scholar]
  6. Zhao, H.; Zhang, G.L.; Li, S.T.; Liu, Y.; Ren, X.L.; Kong, L.W.; Wang, R.; Qiu, D.C.; Zhang, H.X. Study on the Dynamic Response of Rock Mechanics and Numerical Simulation of Excavation Sequence Optimization in Ultra-large Span Variable Section Tunnels: Taking Suzhou Changjiang Road South Extension Project-Qizishan Tunnel Project as an Example. Sci. Technol. Ind. 2024, 24, 227–238. [Google Scholar]
  7. Ou, J. Construction Optimization Study of Double Sidewall Heading Method for Shallow Buried Oversized Variable Section Tunnel. Railw. Constr. Technol. 2024, 3, 120–123. [Google Scholar]
  8. Tian, S.M.; Wang, W.; Gong, J.F. Development and prospect of railway tunnels in China (including statistics of railway tunnels in China by the end of 2020). Tunn. Constr. 2021, 41, 308. [Google Scholar]
  9. Yang, C.Z.; Wu, Y.J.; Wang, W.; Tang, Y.Q. Analysis on Influence of Special Effect on Excavation of Soft Rock Tunnel with Large Cross Section. Chin. J. Undergr. Space Eng. 2021, 17, 511–519. [Google Scholar]
  10. Zhu, N.K.; Chen, Y.S.; Jia, J.L. Numerical Simulation of Excavation Stability of Large Section Tunnel. J. Taiyuan Univ. 2021, 39, 1–6. [Google Scholar]
  11. Qi, H.; Shang, C.S.; Hu, C.; Jiang, Y.S.; Wu, F.M.; Jiang, H. Study on stability of rock supporting structure during construction of super—Large cross—Section tunnel. Yangtze River 2020, 51, 135–141. [Google Scholar]
  12. He, X.; Li, Y. Analysis of stress disturbed zone of tunnel and its influence factors. J. Railw. Sci. Eng. 2019, 16, 2782–2790. [Google Scholar]
  13. Yu, H.; Liu, G.H. Strain Softening Model of Rock Under Multiaxial Stress State Based on Drucker-prager Criterion. Bull. Sci. Technol. 2020, 36, 45–52. [Google Scholar]
  14. Jia, X.T.; Li, Q.; He, W.K. On the Analysis of the Prevention of Common Geological Disasters in Large Cross-Section Tunnel Construction. Shanxi Archit. 2012, 38, 216–217. [Google Scholar]
  15. Zhao, B.J. Study on Construction Method of Forked Tunnel with Large and Multi Section. Master’s Thesis, Beijing Jiaotong University, Beijing, China, 2019. [Google Scholar]
  16. Zhao, G. Excavation Technology for Large Section Interworking Tunnel of Variable Cross Section. Railw. Constr. Technol. 2015, 3, 87–91. [Google Scholar]
  17. Ren, D.P. Construction Technology of Variable Cross⁃section for Three⁃line Bifurcation and Large⁃span Section of Railway Tunnel. Railw. Eng. 2021, 61, 105–108. [Google Scholar]
  18. Ma, J.H.; Zhao, J.Q.; Peng, J.W.; Wu, R.J.; Wang, X.X.; Guo, Y.X. Study on displacement and stress characteristics of criss-cross tunnel with different size and support optimization. J. Taiyuan Univ. Technol. 2024, 1–10. Available online: https://link.cnki.net/urlid/14.1220.N.20240616.1556.002 (accessed on 19 November 2025).
  19. Hong, J.; Guo, H.M.; Zhang, J.R.; Chen, L.J. Study of Structure Selection and Construction Method for Three-line Transition Section at Exit of Xinkaotang Tunnel. Tunn. Constr. 2016, 36, 953–959. [Google Scholar]
  20. Yan, M.C.; Zeng, P.; He, Z.S.; Yang, X.A. Research on Construction Technology of Variable Section Section of Super Large Section Tunnel. Railw. Eng. 2015, 497, 43–45. [Google Scholar]
  21. Sun, S.; Jiang, Z.; Li, L.; Qiu, D. Model test and numerical verification of surrounding rock stability of super-large-span and variable-section tunnels. Tunn. Undergr. Space Technol. 2024, 153, 106020. [Google Scholar] [CrossRef]
  22. Fan, S.; Song, Z.; Li, X.; Zhang, Y.; Liu, L. Investigation into the large deformation mechanism and control technology of variable cross-section tunnel in layered mudstone stratum. Buildings 2022, 13, 110. [Google Scholar] [CrossRef]
  23. Song, S.; Li, S.; Liang, Y.; Huo, R.; Song, Z.; Miao, Z.; Song, Z. Study on construction mechanical effect and optimization of large-span variable cross-section of railway tunnel. Buildings 2023, 13, 2859. [Google Scholar] [CrossRef]
  24. Li, H.Y. Research on Construction Technology of Subway Crossing Tunnel in Variable Cross-Section and Soft Flow Plastic Stratum. Master’s Thesis, Central South University, Changsha, China, 2007. [Google Scholar]
  25. Zeng, W.H.; Peng, X.F.; Zhang, L.; Hu, E.L.; Yang, W.B. Mechanical Characteristics of Super-Large Variable-Section Tunnel. Chin. J. Undergr. Space Eng. 2022, 18, 2062−2071+2079. [Google Scholar]
  26. Fang, G.; Ding, C.L.; Jia, R.Z.; Wu, C. Mechanical Properties Analysis of Large Cross-section Tunnel with Variable Cross-Section. Mod. Tunn. Technol. 2018, 55, 258–263. [Google Scholar]
  27. Lu, R. Research on Construction Method Optimization and Support Countermeasures of Large Span Variable Section Bifurcation Tunnel. Master’s Thesis, University of Jinan, Jinan, China, 2023. [Google Scholar]
  28. Ayasrah, M.M.; Qiu, H.; Zhang, X. Influence of Cairo Metro Tunnel Excavation on Pile Deep Foundation of the Adjacent Underground Structures: Numerical Study. Symmetry 2021, 13, 426. [Google Scholar] [CrossRef]
  29. Huang, L.-H.; Chen, Q.-N. Study on Stability of Underground Cavern in Variable cross Section Based on Nonlinear. J. Hunan Inst. Eng. 2012, 22, 61–64. [Google Scholar]
  30. Fu, J.N. Comparison and Selection of Construction Scheme for Variable Section Tunnel in Interval Crossing Section Based on Numerical Analysis. Railw. Constr. Technol. 2019, 308, 104–108. [Google Scholar]
  31. Li, T.; Wang, Y.B.; Yu, Z.W.; Liu, B. Prediction of soil movement and settlement of excavated surface soil of variable section tunnel. J. Cent. South Univ. (Sci. Technol.) 2020, 51, 433–444. [Google Scholar]
  32. Tai, Q.M.; Zhang, D.L.; Wang, J.C.; Sun, Z.Y.; Li, A. Analysis on pressure arch evolution law of high-speed railway tunnel under unfavourable rock conditions. J. Beijing Jiaotong Univ. 2015, 39, 62–68. [Google Scholar] [CrossRef]
  33. Gere, J.M.; Goodno, B.J. Mechanics of Materials, 8th ed.; Cengage Learning: Boston, MA, USA, 2012. [Google Scholar]
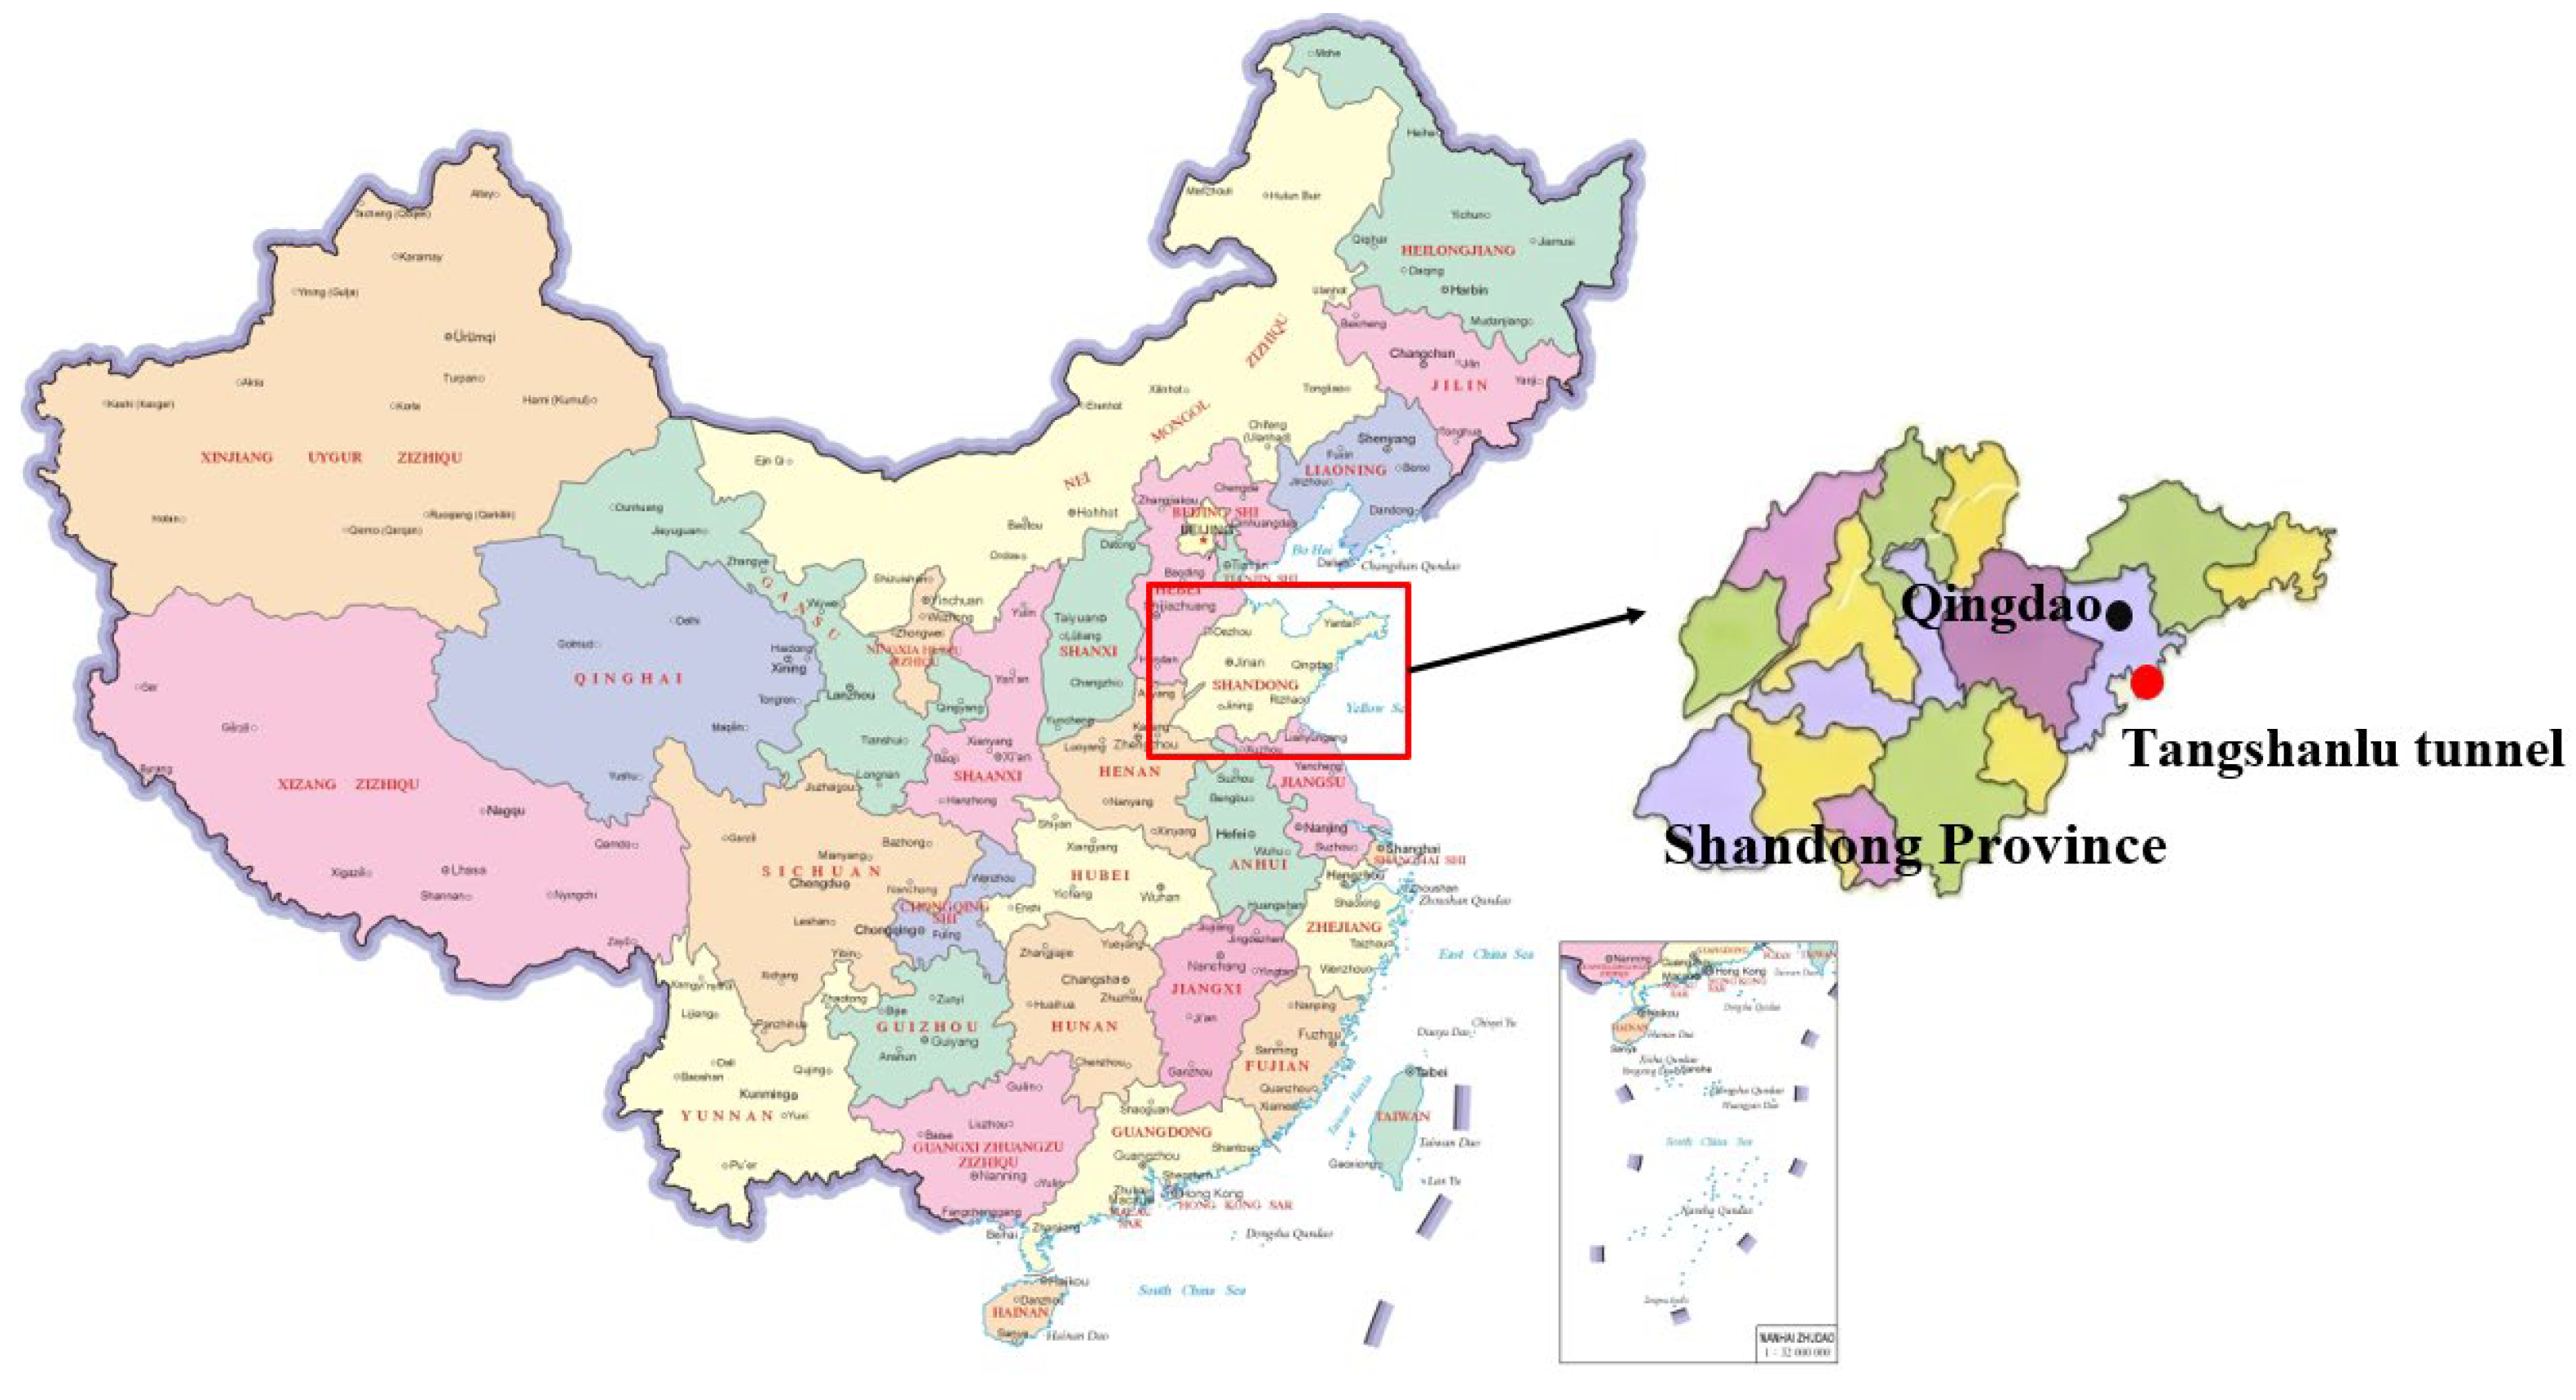
Figure 1. Location of Tangshan Road Tunnel.
Symmetry 17 02036 g001
Figure 2. Geological profile and variable cross-section section plan of Tangshan Road Tunnel.
Symmetry 17 02036 g002
Figure 3. I-shaped section tunnel support diagram.
Symmetry 17 02036 g003
Figure 4. II-shaped section tunnel support diagram.
Symmetry 17 02036 g004
Figure 5. Schematic diagram of tunnel excavation sequence.
Symmetry 17 02036 g005
Figure 6. Schematic diagram of different cross-section changes: (a) Sudden changes in the cross-section of the symmetric tunnel; (b) Gradual changes in the cross-section of the symmetric tunnel; (c) Sudden changes in the cross-section of the asymmetric tunnel; (d) Gradual changes in the cross-section of the asymmetric tunnel.
Symmetry 17 02036 g006aSymmetry 17 02036 g006b
Figure 7. Schematic diagram of tunnel numerical model.
Symmetry 17 02036 g007
Figure 8. Schematic diagram of tunnel Monitoring Section.
Symmetry 17 02036 g008
Figure 9. Schematic diagram of tunnel monitoring position: (a) Asymmetrical tunnel; (b) Symmetrical tunnel.
Symmetry 17 02036 g009
Figure 10. Z-axis displacement cloud diagram of four models: (a) Symmetrical sudden-change construction; (b) Symmetrical gradual-change construction; (c) Asymmetrical sudden-change construction; (d) Asymmetrical gradual-change construction.
Symmetry 17 02036 g010
Figure 11. Monitoring Section A comparative curve of vault settlement.
Symmetry 17 02036 g011
Figure 12. Monitoring Section B comparative curve of vault settlement.
Symmetry 17 02036 g012
Figure 13. X-axis displacement cloud diagram of four models: (a) Symmetrical sudden-change construction; (b) Symmetrical gradual-change construction; (c) Asymmetrical sudden-change construction; (d) Asymmetrical gradual-change construction.
Symmetry 17 02036 g013
Figure 14. Horizontal displacement and haunch convergence comparison curve of Monitoring Section A.
Symmetry 17 02036 g014
Figure 15. Horizontal displacement and haunch convergence comparison curve of Monitoring Section B.
Symmetry 17 02036 g015
Figure 16. Variation law of vault settlement of four models.
Symmetry 17 02036 g016
Figure 17. The average effective stress cloud diagram of surrounding rock of four models: (a) Symmetrical sudden-change construction; (b) Symmetrical gradual-change construction; (c) Asymmetrical sudden-change construction; (d) Asymmetrical gradual-change construction.
Symmetry 17 02036 g017
Figure 18. The initial support stress cloud diagram of four models: (a) Symmetrical sudden-change construction; (b) Symmetrical gradual-change construction; (c) Asymmetrical sudden-change construction; (d) Asymmetrical gradual-change construction.
Symmetry 17 02036 g018
Figure 19. Monitoring Section A initial support stress comparison curve diagram: (a) A1 point stress comparison curve; (b) A2 point stress comparison curve; (c) A3 point stress comparison curve; (d) A4 point stress comparison curve; (e) A5 point stress comparison curve;.
Symmetry 17 02036 g019
Figure 20. Monitoring Section B initial support stress comparison curve diagram: (a) B1 point stress comparison curve; (b) B2 point stress comparison curve; (c) B3 point stress comparison curve; (d) B4 point stress comparison curve; (e) B5 point stress comparison curve.
Symmetry 17 02036 g020
Figure 21. The axial force cloud diagram of the four models of the bolt: (a) Symmetrical sudden-change construction; (b) Symmetrical gradual-change construction; (c) Asymmetrical sudden-change construction; (d) Asymmetrical gradual-change construction.
Symmetry 17 02036 g021
Figure 22. Monitoring Section, monitoring point layout diagram.
Symmetry 17 02036 g022
Figure 23. Field Monitoring Section vault settlement monitoring diagram: (a) Field Monitoring Section A data comparison diagram; (b) Field Monitoring Section B data comparison diagram.
Symmetry 17 02036 g023
Figure 24. Field Monitoring Section surrounding rock stress monitoring diagram: (a) Field Monitoring Section A data comparison diagram; (b) Field Monitoring Section B data comparison diagram.
Symmetry 17 02036 g024
Figure 25. Field Monitoring Section supporting stress monitoring diagram: (a) Field Monitoring Section A data comparison diagram (b) Field Monitoring Section B data comparison diagram.
Symmetry 17 02036 g025
Figure 26. Field Monitoring Section bolt axial force monitoring diagram: (a) Field Monitoring Section A data comparison diagram; (b) Field Monitoring Section B data comparison diagram.
Symmetry 17 02036 g026
Table 1. Stratigraphic parameters.
StratumDensity
/kN/m3
Elastic Modulus
/GPa
Poisson RatioInternal Friction AngleCohesion
/kPa
Highly Weathered Granit22.50.50.252850
Moderately Weathered Granite2450.2335500
Slightly Weathered
Granite
25.8220.23401600
Table 2. Supporting structure parameters.
Name of The MaterialMaterial TypeElastic Modulus/GPaDensity/kN/m3Poisson RatioThickness/m
Initial SupportPlate Element28250.20.31
Temporary SupportPlate Element28250.20.25
II-shaped section
Strengthening Support
Plate Element28250.20.26
Mortar AnchorImplantable Truss20678.50.25/
Advanced SupportImplantable Beam Element20678.50.25/
Disclaimer/Publisher’s Note: The statements, opinions and data contained in all publications are solely those of the individual author(s) and contributor(s) and not of MDPI and/or the editor(s). MDPI and/or the editor(s) disclaim responsibility for any injury to people or property resulting from any ideas, methods, instructions or products referred to in the content.