3.2. Turbulent Bursing Events Detected by VITA
Turbulent bursting refers to asymmetrical, intermittent and abrupt intense disturbances occurring in the turbulent boundary layer. Physically, the bursting process consists of two distinct phases: “ejection” and “sweep”. The ejection phase is characterized by transient, explosive movement of low-momentum fluid parcels away from the wall region, forming high-velocity ejections, while the sweep phase involves downward impingement of high-momentum fluid from the outer flow. Both processes generate strong shear between high- and low-velocity fluids, resulting in the formation of complex vortex structures and intense momentum and energy exchange. Studies have shown that bursting events contributes 50–75% to the turbulent kinetic energy production [
21]. In terms of flow parameters, the most direct manifestation of bursting phenomena is the occurrence of intense velocity fluctuations. Typically, the burst period is defined as the time interval between two consecutive ejection events. Therefore, burst events can be detected by identifying sudden enhancements in velocity fluctuations. This study employs the Variable Interval Time Average (VITA) method [
36] to detect turbulent bursting phenomena in the boundary layer. The conditional averaging parameters were set following the principle that the amplitude of conditionally averaged fluctuating velocity should remain adequately smooth without becoming excessively small, with the threshold level set at
and integration time at
. Here,
represents the non-dimensional time for the integration time
T based on the friction velocity, i.e.,
.
According to
Figure 8 in
Section 3.1, the drag reduction rate reaches its maximum at
(for freestream velocity of 6 m/s), after which the drag reduction effect begins to attenuate, demonstrating the degradation phenomenon [
33]. By
(for freestream velocity of 10 m/s), the drag reduction rate has degraded to 50% of its maximum value. Therefore, these two characteristic velocities are selected for further analysis.
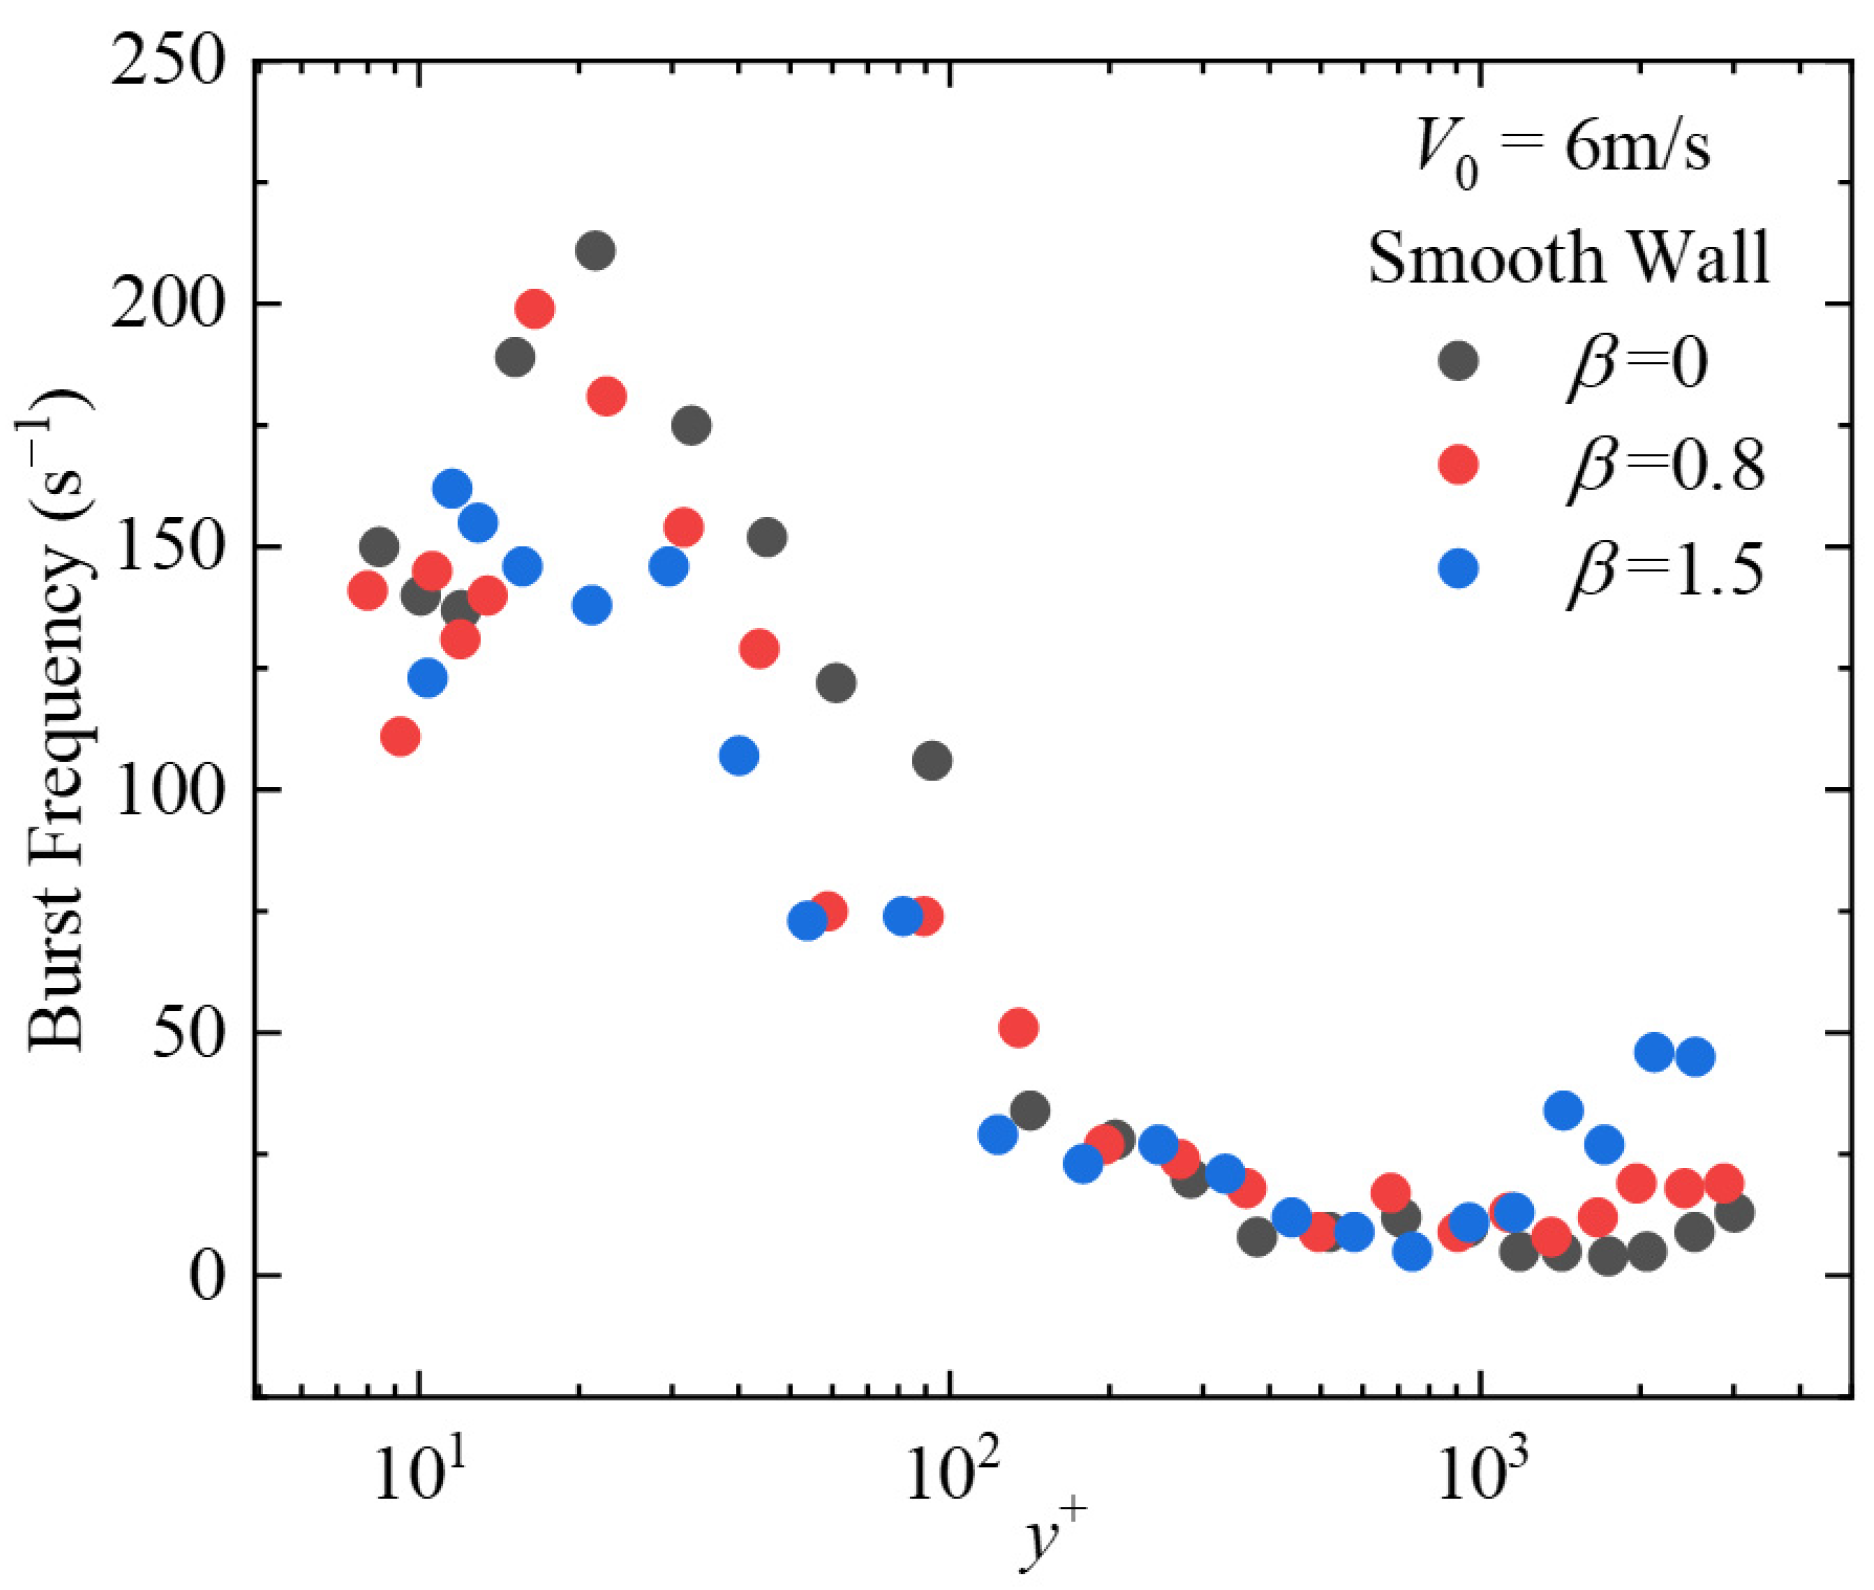
Figure 9 and
Figure 10 show the variation of burst frequency with height under different pressure gradients and wall surface conditions. As seen from
Figure 9 and
Figure 10, regardless of changes in inflow conditions or wall surface conditions, the trend of burst frequency variation with height remains consistent: the occurrence frequency of bursting phenomena is extremely low away from the wall, increases significantly as the hot-wire approaches the wall, reaches its maximum near
= 15, and then gradually decreases. This pattern aligns with the characteristics of turbulent boundary layer fluctuating velocity profiles [
11]. Bursting events eject low-speed fluid from the wall region into the mainstream while sweeping high-speed fluid toward the wall region, both processes causing intense velocity fluctuations. Moreover, these changes are intermittent—when bursting events conclude, the local velocity returns to lower levels, leading to an increase in the root mean square value of velocity fluctuations.
Since burst events typically contribute to 80% of the Reynolds stress and 50–75% of the turbulent fluctuation energy at high Reynolds flow, the reduction in burst frequency for riblets directly leads to a decrease in wall friction drag. The presence of riblets affects coherent structures at various scales within a certain range above the wall, such as by weakening streamwise vortex strength and increasing structural inclination angles (shown in
Section 3.3). This reduces the ability of different structures to interact and interfere with one another, thereby diminishing the driving factors for burst events. The resulting reduction in momentum exchange ultimately leads to a decrease in wall friction drag.
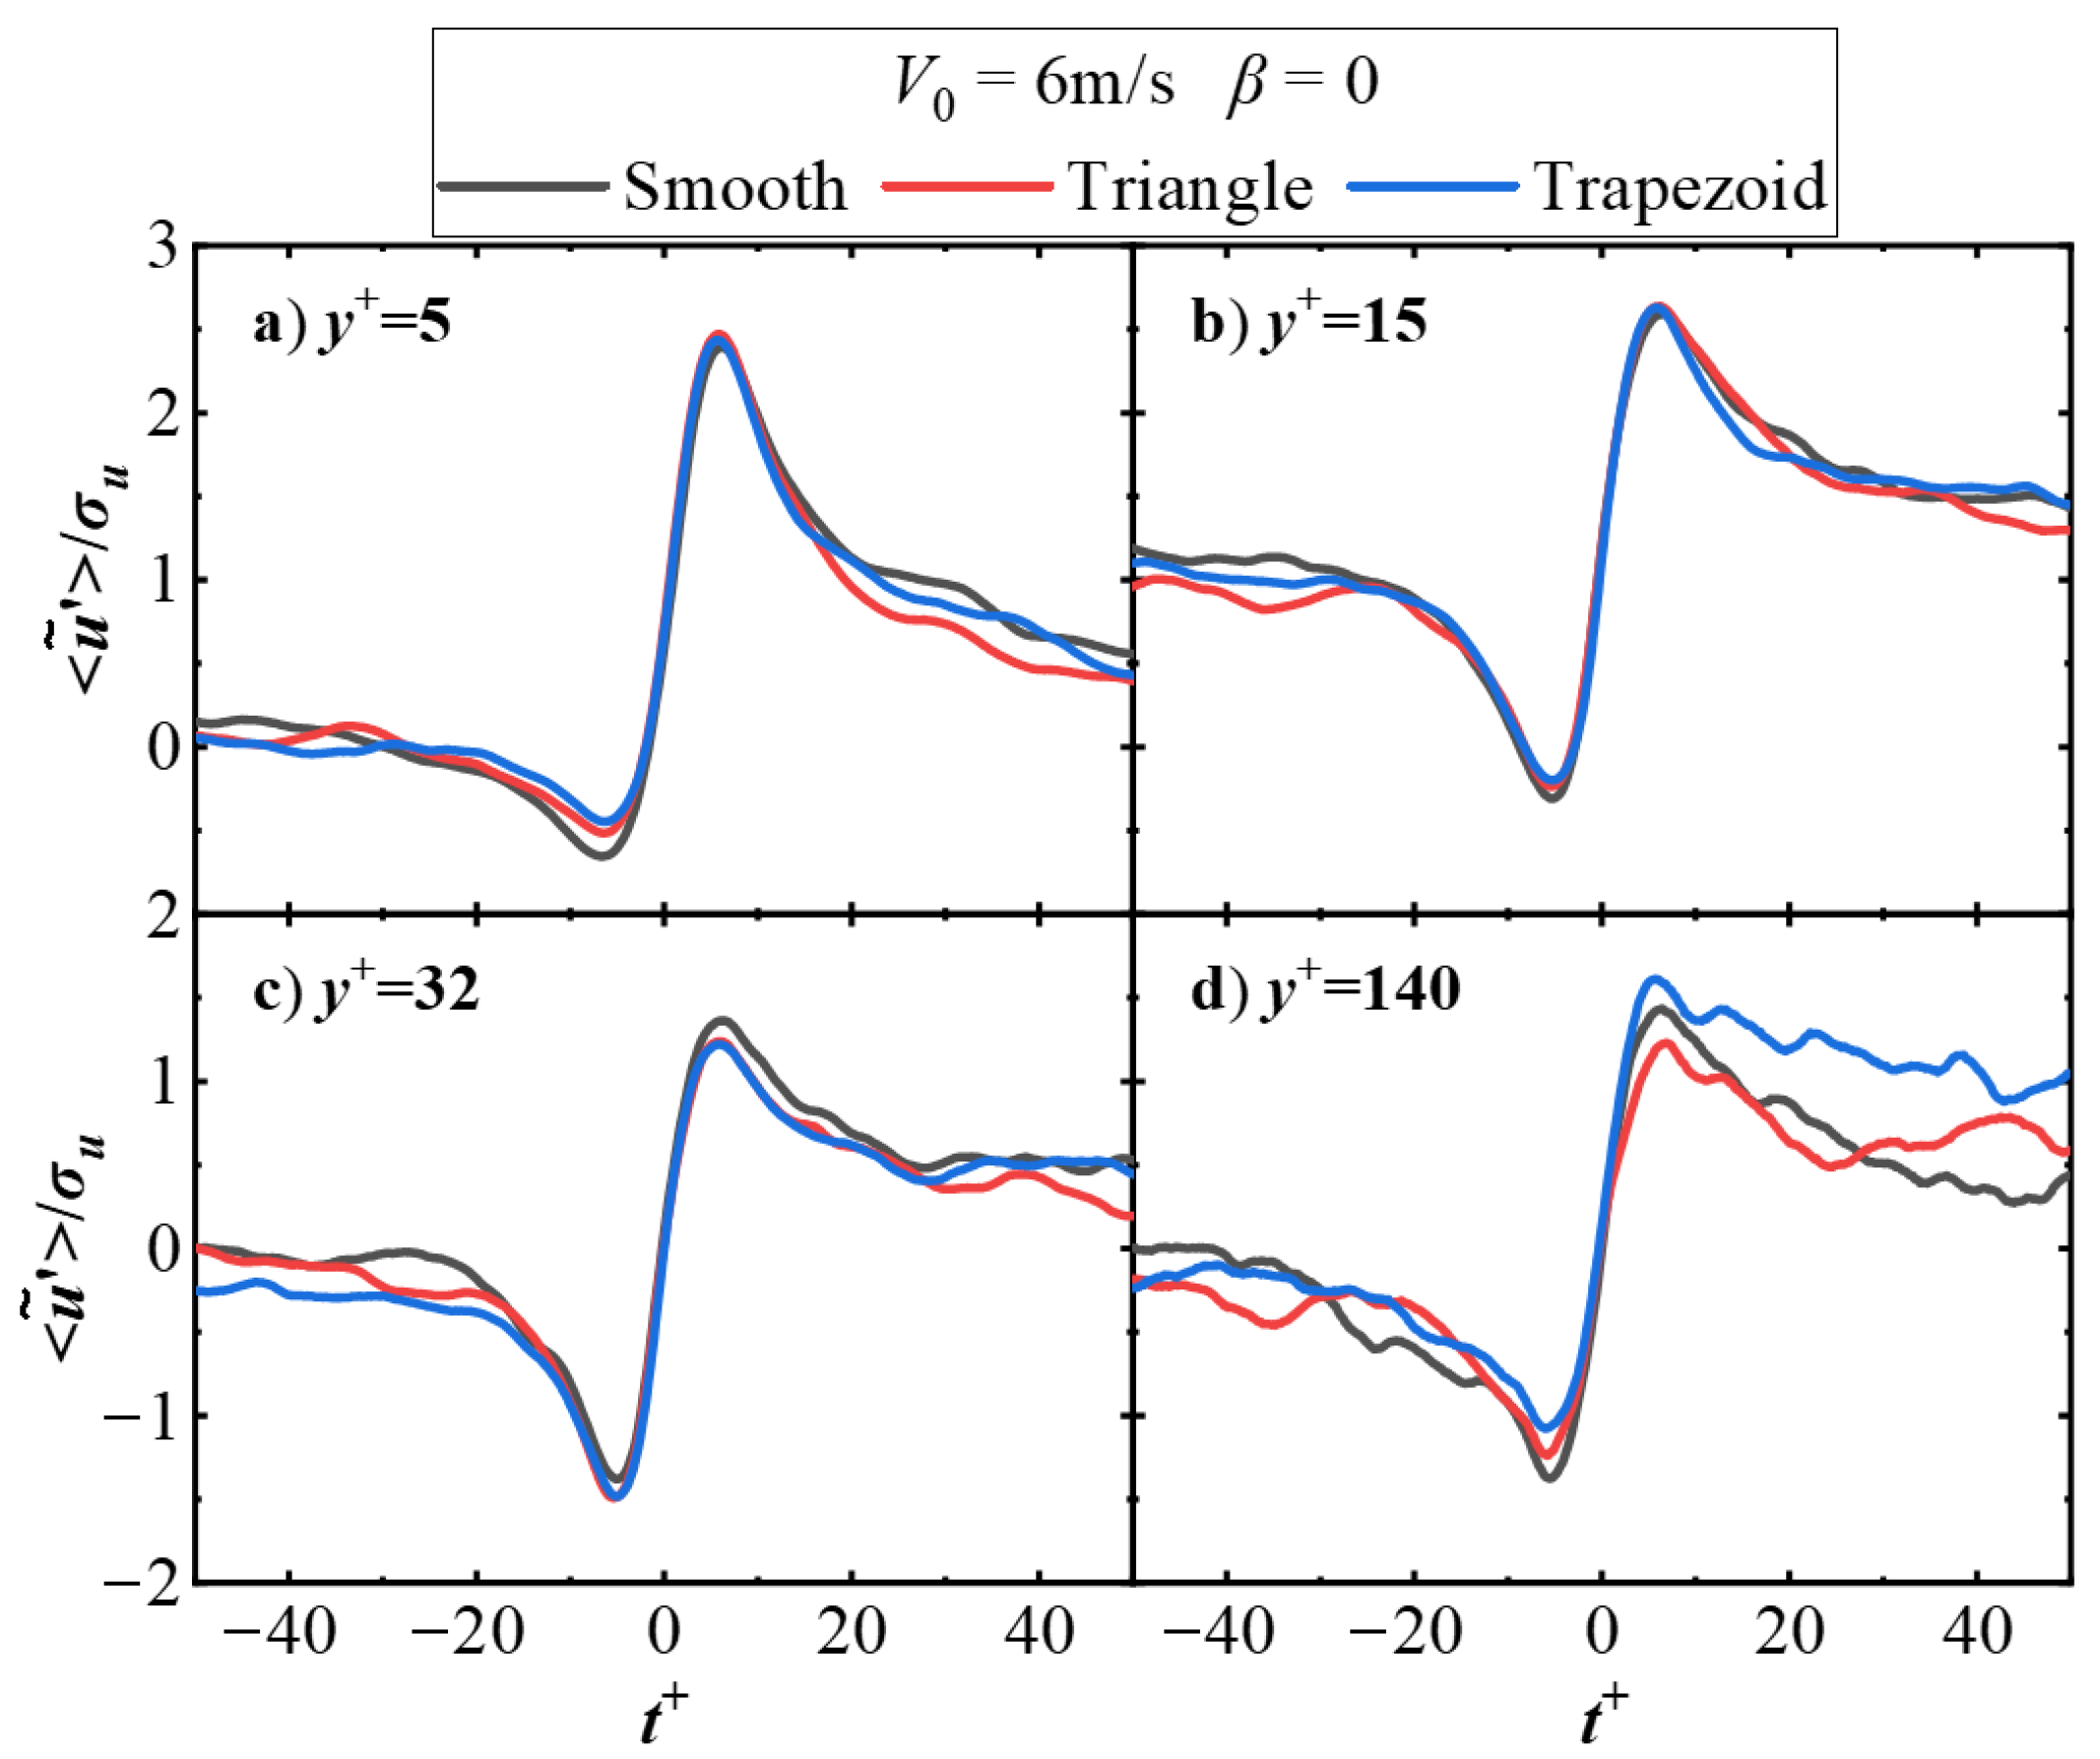
Figure 11 compares the conditionally averaged statistical results of velocity fluctuation for bursting events at different wall-normal heights between riblet and smooth walls for the case of (
β = 0, 6 m/s). Here,
represents the non-dimensional time, defined as
. For the four observed positions at
y+ = 5, 15, 32, and 140, it can be seen that within the dimensionless time range of −15 <
t+ < 15, the conditional velocity fluctuation for bursting events on riblet surfaces remains approximately constant compared to smooth walls. Beyond the range of
, no consistent pattern emerges between the velocity fluctuation on riblet surfaces and smooth walls, as local velocity fluctuations exhibit random variations before and after the concentrated enhancement caused by bursting events. Therefore, amplitude variations outside this region are not correlated with the presence or absence of riblet control. The separation and non-smooth phenomena observed in velocity fluctuations among the three wall types at
y+ = 140 are attributed to the relatively low number of detected local bursting events, which insufficiently averages out the differences in random velocity fluctuations during the conditional averaging process based on bursting events. The conditionally averaged velocity fluctuations at
y+ = 5 maintain positive values over a larger time range, indicating that the probability density function of velocity fluctuations is skewed toward the positive axis—referred to as “positive skewness”—with a corresponding positive skewness factor. Simultaneously, at
y+ = 5, the velocity fluctuations on riblet surfaces show an overall increase compared to smooth walls, suggesting a greater degree of positive skewness in their probability density function and a larger skewness factor. These findings are consistent with the results reported in the literature [
37].
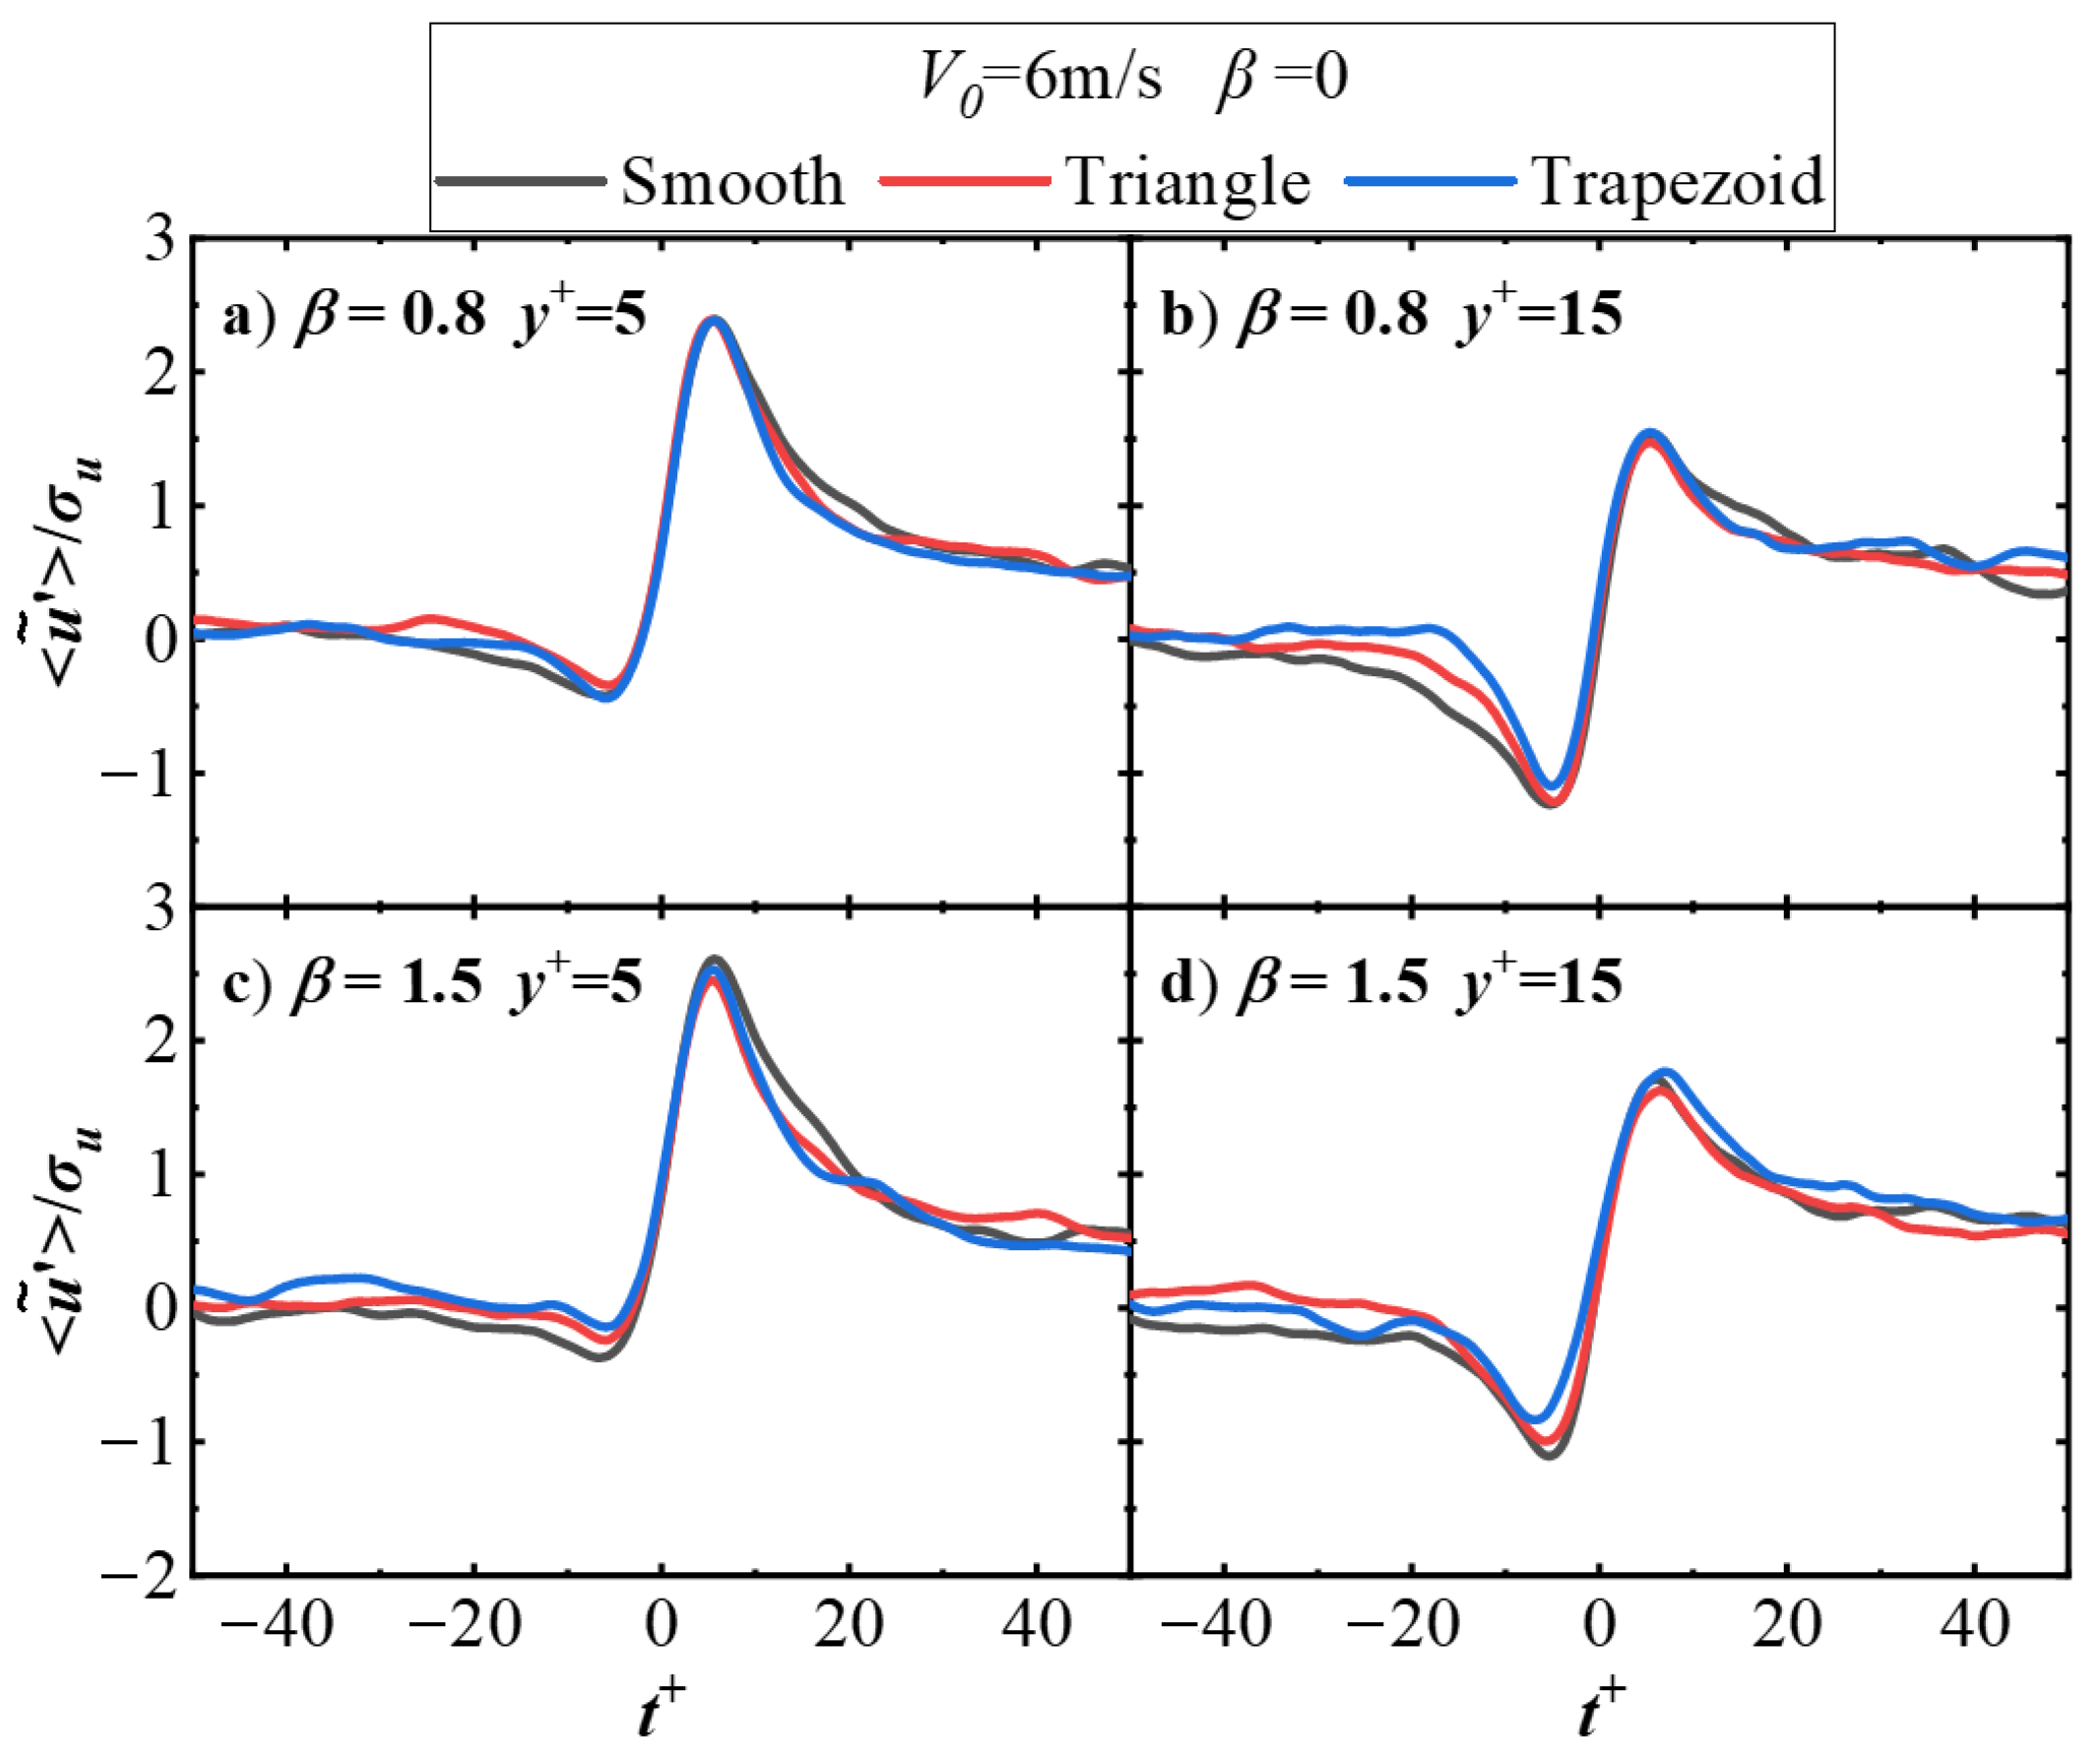
Figure 12 presents the conditionally averaged statistical results of velocity fluctuation for bursting events at different wall-normal heights for riblet and smooth walls at different adverse pressure gradient. Due to the insufficient number of bursting events at larger wall-normal heights, which leads to non-smooth and unstable variations in the statistically averaged velocity fluctuation, only the positions at
y+ = 5 and
y+ = 15 are considered here. The characteristics of amplitude variations remain consistent with those observed under ZPG condition: the conditionally averaged velocity fluctuation amplitudes on riblet surfaces show slight narrowing and an overall shift toward positive fluctuation velocities. Furthermore, across all pressure gradient conditions, trapezoidal riblets exhibit a greater influence on velocity fluctuation amplitudes than triangular riblets. These observations are consistent with the drag reduction rate results.
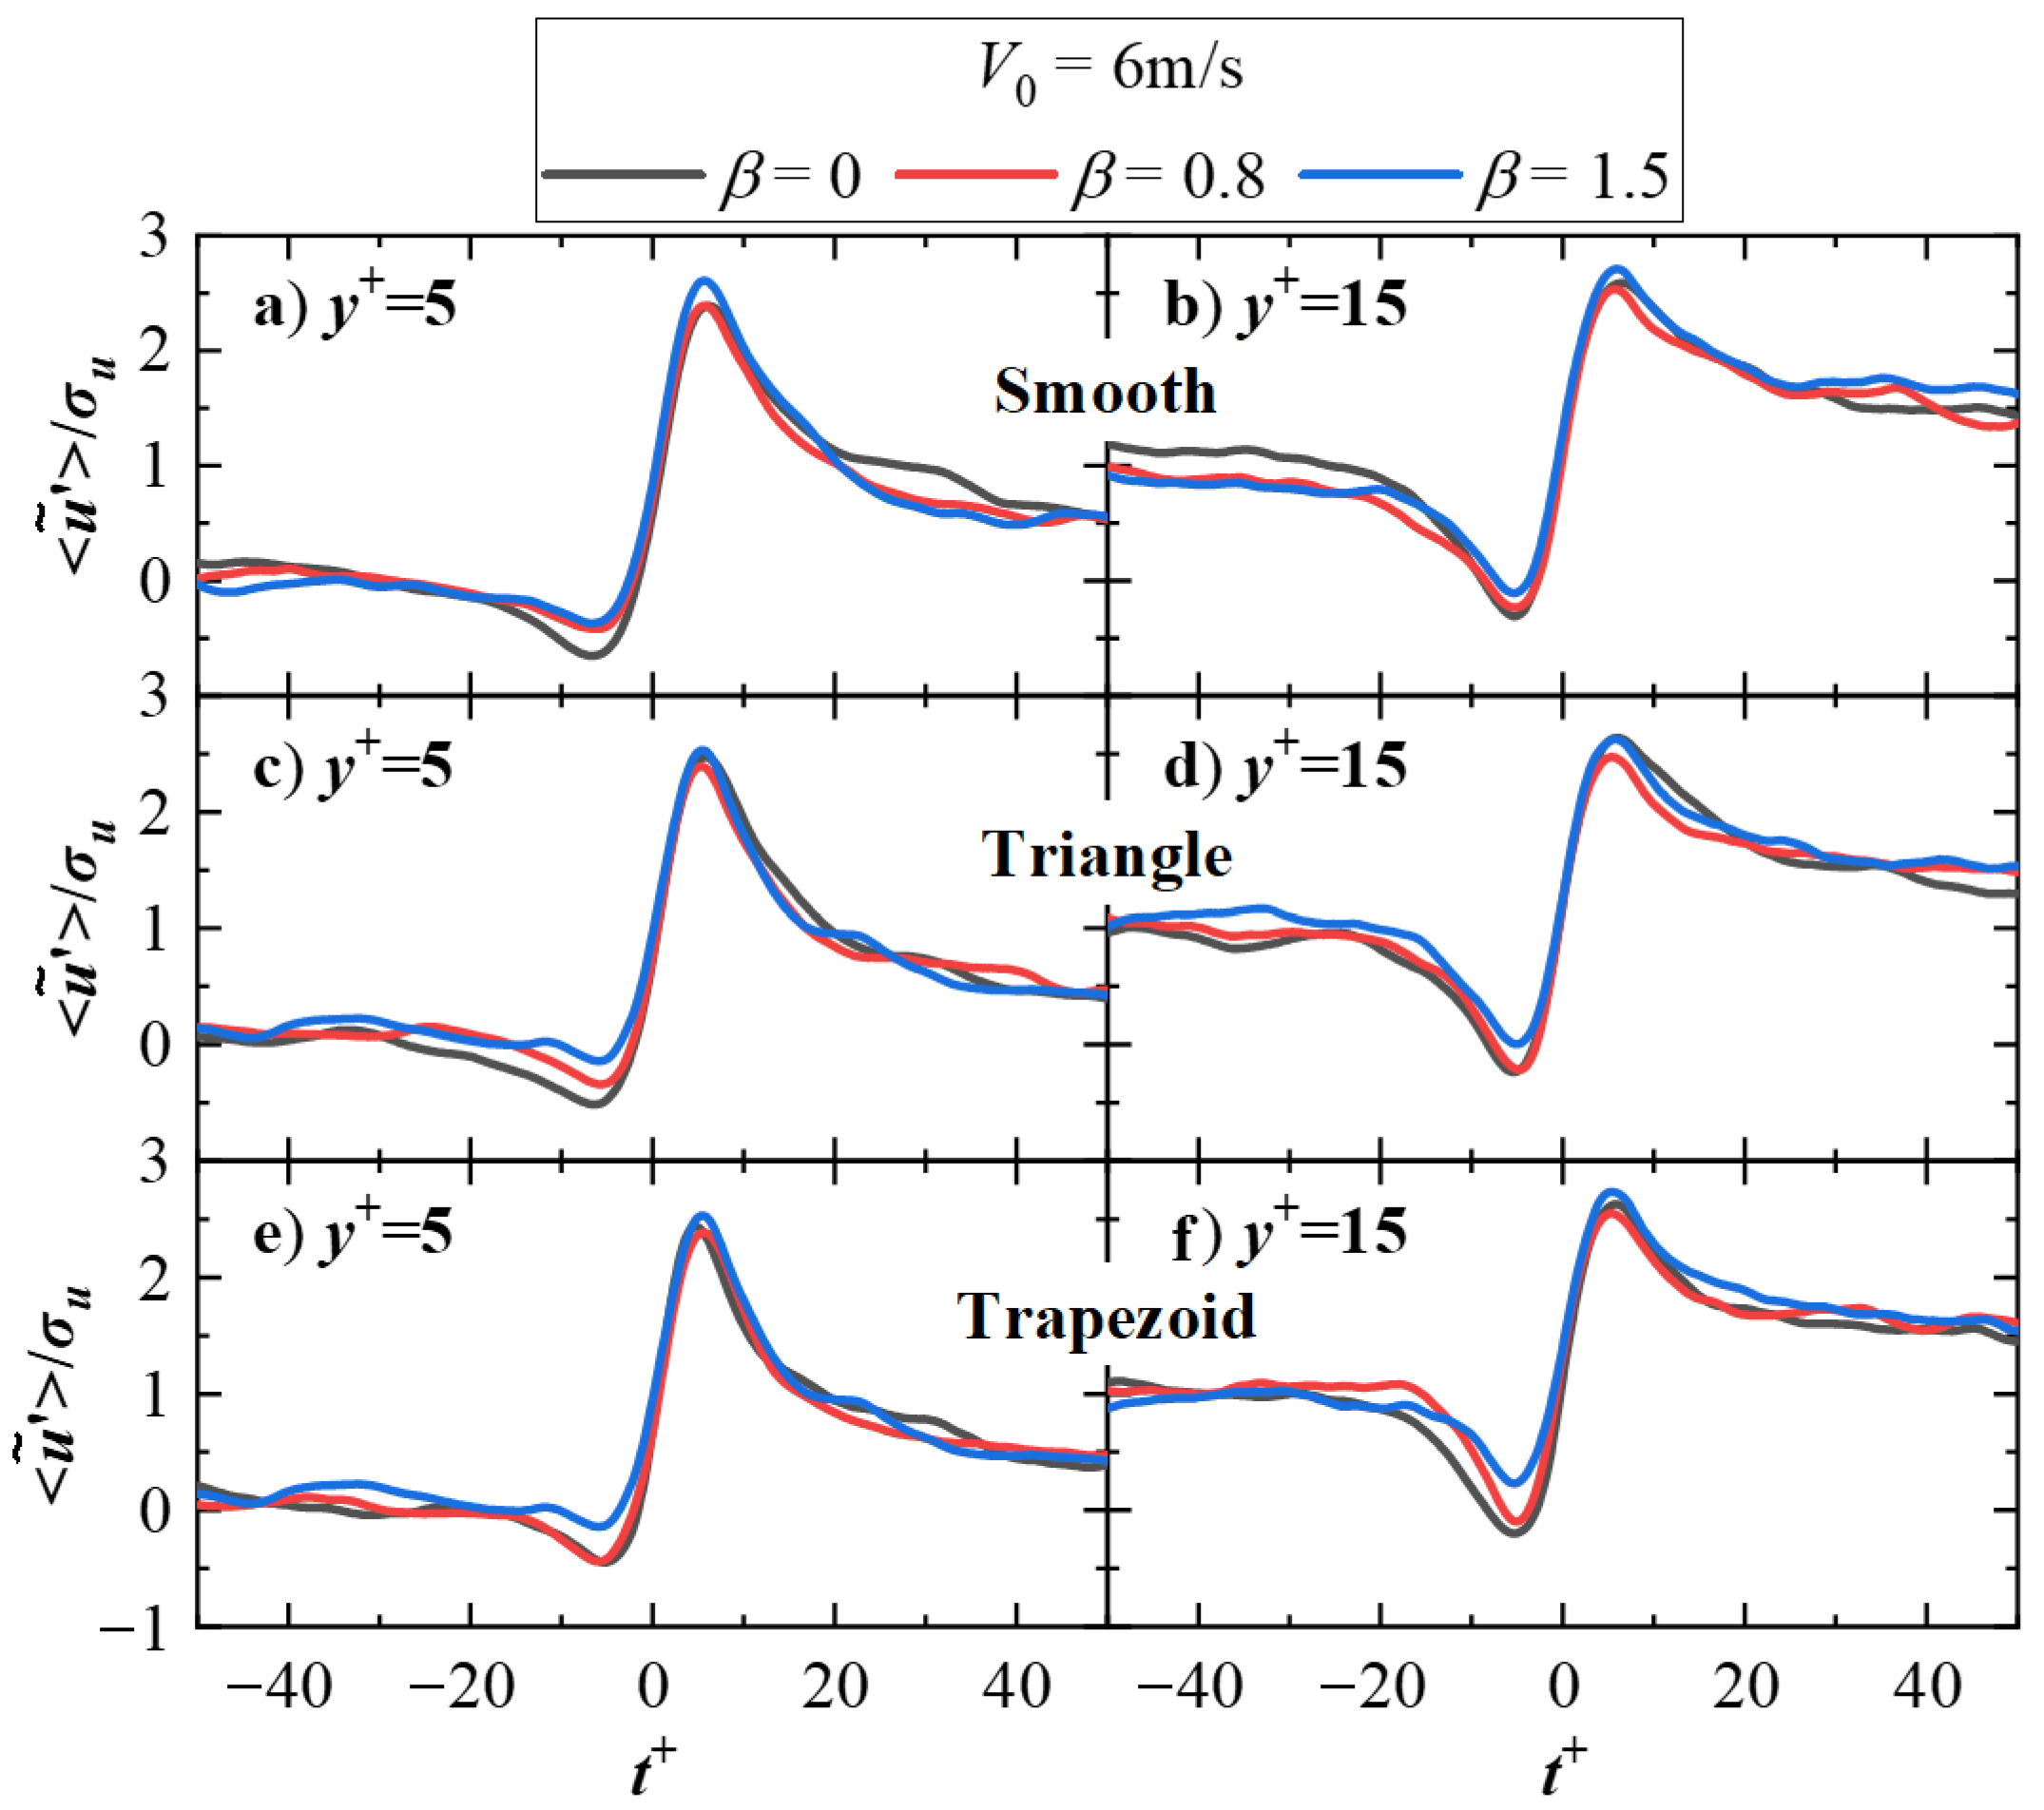
In the aforementioned figures, each subplot examines the conditionally averaged variations of riblet surfaces relative to smooth walls under fixed inflow velocity, wall-normal height, and pressure gradient conditions. As seen from
Figure 13, however, it fixes the wall-normal height (
y+ = 5 or
y+ = 15) and surface conditions to compare the influence of pressure gradient on conditional averaging at and for each surface condition. Rows represent identical wall boundary conditions, while columns correspond to the same wall-normal height. Observations reveal that for every compared wall boundary condition and normal height, the conditionally averaged velocity fluctuation amplitudes under adverse pressure gradient conditions are reduced compared to zero pressure gradient conditions, while simultaneously shifting overall toward positive fluctuation velocities. Moreover, the degree of amplitude reduction and overall shift exhibits a positive correlation with the magnitude of pressure gradient
β. This phenomenon shows strong consistency with the drag reduction rates demonstrated in
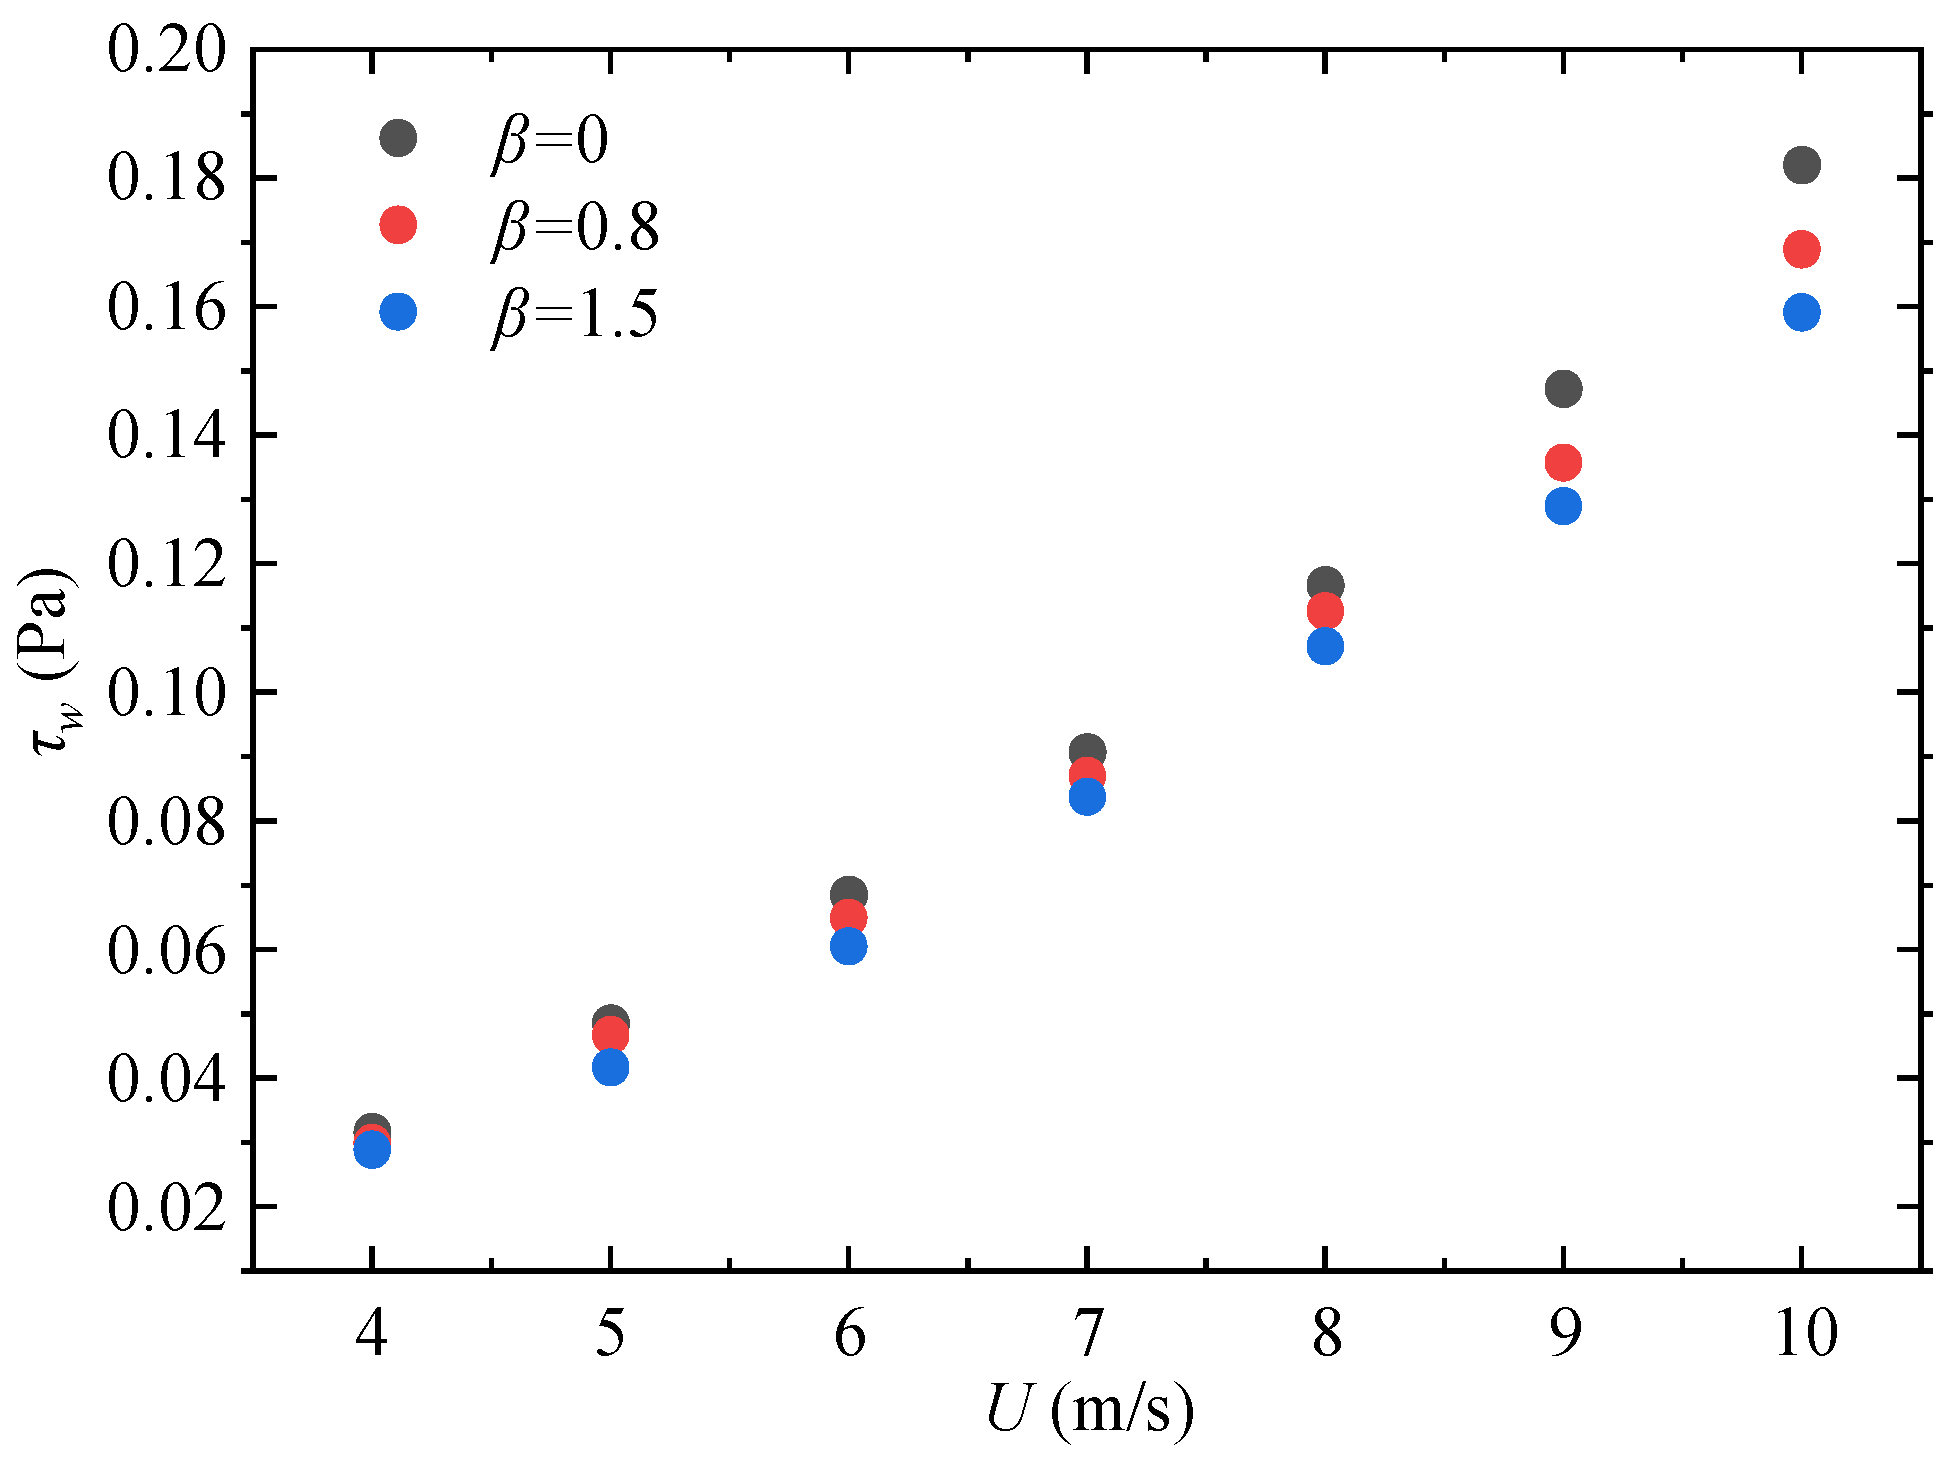
Figure 7 and
Figure 8.
In summary, riblet surfaces achieve drag reduction by suppressing the normal momentum exchange caused by bursting events through reducing both the burst frequency and intensity, with adverse pressure gradient exerting a positive reinforcing effect. Specifically, the presence of riblets alters the vortex generation mechanism in the near-wall region [
38]. Since bursting events are typically induced by near-wall vortex structures, riblets suppress the formation and development of these vortices, thereby reducing the dynamic factors that trigger bursting. Regarding changes in burst intensity, the ejection and sweep processes dominate during bursting events. The presence of riblets disrupts the formation and development of ejection flows, reducing their velocity and spatial extent. For the sweep process, riblets also diminish its intensity by modifying the near-wall velocity distribution and fluid motion paths, thereby weakening momentum exchange during sweeping.
Concerning the role of adverse pressure gradient, when it does not cause flow separation, it decelerates the near-wall fluid [
26], hindering momentum exchange between fluid parcels and the vorticity generation process. This further reduces the driving factors for bursting events and decreases the energy associated with both ejection and sweep processes. Consequently, the adverse pressure gradient introduces an additional layer of influence beyond that of riblets alone, creating a synergistic effect where the combined influence of riblets and APG exceeds the additive effect of each mechanism individually.
3.3. Inclination Angle of Coherent Structure
According to the experimental description in
Section 2, the hot-film probe remains in close contact with the wall and can sense flow field information at the wall. During a complete boundary layer measurement, the hot-wire probe continuously changes its height to detect flow field information in the spatial domain. Since the hot-wire probe is positioned directly above the hot-film probe and both measurements are synchronized, cross-correlation between the two can be performed to investigate the relationship between turbulent events in the spatial domain and those at the wall, or to study certain changes in turbulent structures. It should be noted that during synchronized hot-wire and hot-film measurements, a single (the
i-th) measurement only provides velocity fluctuations
at the respective probe positions and wall friction fluctuations
. To change the position of the hot-wire probe, multiple measurements are required, and these measurements do not correspond to the same spatial fluctuation field. However, by leveraging the ergodicity hypothesis, it can be approximately assumed that the statistical averages remain consistent across multiple measurements. Furthermore, using Taylor’s frozen turbulence hypothesis, a long-term measurement at a single point in space can be transformed into an instantaneous spatial observation. This enables the derivation of the hot-wire and hot-film cross-correlation. The cross-correlation function is defined as
, where
represents the time shift for the hot-wire and hot-film cross-correlation, also known as the lag time. Its expression is given by Equation (3).
Figure 14 shows the cross-correlation function between the hot-wire and hot-film probes for a 6 m/s flat-plate boundary layer. For each plate type, three typical positions are selected to illustrate the correlation function when the hot-wire probe is located at
, 15, and 60, respectively. The horizontal coordinate in the figure has been normalized using the time coordinate
, where one unit of
corresponds to an actual physical time of
approximately. As can be seen from
Figure 14, when the hot-wire probe is at the same height, the correlation function for the ribbed plate is lower than that for the smooth plate. As the height of the hot-wire probe increases, the peak value of the cross-correlation function continuously decreases, while the corresponding normalized lag time
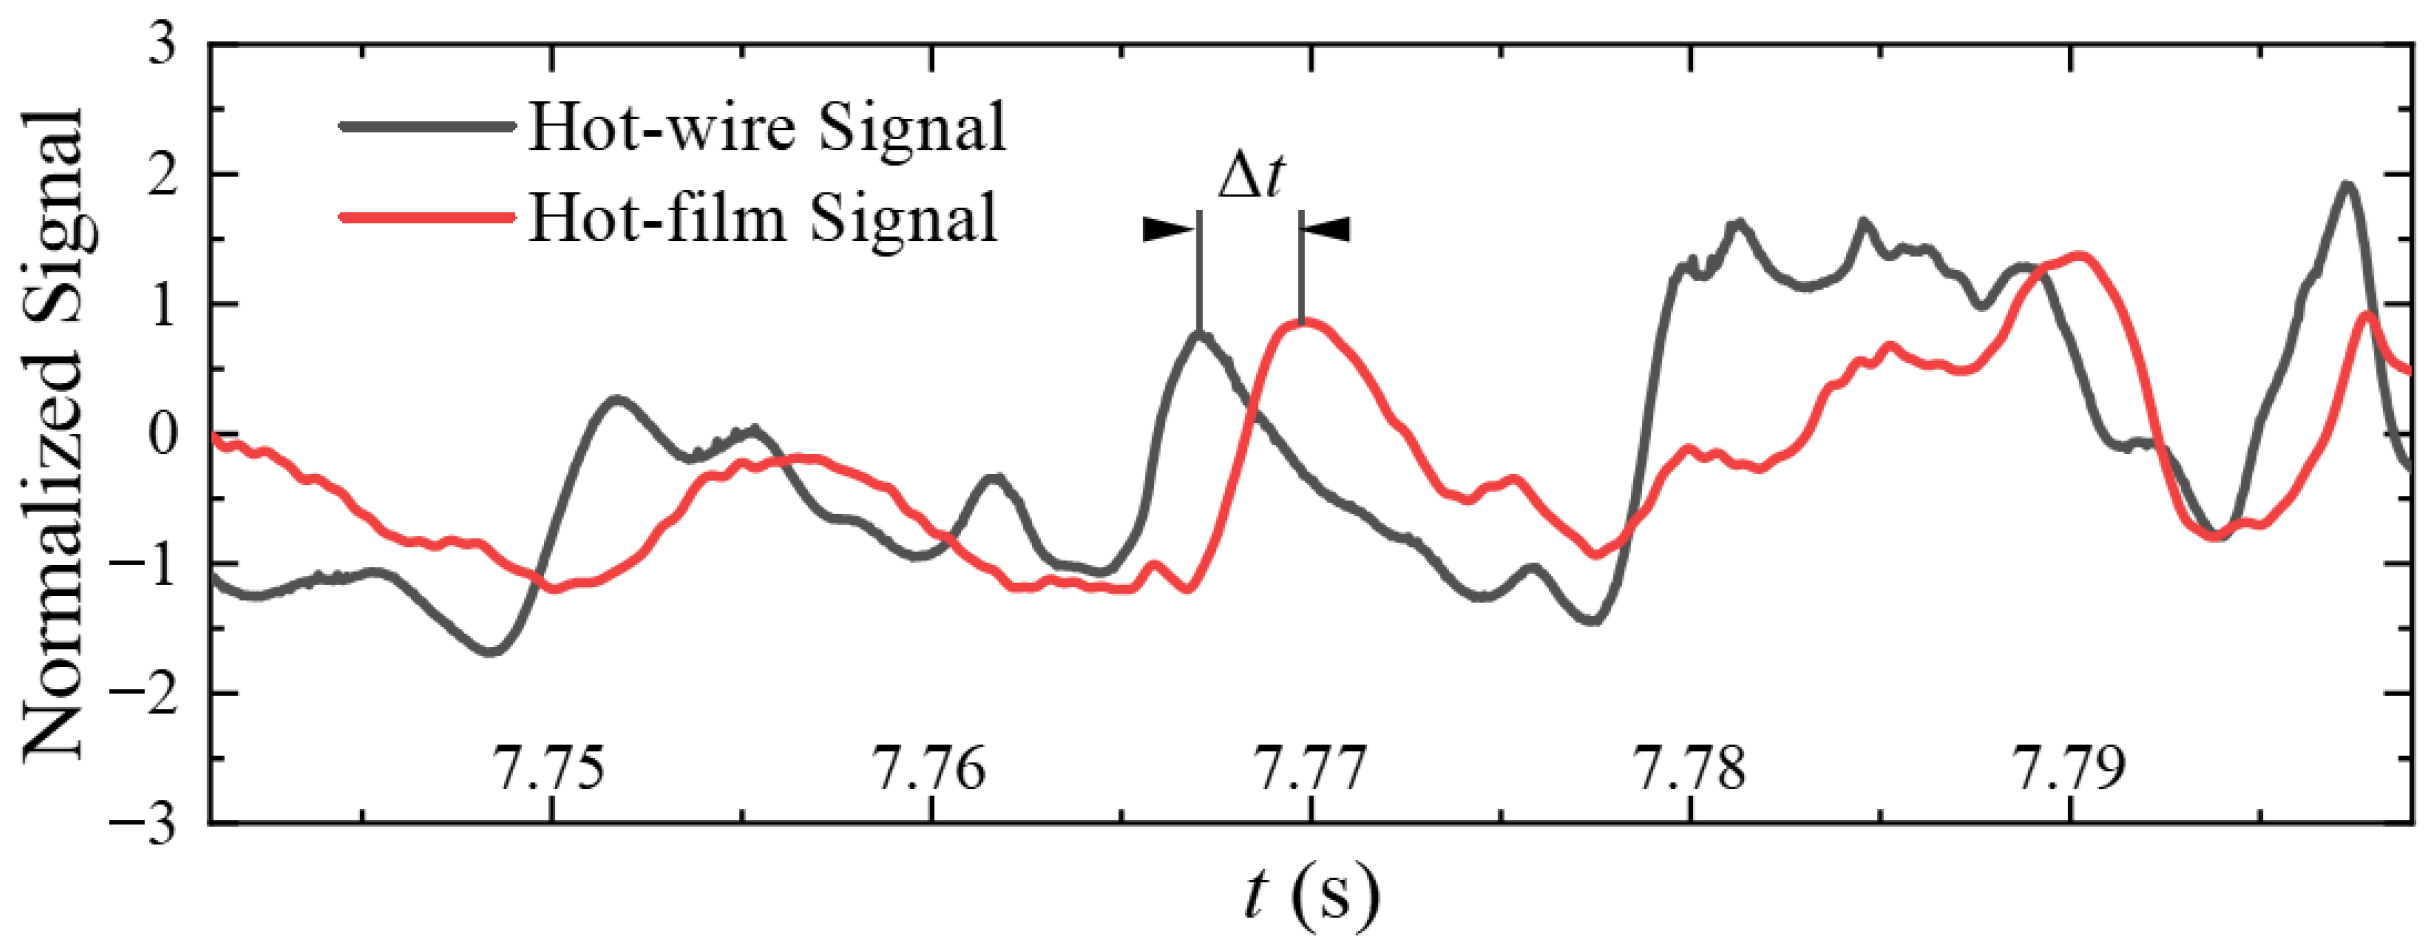
at the peak shifts further toward the negative direction of the time axis. According to the definition of the cross-correlation function, the above phenomenon indicates that a certain turbulent event present in the flow is first captured by the hot-wire probe located above the wall, and subsequently, the hot-film probe at the wall senses the impact of the same event. The time difference between these two detections is the lag time
, as illustrated in
Figure 15. Furthermore, during the propagation process, the event undergoes deformation or dissipation, causing the signals captured by the two probes to become less consistent as the height of the hot-wire probe increases. This is reflected in the overall reduction of the cross-correlation function.
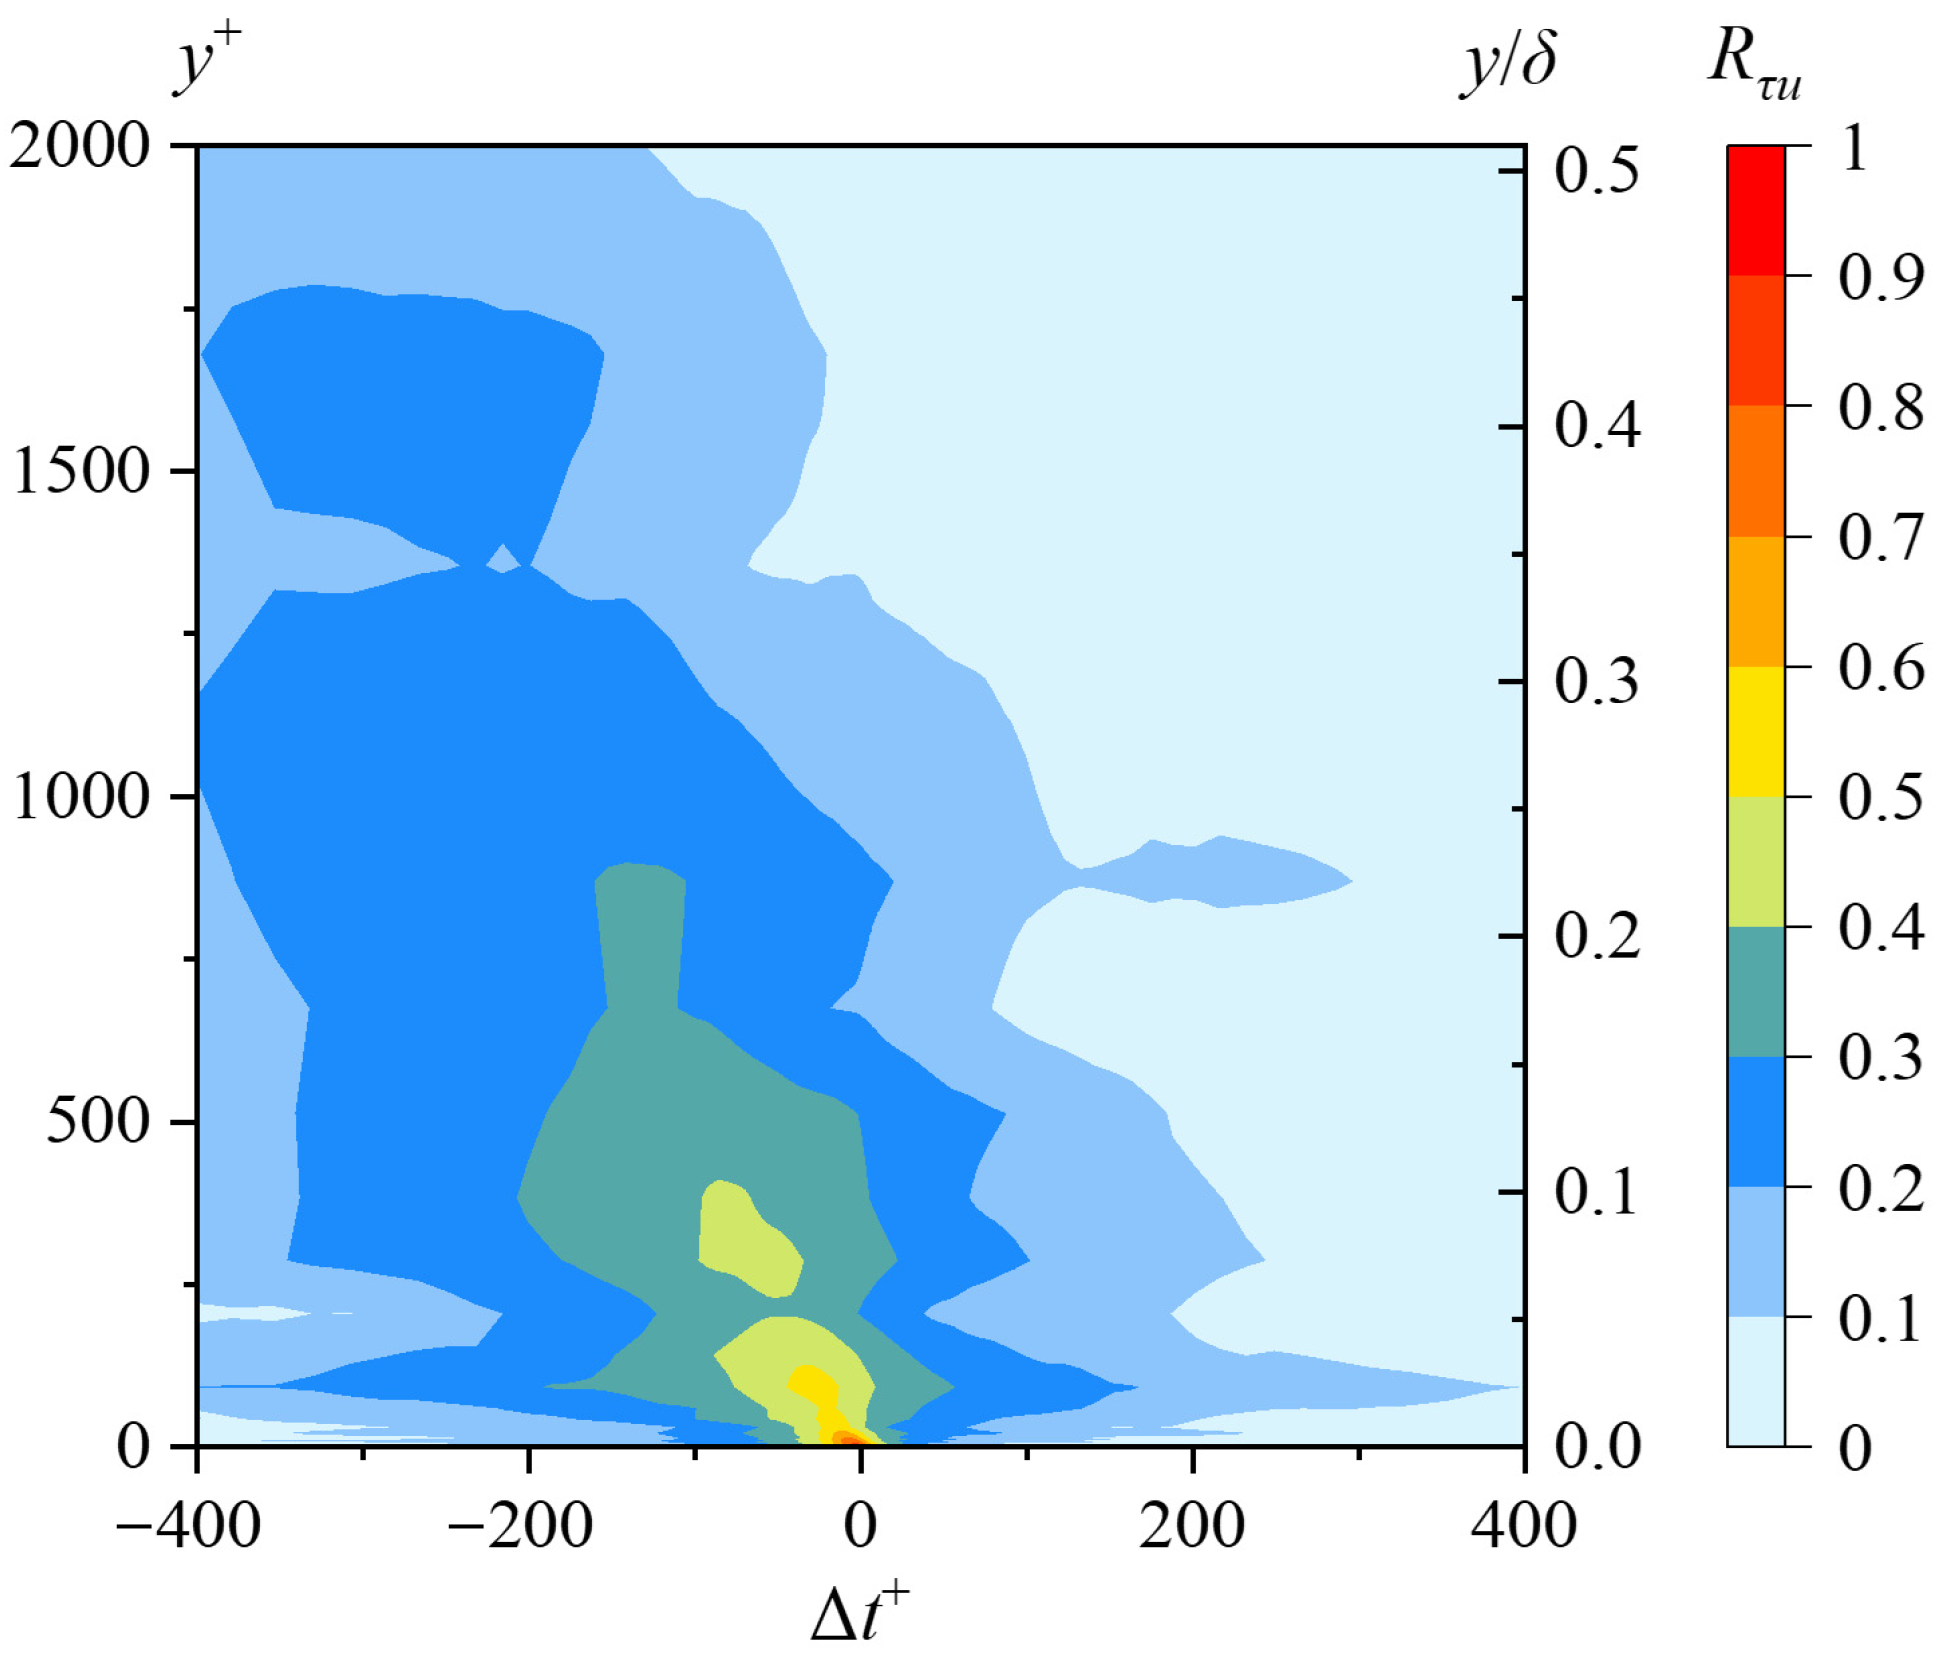
Plotting the cross-correlation functions between the hot-wire and hot-film probes at different heights as a contour map facilitates further observation of the temporal–spatial relationship between the spatial fluctuation field in the turbulent boundary layer and the wall friction stress fluctuations. As shown in
Figure 16, the shape of the correlation function indicates that the cross-correlation in the wall-normal direction tilts toward the negative time direction. This implies that when the hot-film probe measures the corresponding signal at the wall, the correlated signal measured by the hot-wire probe at a certain height above the wall has already convected downstream by the corresponding time shift
and spatial displacement
. Strong correlation signals (above 0.6) between the wall friction stress
and the local velocity
in the turbulent boundary layer are concentrated in the viscous sublayer and the buffer layer. This suggests a strong relationship between wall shear stress fluctuations and near-wall low-speed streaks. However, regions with a cross-correlation value of 0.3 extend into the logarithmic layer of the boundary layer, indicating that there is also a significant correlation between
and the logarithmic layer. This demonstrates that large-scale turbulent structures present in the logarithmic layer exert a notable modulating effect on wall friction stress
.
To quantify the relationship between the spatial flow field information contained in the cross-correlation function and the near-wall flow, as well as to examine the influence of riblets under different pressure gradients, the concept of the turbulence structure inclination angle is introduced here. Brown and Thomas [
39] used a hot-film wall shear stress probe and a wall-normal array composed of four hot-wires positioned above the hot-film to measure wall friction stress fluctuations and velocity fluctuations. After performing cross-correlation between the signals from the hot-wire and hot-film probes, they found that the results support the hypothesis that an “organized structure” exists in the boundary layer, which is inclined at a certain angle to the wall. Subsequent research on turbulent boundary layers generally identifies this structure as a hairpin vortex package or large-scale motion (LSM) [
27,
40]. Since the experimental conditions in this study do not allow for definitive identification of the specific type of this structure, it will be collectively referred to as a coherent structure in the following discussion. The inclination angle of this structure is often determined from the angle exhibited in the contour map of the two-point correlation function based on PIV flow field results. However, this method is not applicable to single-point hot-wire measurements. Therefore, the definition of the inclination angle proposed by Marusic and Heuer [
41] is adopted here:
Here, represents the height of the hot-wire probe, and denotes the spatial displacement described earlier. The superscript * indicates that corresponds to the lag time at which the maximum value of the hot-wire/hot-film cross-correlation function occurs. This definition can be interpreted as follows: if a coherent structure is inclined relative to the wall in the downstream direction, when the hot-wire and hot-film probes are aligned at the same streamwise position, the head or neck of the coherent structure will first pass the hot-wire probe. It then moves downstream at the local mean velocity and, after a time interval , the footprint of the coherent structure passes the hot-film probe at the wall. At this moment, the downstream convection distance of the structure’s head is exactly . Thus, the inclination angle can be defined as the arctangent of the height of the hot-wire probe divided by these convection distances.
Existing data on the inclination angles of coherent structures are abundant. Brown and Thomas [
39] initially combined and analyzed the cross-correlation functions between a hot-wire array (positioned at
y/
δ = 0.05, 0.25, 0.5, 0.75 and a hot-film probe, obtaining a coherent structure inclination angle of 12.3°. Volino et al. [
42] used Laser Doppler Velocimetry (LDV) and Particle Image Velocimetry (PIV) in a water channel to acquire detailed flow field results. Using reference points at
y/
δ = 0.2 and 0.7, they reported an average inclination angle of 13.2 ± 2.5° for coherent structures in the range 0.2 <
y/
δ < 0.7. Under laboratory conditions (
Reτ = 2800), Marusic et al. [
43] obtained an average inclination angle of 13.8 within
y/
δ < 0.15. Meanwhile, Marusic and Heuer [
41] conducted research on the atmospheric surface layer (ASL) at the Surface Layer Turbulence and Environmental Science Test (SLTEST) facility in Utah, USA, where the friction Reynolds number
Reτ reached as high as 10
6. They found an average inclination angle of 14.4 in the range
y/
δ = 0.0024∼0.0293, confirming the Reynolds number independence of the coherent structure inclination angle.
This section aligns with the research scope of Marusic [
41,
43] by calculating the inclination angles of coherent structures within
y/
δ = 0.073~0.183 (
y+ = 240~680) and
y/
δ = 0.0024~0.0293 (
y+ = 5~90), and examining the influence of riblets on these angles.
Figure 17 compares the hot-wire and hot-film cross-correlation functions obtained in this experiment with the results from Marusic’s two studies. At approximately the same dimensionless heights, the dimensionless spatial displacement corresponding to the maximum value of the correlation function shows good agreement with the literature data.
However, the amplitude of the correlation function obtained in this experiment is significantly larger than the values reported in the literature. This discrepancy may be attributed to the use of a Dantec 55P15 single-wire boundary layer probe in the present study, which directly captures streamwise velocity fluctuations and operates at a sampling frequency of 20 kHz. In contrast, Marusic et al. [
43] employed an Auspex A55P51 X-wire two-dimensional hot-wire probe. The process of converting signals from its two channels into streamwise and wall-normal velocity components may lead to the loss of some signal details. Meanwhile, in their investigation of the atmospheric surface layer (ASL), Marusic and Heuer [
41] utilized a Campbell Scientific CSAT3 sonic anemometer. While well-suited for atmospheric measurements, this instrument may exhibit slightly lower precision and sampling frequency compared to hot-wire probes, resulting in a reduced ability to capture high-frequency flow features.
For the smooth wall case at
β = 0 in this experiment, the average inclination angles of coherent structures were calculated over different height ranges. The result for
y/
δ = 0.073~0.183 (
y+ = 240~680) is
, while the result for
y/
δ = 0.0024~0.0293 (
y+ = 5~90) is
. These values are slightly smaller than those reported in the studies mentioned earlier. However, other literature has also reported similarly small inclination angles, with values as low as 6 [
44]. Therefore, the inclination angles obtained in this experiment can be considered within a reasonable range.
The influence of riblets on the inclination angle of coherent structures is examined. On the interval of
y/
δ = 0.073~0.183 (
y+ = 240~680), which represents the mid-logarithmic region of the turbulent boundary layer,
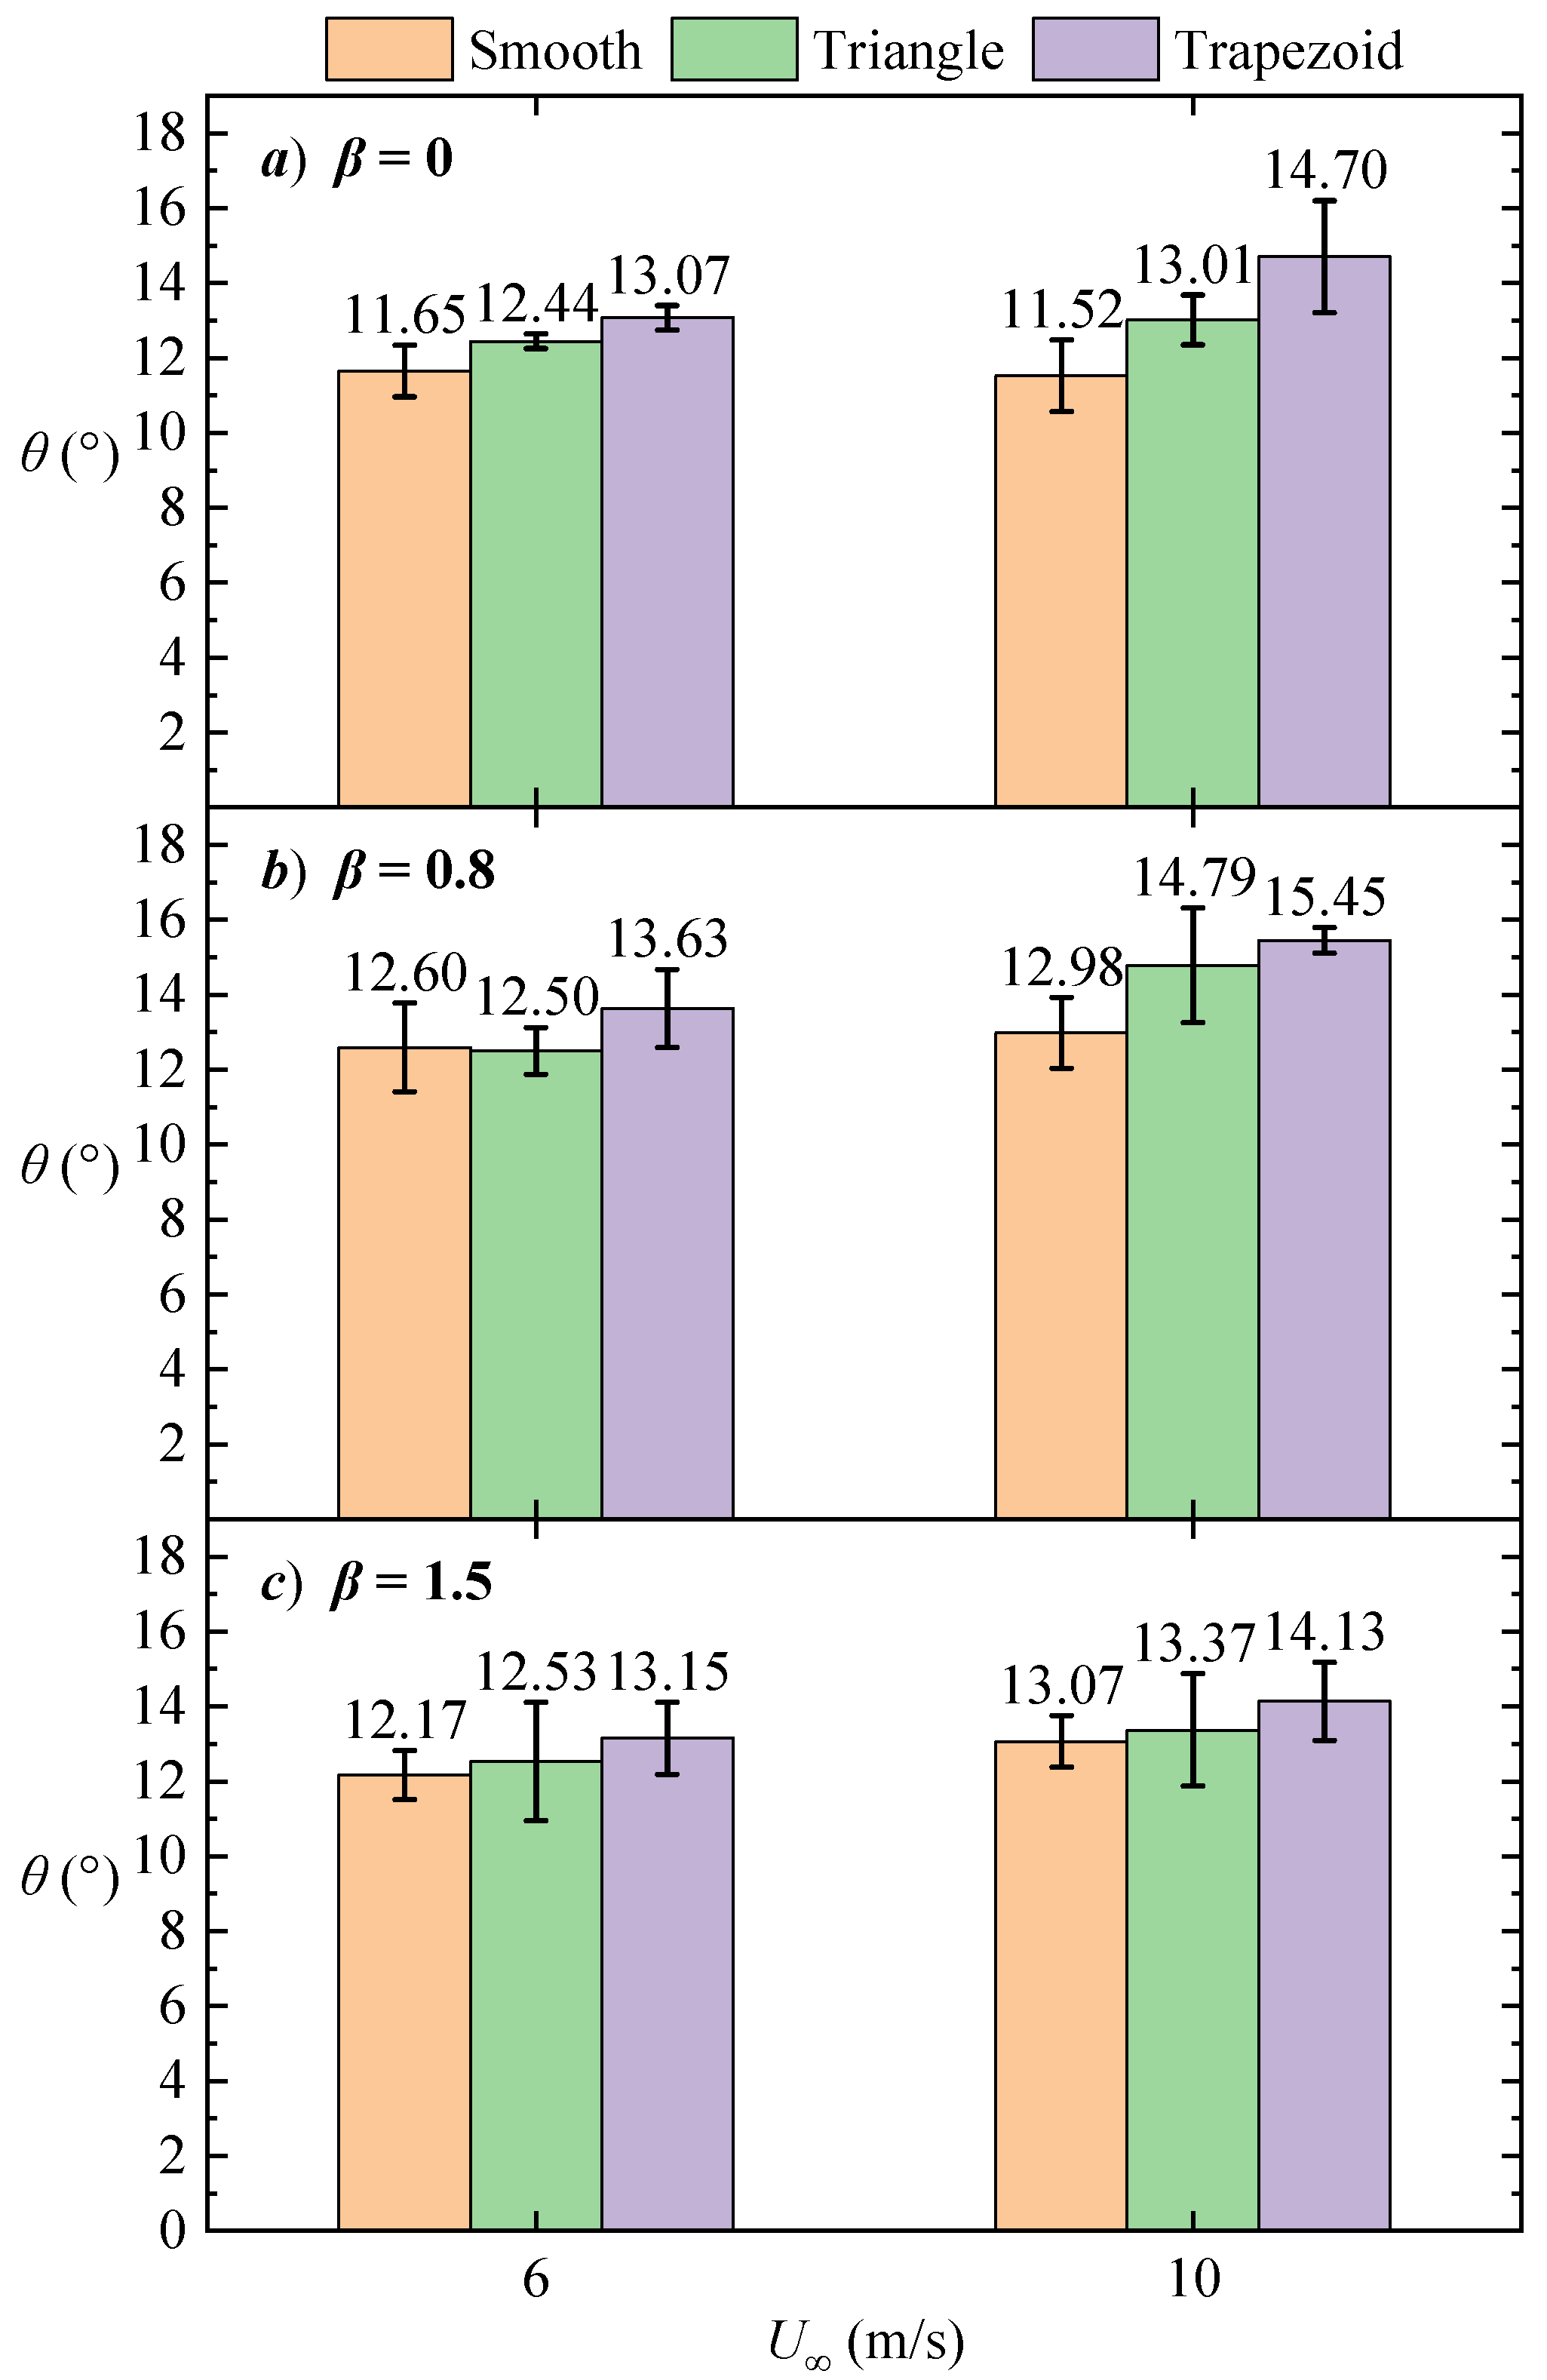
Figure 18 displays the distribution and statistical results of the inclination angles for different wall types under three pressure gradient conditions and two incoming flow velocities within this interval. For all pressure gradient and flow velocity conditions, the presence of both types of riblets increases the structural inclination angle compared to the smooth wall. This observation is consistent with the drag-reducing effect of riblets and can, to some extent, explain the mechanism behind it. Coherent structures within the
y+ = 240~680 range are considered large-scale structures (such as hairpin vortex packets). Studies have shown that large-scale structures modulate near-wall small-scale events [
45,
46], which is why wall stress events are often referred to as the “footprints” of large- or very-large-scale motions [
47].
When large-scale vortex systems in the mainstream sweep through the near-wall region, they disturb the fluid in the viscous sublayer and buffer layer, enabling some fluid to gain sufficient energy and initiate bursts. This leads to intense wall-normal momentum exchange and contributes significantly to Reynolds stress. Here, the increased inclination angle of large-scale structures over riblet surfaces compared to smooth walls implies that the vortex structures are lifted upward, reducing their interaction with the wall. Meanwhile, the decrease in the hot-wire/hot-film cross-correlation function for riblet surfaces in
Figure 16 indicates a weakened correlation between the large-scale motions above and wall stress events. This confirms that the increased inclination angle attenuates the modulation effect, supporting the reasonable inference that the frequency of burst events and the intensity of momentum mixing are reduced, thereby resulting in drag reduction.
Furthermore, by alternately examining the three images in
Figure 19a–c, it can be observed that when the incoming flow velocity and wall boundary conditions are held constant, the inclination angle of coherent structures at APG increases compared to that at ZPG. This result is consistent with the findings of Volino and Schultz [
27]. It is hypothesized that this outcome is caused by velocity deficit, and the increase in inclination angle similarly implies a reduction in streamwise shear. This conclusion aligns with the measured decrease in wall friction under adverse pressure gradient conditions in
Section 3.1, providing mutual validation. It also helps explain the positive effect of adverse pressure gradients on the drag reduction rate of riblets observed in
Section 3.1.
However, the magnitude of change in the structural inclination angle does not exhibit a linear correlation with the drag reduction rate. Although the drag reduction rates of the riblets increase sequentially at
β = 0.8, and
β = 1.5, the corresponding increases in inclination angle are not proportional to the improvements in drag reduction. In fact, the inclination angle at
β = 1.5 is lower than that at
β = 0.8, a result consistent with the findings of Volino and Schultz [
27]. These outcomes indicate that changes in the structural inclination angle represent only one aspect influencing drag reduction, and no simple linear relationship exists between the two.
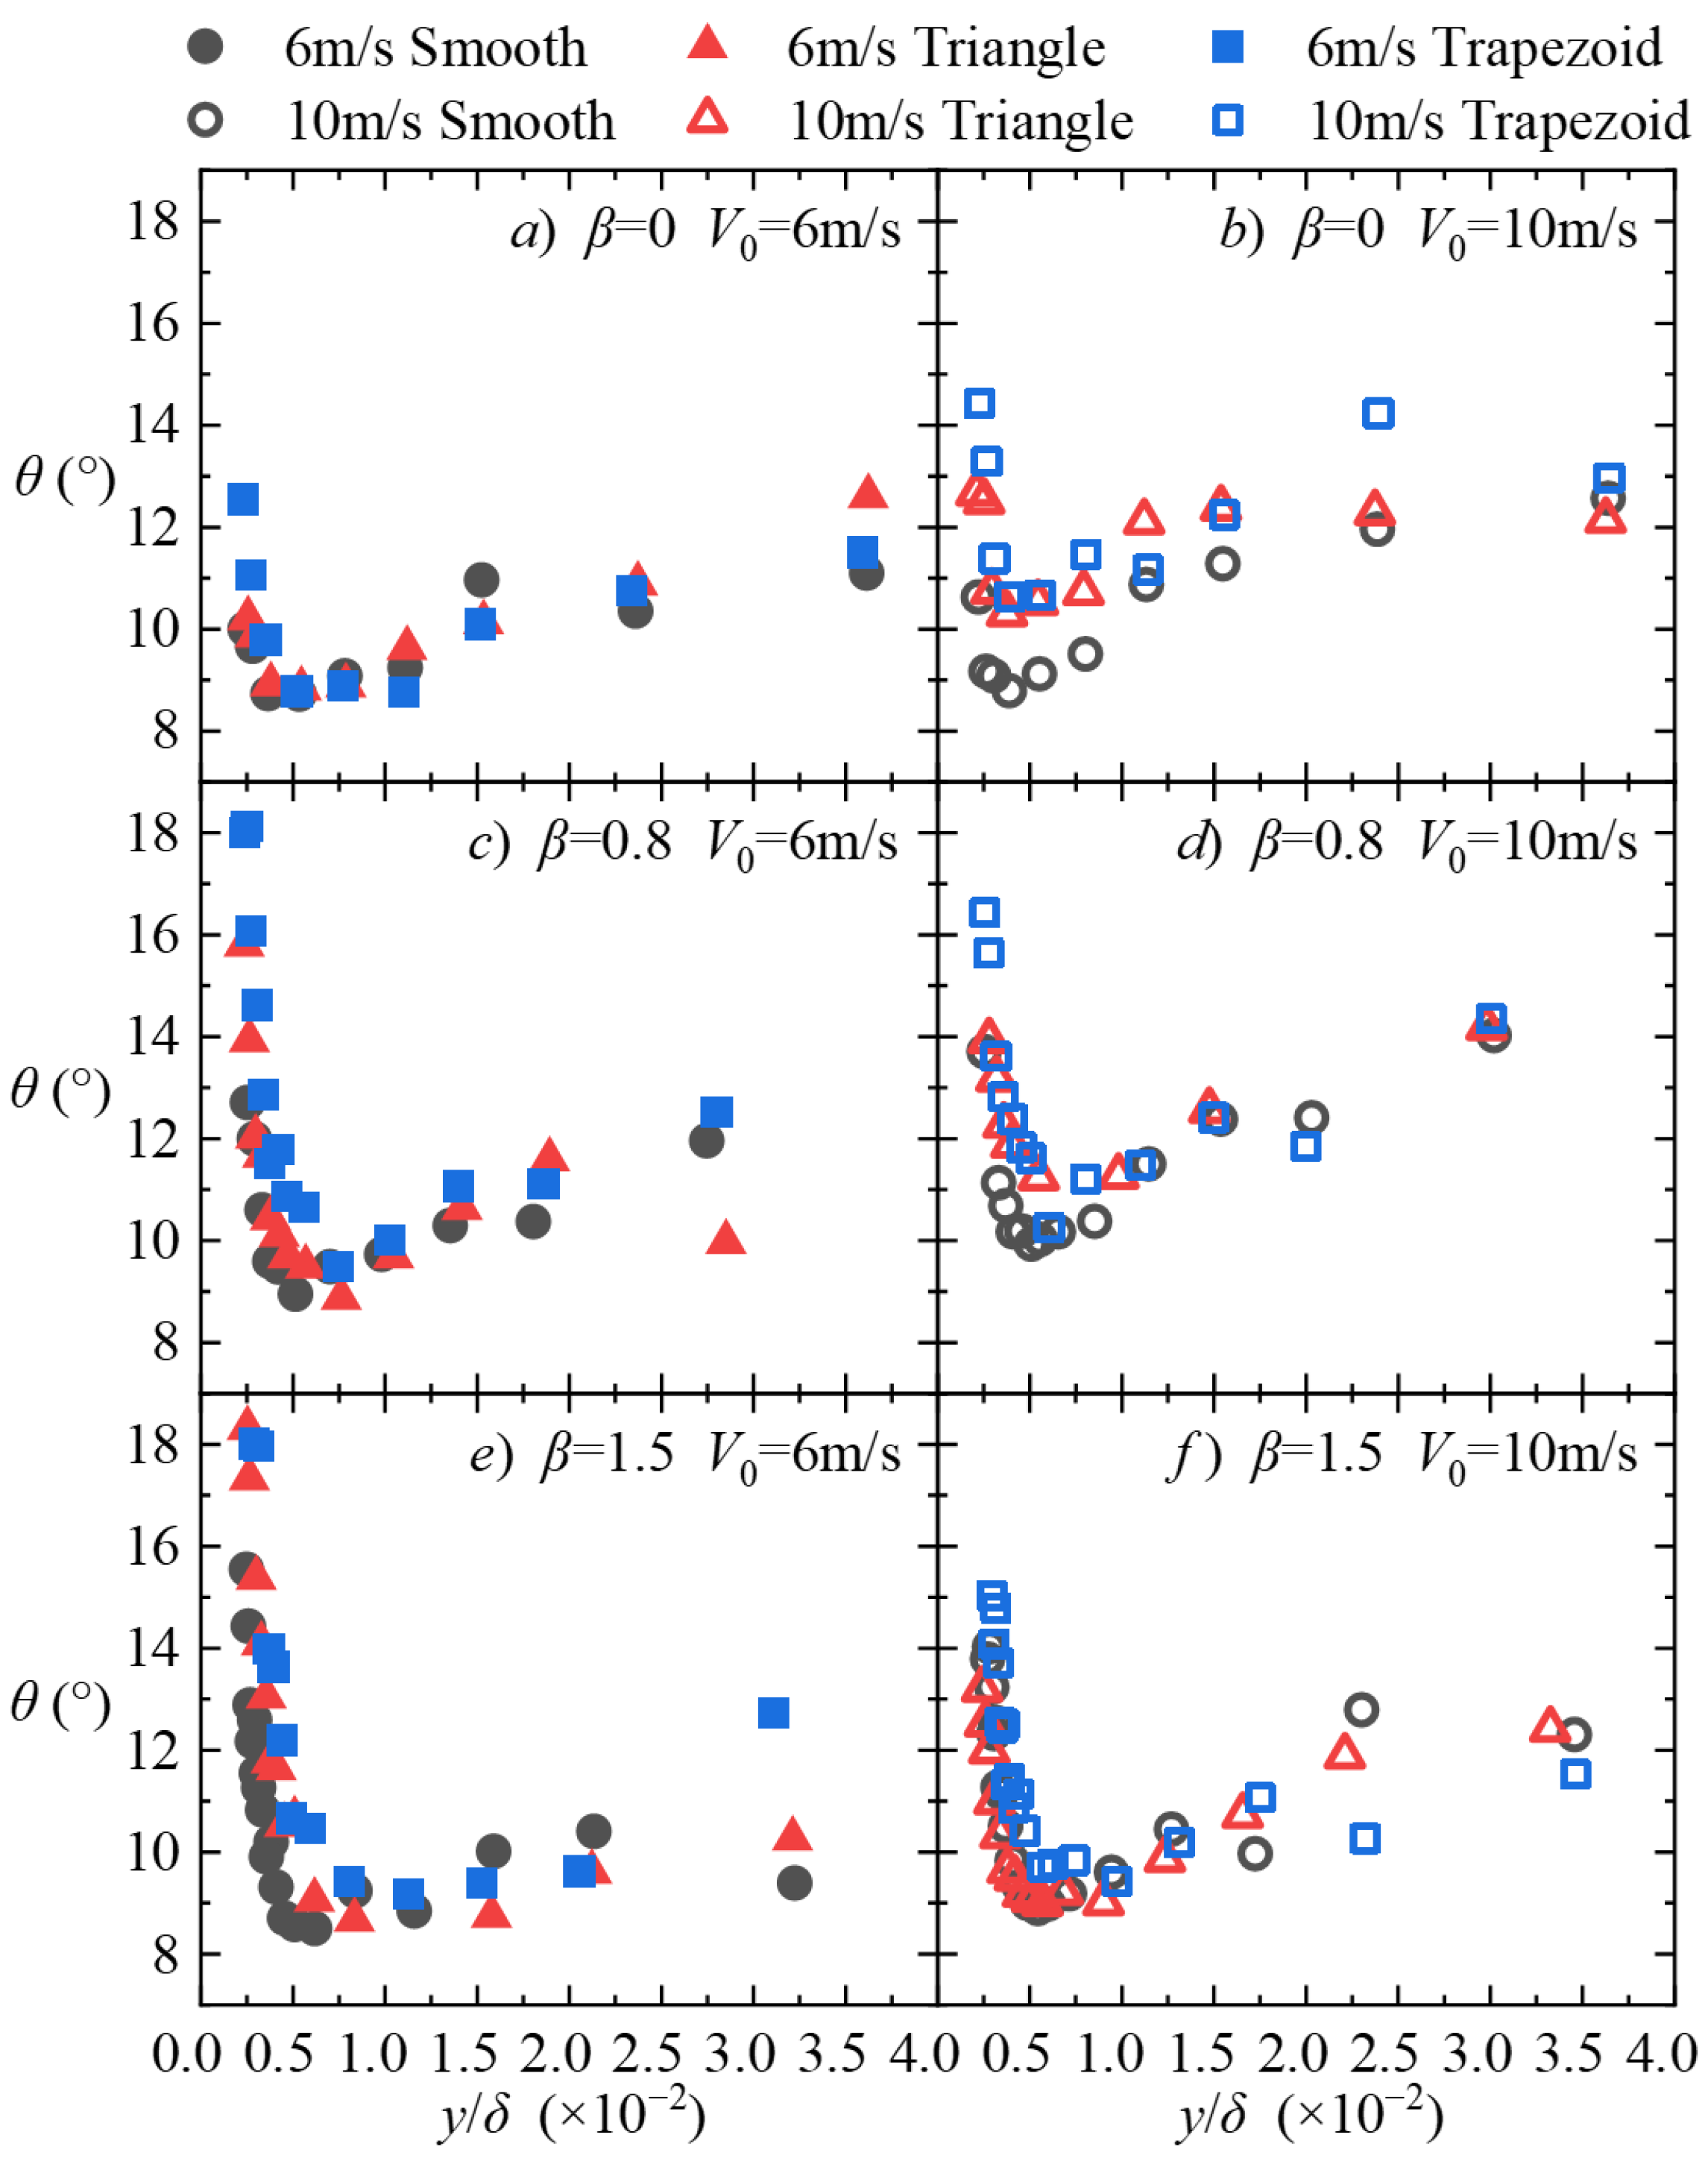
Next, we examine the interval of
y/
δ = 0.0024~0.0293 (
y+ = 5~90), which covers the viscous sublayer, buffer layer, and the lower portion of the logarithmic region. The coherent structures present in this range include low-speed streaks, quasi-streamwise vortices, and individual hairpin vortices [
48].
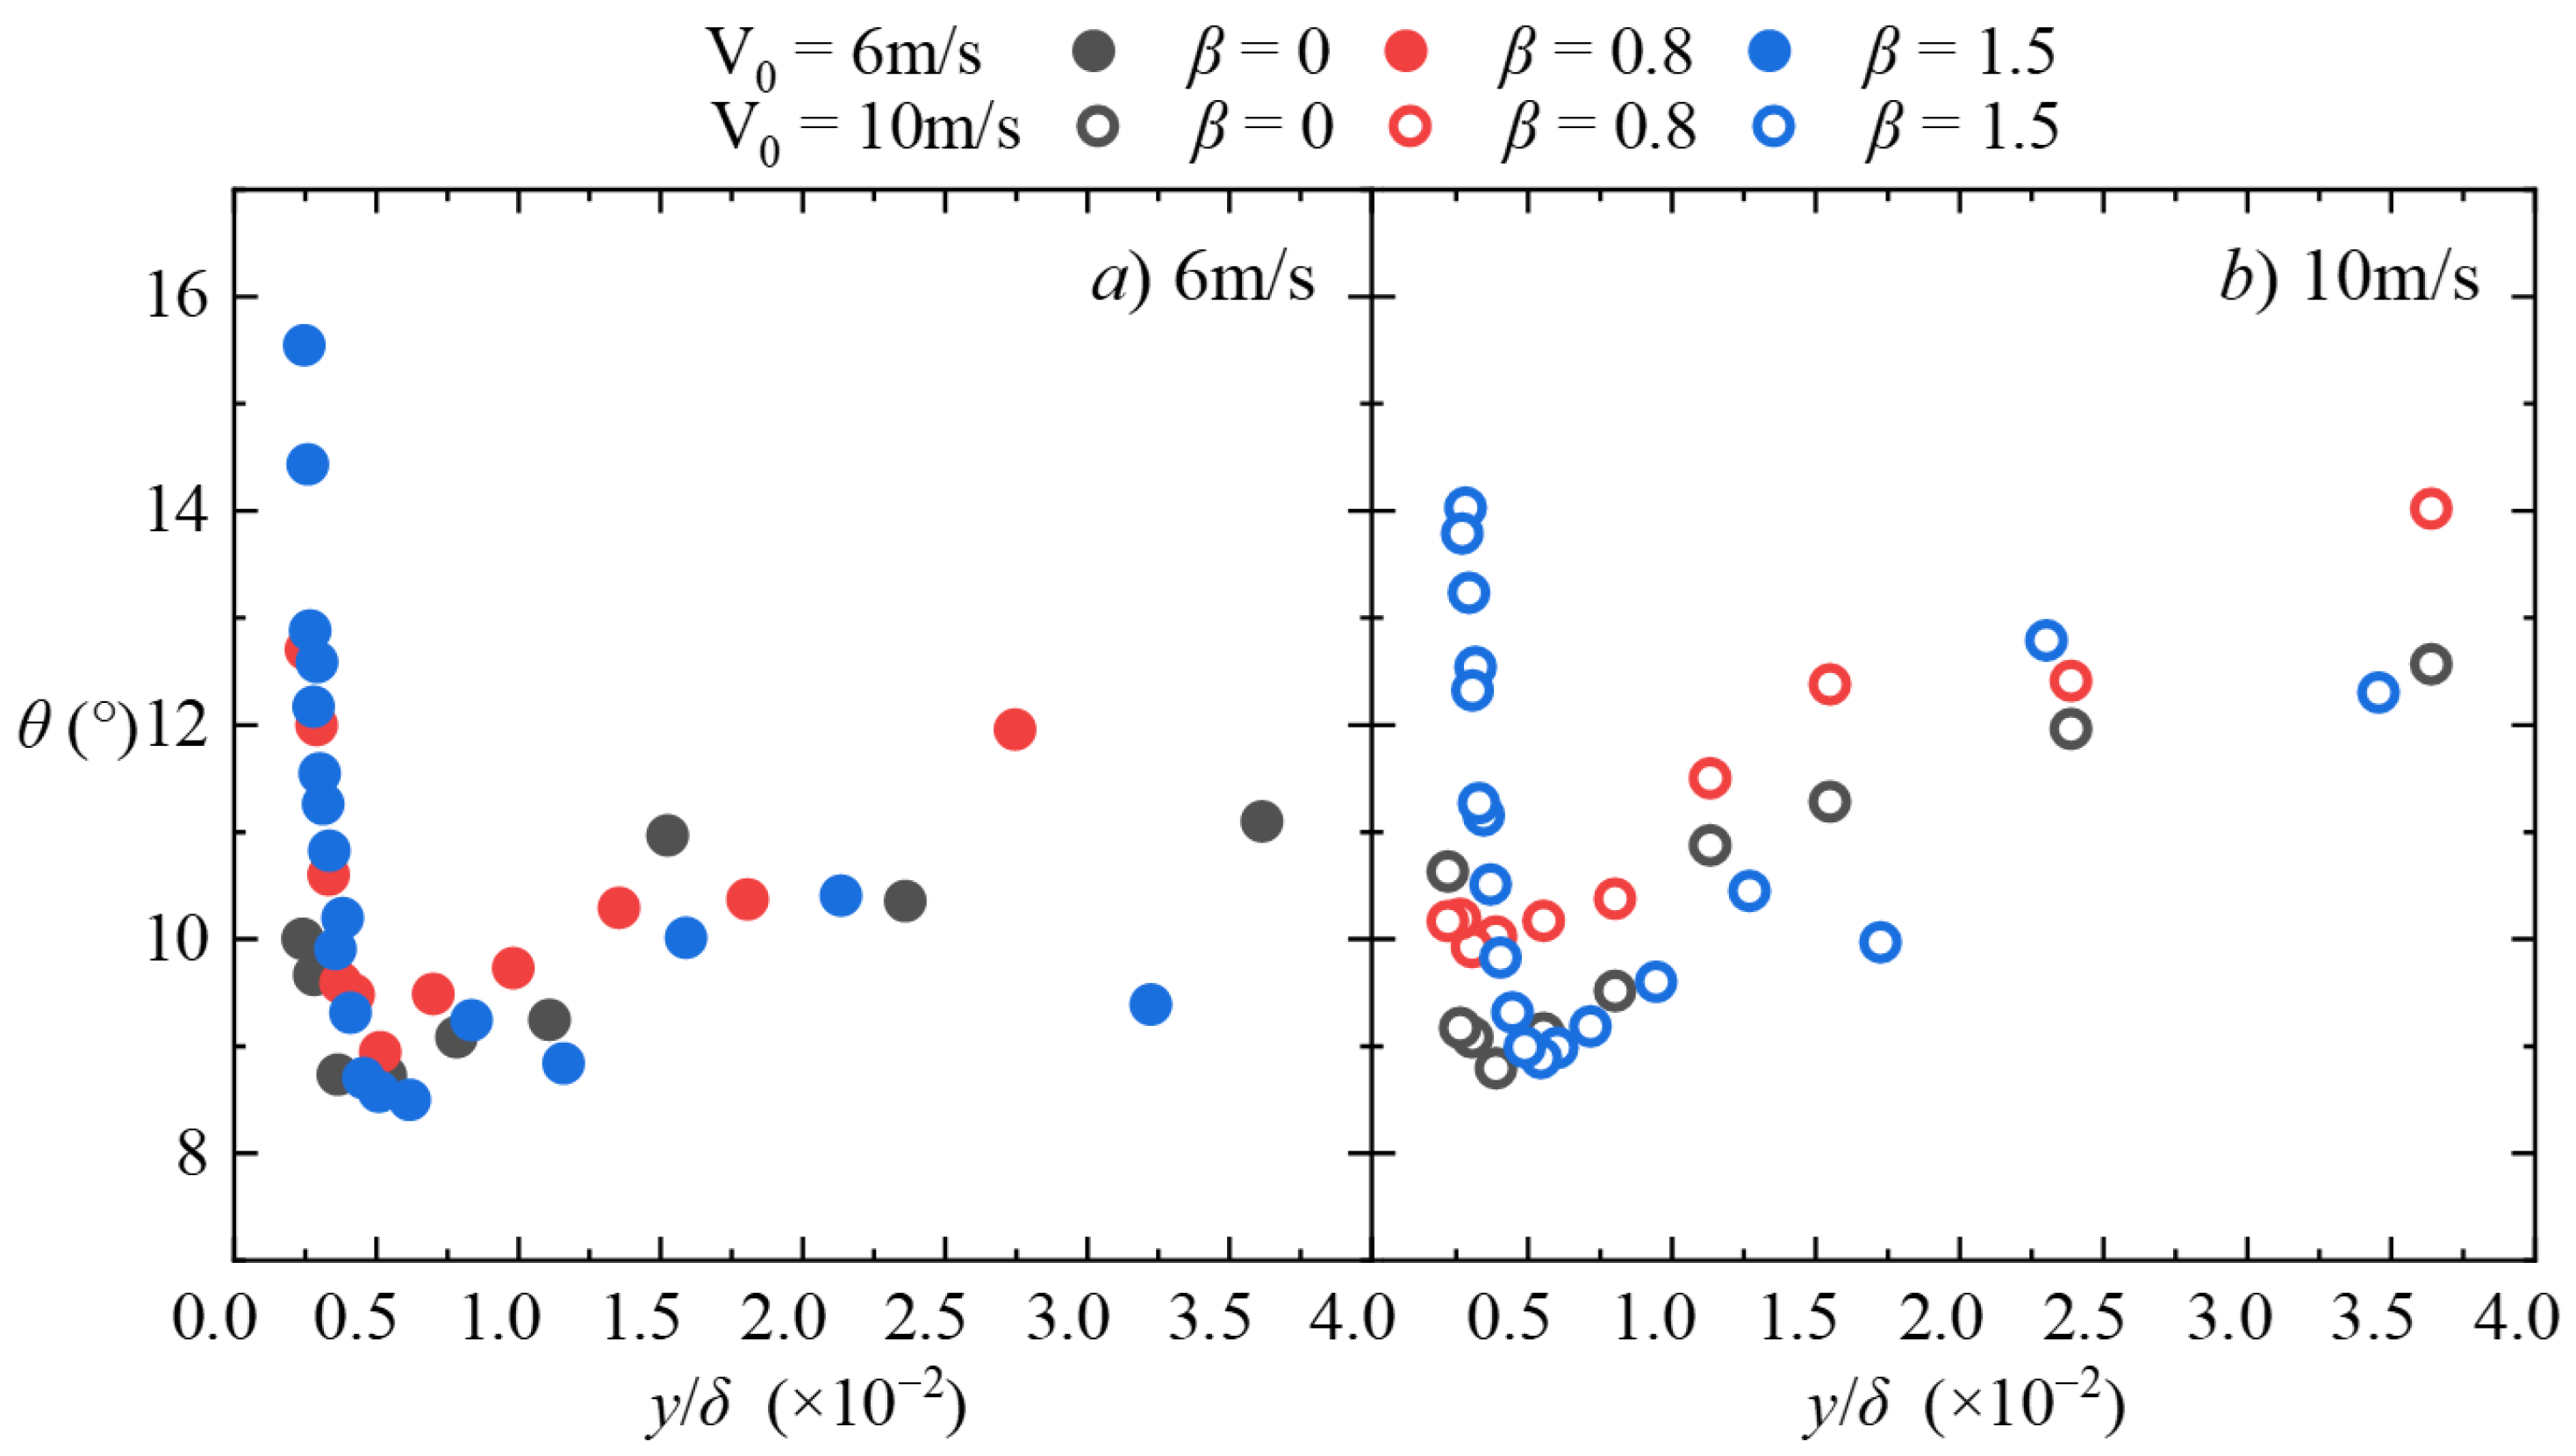
Figure 20 displays the distribution of inclination angles for different wall types under three pressure gradient conditions and two incoming flow velocities within this interval. However, due to the significant variation of inclination angle with height, no averaging was performed. Additionally,
Figure 21 shows the distribution of inclination angles for smooth walls under different adverse pressure gradients.
As seen in the figures, the structural inclination angles in this region still exhibit the characteristics described earlier for the logarithmic layer. Regarding the role of structures such as hairpin vortices in wall friction stress, Sheng et al. [
47] used Digital Holographic Microscopy (DHM) and Particle Tracking Velocimetry (PTV) to conduct detailed observations of flow structures—including counter-rotating streamwise vortex pairs, quasi-spanwise structures, and (hairpin-like) vortices—within a near-wall volume of
x+ ×
y+ ×
z+ = 88 × 145 × 88. They proposed a conceptual model in which spanwise vortices evolve into hairpin vortices and counter-rotating streamwise vortex pairs and employed conditional sampling to identify extreme stress events generated during their evolution, thereby capturing the “footprints” of wall friction stress. For example, sweeping events occur on one side of a streamwise vortex or near the head of a hairpin vortex, locally generating extreme stress.
Therefore, similar to the previous analysis, the increased inclination angle of these coherent structures—combined with the weakened cross-correlation between the wall and the flow above—suggests that such evolution is likely to reduce extreme stress events, thereby contributing to drag reduction.
