1. Introduction
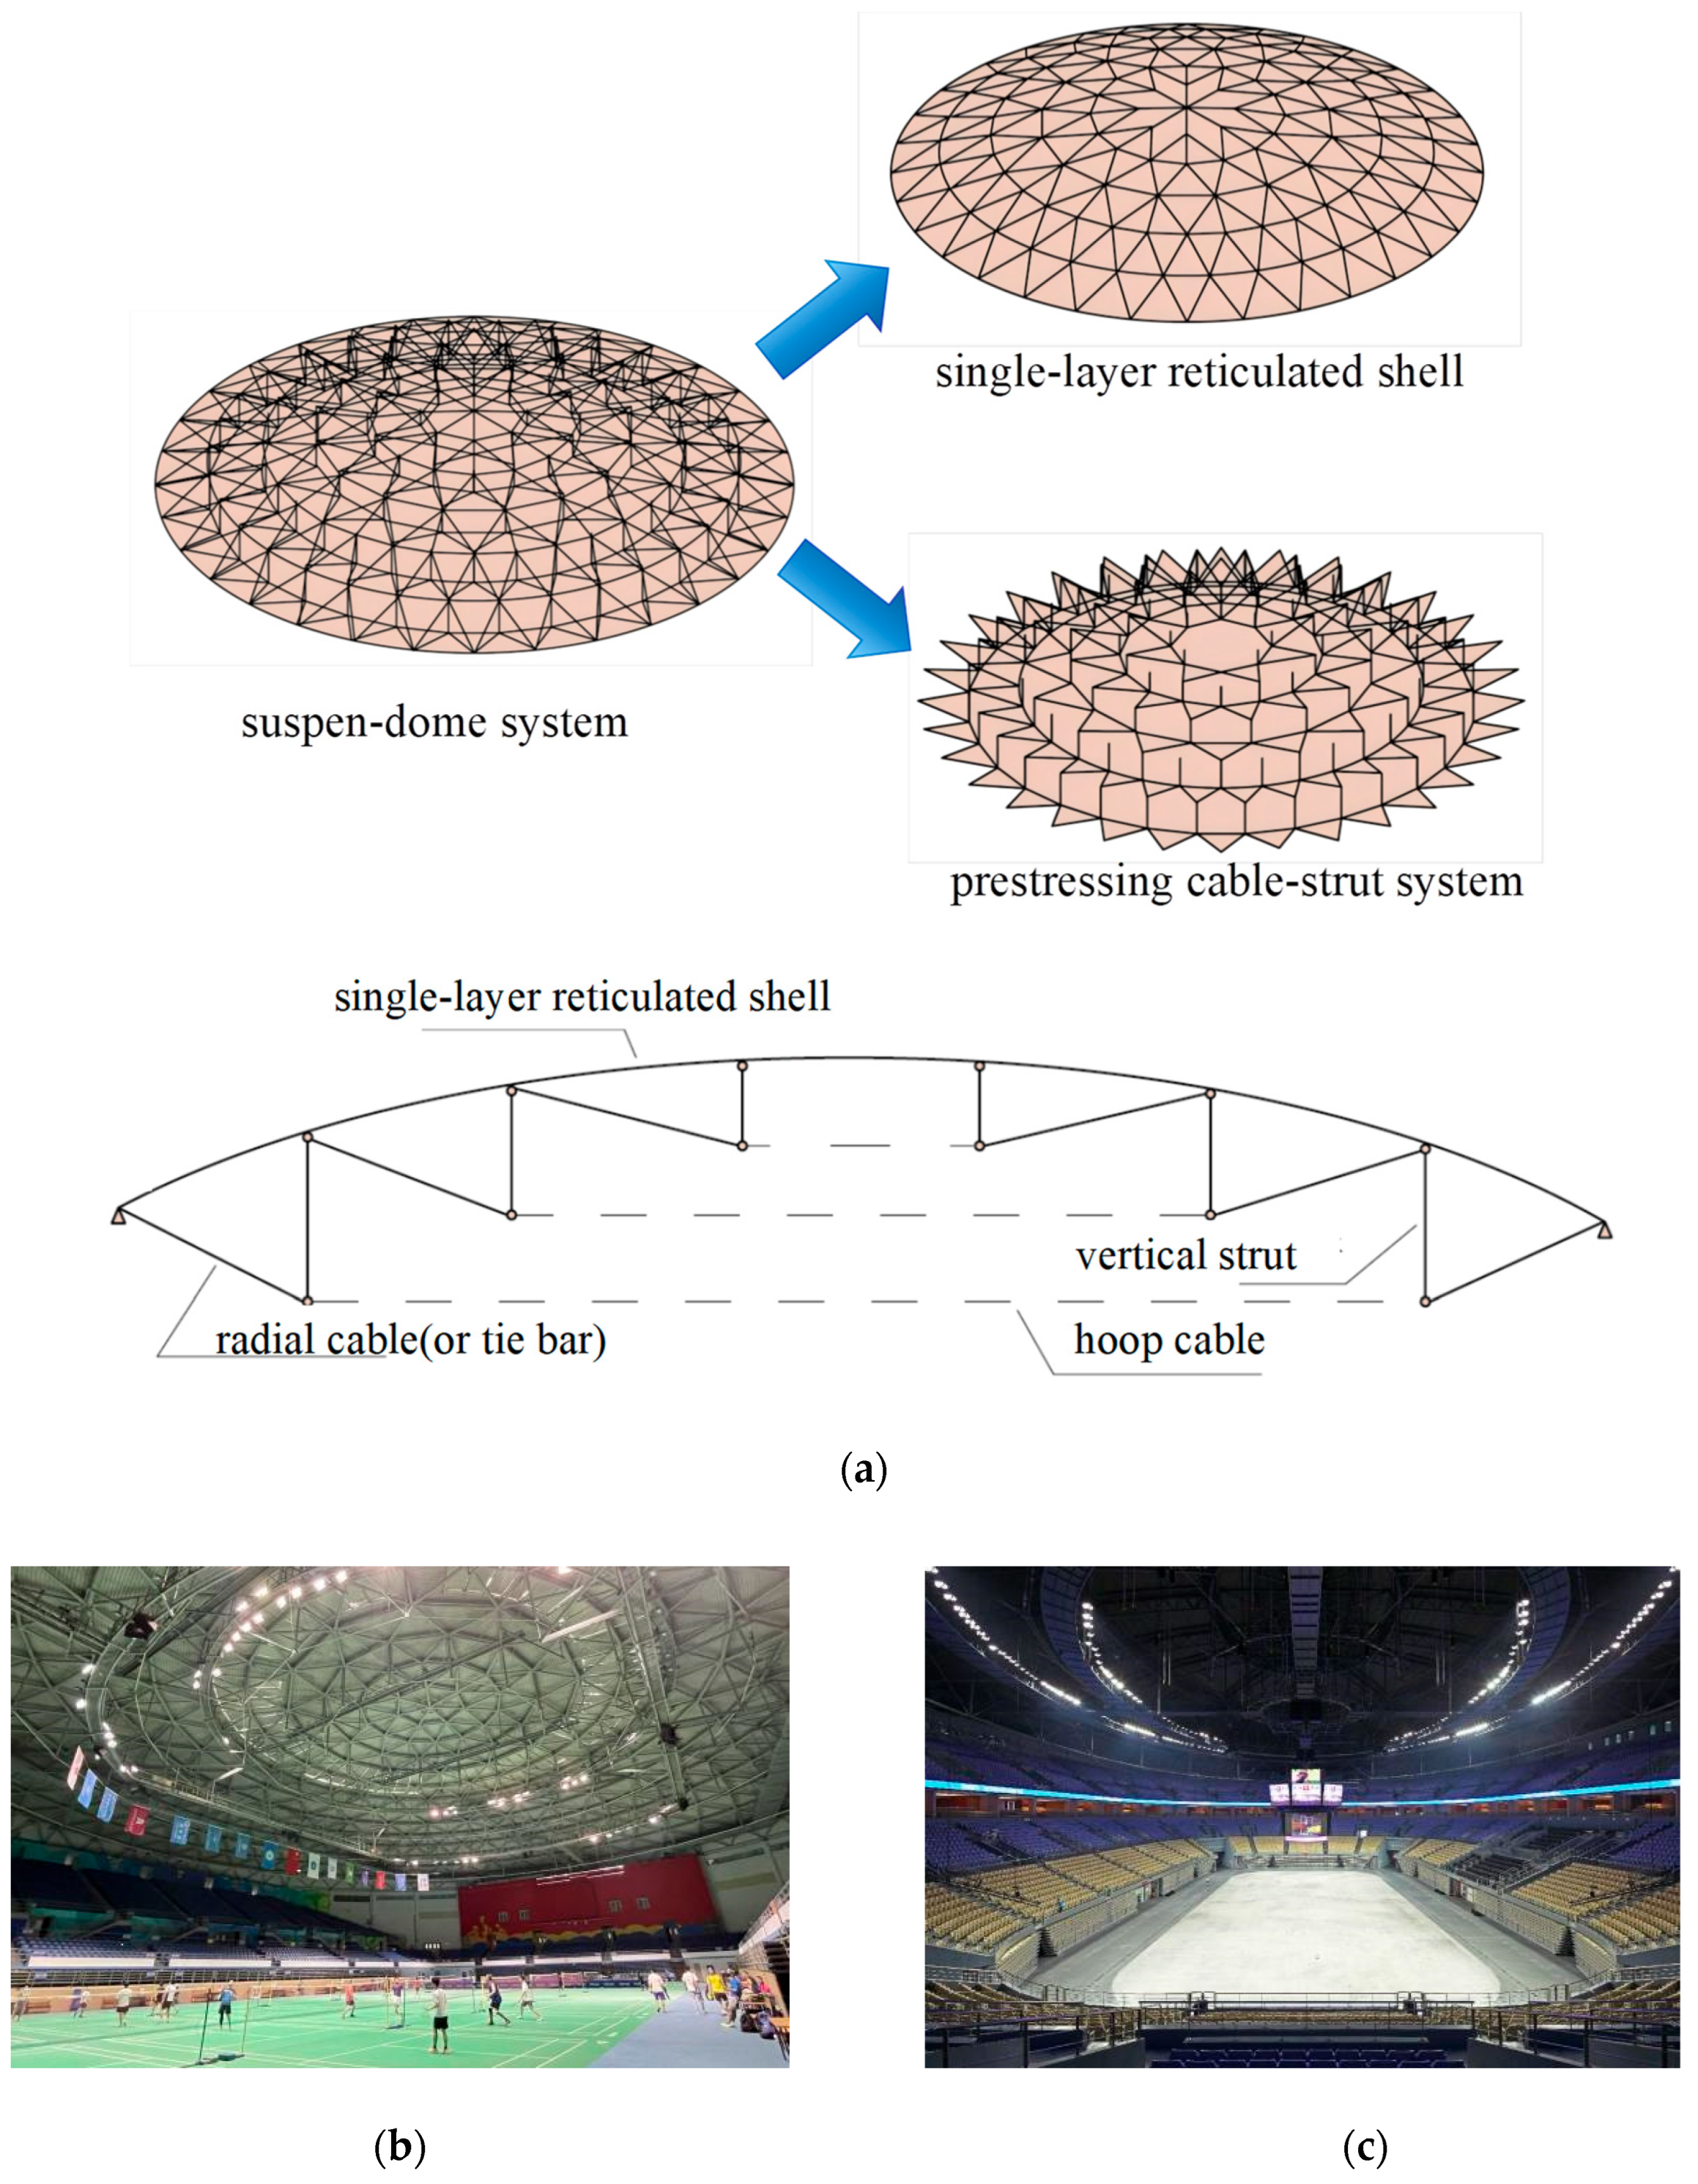
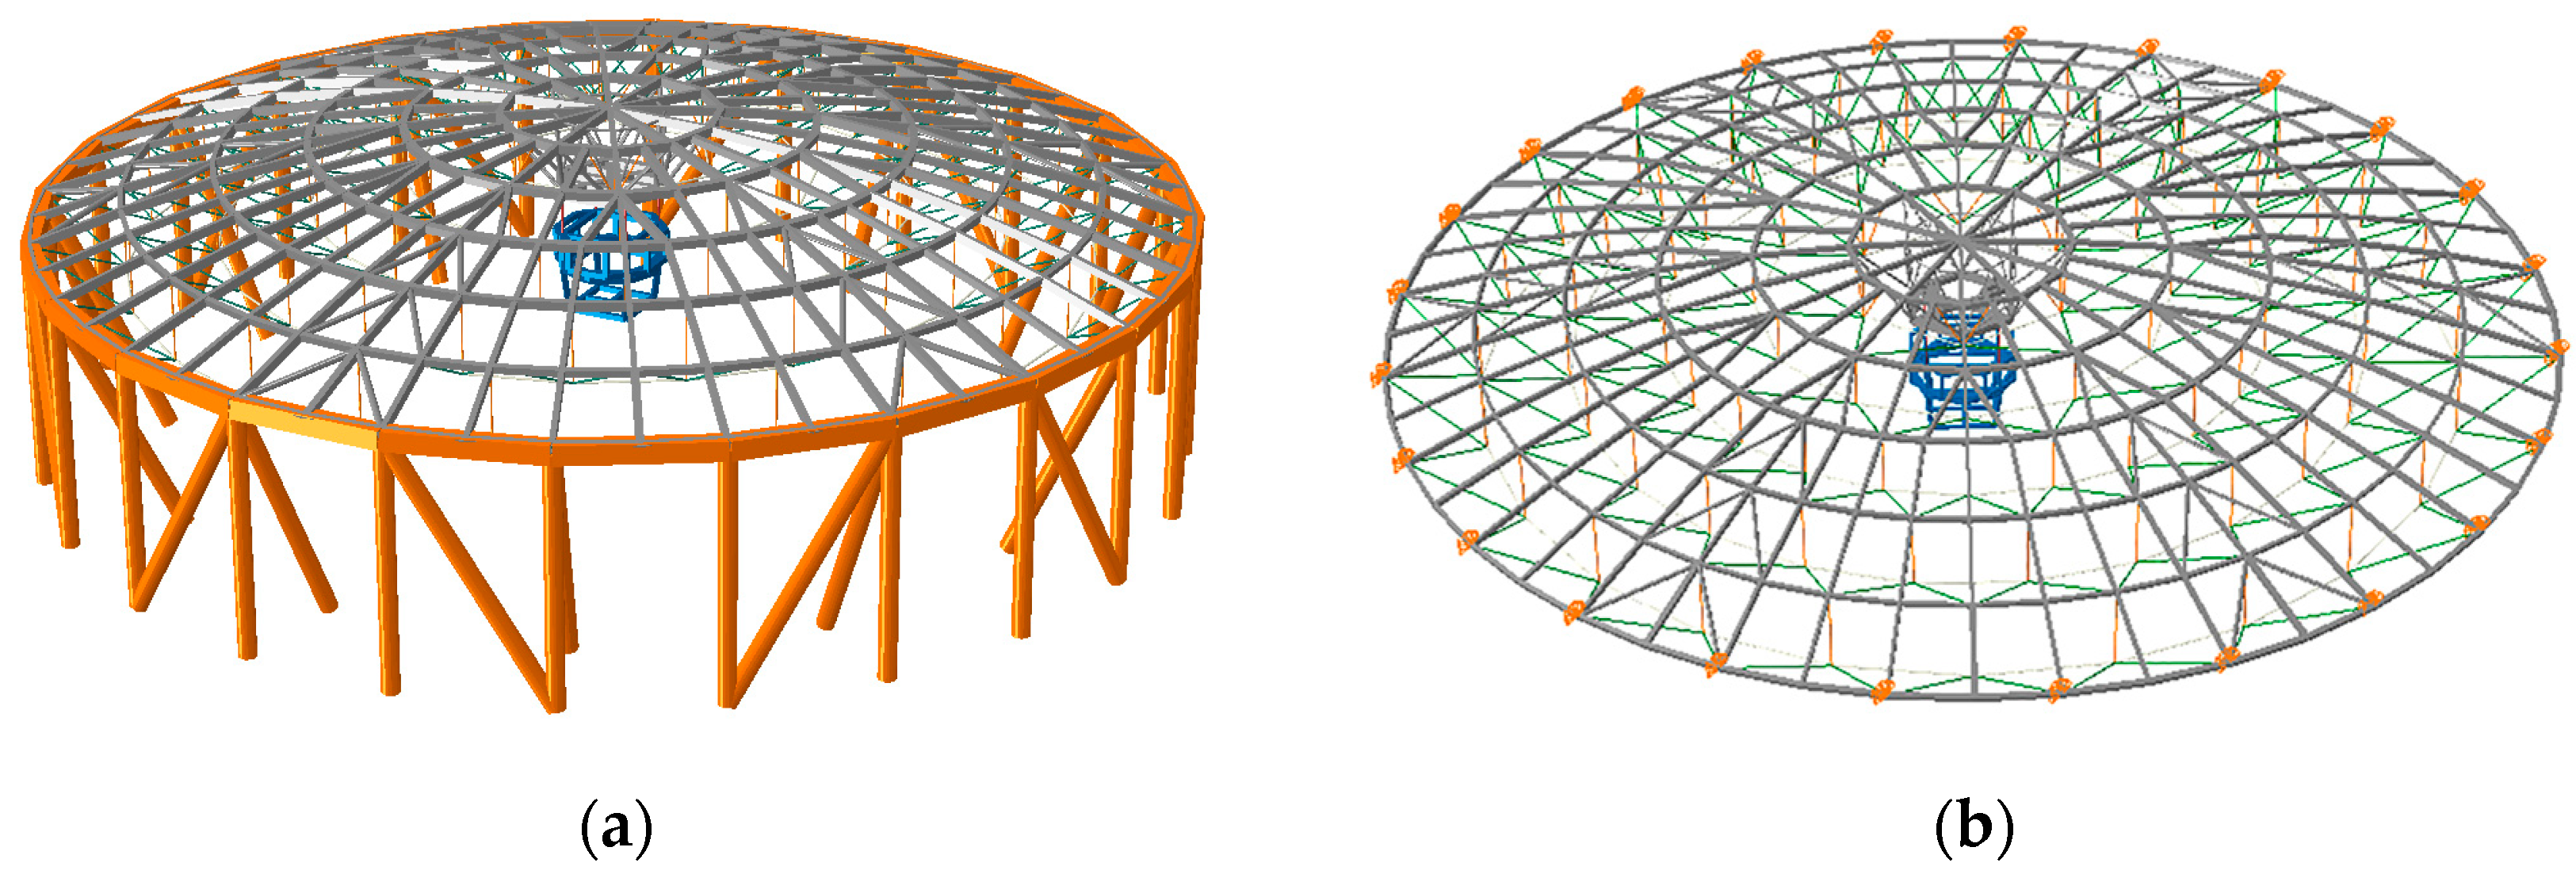
The suspen-dome structure is a prestressed long-span spatial structure, typically composed of an upper symmetric single-layer reticulated shell and a lower prestressed cable-strut system [
1], as illustrated in
Figure 1a. Compared to the single-layer reticulated shell, the addition of the lower cable-strut system significantly enhances the stiffness of the suspen-dome structure. This improvement enables its application in larger-span buildings [
2].
The Hikarigaoka Dome, constructed in Japan in 1994 with a span of 30 m, is recognized as the world’s first suspen-dome structure [
3]. Since its inception, the use of suspen-dome structures has proliferated globally, particularly in East Asia [
4,
5,
6,
7]. In China, the first suspen-dome structure, spanning 93 m, was built for the Badminton Gymnasium at the 2008 Olympic Games [
8], as shown in
Figure 1b. Currently, the largest suspen-dome in Asia is the Dalian Gymnasium, spanning 145.5 m [
9], as shown in
Figure 1c.
Because suspen-dome structures are frequently employed in major public buildings—such as gymnasiums, exhibition halls, and convention centers—their dynamic characteristics and seismic response are critical to ensuring structural safety during earthquakes.
To comprehensively investigate the seismic performance of suspen-dome structures, in addition to theoretical analyses and numerical simulations, dynamic scale model experiments have alaso become a vital research method. Kawaguchi and colleagues [
10] conducted a series of experimental studies on the Hikarigaoka Dome and the Gathering Dome, demonstrating the superior dynamic property of suspen-dome structures. Similarly, Wang et al. [
11] performed white noise excitation and earthquake simulation tests on a dynamic scale model based on the suspen-dome structure of the 2008 Olympic Badminton Gymnasium, revealing that the structure exhibited dense natural frequencies and excellent seismic performance. Tatemichi et al. [
12] analyzed the dynamic characteristics and testing accuracy of a suspen-dome structure through vibration testing. Wu et al. [
13] further investigated the seismic behavior of a suspen-dome structure using a scale model tested on eight sub-shaking tables, employing an improved plant growth simulation algorithm to enhance the analysis.
Previous studies on suspen-dome structures, whether theoretical or experimental, have primarily focused on the upper suspen-dome roof structure, largely neglecting the influence of substructures. In reality, most long-span spatial structures are constructed on concrete or steel substructures, which often amplify the input seismic load [
14]. In many cases, the vibrations of the substructure can induce significant seismic forces on the upper roof structure, and these forces vary depending on the substructure’s stiffness [
15].
Recognizing this, some researchers have investigated the dynamic characteristics and seismic response of various types of long-span roof structures incorporating substructures. For instance, Yu et al. [
16] analyzed the dynamic characteristics and failure mechanisms of single-layer reticulated domes under the influence of substructures, demonstrating that the substructure significantly affects seismic performance and that structural failure modes under severe earthquakes are influenced by substructure stiffness. Fan et al. [
17] examined the impact of substructures on the seismic response of grid structures and proposed a simplified method for modeling substructures. Similarly, Nie et al. [
18] investigated the influence of substructures on the seismic performance of cylindrical reticulated shell structures, revealing that substructures reduce structural stiffness and amplify seismic responses.
Despite these advancements, the previous research subjects were all reticulated shell structures, there is currently no research addressing the seismic performance of suspen-dome structures while accounting for substructure influence.
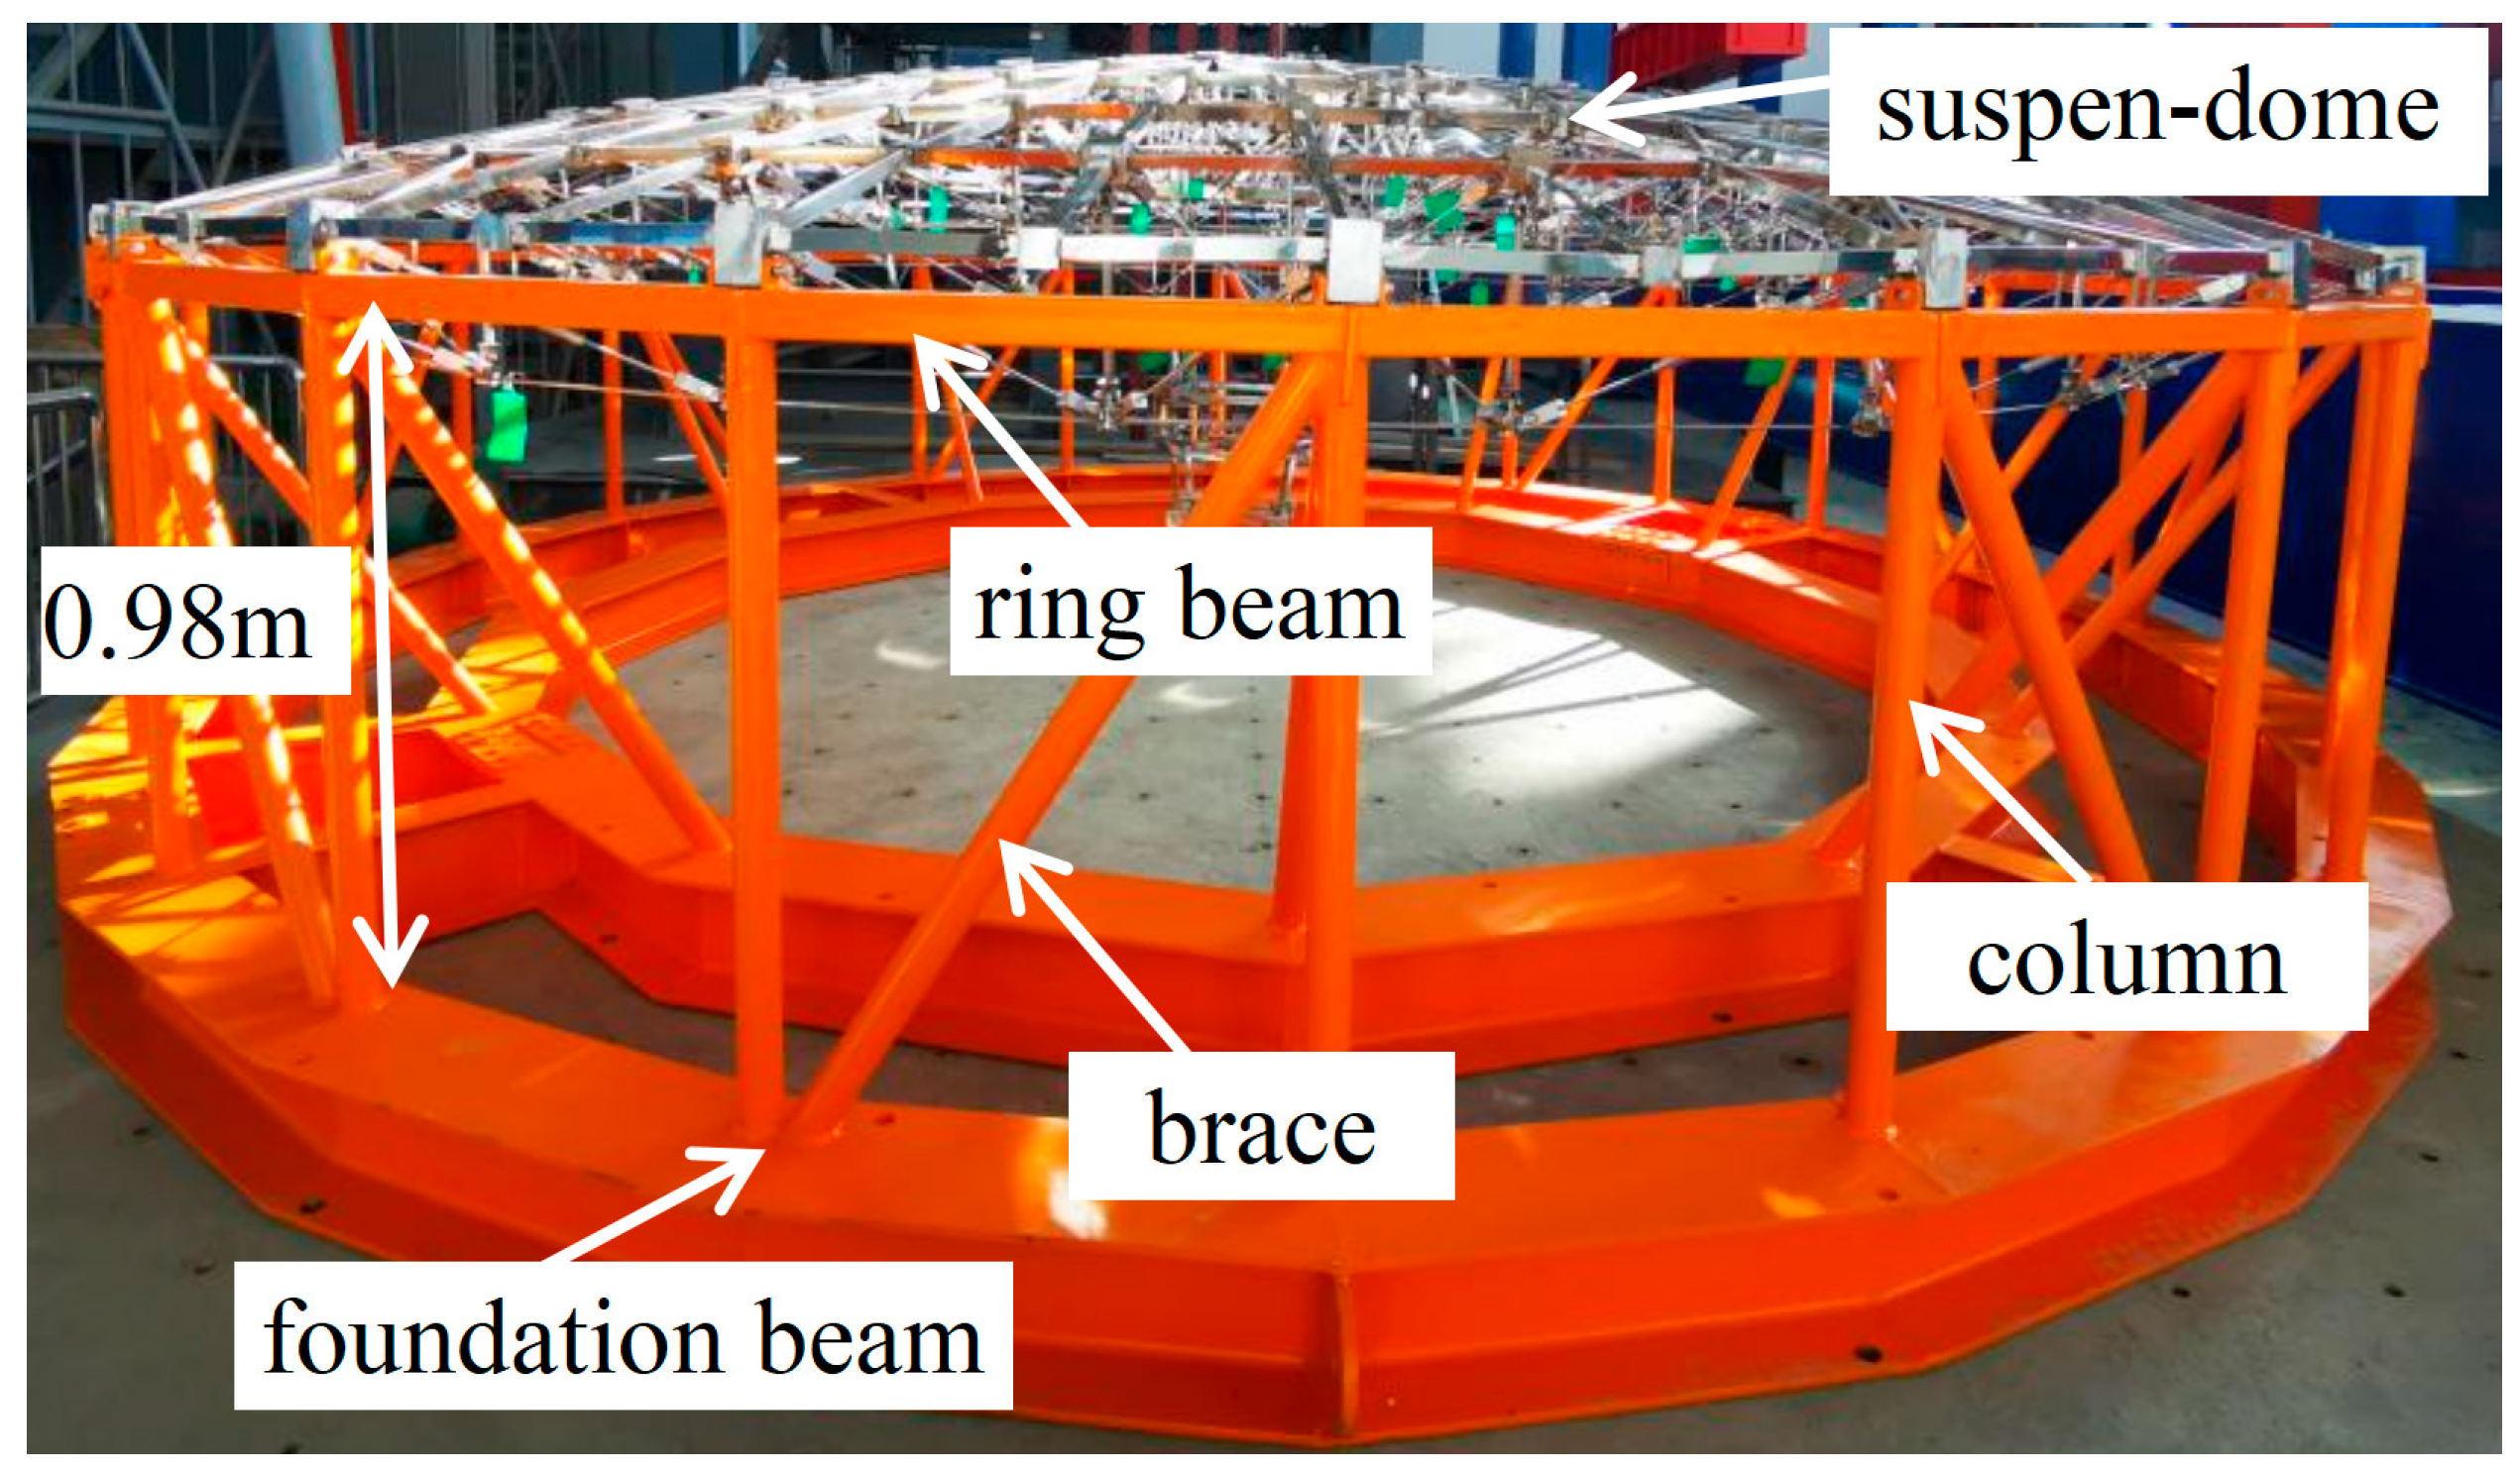
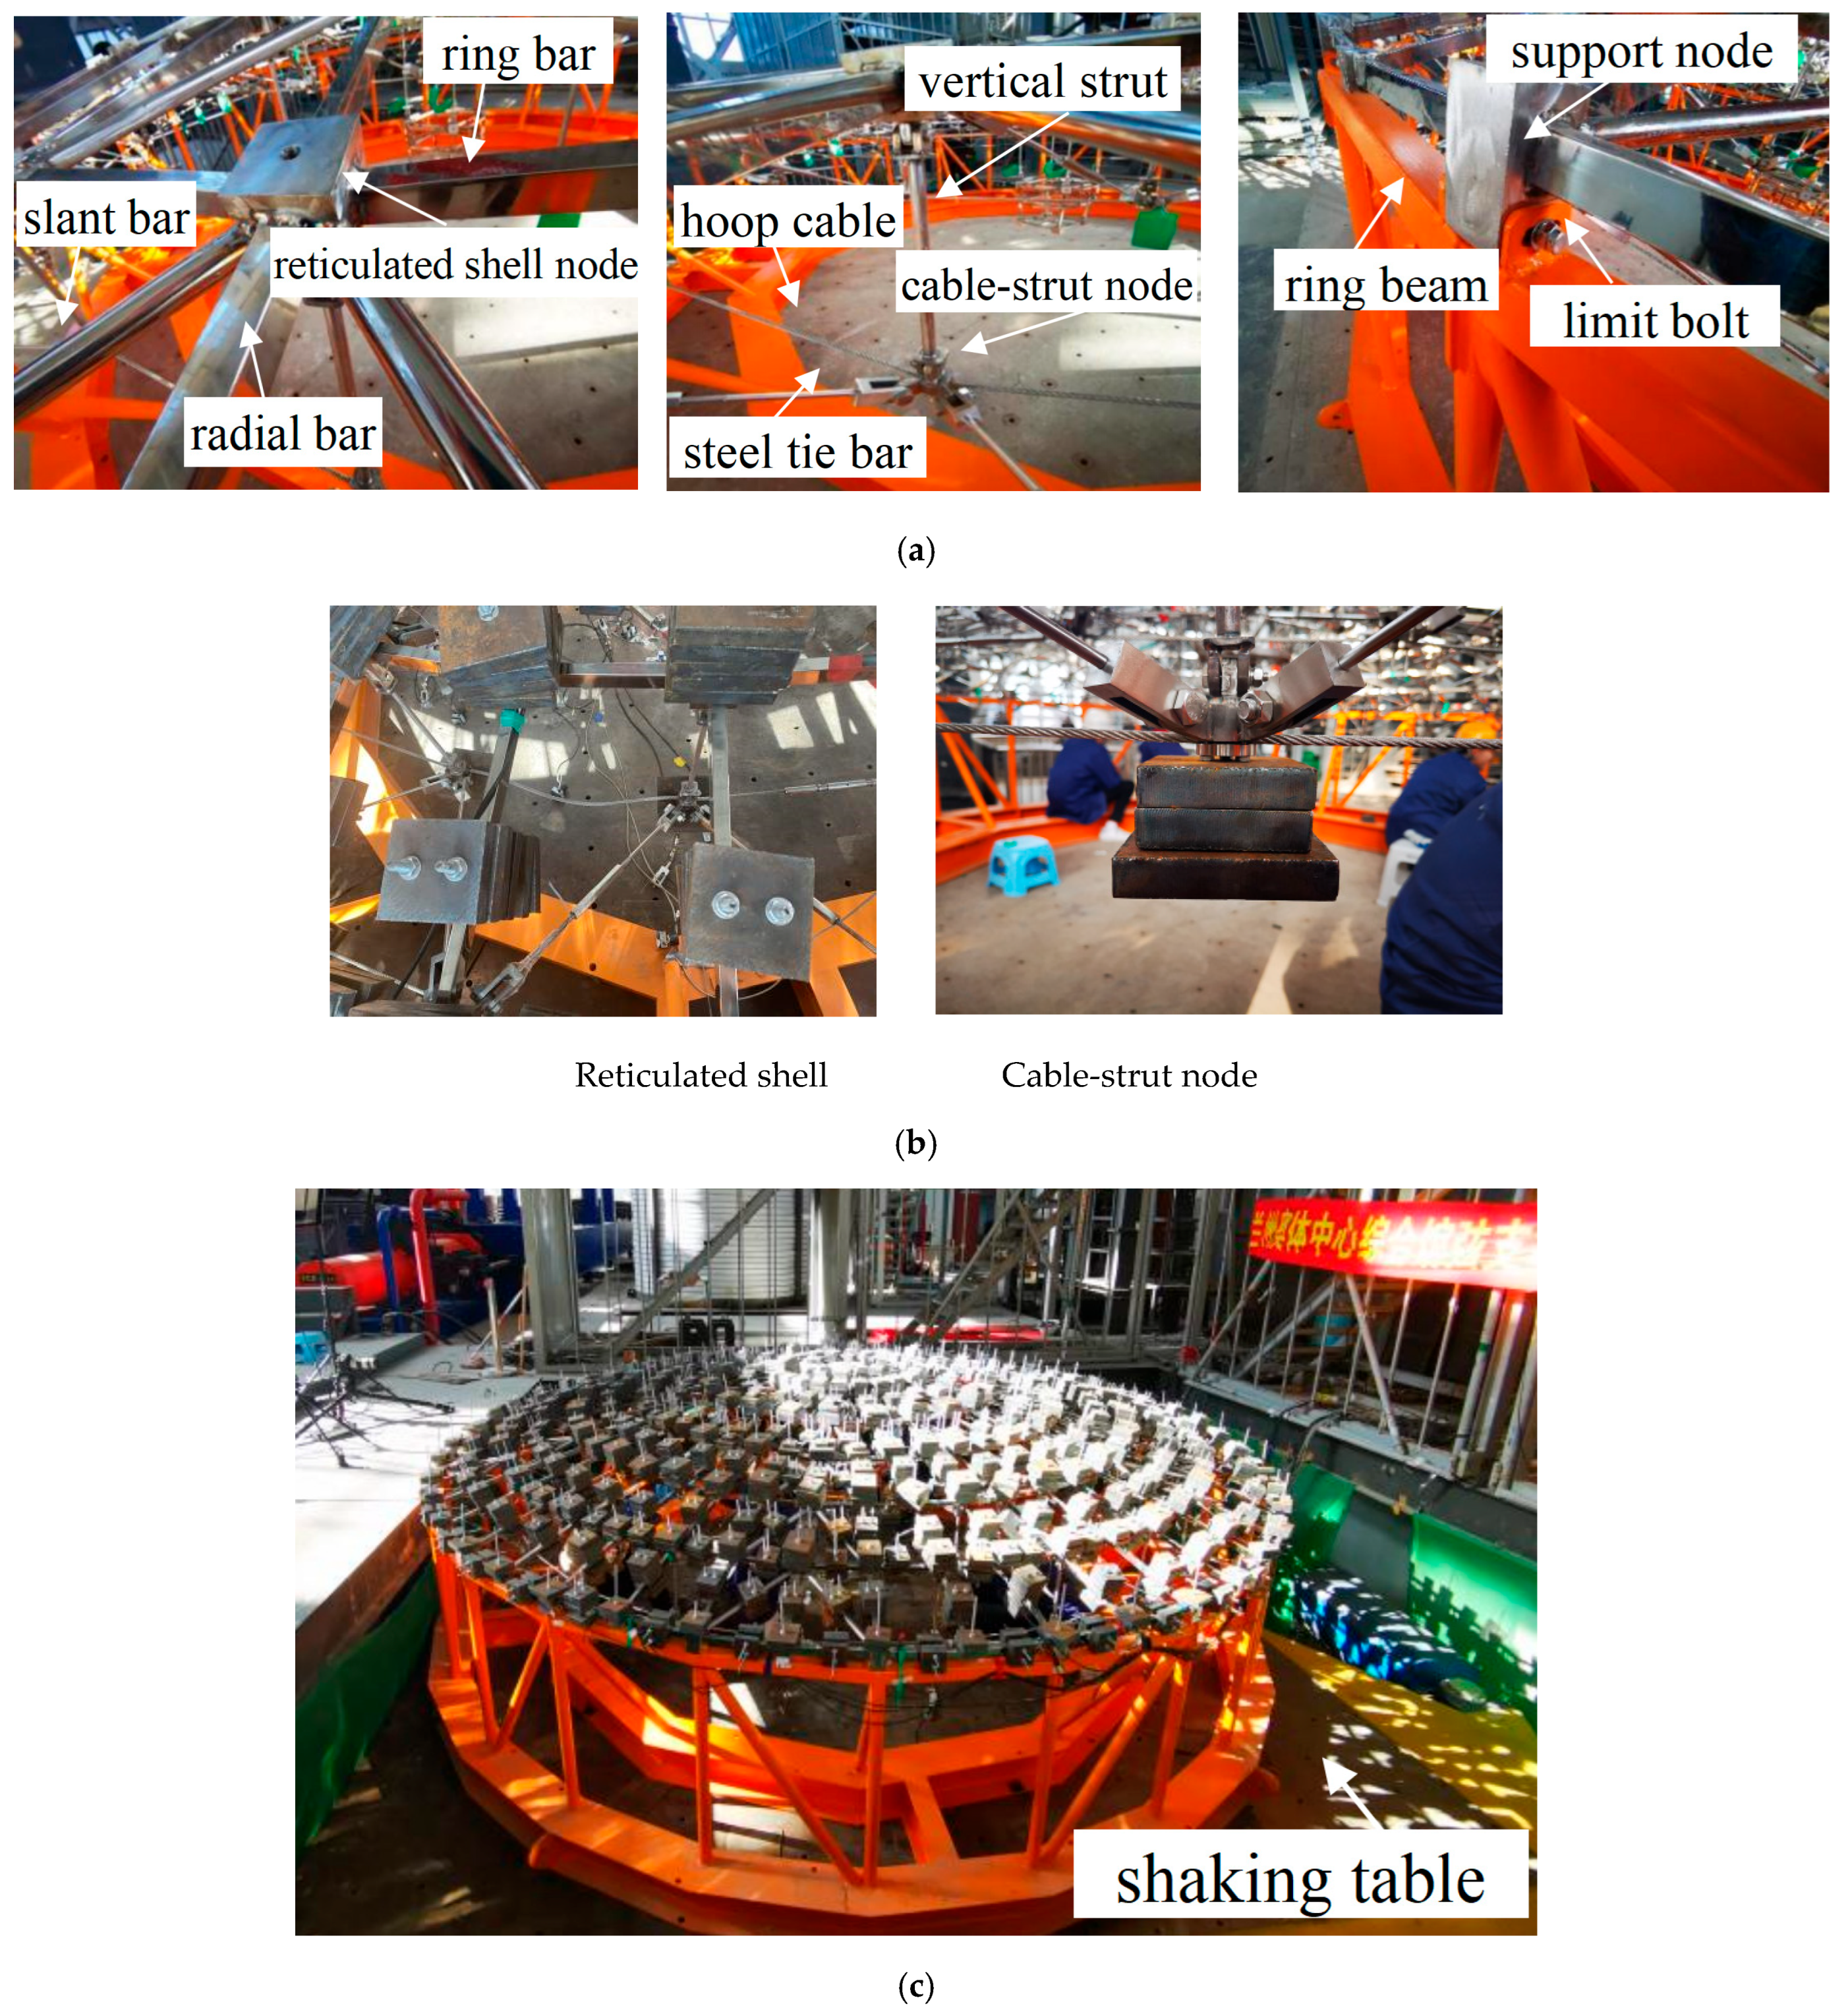
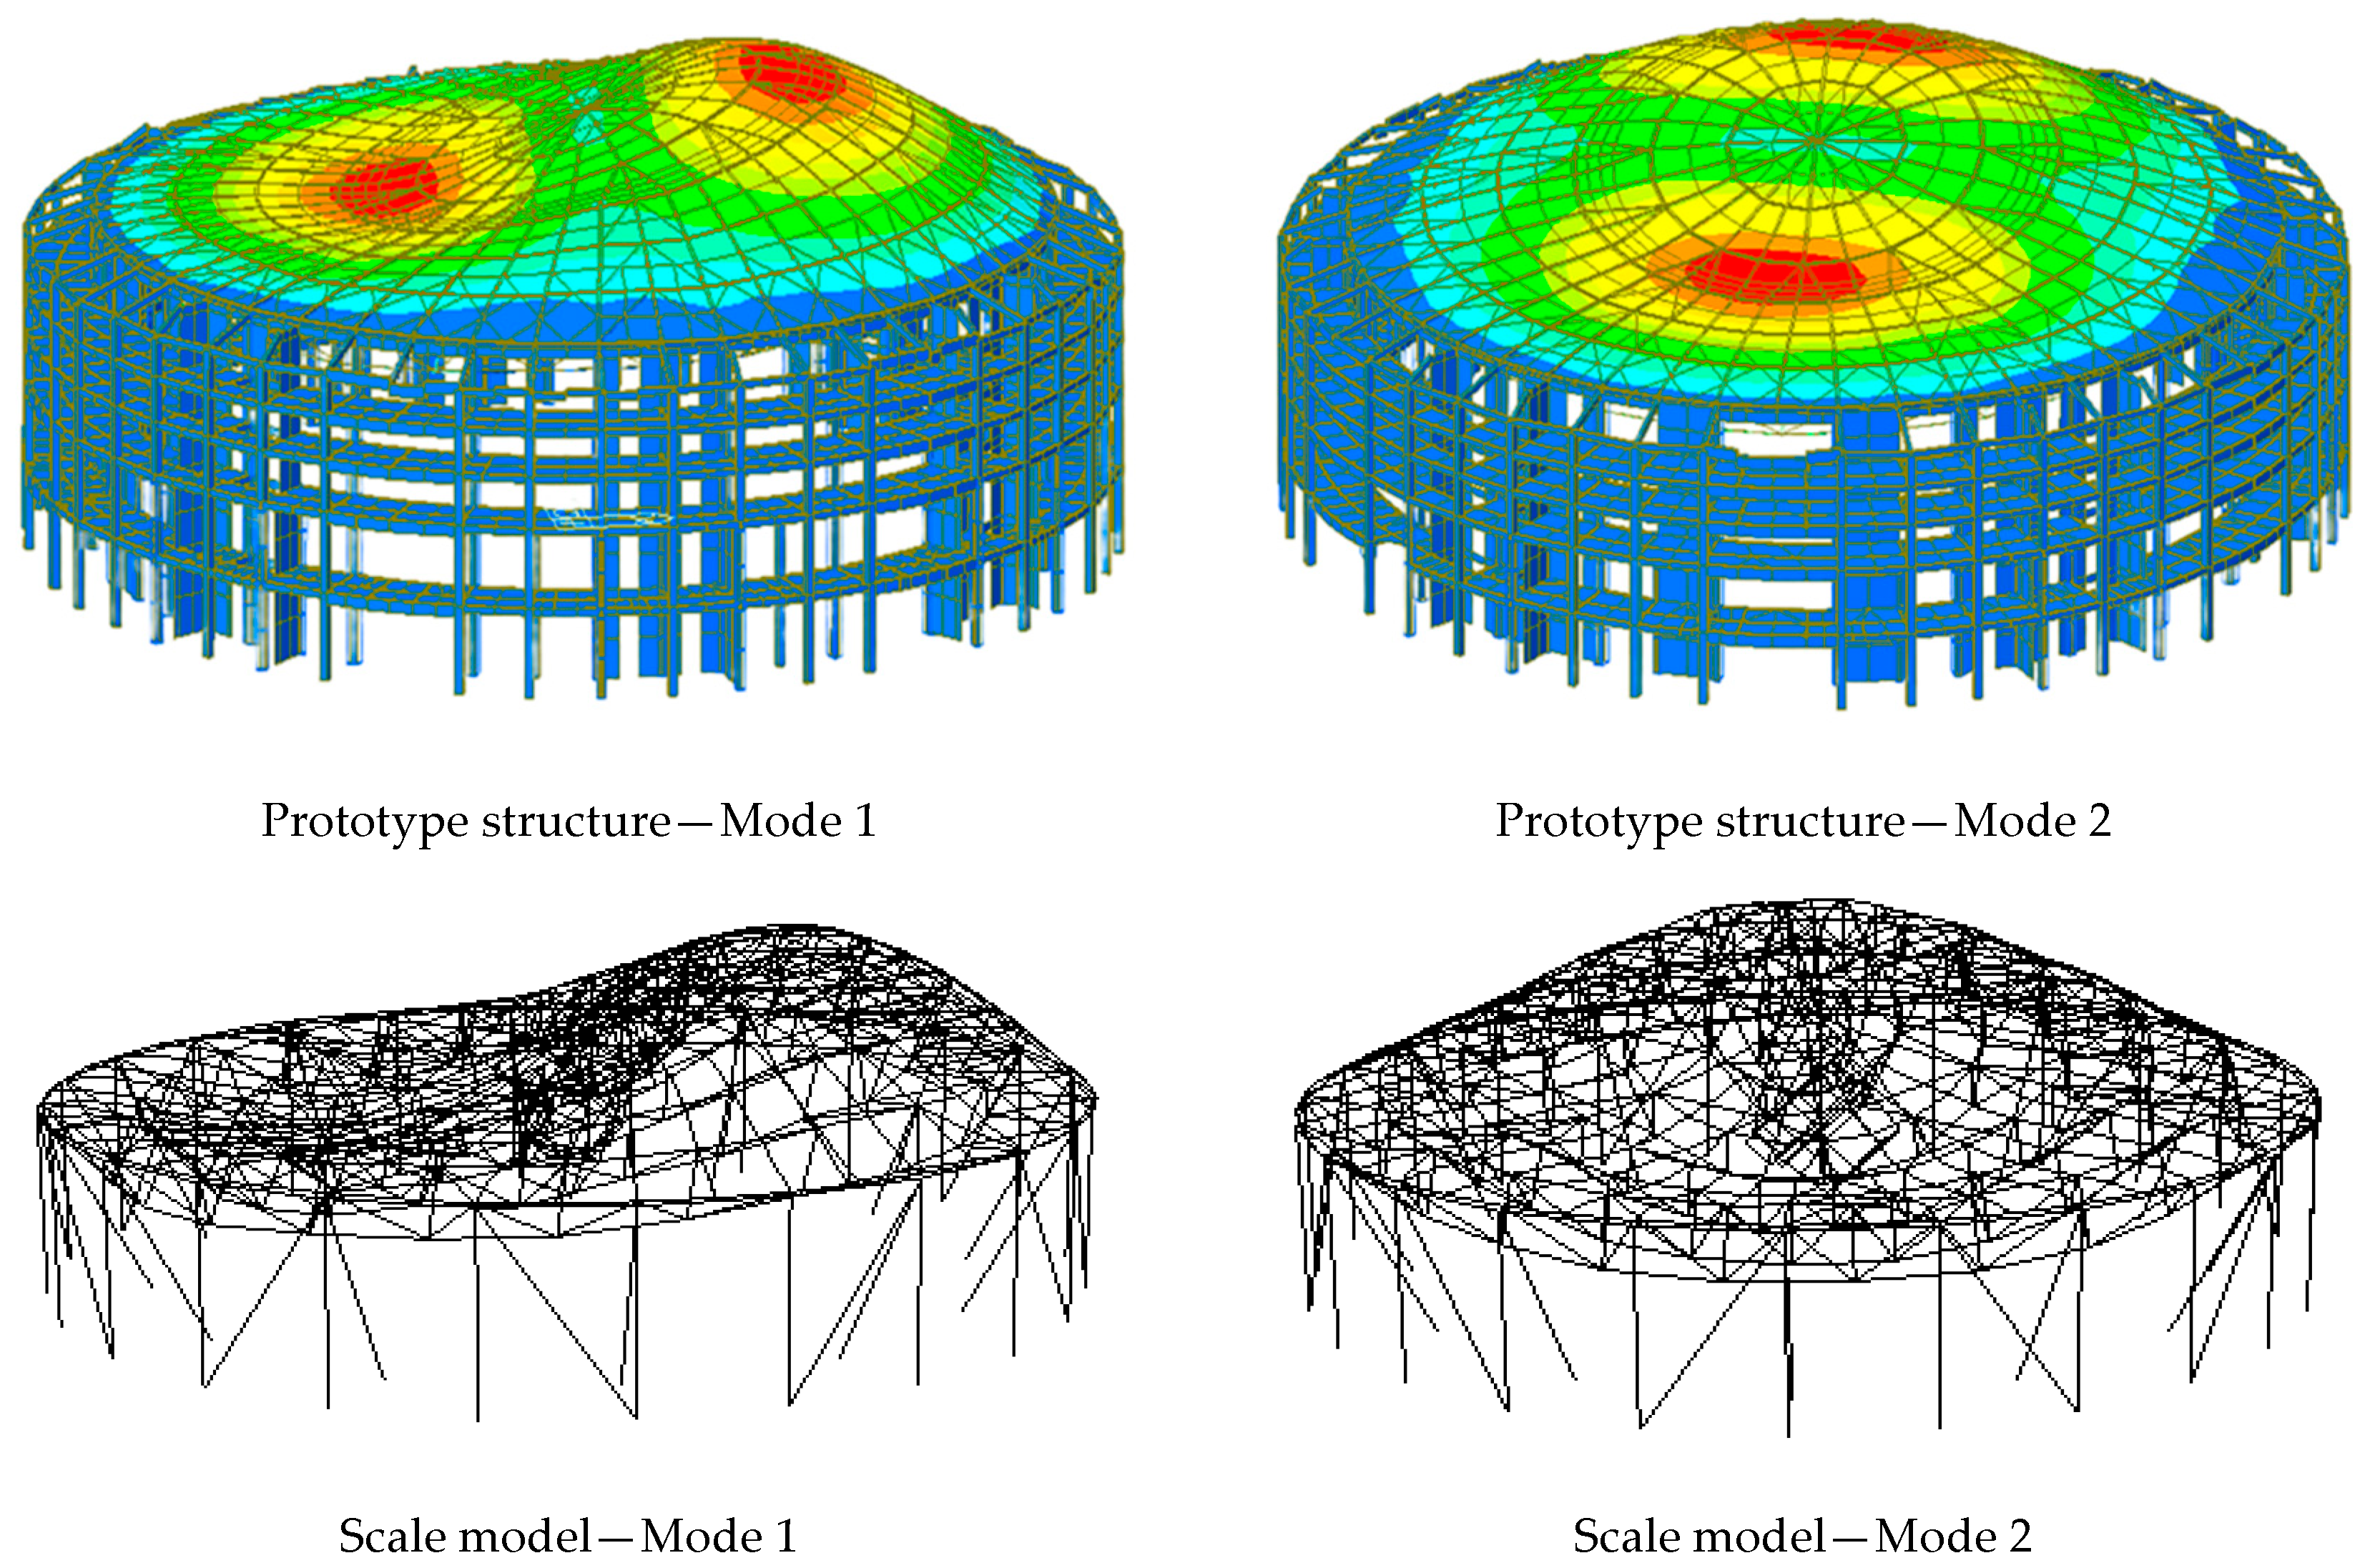
To address this, the present study adopts the suspen-dome structure of the Lanzhou Olympic Sports Center as a prototype and carries out a comprehensive investigation into its natural vibration characteristics and seismic response, considering the influence of substructures. Initially, a method for incorporating and simplifying the complex concrete substructure of the suspen-dome prototype into a dynamic scale model was proposed, resulting in the development of an overall model with a similarity ratio of 1:20. The dynamic characteristics of the scale model were assessed through a white noise excitation test, and the results were compared to those of the prototype structure.
Subsequently, an earthquake simulation test was performed on the scale model. To complement the experimental study, an overall numerical model corresponding to the test model, along with a simplified model using three-directional hinge supports as boundary conditions, was developed using ABAQUS software. The natural frequencies and seismic responses of the overall numerical, simplified numerical, and test models were compared.
Finally, three overall numerical models with varying levels of substructure stiffness were established. The dynamic characteristics and seismic responses—including acceleration, displacement, and internal force—of these models were analyzed and compared.
The findings of this study offer practical guidance for the seismic analysis of suspen-dome structures with substructures in real-world engineering applications.
5. Dynamic Characteristics and Seismic Responses of Suspen-Dome Structures with Varying Substructure Stiffness
To further investigate the dynamic characteristics and seismic response of suspen-dome structures with substructures, three overall numerical models with varying substructure stiffness levels were established by ABAQUS software. Model 1 was taken as the model with a strong stiffness substructure. Meanwhile, Model 2 with a medium stiffness substructure and Model 3 with a weak stiffness substructure were established by reducing the diagonal braces in Model 1, as shown in
Figure 12. The substructure lateral stiffness of the three models is 159.1 kN/mm, 69.9 kN/mm and 23.7 kN/mm, respectively.
5.1. Dynamic Characteristics
Modal analysis was performed on the three overall models, and their first 50-order natural frequencies are compared in
Figure 13. It can be observed that with the reduction in the substructure stiffness, the natural frequencies of the suspen-dome structure decrease significantly; the fundamental frequencies of Model 1, Model 2, and Model 3 are 5.75 Hz, 5.11 Hz, and 3.42 Hz, respectively. That is to say, the reduction in the substructure stiffness will reduce the stiffness of the overall suspen-dome structure, thereby reducing the natural frequency of the structure.
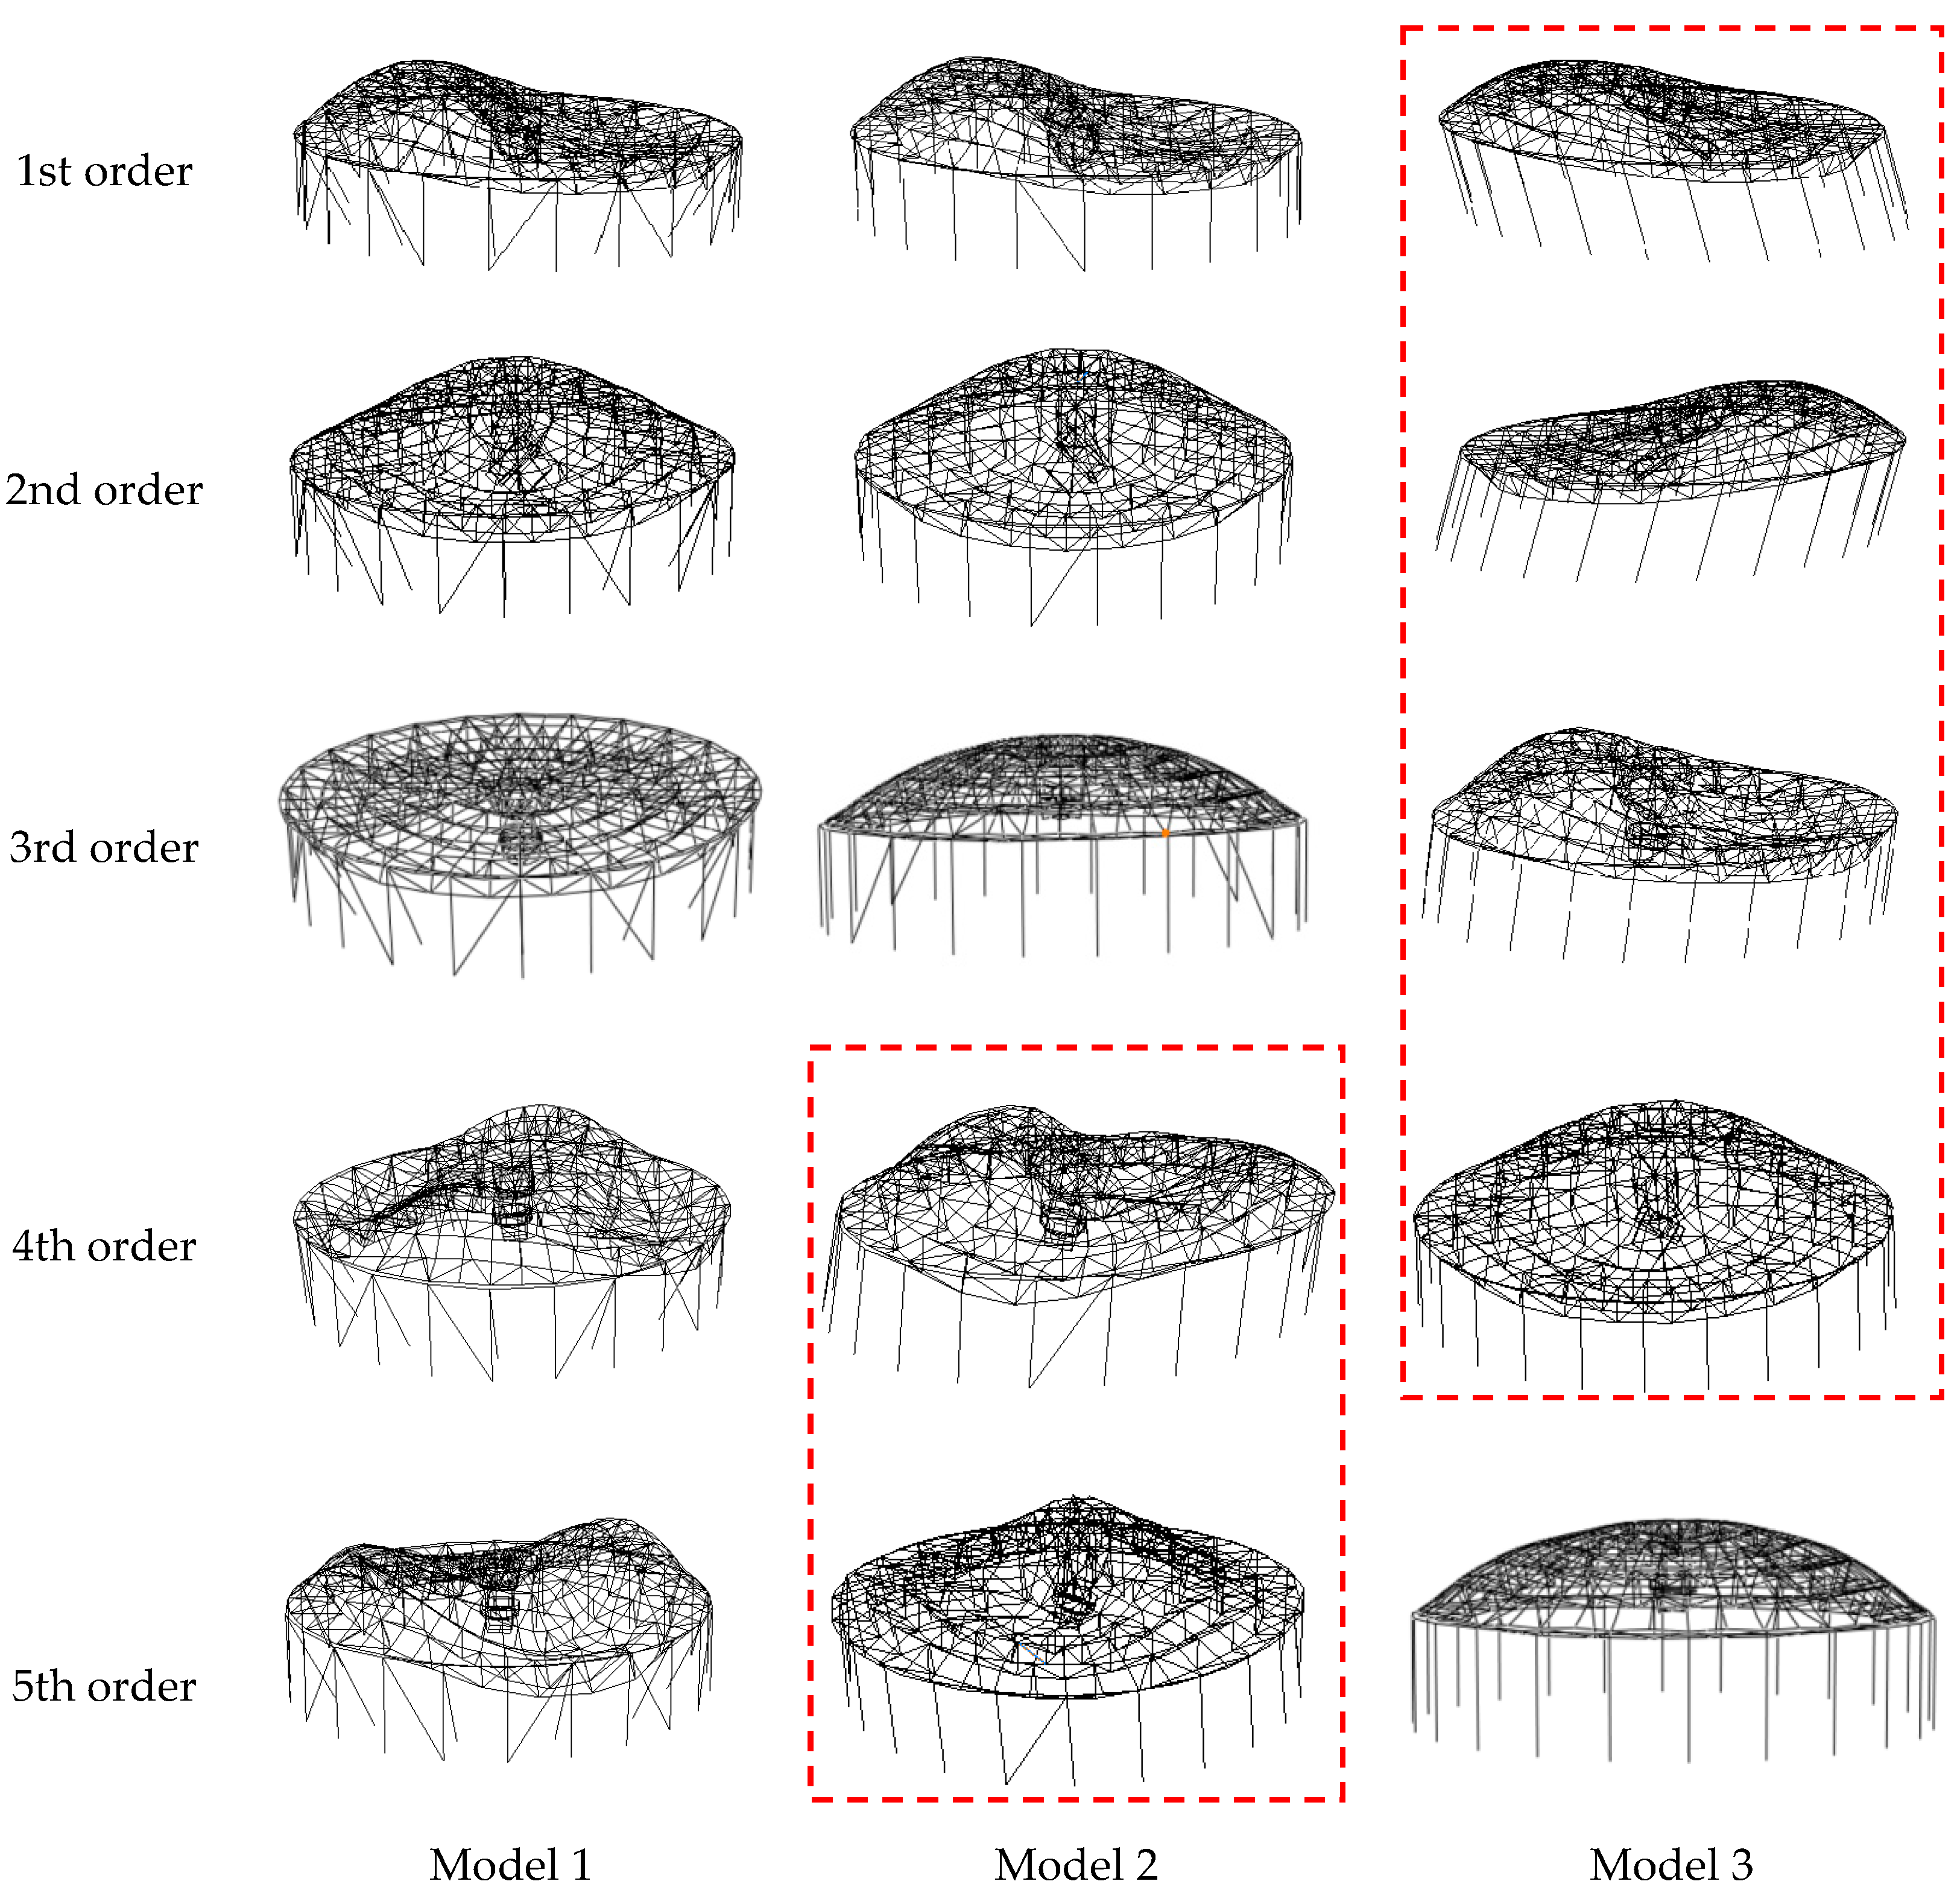
Figure 14 compares the first 5-order vibration modes of the three models. It can be found that all vibration modes of Model 1 involve deformation primarily in the superstructure, while the fourth- and fifth-order vibration modes of Model 2 and the first 4-order vibration modes of Model 3 are all the coupled deformations of the superstructure and the substructure. In other words, as the substructure stiffness decreases, the vibration mode of the overall structure changes from the deformation of the superstructure to the coupled deformation of the superstructure and the substructure. The above results declare that the substructure stiffness has a significant impact on the natural vibration characteristics of the suspen-dome structure.
5.2. Seismic Responses
The seismic time-history analysis was carried out on Model 1, Model 2, and Model 3, respectively, and one measuring point was selected from each ring of the superstructure. The acceleration data of the seismic record collected from the shaking table was used as the severe seismic load. Meanwhile, in order to consider the influence of seismic intensity on structural seismic response, according to relevant regulations, the peak acceleration values collected from the vibration table were reduced by 2 times and 5.7 times, respectively, and used as medium and minor seismic loads.
5.2.1. Acceleration Response
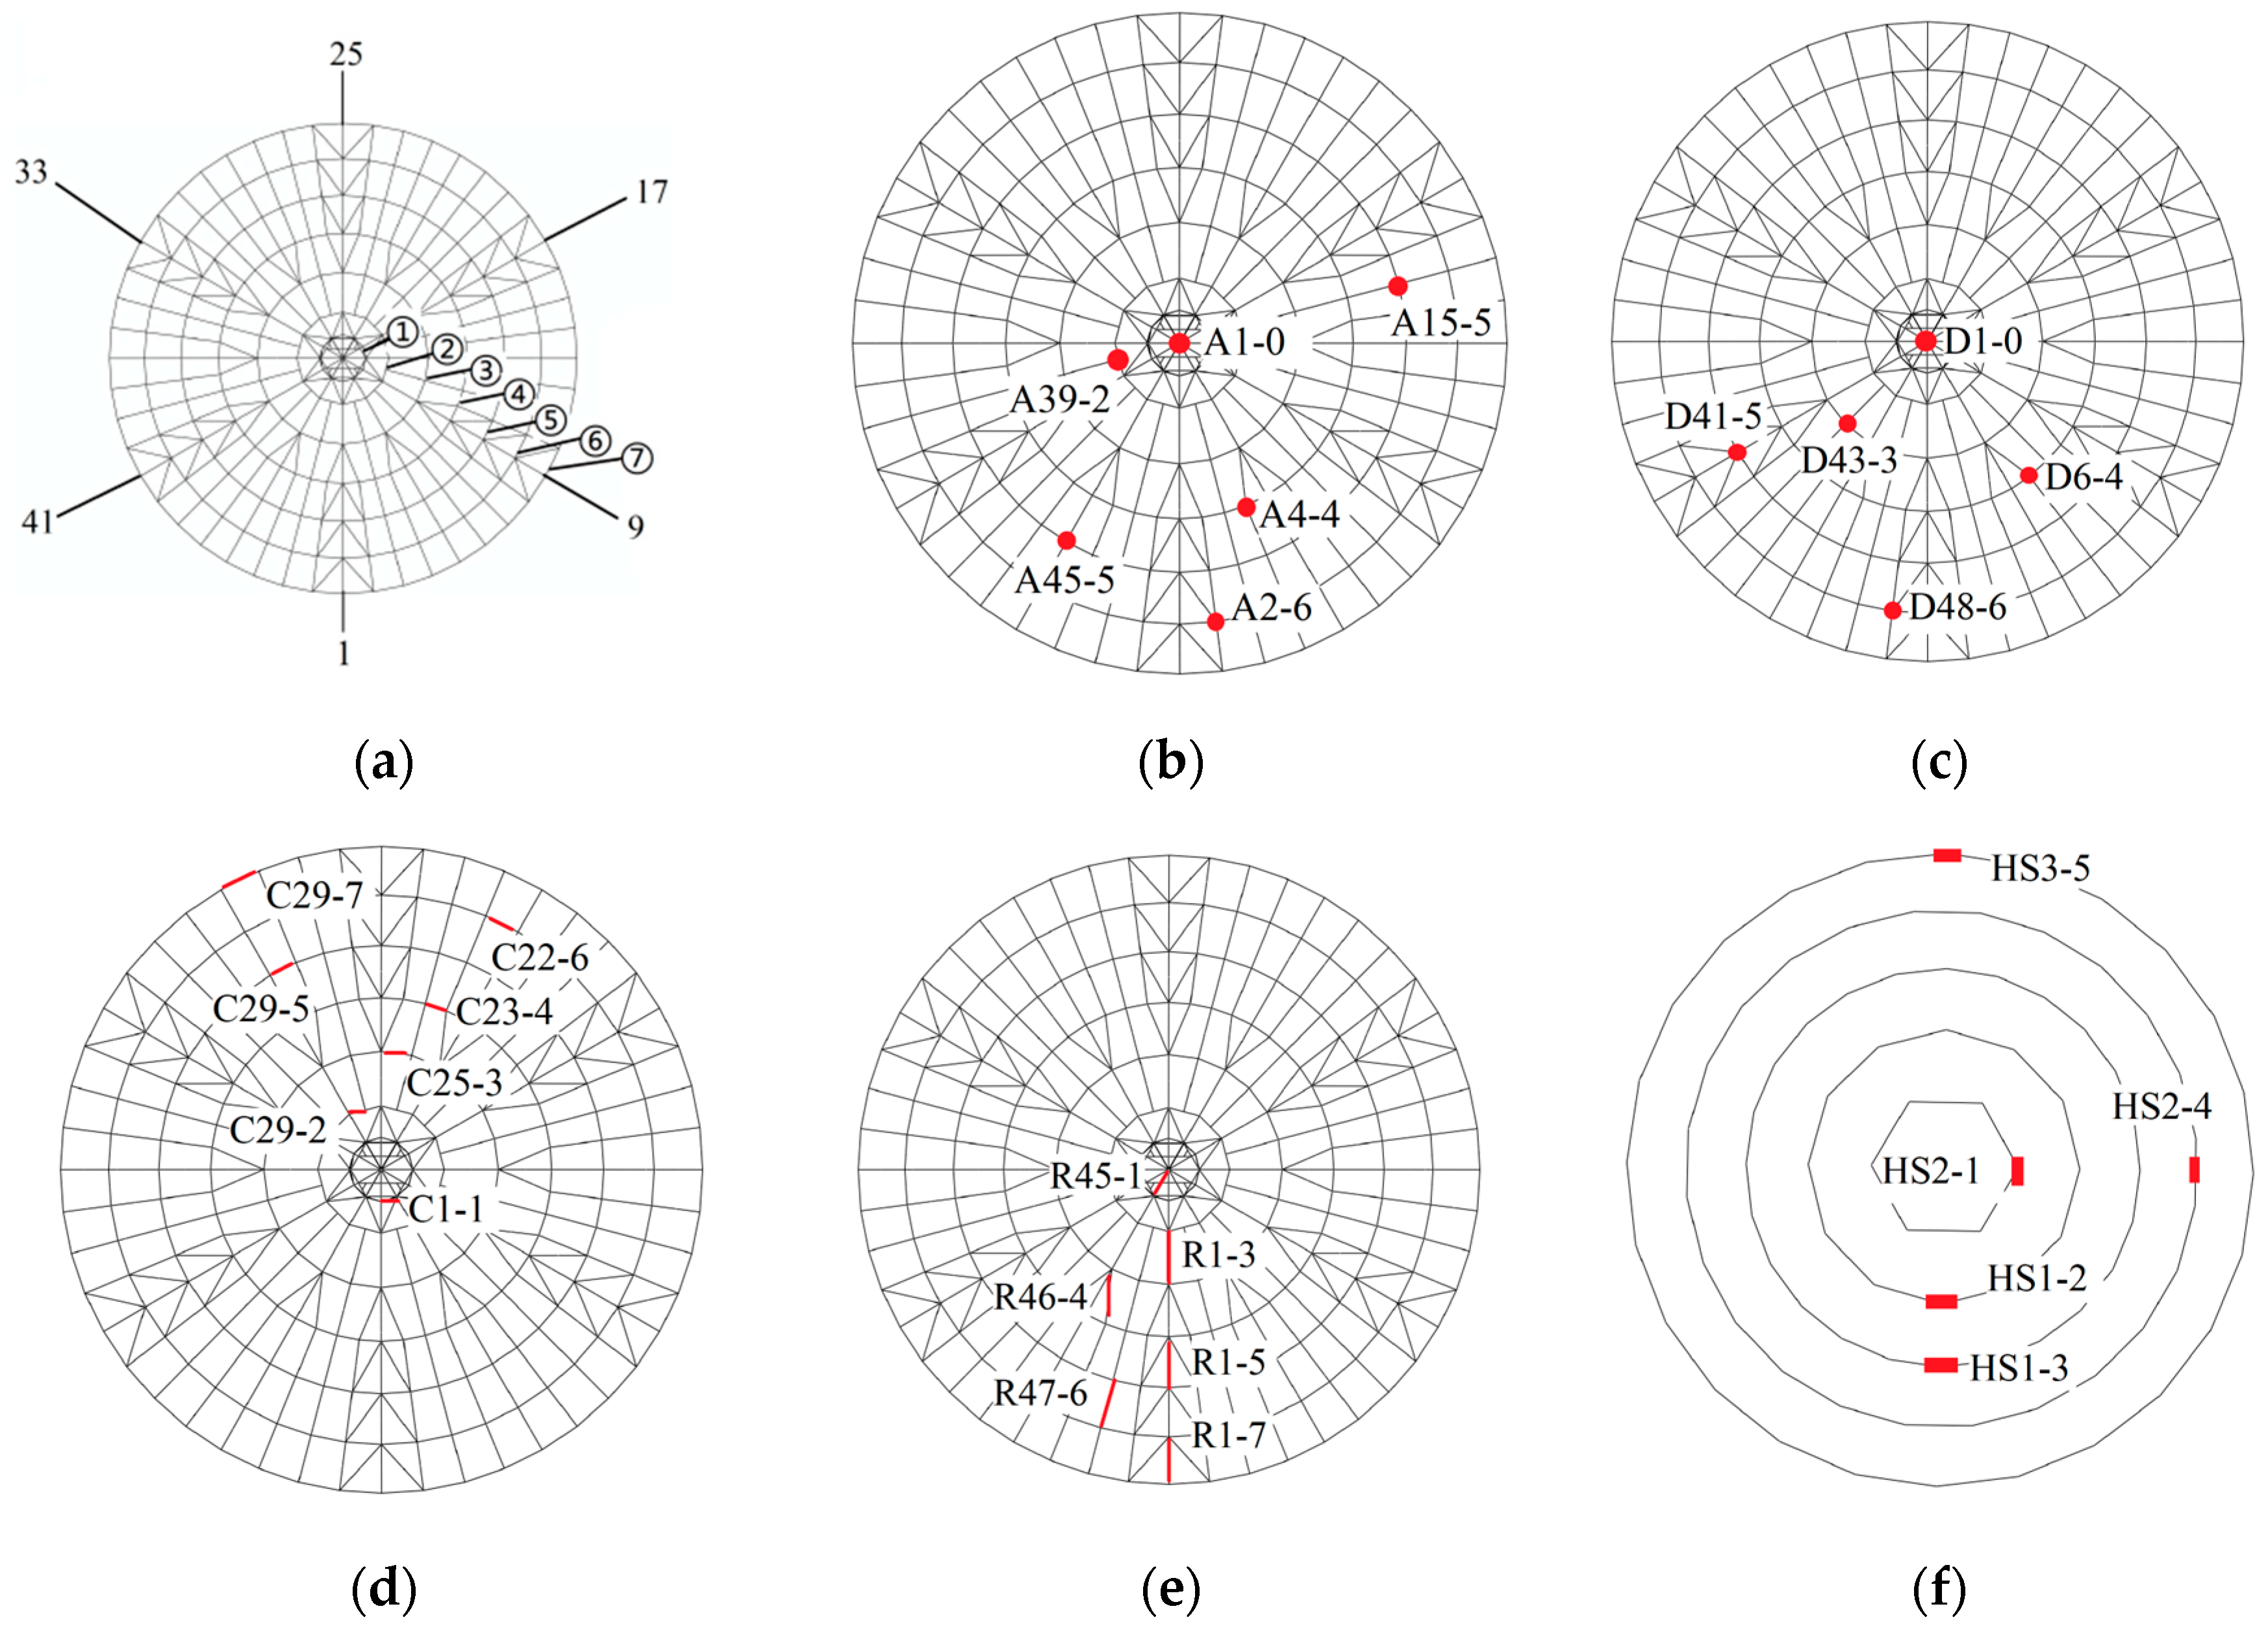
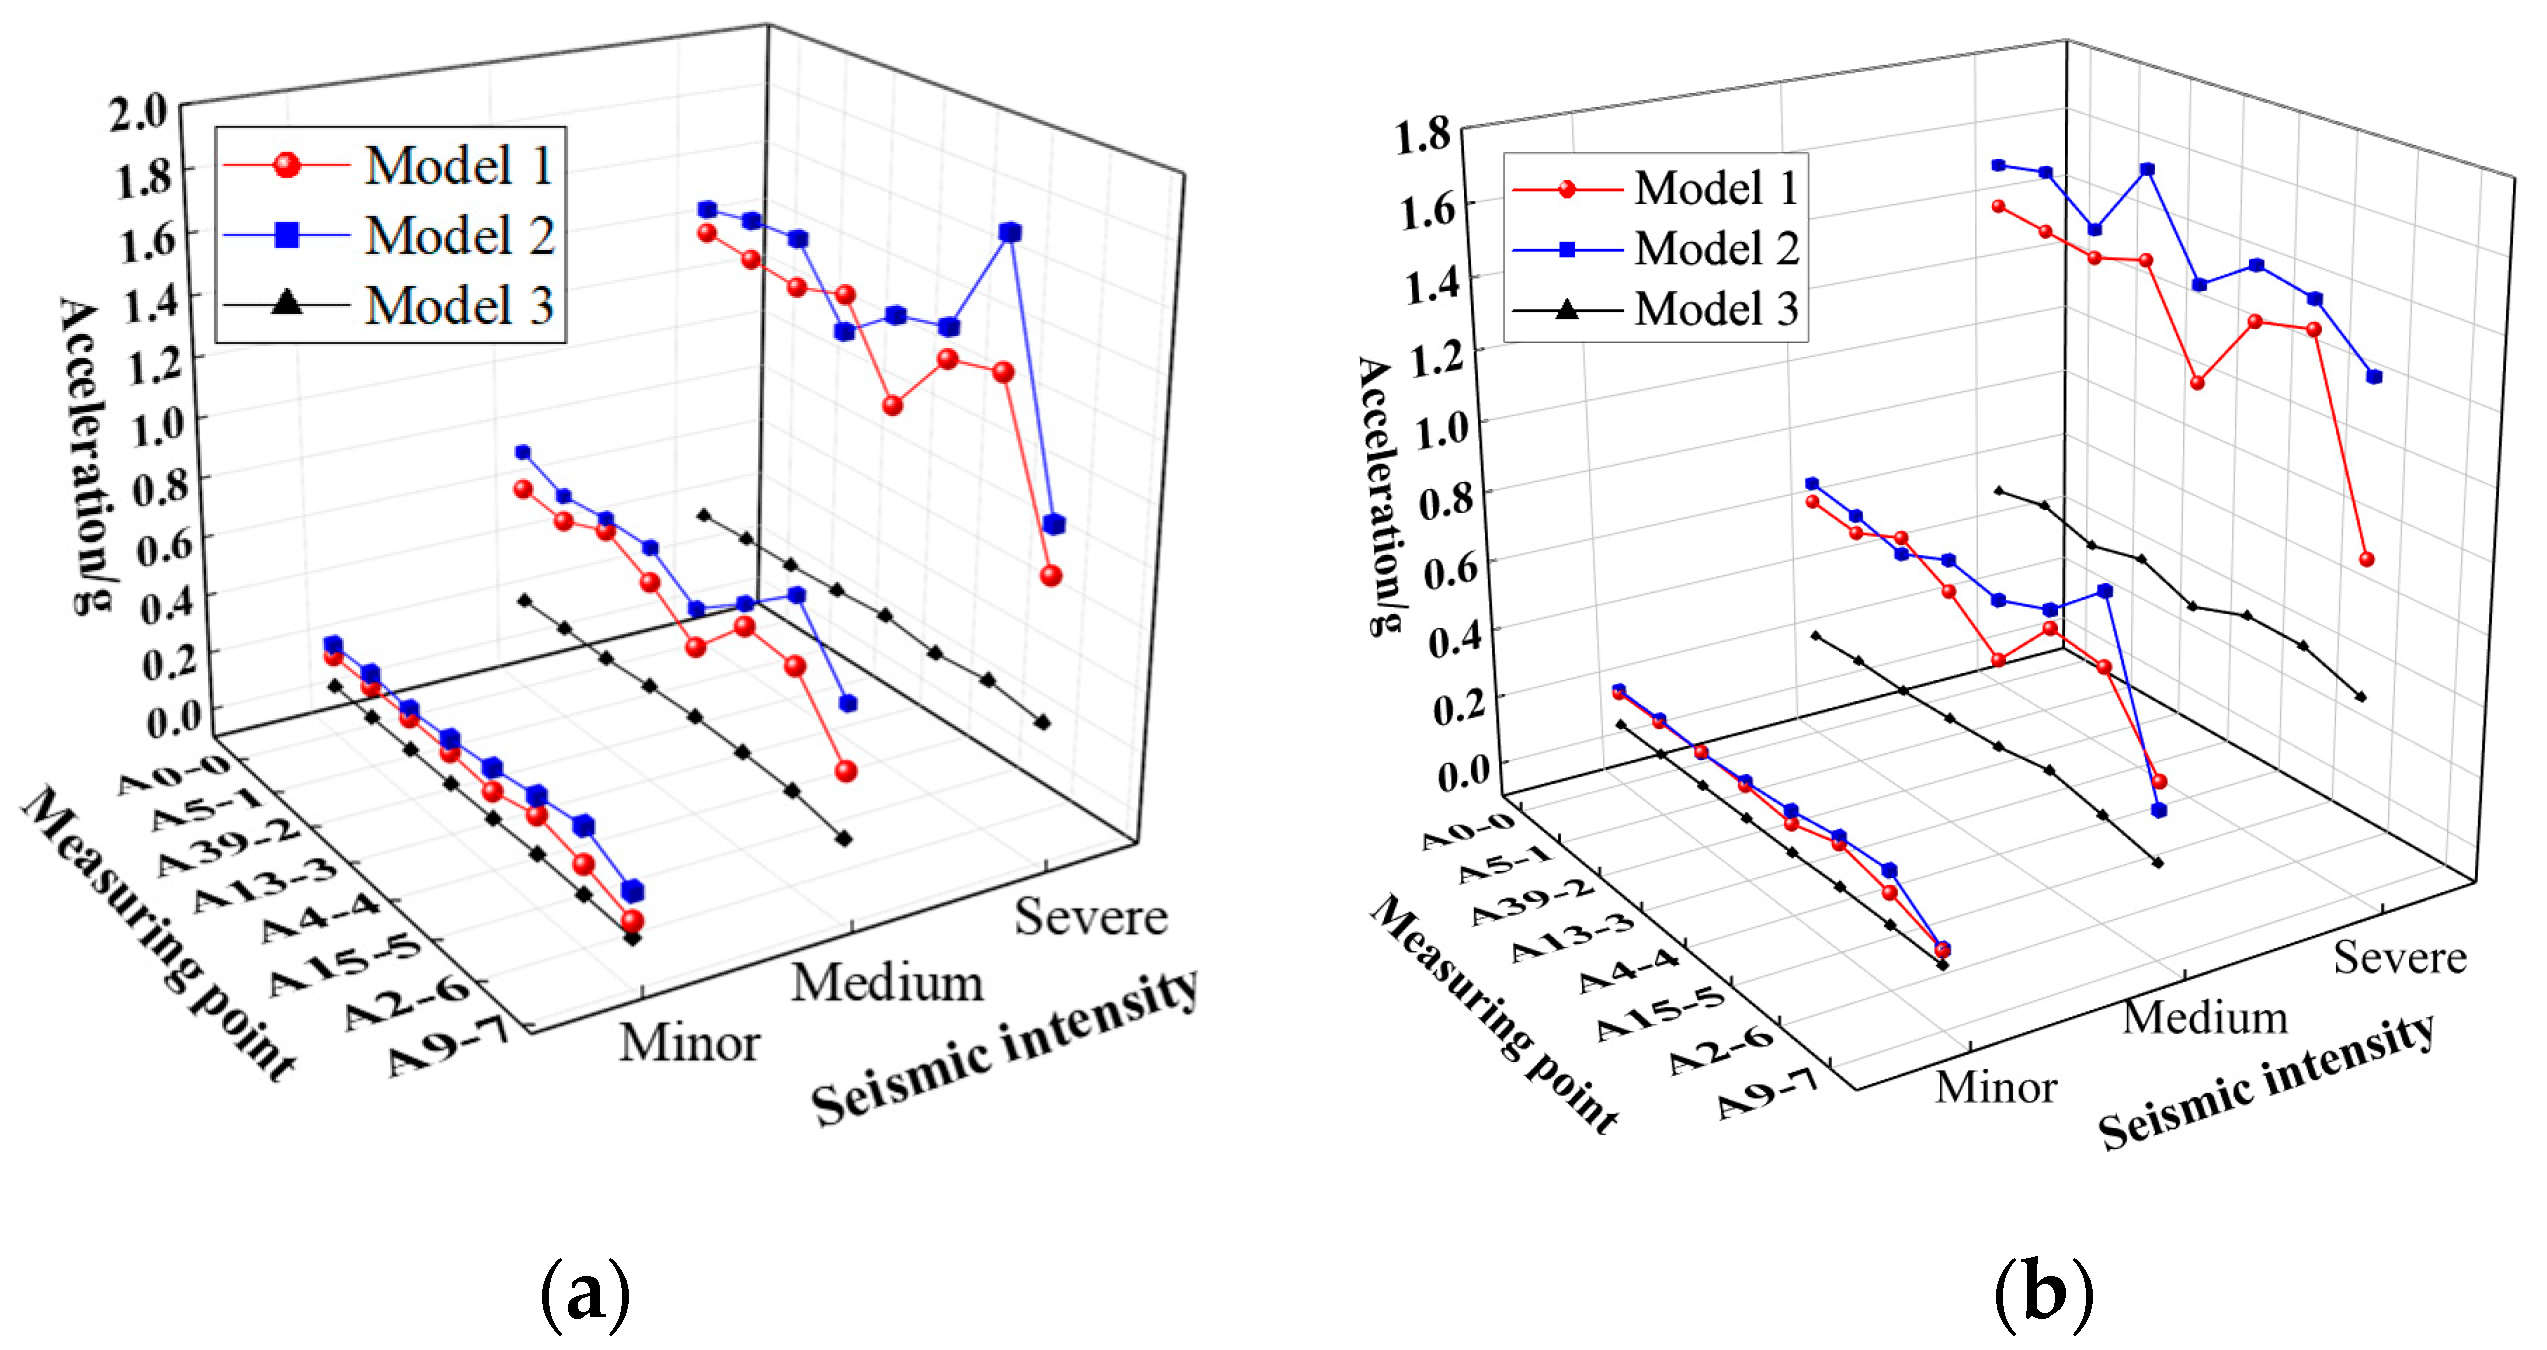
The peak acceleration responses in the x-direction of the three models are drawn in
Figure 15a,b;
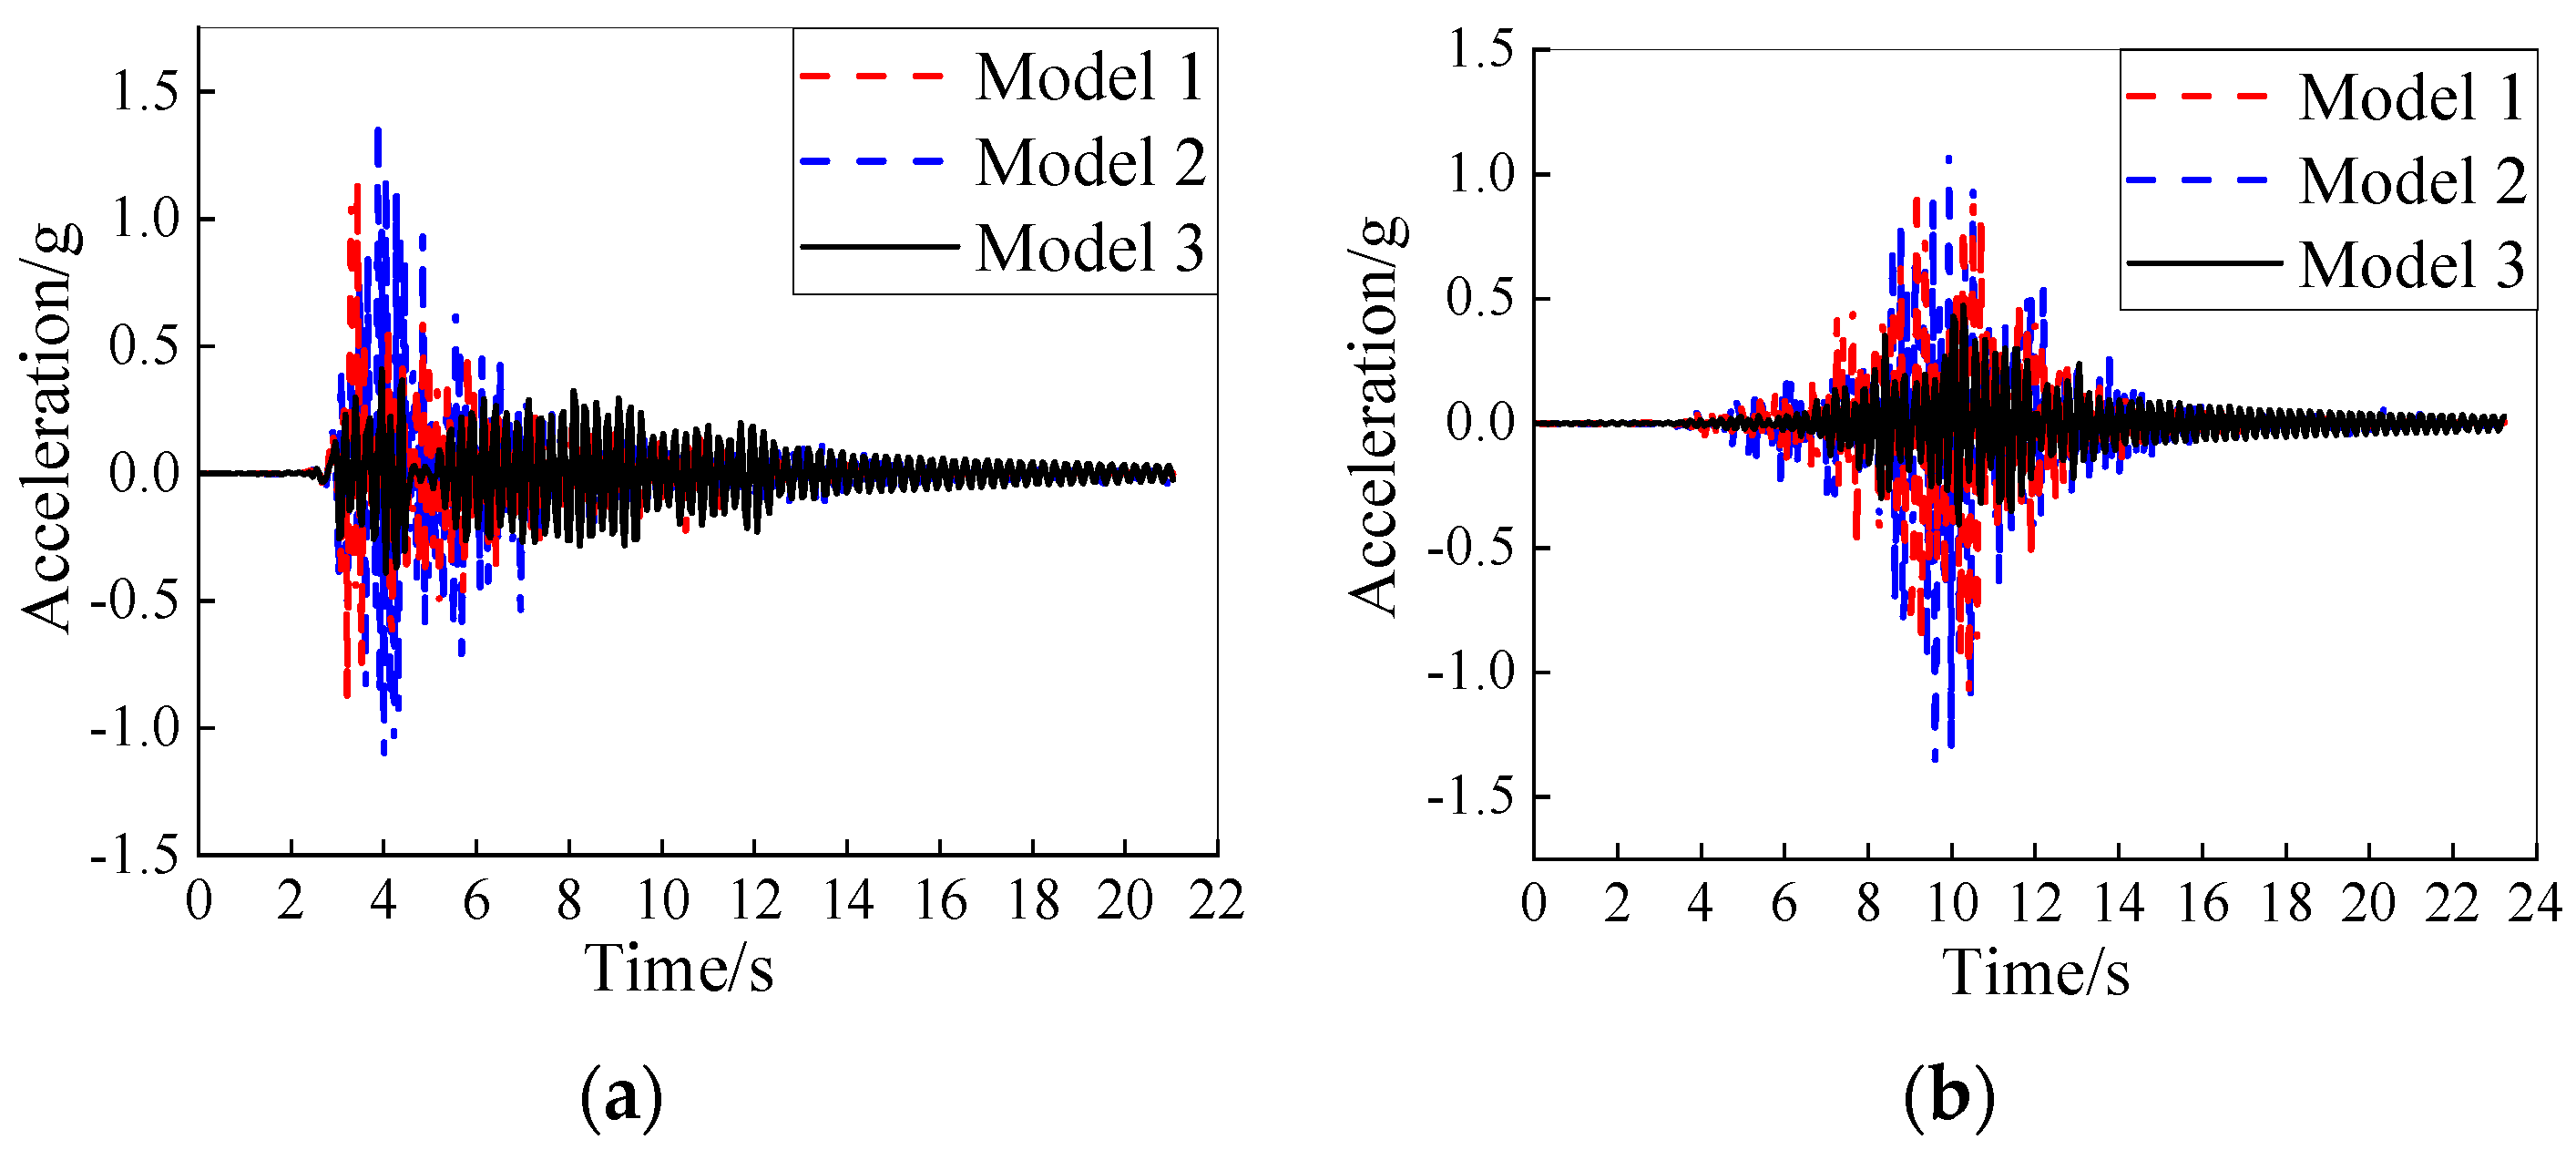
Figure 16 shows the acceleration time-history curves of measuring point A4-4 under the severe seismic load. It can be seen that the acceleration responses of the three models under various intensities of seismic loads differ significantly. Model 2 exhibits the highest acceleration response, followed by Model 1, and the acceleration response of Model 3 is the weakest; taking the peak acceleration of measuring point A4-4 as an example, under the excitation of the severe TAFT seismic record, the peak accelerations of A4-4 in Model 1, Model 2 and Model 3 are 1.15 g, 1.4 g, and 0.51 g, respectively; under the action of the severe Beijing seismic record, the peak accelerations of A4-4 in the three models are 1.11 g, 1.38 g, and 0.9 g, respectively. Moreover,
Figure 15 also reveals that the acceleration response of each measuring point in Model 3 is relatively consistent, indicating that the superstructure of Model 3 tends to vibrate as a rigid body; however, there is an obvious difference in the peak acceleration of each measuring point in Model 1 and Model 2.
Table 7 compares the maximum peak accelerations and the acceleration amplification coefficients of the three models. In this paper, the ratio of the peak acceleration response
a to the peak acceleration of the seismic record
ag is defined as the acceleration amplification coefficient
Ra, the calculation method is as follows:
It can be observed that Model 2 exhibits the greatest amplification effect on seismic loads, followed by Model 1, and Model 3 has the weakest amplifying effect on seismic loads.
These results indicate that the stiffness of the substructure has a great influence on the acceleration response of the suspen-dome structure; when the substructure stiffness decreases, it may further increase the acceleration response of the superstructure or it can have a seismic isolation effect on the superstructure, thereby reducing the superstructure’s acceleration response, and the underlying reasons for this will be analyzed later.
5.2.2. Displacement Response
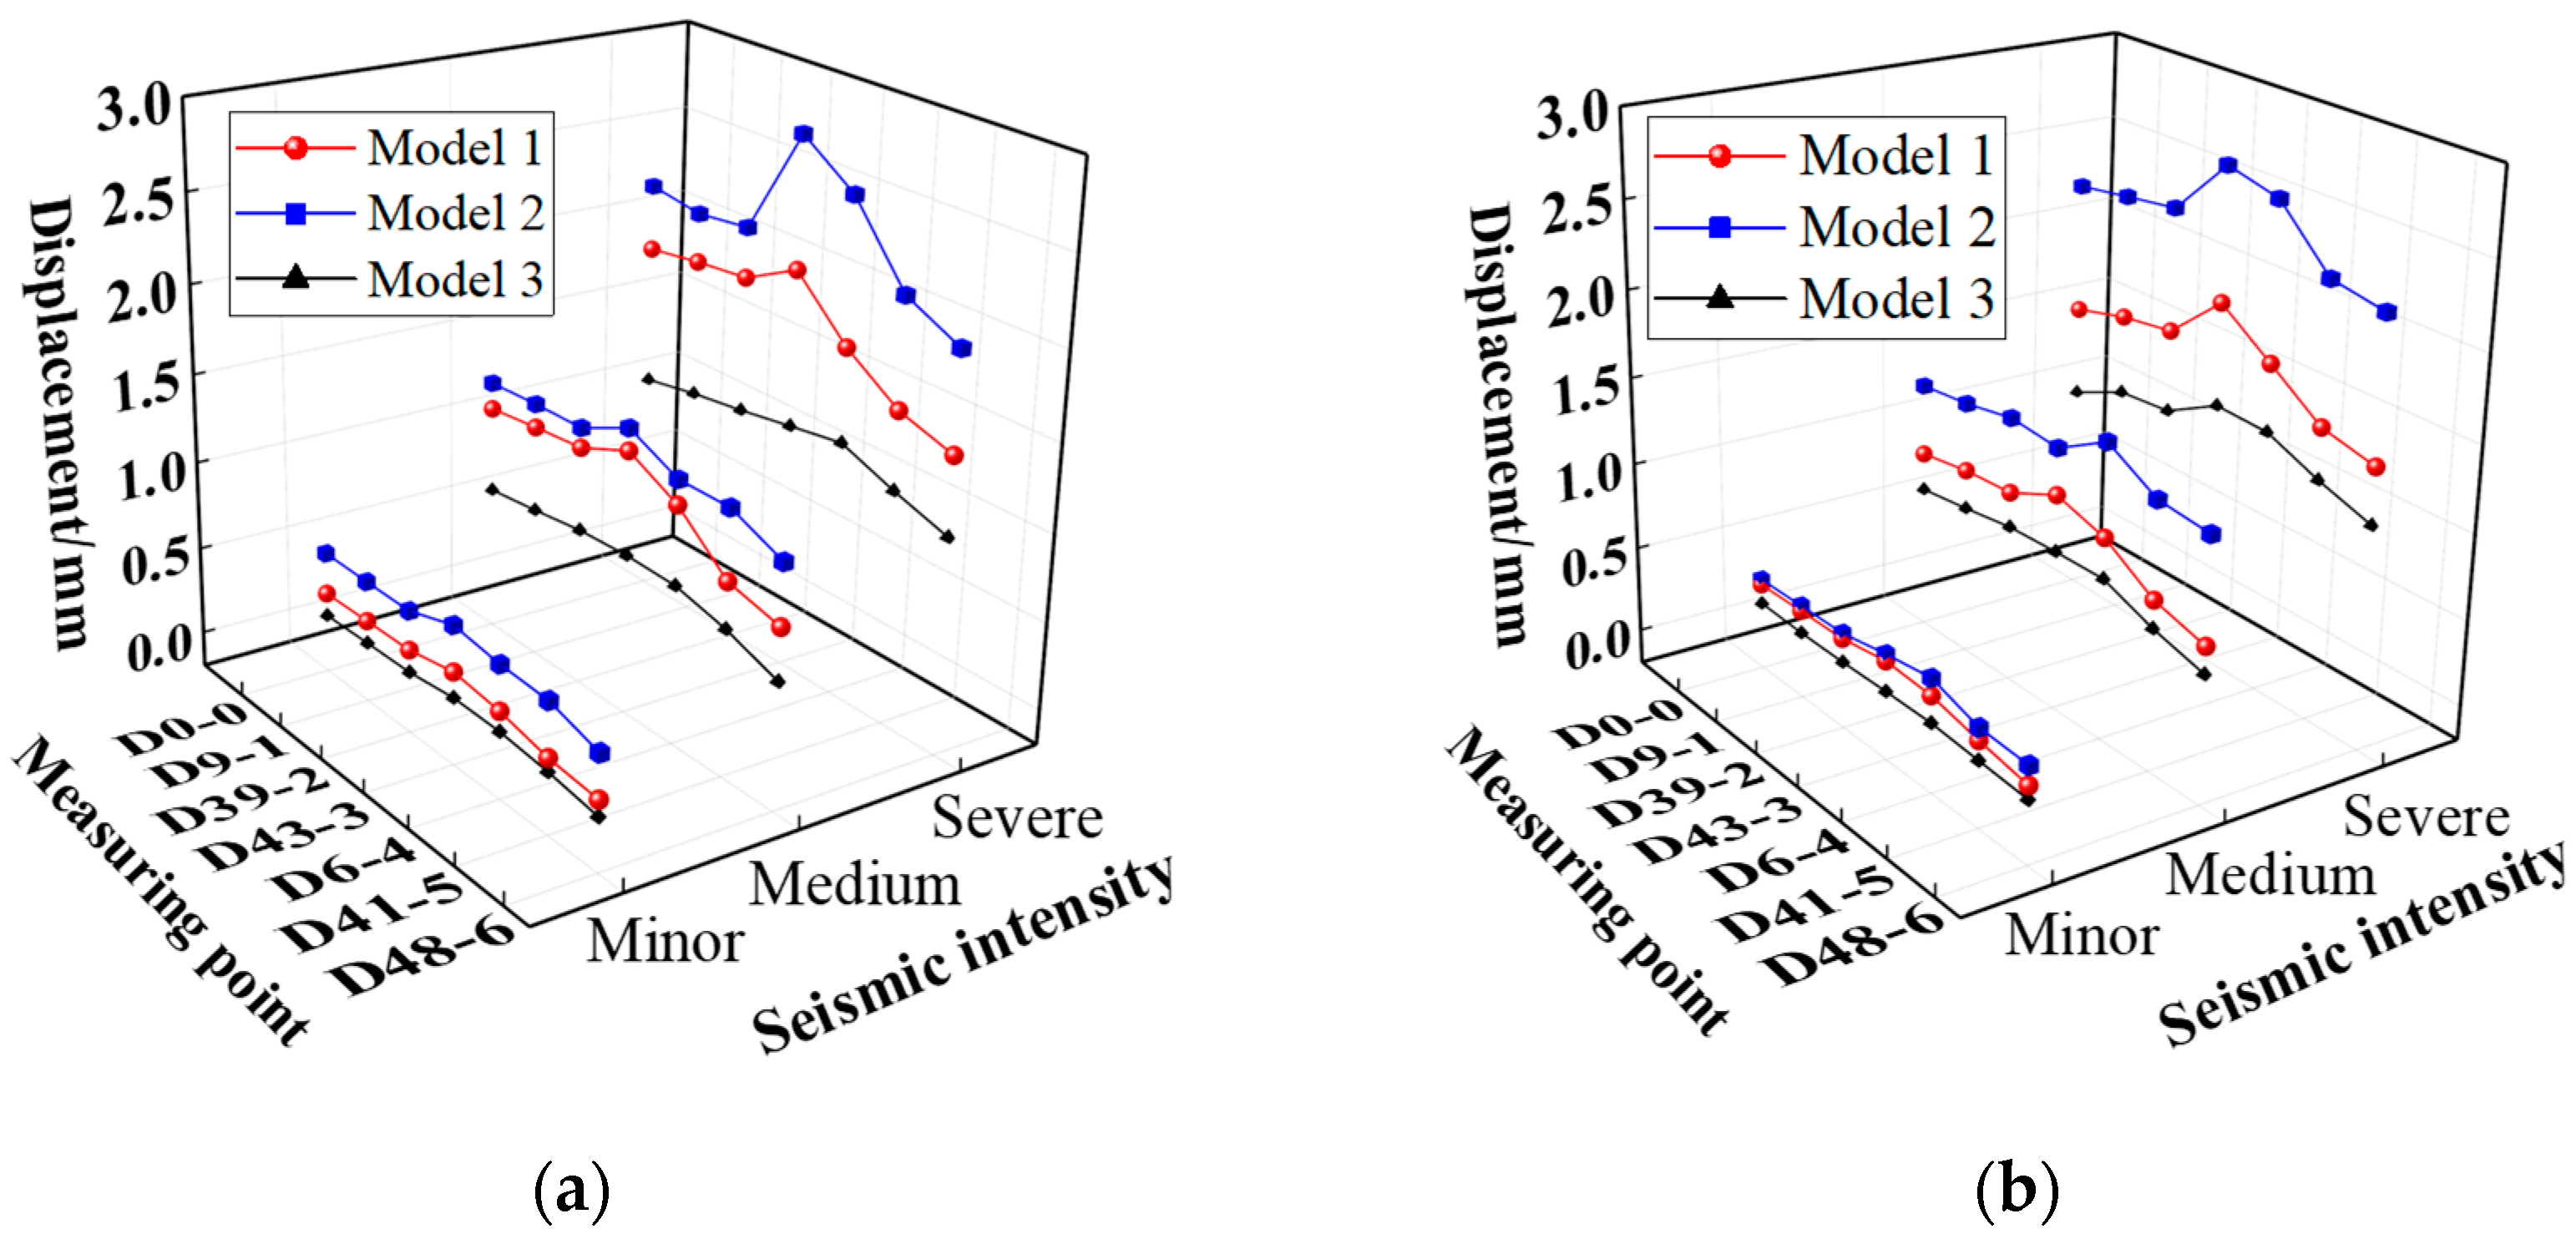
Figure 17a,b show the peak displacement responses of the three models;
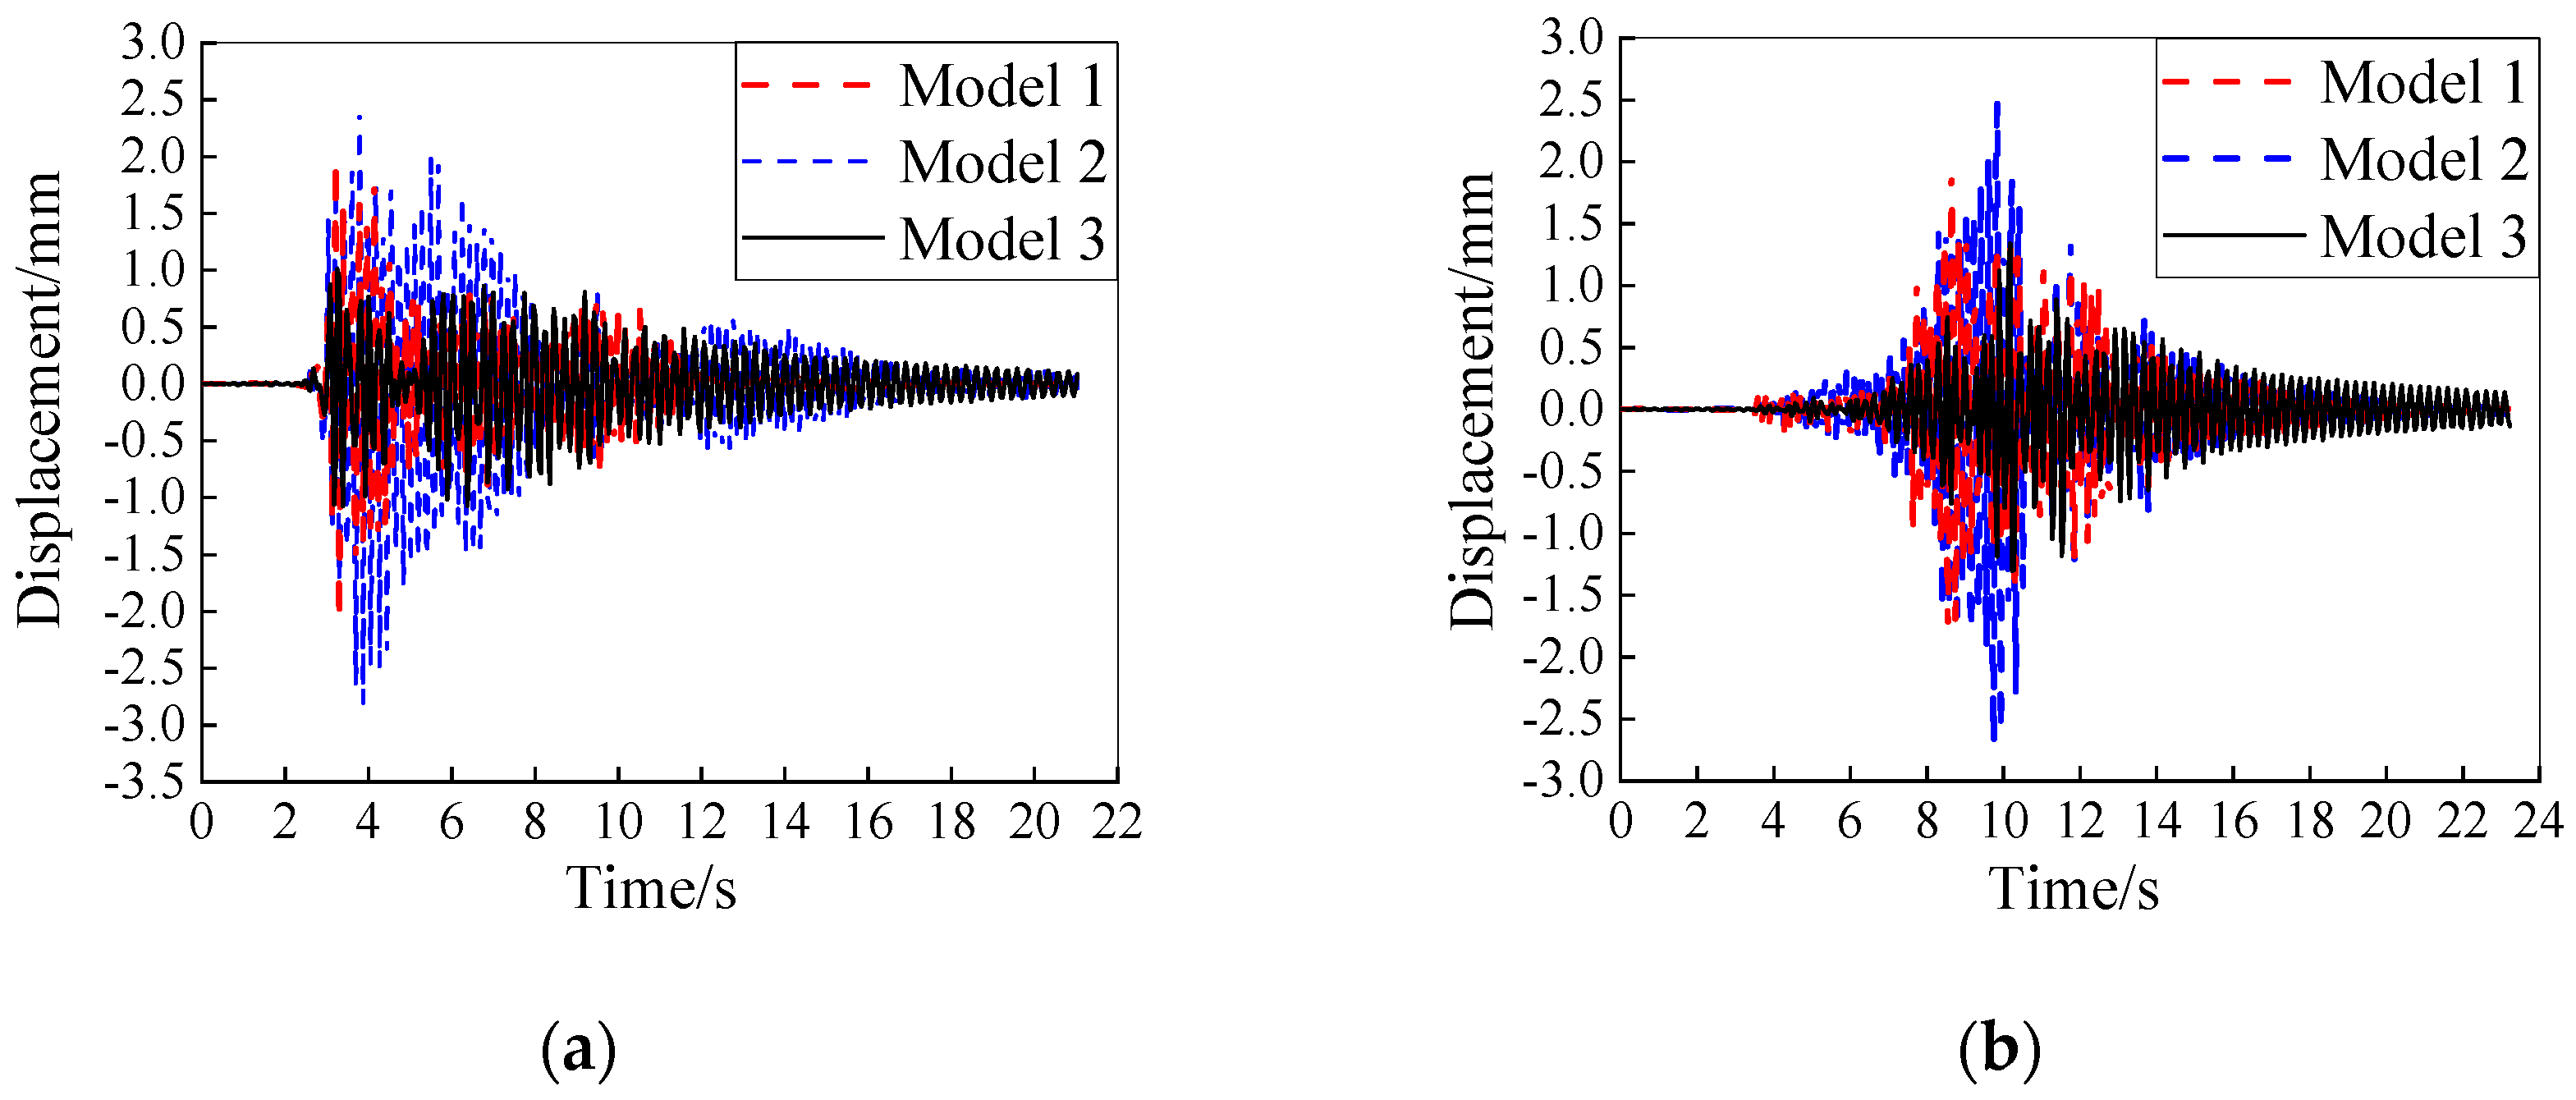
Figure 18a,b depicts the displacement time-history curves of measuring point D43-3. To exclude the influence of substructure displacements, the displacement values at each measuring point were taken as relative displacements to the column top. It can be observed that under varying intensities of seismic loads, the displacement responses of the three models exhibit significant differences. Of the three, Model 2 demonstrates the most intense displacement response, followed by Model 1, while Model 3 exhibits the smallest displacement response. For instance, under the severe TAFT seismic record’s action, the peak displacements of A4-4 in Model 1, Model 2, and Model 3 are 2.09 mm, 2.82 mm, and 1.26 mm, respectively. Similarly, under the severe Beijing seismic record’s action, the peak displacements of A4-4 in the three models are 1.93 mm, 2.70 mm, and 1.34 mm, respectively. Furthermore, it is evident that the peak displacements at each measurement point of Model 3 are similar, and the trend of the line connecting the peak displacements at each point is relatively smooth and approaches a line, indicating that under the impact of an earthquake, its superstructure tends to move as a rigid body. In contrast, significant differences in peak displacements exist between each measurement point in Models 1 and 2, suggesting that the superstructures of these two models have undergone significant displacement deformation.
Table 8 presents the maximum peak displacement of the three models under seismic actions of varying intensities. It can be seen that there are significant differences in the maximum displacement responses among the three models, with Model 2 exhibiting the largest displacement response, followed by Model 1, and Model 3 having the weakest displacement response. That is to say, the deformation of Model 2 is the most obvious, followed by Model 1, and the deformation of Model 3 is the smallest.
The aforementioned results demonstrate that the displacement response of the suspen-dome structure is obviously influenced by the substructure stiffness; and similar to acceleration response, as the stiffness of the substructure decreases, the displacement and deformation of the suspen-dome structure may either increase or decrease.
5.2.3. Internal Force Response
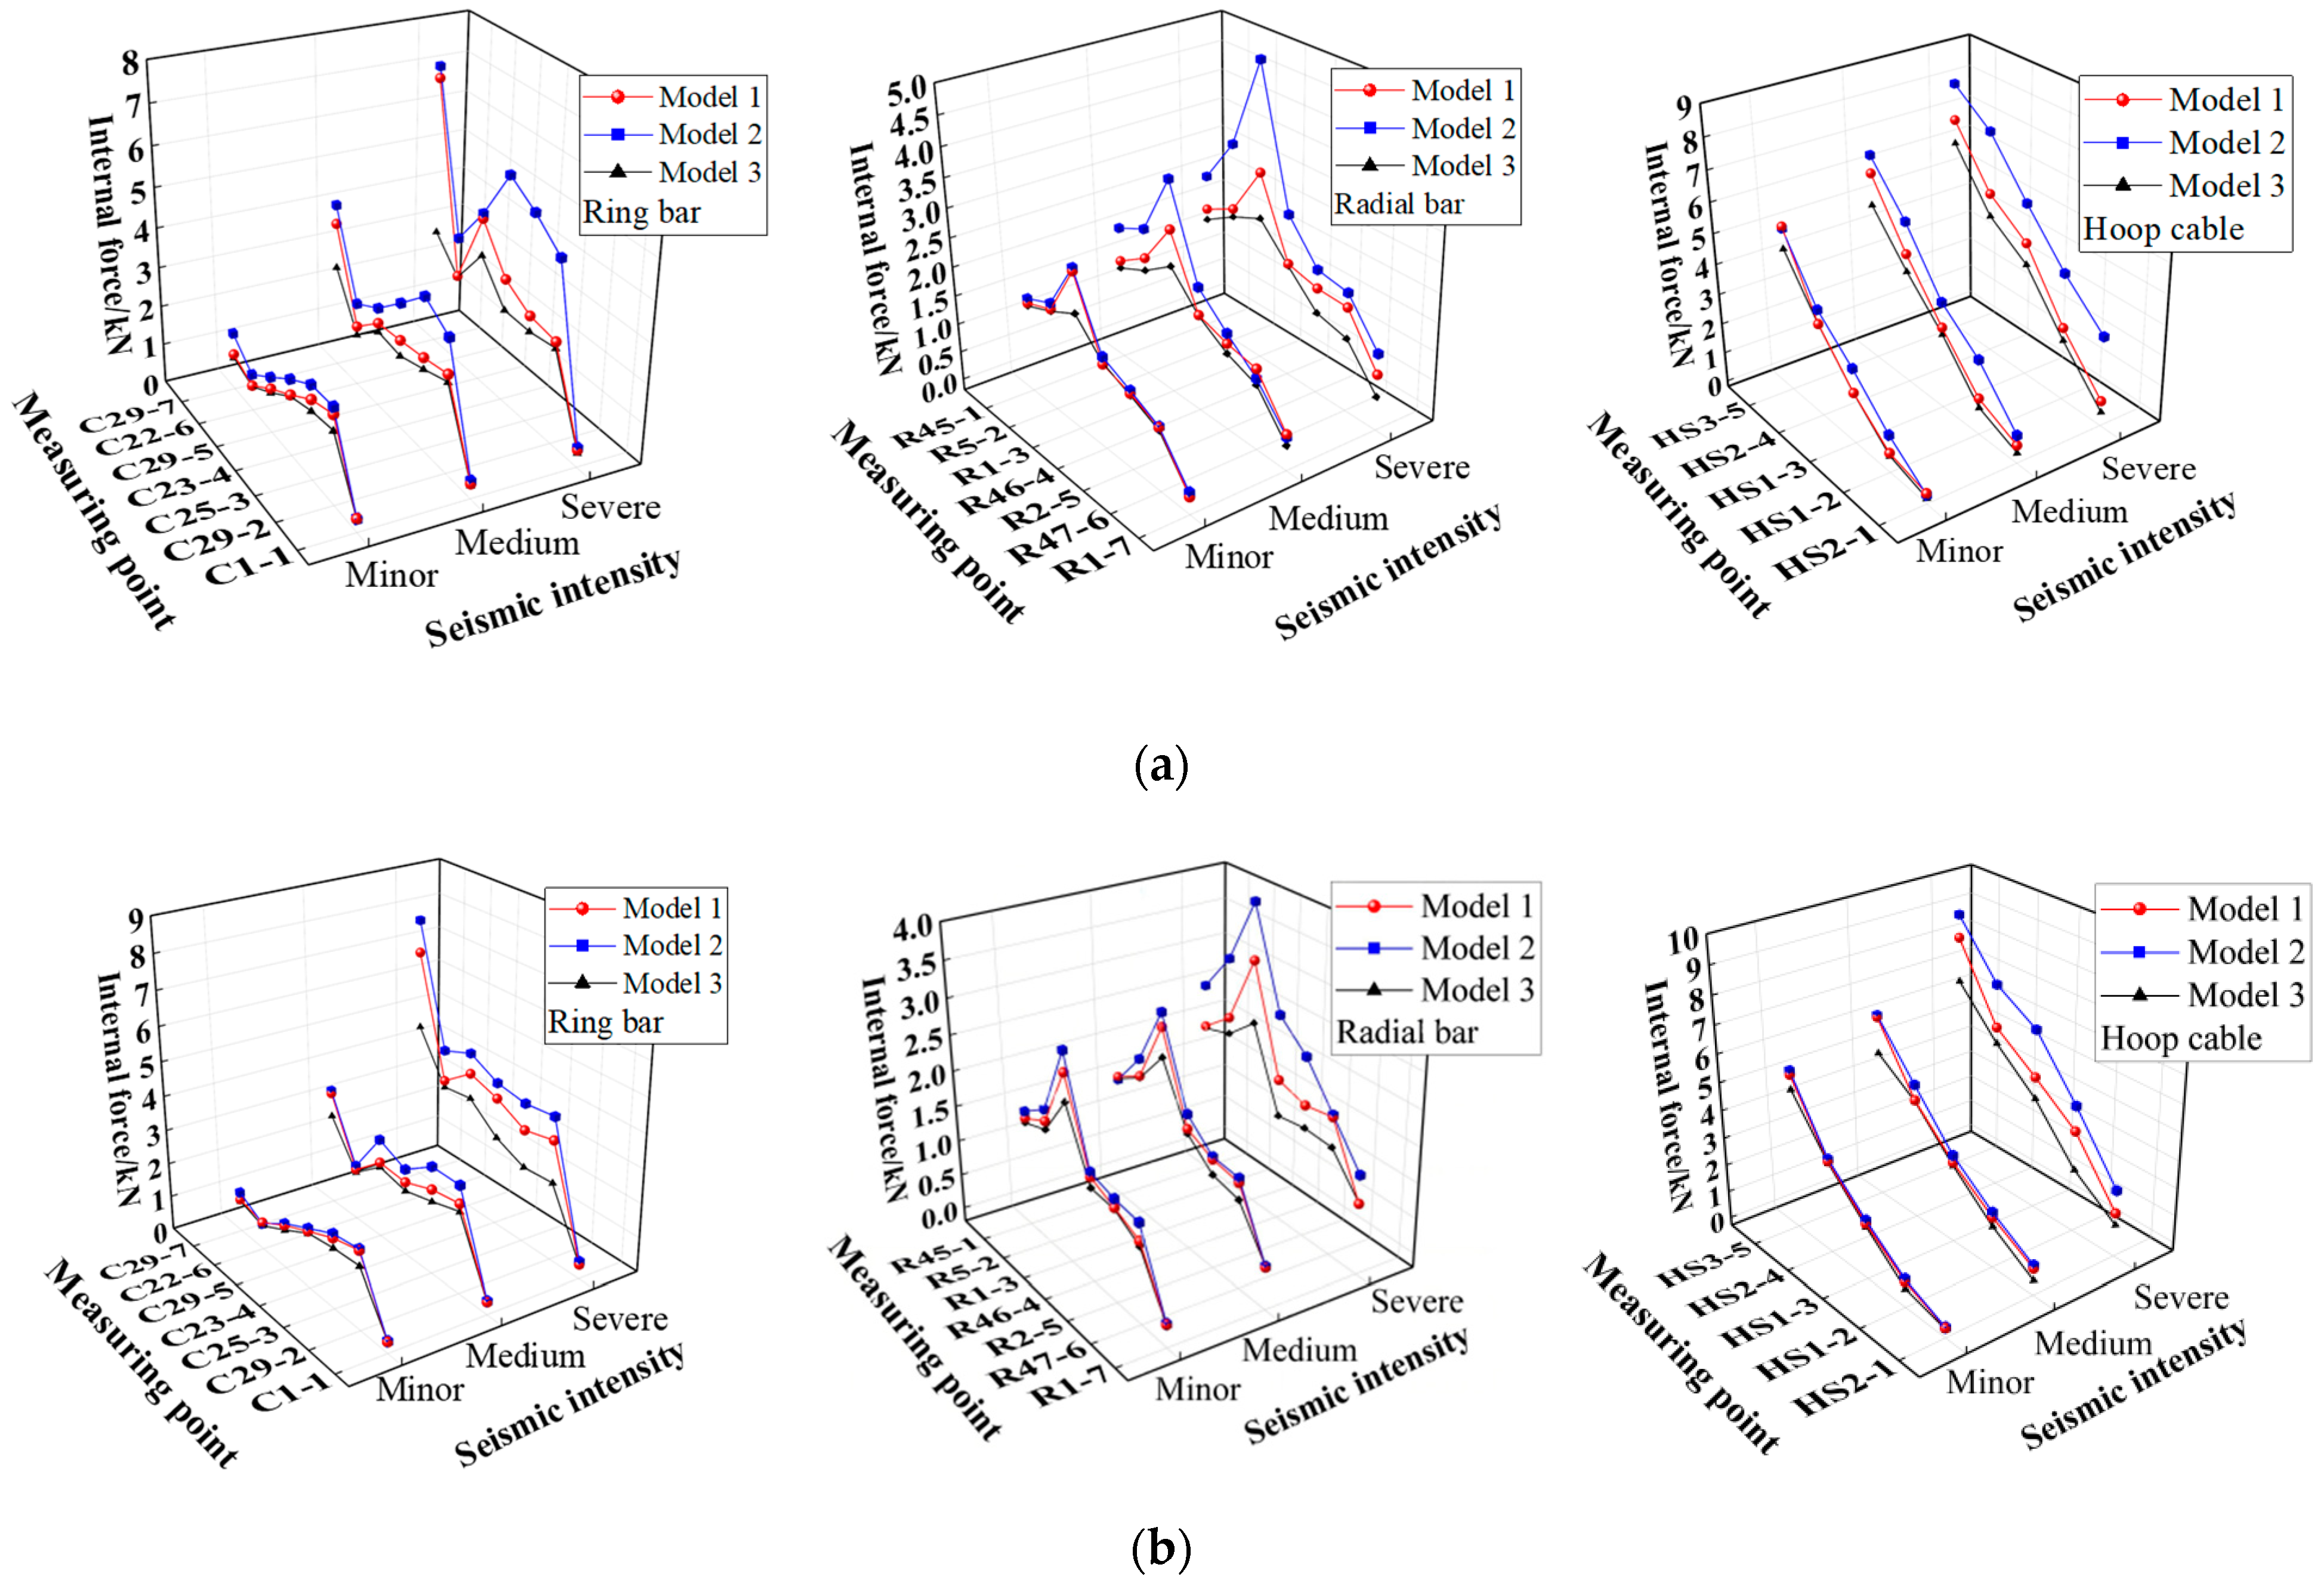
Figure 19a–b display the peak internal force responses of the ring bars, radial bars, and hoop cables, respectively;
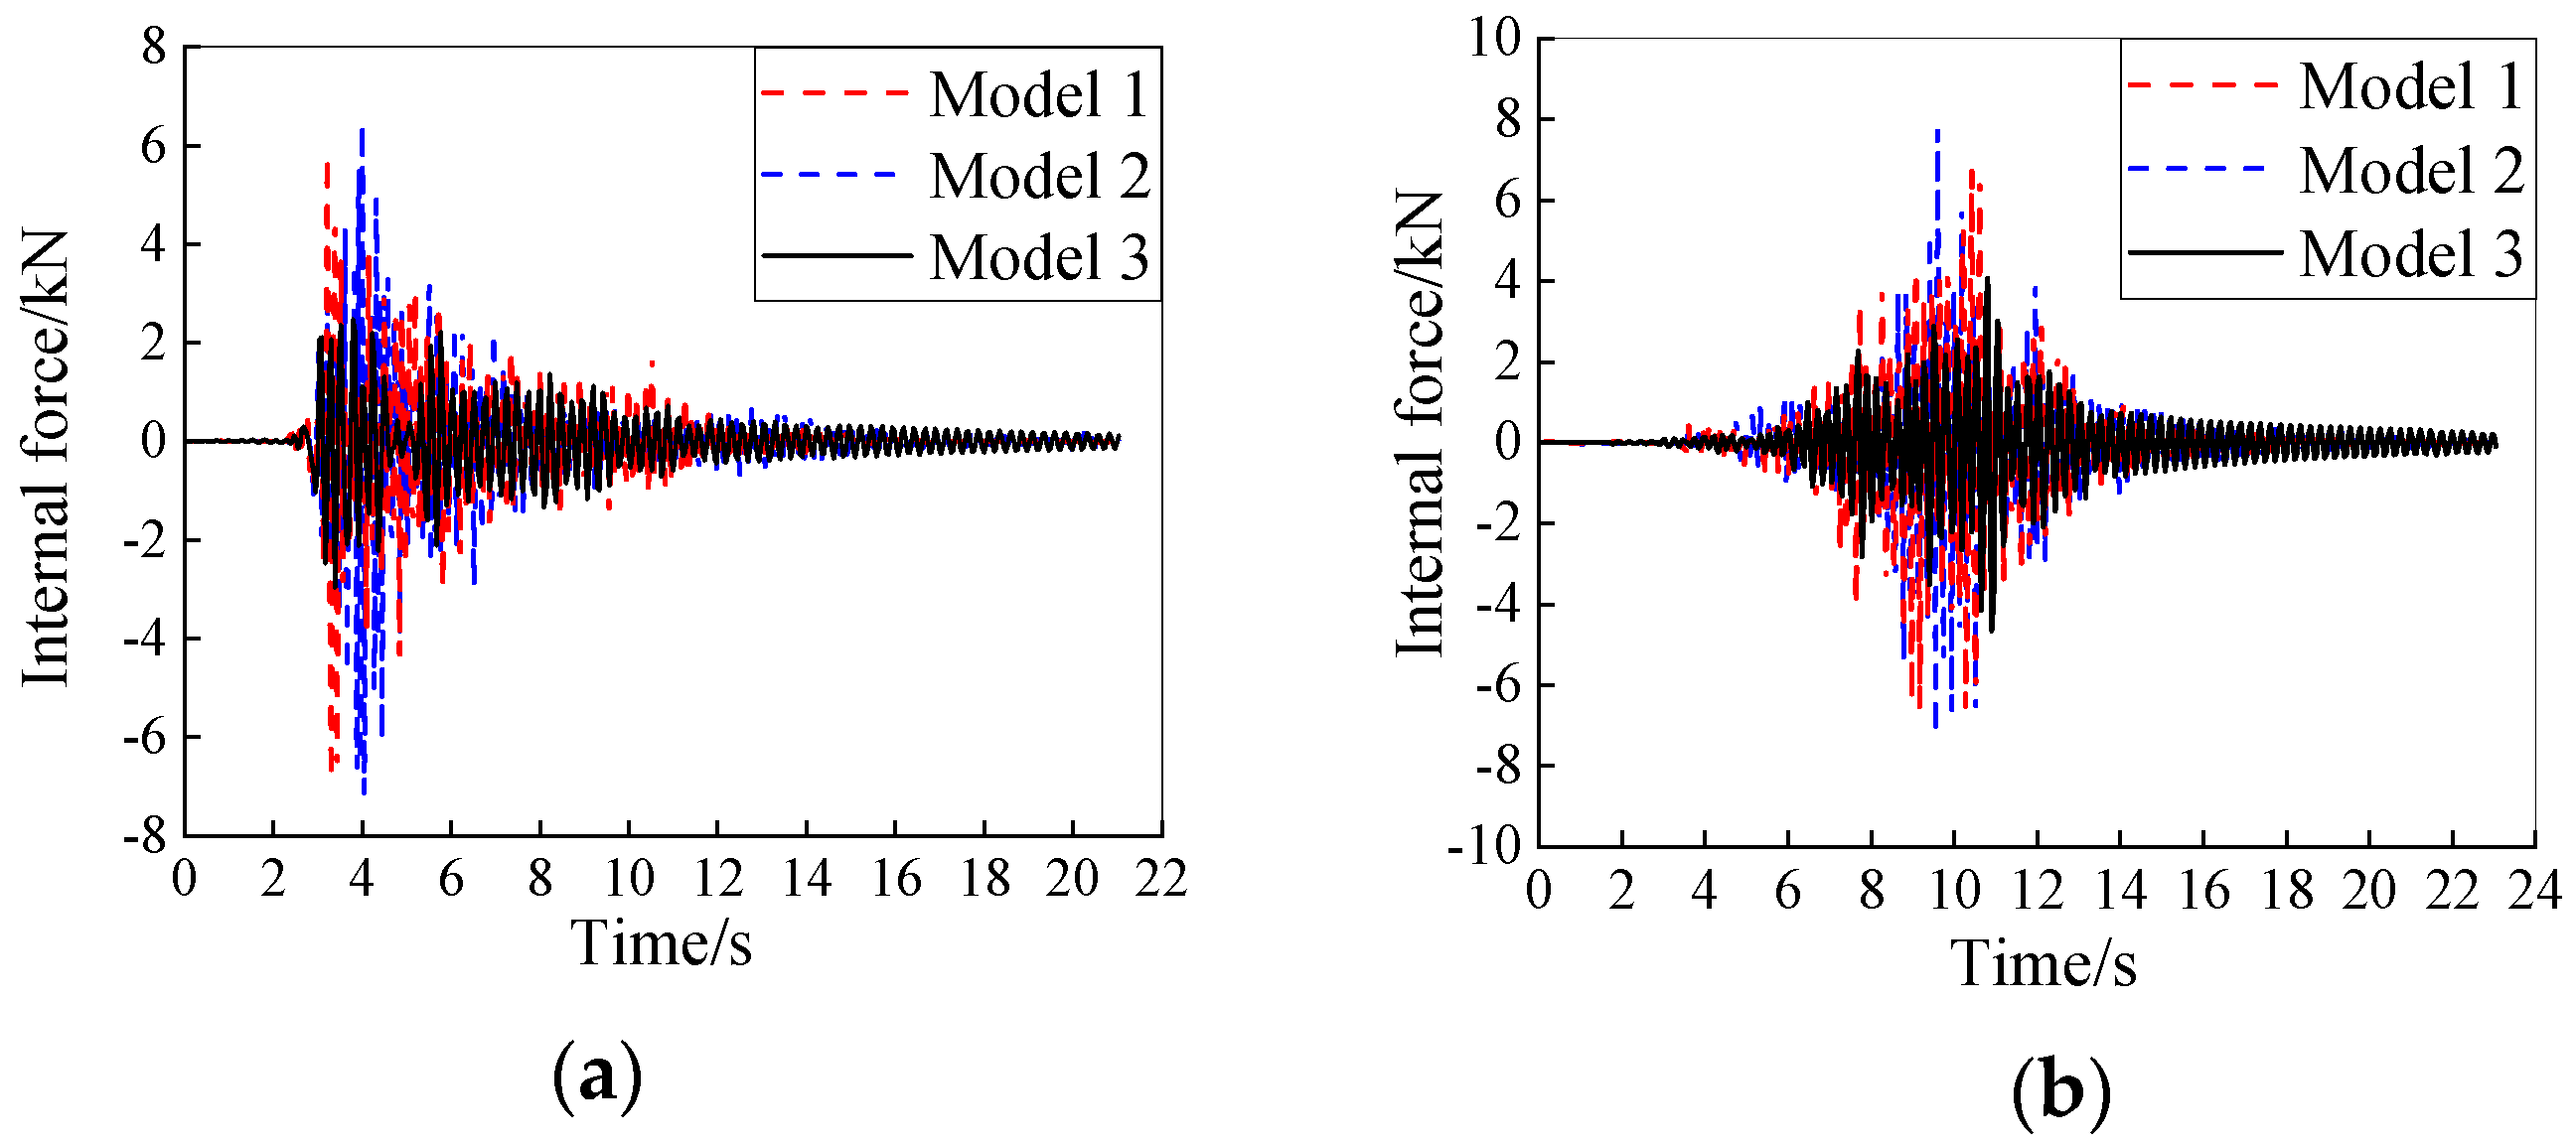
Figure 20a,b present the internal force time-history curves of measuring points C29-7 under the severe seismic record’s action. It is shown that under the excitation of seismic loads with different intensities, there are remarkable differences in the internal forces of various types of members in the three models, and the internal force response of Model 2 is the most intense, followed by Model 1, and the internal force response of Model 3 is the smallest. Taking the maximum internal force of the ring bar C29-7 as an example, when Model 1, Model 2 and Model 3 are excited by the severe TAFT record, the peak internal forces of the ring bar C29-7 of the three models are 6.77 kN, 7.26 kN, and 3.26 kN, respectively; when the three models are excited by the severe Beijing record, the peak internal forces of the ring bar C29-7 of the three models are 6.86 kN, 7.79 kN, and 4.65 kN, respectively.
Table 9 lists the maximum peak internal forces of various members in the three models under the action of seismic load. It is also illustrated that the internal force responses of the three models vary noticeably, and Model 2 exhibits the largest internal force response, followed by Model 1, while Model 3 shows the smallest.
Based on the above results, it can be inferred that the internal forces of the suspen-dome structure are considerably affected by the substructure stiffness. In addition, consistent with the variation patterns of acceleration response and displacement, when the stiffness of the substructure decreases, the internal forces of the suspended dome structure may significantly increase or decrease.
5.3. Result Analysis
According to the above results, although the substructure stiffness of Model 2 and Model 3 is lower than that of Model 1, the seismic responses of Model 2 are more severe than that of Model 1, while the seismic responses of Model 3 are the weakest, the superstructure of which tends to move and deform as a whole. This is attributed to the greater amplification of seismic input by the substructure of Model 2 compared to Model 1; while compared with Model 1 and Model 2, the substructure of Model 3 had a seismic isolation effect.
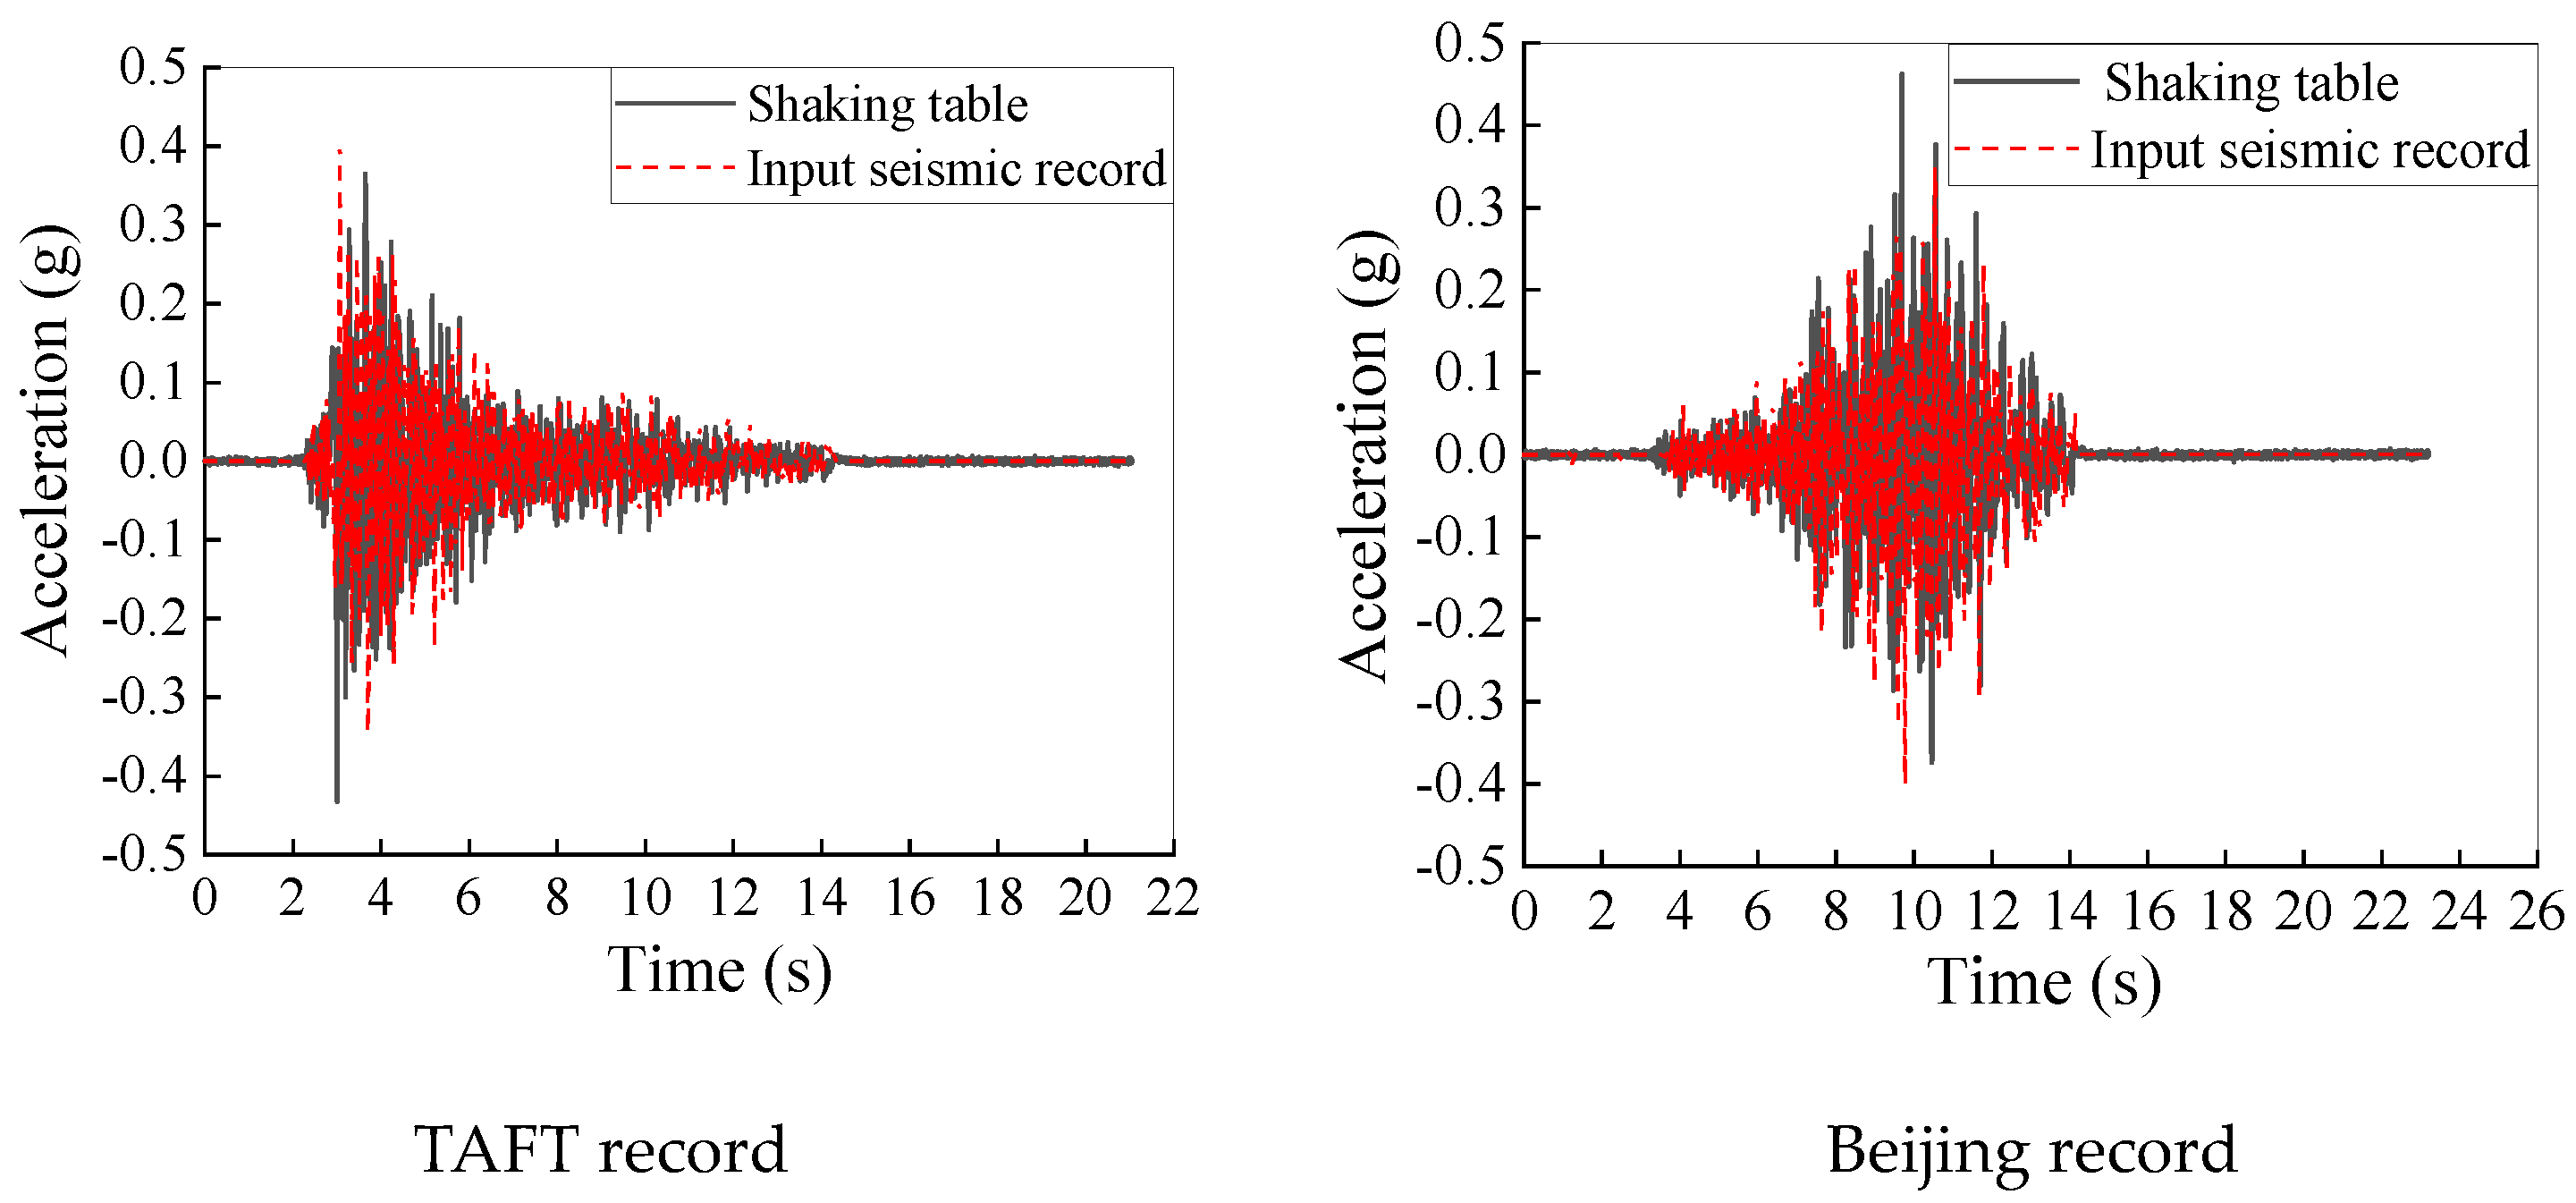
To validate the above inference, the column-top acceleration–time-history curves of the three models under severe TAFT seismic excitation were compared against the input acceleration–time-history curves, as shown in
Figure 21a–c. It can be observed that the peak acceleration of the input seismic record is 0.43 g, and the peak accelerations of the column tops of Model 1, Model 2, and Model 3 are 0.65 g, 0.96 g, and 0.31 g, respectively; in other words, the substructures of Model 1, Model 2 and Model 3 amplify the input seismic load by factors of 1.5, 2.2, and 0.73, respectively, indicating that the substructure of Model 2 has the greatest amplification effect on seismic loads, followed by Model 1, while the substructure of Model 3 has a seismic isolation effect on seismic loads, which proves the correctness of the above inference.
In addition, in order to further study the influence of the substructure stiffness on the seismic response of the suspen-dome structure, the amplitude–frequency curves of the seismic records are depicted in
Figure 22. It can be seen that the main frequency ranges of TAFT seismic record and Beijing seismic record are 4.53 Hz~16.52 Hz and 3.15 Hz~8.67 Hz, respectively. At the same time, according to
Figure 12, the fundamental frequencies of the three models are 5.784 Hz, 5.111 Hz and 3.420 Hz, respectively. It follows that the fundamental frequency of Model 3 is quite different from that of Model 1 and Model 2, which falls outside the main frequency ranges of the seismic records, thus the substructure of Model 3 has a seismic isolation effect on the superstructure, so that the seismic response of the superstructure of Model 3 is the smallest; by contrast, the fundamental frequencies of Model 1 and Model 2 are relatively close and the main frequency range of seismic records cannot be avoided, so the seismic responses of the superstructures of Model 1 and Model 2 are relatively violent. In addition, the substructure stiffness of Model 1 is the strongest and the upper suspen-dome is firmly constrained; hence, the seismic response of Model 1 is weaker than that of Model 2, while the restraining effect of the substructure in Model 2 is relatively weaker, resulting in a more intense seismic response of the superstructure than that of Model 1.
Based on the above analysis, it can be concluded that the influence of substructure stiffness on the seismic response of suspen-dome structure mainly depends on two aspects: on one hand, as the substructure stiffness is different, the strength of the constraint on the superstructure is varying, which affects the seismic responses of the superstructure; on the other hand, the change in the substructure stiffness will affect the fundamental frequency of the overall structure, so that the seismic responses of the structures will also be different under seismic loads with certain spectral characteristics. At the same time, it is well-known that the spectral characteristics of seismic load are often site-dependent. Consequently, in seismic analysis and design, the influence of substructure stiffness on the seismic response of suspended dome structures should be considered, and the substructure with reasonable stiffness should be designed and selected in combination with the building site.
6. Conclusions
In order to investigate the dynamic characteristics and seismic responses of suspen-dome structures accounting for substructure stiffness, the gymnasium of the Lanzhou Olympic Sports Center served as the prototype, a method of accounting for the complex concrete substructures of the prototype structure in a dynamic scale model was proposed, and an overall test model with a scale ratio of 1:20 was designed and produced. After that, a white noise excitation test was carried out on the test model, and the natural frequencies were compared with those of the prototype structure after considering the scale ratio. Moreover, the natural frequency and seismic response of the overall numerical model were compared with the simplified model, and the influence of the substructure on the seismic performance of the suspen-dome structure was studied. Finally, three overall numerical models with various levels of substructure stiffness were established, and the dynamic characteristics and seismic response of the three models were compared and analyzed. The following conclusions can be drawn:
(1) The proposed method of replacing complex concrete substructures of the suspen-dome prototype structure with steel substructures in the dynamic scale model is accurate and reasonable. The result will provide a reference for the design of shaking table test models of suspen-dome structures with substructures.
(2) The inclusion of substructures reduces the overall stiffness of the suspen-dome structure, thereby reducing the structural natural frequency. Meanwhile, the seismic responses of the overall model increase significantly compared to the simplified model. Therefore, substructures should be considered, and overall models employed in the seismic analysis and design of suspen-domes.
(3) With a reduction in substructure stiffness, the natural frequency of the suspen-dome structure will decrease, and the vibration mode of the overall structure will change from the deformation of the superstructure to the coupled deformation of the superstructure and the substructure.
(4) The seismic response of the suspen-dome structure is governed by two primary factors related to substructure stiffness: the degree of constraint it imposes on the superstructure, and the fundamental frequency of the overall system, which determines its resonance susceptibility to the spectral characteristics of the seismic input.
In future research, the failure mechanism and ultimate bearing capacity of the suspen-dome structure considering the influence of the substructures subjected to extremely severe earthquakes can be further studied by shaking table tests and numerical simulations.
