Article

Enhanced Skin Lesion Segmentation via Attentive Reverse-Attention U-Net

Software Engineering Department, Engineering and Natural Science Faculty, Bandırma Onyedi Eylül Üniversitesi, Bandırma 10200, Balıkesir, Turkey
Symmetry 2025, 17(11), 2002; https://doi.org/10.3390/sym17112002
Submission received: 14 October 2025 / Revised: 10 November 2025 / Accepted: 17 November 2025 / Published: 19 November 2025
(This article belongs to the Section Computer)

Abstract

Accurate identification and segmentation of skin lesions are essential for the early diagnosis of skin cancer. Symmetry is an important diagnostic cue in clinical practice, as malignant lesions often exhibit asymmetric patterns in shape, color, and texture. Therefore, incorporating symmetry-based features into automated analysis can enhance segmentation reliability and improve diagnostic accuracy. However, automated lesion segmentation faces significant challenges, including blurred boundaries, low-contrast lesions, and heterogeneous backgrounds. To address these challenges, we propose a hybrid deep neural network model that enhances the traditional U-Net architecture with an integrated reverse-attention module embedded within its skip connections. This innovation sharpens feature extraction in ambiguous regions, boosting segmentation accuracy, particularly in complex areas. The model employs a multifaceted loss function approach—encompassing binary cross entropy, dice, Tversky, and compound losses—to effectively manage data imbalances while preserving lesion boundary details. Experimental validation on the ISIC2018 and PH2 datasets demonstrates the model’s efficacy, achieving dice similarity coefficients of 88.71% and 93.41% and mean intersection over union values of 87.68% and 90.78%, respectively. These results underscore the potential of our approach for clinical applications.

1. Introduction

The skin acts as a barrier between internal organs and the external environment to protect human health. If the skin barrier is compromised for any reason, it can result in microbial dysbiosis. In simpler terms, this refers to the disruption of the balance of microorganisms—such as bacteria, viruses, fungi, and various eukaryotic microbes—collectively known as the microbiota, which can harm human health (dysbiosis). This undesirable condition may be an early indicator of skin cancer. Skin cancer is a deadly type of cancer that is more common in the white population and continues to impose an increasing global health burden [1]. As with other fatal cancers, early diagnosis of skin cancer is vital. Therefore, the early and accurate detection of this cancer type is an important area of research.
Skin cancer is classified into two main types: melanoma and non-melanoma skin cancers (NMSC) [2]. Melanoma typically originates from a mole and is considered the most aggressive form of skin cancer. Among NMSC, basal cell carcinoma (BCC) is the most common type. Although BCC is prevalent, it poses a relatively low risk to life. Squamous cell carcinoma (SCC), another common type of NMSC, is more dangerous because it can rapidly spread to lymph nodes and internal organs, posing a significant health threat. There are also less-common types of non-melanoma skin cancers. Melanoma, however, is the most aggressive and deadliest form of skin cancer. A study conducted in 2022 projected that the global incidence of melanoma will reach approximately 510,000 new cases by 2040, accompanied by an estimated 96,000 melanoma-related deaths worldwide [3].
Early detection of skin cancer has been shown to reduce mortality rates by up to 90% [4]. The accurate diagnosis of skin cancer in clinical practice heavily relies on the dermatologist’s expertise. Several factors influence the accuracy of diagnosis, including the complexity of the lesion, the quality and quantity of dermatoscopic images, and the dermatologist’s level of experience. Consequently, diagnosing skin cancer in clinical settings is often subjective, challenging, and time-consuming. The subjective nature of diagnosis is closely tied to the physician’s expertise. For instance, in a study, clinicians with six or more years of dermoscopy experience demonstrated significantly higher diagnostic performance compared to their counterparts with less than six years of experience [5].
Dermatologists commonly employ the ABCDE method and biopsy procedures for diagnosing skin cancer. The ABCDE method is a diagnostic approach based on the morphological features of the lesion. It evaluates the Asymmetry (A), Border irregularity (B), Color variation (C), Diameter (D), and Evolution (E) of the lesion. However, due to the similarities between skin cancer and benign lesions, this method is often inconsistent and challenging to apply reliably. On the other hand, the biopsy method involves the extraction of tissue from the suspected cancer area, followed by a pathological examination of the sample. While this approach is definitive, it is often painful and time-consuming in clinical practice.
Computer-aided diagnosis (CAD) systems provide fast, robust, and reliable methods for the classification and segmentation of skin cancer. In recent years, there has been a significant increase in the development of deep learning-based CAD systems. While these systems have demonstrated considerable improvements in segmenting and classifying skin lesions, several challenges remain, as illustrated in Figure 1. These challenges include the variability in the shape and size of lesions, the presence of hair occluding the lesion, and the difficulty in distinguishing the lesion from the background due to low contrast or similarity.

1.1. Related Works

Karthik et al. [7] proposed a novel image enhancement framework for the classification of skin cancer types. Their method comprises two sequential stages: image enhancement and image classification. In the image enhancement stage, the process involves image decomposition followed by a weighted least squares (WLS) filter. Image decomposition is achieved by convolving the original input image with a Gaussian filter to separate structural and textural components. Subsequently, a WLS filter is applied to the decomposed image to enhance clarity and reduce noise, resulting in an optimized output. In the classification stage, features are extracted from the enhanced images and utilized to train a hybrid model combining support vector machine (SVM) and convolutional neural network (CNN) architectures. This approach demonstrated robust performance in classifying dermoscopic tumor images, leveraging the complementary strengths of traditional machine learning and deep learning techniques.
Anand et al. [8] proposed a fusion model for skin lesion segmentation and classification. They employed a modified U-Net architecture to segment skin images, adjusting the feature map size within the U-Net structure. In the second phase of the fusion model, a CNN was utilized for multi-class classification of segmented images, enabling the categorization of seven different skin diseases.
Song et al. [9] introduced a feature fusion strategy for skin lesion segmentation. Their approach incorporated a U-Net-based segmentation framework, where the input image was first processed by SSD300 to generate feature maps. These maps were then fed into a model called det2seg, which refined the segmentation. The resulting segmented images were classified using another model, seg2cls, which employed ResNet and DenseNet as classifiers.
Wang et al. [10] developed SSD-KD, a lightweight framework for skin lesion classification based on a student–teacher model. This method enhances the student model’s performance by transferring different types of knowledge from the teacher model. By replacing conventional single-relational modeling blocks with dual-relational blocks, SSD-KD enables the student model to better capture relational information from the teacher model.
He et al. [11] proposed a CNN-based method for simultaneous segmentation and classification of skin lesions. Their approach integrated a single model capable of handling multiple learning tasks, facilitating useful information sharing between segmentation and classification. The model consisted of an encoder and three separate branches dedicated to skin lesion classification, melanoma classification, and seborrheic keratosis classification.
Zhang et al. [12] introduced ACCPG-Net, a deep learning architecture for skin lesion segmentation. The framework comprised a feature extraction module and a segmentation module. The feature extraction phase was based on the ResNet-50 architecture, while the segmentation phase employed an adaptive channel-context-aware pyramid attention mechanism. The adaptive channel-context mechanism was designed to enhance the distinct characteristics of each channel, whereas the pyramid attention mechanism helped differentiate features across multiple scales. Additionally, a global feature fusion module was proposed to integrate various segmentation information, enriching the low-level feature maps in the decoder.
Qiu et al. [13] proposed a segmentation architecture consisting of two decoders, referred to as the gated fusion attention network. This architecture integrates multiple contextual features through the context-guided feature decoder, which is composed of a context feature extraction module (CEM) and a gated fusion decoder (GFD). The CEM is responsible for extracting contextual features, while the GFD filters out irrelevant information and integrates contextual feature representations.
Karri et al. [14] introduced a two-stage transfer learning (TL) approach to accurately segment skin lesions. In the first stage, a network trained on large-scale datasets extracts cross-domain features. In the second stage, this pre-trained network is fine-tuned to adapt to the target dataset, enhancing segmentation accuracy. The effectiveness of this approach largely depends on the dataset used. Additionally, the study introduced nSknRSUNet, which incorporates a receptive field block and a spatial edge attention fusion module to improve segmentation performance.
Tembhurne et al. [15] proposed a hybrid approach combining machine learning and deep learning techniques. In this framework, deep learning models are used for image preprocessing, followed by both manual and automated feature extraction. Manual feature extraction is performed using contourlet transform and local binary pattern histogram methods, whereas automatic feature extraction is based on transfer learning techniques. The final classification is achieved by aggregating the predictions from deep learning and machine learning models using a voting mechanism.
Gilani et al. [16] presented a novel architecture for skin lesion classification, which is trained using gradient descent. Initially, the Poisson distribution of the input image is computed to extract sharp edges. These extracted features are then processed through convolutional layers, which are based on integrate-and-fire neuron models. For classification, the VGG-13 model is employed to differentiate between melanoma and non-melanoma skin lesions.
Golnoori et al. [17] proposed an optimization-based approach for skin lesion classification. Their methodology consists of two phases. In the first phase, an optimally structured neural network is trained and evaluated for skin lesion classification performance. In the second phase, well-established pre-trained networks are assessed for their classification capabilities. The optimal architecture is determined using genetic algorithms, particle swarm optimization, and differential evolution. Additionally, classification accuracy was achieved by combining DenseNet and ResNet-50 features on the ISIC2017 dataset, and DenseNet and Inception features on the ISIC2018 dataset.
Shukla et al. [18] proposed a hybrid CNN model incorporating transfer learning for skin cancer classification. The model consists of two main components: feature extraction using multiple pre-trained CNN models and classification using a random forest classifier. The study utilized two different datasets, where images were preprocessed through resizing and color space transformation before being fed into the model.
Natha et al. [19] proposed an ensemble model optimized with the maximum voting method for skin cancer classification. The study utilized the HAM10000 and ISIC2018 datasets, employing random forest, gradient boosting, adaBoost, catBoost, and extra trees models for multi-class classification. Genetic algorithms were applied to extract optimal feature vectors from images, which were then fed into the ensemble models.
Wang et al. [20] introduced a transfer learning and contrastive learning paradigm for skin cancer classification using Raman spectroscopy (RS) data. The proposed approach manages the inherent noise in the data through contrastive learning while overcoming the limitation of small sample sizes via transfer learning. Additionally, a self-supervised learning strategy based on SimCLR [21] was employed to extract features from RS data, which were subsequently utilized in deep learning models for classification.
Pandurangan et al. [22] proposed a segmentation and classification model for skin cancer diagnosis. The RPO-SegNet, designed for skin lesion segmentation, integrates recurrent prototypical networks [23] and an object segmentation network [24]. The classification task was performed using a fuzzy-based Shepard convolutional maxout network, a hybrid deep learning model that combines the Shepard convolutional neural network [25] and deep maxout network [26]. The study was evaluated on the ISIC2019 dataset.
Kumar et al. [27] proposed a novel activation function called the adaptable-shifted-fractional-rectified-linear-unit (RL-ASFReLU) for skin cancer diagnosis. The study aimed to enhance classification performance by integrating this activation function into CNN architectures such as EfficientNet-B3. Using the ISIC2018 dataset, RL-ASFReLU demonstrated faster convergence, improved generalization, and reduced computational cost compared to conventional activation functions.
Yang et al. [28] developed a novel convolutional neural network, SLP-Net, for skin lesion image segmentation. SLP-Net consists of three primary modules: Spiking neural P-type (SNP-type) lightweight pyramid, SNP-type feature adaptive fusion module, and SNP-type dense downsampling module. The network incorporates a new neuron structure, MCConvSNP, which combines SNP-type convolution with depth-wise convolution. These modules are designed for feature extraction, multi-scale information fusion, and fine-grained detail preservation. The study was evaluated on the ISIC2018, PH2, and ISIC2016 datasets.
The reviewed literature demonstrates diverse approaches to skin lesion analysis, ranging from classification [7,10,16,17,18,19,20] to segmentation [8,9,11,12,13,28] and hybrid methods [14,15,22,27]. However, a common challenge across these works is the complexity of accurately delineating lesion boundaries, particularly in images with low contrast, varying resolutions, and limited dataset availability—factors widely acknowledged in the dermoscopic image analysis domain.
A summary of the relevant studies is provided in Table 1, where the “result” column displays the accuracy metrics reported in each investigation. The primary challenges associated with the methods proposed by researchers for the classification and segmentation of skin lesions are as follows:
  • Difficulty in accurately distinguishing between different types of skin lesions.
  • While high-resolution images yield better performance, a significant decline in accuracy is observed for low-resolution images. Additionally, inconsistencies in image quality and resolution across various datasets further complicate classification and segmentation tasks.
  • The limited availability of clinical information in datasets restricts the development of more robust computer-aided diagnostic models.

1.2. Motivation and Contribution

Automated and accurate segmentation and classification of skin lesions play a crucial role in the early diagnosis of skin cancer. However, classification tasks have attracted more research attention, partly due to the availability of image-level annotations, while segmentation remains more challenging due to the need for pixel-level annotations, low-contrast images, and blurred lesion boundaries. These challenges highlight the need for improved segmentation approaches, which serve as the motivation for this study.
Furthermore, the high cost and time-consuming nature of obtaining expert-level pixel-wise annotations for medical images leads to a significant label scarcity problem. This limitation has stimulated extensive research into non-fully supervised deep learning paradigms—such as semi-supervised, weakly supervised, and unsupervised methods—that aim to reduce dependence on large-scale, fully annotated datasets [29]. While we acknowledge the importance of these approaches in addressing data limitations, this work adopts a fully supervised framework and focuses on architectural innovations and loss function optimization to enhance segmentation accuracy. We believe that improving the core architecture provides complementary benefits to data-efficiency methods. Moreover, the proposed method can serve as a strong backbone for integration with non-fully supervised paradigms in future work. For instance, incorporating our architecture into semi- or weakly supervised frameworks could further improve label efficiency and generalization in scenarios with limited annotations.
Building upon these considerations, in this paper, we propose a novel attention-based U-Net model to address the architectural challenges associated with skin lesion segmentation within a fully supervised setting. The proposed model is evaluated on different skin lesion datasets, ensuring its analysis across varying resolutions and lesion types. Furthermore, an in-depth examination of different loss functions commonly used in segmentation tasks is conducted to assess their impact on model performance.
The primary contributions of this study aim to address the following research questions:
  • Are the datasets balanced? If not, how does this imbalance affect performance?
  • Which loss function is most suitable for skin lesion segmentation?
  • To what extent do attention mechanisms enhance segmentation performance?
  • How does the performance of deep learning models vary across different epochs?
The key contributions of this paper are as follows:
  • The impact of dataset imbalances and the generalizability of the proposed model across different data distributions were analyzed using two publicly available datasets.
  • The effect of various loss functions on model performance was evaluated through a comparative analysis of four different loss functions.
  • A reverse-attention-based U-Net model was introduced for skin lesion segmentation, offering a novel approach to improving segmentation accuracy.
The remainder of this study is organized as follows: Section 2 describes the proposed BA-RA-UNet model, detailing the BA-RA module and the employed loss functions. Section 3 presents the experimental studies, including dataset descriptions, evaluation metrics, and implementation details. Finally, Section 4 concludes the study, highlighting key findings, limitations, and directions for future work.

2. Proposed Method

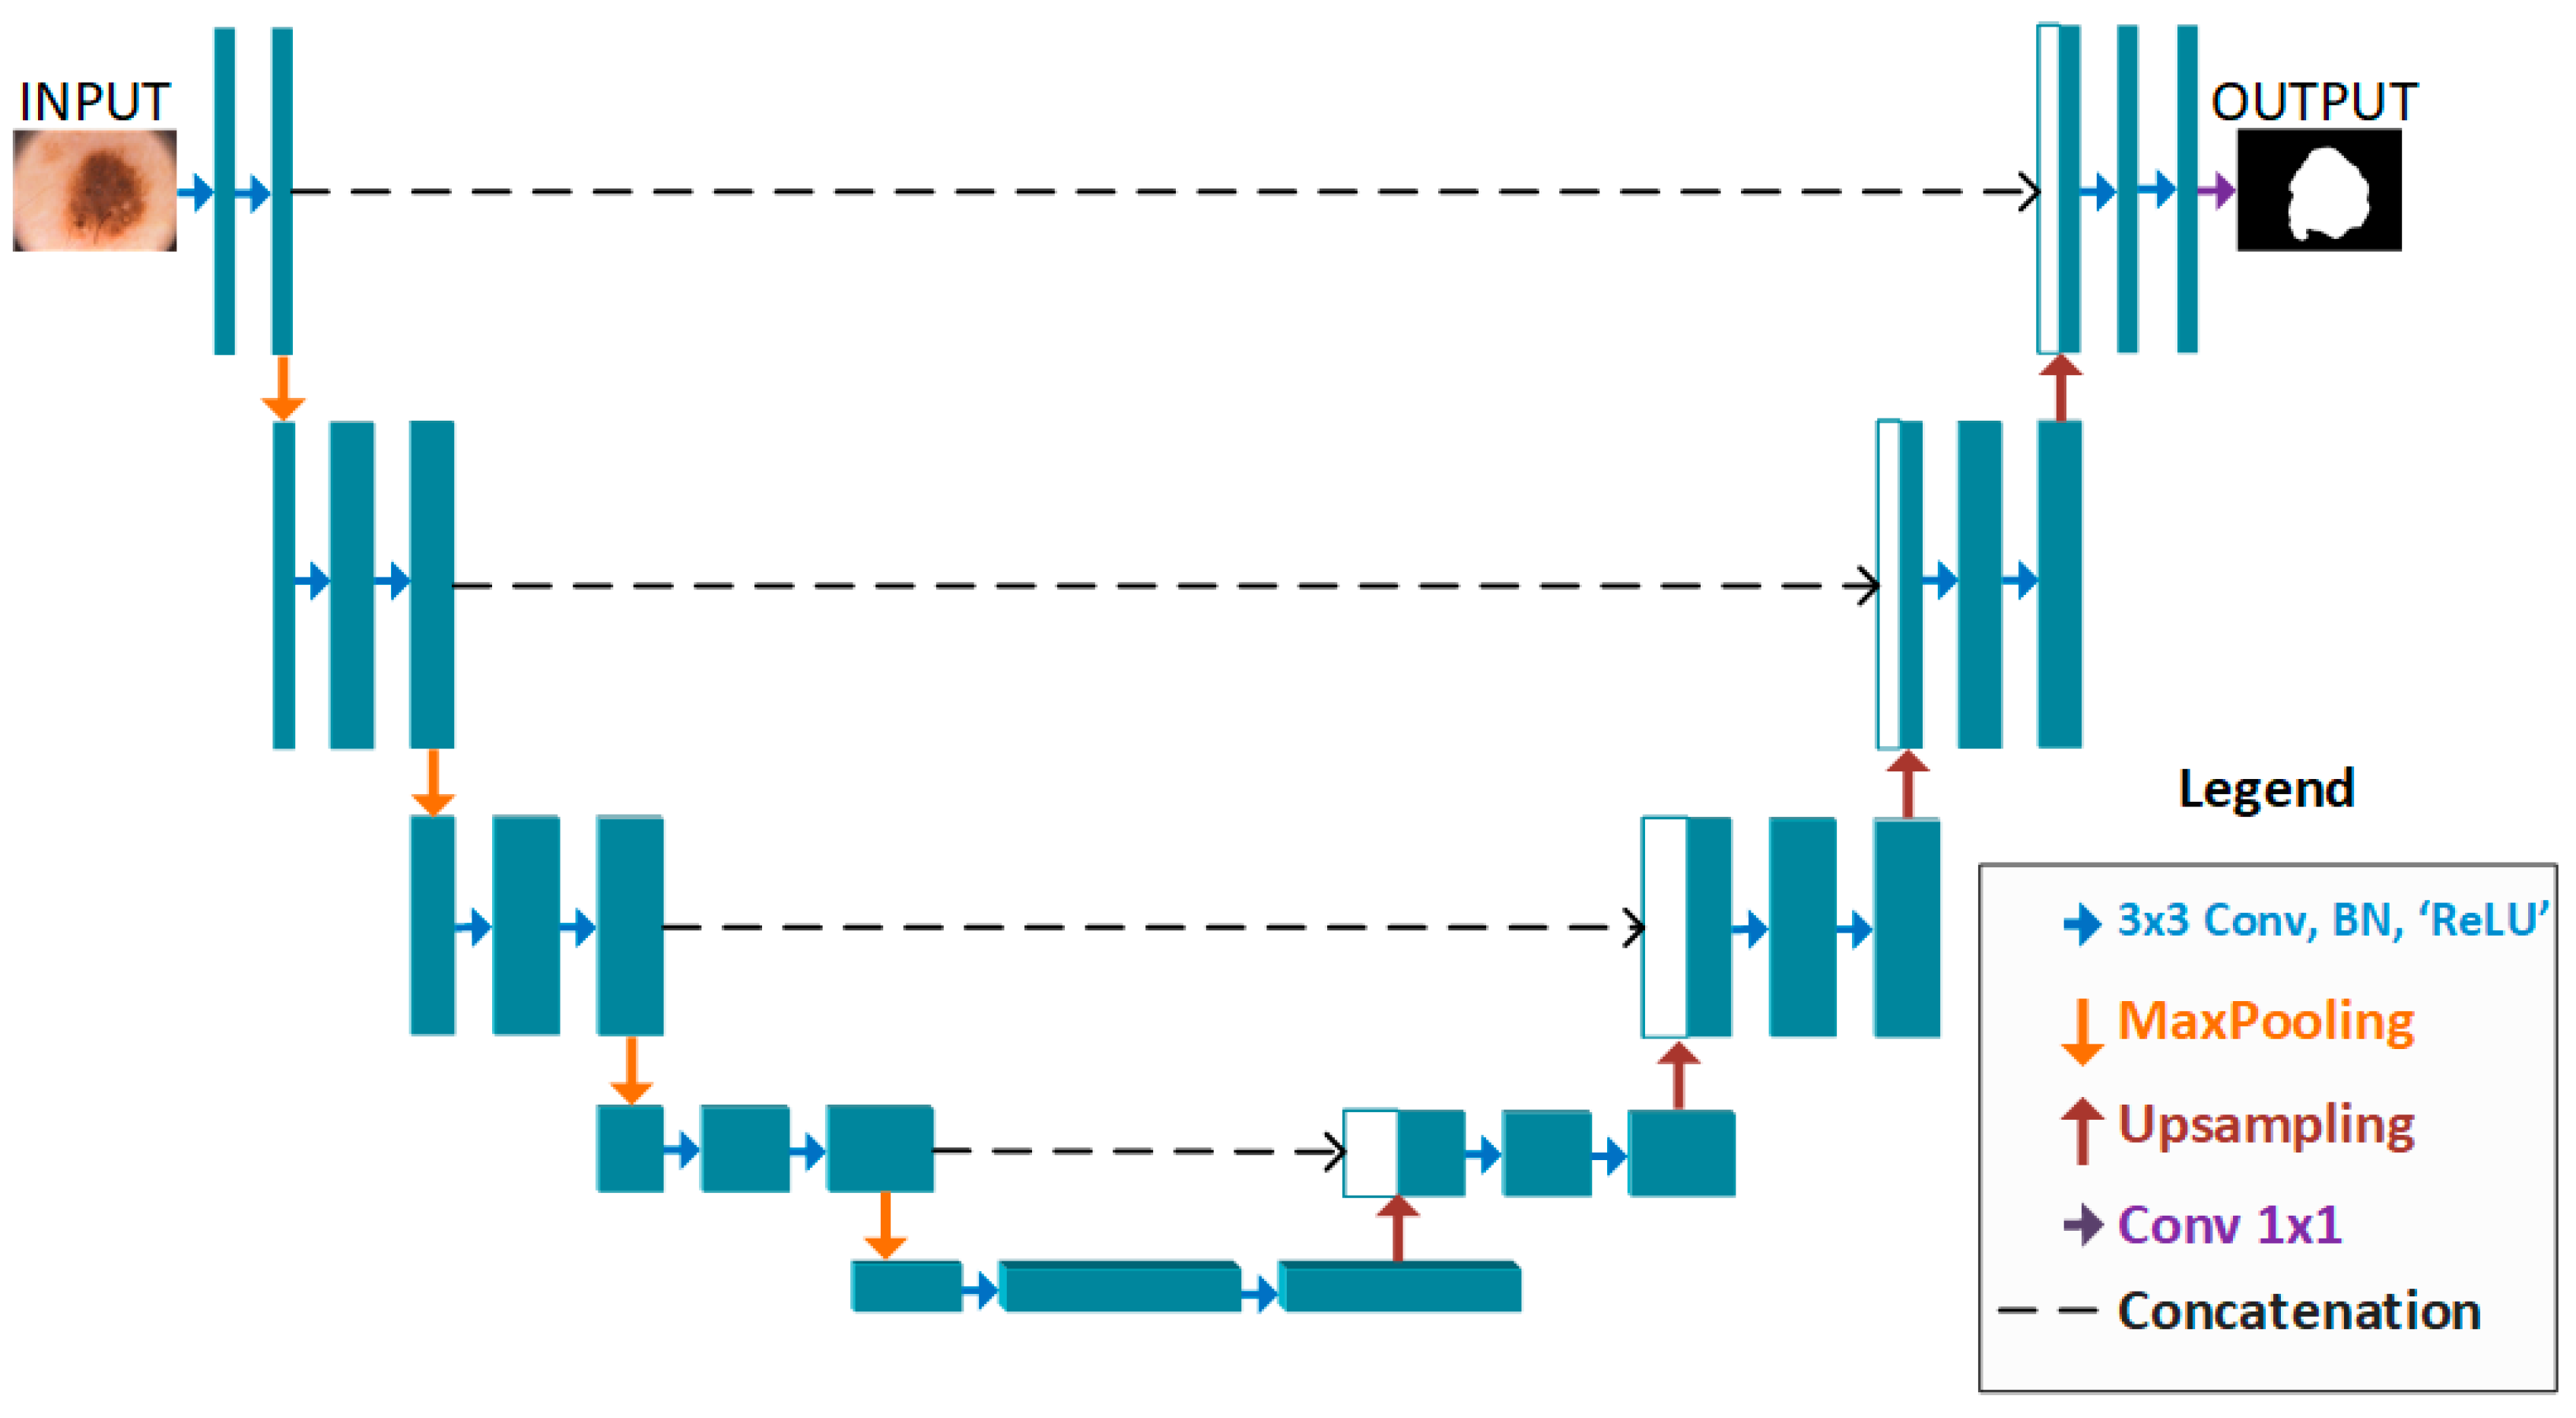
Semantic segmentation of skin images involves using 8-bit, three-channel dermoscopic images along with corresponding lesion region masks to ensure spatial accuracy. Ground truth (GT) images are binary, where lesion pixels are represented by 1, and background pixels by 0. U-Net [30] has become a widely used architecture in this field, demonstrating its effectiveness in segmentation tasks. The U-Net architecture consists of an encoder, a decoder, and skip connections that bridge these two components. The encoder is designed to efficiently extract meaningful features from the input image, while the decoder reconstructs the segmented binary output. Skip connections transfer information from the encoder to the decoder, preserving high-resolution details and enhancing semantic feature extraction. The encoder features are directly fed into the corresponding decoder layers to refine segmentation accuracy. Figure 2 illustrates the standard U-Net architecture.
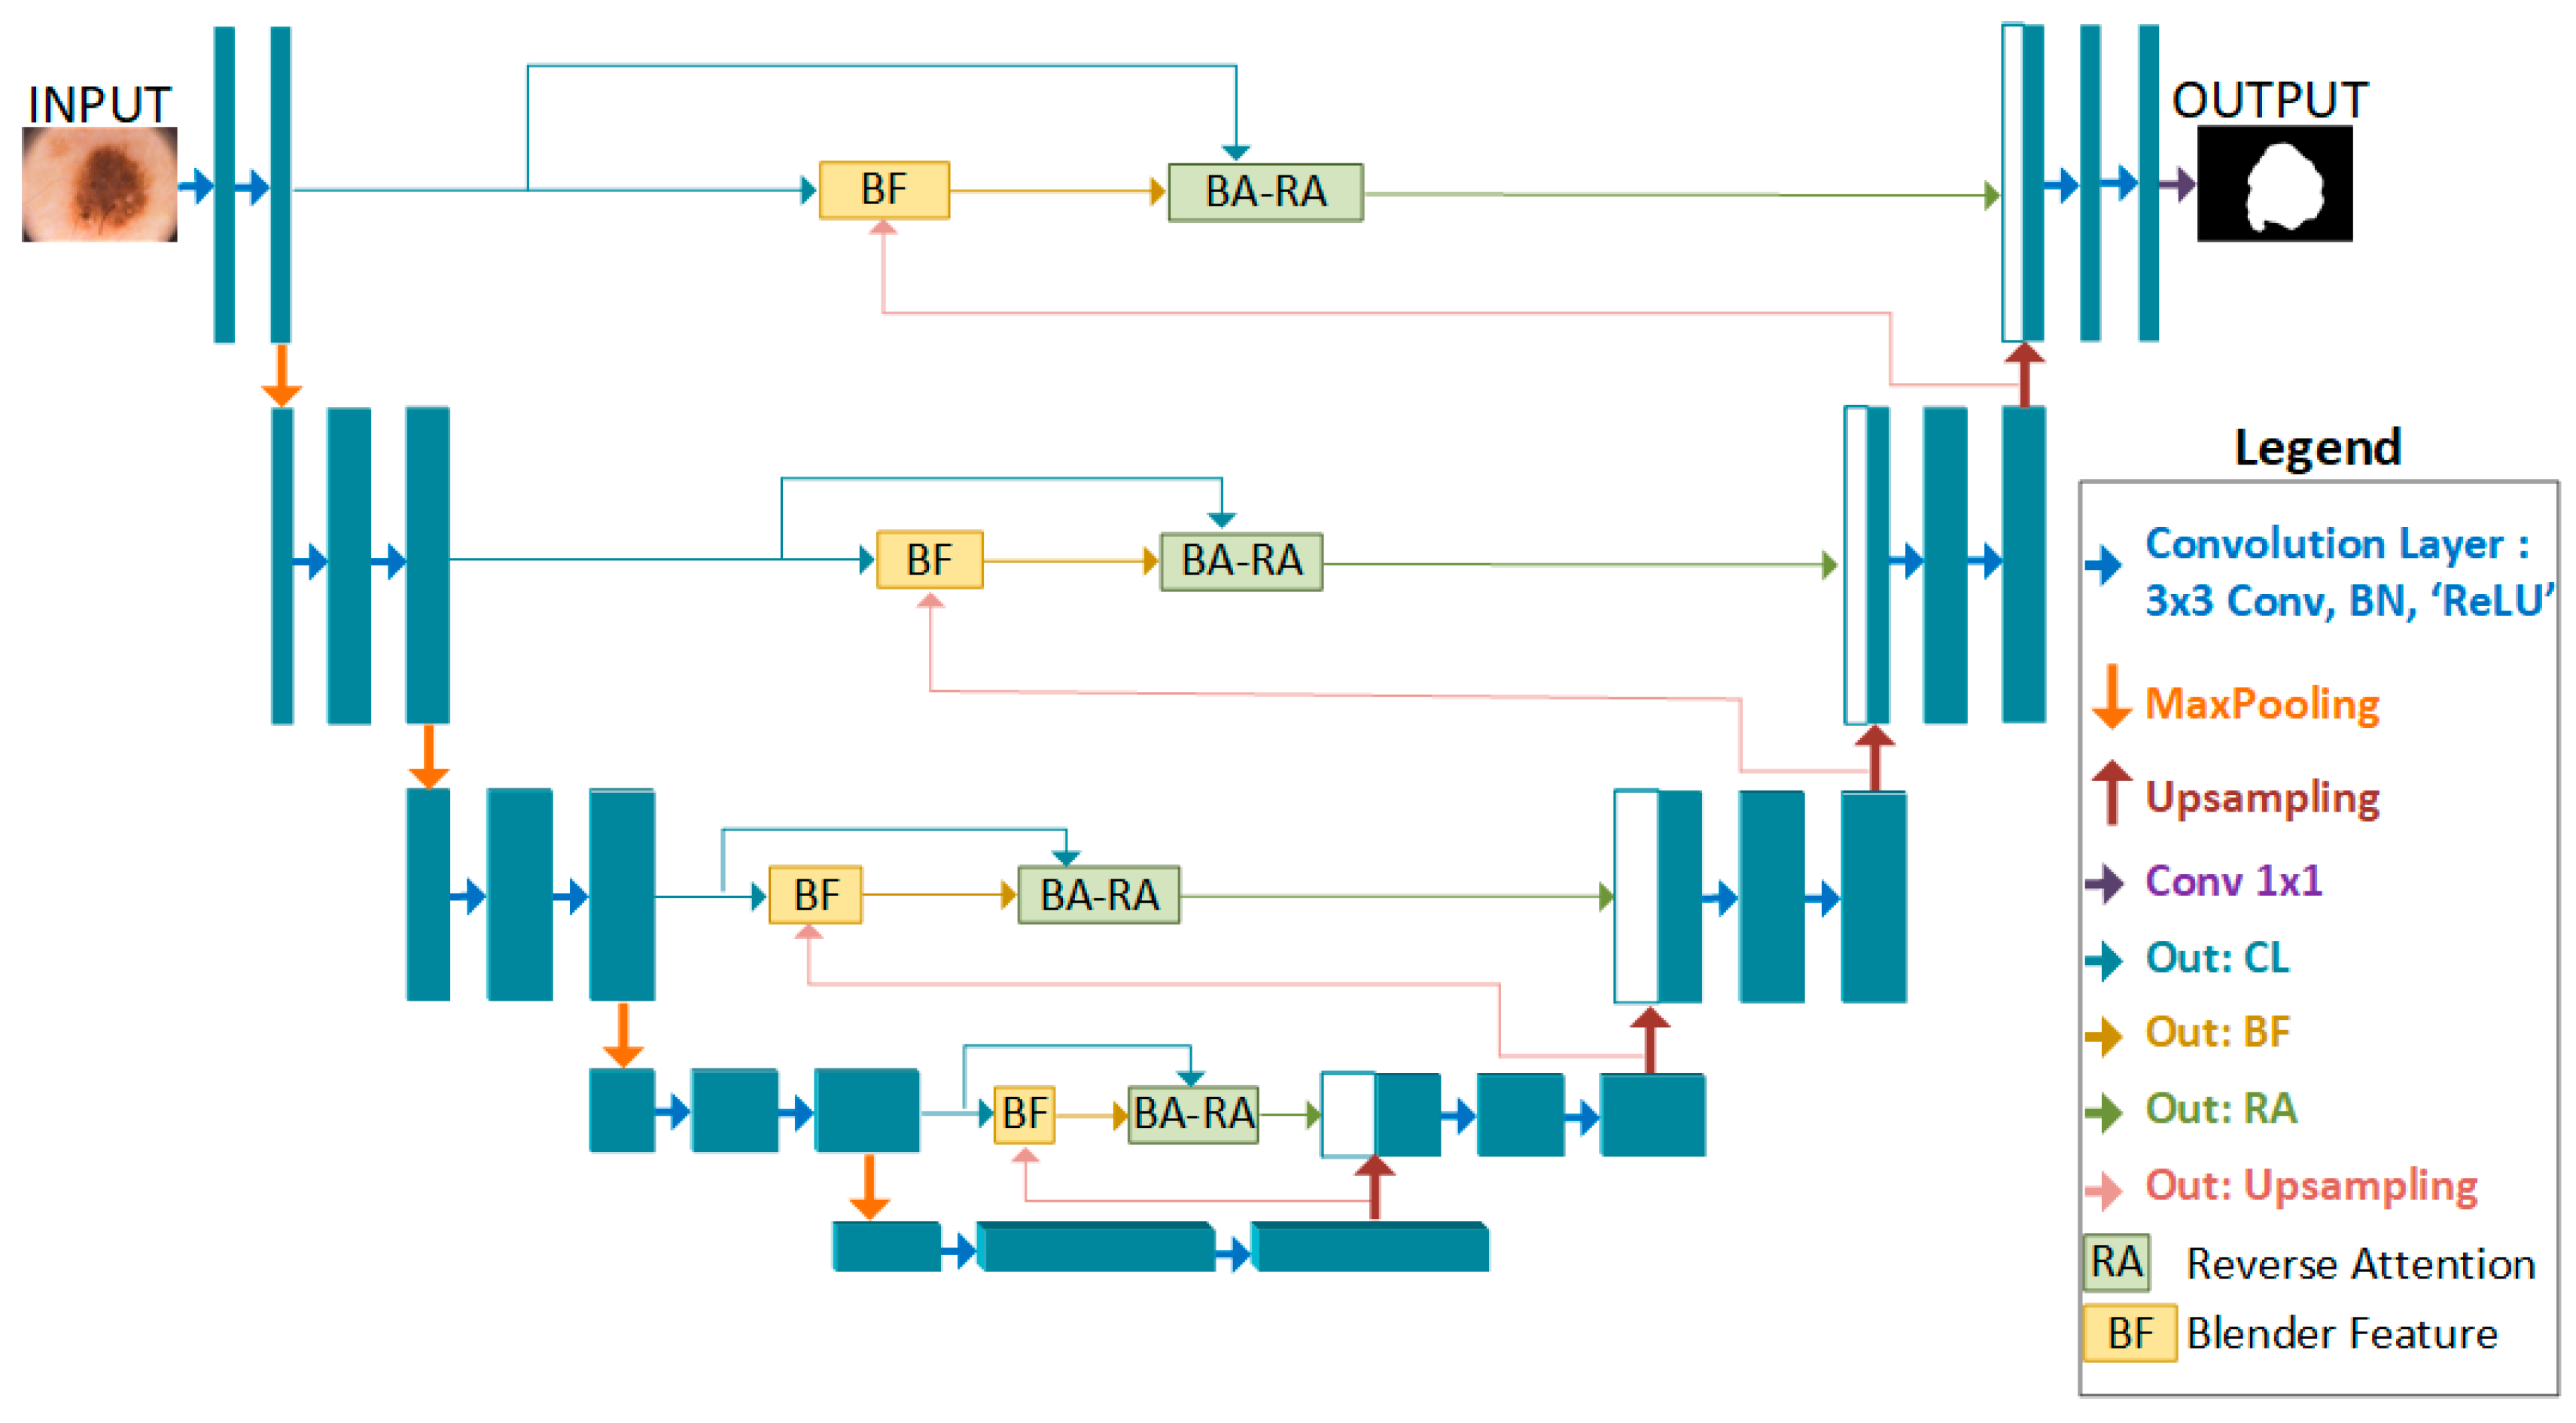
Although U-Net has demonstrated exceptional performance in segmentation tasks, it has certain limitations. Several studies [31,32] have aimed to address these constraints. In this study, an attention mechanism has been integrated into the skip connections of the U-Net architecture to enhance segmentation performance. The proposed attention mechanism increases the focus on semantic information within the skip connections, assigning higher weights to important features, thereby preserving fine details in dermatological images. This attention mechanism, embedded within the skip connections, is referred to as BA-RA, and the modified U-Net architectural diagram is illustrated in Figure 3. In the architecture, each output from the encoder layer is blended with the corresponding decoder layer input (Blend Feature-BF) to mitigate dimensionality issues. Subsequently, the encoder output and the BF output from the corresponding layer are fed into the attention mechanism. This attention mechanism incorporates a modified version of the reverse attention (RA) approach used in [33]. The modification involves integrating a novel Boundary Attention (BA) module before the RA module, creating a cascaded BA-RA structure. Detailed descriptions of the BA and RA modules are provided under the “BA-RA Module” heading.

2.1. BA-RA Module

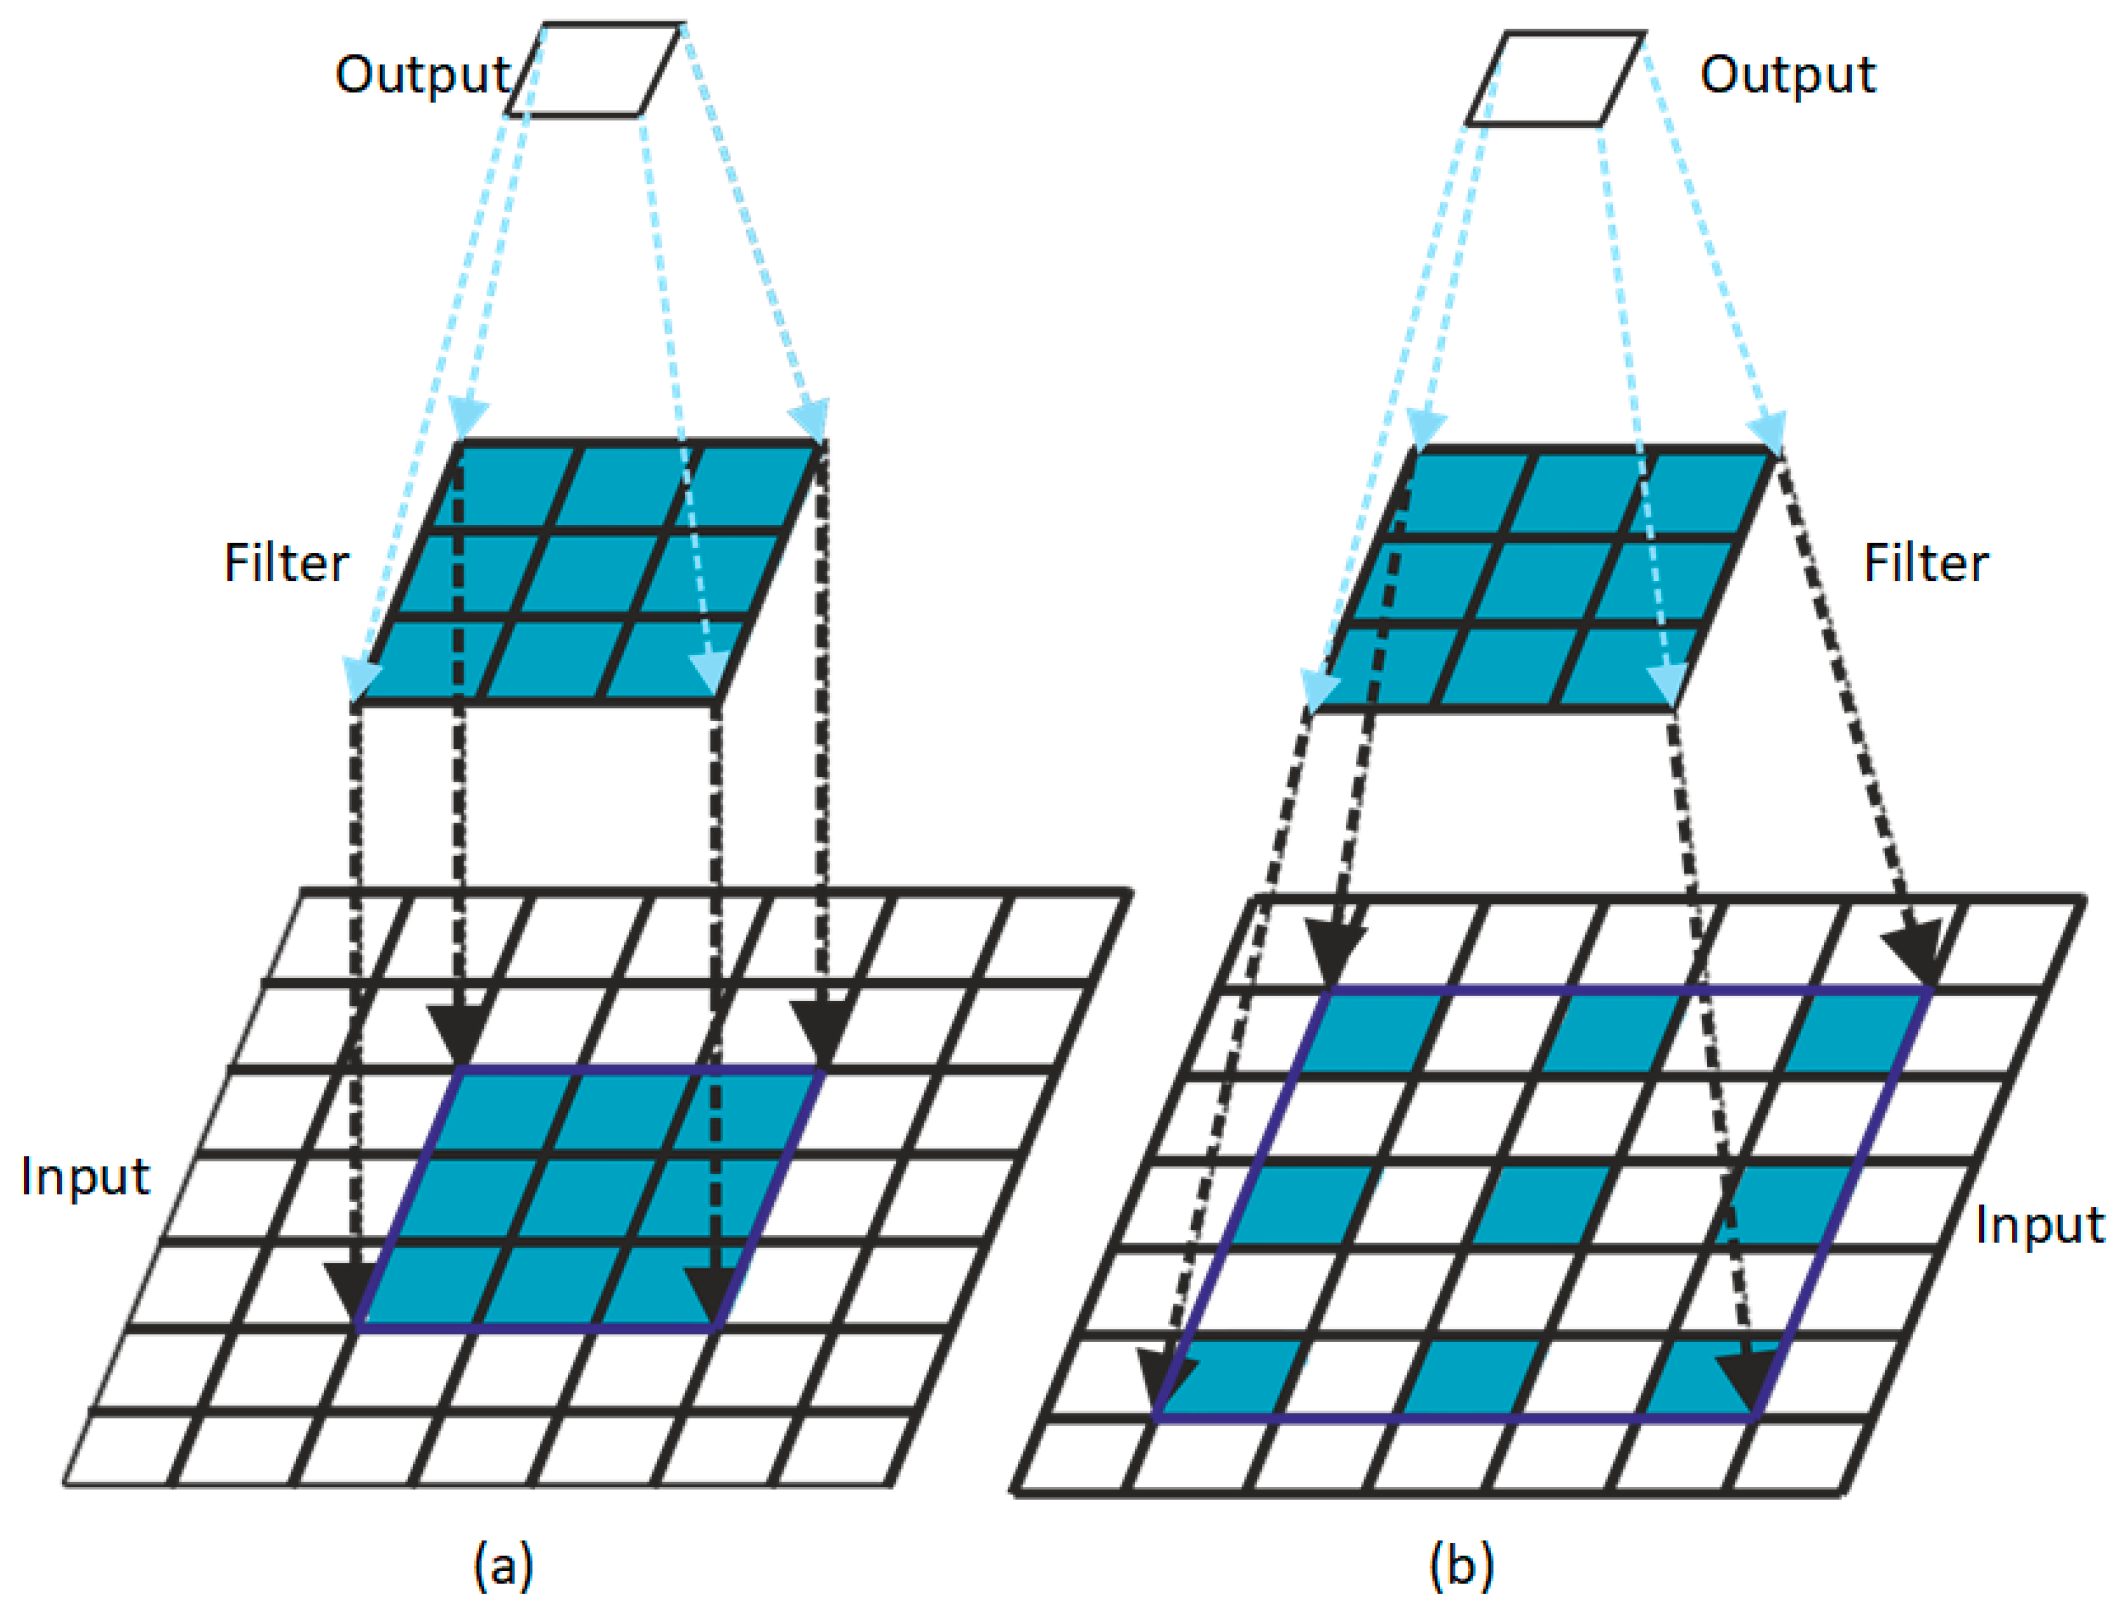
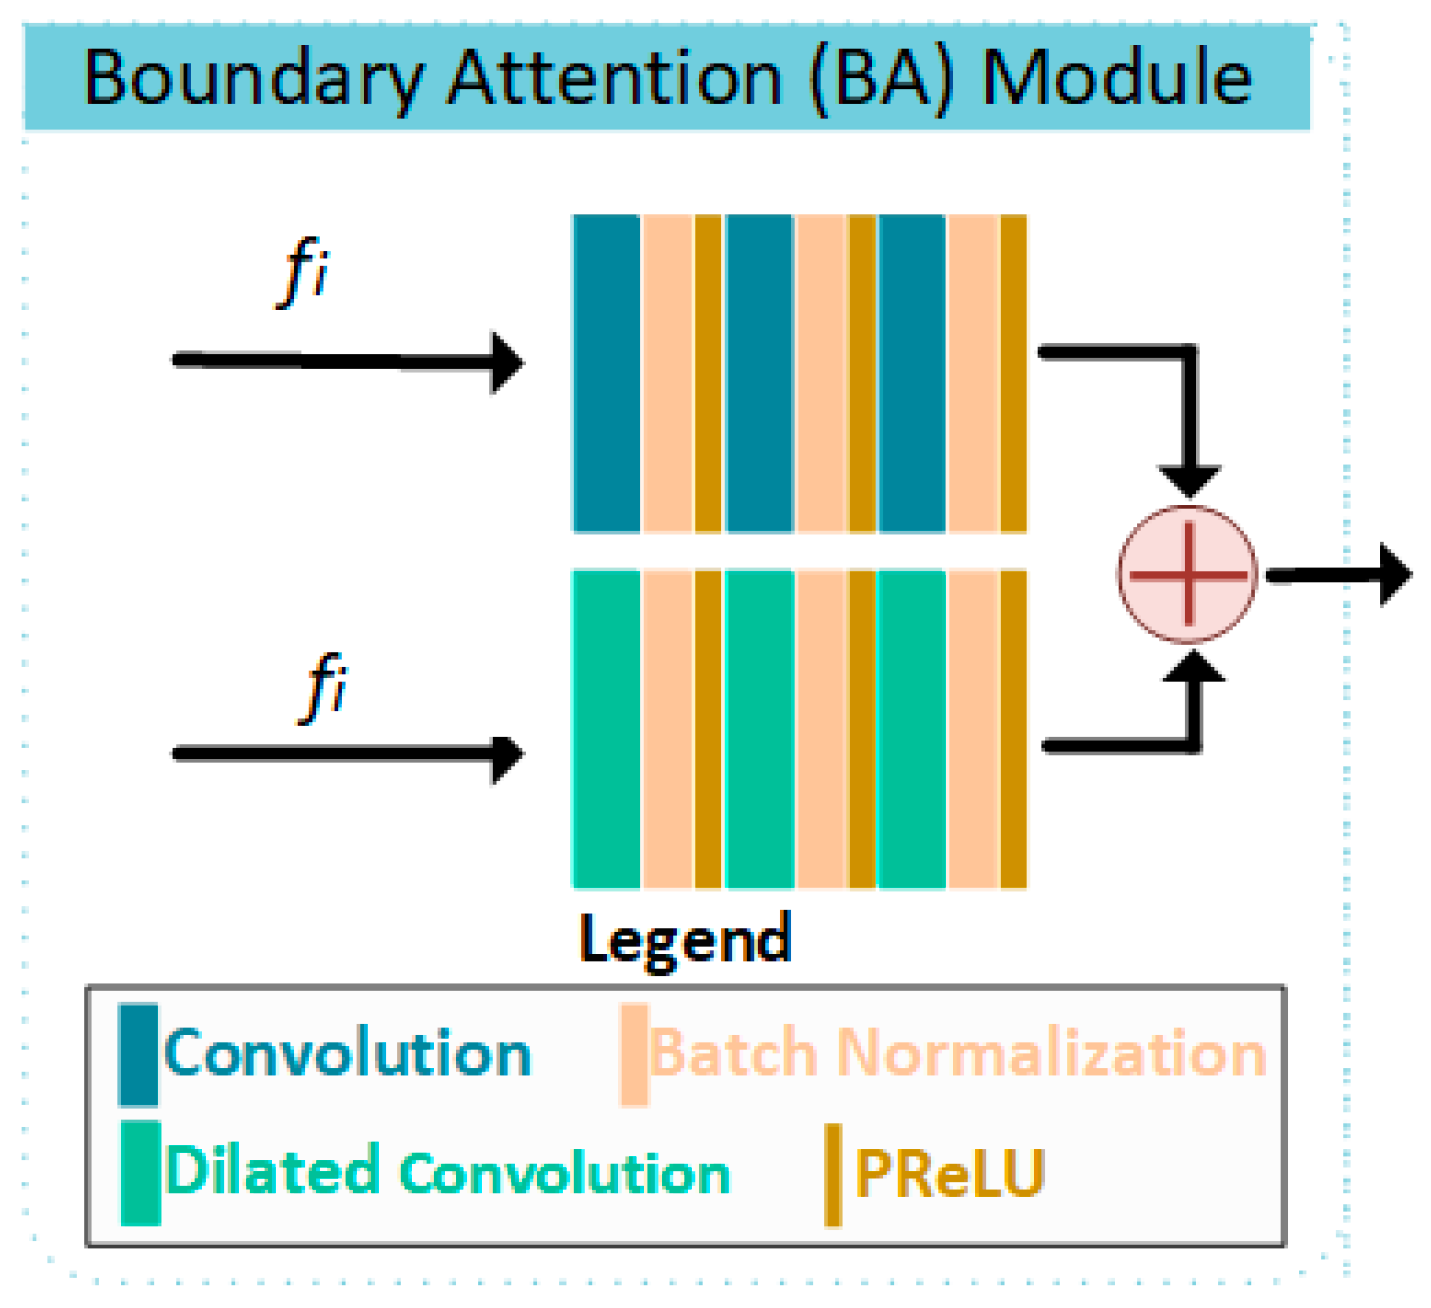
BA, facilitates the parallel processing of high-level input through conventional convolution and dilated convolution operations, thereby enhancing the precision of the RA module and improving lesion-background separation. This module consists of two parallel tasks. The first task involves repeating a sequence of conventional convolution layers, batch normalization, and PReLU activation function three times. The second task follows the same repetition pattern but replaces conventional convolution with dilated convolution. This design preserves semantic information while retaining fine details of the target object. The PReLU activation function provides flexibility for negative values and enhances resistance to the vanishing gradient problem, making it a preferred choice in this architecture due to its performance benefits. The conventional and dilated convolution structures are visually represented in Figure 4. The fundamental difference between these two approaches lies in the expanded receptive field of dilated convolution, enabling the model to capture a broader contextual understanding.
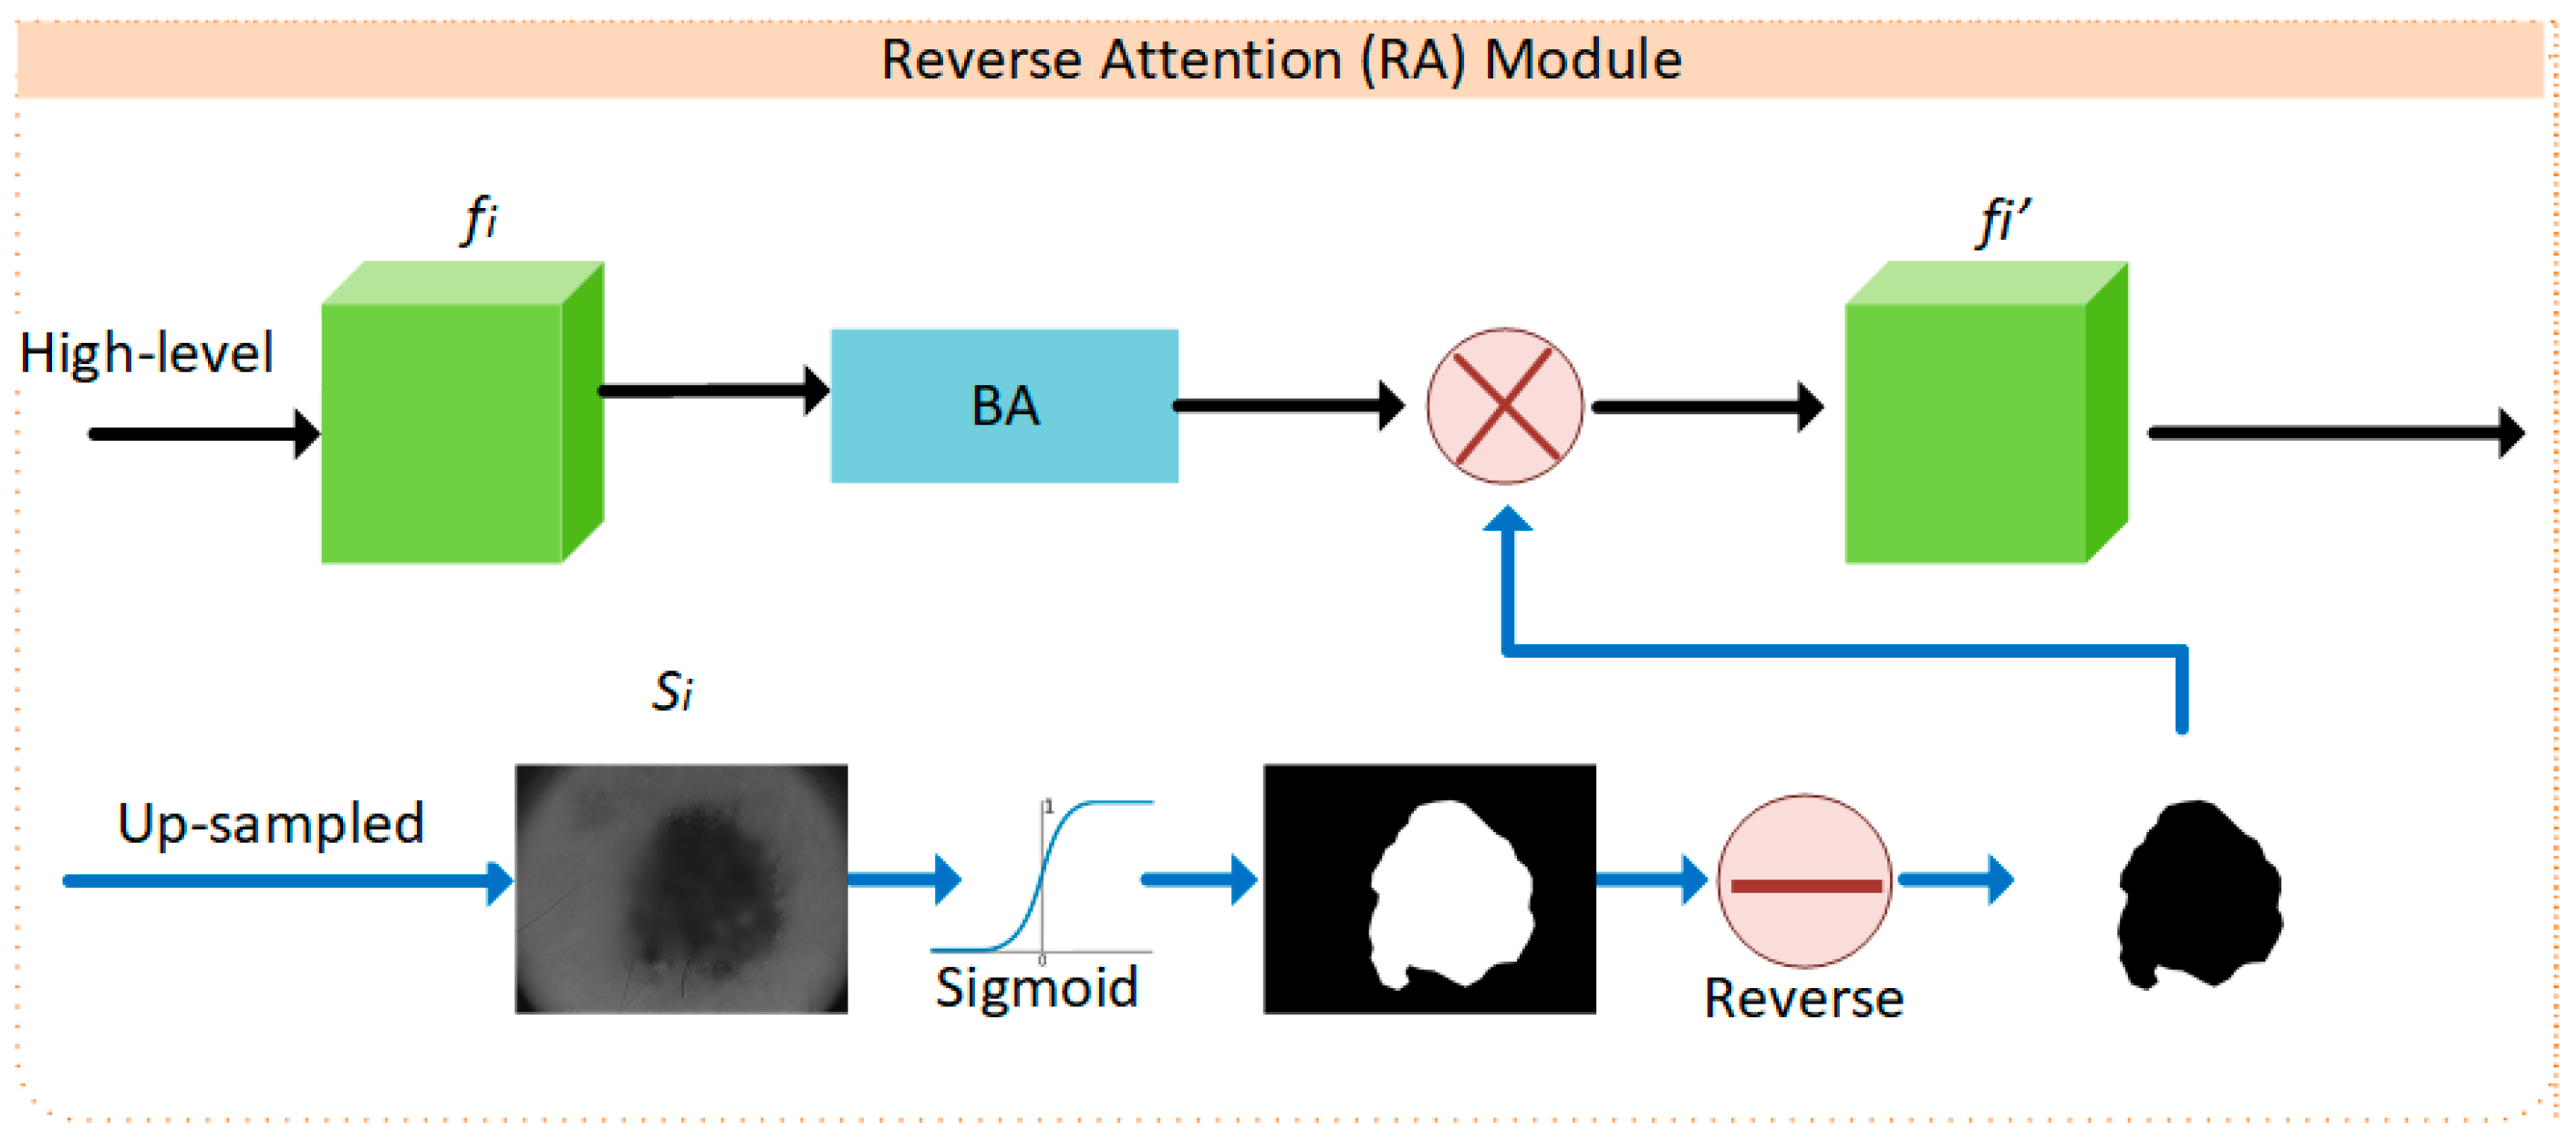
RA module processes both high-level features and downsampled representations by applying an activation function followed by an inversion operation, which is then multiplied with the output of the BA module. This mechanism enhances focus on salient regions in high-level inputs, where high-level features originate from the encoder layers of the U-Net architecture, while upsampled features represent outputs from the decoder layers. By assigning lower weights to background pixels and higher weights to lesion boundaries via the reverse attention mapping, the mechanism enhances the discrimination between lesion and non-lesion regions. The visual representation of this mechanism is illustrated in Figure 5 and Figure 6.
The mathematical formulation of the RA module, as visualized in Figure 5, is given in Equations (1) and (2).
S i = 1 σ ( S i )
f i = f i S
where f i R C × H × W is the high-level feature map from the encoder with C channels and spatial dimensions, H × W , S i R 1 × H × W is the up-sampled single-channel spatial attention map, σ · : R [ 0 , 1 ] is the sigmoid activation function, S i R 1 × H × W is the inverted attention map, denotes element-wise multiplication, and f i R C × H × W is the reverse attention output with attenuated background features. Equation (1) inverts the attention map to emphasize background regions, while Equation (2) applies this inverted map to suppress background in the high-level features.

2.2. Loss Function

Loss functions constitute a significant part of deep network architectures in segmentation tasks. Their role is to represent the deviation between the actual and predicted pixel values. Typically located in the output layer of deep network architectures, they are responsible for backpropagating the computed loss to the previous layers and updating the network parameters. At the beginning of network training, there is a substantial difference between the actual and predicted values. During this phase, the gradient descent method is employed to optimize the parameters.
The impact of loss functions on segmentation tasks has attracted considerable attention from researchers. Researchers working on segmentation tasks across various domains have categorized loss functions. For instance, Nguyen et al. [34], in a study on crack segmentation, examined loss functions under three categories: distribution balanced loss functions, performance balanced loss functions, and compound loss functions. Similarly, Xu et al. [35], in their study on road segmentation, classified loss functions into three categories: distribution-based loss functions, region-based loss functions, and compound loss functions. Ma et al. [36], in a study on medical image segmentation, categorized loss functions into four groups: distribution-based loss functions, region-based loss functions, boundary-based Loss, and compound loss functions. Inspired by these studies, this article investigates the performance of loss functions in the task of skin lesion segmentation under three categories. The first category is Distribution-based loss functions, where binary cross entropy (BCE) [37], the most commonly used loss function in binary segmentation tasks, is employed. The second category includes region-based loss functions, namely Dice loss [38] and Tversky loss [39]. The final category utilizes a compound loss function, which is a weighted combination of dice loss and BCE.
Equations (3)–(7) present the mathematical expressions for the BCE loss, Dice loss, Tversky loss, and the combined loss function, respectively.
L B C E = 1 N i = 1 N ( y i m a s k log y ^ i m a s k + ( 1 y i m a s k ) l o g ( 1 y ^ i m a s k ) )
where y i m a s k represents the binary ground truth pixel values, and y ^ i m a s k denotes the predicted pixel values generated by the model. The parameter N corresponds to the total number of pixels in the input image. The BCE loss function tends to prioritize large objects while underrepresenting smaller ones. This imbalance can lead to over-segmentation of large objects, thereby reducing segmentation quality for smaller lesions [40].
L D i c e = 1 D S C = 1 2 y y ^ y + y ^ + ϵ
where ϵ is added to prevent division by zero. The DSC measures the similarity between two data distributions, where y represents the ground truth mask and y ^ represents the predicted mask.
L T v e r s k y   = 1 T I P , G ; α , β   = 1 T P T P + α . F P + β . F N
where T I P , G ; α , β denotes the Tversky index, formulated as follows:
I P , G ; α , β   = P G P G + α P G + β G P
where PG represents the number of true positive (TP) pixels, P∖G represents the number of false positive (FP) pixels, and GP represents the number of false negative (FN) pixels. The parameters α and β control the weighting of FP and FN values. When emphasizing FN reduction, β is increased, whereas emphasizing FP reduction requires increasing α. The Tversky loss generalizes the Dice loss and is particularly effective for imbalanced datasets. In this study, detecting small skin lesions is a priority, leading to the selection of α > β. Specifically, α = 0.7 and β = 0.3 are chosen to focus more on FN reduction.
L C o m p o u n d = λ 1 L B C E + λ 2 L D i c e
In this formulation, λ 1 and λ 2 take values within the range (0, 1) while ensuring that their sum equals 1. That is, if λ 1 = 0.1 then λ 2 = 0.9 . The optimal values of λ 1 and λ 2 , corresponding to the highest experimental success, are selected for use in the loss function.

3. Experimental Studies

3.1. Datasets

Datasets play a crucial role in the development and training of deep learning models. In particular, dermatological datasets enhance model accuracy and robustness by exposing the models to various types of skin cancer. To ensure a diverse representation of skin cancer types, datasets containing images with hair, dark-colored images, light-colored images, and lesions with ambiguous shapes are required. To meet this need, the publicly available ISIC2018 dataset provided by the International Skin Imaging Collaboration (ISIC) [41] and the PH2 dataset [6], obtained from a dermatology service in Portugal, have been utilized.
The ISIC2018 dataset is a large-scale dermoscopic dataset. The images are organized into training, validation, and test folders, with 2594 original dermoscopic images in the training folder, 100 in the validation folder, and 1000 in the test folder. In addition, each image is accompanied by its corresponding ground truth segmentation mask. The images are provided in 8-bit RGB format with a .jpg extension and have resolutions ranging from 679 × 453 pixels to 6748 × 4499 pixels.
The PH2 dataset comprises dermoscopic images captured with 20× magnification and has dimensions of 768 × 560 pixels. The images are in 8-bit RGB format and consist of 80 common nevi, 80 atypical nevi, and 40 melanomas, totaling 200 images. These images are further divided into 160 non-melanoma and 140 melanoma cases [42]. Each image is stored individually and organized into three subfolders: the colored dermoscopic image, the segmented lesion region (i.e., the ground truth segmentation mask), and the region of interest (ROI). Additionally, a .txt file provides the class labels for the images, and an .xlsx file contains detailed labels of the structures present in the images. Since this study focuses on the segmentation task, only the original images and their corresponding ground truth segmentation masks were used.

3.2. Evaluation Metrics

To evaluate the performance of the image segmentation task, both the segmented image (SI) and the corresponding ground truth (GT) images are required. The evaluation is conducted using the mean intersection over union (mIoU) and dice similarity coefficient (DSC) performance metrics, which are formulated based on the spatial overlap of the pixels between these two images. Both mIoU and DSC measure the degree of spatial overlap between the GT and SI images, yielding values in the range of 0 to 1, where 0 indicates no spatial overlap and 1 represents complete overlap.
The calculation of these performance metrics is based on the confusion matrix, which comprises the parameters: TP, true negative (TN), FP, and FN. The TP parameter represents the pixels that are classified as lesion in both the SI and GT images. The FP parameter denotes the pixels marked as lesion in the SI that correspond to non-lesion regions in the GT. Conversely, the FN parameter represents the pixels that are labeled as lesion in the GT but are identified as non-lesion in the SI. The TN parameter corresponds to the pixels that indicate non-lesion areas in both the SI and GT images.
Using these parameters, the accuracy metric (Acc) is calculated as the ratio of correctly classified pixels to the total number of pixels. The recall metric (R) is defined as the ratio of the lesion area determined by the SI to the lesion area in the GT. The specificity parameter (Sp) indicates the successful differentiation of non-lesion areas by the SI. All of the aforementioned performance metrics are provided in Equations (8)–(12).
A c c = ( T P + T N ) / ( T P + T N + F P + F N )
R = T P / ( T P + F N )
S p = T N / ( T N + F P )
D S C = 1 k + 1 i = 0 k 2 T P 2 T P + F P + F N
m I o U = 1 k + 1 i = 0 k T P T P + F P + F N
In addition, the number of parameters (Params) and computational complexity (GFLOPS) of the model were calculated to analyze its efficiency.

3.3. Implementation Details

The implementation of the method was carried out using TensorFlow. For the training and evaluation of the model, all dataset images were resized to 256 × 256 pixels. Similarly, the corresponding GT images were also resized to 256 × 256 pixels. Experiments were conducted over 20, 40, 60, 80, and 100 epochs, and the impact of the four loss functions (BCE Loss, Dice Loss, Tversky Loss, and Compound Loss) on performance was examined at each epoch. Through these experiments, the model’s success with different loss functions was analyzed. In Figure 7, the proposed model utilized the LCompound function for both the PH2 and ISIC2018 datasets, and the IoU and DSC results obtained for different values of λ 2 are presented. According to these results, the U-Net architecture modified with the BA-RA module achieved the highest IoU and DSC values on the PH2 dataset at λ 2 = 0.5, while this value was 0.7 for the ISIC2018 dataset.
After completing all experiments, training and testing procedures were performed on two different datasets using the loss function that delivered the best performance. For both datasets, an 80-20 split was employed, where 80% of the data was allocated for training and 20% for testing. During training, 20% of the training set was further reserved for validation purposes. This data partitioning strategy allowed for a detailed evaluation of the model’s generalization capability across different datasets and its performance during the testing phase.
Throughout the training process, an NVIDIA RTX A4000 GPU was used, and the Adam optimization algorithm with an initial learning rate of 10−4 was preferred. Adam dynamically adjusts the learning rate during gradient descent, enabling faster convergence and more stable optimization [43]. Training was conducted with a batch size of 8, which enhances memory efficiency while ensuring balanced computations in each iteration. The computer used for the experiments is equipped with an i9 2.40 GHz processor and 16 GB of VRAM.

4. Quantitative Results

4.1. Comparison with Loss Functions

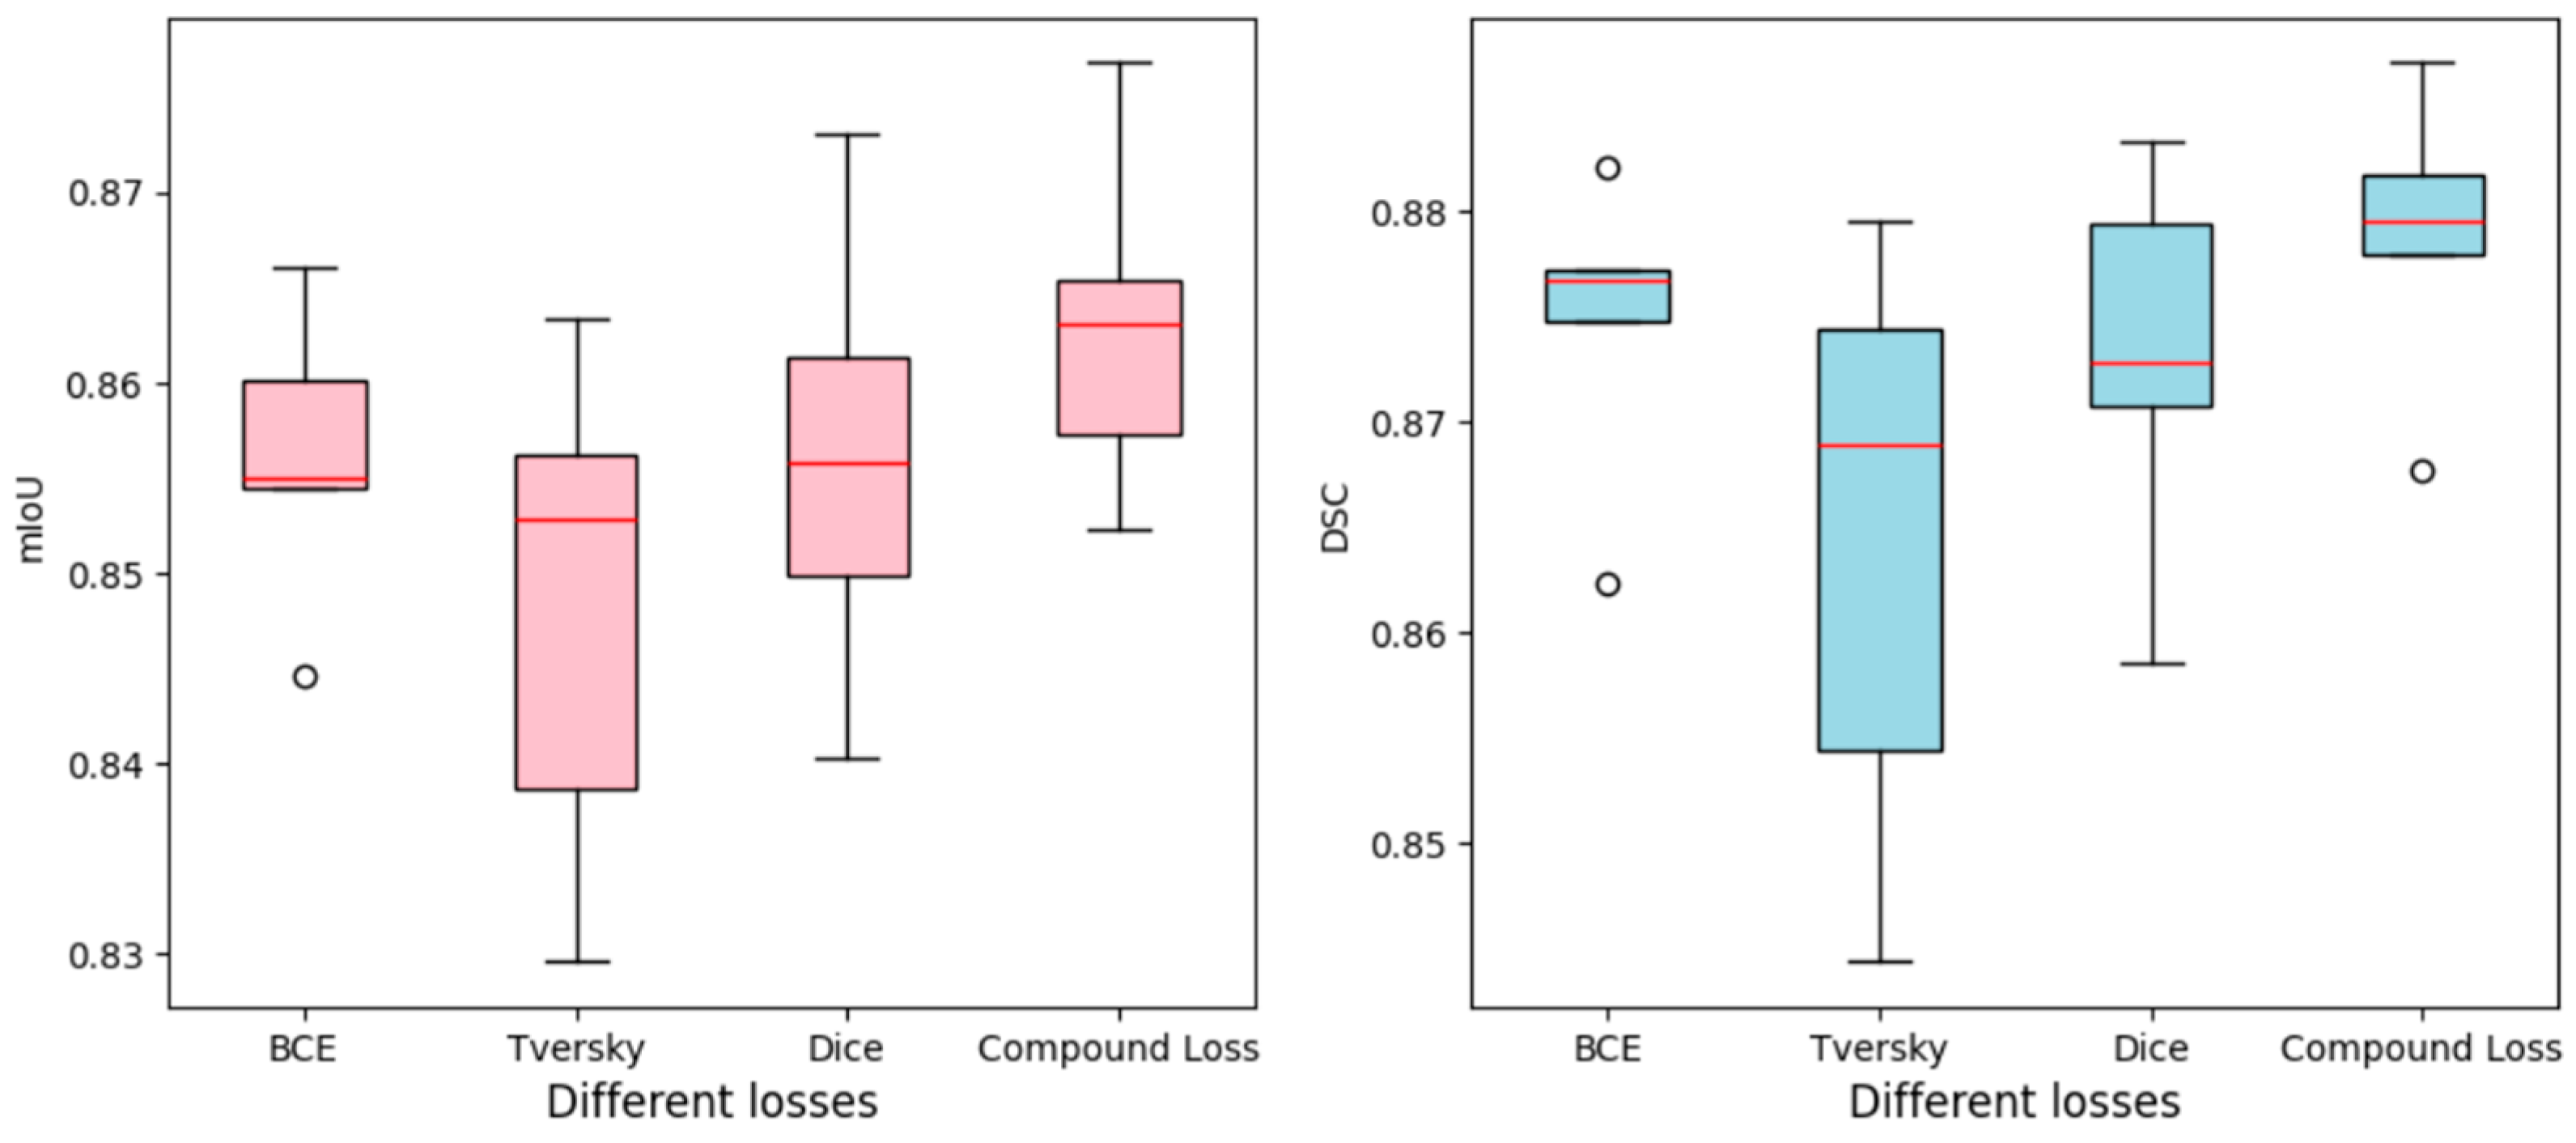
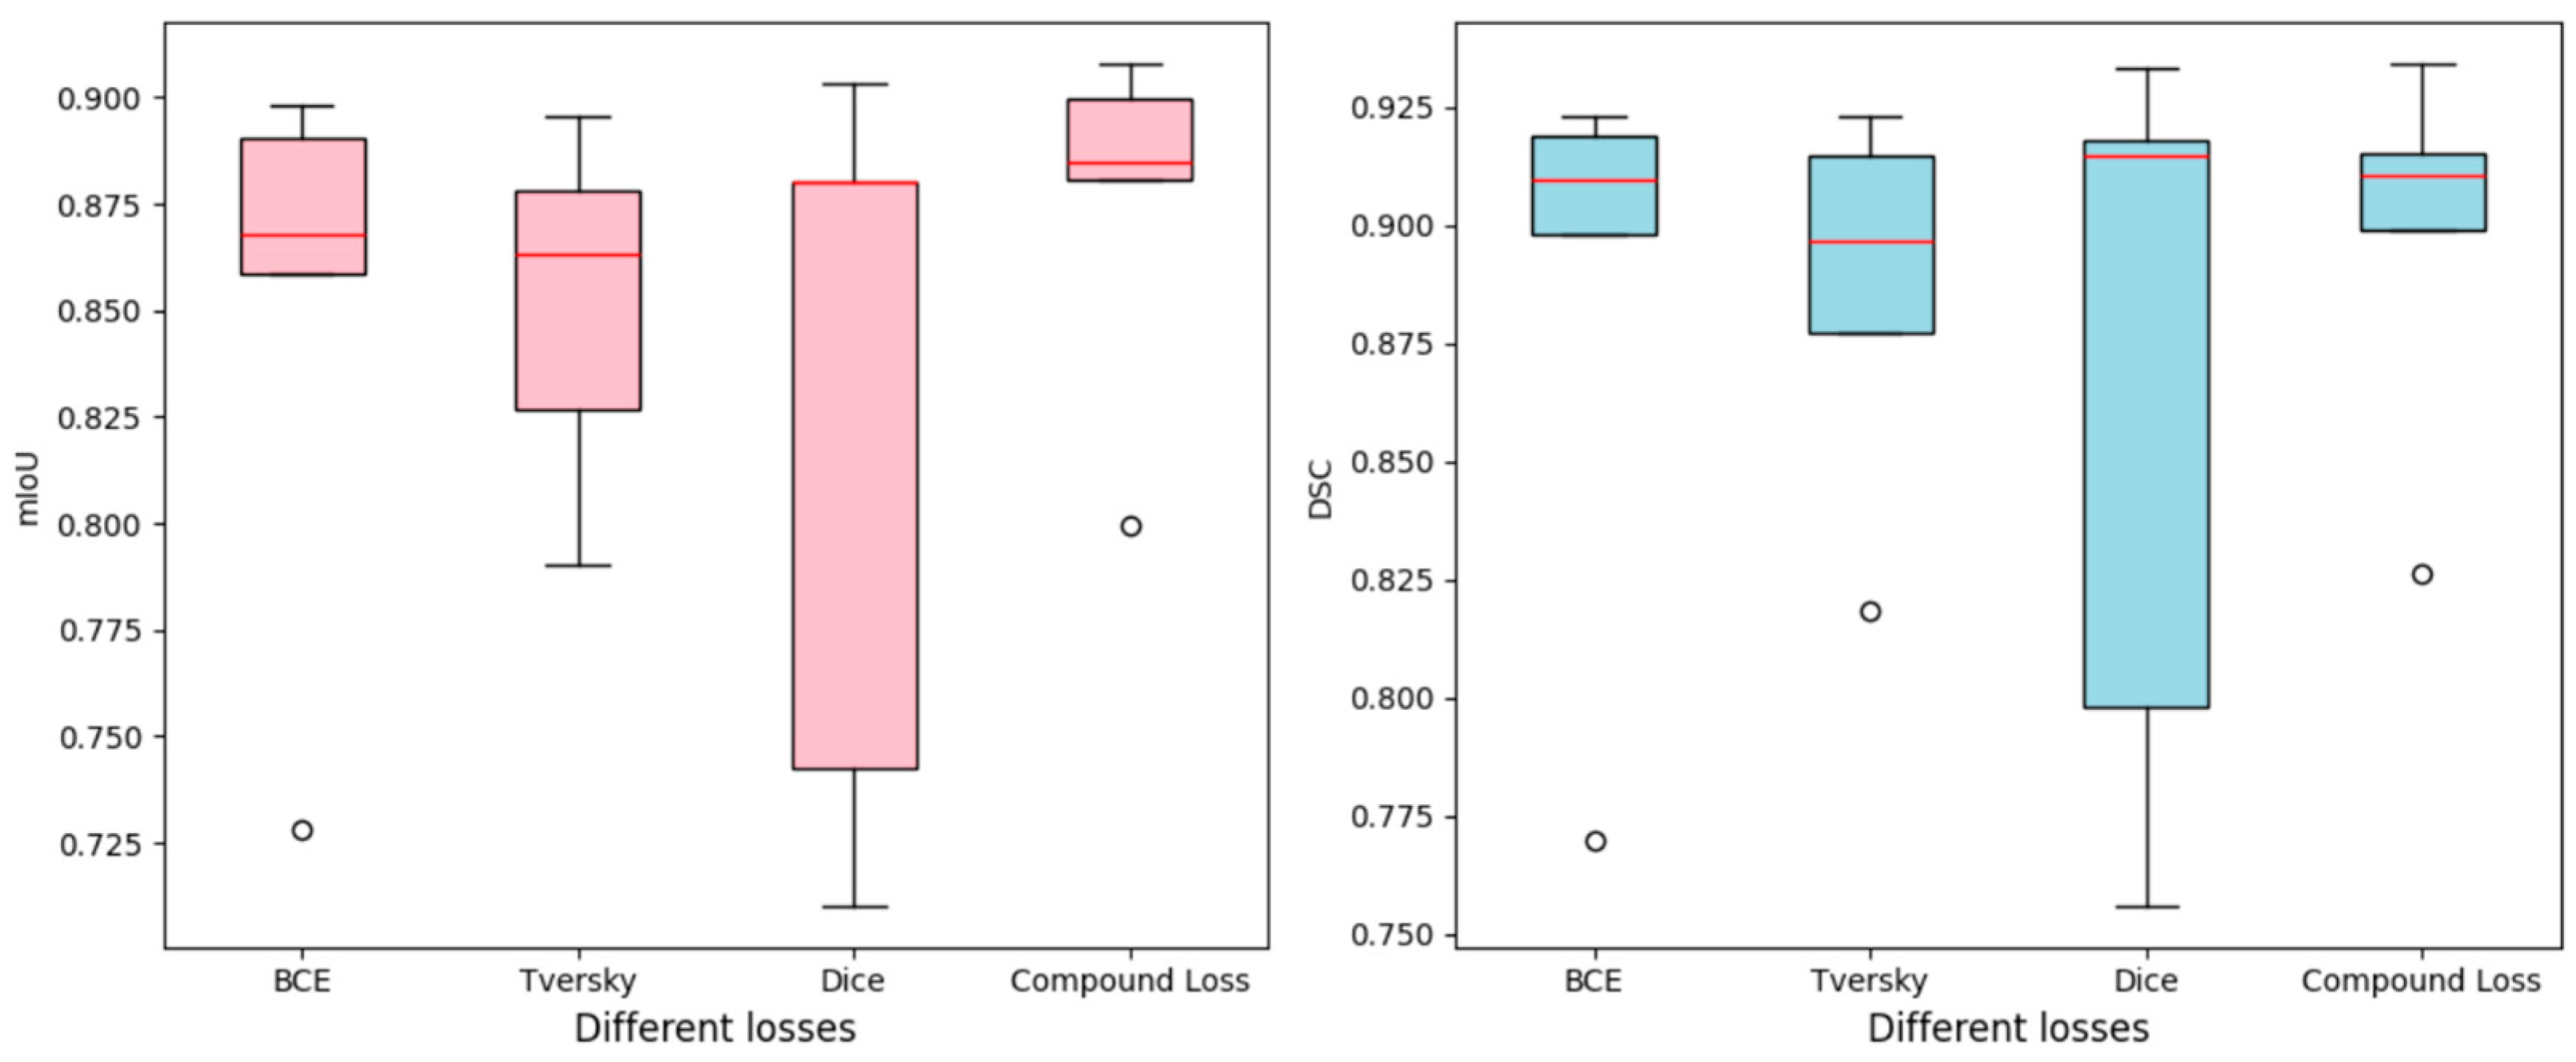
The performance of the proposed method using different loss functions is examined in this section. The method was tested on both the ISIC2018 and PH2 datasets across five epochs using four distinct loss functions. Table 2 and Table 3 present the performance metrics—DSC and mIoU—of various loss functions across different epochs on the ISIC2018 and PH2 datasets, respectively. In both tables, the LCompound function consistently outperforms the others, achieving the highest DSC (0.8871 in Table 2 and 0.9341 in Table 3) and mIoU (0.8768 in Table 2 and 0.9078 in Table 3) scores, observed at the 80th epoch for Table 2 and the 60th epoch for Table 3. These results highlight the LCompound function’s superior ability to facilitate effective learning.
Among the other loss functions, LDice demonstrated competitive performance, especially in the later epochs, yet it was generally surpassed by LCompound in both datasets. Meanwhile, the BCE and Tversky loss functions showed moderate results but failed to match the robust learning performance enabled by LCompound.
A high mIoU value indicates that the model accurately detects the boundaries and lesion regions in the segmentation task, whereas low mIoU values reveal shortcomings in boundary detection and difficulties in accurately segmenting certain lesion types. Similarly, high DSC values suggest that the predicted segmentation closely approximates the ground truth, while low DSC values imply that the lesion regions were not detected with sufficient accuracy. The outstanding performance of the LCompound function demonstrates the model’s ability to learn effectively from diverse lesion types and data distributions. This superiority is attributed to its integration of the advantages of multiple loss functions, which facilitates both a more precise learning of fine details in limited areas and an overall improvement in segmentation accuracy.
The visualizations in Figure 8 and Figure 9 provide a clear comparison of mIoU and DSC performances for different loss functions across epochs on the ISIC2018 and PH2 datasets. Across both datasets, the LCompound function stands out for its consistent and stable performance, with minimal variability in both metrics. This consistency underscores its robustness, as it maintains high scores across all epochs without the fluctuations observed in other loss functions. LDice, while occasionally achieving comparable results in specific epochs, is characterized by greater variability and the presence of outliers, indicating less stable learning. LTversky and LBCE loss functions, though moderately effective, exhibit broader variability ranges and fail to reach the same level of reliability or peak performance as LCompound. The boxplots visually reinforce the LCompound function’s superiority by showcasing its narrower interquartile ranges and higher medians in both mIoU and DSC metrics. This further establishes its effectiveness as a reliable choice for segmentation tasks.
In the experiments conducted on the ISIC2018 and PH2 datasets, the model was trained for 80 and 60 epochs, respectively, using the LCompound loss function, with total training times of 213 min and 19.9 s for ISIC2018 and 18 min and 9.8 s for PH2. The model achieved an accuracy of 0.9528, recall of 0.8555, specificity of 0.9808, and precision of 0.9254 on ISIC2018, while on PH2, it achieved an accuracy of 0.9299, recall of 0.9045, specificity of 0.9465, and precision of 0.9030. The computational complexity for both datasets was approximately 253.39 GFLOPs, with inference speeds of 148.62 FPS for ISIC2018 and 147.67 FPS for PH2. The model comprises around 48 million parameters, including approximately 25,000 non-trainable ones, with memory footprints of 183.61 MB and 97.59 MB for ISIC2018 and PH2, respectively.

4.2. Comparison with State-of-the-Art Methods

The proposed BA-RA-UNet model was compared with state-of-the-art U-Net-based methods in Table 4 and Table 5. Table 4 includes five networks specifically designed for skin lesions, as well as two general segmentation networks, all evaluated on the ISIC2018 dataset. In Table 5, three different deep networks and two general segmentation networks evaluated on the PH2 dataset are presented. The comparisons were based on the number of model parameters, DSC and mIoU metrics. In Table 4, the results for the general segmentation networks were obtained experimentally, while the other results were taken from the original studies.
Ms-RED [44] is a lightweight model that predicts skin lesions using innovative mechanisms such as multi-scale residual encoding and soft-pooling. Ms-RED achieves the highest mIoU among compared methods (0.8999), outperforming our model (0.8768) in region-level segmentation precision. However, our model demonstrates superior DSC performance (0.8871 vs. 0.8345), indicating better pixel-level foreground overlap. This performance pattern reflects different architectural priorities.
CPFNet [45] utilizes a composite loss function—combining LDice and LBCE—and has been tested on various medical datasets. While CPFNet achieves higher mIoU (0.8963 vs. 0.8768), our model demonstrates superior DSC performance (0.8871 vs. 0.8292), indicating better pixel-level overlap.
Among the compared methods, LeaNet [46] is the lightest—with only 0.11 million parameters—but it exhibits the lowest performance in terms of mIoU. This shortfall is likely due to its low parameter count and simplified architecture, which limits its ability to learn complex features effectively. Although its lightweight design ensures speed and efficiency, the model sacrifices performance on complex segmentation tasks.
The AS-Net [47] model, when trained for approximately 17.5 h on an NVIDIA GeForce RTX 2080Ti GPU, achieved 0.8955 DSC and 0.8309 mIoU. In contrast, our model was trained on an NVIDIA RTX A4000 GPU for about 4 h, attaining 0.8871 DSC and 0.8768 mIoU. The reduced training time of our model is attributable not only to hardware differences but also to its efficient architecture and faster convergence properties. Moreover, even though our model has 48 million parameters compared to AS-Net’s 24.9 million, it achieves a higher mIoU, underscoring its superior feature extraction and learning capacity.
ACCPG-Net [12] was trained for 250 epochs using a loss function based on the SoftDice loss [48]. On the ISIC2018 dataset, ACCPG-Net achieved a DSC of 0.9081, outperforming our model’s DSC of 0.8871. However, with respect to mIoU, our model outperformed ACCPG-Net by achieving 0.8768 versus 0.8352. On the PH2 dataset, our model demonstrated superiority in both metrics. While ACCPG-Net’s 11.8 million parameters make it a lighter model, the higher computational capacity enhances our model’s ability to learn complex features and perform more precise segmentation. The DSC metric, being more sensitive to false negatives due to its harmonic mean formulation, penalizes missed regions more heavily, while mIoU provides a more balanced assessment of overall segmentation quality including true negatives. This pattern suggests that our model may be particularly suitable for applications where boundary precision and reducing false alarms are prioritized over maximizing lesion detection sensitivity. In conclusion, our BA-RA-UNet model, with its higher parameter capacity, offers particularly strong generalization ability and precise segmentation performance on the PH2 dataset, while also presenting a competitive approach on the ISIC2018 dataset.
ICL-Net [49]: Our model outperforms ICL-Net on the PH2 dataset, achieving higher DSC (0.9341 vs. 0.9280) and mIoU (0.9078 vs. 0.8725) values. While ICL-Net benefits from complex modules for feature extraction, it shows limitations in generalization. In contrast, our model demonstrates better segmentation accuracy, though it has a higher parameter count, indicating a trade-off between model complexity and performance.
Table 4. Skin lesion segmentation performances of different networks on ISIC2018.
Networks (Ref.)Params (M) ↓DSCmIoU
U-Net ([30])32.90.84170.8269
Attention-U-Net ([50])33.30.82530.8151
Ms-RED ([44])3.80.83450.8999
CPFNet ([45])43.30.82920.8963
LeaNet ([46])0.110.88250.7839
AS-Net ([47])24.90.89550.8309
ACCPG-Net ([12])11.80.90810.8352
MCGFF-Net ([51])39.670.89070.8179
Ours480.88710.8768
Bold values indicate the best performance. ↑ denotes metrics where higher values are better, while ↓ denotes metrics where lower values are better.
Table 5. Skin lesion segmentation performances of different networks on PH2.
Networks (Ref.)Params (M) ↓DSCmIoU
U-Net ([30])32.90.92930.9012
Attention-U-Net ([50])33.30.89920.8673
AS-Net ([47])24.90.93050.8760
ICL-Net ([49])N.A0.92800.8725
ACCPG-Net ([12])11.80.91330.8427
MCGFF-Net ([51])39.670.93070.8752
Ours480.93410.9078
Bold values indicate the best performance. ↑ denotes metrics where higher values are better, while ↓ denotes metrics where lower values are better.
MCGFF-Net [51] executes medical segmentation by integrating a CBAM module within its encoder. In comparison, our model achieved superior mIoU performance across two datasets, whereas the mDSC metric demonstrated a competitive outcome. The MCGFF-Net module was trained for 200 epochs to obtain these results. Moreover, various data augmentation techniques were employed during training to support additional processing operations.
In summary, although models such as CPFNet and AS-Net have fewer parameters, our model achieves higher mIoU values due to its capability for complex feature extraction and precise segmentation. In comparison with ACCPG-Net, while our model slightly lags in DSC on the ISIC2018 dataset, it demonstrates superior performance in mIoU and outperforms ACCPG-Net in both metrics on the PH2 dataset. When compared with ICL-Net, our model exhibits stronger generalization by achieving higher DSC and mIoU scores on the PH2 dataset. Moreover, compared to AS-Net, our model offers a shorter training time and higher accuracy, highlighting the efficiency of its architecture and rapid convergence capability.

4.3. Visualization Results

The visual results of the proposed BA-RA-UNet model were evaluated on skin lesions characterized by irregular shapes, varying color tones, the presence of hair, and other segmentation challenges. Figure 10 presents the segmentation outcomes for ten different skin lesion images. Specifically, the first row displays the raw skin lesion images, the second row shows the ground truth masks, the third row presents the masks predicted by the model, and the final row overlays the predicted boundaries on the ground truth. These results demonstrate that the model can accurately detect lesion regions even in complex scenarios, such as those involving irregular boundaries, low contrast, and areas with hair.
Figure 11, on the other hand, presents the results for the images provided in Figure 1, which illustrate the challenges of skin lesion segmentation discussed in Section 1 of the paper. The experimental results visually confirm that the proposed model successfully overcomes these challenges. Even in images with hair and heterogeneous textures, the model achieves precise segmentation, thereby validating the strong generalization capability of BA-RA-UNet’s attention mechanism.
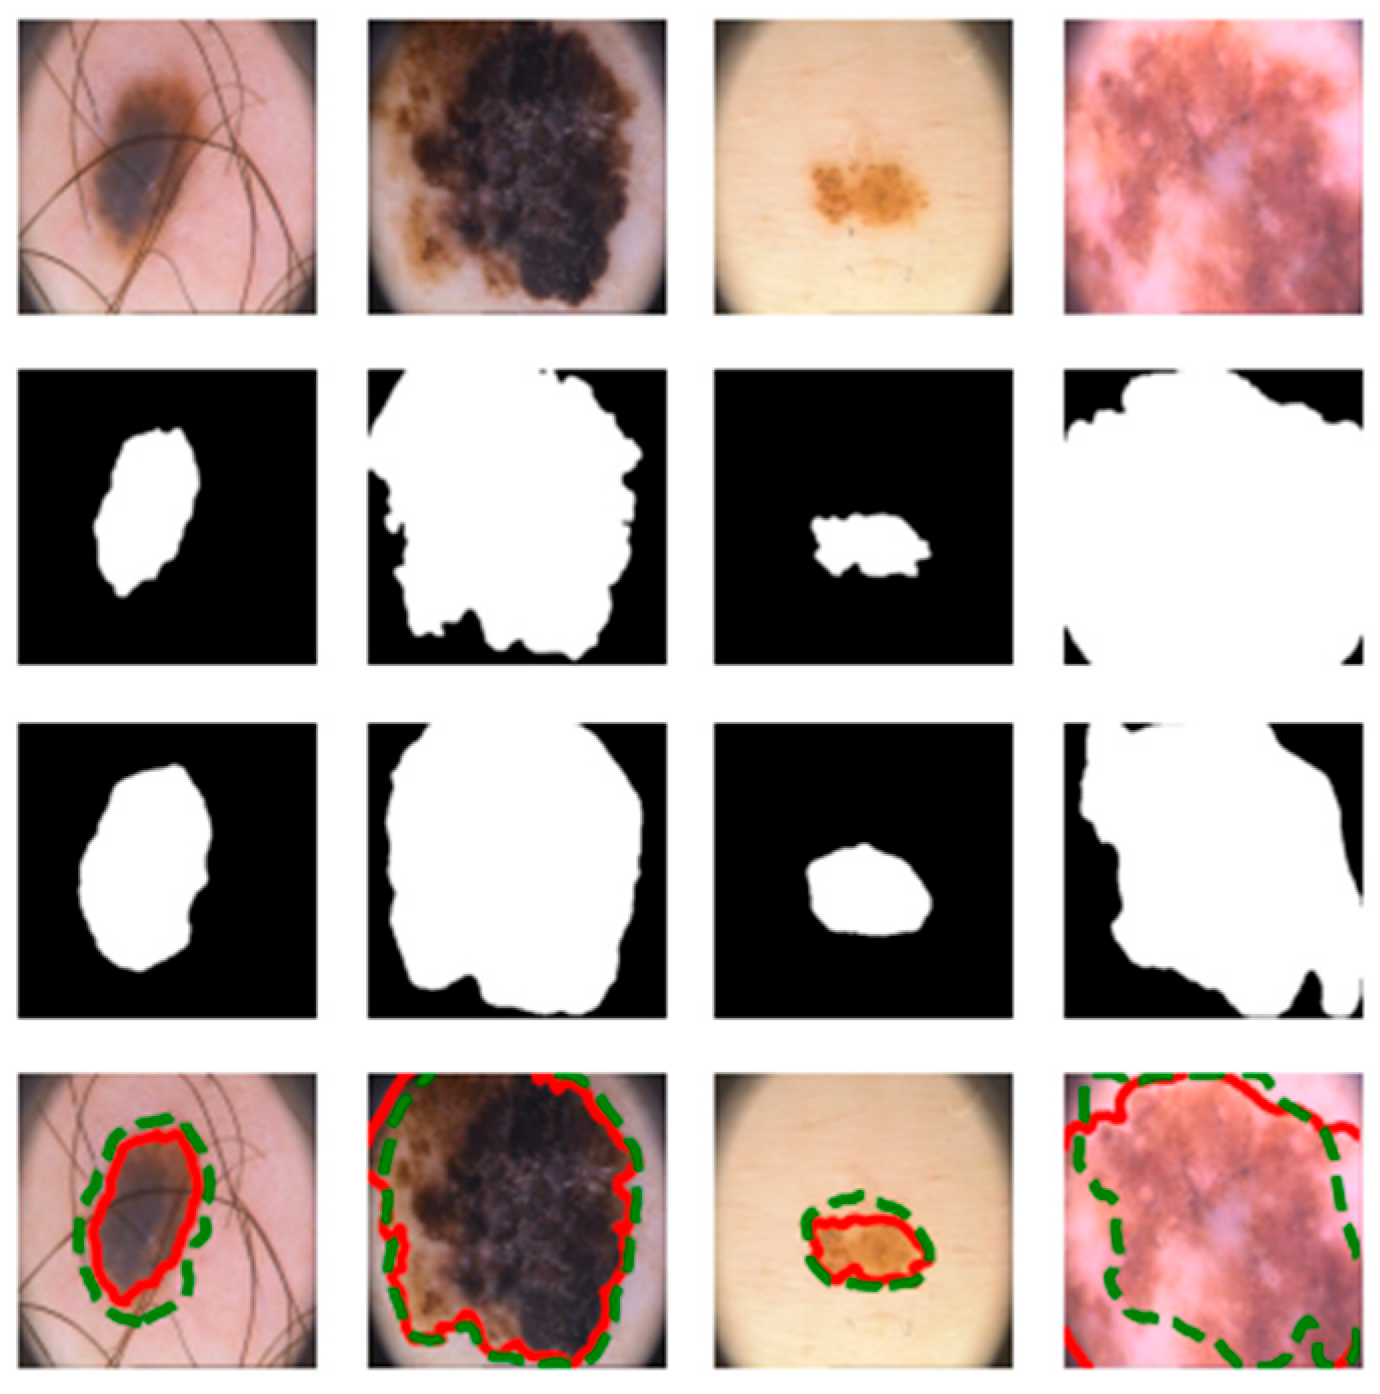
Figure 12 presents the segmentation results of the proposed BA-RA-UNet model on challenging skin lesion images. The first row shows original test images with obstacles such as hair occlusion, low contrast, and irregular lesion boundaries. The second row provides ground truth segmentation masks, while the third row displays the model’s predicted segmentations. The final row overlays predicted contours (green) and ground truth contours (red) on the original images. The model performs well on clearly defined lesions but struggles with complex cases. In the first two columns, where dense hair occlusion makes differentiation difficult, the model produces fragmented segmentations. The third column, featuring a lesion with a color close to the surrounding skin, shows minimal deviation from the ground truth. In the last column, where the lesion has a distinctly dark appearance, the model achieves near-perfect segmentation. These results demonstrate the model’s effectiveness in segmenting diverse lesions while highlighting areas for improvement, such as handling occlusions and subtle lesion boundaries.
Generally, these visual results substantiate the robust performance of the proposed model in challenging skin lesion segmentation tasks and support its potential as a reliable tool in clinical applications.

5. Conclusions, Limitation and Future Work

In this paper, the BA-RA-UNet model is presented as a solution specifically designed to deliver high performance in the segmentation of skin lesions. The model enhances feature extraction by integrating a Reverse-Attention module into the skip connections of the conventional U-Net architecture, thereby improving segmentation accuracy—particularly in ambiguous and complex regions. This approach not only preserves fine boundary details but also contributes to minimizing segmentation errors. By employing multiple loss functions—namely BCE loss, dice loss, Tversky loss, and compound loss—the model ensures the retention of boundary details and reduces segmentation errors even when faced with imbalanced data distributions. Recognizing the critical role of loss functions in the performance of deep learning models, a detailed examination was conducted for the task of skin lesion segmentation, with the LCompound function yielding the best results. The LCompound facilitates a more balanced learning process, ultimately enhancing overall accuracy.
Experimental validation demonstrated that the model achieved a DSC of 88.71% and mIoU of 87.68% on the complex and heterogeneous ISIC2018 dataset, and 93.41% DSC along with 90.78% mIoU on the more homogeneous and limited PH2 dataset. Despite a computational cost of 253.39 GFLOPs, the model exhibited high efficiency at 148.62 FPS. However, several limitations should be acknowledged. First, the model’s high parameter count (~48 million parameters) represents a significant computational burden, particularly for resource-constrained clinical environments and mobile or edge deployment scenarios. This large model size results in substantial memory requirements and limits real-time applicability. Addressing this constraint through model compression techniques such as pruning, quantization, or knowledge distillation is a focus for future work. Second, the evaluations were conducted on only two datasets, which may limit generalizability and comparability across diverse clinical settings and imaging conditions.
Future work will focus on performance assessments using multi-modal data and larger datasets, reducing computational costs through parameter optimization, and adapting the model for real-time clinical applications. Additionally, systematic visualization and clinical validation of the BA-RA attention maps could be explored to investigate the interpretability aspects of the proposed mechanism, potentially contributing to explainable AI research in dermatological image analysis. Both quantitative metrics and visual outputs confirm that BA-RA-UNet offers a competitive balance of accuracy and efficiency in complex medical image segmentation tasks.

Funding

This research received no external funding.

Data Availability Statement

The datasets used in this study are publicly available and can be accessed through their respective repositories.

Conflicts of Interest

The author declares no conflicts of interest.

References

  1. Woo, Y.R.; Cho, S.H.; Lee, J.D.; Kim, H.S. The Human Microbiota and Skin Cancer. Int. J. Mol. Sci. 2022, 23, 1813. [Google Scholar] [CrossRef]
  2. Jiminez, V.; Yusuf, N. An update on clinical trials for chemoprevention of human skin cancer. J. Cancer Metastasis Treat. 2023, 9, 4. [Google Scholar] [CrossRef]
  3. Arnold, M.; Singh, D.; Laversanne, M.; Vignat, J.; Vaccarella, S.; Meheus, F.; Cust, A.E.; de Vries, E.; Whiteman, D.C.; Bray, F. Global burden of cutaneous melanoma in 2020 and projections to 2040. JAMA Dermatol. 2022, 158, 495–503. [Google Scholar] [CrossRef]
  4. Khan, M.Q.; Hussain, A.; Rehman, S.U.; Khan, U.; Maqsood, M.; Mehmood, K.; Khan, M.A. Classification of Melanoma and Nevus in Digital Images for Diagnosis of Skin Cancer. IEEE Access 2019, 7, 90132–90144. [Google Scholar] [CrossRef]
  5. Harrison, K. The accuracy of skin cancer detection rates with the implementation of dermoscopy among dermatology clinicians: A scoping review. J. Clin. Aesthetic Dermatol. 2024, 17 (Suppl. S1), S18. [Google Scholar]
  6. Mendonca, T.; Ferreira, P.M.; Marques, J.S.; Marcal, A.R.S.; Rozeira, J. PH2-A dermoscopic image database for research and benchmarking. In Proceedings of the 2013 35th Annual International Conference of the IEEE Engineering in Medicine and Biology Society (EMBC), Osaka, Japan, 3–7 July 2013; pp. 5437–5440. [Google Scholar] [CrossRef]
  7. Karthik, B.; Muthupandi, G. SVM and CNN based skin tumour classification using WLS smoothing filter. Optik 2023, 272, 170337. [Google Scholar] [CrossRef]
  8. Anand, V.; Gupta, S.; Koundal, D.; Singh, K. Fusion of U-Net and CNN model for segmentation and classification of skin lesion from dermoscopy images. Expert Syst. Appl. 2023, 213, 119230. [Google Scholar] [CrossRef]
  9. Song, L.; Wang, H.; Wang, Z.J. Decoupling multi-task causality for improved skin lesion segmentation and classification. Pattern Recognit. 2023, 133, 108995. [Google Scholar] [CrossRef]
  10. Wang, Y.; Wang, Y.; Cai, J.; Lee, T.K.; Miao, C.; Wang, Z.J. SSD-KD: A self-supervised diverse knowledge distillation method for lightweight skin lesion classification using dermoscopic images. Med. Image Anal. 2023, 84, 102693. [Google Scholar] [CrossRef]
  11. He, X.; Wang, Y.; Zhao, S.; Chen, X. Joint segmentation and classification of skin lesions via a multi-task learning convolutional neural network. Expert Syst. Appl. 2023, 230, 120174. [Google Scholar] [CrossRef]
  12. Zhang, W.; Lu, F.; Zhao, W.; Hu, Y.; Su, H.; Yuan, M. ACCPG-Net: A skin lesion segmentation network with Adaptive Channel-Context-Aware Pyramid Attention and Global Feature Fusion. Comput. Biol. Med. 2023, 154, 106580. [Google Scholar] [CrossRef]
  13. Qiu, S.; Li, C.; Feng, Y.; Zuo, S.; Liang, H.; Xu, A. GFANet: Gated Fusion Attention Network for skin lesion segmentation. Comput. Biol. Med. 2023, 155, 106462. [Google Scholar] [CrossRef]
  14. Karri, M.; Annavarapu, C.S.R.; Acharya, U.R. Skin lesion segmentation using two-phase cross-domain transfer learning framework. Comput. Methods Programs Biomed. 2023, 231, 107408. [Google Scholar] [CrossRef]
  15. Tembhurne, J.V.; Hebbar, N.; Patil, H.Y.; Diwan, T. Skin cancer detection using ensemble of machine learning and deep learning techniques. Multimed. Tools Appl. 2023, 82, 27501–27524. [Google Scholar] [CrossRef]
  16. Gilani, S.Q.; Syed, T.; Umair, M.; Marques, O. Skin Cancer Classification Using Deep Spiking Neural Network. J. Digit. Imaging 2023, 36, 1137–1147. [Google Scholar] [CrossRef] [PubMed]
  17. Golnoori, F.; Boroujeni, F.Z.; Monadjemi, A. Metaheuristic algorithm based hyper-parameters optimization for skin lesion classification. Multimed. Tools Appl. 2023, 82, 25677–25709. [Google Scholar] [CrossRef]
  18. Shukla, M.M.; Tripathi, B.K.; Dwivedi, T.; Tripathi, A.; Chaurasia, B.K. A hybrid CNN with transfer learning for skin cancer disease detection. Med. Biol. Eng. Comput. 2024, 62, 3057–3071. [Google Scholar] [CrossRef]
  19. Natha, P.; RajaRajeswari, P. Advancing Skin Cancer Prediction Using Ensemble Models. Computers 2024, 13, 157. [Google Scholar] [CrossRef]
  20. Wang, Z.; Lin, Y.; Zhu, X. Transfer Contrastive Learning for Raman Spectroscopy Skin Cancer Tissue Classification. IEEE J. Biomed. Health Inform. 2024, 28, 7332–7344. [Google Scholar] [CrossRef]
  21. Chen, T.; Kornblith, S.; Norouzi, M.; Hinton, G. A simple framework for contrastive learning of visual representations. In Proceedings of the 37th International Conference on Machine Learning ICML 2020, Vienna, Austria, 13–18 July 2020; Volume Part F16814. pp. 1575–1585. [Google Scholar]
  22. Pandurangan, V.; Sarojam, S.P.; Narayanan, P.; Velayutham, M. Hybrid deep learning-based skin cancer classification with RPO-SegNet for skin lesion segmentation. Netw. Comput. Neural Syst. 2024, 36, 221–248. [Google Scholar] [CrossRef] [PubMed]
  23. Wang, L.; Xie, C.; Zeng, N. RP-Net: A 3D Convolutional Neural Network for Brain Segmentation From Magnetic Resonance Imaging. IEEE Access 2019, 7, 39670–39679. [Google Scholar] [CrossRef]
  24. Eerapu, K.K.; Lal, S.; Narasimhadhan, A.V. O-SegNet: Robust Encoder and Decoder Architecture for Objects Segmentation From Aerial Imagery Data. IEEE Trans. Emerg. Top. Comput. Intell. 2022, 6, 556–567. [Google Scholar] [CrossRef]
  25. Ren, J.S.; Xu, L.; Yan, Q.; Sun, W. Shepard convolutional neural networks. Adv. Neural Inf. Process. Syst. 2015, 2015, 901–909. [Google Scholar]
  26. Sun, W.; Su, F.; Wang, L. Improving deep neural networks with multi-layer maxout networks and a novel initialization method. Neurocomputing 2018, 278, 34–40. [Google Scholar] [CrossRef]
  27. Kumar, M.; Mehta, U. Enhancing the performance of CNN models for pneumonia and skin cancer detection using novel fractional activation function. Appl. Soft Comput. 2025, 168, 112500. [Google Scholar] [CrossRef]
  28. Yang, B.; Zhang, R.; Peng, H.; Guo, C.; Luo, X.; Wang, J.; Long, X. SLP-Net:An efficient lightweight network for segmentation of skin lesions. Biomed. Signal Process. Control 2025, 101, 107242. [Google Scholar] [CrossRef]
  29. Zhang, X.; Wang, J.; Wei, J.; Yuan, X.; Wu, M. A Review of Non-Fully Supervised Deep Learning for Medical Image Segmentation. Information 2025, 16, 433. [Google Scholar] [CrossRef]
  30. Ronneberger, O.; Fischer, P.; Brox, T. U-Net: Convolutional networks for biomedical image segmentation. In International Conference on Medical Image Computing and Computer-Assisted Intervention, Miccai; Springer: Cham, Switzerland, 2015; pp. 234–241. [Google Scholar]
  31. Yu, Y.; Chen, S.; Wei, H. Modified UNet with attention gate and dense skip connection for flow field information prediction with porous media. Flow Meas. Instrum. 2023, 89, 102300. [Google Scholar] [CrossRef]
  32. Ambesange, S.; Annappa, B.; Koolagudi, S.G. Simulating Federated Transfer Learning for Lung Segmentation using Modified UNet Model. Procedia Comput. Sci. 2022, 218, 1485–1496. [Google Scholar] [CrossRef]
  33. Fan, D.-P.; Ji, G.-P.; Zhou, T.; Chen, G.; Fu, H.; Shen, J.; Shao, L. PraNet: Parallel Reverse Attention Network for Polyp Segmentation. In Lecture Notes in Computer Science (Including Subseries Lecture Notes in Artificial Intelligence and Lecture Notes in Bioinformatics); Springer: Berlin/Heidelberg, Germany, 2020; Volume 12266 LNCS, pp. 263–273. [Google Scholar] [CrossRef]
  34. Du Nguyen, Q.; Thai, H.-T. Crack segmentation of imbalanced data: The role of loss functions. Eng. Struct. 2023, 297, 116988. [Google Scholar] [CrossRef]
  35. Xu, H.; He, H.; Zhang, Y.; Ma, L.; Li, J. A comparative study of loss functions for road segmentation in remotely sensed road datasets. Int. J. Appl. Earth Obs. Geoinf. 2023, 116, 103159. [Google Scholar] [CrossRef]
  36. Ma, J.; Chen, J.; Ng, M.; Huang, R.; Li, Y.; Li, C.; Yang, X.; Martel, A.L. Loss odyssey in medical image segmentation. Med. Image Anal. 2021, 71, 102035. [Google Scholar] [CrossRef] [PubMed]
  37. Lin, T.; Goyal, P.; Girshick, R.; He, K.; Dollár, P. Focal Loss for Dense Object Detection. In Proceedings of the IEEE International Conference on Computer Vision (ICCV), Venice, Italy, 22–29 October 2017; pp. 2999–3007. [Google Scholar] [CrossRef]
  38. Milletari, F.; Navab, N.; Ahmadi, S.-A. V-net: Fully convolutional neural networks for volumetric medical image segmentation. In Proceedings of the 2016 Fourth International Conference on 3D Vision (3DV), Stanford, CA, USA, 25–28 October 2016; pp. 565–571. [Google Scholar] [CrossRef]
  39. Salehi, S.S.M.; Erdogmus, D.; Gholipour, A. Tversky loss function for image segmentation using 3D fully convolutional deep networks. In Lecture Notes in Computer Science (Including Subseries Lecture Notes in Artificial Intelligence and Lecture Notes in Bioinformatics); Springer: Berlin/Heidelberg, Germany, 2017; Volume 10541 LNCS, pp. 379–387. [Google Scholar] [CrossRef]
  40. Yeung, M.; Sala, E.; Schönlieb, C.-B.; Rundo, L. Unified Focal loss: Generalising Dice and cross entropy-based losses to handle class imbalanced medical image segmentation. Comput. Med. Imaging Graph. 2022, 95, 102026. [Google Scholar] [CrossRef]
  41. Codella, N.; Rotemberg, V.; Tschandl, P.; Celebi, M.E.; Dusza, S.; Gutman, D.; Helba, B.; Kalloo, A.; Liopyris, K.; Marchetti, M.; et al. Skin Lesion Analysis Toward Melanoma Detection 2018: A Challenge Hosted by the International Skin Imaging Collaboration (ISIC). arXiv 2019, arXiv:1902.03368. [Google Scholar] [CrossRef]
  42. Yin, W.; Zhou, D.; Nie, R. DI-UNet: Dual-branch interactive U-Net for skin cancer image segmentation. J. Cancer Res. Clin. Oncol. 2023, 149, 15511–15524. [Google Scholar] [CrossRef] [PubMed]
  43. Zhang, Q.; Li, C.; Zuo, S.; Cai, Y.; Xu, A.; Huang, H.; Zhou, S. The impact of multi-class information decoupling in latent space on skin lesion segmentation. Neurocomputing 2025, 617, 128962. [Google Scholar] [CrossRef]
  44. Dai, D.; Dong, C.; Xu, S.; Yan, Q.; Li, Z.; Zhang, C.; Luo, N. Ms RED: A novel multi-scale residual encoding and decoding network for skin lesion segmentation. Med. Image Anal. 2022, 75, 102293. [Google Scholar] [CrossRef]
  45. Feng, S.; Zhao, H.; Shi, F.; Cheng, X.; Wang, M.; Ma, Y.; Xiang, D.; Zhu, W.; Chen, X. Cpfnet: Context pyramid fusion network for medical image segmentation. IEEE Trans. Med. Imaging 2020, 39, 3008–3018. [Google Scholar] [CrossRef]
  46. Hu, B.; Zhou, P.; Yu, H.; Dai, Y.; Wang, M.; Tan, S.; Sun, Y. LeaNet: Lightweight U-shaped architecture for high-performance skin cancer image segmentation. Comput. Biol. Med. 2024, 169, 107919. [Google Scholar] [CrossRef] [PubMed]
  47. Hu, K.; Lu, J.; Lee, D.; Xiong, D.; Chen, Z. AS-Net: Attention Synergy Network for skin lesion segmentation. Expert Syst. Appl. 2022, 201, 117112. [Google Scholar] [CrossRef]
  48. Bertels, J.; Eelbode, T.; Berman, M.; Vandermeulen, D.; Maes, F.; Bisschops, R.; Blaschko, M.B. Optimizing the Dice Score and Jaccard Index for Medical Image Segmentation: Theory and Practice. In International Conference on Medical Image Computing and Computer Assisted Intervention—MICCAI; Springer: Cham, Switzerland, 2019; pp. 92–100. [Google Scholar]
  49. Cao, W.; Yuan, G.; Liu, Q.; Peng, C.; Xie, J.; Yang, X.; Ni, X.; Zheng, J. ICL-Net: Global and Local Inter-Pixel Correlations Learning Network for Skin Lesion Segmentation. IEEE J. Biomed. Health Inform. 2023, 27, 145–156. [Google Scholar] [CrossRef] [PubMed]
  50. Oktay, O.; Schlemper, J.; Folgoc, L.L.; Lee, M.; Heinrich, M.; Misawa, K.; Mori, K.; McDonagh, S.; Hammerla, N.Y.; Kainz, B.; et al. Attention U-Net: Learning Where to Look for the Pancreas. arXiv 2018, arXiv:1804.03999. [Google Scholar] [CrossRef]
  51. Li, Y.; Meng, W.; Ma, D.; Xu, S.; Zhu, X. MCGFF-Net: A multi-scale context-aware and global feature fusion network for enhanced polyp and skin lesion segmentation. Vis. Comput. 2024, 41, 5267–5282. [Google Scholar] [CrossRef]
Figure 1. Different lesion images (The images were taken from the dataset published in [6].
Symmetry 17 02002 g001
Figure 2. Original U-Net architecture (The architecture has been redrawn based on the original UNET architecture).
Symmetry 17 02002 g002
Figure 3. Modified U-Net architecture.
Symmetry 17 02002 g003
Figure 4. Convolution architectures (a) traditional convolution, (b) dilated convolution.
Symmetry 17 02002 g004
Figure 5. Modified reverse attention.
Symmetry 17 02002 g005
Figure 6. Boundary attention module.
Symmetry 17 02002 g006
Figure 7. Performance Variations In The Compound loss function at different λ 2 values: IoU and DSC metrics for PH2 and ISIC2018 dataset.
Symmetry 17 02002 g007
Figure 8. Comparison of mIoU and DSC performance for different loss functions (BCE, Tversky, Dice, Compound Loss) across varying epochs (20, 40, 60, 80, 100) on the ISIC2018 dataset (results from our proposed method).
Symmetry 17 02002 g008
Figure 9. Comparison of mIoU and DSC performance for different loss functions (BCE, Tversky, Dice, Compound Loss) across varying epochs (20, 40, 60, 80, 100) on the PH2 dataset (results from our proposed method).
Symmetry 17 02002 g009
Figure 10. Sample segmentation results of the proposed BA-RA-UNet model on various skin lesion images. The first row represents the original test images, the second row shows the corresponding ground truth segmentation masks, the third row presents the predicted masks by the proposed model, and the last row overlays the predicted contours (green) and ground truth contours (red) on the original images.
Symmetry 17 02002 g010
Figure 11. Experimental results of Figure 1.
Symmetry 17 02002 g011
Figure 12. Segmentation performance of the proposed BA-RA-UNet on challenging skin lesions.
Symmetry 17 02002 g012
Table 1. Summary of Related Work.
Ref. (Year)Method(s)DescriptionResult
[7] (2022)Feature extraction + Feature classification using SVM and CNNClassificationEnhancement ratio 1.5 has average classification rate around 98%
[8] (2023)A fusion model is proposed with the integration of U-Net and Convolution Neural Network model.Segmentation and ClassificationHAM10000: 0.979
[9] (2023)Segmentation using U-Net and classification with ResNet/DenseNetSegmentation and ClassificationPH2: Acc: 0.965 (segmentation)
PH2: Acc: 0.933 (classification)
ISIC2017: 0.956 (segmentation)
[10] (2023)A self-supervised diverse knowledge distillation method, that is SSD-KDClassificationISIC2019: Acc: 0.846
(Teacher: Resnet50-Student: MobileNetV2)
[11] (2023)Multi-
Task Learning Convolutional Neural Network (Mtl-Cnn)
Segmentation and ClassificationXiangya-Clinic dataset: 0.959 (Melanoma Classification)
ISIC2016: 0.885 (Skin lesion Classification)
ISIC2017: 0.940 (Seborrheic Keratosis Classification) 0.873 (Melanoma Classification)
[12] (2023)Adaptive Channel-Context-Aware Pyramid Attention and Global Feature Fusion (ACCPG-Net)SegmentationISIC2016: 0.9662
ISIC2017: 0.9561
ISIC2018: 0.9613
[13] (2023)Gated Fusion Attention NetworkSegmentationISIC2016: 0.9604
ISIC2017: 0.9397
ISIC2018: 0.9629
[14] (2023)Two-phase cross-domain transfer learning framework HAM10000: 0.9912
MoleMap: 0.9701
[15] (2023)Feature extraction based on deep learning and machine learningClassificationISIC Archive: 0.93
[16] (2023)Deep spiking Neural networkClassificationISIC2019: 0.8957
[17] (2023)Hyperparameter tuning based on optimizationClassificationISIC2017: 0.816
ISIC2018: 0.901
[18] (2024)A hybrid CNN with transfer learningClassificationISIC2019: 0.901
[19] (2024)Max Voting ModelClassificationISIC2018 and HAM10000: 0.9580
[20] (2024)Transfer learning and contrastive learningClassificationPrivate dataset
[22] (2024)Hybrid deep learning methodSegmentation and ClassificationISIC2019: 0.9174
[27] (2025)Novel activation functionClassificationISIC2018: 0.9212
[28] (2025) SegmentationISIC2016: 0.9570,
ISIC2018: 0.9387
PH2: 0.9162
Table 2. Performance metrics of different loss functions across varying epochs on the ISIC2018 dataset. The best scores are in bold. (Our model.)
Loss FunctionDSCmIoU
EpochEpoch
2040608010020406080100
BCE0.86240.88210.87480.87670.87720.84460.86610.85440.85500.8601
Tversky0.85440.84440.86900.87440.87960.83860.82960.85280.85620.8633
Dice0.87080.85860.87950.88340.87280.84990.84030.86130.87310.8558
Compound0.86770.88180.87960.88710.87800.85230.86310.86530.87680.8573
Table 3. Performance metrics of different loss functions across varying epochs on the PH2 dataset. The best scores are in bold. (Our model.)
Loss FunctionDSCmIoU
EpochEpoch
2040608010020406080100
BCE0.76970.90950.92330.89810.91900.72800.86800.89830.85870.8905
Tversky0.81830.87710.91490.89650.92320.79030.82660.87790.86300.8954
Dice0.75620.79790.93040.91460.91810.74260.71040.90330.88000.8803
Compound0.82650.89880.93410.91500.91060.79940.89960.90780.88460.8809
Disclaimer/Publisher’s Note: The statements, opinions and data contained in all publications are solely those of the individual author(s) and contributor(s) and not of MDPI and/or the editor(s). MDPI and/or the editor(s) disclaim responsibility for any injury to people or property resulting from any ideas, methods, instructions or products referred to in the content.