Design of Network Anomaly Detection Model Based on Graph Representation Learning
Abstract
1. Introduction
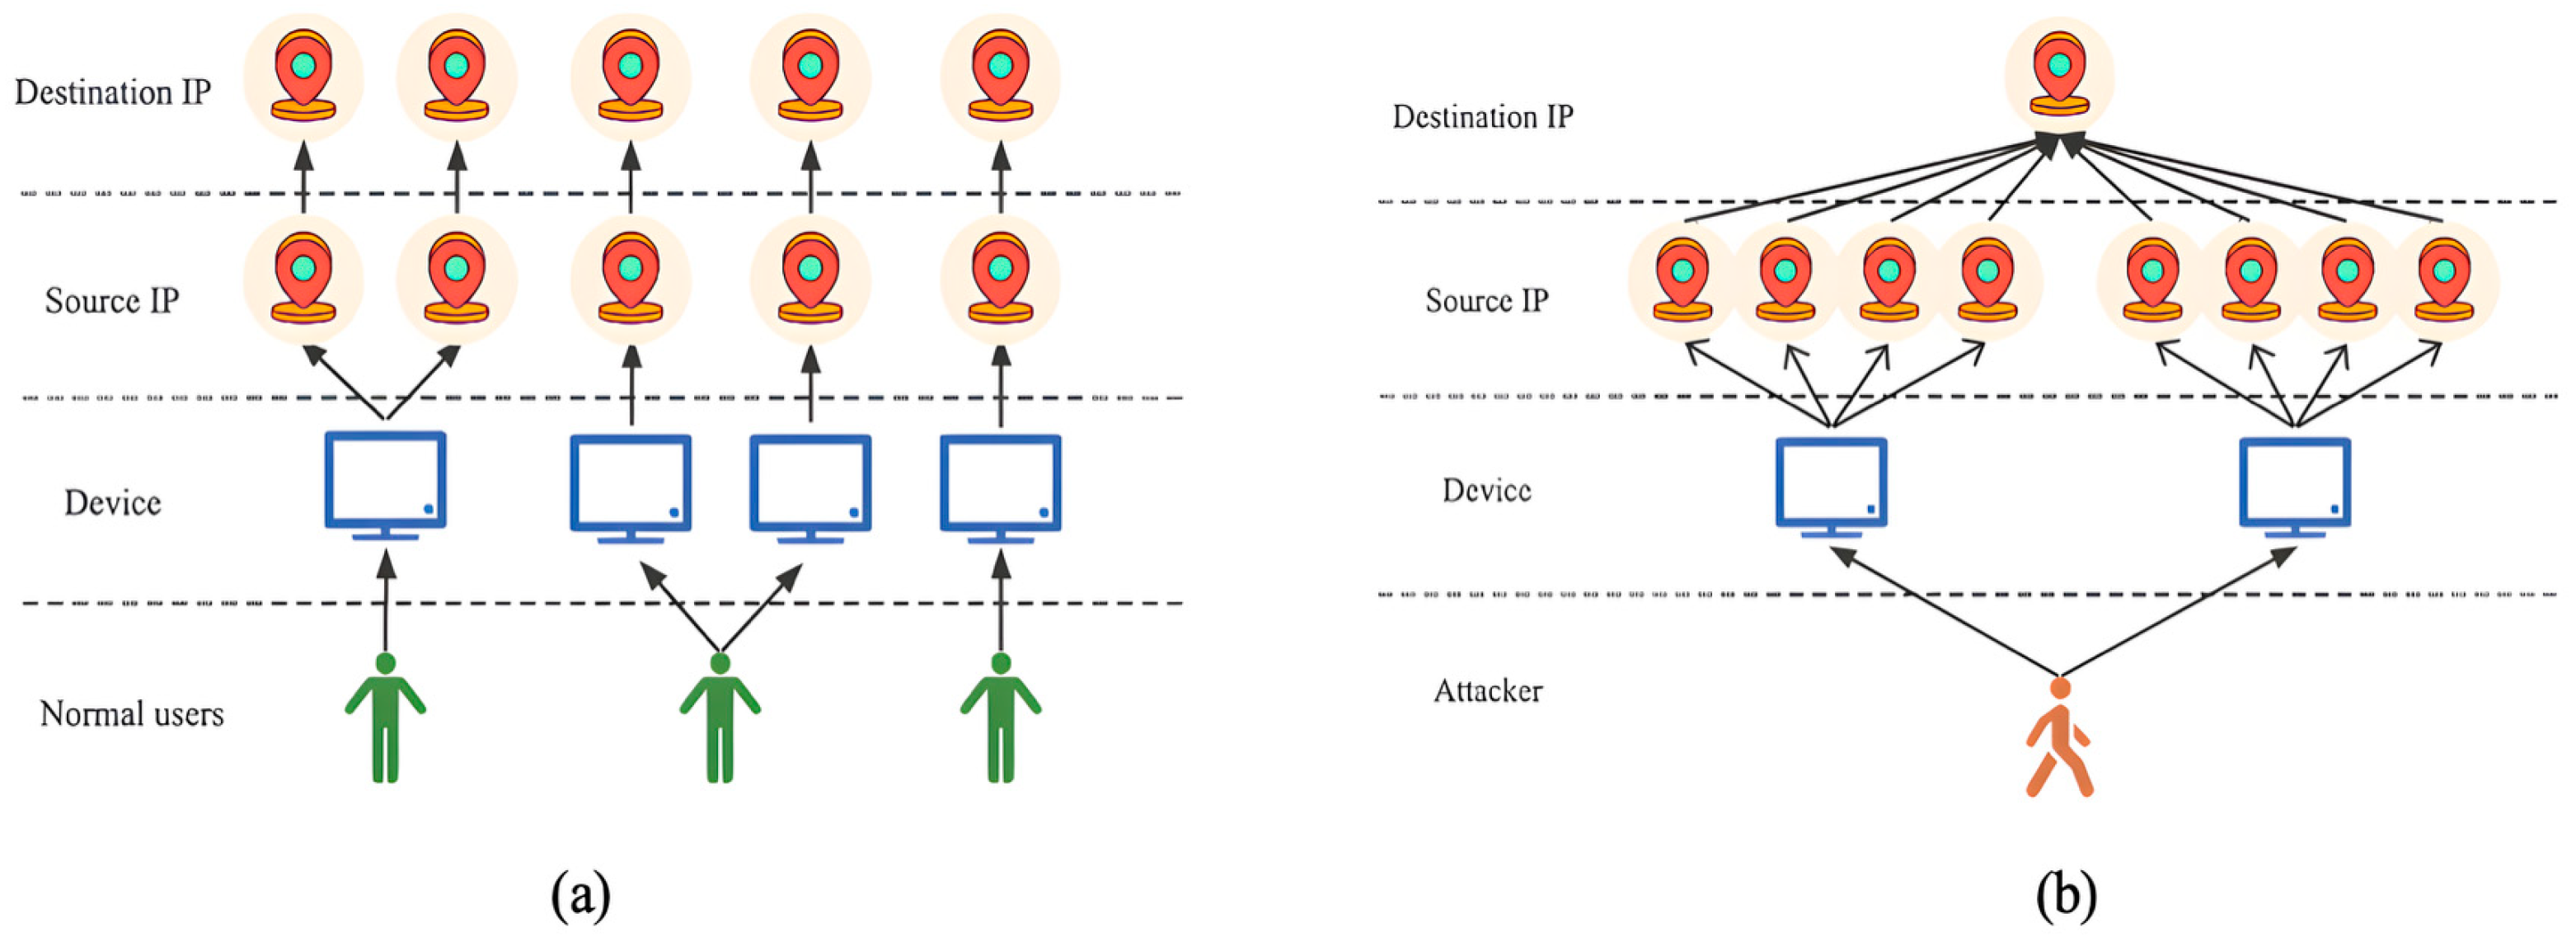
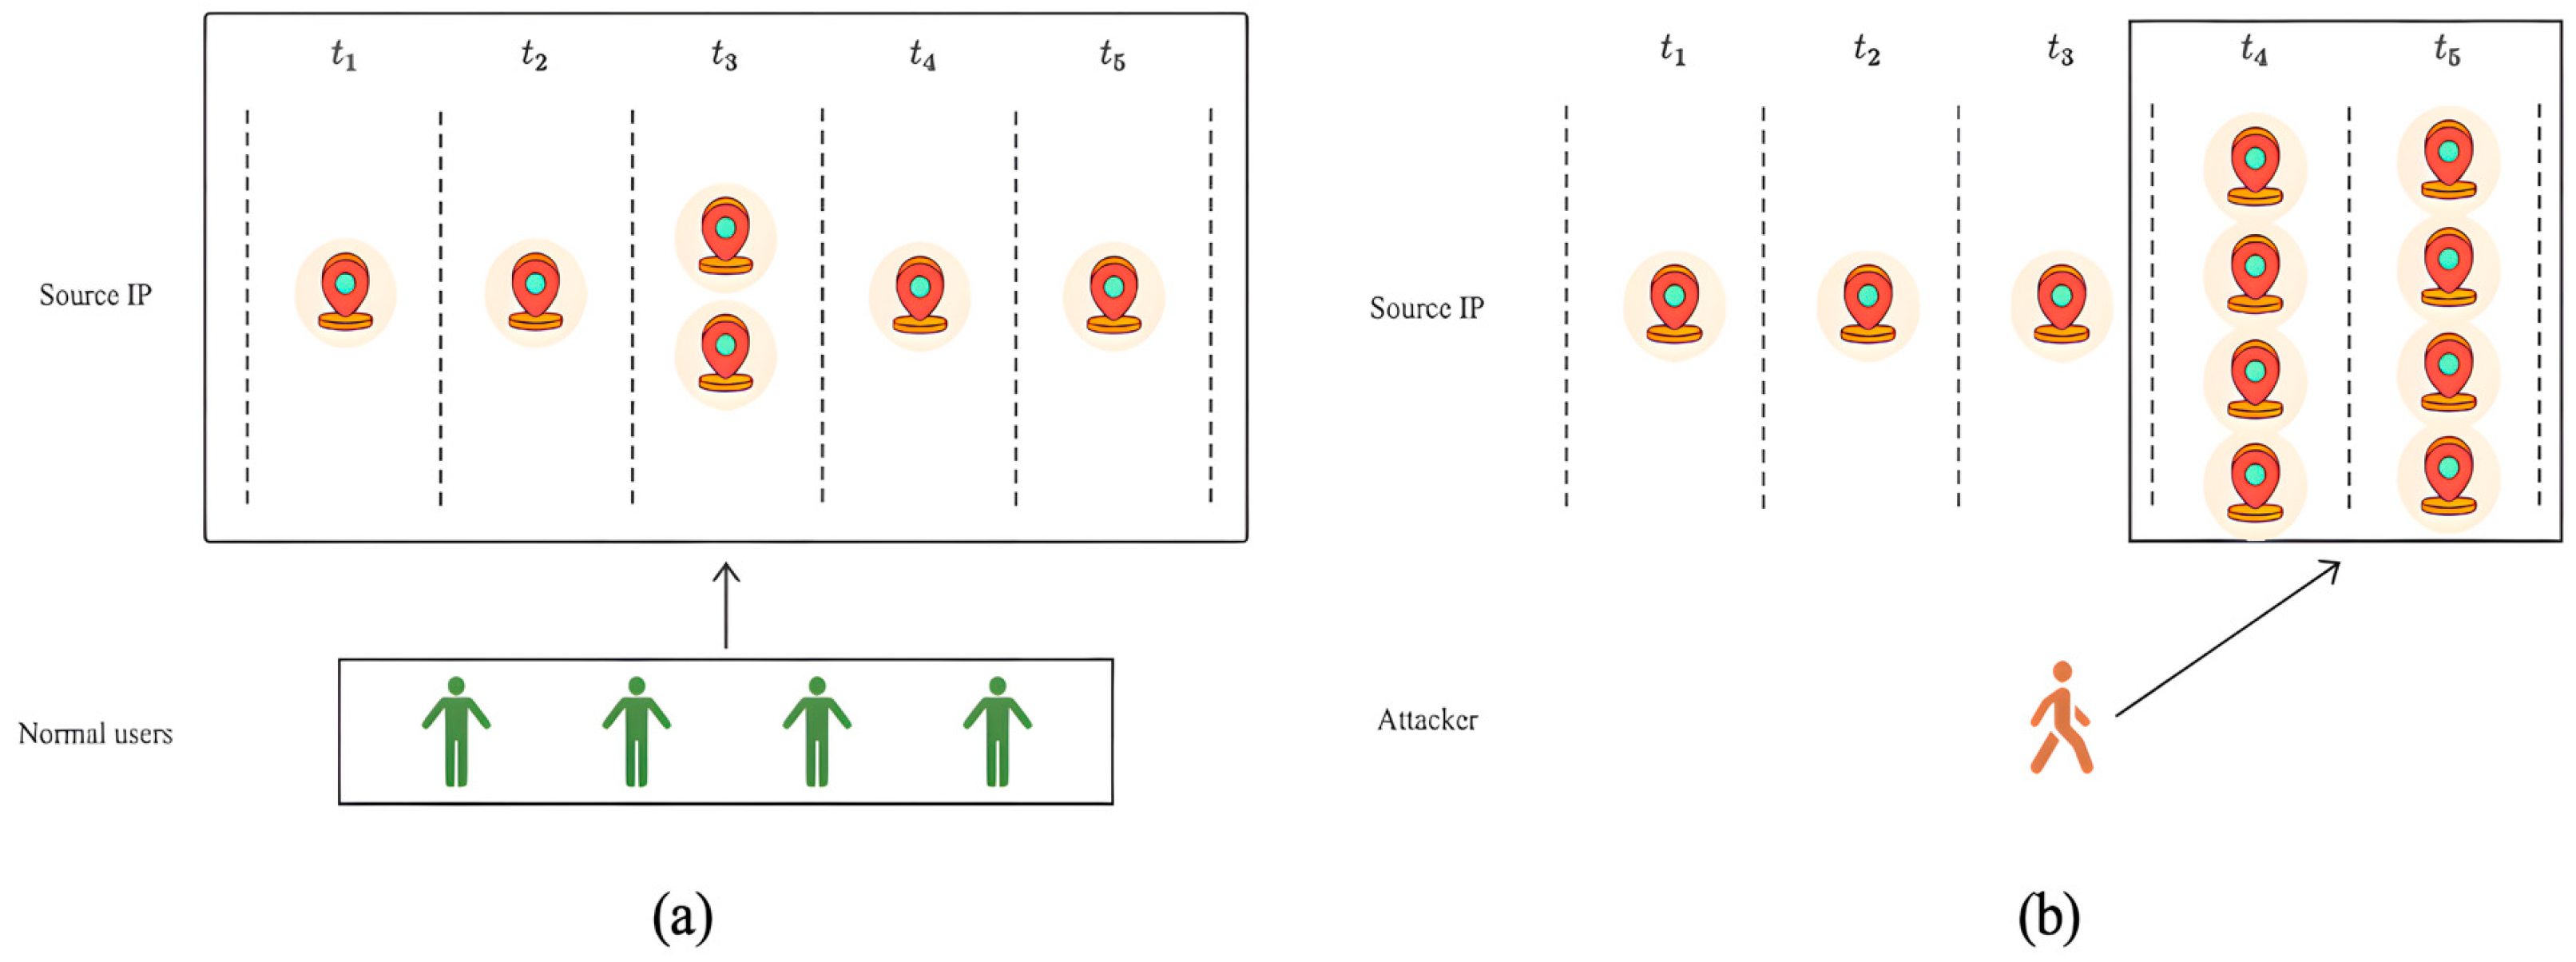
- Based on the identified characteristics of network anomalies, such as “device aggregation” and “activity aggregation” [7], and the main features generated by network traffic data, we propose a novel graph construction method that constructs event key time subgraphs on network traffic data. Unlike other graph construction methods, this method enables the aggregation of data with similar features and obtains a more compact, accurate, and comprehensive representation of data relationships and structural features. Moreover, this construction method reduces graph complexity and improves detection efficiency.
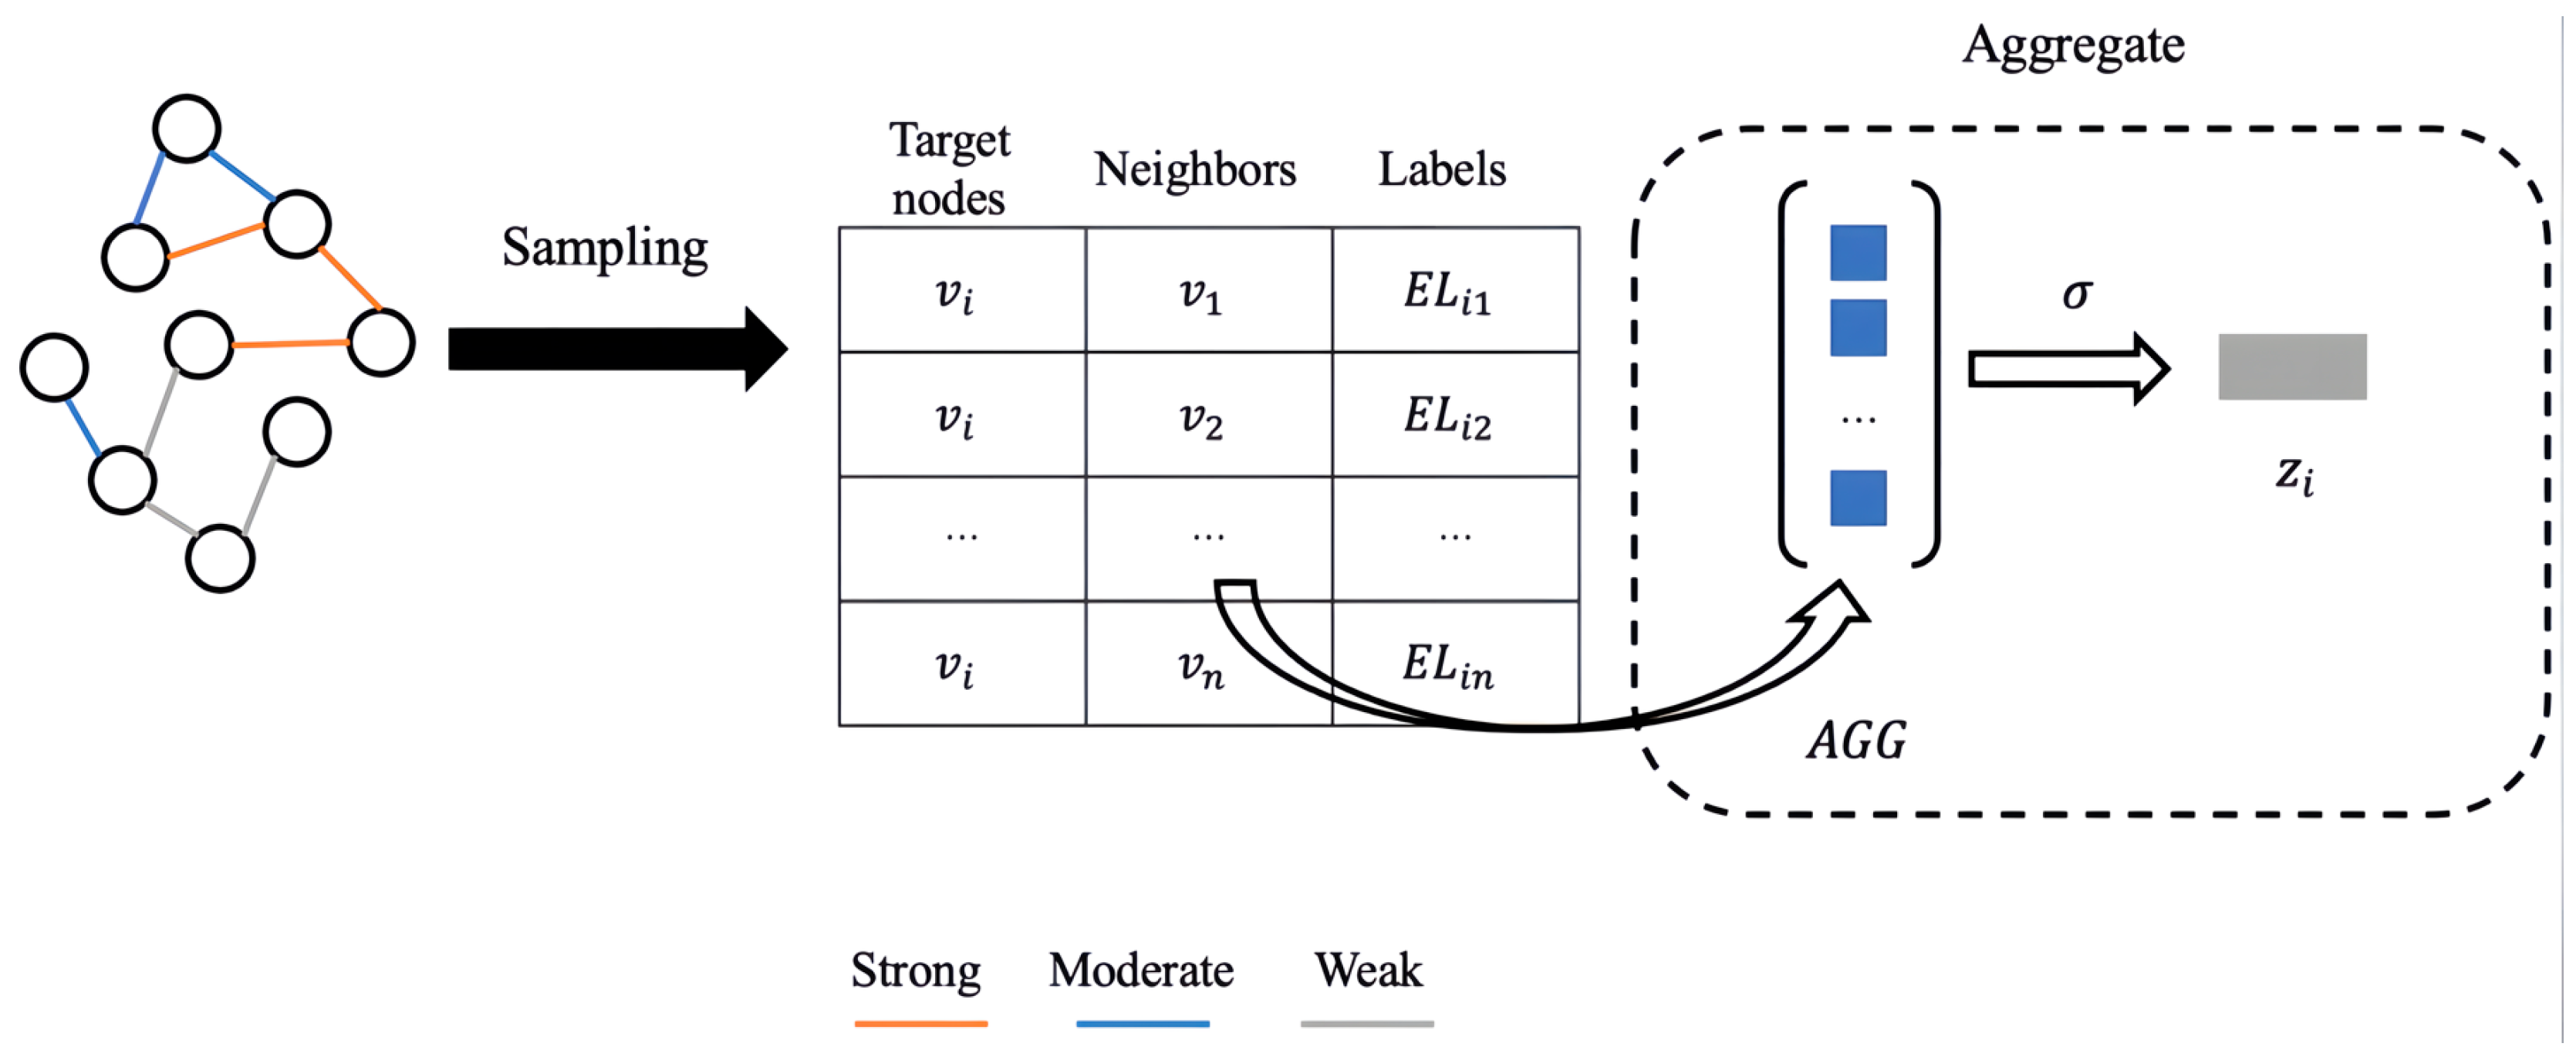
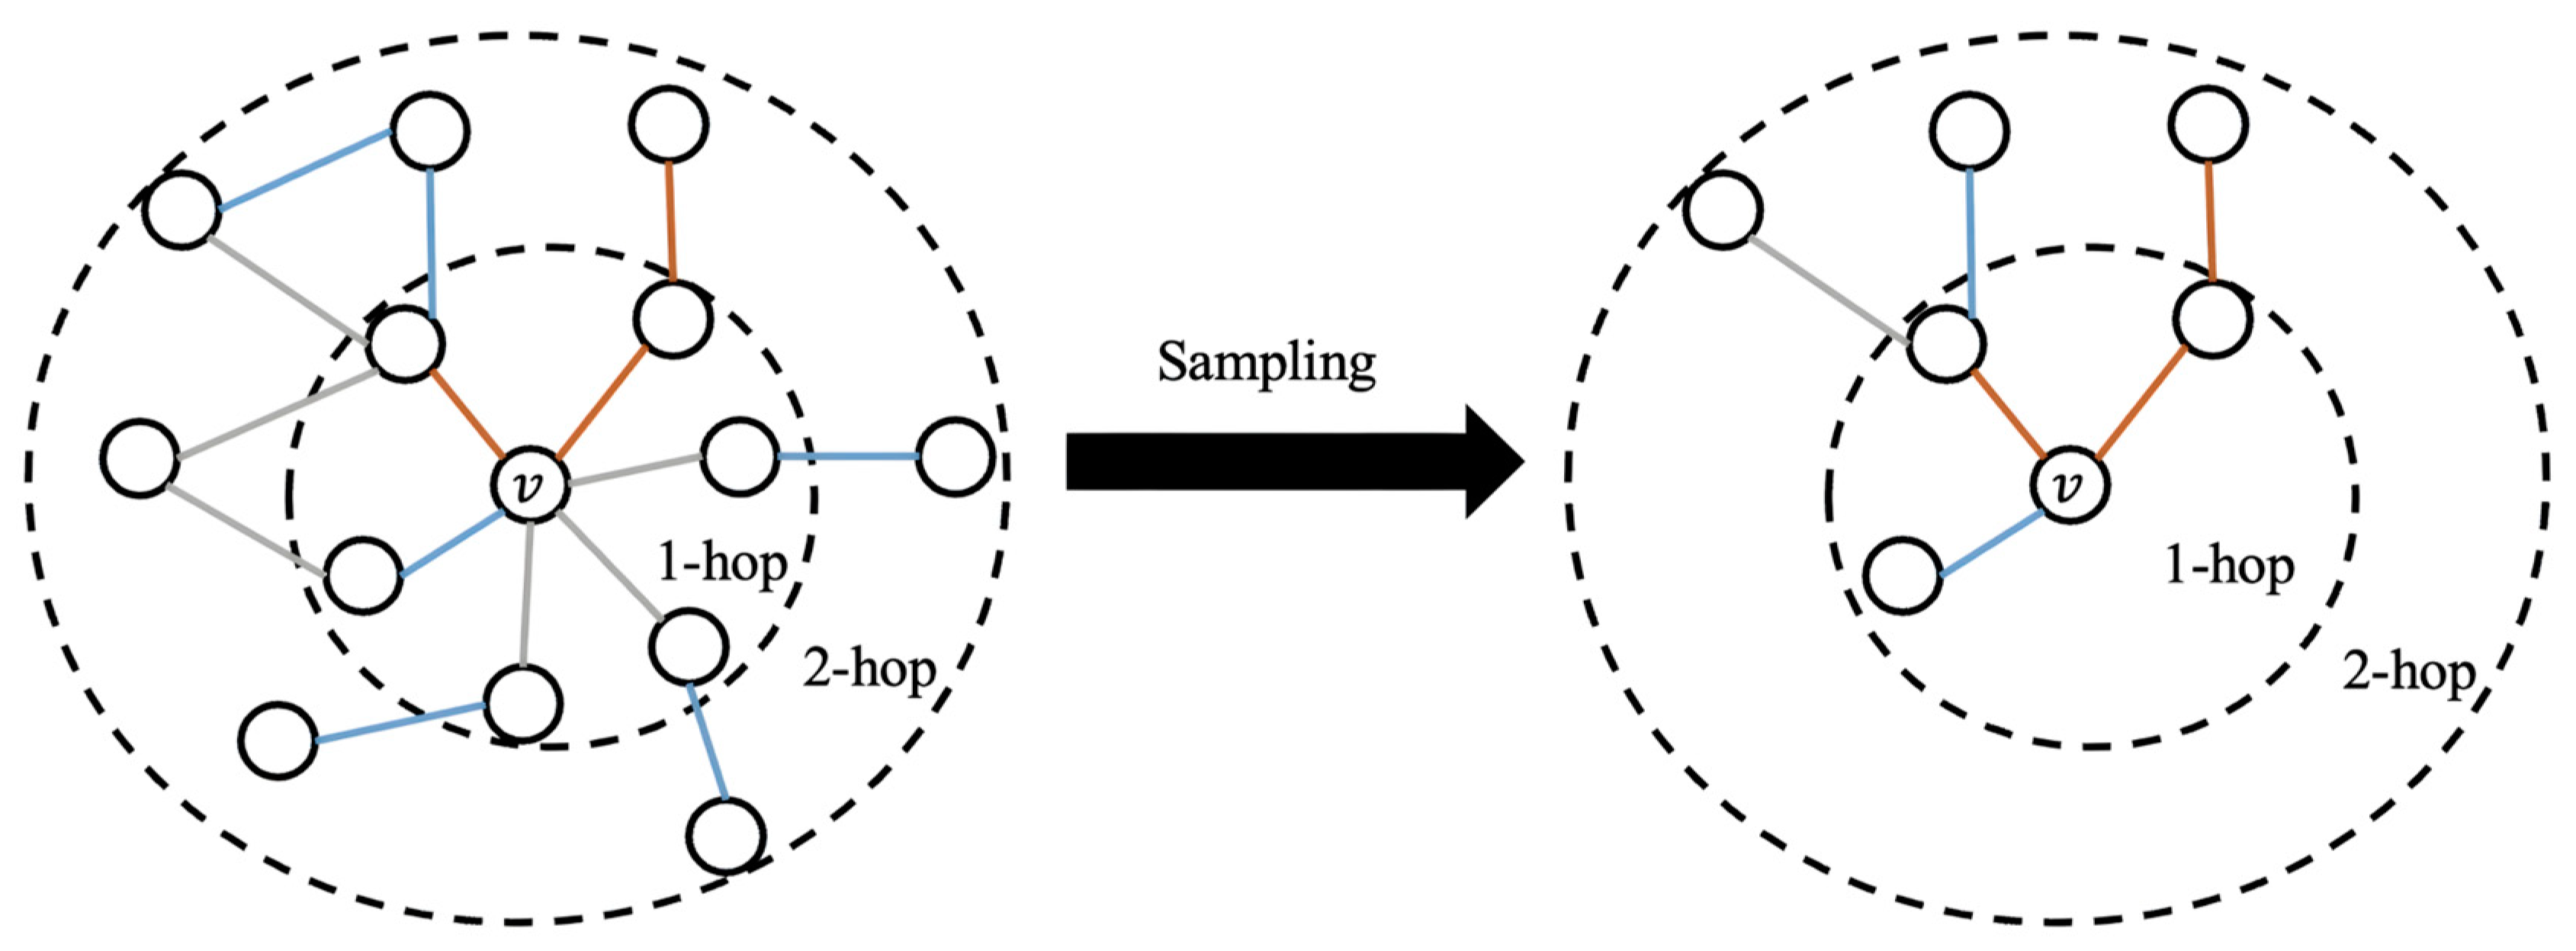
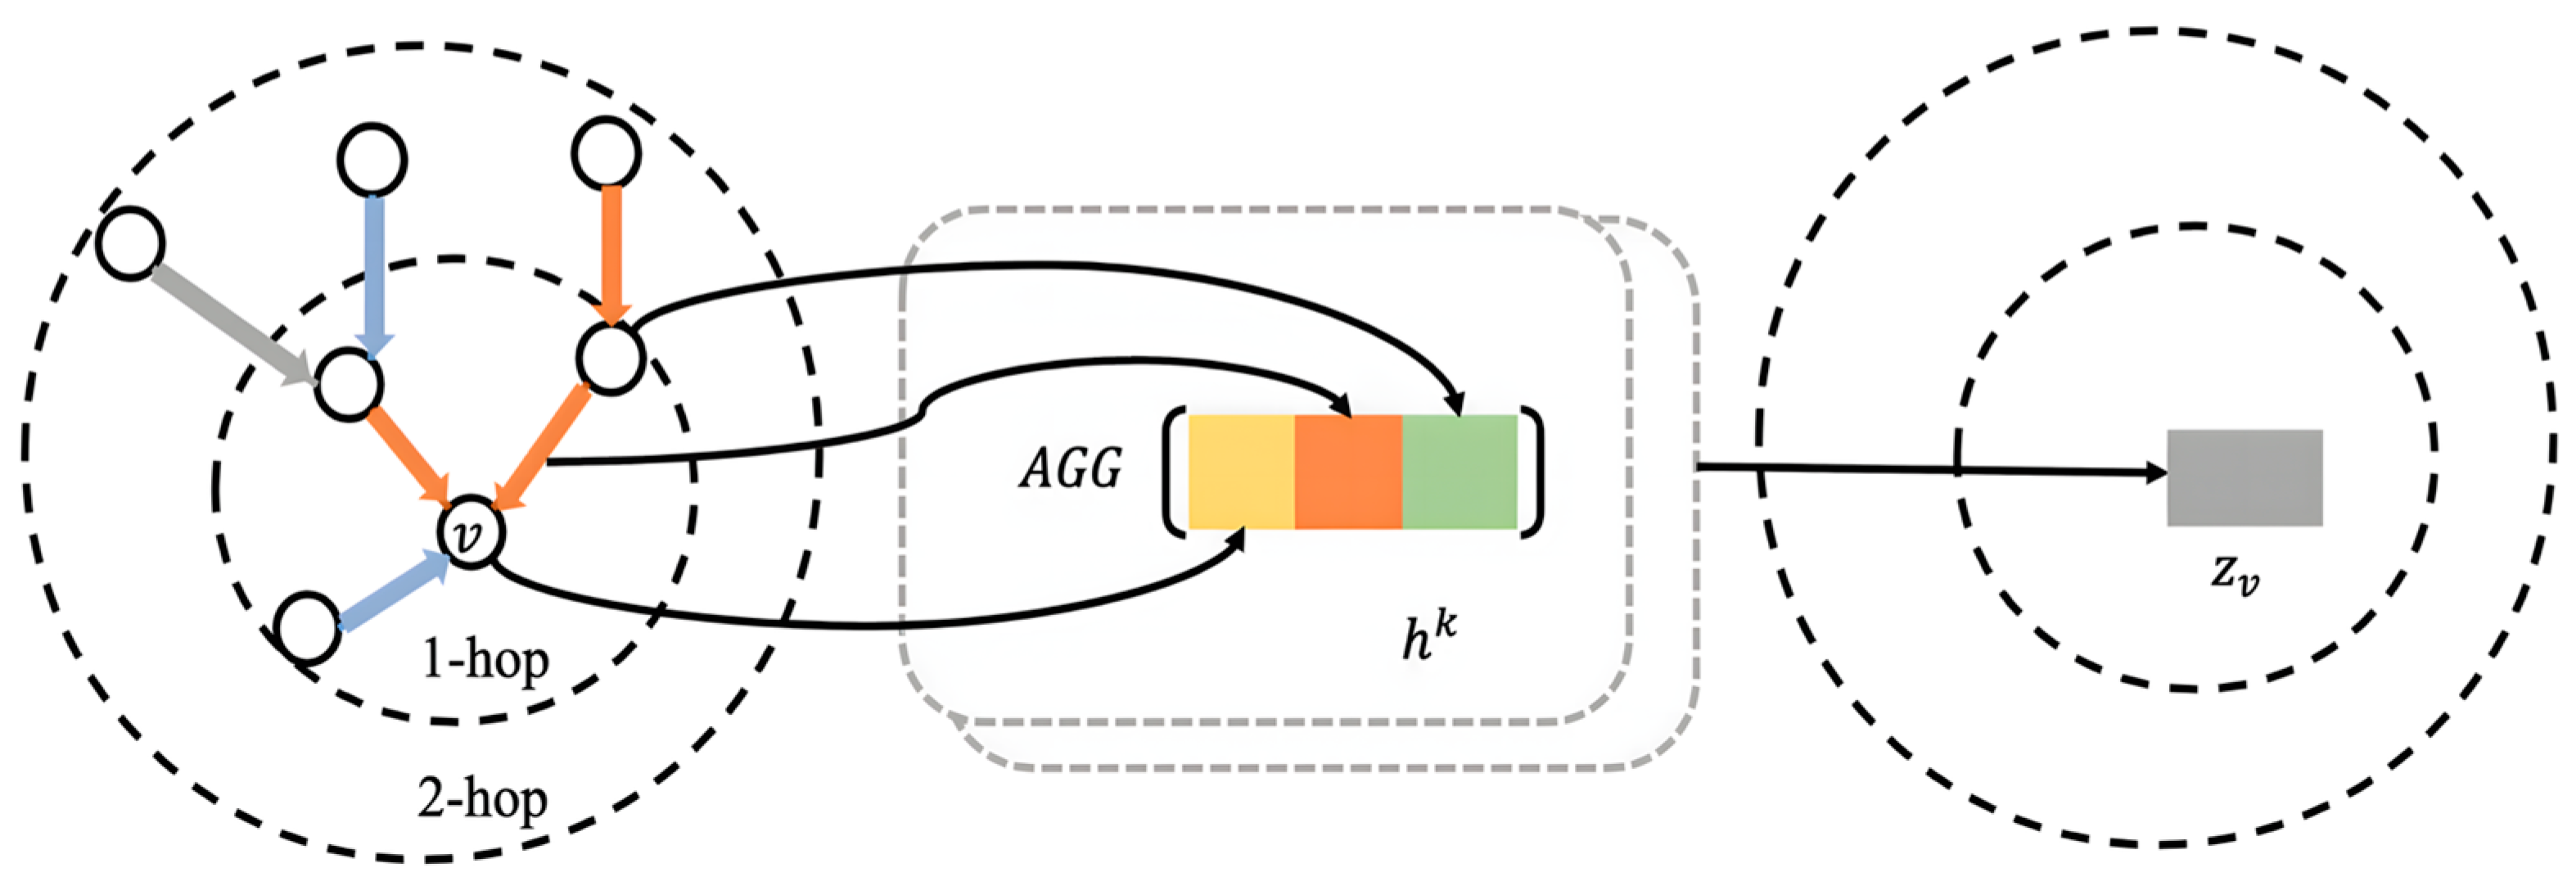
- We propose an edge enhancement sampling aggregation algorithm for representation learning on the constructed event key time subgraphs. The algorithm consists of two parts: the edge selection sampling algorithm and the edge enhancement aggregation algorithm. The edge selection sampling algorithm captures accurate correlation relationships between nodes and differential information among different edges. In the aggregation phase, the edge enhancement aggregation can obtain more comprehensive node feature representations without the need for multiple layers of aggregation or complex aggregation functions.
2. Related Work
3. Proposed Framework
3.1. Overview
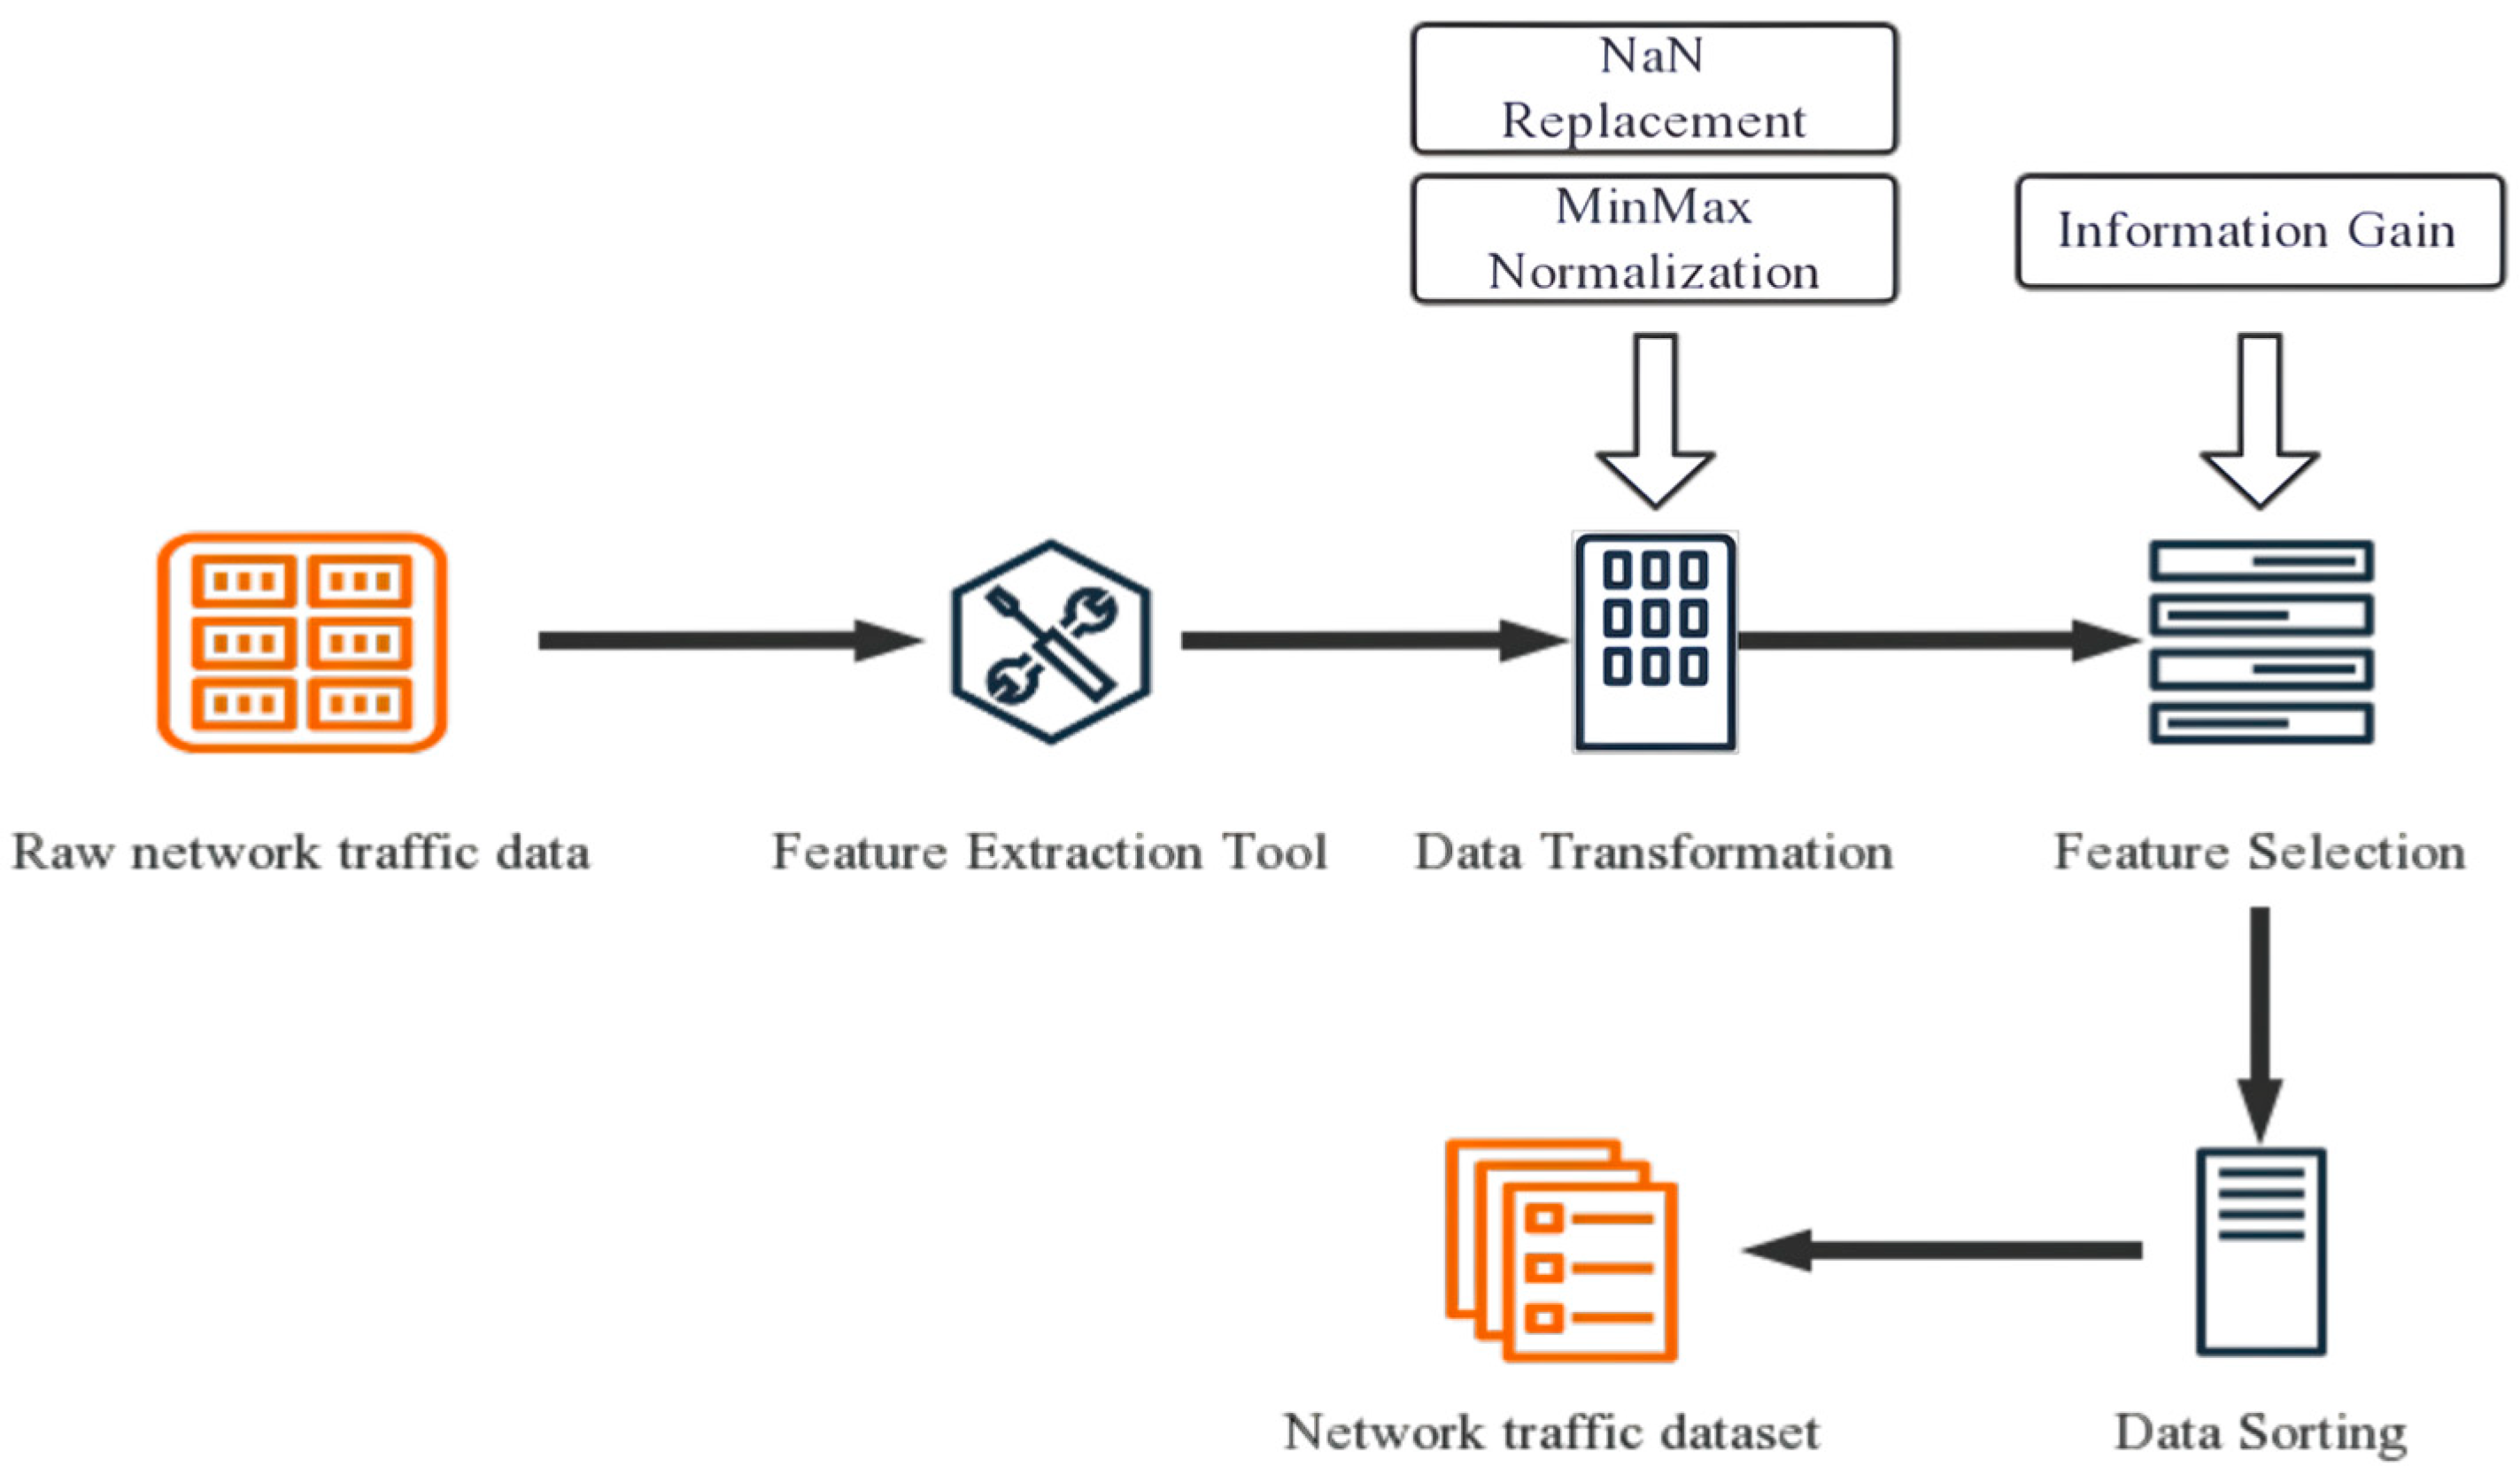
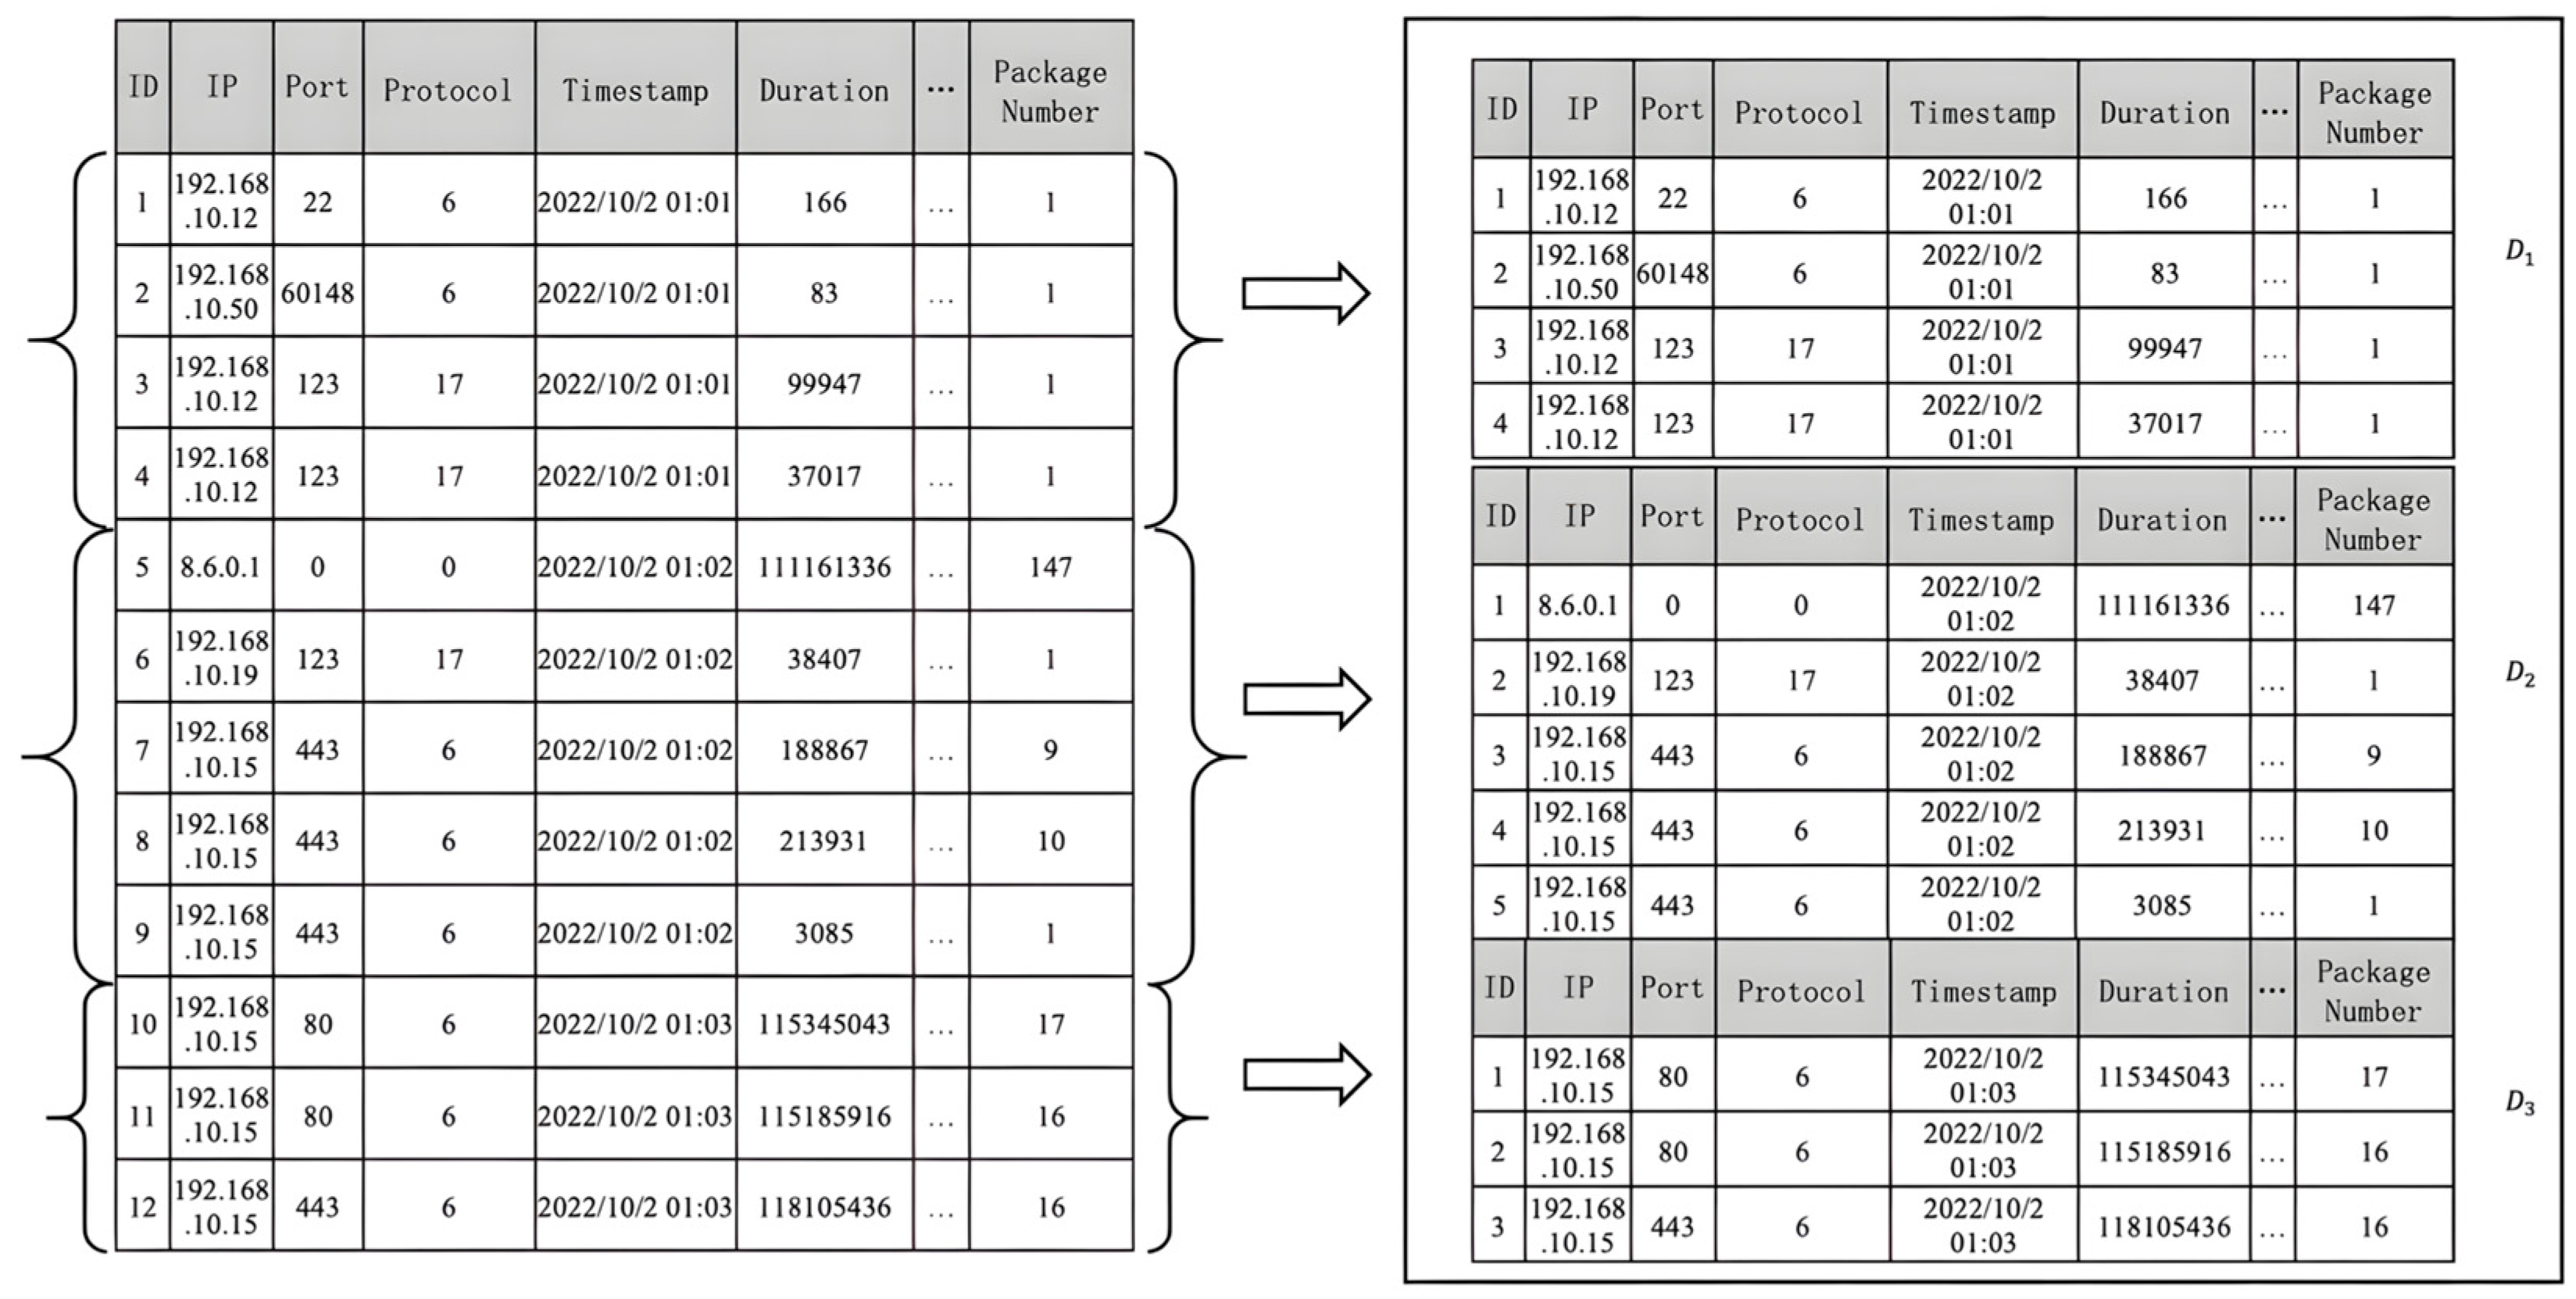
- Data Pre-processing: To address the issues of inconsistency and incompleteness in the original network data, our ETG-EESAGE model first performs data pre-processing, which includes data replacement, feature extraction, and selection. This process improves the quality of the data and enhances the efficiency of data analysis.
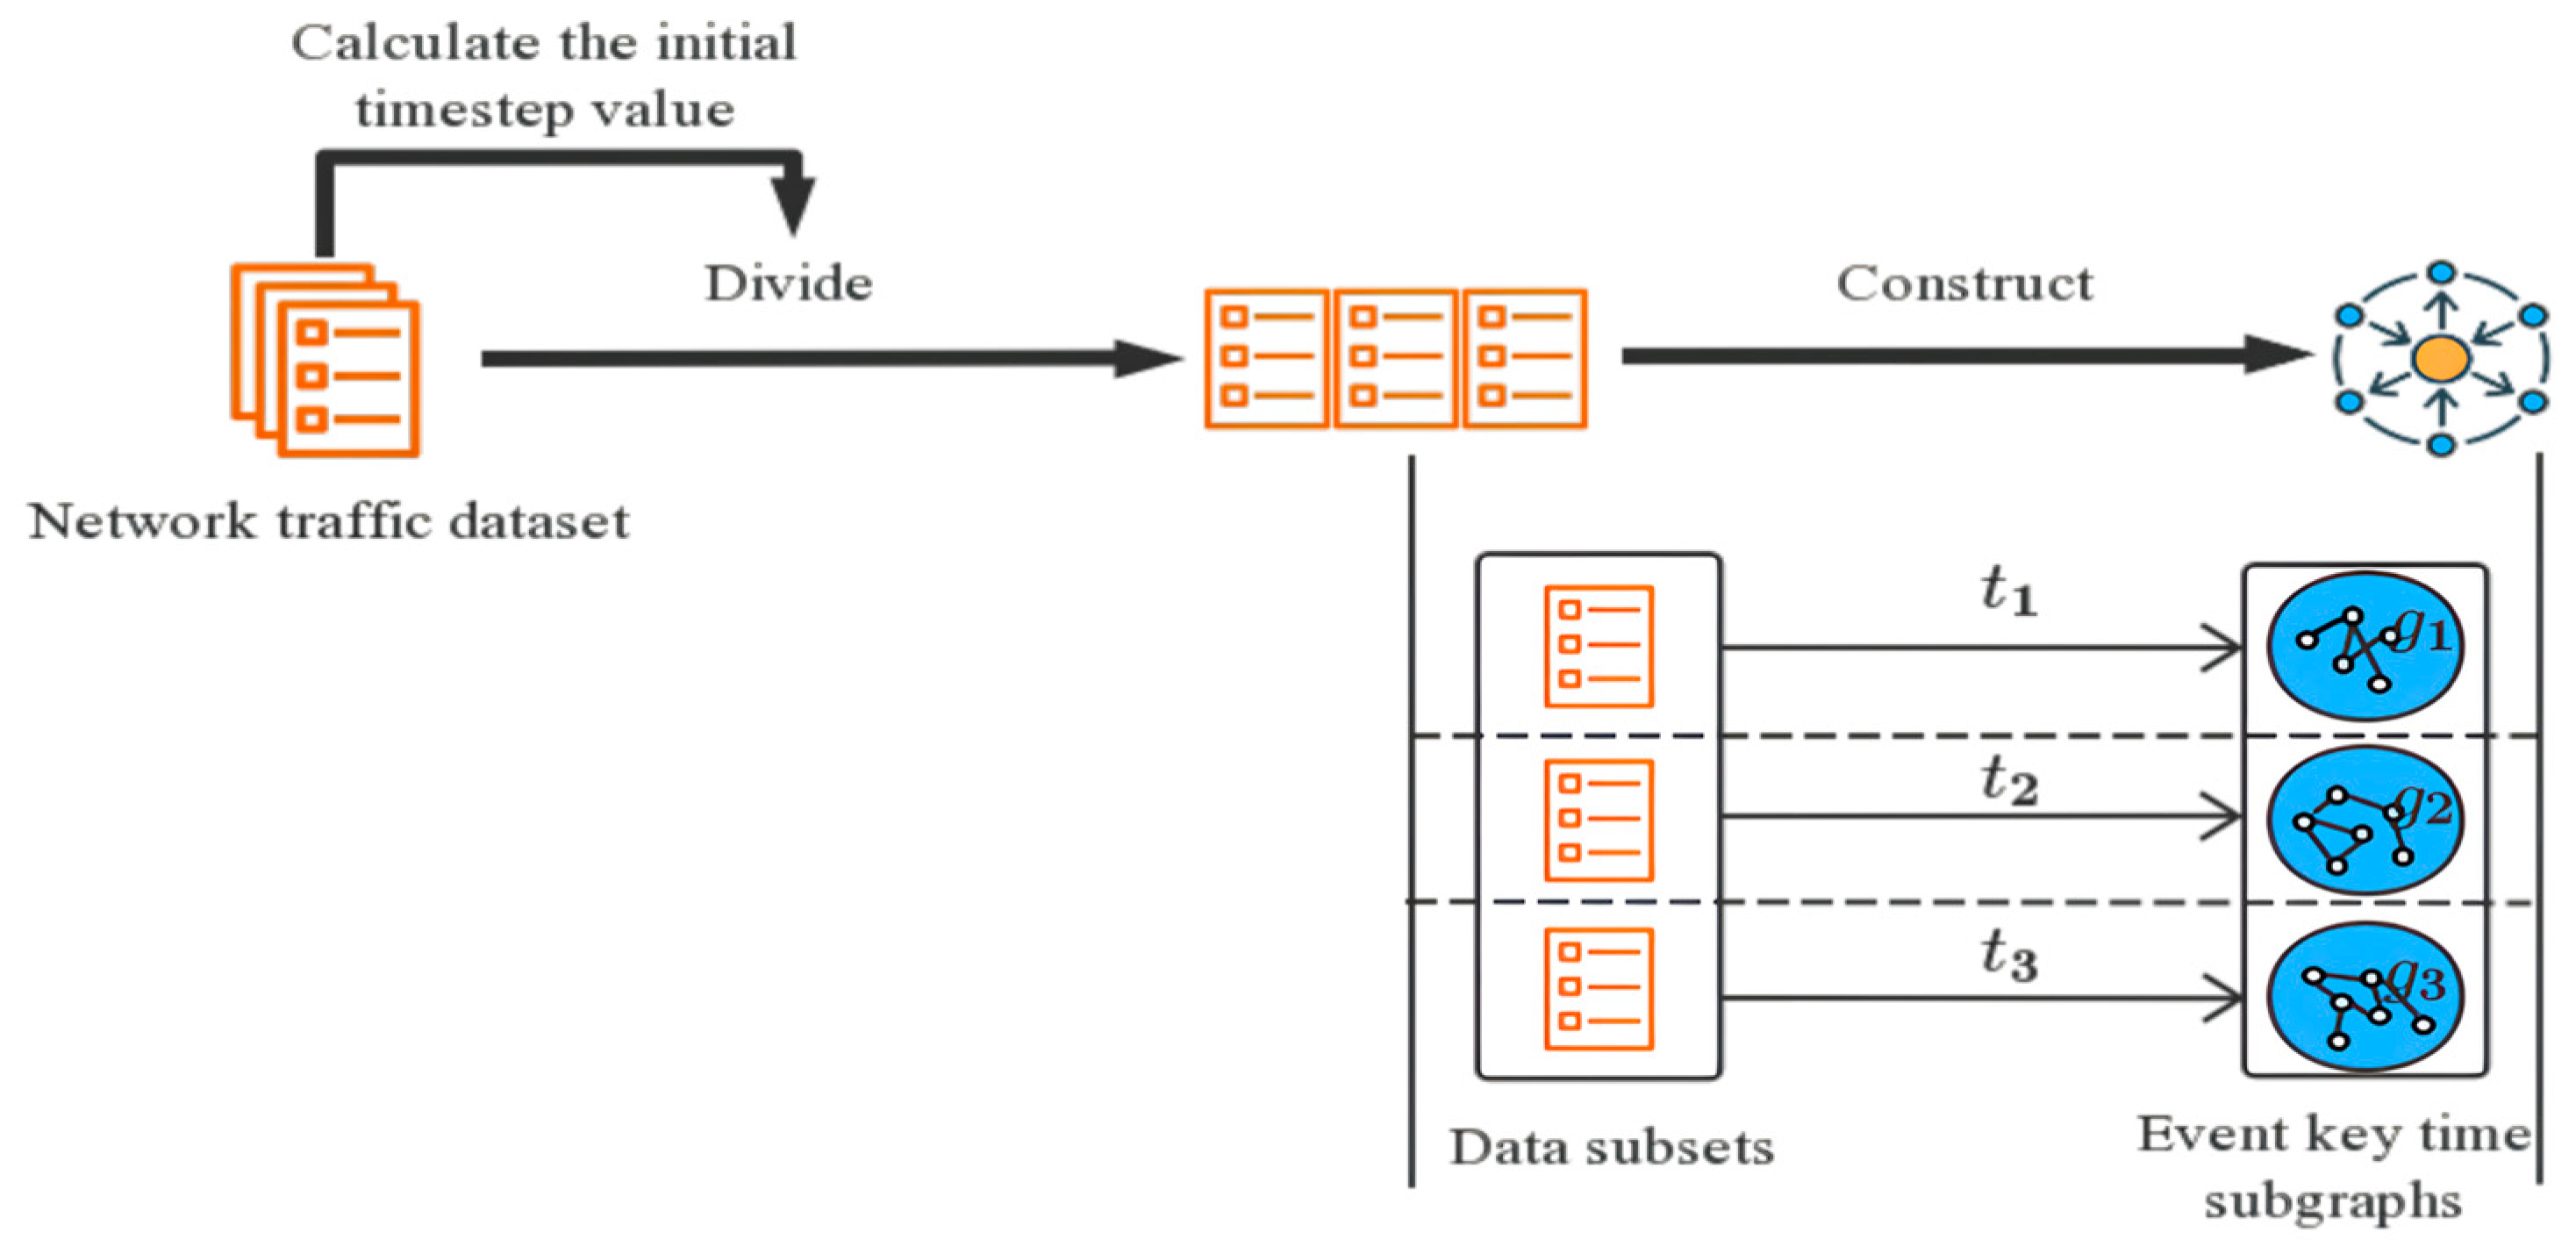
- ETG Construction: Based on the characteristics of network traffic data and network anomalies such as “device aggregation” and “activity aggregation”, the data is divided into subsets based on timestamp characteristics, resulting in several data sets within the same timestamp and across different periods. With this approach, we define a network event as a graph node and the different relationships between the nodes as edges to construct the event key time subgraph (ETG).
- EESAGE Algorithm: The Edge Enhancement Sampling Aggregation (EESAGE) algorithm has two main components: neighboring-edge selection sampling and neighboring-edge enhancement aggregation. In the neighboring-edge selection sampling algorithm, the neighboring nodes are first selected and sampled based on their correlation. In the neighboring-edge enhancement aggregation algorithm, the mean aggregation function is used to aggregate the node’s features, neighboring node features, and neighboring edge label features simultaneously. This process results in a more accurate and comprehensive node.
- Detection Algorithm: By setting a detection threshold, the model can determine whether the network event represented by the node is abnormal or not. This method allows for intuitive understanding and interpretation of the detection results and is applicable to various types of data.
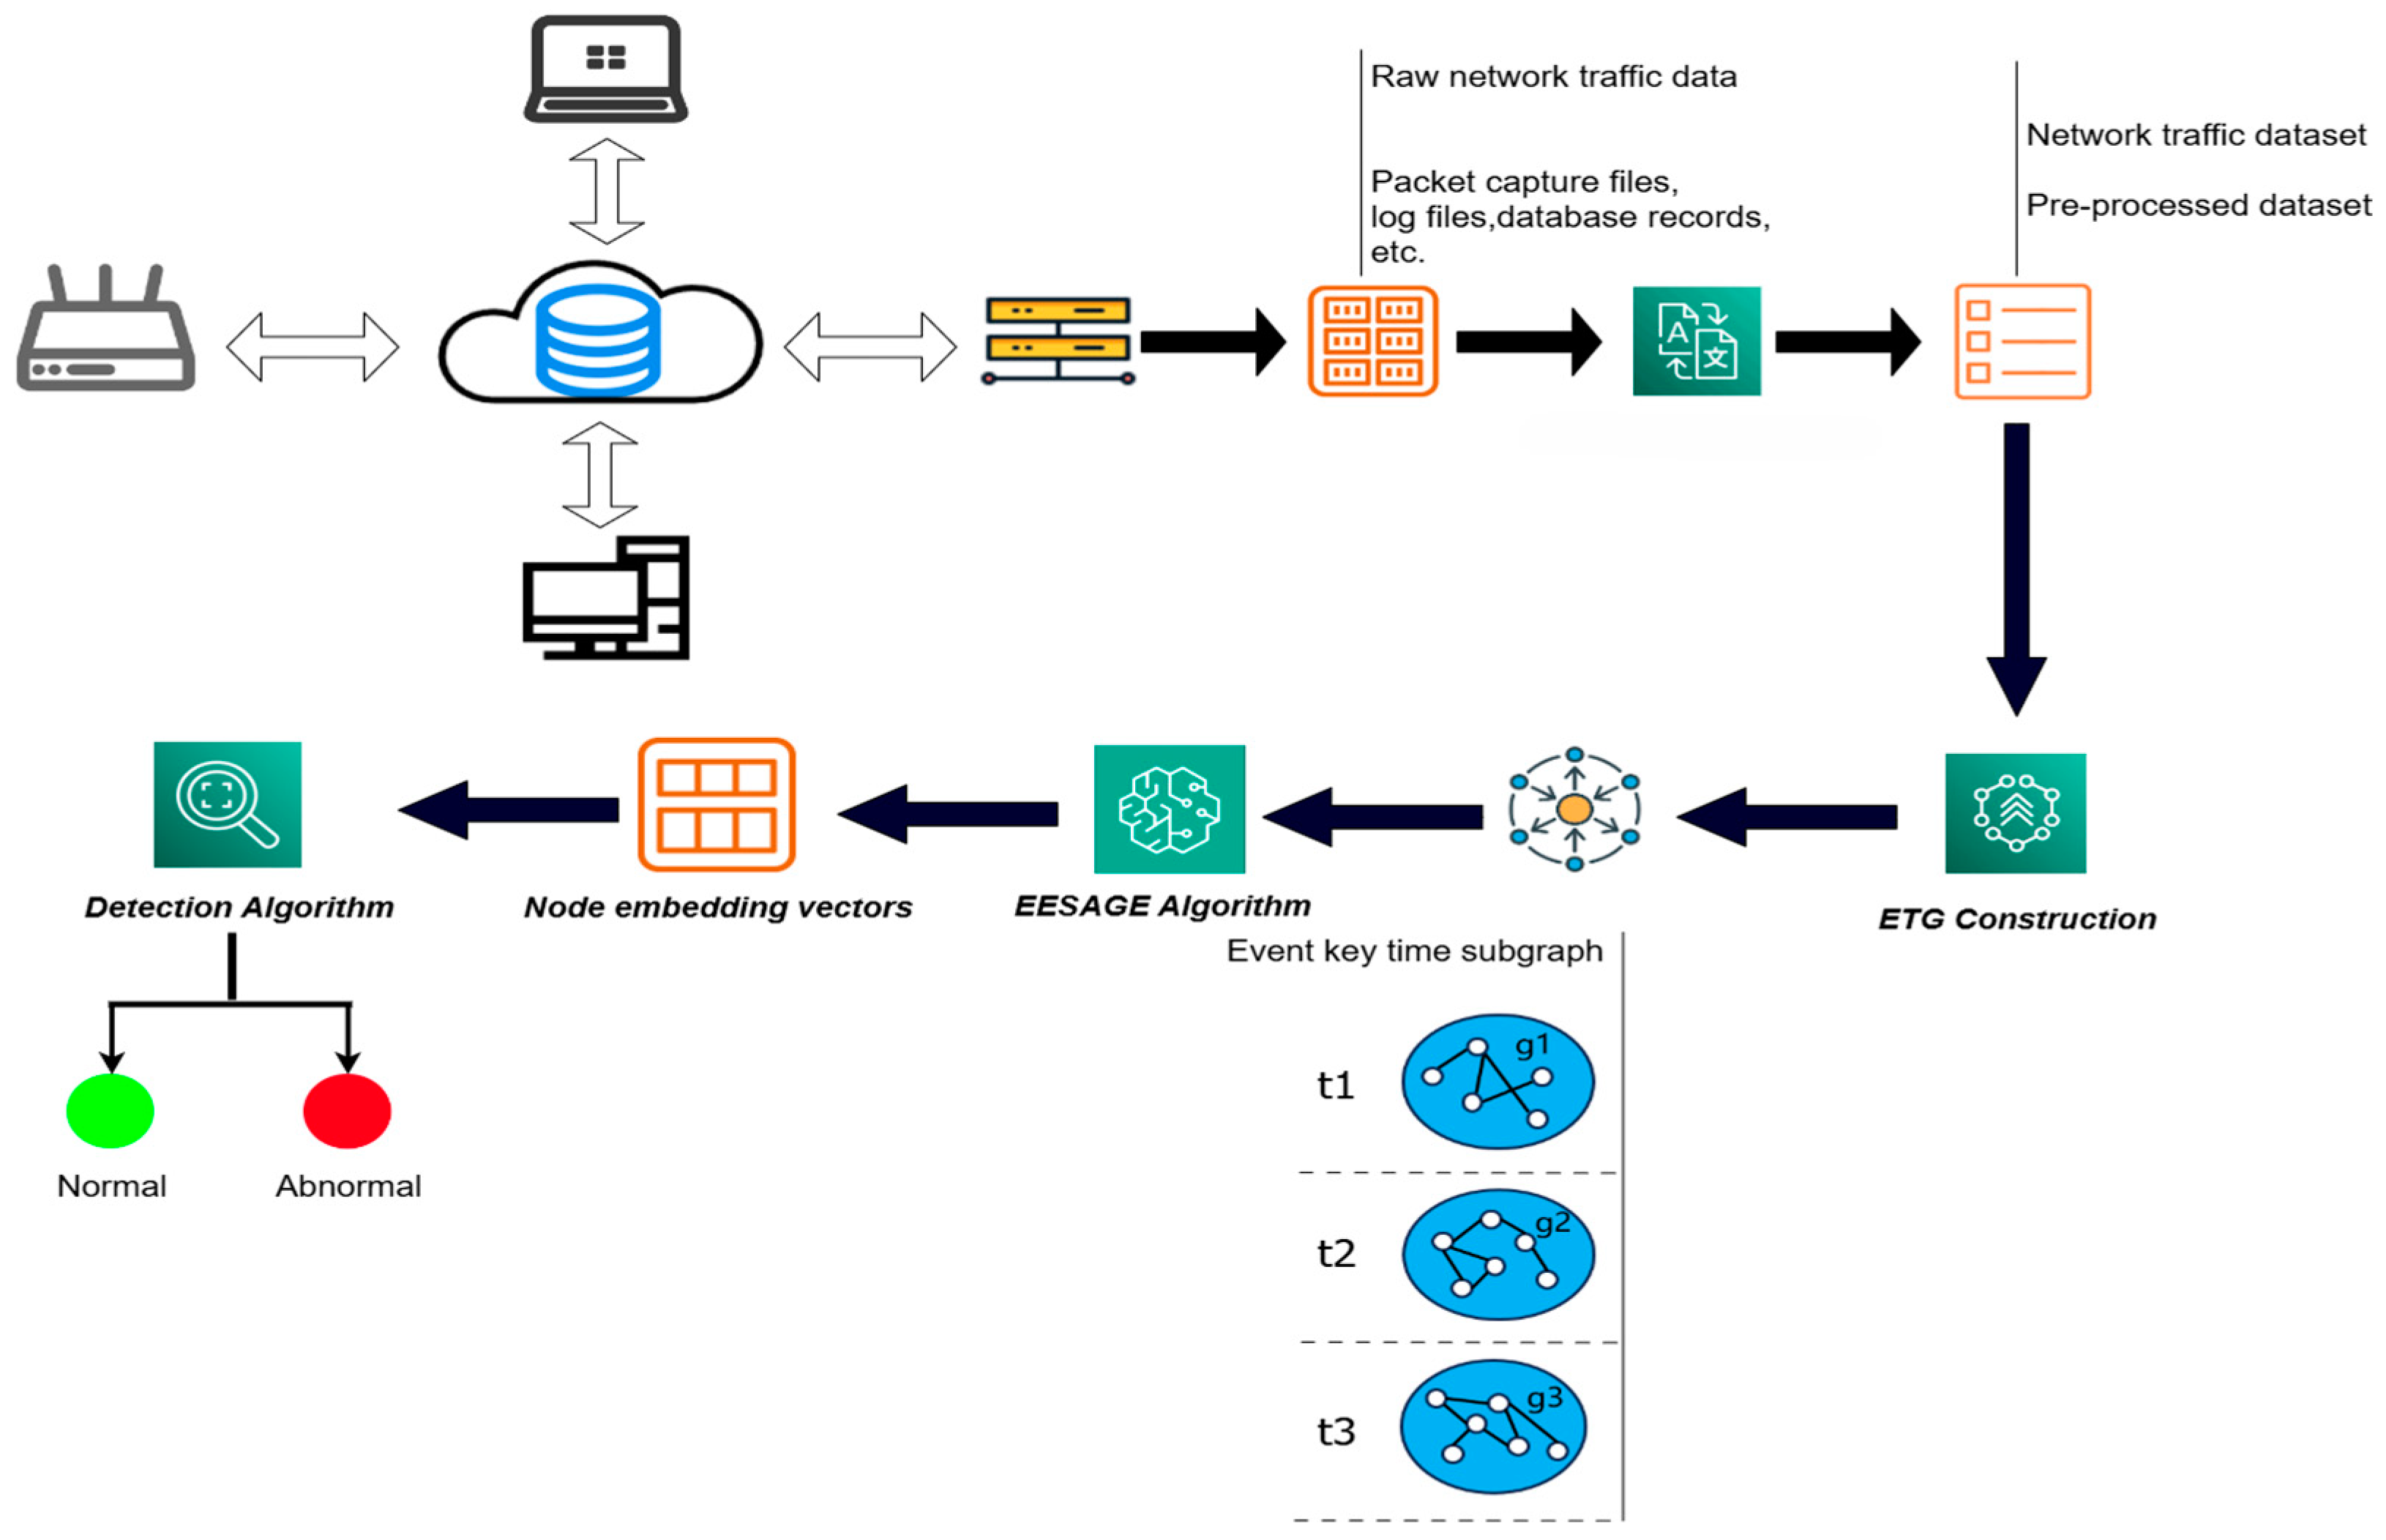
3.2. Data Pre-Processing
3.2.1. Workflow of Pre-Processing
3.2.2. Data Transformation
3.2.3. Feature Selection
3.3. ETG Construction
3.3.1. Construction Motivation
3.3.2. Calculate the Initial Timestamp Value
3.3.3. Divide Data Subsets
| Algorithm 1: Divide data subsets |
| Input: pre-processed dataset timestamp set ; timelen; timestamp; Output: data subsets ( 1: 2: 3: for do 4: if then 5: 6: else 7: 8: 9: end if 10: end for |
3.3.4. Rules of Graph Construction
- When multiple nodes exhibit frequent communication patterns using the same source IP address, source port number, destination IP address, destination port number, and protocol within the same time period, the correlation between these nodes is strong and highly suspicious.
- When multiple nodes frequently initiate communication over the same protocol but with different source IP addresses, source port numbers, and the same destination IP address and destination port number within the same time period, there is a possibility of “device aggregation”. In this case, the correlation between these nodes is weak but still suspicious.
- When multiple nodes use the same source IP address and source port number to frequently initiate communication to different destination IP addresses, destination port numbers, and different protocols within the same time period, this behavior may not be obvious, but should not be ignored. The correlation between these nodes is the weakest among the three scenarios.
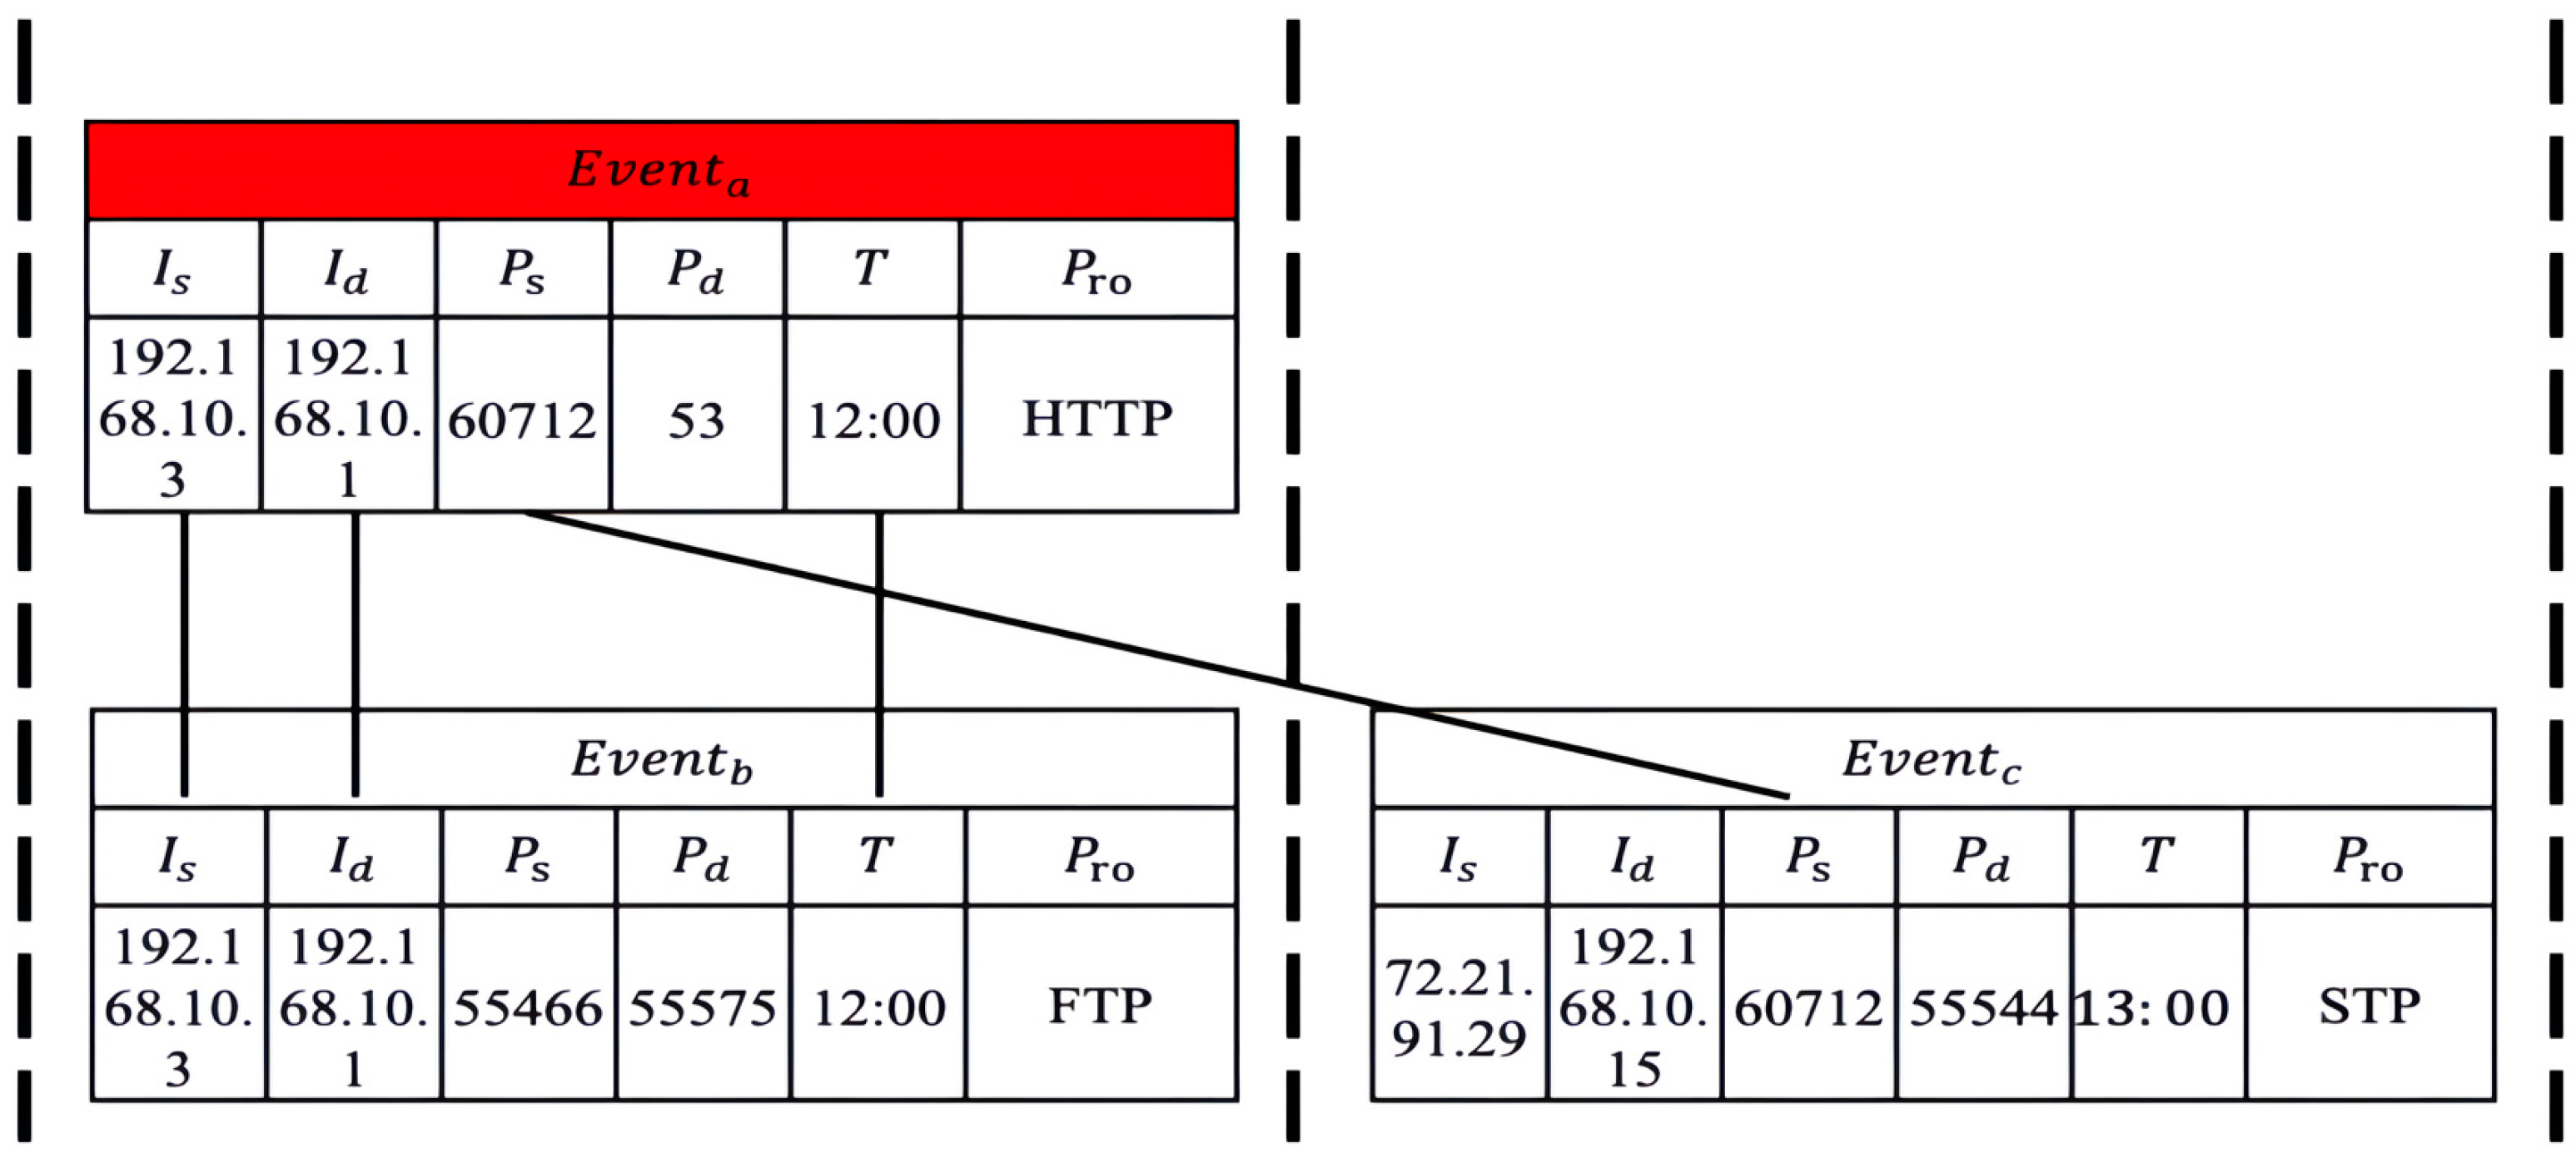
- Strong Correlation: two nodes have the same source IP address, source port number, target IP address, target port number, and protocol in the same time period.
- Moderate Correlation: two nodes have the same target IP address, target port number, and protocol in the same time period.
- Weak Correlation: two nodes have the same source IP address and source port number in the same time period.
- Determine if the two nodes are strongly correlated. If they do, they establish a “Strong Correlation” edge between them.
- If the nodes do not have a “Strong Correlation”, determine if they are moderately correlated. If they do, establish a “Moderate Correlation” edge relationship between them.
- If the nodes do not have a “Moderate Correlation”, determine if they are weakly correlated. If they do, establish a “Weak Correlation” edge relationship between them.
- If none of the above conditions are met, there is no correlation between the nodes, and no edge relationship is established.
3.4. EESAGE Algorithm
3.4.1. Neighboring-Edge Selection Sampling Algorithm
| Algorithm 2: Neighboring-edge selection sampling algorithm |
| Input: node set ; neighboring edge labels dictionary ; sampling number ; Output: neighborhood for node ; neighboring edge labels matrix ; 1: for do 2: for do 3: ; 4: for do 5: if ( < ) then 6: ; 7: ; 8: else 9: break (); 10: end if 11: end for 12: end for 13: end for |
3.4.2. Neighboring-Edge Enhancement Aggregation Algorithm
| Algorithm 3: Neighboring-edge enhancement aggregation algorithm |
| Input: node set ; node features ; neighborhood for node ; aggregation depth ; aggregation function ; weight matrix ; activation function ; Output: embedding vector ; 1: 2: for . do 3: for do 4: ; 5: ; 6: ; 7: end for 8: ; 9: end for 10: ; |
3.5. Detection Algorithm
4. Experiments
4.1. Dataset
4.2. Experimental Setting
- (1)
- Traditional machine learning methods: KNN, RF, CART, Adaboost, QDA, which rely on feature engineering and serve as classical baselines. These algorithms are widely used in network anomaly detection literature and provide benchmarks to evaluate the improvement brought by deep and graph-based models.
- (2)
- Deep learning and hybrid optimization methods: including models combining LSTM, attention mechanisms, or meta-heuristic algorithms such as SSA and H2GWO. They are selected because they represent state-of-the-art approaches that can capture temporal dependencies and complex nonlinear patterns in network traffic data.
- (3)
- Graph-based anomaly detection models: including recent works such as the hyperbolic embedding GNN and the continual-learning-based EL-GNN, which are chosen to assess performance in capturing relational and structural dependencies inherent in network traffic.
4.3. Results and Discussion
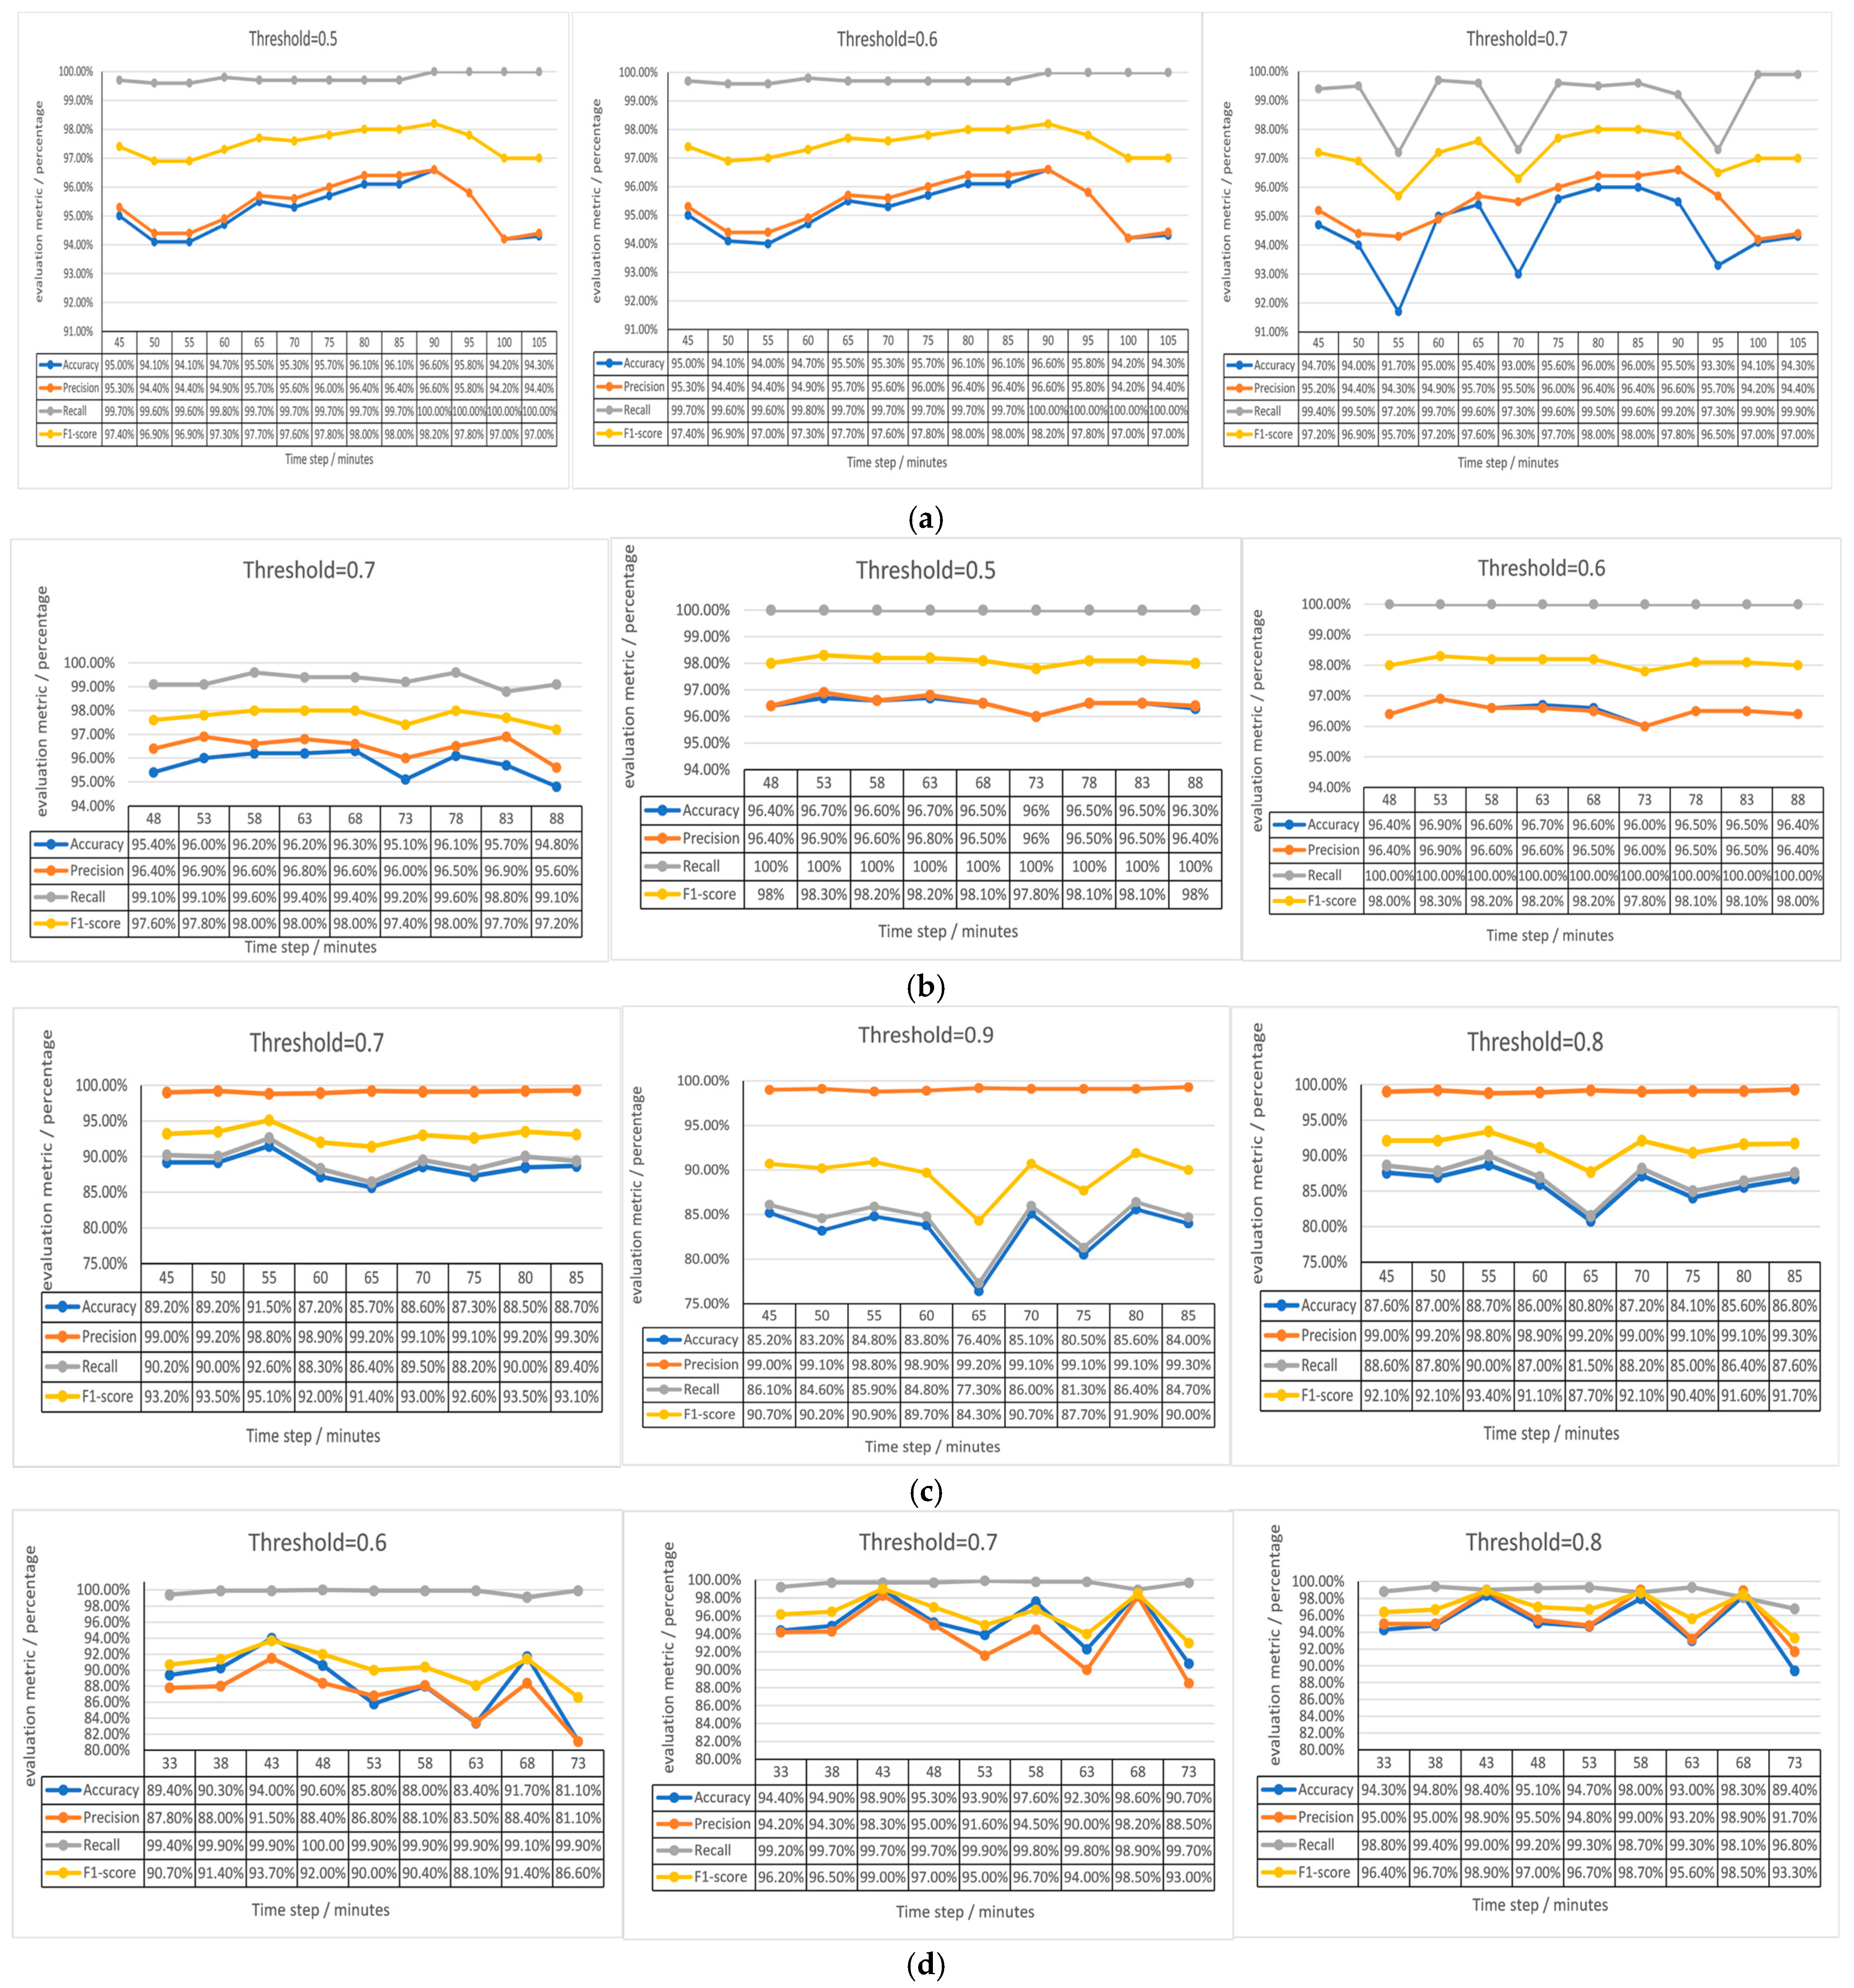
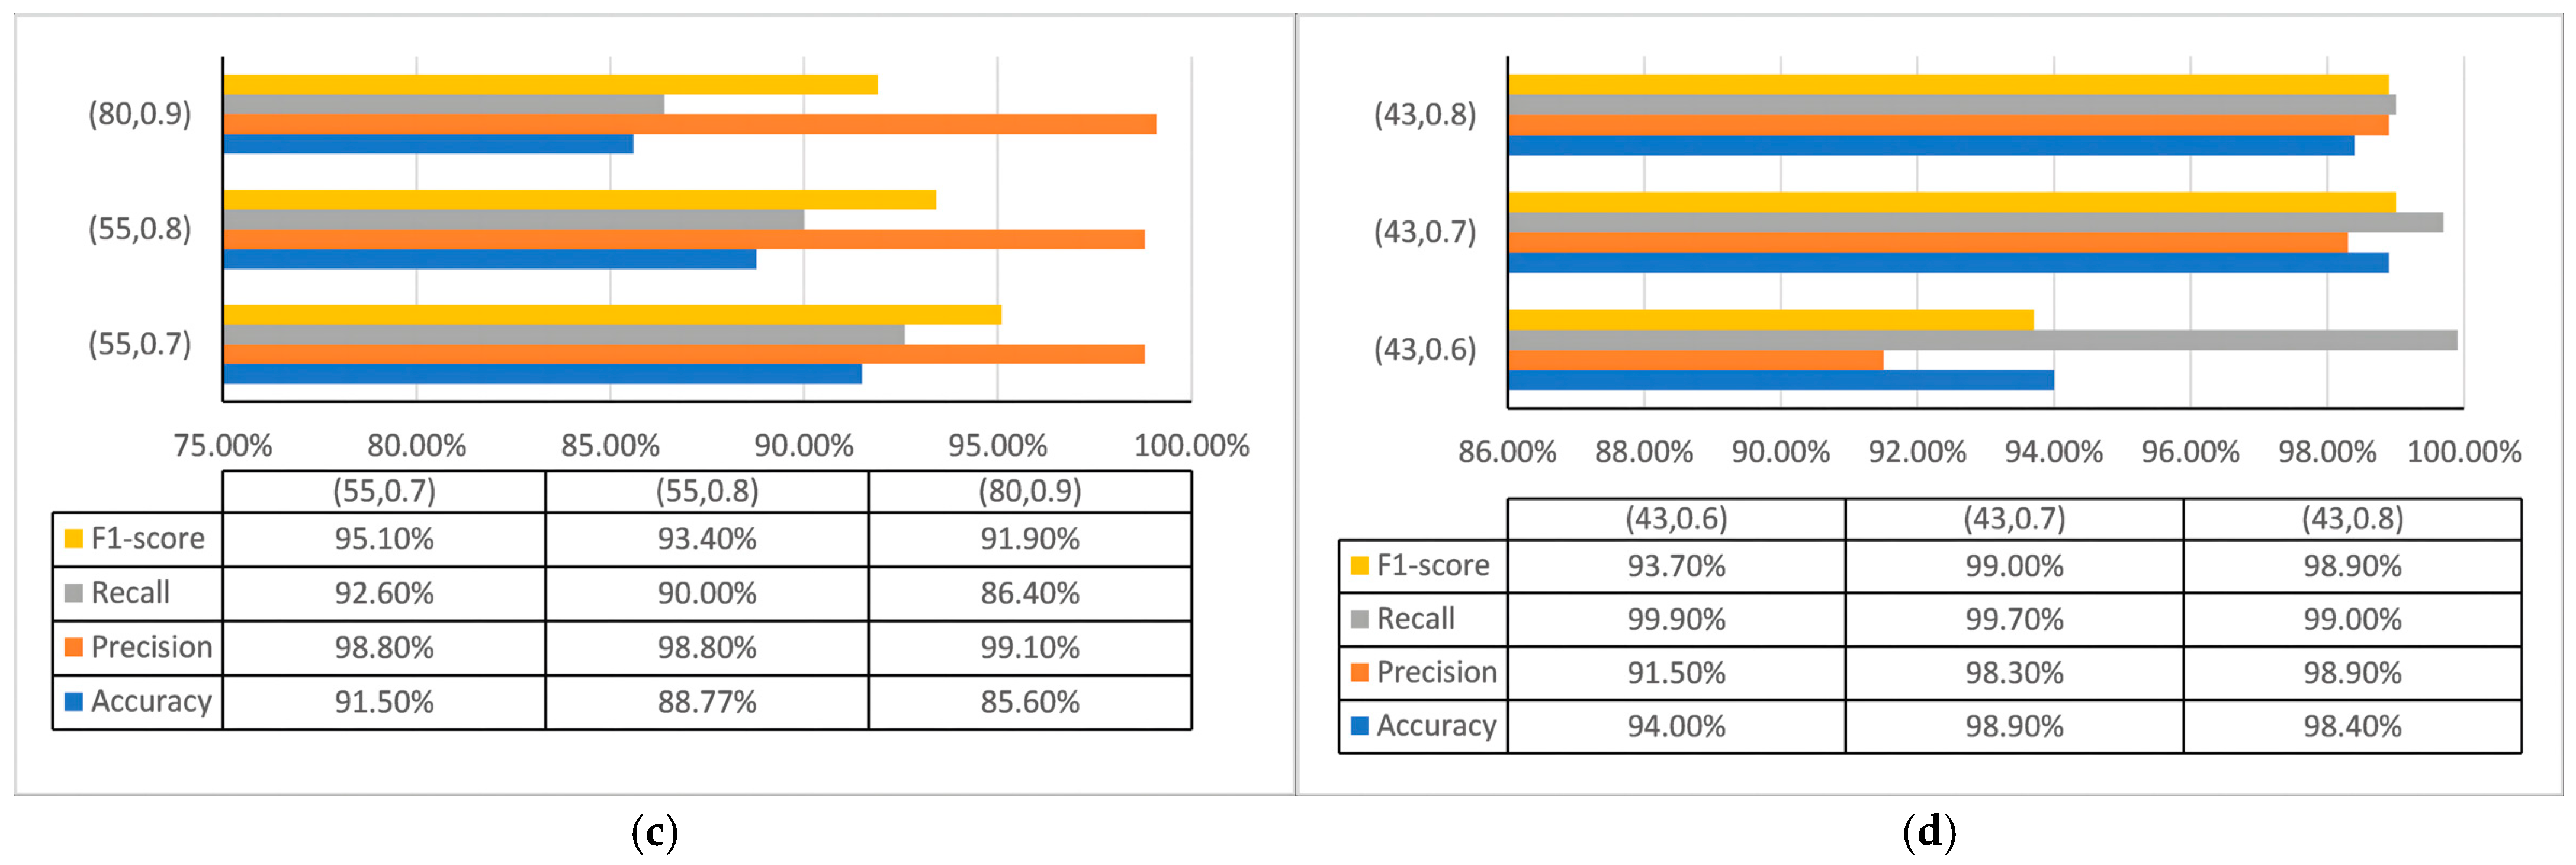
4.4. Sensitivity and Robustness Analysis of the Detection Threshold
4.5. Compared with Other Algorithms
5. Conclusions and Future Work
Author Contributions
Funding
Data Availability Statement
Conflicts of Interest
References
- Chandola, V.; Banerjee, A.; Kumar, V. Anomaly Detection: A Survey. ACM Comput. Surv. 2009, 41, 15. [Google Scholar] [CrossRef]
- Hawkins, D.M. Identification of Outliers; Springer: Berlin/Heidelberg, Germany, 1980; Volume 11. [Google Scholar]
- Liu, L.; Chen, B.; Qu, B.; He, L.; Qiu, X. Data Driven Modeling of Continuous Time Information Diffusion in Social Networks. In Proceedings of the 2017 IEEE Second International Conference on Data Science in Cyberspace (DSC), Shenzhen, China, 26–29 June 2017; IEEE: New York, NY, USA, 2017; pp. 655–660. [Google Scholar]
- Khalil, I.; Yu, T.; Guan, B. Discovering Malicious Domains through Passive DNS Data Graph Analysis. In Proceedings of the 11th ACM on Asia Conference on Computer and Communications Security, Xi’an, China, 30 May–3 June 2016; pp. 663–674. [Google Scholar]
- Qu, B.; Li, C.; Van Mieghem, P.; Wang, H. Ranking of Nodal Infection Probability in Susceptible-Infected-Susceptible Epidemic. Sci. Rep. 2017, 7, 9233. [Google Scholar] [CrossRef] [PubMed]
- Hu, Z.; Qu, B.; Li, X.; Li, C. An Encrypted Traffic Classification Framework Based on Higher-Interaction-Graph Neural Network. In Proceedings of the Australasian Conference on Information Security and Privacy, Sydney, NSW, Australia, 15–17 July 2024; Springer: Berlin/Heidelberg, Germany, 2024; pp. 383–403. [Google Scholar]
- Liu, Z.; Chen, C.; Yang, X.; Zhou, J.; Li, X.; Song, L. Heterogeneous Graph Neural Networks for Malicious Account Detection. In Proceedings of the 27th ACM International Conference on Information and Knowledge Management, Torino, Italy, 22–26 October 2018; pp. 2077–2085. [Google Scholar]
- Ding, K.; Li, J.; Bhanushali, R.; Liu, H. Deep Anomaly Detection on Attributed Networks. In Proceedings of the 2019 SIAM International Conference on Data Mining, Calgary, AB, Canada, 2–4 May 2019; SIAM: Philadelphia, PA, USA, 2019; pp. 594–602. [Google Scholar]
- Goldman, A.; Cohen, I. Anomaly Detection Based on an Iterative Local Statistics Approach. Signal Process. 2004, 84, 1225–1229. [Google Scholar] [CrossRef]
- Ye, N.; Chen, Q. An Anomaly Detection Technique Based on a Chi-Square Statistic for Detecting Intrusions into Information Systems. Qual. Reliab. Eng. Int. 2001, 17, 105–112. [Google Scholar] [CrossRef]
- Wang, J.; Hong, X.; Ren, R.; Li, T. A Real-Time Intrusion Detection System Based on PSO-SVM. In Proceedings of the 2009 International Workshop on Information Security and Application (IWISA 2009), Busan, Republic of Korea, 25–27 August 2009; Academy Publisher: London, UK, 2009; p. 319. [Google Scholar]
- Su, M.-Y. Real-Time Anomaly Detection Systems for Denial-of-Service Attacks by Weighted k-Nearest-Neighbor Classifiers. Expert Syst. Appl. 2011, 38, 3492–3498. [Google Scholar] [CrossRef]
- Li, Y.; Ma, R.; Jiao, R. A Hybrid Malicious Code Detection Method Based on Deep Learning. Int. J. Secur. Its Appl. 2015, 9, 205–216. [Google Scholar] [CrossRef]
- Schlegl, T.; Seeböck, P.; Waldstein, S.M.; Schmidt-Erfurth, U.M.; Langs, G. Unsupervised Anomaly Detection with Generative Adversarial Networks to Guide Marker Discovery. In Proceedings of the Information Processing in Medical Imaging, Boone, NC, USA, 25–30 June 2017. [Google Scholar]
- Liu, Y.; Wang, X.; Qu, B.; Zhao, F. ATVITSC: A Novel Encrypted Traffic Classification Method Based on Deep Learning. IEEE Trans. Inf. Forensics Secur. 2024, 19, 9374–9389. [Google Scholar] [CrossRef]
- Liu, F.; Wen, Y.; Zhang, D.; Jiang, X.; Xing, X.; Meng, D. Log2vec: A Heterogeneous Graph Embedding Based Approach for Detecting Cyber Threats within Enterprise. In Proceedings of the 2019 ACM SIGSAC Conference on Computer and Communications Security, London, UK, 11–15 November 2019; pp. 1777–1794. [Google Scholar]
- Cai, L.; Chen, Z.; Luo, C.; Gui, J.; Ni, J.; Li, D.; Chen, H. Structural Temporal Graph Neural Networks for Anomaly Detection in Dynamic Graphs. In Proceedings of the 30th ACM International Conference on INFORMATION & Knowledge Management, Virtual, 1–5 November 2021; pp. 3747–3756. [Google Scholar]
- Xiao, G.; Tong, H.; Shu, Y.; Ni, A. Spatial-Temporal Load Prediction of Electric Bus Charging Station Based on S2TAT. Int. J. Electr. Power Energy Syst. 2025, 164, 110446. [Google Scholar] [CrossRef]
- Zhang, S.; Xi, P.; Jiang, M.; Zhang, G.; Cheng, D. Latent Representation Learning for Attributed Graph Anomaly Detection. ACM Trans. Knowl. Discov. Data 2025, 19, 1–22. [Google Scholar] [CrossRef]
- Zhou, Z.; Abawajy, J. Reinforcement Learning-Based Edge Server Placement in the Intelligent Internet of Vehicles Environment. IEEE Trans. Intell. Transp. Syst. 2025; early access. [Google Scholar] [CrossRef]
- Kurniabudi, K.; Stiawan, D.; Darmawijoyo, D.; Idris, M.Y.B.; Kerim, B.; Budiarto, R. Important Features of CICIDS-2017 Dataset for Anomaly Detection in High Dimension and Imbalanced Class Dataset. Indones. J. Electr. Eng. Inform. 2021, 9, 498–511. [Google Scholar] [CrossRef]
- Sharafaldin, I.; Lashkari, A.H.; Ghorbani, A.A. Toward Generating a New Intrusion Detection Dataset and Intrusion Traffic Characterization. ICISSp 2018, 1, 108–116. [Google Scholar]
- Cisco Annual Internet Report (2018–2023) White Paper; Cisco Systems, Inc.: San Jose, CA, USA, 2019.
- Goryunov, M.N.; Matskevich, A.G.; Rybolovlev, D.A. Synthesis of a Machine Learning Model for Detecting Computer Attacks Based on the Cicids2017 Dataset. Proc. Inst. Syst. Program. RAS 2020, 32, 81–94. [Google Scholar] [CrossRef] [PubMed]
- Zhang, Y.; Zhao, H.; Liu, X.; Cui, Z.; Tian, Y.; Du, Y. Network Intrusion Detection Based on Layered Hybrid Grey Wolf Algorithm and Lightweight Transformer. In Proceedings of the 2025 8th International Conference on Advanced Electronic Materials, Computers and Software Engineering (AEMCSE), Nanjing, China, 9–11 May 2025; pp. 319–322. [Google Scholar]
- Shyaa, M.A.; Zainol, Z.; Abdullah, R.; Anbar, M.; Alzubaidi, L.; Santamaría, J. Enhanced Intrusion Detection with Data Stream Classification and Concept Drift Guided by the Incremental Learning Genetic Programming Combiner. Sensors 2023, 23, 3736. [Google Scholar] [CrossRef] [PubMed]
- Hu, X.; Ma, D.; Wang, W.; Liu, F. Dual Adaptive Windows Toward Concept-Drift in Online Network Intrusion Detection. In Proceedings of the International Conference on Computational Science, Singapore, 7–9 July 2025; Springer: Berlin/Heidelberg, Germany, 2025; pp. 210–224. [Google Scholar]
- Idrissi, M.J.; Alami, H.; Mahdaouy, A.E.; Mekki, A.E.; Oualil, S.; Yartaoui, Z.; Berrada, I. Fed-ANIDS: Federated Learning for Anomaly-Based Network Intrusion Detection Systems. Expert Syst. Appl. 2023, 234, 121000. [Google Scholar] [CrossRef]
- Dash, N.; Chakravarty, S.; Rath, A.K.; Giri, N.C.; AboRas, K.M.; Gowtham, N. An Optimized LSTM-Based Deep Learning Model for Anomaly Network Intrusion Detection. Sci. Rep. 2025, 15, 1554. [Google Scholar] [CrossRef] [PubMed]
- Zhang, H.; Zhou, Y.; Xu, H.; Shi, J.; Lin, X.; Gao, Y. Graph Neural Network Approach with Spatial Structure to Anomaly Detection of Network Data. J. Big Data 2025, 12, 105. [Google Scholar] [CrossRef]
- Nguyen, T.-T.; Park, M. EL-GNN: A Continual-Learning-Based Graph Neural Network for Task-Incremental Intrusion Detection Systems. Electronics 2025, 14, 2756. [Google Scholar] [CrossRef]


| Neighboring Edge Type | ||||||
|---|---|---|---|---|---|---|
| Same Key Feature | ||||||
| Strong Correlation | √ | √ | √ | √ | √ | |
| Moderate Correlation | √ | √ | √ | |||
| Weak Correlation | √ | √ | ||||
| Dataset | Volume of Data | Length of Time (Minutes) |
|---|---|---|
| Tuesday | 445,907 | 488 |
| Wednesday | 461,628 | 509 |
| Thursday | 456,750 | 486 |
| Friday | 477,499 | 391 |
| Algorithms | Accuracy | Precision | Recall | F1-Score |
|---|---|---|---|---|
| KNN [24] | 97.1% | 94.2% | 96.1% | 96.9% |
| RF [24] | 97.1% | 97.8% | 94.3% | 97% |
| CART [24] | 97.5% | 97.3% | 94.6% | 96.6% |
| Adaboost [24] | 97.8% | 96.2% | 96.5% | 97.3% |
| QDA [24] | 87.2% | 97.8% | 59.7% | 94.9% |
| H2GWO + Transformer [25] | 94.61% | 92.8% | 93.9% | |
| GPC-FOS [26] | 90.09% | 89.83% | ||
| DWOIDS [27] | 96.08% | 94.80% | 99.69% | 96.56% |
| Fed-ANIDS [28] | 93.36% | 92.73% | ||
| SSA-LSTM [29] | 90.97% | 95.74% | 91.58% | 92.41% |
| DGI + GAT [30] | 69.82% | 98.69% | 72.58% | 83.66% |
| EL-GNN [31] | 96.72% | 96.82% | ||
| ETG-EESAGE (mean result) | 95.50% | 97.90% | 97.30% | 97.7% |
Disclaimer/Publisher’s Note: The statements, opinions and data contained in all publications are solely those of the individual author(s) and contributor(s) and not of MDPI and/or the editor(s). MDPI and/or the editor(s) disclaim responsibility for any injury to people or property resulting from any ideas, methods, instructions or products referred to in the content. |
© 2025 by the authors. Licensee MDPI, Basel, Switzerland. This article is an open access article distributed under the terms and conditions of the Creative Commons Attribution (CC BY) license (https://creativecommons.org/licenses/by/4.0/).
Share and Cite
Qu, B.; Zheng, S.; Zeng, J.; Tian, L. Design of Network Anomaly Detection Model Based on Graph Representation Learning. Symmetry 2025, 17, 1976. https://doi.org/10.3390/sym17111976
Qu B, Zheng S, Zeng J, Tian L. Design of Network Anomaly Detection Model Based on Graph Representation Learning. Symmetry. 2025; 17(11):1976. https://doi.org/10.3390/sym17111976
Chicago/Turabian StyleQu, Bo, Simin Zheng, Junming Zeng, and Liwei Tian. 2025. "Design of Network Anomaly Detection Model Based on Graph Representation Learning" Symmetry 17, no. 11: 1976. https://doi.org/10.3390/sym17111976
APA StyleQu, B., Zheng, S., Zeng, J., & Tian, L. (2025). Design of Network Anomaly Detection Model Based on Graph Representation Learning. Symmetry, 17(11), 1976. https://doi.org/10.3390/sym17111976


