1. Introduction
Grid-forming control has emerged as a key technology for ensuring the effective integration of large-scale renewable energy plants, owing to its synchronous generator-like dynamic characteristics. In recent years, grid-forming renewable units and energy storage systems have seen increasing application in real-world projects. Existing studies have demonstrated that grid-forming control not only provides frequency and voltage support but also mitigates oscillation issues caused by the integration of renewables into weak grids [
1,
2,
3,
4]. Under conventional grid-following control, as grid strength weakens, the converter’s phase-locked loop (PLL) or DC voltage outer loop becomes prone to oscillatory instability [
5,
6,
7,
8]. In contrast, grid-forming control, such as virtual synchronous generator (VSG) control, exhibits superior stability under weak grid conditions but has been observed to experience oscillation instability under strong grid conditions. Therefore, by taking advantage of the complementary characteristics of grid-following and grid-forming control strategies, the system’s oscillation stability can be enhanced through the rational allocation of grid-forming devices in systems with high penetration of renewable energy plants. This approach has become a prominent research focus.
Three main strategies are currently preferable to improve the oscillation stability of large-scale renewable plant integration systems by coordinating GFL and GFM controls: (1) mode-switching, (2) hybrid, and (3) power plant-level mixed deployment approaches. (1) The mode-switching approach is based on applying GFM control under weak grid conditions and GFL control under strong grid conditions to enhance the converter’s oscillation stability across varying grid impedances. For example, ref. [
9] proposed an adaptive dual-mode switching strategy based on grid conditions, which improves converter adaptability to different grid impedances via grid impedance estimation and GFL/GFM mode switching. In practice, to ensure the economic performance of renewable generation, GFL control, featuring faster dynamic response, is preferred, while GFM control is adopted when the system faces oscillation risks in weak grids [
10]. Accordingly, ref. [
11] introduced a switching indicator based on the operational short-circuit ratio (SCR) and developed an optimal configuration method for switchable GFL/GFM units, effectively improving system stability under extremely weak grids. (2) In terms of hybrid control, the studies [
12,
13,
14] proposed a combined synchronization control method that integrates PLL synchronization with power synchronization. This approach allows converters to exhibit characteristics of both GFL and GFM control, thereby improving their stability under weak grid conditions. However, the above-mentioned strategies primarily focus on enhancing the stability of a single grid-connected converter and are not directly applicable to improving the oscillation stability of entire renewable energy plants under weak grid conditions.
From the (3) power plant-level perspective, deploying a certain capacity of GFM units can effectively mitigate the oscillatory instability issues encountered by conventional GFL control under weak grid conditions. References [
15,
16] analyzed the impact mechanism of GFM converters on system oscillation stability from the perspective of equivalent circuit models. These studies highlight that the fundamental impedance of GFM converters is significantly lower than that of the grid and exhibits an overall positive resistance–inductance (R-L) characteristic. This helps to suppress the negative resistance–capacitance (R-C) behavior typically exhibited by GFL converters, thereby improving the oscillation stability of GFL control in weak grids. The studies [
17,
18] further investigate the stabilizing mechanism of GFM converters in renewable energy plants operating under weak grid conditions. It is noted that virtual inertia has contrasting effects on small-signal stability and frequency stability, underscoring the trade-off in stability performance. Reference [
19] proposed a coordinated optimization strategy for allocating GFL and GFM converters in systems with multiple renewable energy plants. Reference [
20] explored GFM converter allocation based on participation factors, aiming to enhance grid strength. These works offer valuable insights into enhancing the oscillation stability of renewable energy plants under weak grids. However, the oscillation stability of such plants is highly sensitive to operating conditions. In practice, the operational SCR of a renewable plant is influenced by multiple dynamic factors, including power output from neighboring plants, grid topology changes, and the plant’s own output, resulting in a wide variation range. Due to this diversity in operating scenarios, ensuring the robustness of GFM deployment strategies under varying grid conditions remains a key challenge for future research.
To address these challenges, this paper proposes a hierarchical optimization method for the allocation of GFL and GFM devices aimed at enhancing oscillation stability in renewable energy plants. First, a renewable plant model incorporating both GFL and GFM devices is established, followed by the development of a system oscillation stability criterion based on an equivalent resonant circuit. Considering both economic efficiency and oscillation stability, a bi-level optimization model for the GFL/GFM device allocation is then formulated. The proposed method also recognizes the inherent symmetry between GFL and GFM converters, whose complementary control functions—current tracking versus voltage forming—collectively support balanced and stable system dynamics. The upper-level optimization model aims to maximize the proportion of GFL control—due to its faster dynamic response—under the objectives of minimizing cost, while ensuring no oscillation risk across a set of operating conditions and given a lower SCR bound. The lower-level model, based on the GFL/GFM configuration obtained from the upper level, solves for the maximum SCR upper bound that guarantees oscillation stability of the renewable plant under the specified operation scenarios. By iteratively solving between the upper and lower levels, an optimized GFL and GFM device allocation scheme is obtained that satisfies oscillation stability requirements across the entire preset SCR range. Finally, the proposed optimization approach is validated through case studies in simulations. The proposed two-layer optimization model accounts for the stability of the GFL strategy under weak grid conditions and the GFM strategy under strong grid conditions with low power generation. It effectively ensures the oscillation stability of wind farms under complex and varying operating scenarios.
The remainder of this paper is organized as follows.
Section 2 presents the impedance modeling of renewable energy plants incorporating GFL and GFM devices, along with the method for oscillation risk analysis.
Section 3 develops the optimization model for GFL and GFM device allocation aimed at enhancing oscillation stability.
Section 4 shows the case studies and simulation analysis. Finally,
Section 5 summarizes the main contributions and conclusions of this research work.
2. Modeling and Oscillatory Stability Analysis of Renewable Energy Plants
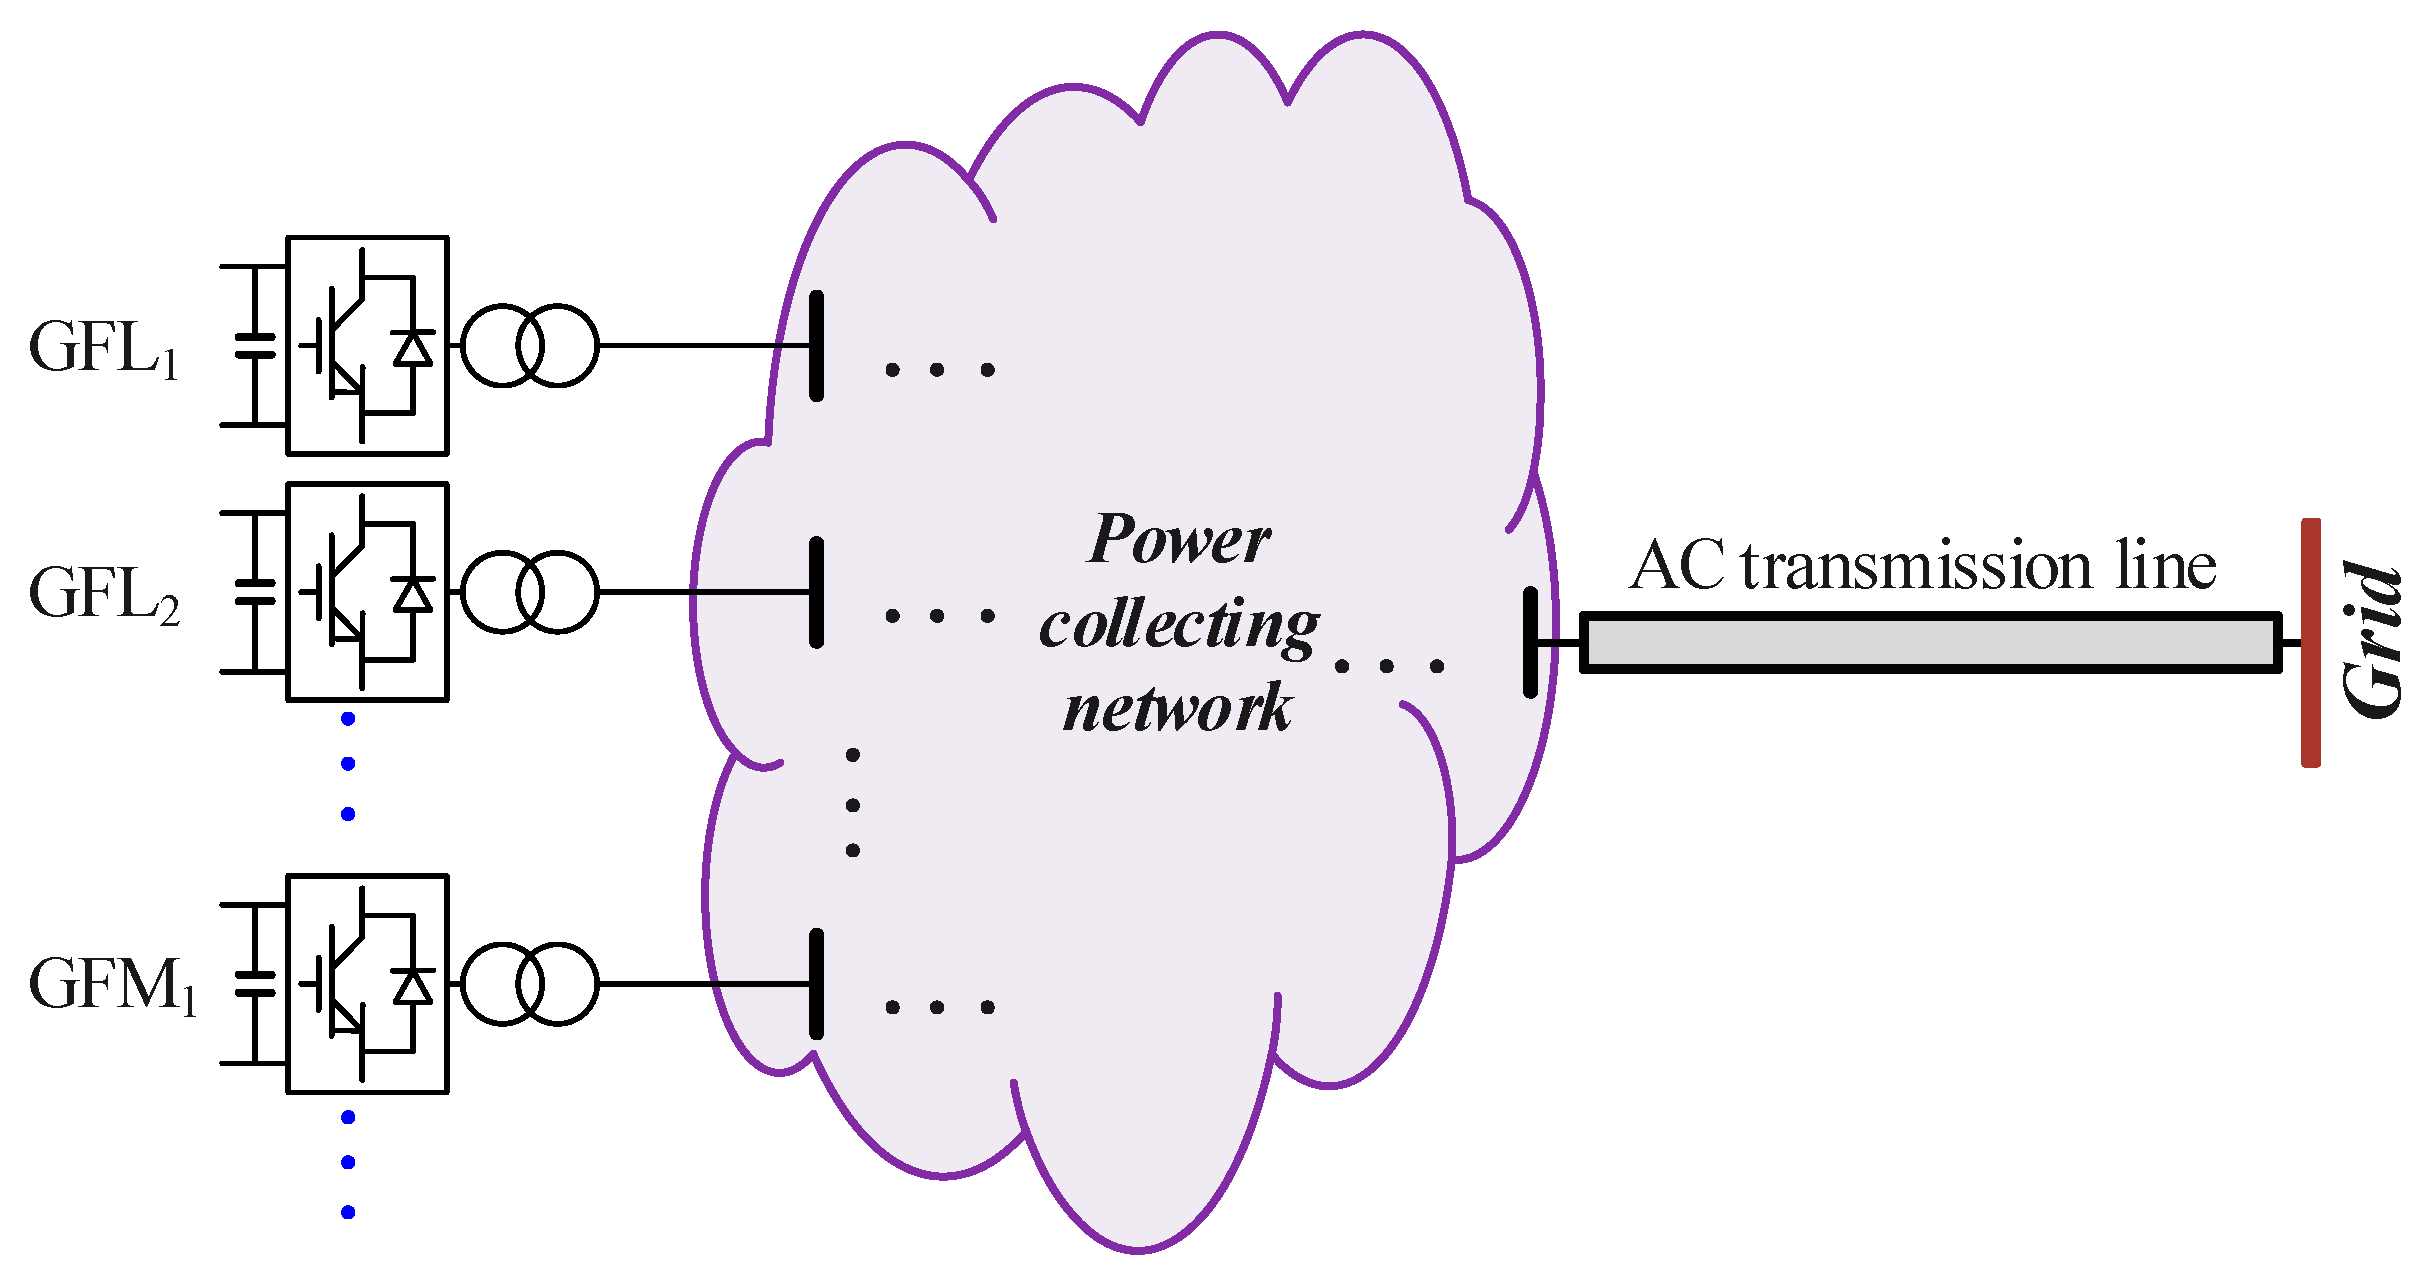
This section first investigates the modeling and oscillatory stability analysis method for renewable energy plants incorporating both GFL and GFM devices, providing the foundation for subsequent optimization of GFM device allocation. The typical topology of a hybrid GFL-GFM renewable plant is shown in
Figure 1. For wide-frequency oscillation analysis, both GFL and GFM devices can be represented using the following admittance-based model:
where
Igfli and
Vgfli denote the output current and terminal voltage column vectors of the
i-th GFL device, respectively, and
Ggfli(
s) is its admittance model. Similarly,
Igfmj and
Vgfmj denote the output current and terminal voltage column vectors of the
j-th GFM device, with
Ggfmj(
s) representing its admittance model, where
i = 1, 2, …,
N and
j = 1, 2, …,
M, where
N and
M are the numbers of GFL and GFM devices within the renewable plant, respectively.
For the internal collection network of the wind power plant, the nodal impedance matrix is adopted, and its model is as follows:
where
V = [
VGFLT VGFMT]
T,
I = [
IGFLT IGFMT]
T,
VGFL = [
Vgfl1T Vgfl2T …
VgflNT]
T,
VGFM = [
Vgfm1T Vgfm2T …
VgfmMT]
T,
IGFL = [
Igfl1T Igfl2T …
IgflNT]
T,
IGFM = [
Igfm1T Igfm2T …
IgfmMT]
T,
Zc(
s) denotes the nodal impedance matrix of the collection network, and
VCM = [
VCT VCT …
VCT]
T ∈ R
2(N+M)×1 is the column vector composed of
Vc and
Vc itself is the voltage column vector of bus C.
According to (1) and (2), by integrating all converter models, it has
where
, and diag[
Ggfli(
s)] and diag[
Ggfmj(
s)] are block diagonal matrices composed of
Ggfmj(
s).
By combining all converter models and the AC grid model, i.e., by combining (3) and (4), the overall admittance model of the wind farm is derived, it is obtained that
where
is the column vector of output currents of the renewable plant; [
GM−1(
s) −
Zc(
s)]
−1 = [
mkh(
s)]|
k, h = 1, 2, …, (N + M), [
mkh(
s)]|
k, h = 1, 2, …, (N + M) is a block matrix whose (
k,
h)-th element is
mkh(
s);
k,
h = 1, 2, …,
N +
M,
mkh(
s) is a 2*2 polynomial matrix;
denotes the admittance model of the renewable plant. The superscript “−1” denotes the matrix inverse. The detailed derivation principles can be found in [
2].
For the connected grid, it can also be modeled in the following admittance form:
where
Inet = −
Ic denotes the output current of the grid and
Gnet(
s) represents the admittance model of the grid.
After modeling the renewable units and the external grid, system oscillation stability can be analyzed. From (5) and (6), the renewable plant and the grid constitute a 2 × 2 multivariable feedback system; the open-loop characteristic gain matrix is
where
Gopen(
s) denotes the system open-loop gain matrix.
According to multivariable feedback theory, the eigenvalues of Gopen(s) are the system’s open-loop characteristic gains. System stability is determined by whether the trajectories of these gains encircle the point (−1,0) counterclockwise; a zero encirclement indicates stability. This approach only provides a qualitative assessment of oscillatory risk and does not account for stability margins, making it unsuitable for optimizing the coordination between GFL and GFM devices.
For quantitative evaluation, the system characteristic equation can be solved to identify oscillation modes with negative damping. The characteristic equation is calculated as follows:
Accordingly, the system eigenvalues can be obtained, and the presence of oscillatory risk can be determined by checking whether any pair of conjugate eigenvalues lies in the right half of the complex plane. However, in practice, the control models and parameters of renewable generation units are typically unknown. Although impedance model data of the units can be obtained through measurement, it is difficult to derive analytical expressions for their impedance models. Consequently, directly solving the characteristic equation to obtain the system eigenvalues becomes impractical. To address this, the following method is proposed to assess the system’s oscillatory stability and stability margin.
Let
, the Schur complement of the matrix is
Furthermore, the system characteristic equation can be expressed as
Because of the black- or gray-box nature of power electronic device models, the system’s oscillatory stability can be evaluated using the principle of an equivalent resonant circuit. Denote
Accordingly, the system’s oscillatory stability can be evaluated using the following method, and the stability margin is defined accordingly. If , then
If , the system is equivalent to a resonant circuit with positive conductance at the angular frequency ωr, and the system is stable.
If , the system is equivalent to a resonant circuit with negative con-ductance, implying an oscillatory instability risk, and the oscillation frequency is .
Moreover, when
, a larger
indicates a greater oscillatory stability margin. Therefore,
Ge(
jω) can be used as an index for quantifying the oscillatory stability margin. In this paper, the minimum value of the equivalent one-dimensional conductance at all resonance points within the concerned frequency range is defined as the oscillatory stability margin indicator:
where
Ge1,
Ge2, …,
GeM are the equivalent conductance at each resonance point, and
M is the number of resonance points.
3. Optimization Method for GFL–GFM Device Allocation over a Wide SCR Range
GFL control technology is relatively mature and supports MPPT. In contrast, GFM control offers superior disturbance rejection capability, but due to its requirements for higher overcurrent capacity and other factors, it is generally less economical. From the perspective of oscillation stability, as the share of renewable generation increases, the sending-end grid is increasingly characterized by low SCRs, making GFL-based renewable energy plants more susceptible to oscillatory instability. Deploying a certain share of GFM devices can mitigate the oscillation issues of GFL converters in weak-grid conditions. Given the trade-off between stability and cost for GFL and GFM devices in weak-grid scenarios, it is necessary to perform optimal allocation of GFM capacity.
From the point of integration of a renewable plant, the grid strength is significantly influenced by the output of nearby renewable energy plants and the switching in/out of major transmission and transformation equipment. As a result, the SCR may vary over a wide range. Considering the effect of SCR variation (where SCRL to SCRH denote the SCR range), if a GFL-based renewable plant faces oscillation risks at low SCRs, then when GFM devices are allocated to improve oscillation stability, two different outcomes may occur:
By allocating a certain number of GFM devices, the renewable plant can operate without oscillation risk when the connection point short-circuit ratio is SCRL. As the SCR increases, the oscillation stability of the GFL renewable units further improves. However, under stronger grid conditions, the presence of GFM devices may introduce oscillation stability issues for the plant. If, at a higher short-circuit ratio SCRH, the integration of GFM devices does not cause oscillation instability in the plant, then an optimal allocation of GFL and GFM devices can effectively enhance the oscillation stability of the renewable plant across the SCR range.
If allocating GFM devices can eliminate oscillation risk at the connection point, the short-circuit ratio is SCRL, but it is difficult to prevent the emergence of new oscillation instability issues at higher SCR values (e.g., SCRH) caused by GFM devices, then it is necessary to adjust the GFL-type and GFM-type device ratio according to changes in grid strength.
To address both scenarios, this section considers a wide range of SCR variations and establishes a bi-level optimization model for the allocation of GFL and GFM devices aimed at improving oscillation stability. The upper-level optimization aims to minimize the total cost of GFL and GFM device allocation, subject to the constraint that the renewable plant remains oscillation-stable at a given SCR—i.e., the equivalent conductance/resistance at resonance points is positive and maintains a certain stability margin. Since GFL devices are more economical than GFM devices, this objective function is equivalent to minimizing the capacity or proportion of GFM devices. The key task of the lower-level optimization is to determine, under the GFM allocation scheme output by the upper-level model, the maximum SCR range within which the plant maintains positive oscillation damping and a required stability margin across different output levels. This evaluates whether the upper-level allocation scheme of GFL and GFM devices can ensure oscillation stability constraints are met throughout the entire SCR variation range.
Based on the above analysis, the objective function of the upper-level optimization model is formulated as follows.
where
C(
X) represents the total cost of grid-following and grid-forming equipment, with
X = [
X1 X2]
T;
X1 and
X2 denote the installed capacities of grid-following and grid-forming renewable units, respectively.
C1(
X1) and
C2(
X2) represent the costs associated with the grid-following and grid-forming renewable units, respectively;
C1(
X1) and
C2(
X2) are linear cost functions, including equipment procurement costs and operation and maintenance costs [
21].
where
c1 and
c2 represent the procurement cost of a single GFL-type and GFM-type device, respectively;
α1 and
α2 denote the annual maintenance rates of GFL- and GFM-type devices; and
X0 is the rated capacity of a single renewable plant.
The constraints of the upper-level optimization are as follows:
In (17),
represents the system oscillation stability margin at the resonance point under the
SCRinput condition and when the renewable plant is operating under condition
b;
GL is the lower limit of the system oscillation stability margin;
B is the set of operating conditions of the renewable plant considered in the analysis; and
S is the total capacity of the renewable plant.
is calculated following the principle in
Section 2. First, under operating condition
b and
SCRinput, frequency-domain transfer function models of the generators and the grid are established. Using the Schur complement,
Ge(
jω) is derived, and
is obtained as the minimum real part at the zero-crossing of its imaginary component.
The lower-level optimization, based on the grid-following and grid-forming device ratio obtained from the upper-level optimization, further calculates the maximum SCR under which the system can maintain stable operation for this device configuration.
where
SCR represents the short-circuit ratio of the renewable plant;
SCRinput is the lower bound of the SCR input to the upper-level optimization model;
SCRH is the upper bound of the SCR considered in the optimization;
Xresult is the solution obtained from the upper-level optimization model. It should be noted that if the constraints are satisfied when
SCR =
SCRH, the lower-level optimization model outputs
SCRH as the result.
After defining the SCR variation range to be considered,
SCRL ~
SCRH, the basic process for optimizing the GFL and GFM device ratio based on the two-level optimization model shown in (14) to (19) is illustrated in
Figure 2 and described as follows:
Determine the set of renewable plant operating conditions to be considered in the oscillation risk analysis, including unit combinations and unit outputs. Since the SCR significantly affects the oscillation stability of renewable energy plants, the construction of operating scenario sets should emphasize varying SCR levels. This includes conditions of high and low renewable output as well as the impact of switching key transmission and substation equipment in or out of service.
Establish the admittance models of GFL and GFM units at different output levels. Specify the lower limit of the system admittance margin at resonance points, denoted as GL.
Set SCRinput = SCRL, obtain the optimal GFL and GFM device configuration X(1) that ensures oscillation stability of the plant under the considered operating conditions at the point of connection short-circuit ratio SCRL based on the upper-level optimization model.
Substitute X(1) into the lower-level optimization model to calculate the maximum short-circuit ratio SCRmax(1) under which the renewable plant’s oscillation stability can be maintained for the considered operating conditions.
If SCRmax(1) ≥ SCRH, take X(1) as the optimal configuration and output the optimization result. If SCRmax(1) < SCRH, record the GFL-GFM device configuration X(1) that ensures oscillation stability over the SCR range SCRL ~ SCRmax(1). Then set SCRinput = SCRmax(1) and repeat step 2 to obtain a new optimal configuration X(2). Next, perform step 3 to find the new maximum stable short-circuit ratio SCRmax(2) corresponding to the configuration X(2).
If SCRmax(2) ≥ SCRH, output the optimized configuration scheme, i.e., use configuration X(1) for the short-circuit ratio range SCRL~SCRmax(1) and configuration X(2) for the range SCRmax(1)~SCRH. If SCRmax(2) < SCRH, repeat steps 2 and 3 until an optimized configuration scheme is obtained that satisfies the entire short-circuit ratio range.
Following the above process, an optimized configuration scheme of GFL and GFM devices can be obtained that satisfies oscillation stability constraints under multiple operating conditions and a wide range of short-circuit ratios, while minimizing the number of switches between GFL and GFM controls for converters, thereby facilitating practical operation and control of renewable energy plants.
To facilitate the optimization process, the above-mentioned short-circuit ratio is calculated based on the plant’s rated capacity at the point of interconnection, rather than the actual operating short-circuit ratio based on real-time output.
Given the rated capacity per unit of both GFL and GFM devices, the capacity configuration optimization is equivalent to the unit number configuration optimization. Therefore, the optimization model established in this section is a nonlinear integer programming problem. It can be solved by specialized heuristic algorithms. The genetic algorithm, known for its well-established advantages, is applied for the optimal allocation of distributed phase-shifting transformers to enhance oscillation stability. Since these related algorithms are well-studied in [
21,
22,
23] and are not the primary focus of this research, they will not be discussed in detail.
4. Case Study
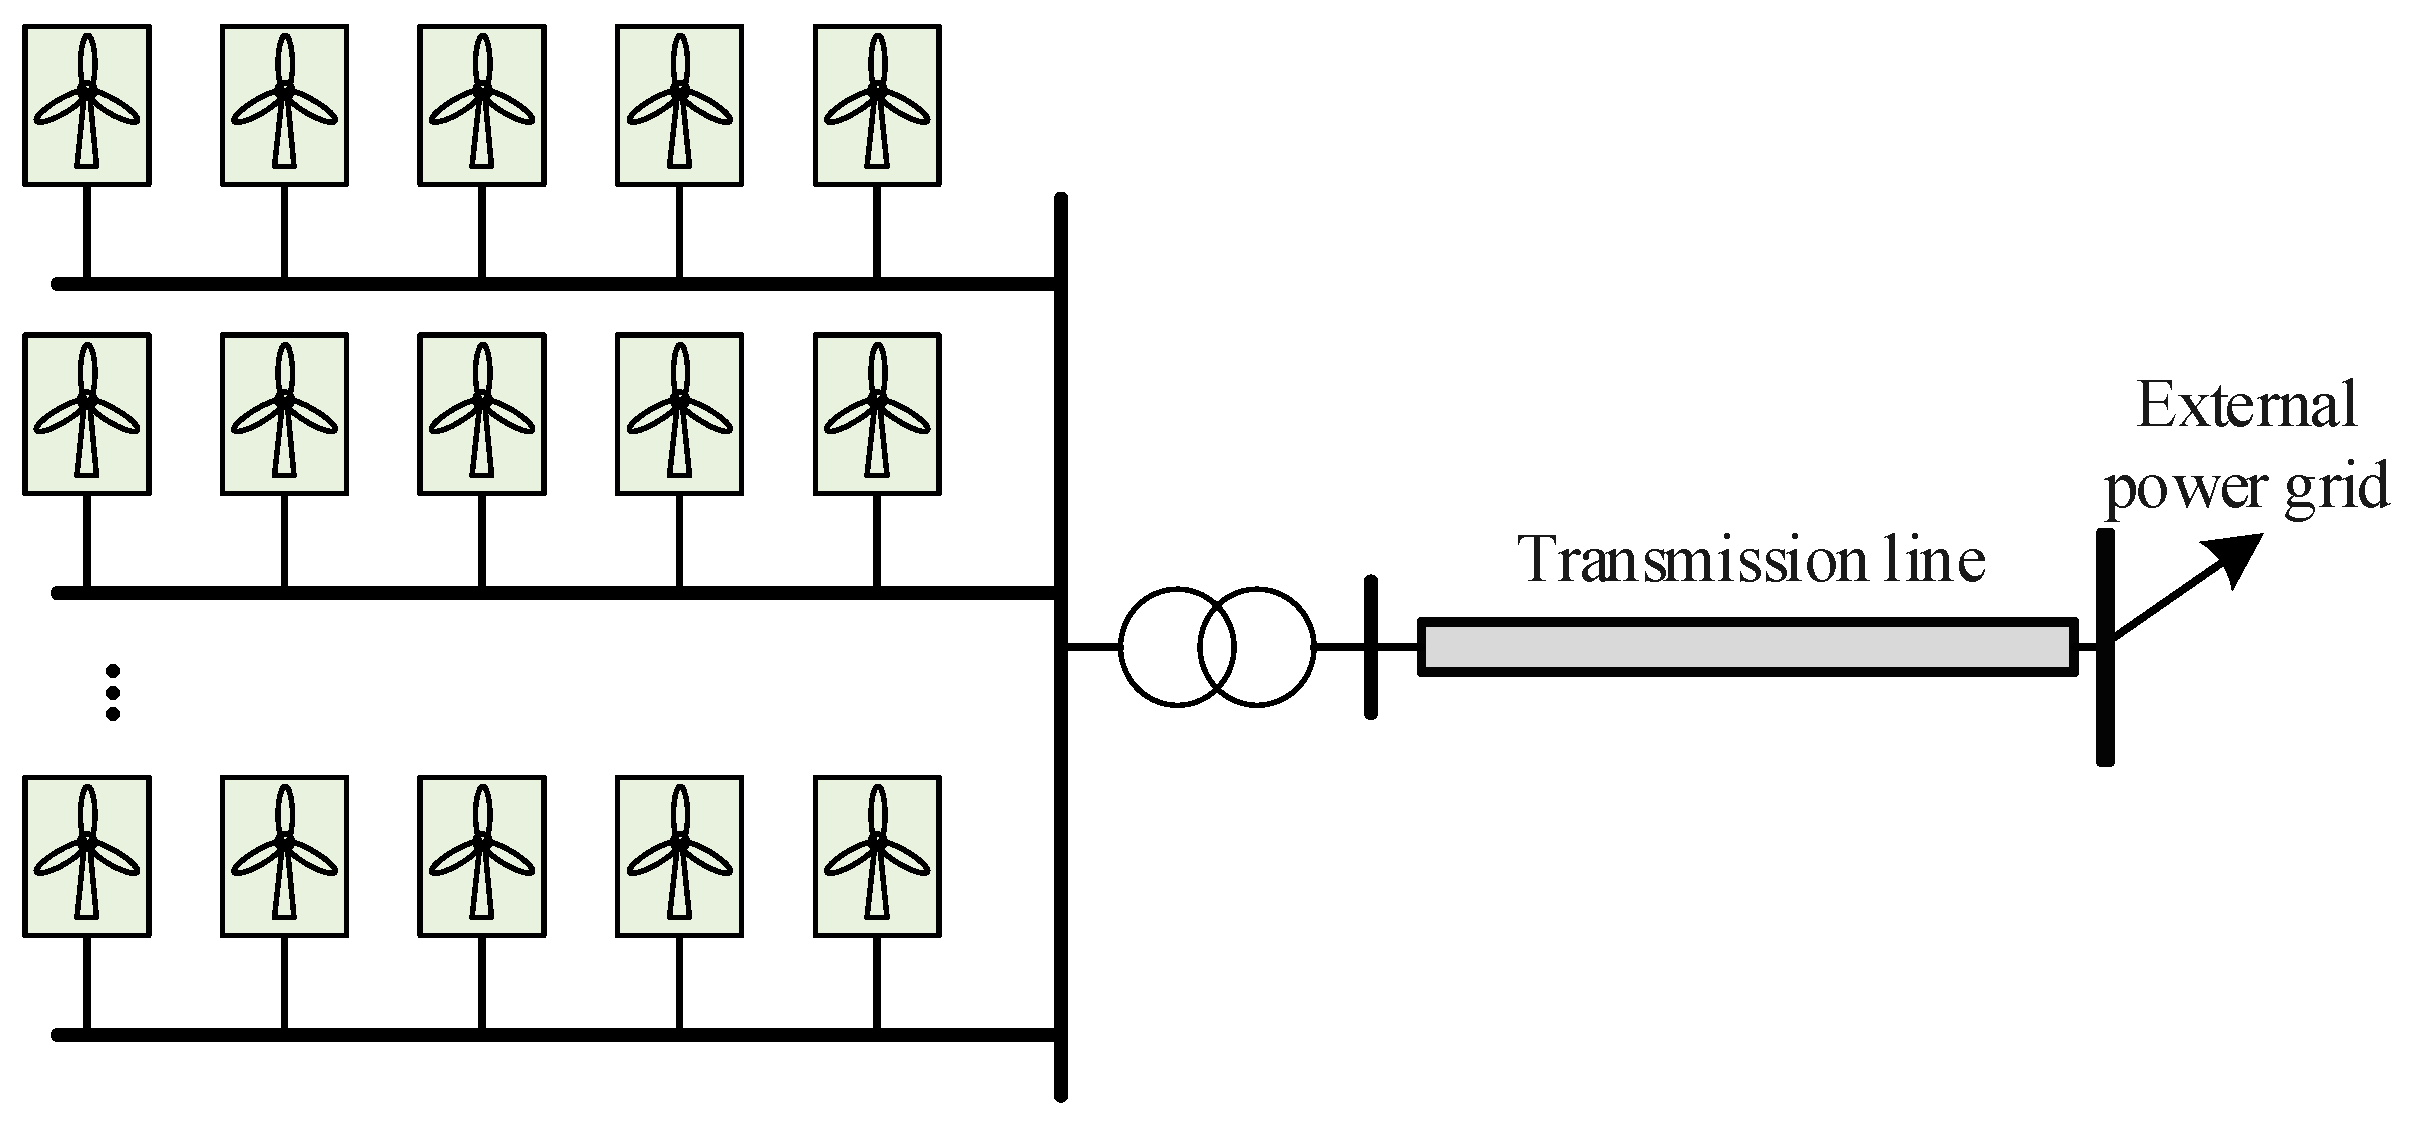
This section optimizes the capacity ratio between GFL and GFM devices based on the wind farm grid-connected system shown in
Figure 3. The system is an equivalent model derived from the actual project reported in [
24]. The optimized configuration is then validated through simulations. The wind farm has a total installed capacity of 500 MW, consisting of 100 PMSGs rated at 5 MW each. The plant is configured with 20 feeders, with each feeder connecting five wind generators in a chained arrangement. Under initial conditions, the SCR at the wind farm’s point of connection is set to 3. Detailed models and parameters of GFL and GFM power converters can be found in [
2,
25].
4.1. Wide-Frequency Oscillation Risk Analysis Under GFL Control
This subsection analyzes the wide-frequency oscillation risk of the wind farm when internal units adopt GFL control, serving as the basis for and benchmark of the GFL and GFM device ratio optimization. First, the set of system operating modes needed for oscillation risk analysis is determined. For the wind farm operation scenarios, typical cases are constructed by considering different unit combinations and output levels. Specifically, unit combinations include 10%, 20%, … up to 100% of units online, totaling 10 cases; unit output levels also consider 10%, 20%, … up to 100%, another 10 cases. Regarding the SCR at the wind farm connection point, the analysis considers scenarios where grid strength decreases due to the outage of major transmission and transformation equipment in the grid, and scenarios where grid strength increases due to the commissioning of new transmission lines, as well as the impact of output variations from nearby renewable energy plants. Taking these factors into account, the SCR range is set to 1.5–6, with 19 operating scenarios analyzed, corresponding to SCR values of 1.5, 1.75, …, and 6. In total, the system operation set for stability analysis includes 1900 different scenarios. It should also be noted that in this analysis, a relatively wide SCR range of 1.5 to 6 is considered to more comprehensively validate that the proposed optimal allocation strategy can ensure oscillation stability of renewable energy plants under both strong and weak grid conditions. In practice, the variation in SCR at the point of connection for renewable energy plants is usually smaller than this range, thereby rendering the conclusions drawn from the case study analysis somewhat conservative.
Then, the admittance model
GC(
s) of the renewable plant is established, and the oscillation risk of the plant’s grid-connected system is analyzed based on the method proposed in
Section 2. The results show that when the connection point SCR is 2 or below, there is an oscillation risk under high wind power generation/output conditions. Representative analysis results are shown in
Figure 4. Specifically, when the SCR is 2 and the wind power output is 100%, or when the SCR is 1.5 and the wind power generation/output is 90%, the system’s one-dimensional equivalent circuit exhibits characteristics of a negative-resistance resonant circuit at frequencies of 17.55 Hz and 17.69 Hz, indicating the presence of oscillation risk. It should be noted that the oscillation stability analysis results for all 1900 scenarios cannot be presented due to the large number of scenarios. Considering that GFL exhibits poorer stability under weaker grid conditions, while GFM is less stable under stronger grid conditions, only representative cases are shown: specifically, low short-circuit ratio with high output and high short-circuit ratio with low output. The results for the remaining scenarios are consistent with the conclusions drawn in this study.
4.2. Optimization of GFL-GFM Device Proportion
Based on the oscillation risks identified in
Section 4.1, an appropriate configuration of network devices improves the oscillation stability of the wind farm under low short-circuit ratio conditions, thereby achieving oscillation suppression.
Firstly, considering that the wind farm grid-connected system exhibits no oscillation risk and maintains a certain stability margin under the representative operating modes identified in
Section 4.1, an optimization of the proportion between grid-following and grid-forming devices was conducted. The SCR was varied between 1.5 and 6, with the equivalent conductance at the resonance point maintained at no less than 0.05 (
GL = 0.05). The optimization results indicate that when the SCR at the point of connection ranges from 1.5 to 6, configuring grid-forming wind generators with a capacity of 75 MW (15% of 500 MW) ensures no oscillation risk when the SCR is 1.5 or 2 and all generators operate at full capacity. However, oscillation risks arise at SCR values above 3.33 during low wind farm output. When the SCR exceeds 3.33, switching all wind generators to grid-following control eliminates oscillation risks across different output conditions.
Next, focusing on the oscillation stability of renewable energy plants, the effectiveness of the optimized grid-following and grid-forming device configuration was validated. Using the method described in
Section 2, the oscillation risks of the grid-connected system were analyzed under the operating conditions listed in
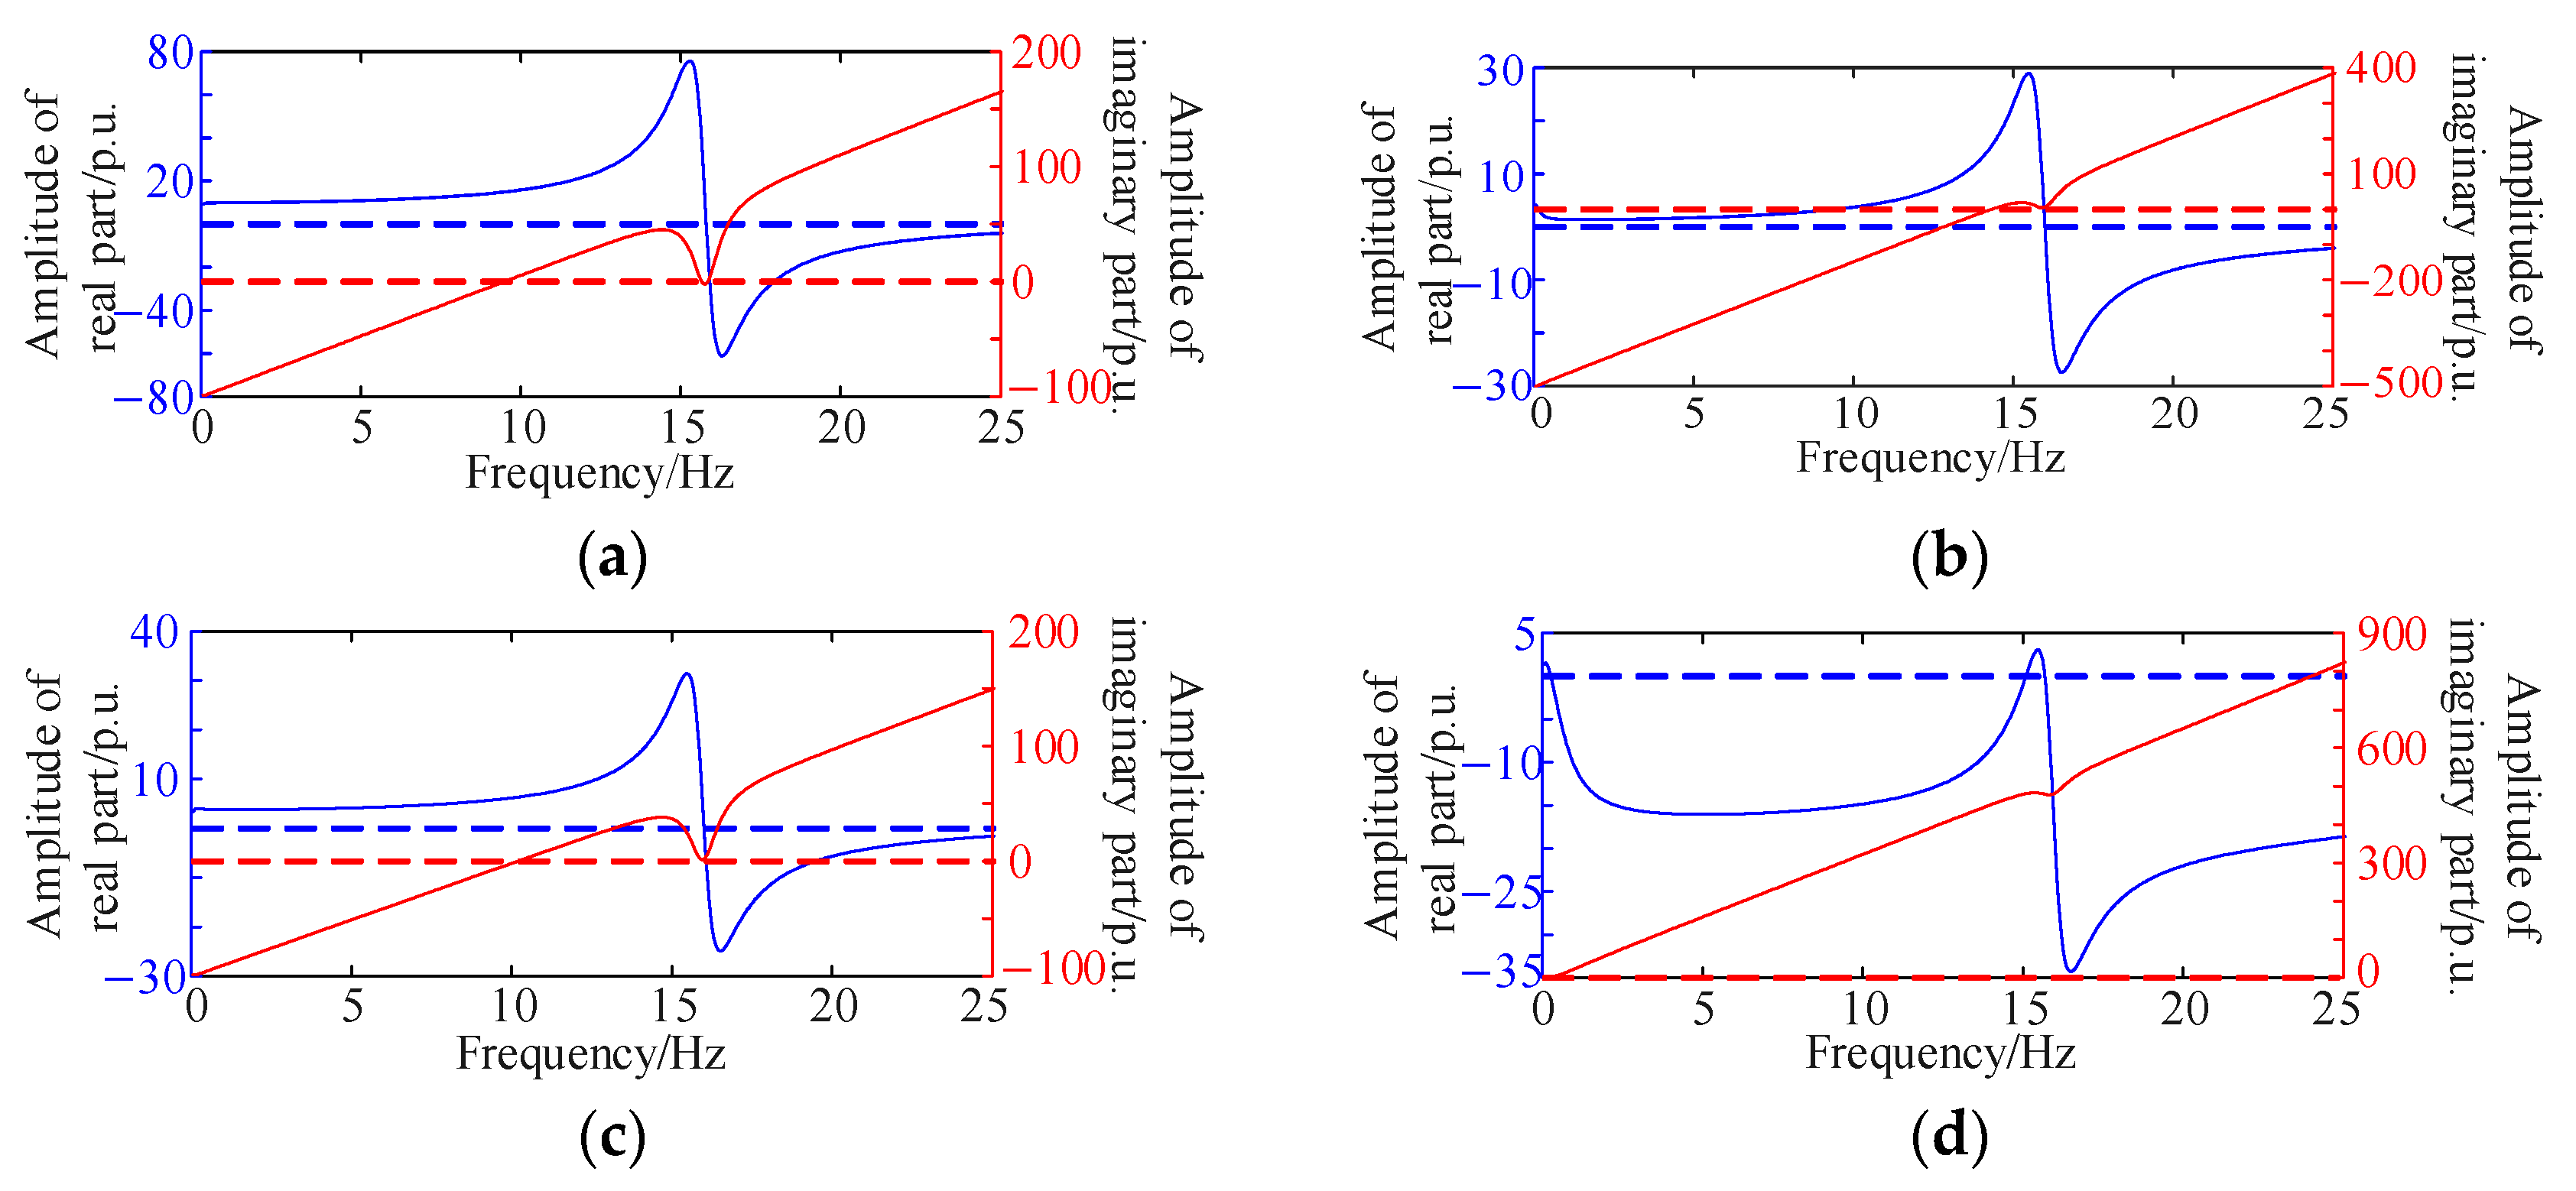
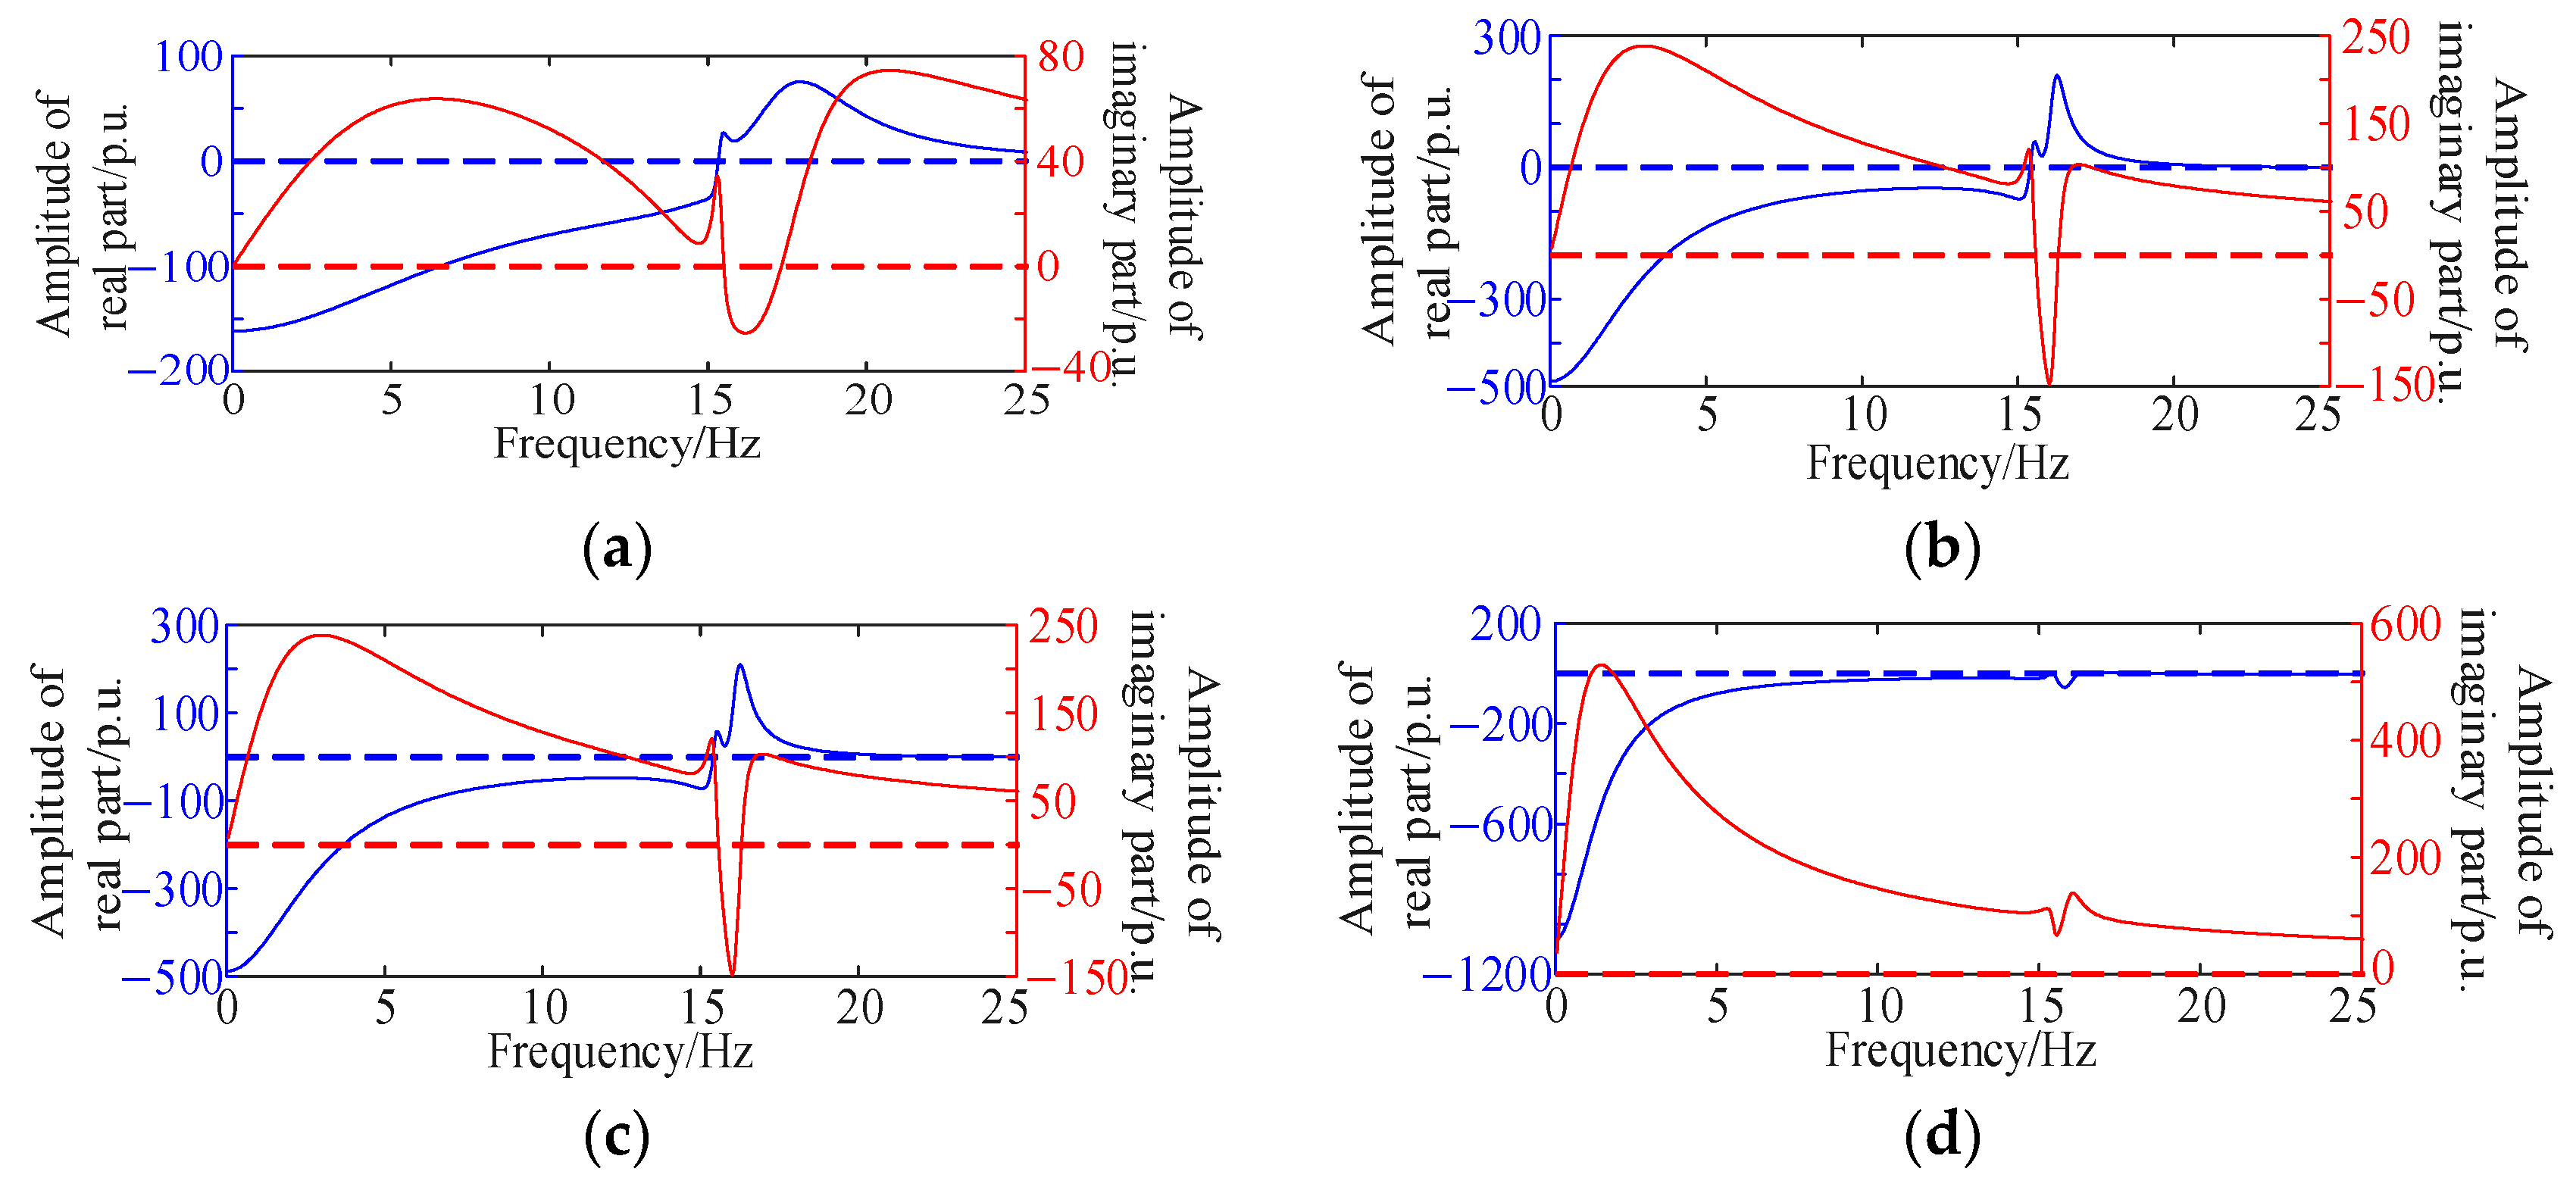
Table 1. The results are shown in
Figure 5 and
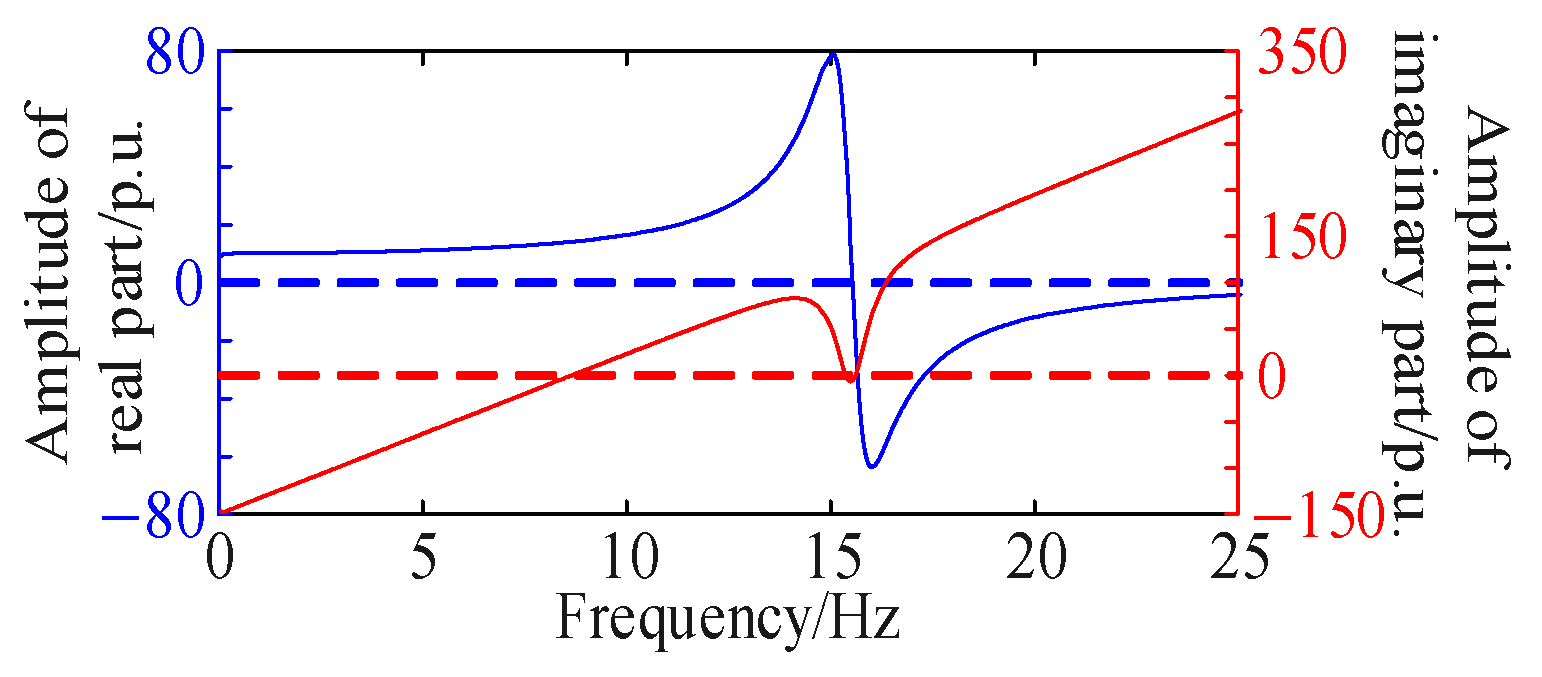
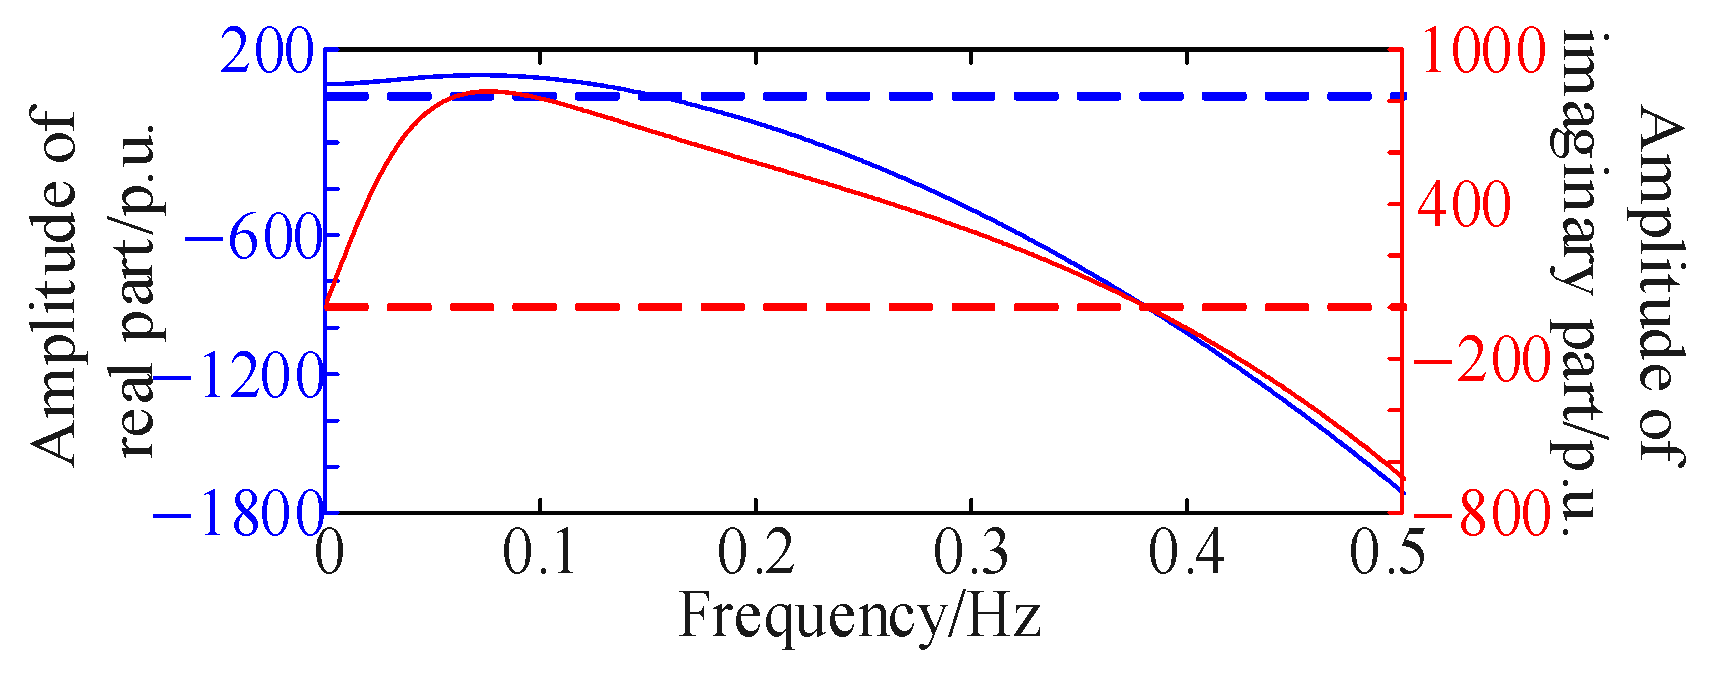
Figure 6. In the figure, the blue and red curves represent the real and imaginary parts of
Ge(
s), respectively. For clarity in identifying zero-crossing points, dashed blue and red lines indicate where the real and imaginary parts equal zero. Due to space limitations, nine representative cases from
Table 1 were selected to demonstrate the improvement in oscillation stability achieved by configuring grid-forming devices. Since grid-following and grid-forming controls tend to cause oscillations under low and high short-circuit ratios, respectively, the validation focused on SCR values of 1.5 and 6. The results confirm that the optimized configuration of grid-forming generators ensures oscillation stability across the considered operating conditions.
To demonstrate the optimality of the simulation results, the system’s oscillation stability was analyzed under an SCR of 1.5, with the wind farm composed of 70 MW grid-forming and 430 MW grid-following generators operating at full capacity. The results, shown in
Figure 7, indicate the presence of oscillation risks. Under an SCR of 3.33, with the wind farm consisting of 75 MW grid-forming and 425 MW grid-following generators, the oscillation risk was assessed at 25% proportion and 20% wind power generation/output. The results, presented in
Figure 8, demonstrate an oscillation risk at a frequency of 0.38 Hz.
4.3. Electromagnetic Transient Validation
This section further validates the improvement in wind farm oscillation stability achieved by the optimized grid-following and grid-forming device configuration through electromagnetic transient simulations.
Based on the analysis in
Section 4.1, oscillation risks occur when the SCR at the point of connection is 2 with 100% wind power generation/output, or when the SCR is 1.5 with 90% wind power generation/output. Simulations were first conducted to validate these conditions. The disturbance was set as a 5% reduction in power output at 0.2 s due to local wind speed variation, recovering at 0.3 s. The simulation results, shown in
Figure 8, confirm the presence of oscillation risks, consistent with conclusions from the linearized model analysis. The results are presented in per-unit values, with a power base of 100 MVA.
Next, applying the grid-forming wind generator configuration described in
Section 4.2 to the same scenarios, the oscillation risks were re-evaluated using the identical disturbance. The results, presented in
Figure 9, demonstrate that the optimized configuration effectively improves the wind farm’s oscillation stability.
Finally, the oscillation risk of the wind farm under high SCR conditions after configuring grid-forming devices was simulated. The simulation considered an SCR of 6 at the point of connection with the wind farm operating at low wind power generation/output (Proportion = 25%, Generation = 20%). The disturbance settings remained the same as before. The results, shown in
Figure 10, indicate that under the optimized configuration, grid-forming wind generators do not introduce oscillation risks at high SCR, confirming the effectiveness of the proposed method.
