Abstract
Aiming at the problem of low signal-to-noise ratio of the projectile signal output by the sky screen sensor, the symmetrical characteristics of the projectile signal and the noise sources were analyzed, and a joint denoising method of variational mode decomposition (VMD) and wavelet threshold based on the whale optimization algorithm (WOA) was proposed. This method employs the whale optimization algorithm (WOA) to globally optimize the key parameters of variational mode decomposition (VMD), namely the number of modes and the penalty factor , to obtain the optimal parameter combination that minimizes the envelope entropy. The original projectile signal is adaptively decomposed through the optimal VMD parameters. The variance contribution rate is used to screen the decomposed intrinsic mode function to retain the IMF component containing the projectile signal information and improve the signal-to-noise ratio of the projectile signal. Then, a wavelet threshold function is introduced to conduct secondary denoising processing on the selected modal components, further improving the signal-to-noise ratio of the projectile signal. Through noise reduction experiments on the measured projectile signals, it is proved that the signal-to-noise ratio of the signals has been significantly improved, indicating that this method can suppress noise while retaining the effective signal of the projectile to the greatest extent, laying a foundation for the recognition of projectile signals of the sky screen target.
1. Introduction
The sky screen target sensor is one of the core detection devices of the projectile test system outside the weapon range. Through combining multiple sky screen target sensors, a high-precision projectile parameter measurement system can be constructed [1,2,3]. Typical configurations include dual-sky screen test systems [4], four-sky screen intersection test systems [5], and six-sky screen intersection test systems [6], etc. These systems, through space-deployed sky screen arrays, can synchronously capture key parameters such as the speed, three-dimensional coordinates, and attitude angles of flying projectiles, providing multi-dimensional data support for the projectile performance evaluation [7]. In these test systems, the signal output by the sky screen target sensor presents a symmetrical waveform due to the characteristics of the projectile and the sky screen target sensor. This feature could have served as a key basis for projectile identification [8]. However, as the sky screen target needs to be deployed in an open-air environment, its output signal is inevitably contaminated by various noises such as environmental interference, resulting in a significant reduction in the signal-to-noise ratio of the original signal. When the noise intensity exceeds the threshold, it not only masks the true characteristics of the projectile signal but also may induce fake signal peaks, leading to a decline in the recognition rate of the test system centered on the sky screen target and thereby affecting the scientific assessment of weapon performance. However, as the sky screen target needs to be deployed in an open-air environment, its output signal is inevitably contaminated by various noises such as environmental interference, resulting in a significant reduction in the signal-to-noise ratio of the original signal. When the noise intensity is high, it will not only mask the real signal characteristics of the projectile but also may induce a false signal peak, resulting in the decline of the recognition rate of the sky screen target, and then affect the scientific evaluation of weapon performance. Therefore, it is very important to explore new noise reduction processing algorithms for sky screen target signals to improve the test ability of the system [9,10,11]. Especially when the length of the projectile is uncertain, the target signal output by the sky screen target sensor is random, mainly reflected in two aspects. First, when the length of the projectile is greater than the thickness of the sky screen target, the sky screen target is prone to output saturation signals. Second, the sky screen target is arranged in an outdoor environment, which is susceptible to the influence of natural light interference and produces noise [12].
To mitigate the impact of interference on the sky screen target test system, some scholars have studied improvement methods from the design aspect of the sky screen target, such as Lai [13] et al., based on the linear relationship between the variation in sky brightness and the output level of the sky screen target conversion circuit, designed an automatic gain control signal conditioning circuit. Different system gains were set according to the intensity of the sky background light to avoid the saturation of the projectile target passing signal. Zhang [14] et al. proposed an adaptive sensitivity adjustment method based on sky brightness dynamic compensation. By controlling the light flux, changing the bias resistance and adjusting the circuit gain, the requirements of sensitivity adaptive stability were effectively achieved. Li et al. [15] proposed to design the receiving module of the sky screen target by using the spliced PIN detector, aiming to improve the optical path system of the sky screen target to eliminate the interference of external strong light. In the improved design of the existing sky screen target, the research focus mainly lies in the optimization of the optical path system of the detection light curtain and the performance enhancement of the photoelectric detection conversion module [16,17,18]. However, to achieve precise detection of projectiles passing through the sky screen, it is also necessary to significantly enhance the signal gain of the photoelectric conversion circuit. Although this high-gain design can enhance signal sensitivity, in complex environmental interference conditions, it is prone to cause the interfering signals to be amplified synchronously, thereby affecting the accuracy of detection [8,19]. More importantly, the sky screen target sensor has a unique signal output characteristic—once its hardware structure is determined, the output signal is directly restricted by the background of the test environment. Therefore, how to develop targeted signal noise reduction optimization methods based on the inherent characteristics of the output signals of the sky screen target has become the core research topic for improving the detection performance of the sky screen target at present. For this purpose, Liu [12] et al. used the EEMD algorithm to decompose the original signal, and eliminated the interference of the large vibration signal by calculating the intrinsic mode function of the signal. Then, based on the spectrum analysis of the signal, filtering and noise reduction were carried out to eliminate the noise. Li [20] proposed an orthogonal wavelet threshold denoising method based on EMD based on empirical mode decomposition, combined with wavelet denoising theory. The order of the EMD filter is adaptively determined by the continuous mean square error criterion. Wavelet threshold denoising is applied to the high-frequency IMF components, which not only retains the effective signal components but also avoids the distortion caused by directly discarding the high-frequency components. Pang [21] proposed a signal denoising method of variational mode decomposition (VMD) based on the whale optimization algorithm combined with the Hausdorff distance. This method automatically optimized the modal number parameters of VMD by the whale optimization algorithm, quantified the similarity between each IMF component and the original signal by Hausdorff distance, and used an adaptive threshold to denoise high-frequency modes. While retaining the characteristics of the effective signal, noise interference is significantly suppressed, thereby enhancing the noise reduction performance of complex non-stationary signals. Wang [22] et al. proposed a noise reduction method based on empirical mode decomposition-cross power spectral density (EMD-CPSD). In this method, the signal was decomposed into multiple intrinsic mode functions by EMD, and the correlation between the mode components and the original signal was analyzed by combining the cross-power spectral density. Veluchamy et al. [23] proposed a detail-preserving noise suppression model based on Retinex variational decomposition to address issues such as poor quality and low signal-to-noise ratio caused by underexposure of images. This model separates illumination from reflectance through variational decomposition and optimizes the illumination coefficient using a weighted transformation to improve the overall effect. Finally, a bilateral non-iterative filter is used to suppress noise and errors while retaining high-quality results. The noise reduction algorithms designed in these studies have greatly improved the test system for the application of sky screen target sensors. However, for increased noise and random interference signals, the recognition rate of traditional recognition algorithms is still relatively low.
Based on the characteristics of the projectile signal output by the sky screen target sensor, this study proposes a noise reduction method that combines the optimization of variational mode decomposition by the whale optimization algorithm with wavelet threshold denoising. The main work and contributions of this research are as follows:
- In response to the special requirements of projectile parameter measurement, this study established a mathematical model of the optical characteristics of projectiles in a light curtain space. The core of this model lies in precisely describing the dynamic process of the projectile passing through the light curtain at the moment. By quantifying the absorption and occlusion relationship of the projectile target characteristics to the light energy, the physical basis of the output signal of the photoelectric sensor is constructed, which provides a reliable theoretical basis for the subsequent noise reduction processing.
- Taking the projectile signal output by the sky screen target sensor as the research object, the intrinsic characteristics of the projectile target signal were analyzed, and the fundamental reason for its symmetry was explained. Due to the symmetry characteristics of the projectile target signal, the traditional VMD algorithm is prone to modal aliasing or component redundancy problems during adaptive decomposition. To this end, we propose a target signal denoising algorithm based on the whale optimization algorithm (WOA) to optimize variational mode decomposition (VMD) combined with wavelet threshold denoising. In terms of noise reduction processing of sky screen targets, based on the basic VMD algorithm, the minimum envelope entropy of WOA is used as the fitness function to optimize the VMD parameters to obtain the best parameter combination of VMD. An adaptive wavelet threshold is introduced to reduce the noise of the output signal of the sky screen target sensor, forming a WOA-VMD and wavelet threshold noise reduction algorithm for sky screen target projectile signals.
- We proposed a noise reduction algorithm for the projectile signal of the sky screen target combining WOA-VMD and wavelet threshold, analyzed the spatial projectile characteristics of the light screen and the output signal characteristics, and constructed the effective signal dataset generated by the projectile passing through the light screen of the sky screen target. Experimental verification was conducted on the effective signal dataset. Based on the analysis of the results, the algorithm proposed in this study effectively suppressed the noise in the signal, improved the signal-to-noise ratio of the projectile signal, and had a better effect compared with other noise reduction algorithms, achieving noise reduction processing of the projectile signal of the sky screen target.
2. Analysis of the Characteristics of Projectiles and Output Signals in the Sky Screen’s Light Curtain Space
As a special type of photoelectric detection sensor, the sky screen target has certain differences in its optical path structure from conventional photoelectric detection sensors. The main difference lies in that the detection area formed by the sky screen target is a fan-shaped detection plane with a certain thickness. Only when the projectile passes through the detection plane, blocking the light energy entering the photodetector device and being sensed, the photodetector can output a signal, which is used by the system to calculate the flight parameters of the projectile. Therefore, it is necessary to study the optical properties of projectiles in the light curtain space and analyze the characteristics of the projectile signal output by the sky screen target.
2.1. Mathematical Model of Optical Properties of Projectiles in Light Curtain Space
Suppose the projectile passing through the sky screen target light curtain is a cylinder with a length of and a diameter of , as shown in Figure 1. The projectile surface is divided into two-dimensional small units, and the radiation energy of each small unit is calculated by using the radiation characteristics of each small unit in space. By using the principle of superposition and integration, the total radiation energy of the projectile surface can be calculated. Let be the area of the -th unit plane element on the surface of the projectile, be the imaging area of on the photosensitive surface of the photodetector, be the Angle between the surface normal of the unit plane element and the radiation reflection of the projectile, is the distance from the projectile in the light curtain to the optical objective lens, and be the thickness of the light curtain at the height distance of .
Figure 1.
Schematic diagram of spatial projectile imaging with a light curtain.
If the surface of the projectile is composed of unit areas, is the sum of small surface elements of the projectile surface . Based on Figure 1, the surface of the projectile in the detection light curtain is unfolded into a planar grid, as shown in Figure 2. Through the optical imaging relationship, the total radiant energy of the projectile surface obtained on the photosensitive surface of the photodetector can be calculated.
Figure 2.
Schematic diagram of spatial projectile grid element imaging.
According to the radiation principle of the light curtain space projectile grid element on the photodetector sensitive surface, the optical characteristics of the space projectile can be equivalent to the superposition of the optical characteristics of the discrete surface elements of the projectile. Combining with the bidirectional reflection distribution characteristics of the radiation on the surface of the spatial projectile in the detection light curtain, the surface of the projectile can be decomposed into a series of independent surface element sets. By superimposing the reflection characteristics of each surface element, the overall optical radiation characteristics of the spatial projectile in the detection light curtain area can be obtained. The bidirectional reflection distribution of any surface element on a projectile is shown in Figure 3.
Figure 3.
Schematic diagram of the bidirectional reflection distribution of projectiles in the light curtain space.
The total characteristic parameters of the projectile in the light curtain space can be expressed as a set of discretized surface element characteristic quantities . Then, the characteristic quantity of the -th unit surface element is
In Equation (1), represents the coordinates of the center of the surface element ; is the normal direction vector of the element surface element ; is the diffuse reflection coefficient of the surface element; is the surface element illumination weighting factor; is the weighting factor for surface element observation.
The spectral irradiance of the projectile reflection in the light curtain space is
In Equation (2), represents the spectral irradiance of the space projectile reflection; represents the spectral illuminance of surface element reflection.
According to the detection principle of the sky screen target and the projectile surface radiation model, the energy of the entry pupil of the sky screen target optical system can be calculated by using the bidirectional reflection distribution function. The bidirectional reflection distribution function of the projectile in the light curtain space can be expressed as
In Equation (3), and represent the incident zenith Angle and the azimuth Angle, respectively. and represent the zenith Angle and azimuth Angle of reflection. represents the spectral radiation wavelength; and represent the incident spectral radiation illuminance and the reflected spectral radiation luminance, respectively.
Based on the bidirectional reflection distribution function of the projectile in the light curtain area of the sky screen target, the spectral radiation luminance of the -th unit reflected on the projectile surface can be expressed as
The radiation flux of the background radiation reflected by the -th unit of the projectile surface at the entry pupil of the photodetector is
In Equation (5), is the Angle between the line connecting the -th unit of the projectile surface and the center of the entry pupil and the optical axis. is the area of the optical system entering the pupil. and represent the corresponding spectral wavelength ranges of the photodetector. Then the radiance of the background radiation reflected by the unit on the surface of the projectile at the entry pupil of the photodetector is
Based on the optical imaging theory of the sky screen target and the principle of energy calculation for the entry pupil, considering the spectral transmittance of the optical lens in the optical system, the radiation flux of the background radiation reflected by the -th unit of the projectile surface on the photosensitive surface of the photodetector is converted to
In Equation (7), represents the spectral transmittance of the optical lens.
According to the image relationship of the sky screen target projectile imaging, the radiation illuminance of the background radiation reflected by the -th unit of the projectile surface on the photosensitive surface of the photodetector is
In Equation (8), represents the magnification of the optical system.
The contribution of the space projectile of the sky screen target light curtain to the photodetector is mainly the sum of the radiation of all unit surface elements on the projectile surface. Then, the total radiation flux and total radiation illuminance of the space projectile of the light curtain are
After obtaining the total radiant flux and total radiant illuminance of the projectile in the light curtain space, based on the principle of the photoelectric effect, the optical signal is converted to an electrical signal through the photoelectric device using the photogenerated current. Then, after being filtered and amplified by the signal processing circuit, the final output is an electrical signal characterizing the projectile’s passage through the curtain.
2.2. Analysis of the Output Signal Characteristics of the Sky Screen Target
The process of the projectile passing through the light curtain detected by the sky screen target can be divided into three key moments: the entry of the warhead, the passage of the projectile body, and the departure of the projectile tail [24]. The warhead is presented as a relatively sharp conical shape. When it enters the light curtain first, the light-blocking information of the warhead gradually increases, and the output signal of the photodetector forms a steep rising edge due to the relatively fast warhead speed. When the cylindrical part of the projectile passes through, the light-blocking information in the projectile and at the projectile tail sensed by the photosensitive surface of the photodetector increases to the maximum value, and the signal shows a peak or plateau. The state of the output signal of this part of the photodetector is determined by the relative relationship between the projectile and the thickness of the light screen. First, if the thickness of the light screen at the shooting position of the projectile is less than the length of the projectile, that is, , the projectile body is only partially blocked, the light flux has not reached saturation, and the signal peak appears as a continuous process; Secondly, if the thickness of the light curtain presented at the shooting position of the projectile is equal to the length of the projectile, that is, , it indicates that during the process of the projectile passing through the light curtain, there is a moment when the entire area of the projectile body is within the light curtain. At this time, the output of the photodetector will have a peak moment, and the peak will be significantly higher than the peak in the state. Thirdly, if the thickness of the light curtain at the shooting position of the projectile is greater than the length of the projectile, that is, , it indicates that the entire projectile body is within the light curtain and there is a continuous process during which a continuous maximum shading amount occurs, and the signal output by the photodetector will also show a continuous peak. When the tail leaves the light curtain at the moment, the shading drops sharply, and the signal generates a steep falling edge. Due to the high-speed movement of the projectile, its signal waveform shows symmetry between the rising edge and the falling edge in terms of slope and time width, eventually forming a waveform with the midpoint of the signal peak as the center of symmetry and the rising edge and the falling edge being symmetrical.
2.3. Analysis of the Output Signal Components of the Sky Screen Target
Section 2.2 conducts a qualitative analysis of the signal output by the projectile passing through the photodetector based on its geometric shape and the amount of light blocking it forms in the thickness of the light screen. To further analyze the characteristics of projectile signals in depth, this study collected an actual projectile signal in an outdoor environment, as shown in the yellow part in Figure 4. When the projectile moves at a constant speed in a straight line through the light screen or sky screen target, the signal waveform it generates exhibits significant symmetry characteristics: the rising edge and falling edge of the waveform are highly consistent in shape, time width and slope, and the peak point is precisely located at the center of the signal waveform. The negative part of the signal waveform below 0 amplitude originates from the discharge process of the internal capacitor of the sky screen target. However, the output signal of the photodetector is not only determined by the geometry of the projectile and the amount of light blocking it forms in the light curtain. For the output signal of the sky screen target detection, it also involves signals such as mosquitoes, shock waves, and sudden changes in natural light. Mosquito signals are formed when mosquitoes interfere with the flight close to the lens. The low-frequency signal components they generate are easily confused with the real projectile signals. Shock waves are generated by air disturbances excited by projectiles and have high-frequency and short-time characteristics, but similar signals may still be triggered at specific heights. Sudden changes in natural light contain both high-frequency and low-frequency components simultaneously. All these interfering signals will have an impact on the output signal. Meanwhile, the output signal of the sky screen target also contains background noise, which mainly comes from the thermal noise of electronic components and environmental light interference, etc. This kind of noise is random and persistent, and it will be superimposed on the target signal, reducing the signal-to-noise ratio and affecting the detection accuracy of weak signals [25,26,27]. Figure 4 shows the output signal of the sky screen target collected under interference.
Figure 4.
The output signal of the sky screen target.
3. PSO-VMD Combined with Wavelet Threshold Denoising Method
3.1. Basic Principles of Variational Mode Decomposition(VMD)
As an adaptive signal Decomposition algorithm, the VMD [28] algorithm can efficiently decompose each mode in the signal and determine its related frequency bands. Its decomposition process includes the construction of the variational problem and the solution of the variational problem. The algorithm has two basic criteria. The first is that the sum of the bandwidths of the center frequencies of each modal component is the smallest; The second is that the sum of all modal components equals the original signal.
First, construct a variational model to find the optimal modal function, let the input signal into modes with limited bandwidth, , and minimize the sum of the bandwidths of all modal functions.
In Equation (10), represents the number of modes; is the impulse function; is an imaginary unit; represents a gradient operation; stands for convolution. is the set of all modes; represents the center frequencies of each mode. The constraint condition is that the sum of all modal signals is equal to the original signal.
To transform the constrained optimization problem in Equation (10) into an unconstrained optimization problem, quadratic penalty terms [29] and Lagrange multiplier algorithms [30] are usually adopted. The Lagrange expression obtained through expansion is
In Equation (11), is the Lagrange multiplier; is a secondary penalty factor.
Then, the saddle point of Equation (11) is calculated using the Alternating Direction Method of Multipliers (ADMM) to obtain the optimal solution of Equation (11). The iterative equation of , and is shown in Equation (12).
In Equation (12), , and are the frequency-domain forms of , and
respectively. is the center of gravity of the power spectrum of the -th mode; is equivalent to the Wiener filter of the current residual ; is a coefficient greater than 0.
3.2. Principle of WOA Optimization Algorithm
The WOA is an optimization algorithm inspired by the predatory behavior of whales, especially humpback whales [31]. Its core mechanism consists of three parts: shrinking the encircled prey, spiral bubble attack, and random search. In this algorithm, the whale population is represented by a set of vectors, each of which defines the position and speed of individual whales. The algorithm simulates the exploration and interaction behaviors of whales during foraging and risk avoidance, and these behaviors jointly drive the dynamic update of the population status. The goal of the algorithm is to find the optimal combination of parameters in the solution space.
- Surround the prey
Whale groups regard the current optimal solution as “prey”, and other individuals adjust their positions based on their distance from the optimal solution. If the individual is at a considerable distance from the prey, the algorithm tends to conduct global exploration. If the distance is relatively short, perform a local fine search and gradually approach the optimal solution. This strategy balances global exploration and local development capabilities by dynamically adjusting the search range.
- 2.
- Spiral attack
When a whale approaches its prey, it moves along a spiral path and spits out a bubble net to encircle it. In the algorithm, this behavior is simulated through the spiral equation to generate a spiral path around the optimal solution, achieving a fine search within a local range. This strategy is triggered with a certain probability to enhance the convergence accuracy of the algorithm near the optimal solution.
- 3.
- Random search
When whales are unsure of the location of their prey, they randomly choose other individuals to explore. This strategy, by introducing randomness, helps the algorithm escape from local optimum and enhances the global search ability. The combination of random search and bounding strategy effectively avoids premature convergence of the algorithm.
In terms of the algorithm flow, the WOA first initializes the whale population, that is, randomly generating the positions and speeds of a group of whales as the initial state of the algorithm. Then, calculate the adaptive evaluation value of the whale herd based on the evaluation function. The algorithm updates candidate solutions through search, encirclement and predation behaviors. During each iteration, the position update strategy for each whale is determined by the value of the random number and the modulus of the coefficient vector. As the iteration proceeds, the whale population keeps approaching the optimal solution.
3.3. VMD of Projectile Signals Optimized by WOA
The key parameters in the VMD algorithm include the number of decomposition layers , the penalty factor , the noise tolerance , and the discrimination accuracy . Research shows that the influence of noise tolerance and discrimination accuracy on the decomposition results is significantly smaller than that of the first two parameters, and the default values are usually adopted. However, the selection of the number of decomposition layers and the penalty factor is highly dependent on experience. If not set properly, it will significantly reduce the decomposition accuracy. At present, there is no unified method that can simultaneously take into account the independent influence and interaction of these two parameters. To this end, this paper introduces the WOA to optimize the VMD parameters, in order to efficiently determine the optimal K and α values and improve the accuracy of signal decomposition.
Based on the balanced ability of global exploration and local development of the WOA, this paper proposes the WOA-VMD signal decomposition method. This method dynamically searches for the optimal parameter combination through the WOA, significantly improving the decomposition effect of VMD on complex signals. The specific implementation process is shown in Figure 5, presenting the complete steps from parameter initialization to the final signal decomposition.
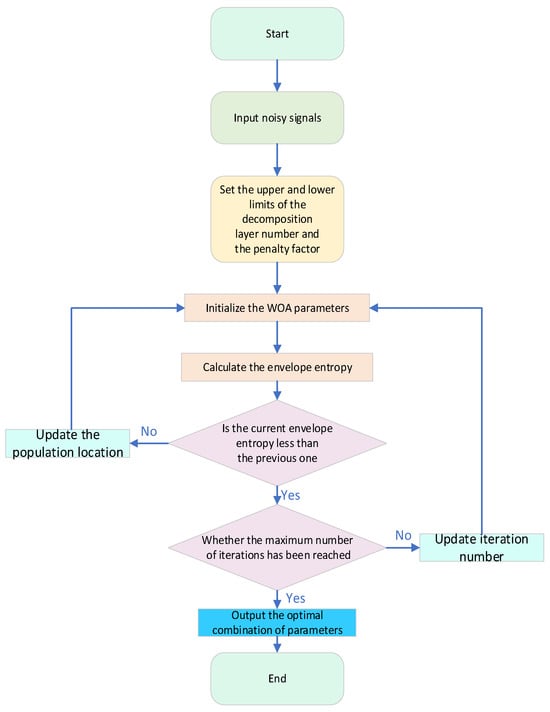
Figure 5.
Flowchart of noise reduction for WOA-VMD.
The optimization of VMD parameters using WOA mainly involves selecting the optimal number of decomposition modes and the penalty factor . When optimizing the VMD parameters, the envelope entropy is selected as the fitness function of WOA. Its calculation is based on the statistical characteristics of the signal envelope and can more directly reflect the energy distribution and structural complexity of the signal. The larger the envelope entropy value, the more intense the signal envelope fluctuation and the wider the energy dispersion, which may contain more random components or noise. The smaller the envelope entropy value is, the more stable the signal envelope is, the more concentrated the energy is, and the more significant the characteristic frequency is. Therefore, in the VMD parameter optimization, the envelope entropy can be used as a fitness function that is closer to the physical characteristics of the signal: by minimizing the envelope entropy value, the energy of each modal component is concentrated and the structure is clear, thereby quickly locking the optimal combination of and and improving the accuracy of signal decomposition. The envelope entropy can be calculated by Equation (13).
In the equation, represents the length of the signal sequence; is the envelope signal obtained after the Hilbert transformation of the original signal. represents the corresponding power spectral entropy.
3.4. Modal Optimization Combined with Wavelet Threshold Denoising Algorithm
3.4.1. Modal Optimization
Based on the analysis of the output signal characteristics of the sky screen target sensor, it can be known that the composite signal it acquires is mainly composed of the high-frequency component signal generated by the projectile passing through the sky screen target, the low-frequency signal interfered by similar targets (such as low-speed flying insects), and the full-frequency background noise of the system’s inherent noise, resulting in the presence of non-stationary components such as high-frequency noise and sudden interference in the signal. The variational mode decomposition (VMD) algorithm, with its frequency-domain adaptive decomposition capability, can effectively decoufy composite signals into several narrowband intrinsic mode components (IMF), achieving the separation and noise reduction in target signals at different frequencies. However, the performance of the VMD algorithm is highly dependent on the selection of the decomposition mode number and the penalty factor . Currently, it mainly relies on manual experience-based trial-and-error adjustment, which is inefficient and difficult to adapt to complex and changeable signal environments.
To this end, this paper combines the advantages of the WOA and the VMD algorithm. Through the optimization of the WOA, two main parameters that affect the decomposition effect of VMD—the number of decomposition layers and the penalty factor are obtained to achieve the purpose of accurate decomposition and obtain a set of optimal decomposition results that can represent different frequency components of the original signal. In order to quantitatively evaluate the decomposition effect of the VMD algorithm, this paper calculates the Variance Contribution Ratio (VCR) of each modal component to reflect the proportion of each modal component to the energy of the original signal, thereby determining whether the VMD achieves effective modal separation. The VCR calculation formula is shown in Equation (14). Remove the IMF with low VCR; Finally, the remaining IMF is subjected to improved wavelet threshold denoising processing to obtain the denoised IMF, which is then reconstructed to ultimately obtain the denoised projectile signal.
In Equation (14), represents the variance contribution rate of the -th eigenmodulus function; is the value of the -th IMF at the -th data point. represents the total number of data points of the signal, that is, the number of samples. is the total number of IMF obtained through decomposition.
3.4.2. WOA-VMD Combined with Wavelet Threshold Noise Reduction
Since the signals collected from the sky screen target usually carry noise, this may cause the effective signal to be severely distorted or drowned out by strong noise. Therefore, achieving signal-to-noise separation has become an important aspect of signal noise reduction. This study adopts the wavelet transform method mainly because it has excellent time-frequency localization properties and can better distinguish high-frequency signals from noise. The success of wavelet denoising lies in the fact that the wavelet coefficients are sparsely distributed, resulting in a reduction in the entropy of the signal after transformation. This means that the signal is easier to represent and compress in the wavelet domain, thereby helping to improve the stability and clarity of the signal. Moreover, the multi-resolution representation method adopted by wavelet transform can effectively capture the non-stationary features of the signal, such as edges, spikes and breakpoints, etc. This enables the wavelet transform to describe the local properties of the signal more accurately, which is conducive to feature extraction and protection. Meanwhile, wavelet transform can achieve signal decorrelation, and after the transform, the noise shows a whitening trend. Therefore, it is more conducive to denoising in the wavelet domain than in the time domain, thereby improving the denoising effect [32].
For a noisy signal X of length N, let . Use the fast algorithm of the orthogonal wavelet transform to obtain the scale coefficient at low resolution and the wavelet coefficients at each resolution, where there are a total of N wavelet transform coefficients. When dealing with boundaries, the periodic extension method is often adopted.
To maintain the overall shape of the signal unchanged, all the low-frequency transformation coefficients are retained, . In this denoising method, the output signal of the sky screen target is the input signal of the algorithm, and the adjustable threshold function of Equation (15) is selected as the wavelet threshold function of .
The improved wavelet threshold algorithm of Equation (15) is used to denoise the effective components, and the denoised signal is obtained by the reconstruction method.
The processing steps of WOA-VMD wavelet threshold denoising are shown in Figure 6, and its specific flow is as follows:
- Optimize VMD parameters using WOA. The VMD parameters to be optimized are combined as the positions of individual whales. According to the position of each whale, the input signal is decomposed by VMD, the corresponding envelope entropy value is calculated, and the position of the individual corresponding to the current envelope entropy value when it is the smallest is recorded. As the number of iterations increases, the change in fitness values will gradually stabilize. Finally, after meeting the termination condition, the optimal position is output as the best parameter combination for the VMD of the input signal .
- Based on the optimal parameters obtained in step (1), perform VMD on the input signal to obtain the corresponding modal components IMFs, and calculate the envelope entropy corresponding to each IMF [33].
- The improved wavelet threshold algorithm is used to denoise the effective components, and the reconstructed method is utilized to obtain the denoised effective modal component signals.

Figure 6.
Flowchart of WOA-VMD combined wavelet threshold denoising.
4. Experiment and Result Analysis
4.1. Dataset Acquisition
To comprehensively verify the robustness of the WOA-VMD wavelet threshold denoising algorithm proposed in this paper in complex noise environments, this study designs an experimental scheme based on the diversity of projectile types and selects three types of projectiles with lengths of 5 mm, 10 mm, and 15 mm, respectively. A high-precision photoelectric sky screen target with a sampling frequency of 10 kilohertz, a resolution of 0.1 mm, and a response time of no more than 1 microsecond was used to collect the shot passing through the screen signal. The thickness of the light screen was fixed at 10 mm to collect the output signal of the sky screen target under three conditions: the thickness of the light screen is greater than, equal to, or less than the length of the projectile. Through multi-scenario tests, a total of 8654 valid signal samples were collected. Some samples are shown in Figure 7.
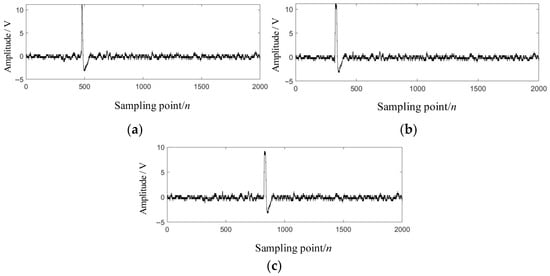
Figure 7.
Output signals of projectiles of different lengths entering the target. (a) The length of the projectile is equal to that of the sky screen target. (b) The length of the projectile is greater than that of the sky screen target. (c) The length of the projectile is less than that of the sky screen target.
To more objectively measure the noise reduction effect of the method proposed in this paper, this paper selects residual variance ratio (RVR), noise reduction ratio (NRR), signal-to-noise ratio (SNR), and root mean square error (RMSE) to evaluate the noise reduction effect. Among them, RVR reflects the degree of noise residue, NRR assesses the improvement of noise reduction performance, SNR measures the intensity comparison between the signal and the noise, and RMSE quantifies the deviation between the predicted value and the true value. The calculation formulas for these four evaluation indicators are:
In Equation (16), represents the difference between the original signal and the filtered signal, and indicates the original signal. represents the signal after noise reduction. is the standard deviation of the original signal; is the standard deviation of the noise reduction signal. and reflect the degree of dispersion of the data before and after noise reduction.
4.2. Experimental Verification
To verify the effectiveness and robustness of the method proposed in this article, this section first randomly selects any output projectile signal from the output signal dataset of the sky screen target for noise reduction processing. The original signal is shown in Figure 8. It can be seen that this signal contains various noises, including background noise, mosquito interference, and so on.
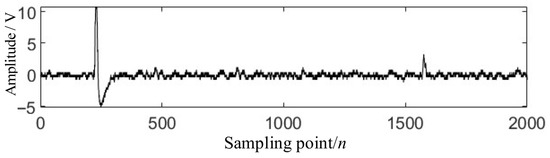
Figure 8.
Original projectile signal.
To obtain the characteristic information of the projectile signal, noise reduction processing was carried out on the signal. Among them, WOA optimized the VMD parameters and obtained the optimal parameter as [6,3327], and its decomposition result is shown in Figure 9.
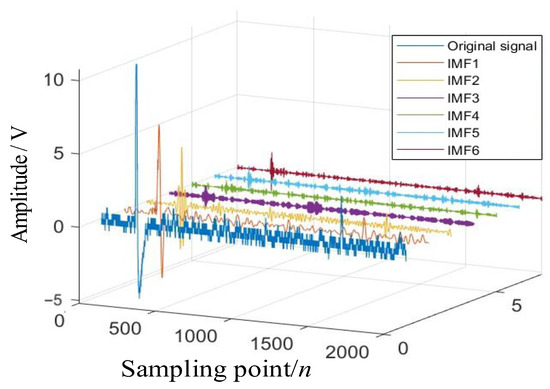
Figure 9.
Decomposition results of WOA-VMD.
Among them, the data in the first column of the image is the original projectile signal, and the data in the 2nd to 7th columns are the IMF components of the signal. After obtaining each IMF component, the key step is to distinguish the useful signal-dominated mode from the noise-dominated mode. For this reason, VCR is adopted as the criterion in this article. VCR quantifies the contribution of each IMF component to the total energy of the original signal and is an effective indicator for distinguishing signals from noise in the field of signal processing. The VCR calculation results of each IMF component are shown in Table 1. It can be clearly observed from the data in the table that the energy distribution of the IMF component presents two completely different groups. The VCR value of IMF1-2 is relatively high, accounting for 75.2% of the signal body. This difference in energy distribution provides strong empirical evidence for distinguishing signals from noise.

Table 1.
IMF Variance Contribution rate.
Signal reconstruction is carried out by selecting IMF1 and IMF2 as effective components, as shown in Figure 10a. Compared with the original signal in Figure 8, the reconstruction result significantly reduces noise interference while retaining the main features, but there are still residual noise components. To further enhance the signal-to-noise ratio, the wavelet threshold method was adopted to conduct secondary processing on the reconstructed signal. The final denoising effect is shown in Figure 10b. It can be seen that the high-frequency noise is effectively suppressed, the signal contour is clearer, and the target projectile signal is effectively retained.
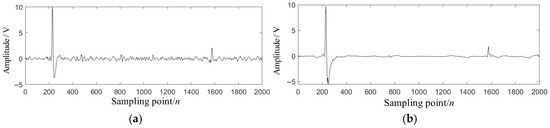
Figure 10.
Results of WOA-VMD combined with wavelet threshold noise reduction. (a) WOA-VMD noise reduction results (b) Wavelet threshold processing results.
To further verify the robustness of the algorithm proposed in this study under different environments, the output signals of different projectiles passing through the sky screen target sensor were measured through experiments, corresponding to three situations: greater than, equal to, and less than. The measured output signals of the sky screen target in the above three cases are denoised by adopting the denoising algorithm proposed in this article. As shown in Figure 11, the measured output signals of the sky screen target under three different conditions are compared with the signal waveforms after applying the WOA-VMD wavelet threshold noise reduction.
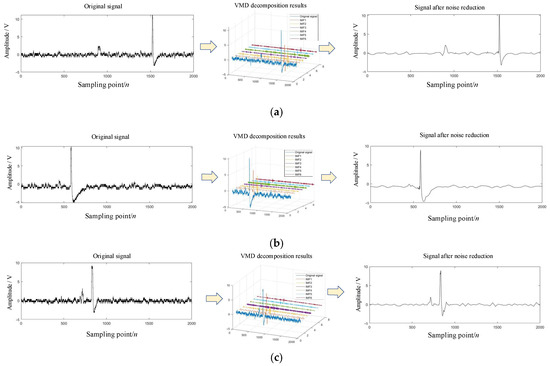
Figure 11.
Results of WOA-VMD combined with wavelet threshold denoising under different conditions. (a) The length of the projectile is equal to that of the sky screen target. (b) The length of the projectile is greater than that of the sky screen target. (c) The length of the projectile is less than that of the sky screen target.
For the three signals as shown in Figure 11, the WOA optimized VMD algorithm is first used to decompose them. Based on the VCR values of the three results, the calculation results are shown in Table 2. The IMF1 and IMF2 components are selected for reconstruction, and then the reconstructed signals are subjected to wavelet threshold processing for secondary noise reduction to obtain the final signal. From the waveform comparison diagrams before and after noise reduction, it can be found that the acceleration response signals in the three cases are smoother after being processed by the joint noise reduction algorithm in this paper, demonstrating the robustness of the WOA-VMD wavelet threshold noise reduction algorithm to different signals. The effective removal of most of the glitches in the signal indicates that the noise reduction algorithm in this paper has a significant effect on noise reduction and also has a good effect on noise reduction in interfering signals.
Table 2.
VCR Values of Different projectile signal Components.
To objectively compare the noise reduction performance of the algorithm proposed in this paper with other signal noise reduction algorithms for measured signals, this paper selects three signal datasets of sky screen target sensors under different projectile lengths as the test objects, and uses RVR and NRR without reference signals as evaluation indicators to compare the algorithm proposed in this paper with noise reduction algorithms such as EMD, CEEMDAN or EWT. The evaluation results of the noise reduction effects of the three types of test objects using the above indicators are shown in Table 3.
Table 3.
Evaluation of noise reduction effects of different algorithms on three types of projectile signals.
From the comparison of noise reduction effects in Table 3, it can be seen that the method proposed in this paper outperforms other methods in the four indicators of RVR, NRR, SNR and RMSE, especially in the scenarios where the shot length and screen thickness are matched differently, the performance is stable. When the projectile length is greater than the curtain thickness, the RVR of the method proposed in this paper is 0.115, which is significantly lower than 0.130 of CEEMDAN, 0.145 of EMD and 0.133 of EWT. The NRR is 2.95, which is higher than 2.74 of CEEMDAN, 2.64 of EMD and 2.69 of EWT. The SNR is 28.78, which far exceeds the 9.06 of EMD and 13.33 of EWT, and the RMSE is 12.83, which is much lower than the 55.86 of EMD, indicating that its signal-to-noise ratio improvement is more significant and noise suppression is more thorough. When the projectile length is equal to the curtain thickness, the RVR of the method proposed in this paper is 0.120, the RMSE is 11.25, still the lowest, the NRR is 2.88, and the SNR is 27.45, maintaining the leading position. However, the SNR of EMD and EWT is less than 10, indicating that the method proposed in this paper has a stronger processing ability for complex signals. When the projectile length is less than the curtain thickness, the SNR of the method proposed in this paper reaches 29.99, and the RMSE is 13.27, which are much lower than 56.72 of EMD and 35.18 of EWT, further verifying its adaptability. In contrast, although the wavelet thresholds of CEEMDAN and VMD + Wavelet threshold are close to the method proposed in this paper in some indicators, the gaps in SNR and RMSE are obvious. EMD and EWT, on the other hand, have a low signal-to-noise ratio due to modal aliasing or frequency band partitioning issues. Overall, the method proposed in this paper effectively suppresses noise interference and improves signal quality by optimizing the signal decomposition and reconstruction strategies. Especially in scenarios where the projectile length does not match the curtain thickness, its stability and robustness are significantly better than those of traditional methods.
As shown in Figure 12, the WOA-VMD combined with wavelet threshold denoising algorithm proposed in this study is aimed at the noisy projectile signals collected by the double sky screen target device. It solves the problems of inaccurate feature extraction and large velocity calculation errors in traditional methods under complex noise interference, thereby more accurately extracting the time value of the projectile signal. When the noisy projectile signal collected by the double sky screen target device is input into the WOA-VMD threshold denoising algorithm proposed in this study, the algorithm first adaptively determines the VMD modal decomposition parameters by introducing the whale optimization algorithm (WOA) to achieve multi-scale feature extraction of the signal. Subsequently, the high-frequency noise modes are suppressed based on threshold rules, while the low-frequency effective components containing projectile features are retained. After noise reduction processing, the signal-to-noise ratio of the signal is significantly improved, effectively eliminating various interferences. The noise reduction signal is identified by an improved peak detection algorithm. Combined with the detector’s acquisition frequency of 250 KHZ, the precise moments when the projectile passes through the light curtain can be accurately determined as a and b. Finally, with a fixed distance of 2 m between the sky screen targets, the velocity of the projectile is calculated based on the velocity equation.
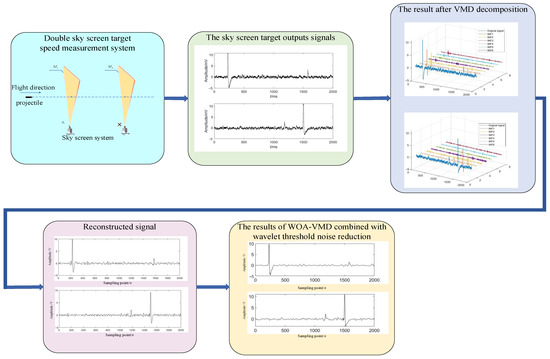
Figure 12.
Noise reduction results of the speed measurement experiment of the double sky screen target device.
5. Conclusions
This study takes the typical sky screen target sensor light curtain speed measurement system as the research object and proposes an innovative processing method for its signal noise reduction problem. Based on the variational mode decomposition (VMD) algorithm, the minimum envelope entropy of the whale optimization algorithm (WOA) was introduced as the fitness function to optimize the VMD parameters, thereby obtaining the optimal parameter combination. Furthermore, a noise reduction algorithm for the projectile signal of the sky screen target with WOA-VMD combined wavelet threshold was constructed. Furthermore, based on the WOA-VMD combined with the wavelet threshold method, a dataset of effective moment values generated by projectiles of different lengths passing through the light curtain of the sky screen target was established. Eventually, a noise reduction algorithm for the sky screen target sensor was formed, achieving effective noise reduction in the sky screen target signal with interference. Through experimental tests, the following conclusions were drawn:
- By introducing the minimum envelope entropy of the WOA as the fitness function, the intelligent optimization of the core parameters of VMD was achieved, thereby accurately extracting the signal features of projectile targets.
- Algorithm performance advantages: The WOA-VMD combined wavelet threshold algorithm constructed can not only effectively separate the signal components of the projectile target, but also significantly improve the signal-to-noise ratio of the output signal of the sky screen target, providing high-quality data for subsequent parameter recognition.
- This algorithm can be directly applied to the parameter testing system of the flying projectile of the light curtain target, and its universality is extended to the audio-visual composite detection scenario. With the development of artificial intelligence and the improvement of deep learning theory, the signals output by the sky screen target sensor have particularities. Future work can explore and develop an intelligent signal noise reduction system for sky screen targets through the framework of deep learning theory. The algorithm in this article lays the foundation for future research.
Author Contributions
Conceptualization, H.H. and H.L.; methodology, H.H. and H.L.; software, H.H.; validation, H.H.; formal analysis, H.H. and H.L.; investigation, H.L.; resources, H.H. and H.L.; writing—original draft preparation, H.H.; writing—review and editing, H.H. and H.L.; visualization, H.H.; supervision, H.L.; project administration, H.L.; funding acquisition, H.L. All authors have read and agreed to the published version of the manuscript.
Funding
This research was funded by the Key Science and Technology Program of Shaanxi Province, grant number 2023-YBGY-342, and the National Natural Science Foundation of China grant number 62073256.
Data Availability Statement
The original contributions presented in this study are included in the article. Further inquiries can be directed to the corresponding author.
Conflicts of Interest
The authors declare no conflicts of interest.
References
- Gao, F.J.; Dong, T.; Chen, D.; Zheng, X. Identification Method of Double-Projectile Using Triangle Array Photoelectric Detection. J. Ordnance Equip. Eng. 2019, 40, 188–192. [Google Scholar]
- Li, L.; Luo, H.E.; Liu, Y.; Kong, X.; Gu, J.; Xia, Y. Projectile feature point interpretation based on improved subpixel edge detection. Electron. Meas. Technol. 2022, 45, 146–151. [Google Scholar]
- Guan, H.; Li, H.S.; Zhang, X.Q. A Projectile Recognition Method Under Overlapped Imaging Based on Light Field Imaging. Electron. Opt. Control. 2021, 28, 93–98. [Google Scholar]
- Ni, J.P.; Song, Y.G.; Feng, B. The principle for measuring motion parameters of projectiles using two sky screens in vertical intersection manner. Opt. Tech. 2008, 34, 388–390+394. [Google Scholar]
- Wang, J.; Zhang, Z.X.; Dong, T. Research on the measurement method of the vertical target of the six light screens based on double N-type. Opt. Tech. 2024, 50, 188–193. [Google Scholar]
- Wu, Z.C.; Xiu, L.Z. On-sate calibration method of target distance of the sky screen target velocity measuring system. Optik 2018, 178, 483–487. [Google Scholar] [CrossRef]
- Li, H.S. An Optical Transformation Design Method of sky screen target sensor Based on Lens Convergence. IEEE Sens. J. 2024, 24, 40685–40695. [Google Scholar] [CrossRef]
- Wang, J.; Feng, B.; Zhang, J.J. Research of Double Light Screen Triggering Device Based on X-ray Light Source. In Proceedings of the 2019 IEEE 2nd International Conference on Automation, Electronics and Electrical Engineering (AUTEEE), Shenyang, China, 22–24 November 2019; pp. 362–365. [Google Scholar]
- Li, H.; Ni, J.P.; Yang, X.D.; Dong, Q. Test influence of screen thickness on double-N six-light-screen sky screen target. Open Phys. 2022, 20, 1–8. [Google Scholar] [CrossRef]
- Wu, Z.C.; Ni, J.P.; Zhang, X.L.; Wu, Y. Study on verification device of screen spatial location parameters of sky screen target. Optik 2014, 125, 3770–3773. [Google Scholar] [CrossRef]
- Chen, D.; Ni, J.P.; Bai, L.; Chen, D. Detection method for the dynamic signal of sky screen-based velocity measurement system using Bayesian Generalized Likelihood Ratio Tests. Optik 2020, 210, 164511. [Google Scholar] [CrossRef]
- Liu, X.Y.; Liu, J.; Yu, L.X. Signal Processing of Photoelectric Weapon Firing Frequency Tests Based on EEMD. J. Gun Launch Control 2023, 44, 19–23. [Google Scholar]
- Lai, Z.H.; Zhang, B.; Zhu, W.B. Adaptive sky illuminance sky screen system. Foreign Electron. Meas. Technol. 2020, 39, 86–92. [Google Scholar]
- Zhang, L.F.; Ni, J.P.; Chen, D. Technique of Adaptive Control for the Sensitivity of Sky Screen Target. Comput. Meas. Control 2019, 27, 76–80. [Google Scholar]
- Li, H.S.; Zhang, X.Q.; Gao, J.C. A design method of active photoelectric detection sensor based on 1-d multiunit p-i-n detector and its detection mode. IEEE Sens. J. 2022, 22, 21600–21612. [Google Scholar] [CrossRef]
- Tan, Z.G.; Yao, X.T.; Li, H.R. An Analysis of Factors Affecting Speed Measuring Accuracy of Muzzle Velocity Measuring Device. J. Gun Launch Control 2020, 41, 59–62. [Google Scholar] [CrossRef]
- Liu, H.; Zhang, H.Q.; Cheng, B. Research on Calibration of Sky Screen Target. Metrol. Meas. Tech. 2017, 5, 19–21+24. [Google Scholar]
- Li, J.; Li, K.; Ni, J.P. Detection sensitivity analysis of single-lens sky-screen with linear array light source. Opt. Tech. 2022, 48, 715–720. [Google Scholar]
- Chen, R.; Ni, J.P.; Chen, D. Error comparison and analysis of six-light-screen vertical target under different light-screen-array model. Proc. SPIE 2018, 10846, 53–59. [Google Scholar]
- Li, X.S. Research on the Data of Exterior Ballistic Trajectory Based on EMD. Master’s Thesis, National University of Defense Technology, Changsha, China, 2012. [Google Scholar]
- Pang, R.J. Research on the Localization Method of Projectile Impact Point Based on Sound Vibration Multi-Mode Fusion. Master’s Thesis, North University of China, Taiyuan, China, 2024. [Google Scholar] [CrossRef]
- Wang, F.; Gao, Y.; Tian, H. Denoising Method Based on EMD-CPSD for Low SNR Signals from Velocity Measuring Underwater Laser Light Screen. IEEE Trans. Instrum. Meas. 2024, 73, 7005811. [Google Scholar] [CrossRef]
- Veluchamy, M.; Subramani, B. Detail preserving noise aware retinex model for low light image enhancement. J. Opt. 2025. [Google Scholar] [CrossRef]
- Liang, W.N.; Li, H.S. Modeling and Performance Evaluation of Photoelectric Imaging System Detection Capabilities. J. Detect. Control. 2025, 47, 174–181. [Google Scholar] [CrossRef]
- Ying, J.J.; Wang, Q.; Shi, M.Y.; Li, M. Research on projectile position test method for sound-optic composite detection. Foreign Electron. Meas. Technol. 2022, 41, 131–135. [Google Scholar]
- Xu, P.; Li, X.D.; Liu, J.L.; Chen, M.; Fan, J.; Zhao, H. Research on Signal to Noise Ratio of High-speed Small Targets Based on Laser Screen. Optoelectron. Technol. 2024, 44, 13–18+33. [Google Scholar]
- Dong, H.S.; Ma, L.; Zhang, Y.J.; Bian, R.; Knag, L.; Li, K. A Method for Identifying Characteristic Signals at the Moment of Projectile Ejection from the Chamber. J. Gun Launch Control. 2024, 45, 92–99. [Google Scholar] [CrossRef]
- Zheng, Y.; Zhang, Y.; Deng, R.J.; He, X.; He, G. The CPO-VMD combined with improved wavelet thresholding method for noisereduction in bridge monitoring signals. J. Vib. Shock. 2025. [Google Scholar] [CrossRef]
- Wang, Y.F.; Zhang, Y. Research on Rotary Kiln Fault Diagnosis Based on JSOA-VMD Decomposition. Digit. Manuf. Sci. 2024, 3, 194–199. [Google Scholar]
- Zhou, C.; Man, X.; Zhou, Z.W. Constrained weighted least squares algorithm based on the MIMO radarsystem for target localization. J. Xidian Univ. 2019, 46, 124–129. [Google Scholar] [CrossRef]
- Zhang, S.Y.; Niu, D.S.; Zhou, Z. Prediction Method of Direct Normal Irradiance for Solar Thermal Power Plants Based on VMD-WOA-DELM. IEEE Trans. Appl. Supercond. 2024, 34, 9002904. [Google Scholar] [CrossRef]
- Qin, F.L.; Liu, J.; Cheng, Y.L. An improved wavelet threshold method and its application in seismic data denoising. Res. Sq. 2022. [Google Scholar] [CrossRef]
- He, X.L.; Su, C.; Zhang, Y.R. Fault Diagnosis for Rolling Bearing Based on Improved VMD and SVM. J. Southeast Univ. (Nat. Sci. Ed.) 2025. Available online: https://link.cnki.net/urlid/32.1178.n.20250901.1035.002 (accessed on 5 November 2025).
Disclaimer/Publisher’s Note: The statements, opinions and data contained in all publications are solely those of the individual author(s) and contributor(s) and not of MDPI and/or the editor(s). MDPI and/or the editor(s) disclaim responsibility for any injury to people or property resulting from any ideas, methods, instructions or products referred to in the content. |
© 2025 by the authors. Licensee MDPI, Basel, Switzerland. This article is an open access article distributed under the terms and conditions of the Creative Commons Attribution (CC BY) license (https://creativecommons.org/licenses/by/4.0/).